 Igor A. Dmitrenko1*†
 Vladislav Y. Petrusevich2†
 Ksenia Kosobokova3,4
 Alexander S. Komarov5
 Caroline Bouchard6,7
 Maxime Geoffroy8,9
 Nikolay V. Koldunov10
 David G. Babb1
 Sergei A. Kirillov1
 David G. Barber1
- 1Centre for Earth Observation Science, University of Manitoba, Winnipeg, MB, Canada
- 2Northwest Atlantic Fisheries Centre, Fisheries and Oceans Canada, St. John’s, NL, Canada
- 3Shirshov Institute of Oceanology, Russian Academy of Sciences, Moscow, Russia
- 4Pacific Oceanological Institute, Far Eastern Branch of the Russian Academy of Sciences, Vladivostok, Russia
- 5Data Assimilation and Satellite Meteorology Research Section, Environment and Climate Change Canada, Ottawa, ON, Canada
- 6Greenland Climate Research Centre, Greenland Institute of Natural Resources, Nuuk, Greenland
- 7Département de Biologie, Université Laval, Québec City, QC, Canada
- 8Centre for Fisheries Ecosystems Research, Fisheries and Marine Institute, Memorial University of Newfoundland, St. John’s, NL, Canada
- 9Department of Arctic and Marine Biology, University of Tromsø – The Arctic University of Norway, Tromsø, Norway
- 10Alfred Wegener Institute for Polar and Marine Research, Bremerhaven, Germany
The diel vertical migration (DVM) of zooplankton is one of the largest species migrations to occur globally and is a key driver of regional ecosystems and the marine carbon pump. The dramatic changes in the Arctic environment in recent years, mainly associated with sea-ice decline, may have wide significance for the Arctic shelf ecosystems including DVM. Observations have revealed the occurrence of DVM in ice-covered Arctic waters, however, there have yet to be observations of DVM from the extensive Siberian shelves in the Eurasian Arctic and no analysis of how the sea-ice decline may affect DVM. Here, 2 yearlong time series of acoustic backscatter, collected by moored acoustic Doppler current profilers in the eastern Laptev Sea from August 1998 to August 1999, were used to examine the annual cycle of acoustic scattering, and therefore the annual cycle of DVM in the area. The acoustic time series were used along with atmospheric and oceanic reanalysis and satellite data. Our observations show that DVM did not occur during polar night and polar day, but is active during the spring and fall transition periods when there is a diurnal cycle in light conditions. DVM began beneath the fast ice at the end of polar night and increased in intensity through spring. However, the formation of a large polynya along the landfast ice edge in late March 1999 caused DVM to abruptly cease near the fast ice edge, while DVM persisted through spring to the start of polar day at the onshore mooring. We associate this cessation of synchronized DVM ∼1 month ahead of polar day with a predator-avoidance behavior of zooplankton in response to higher polar cod abundance near the polynya. During polar day, the intensity of acoustic scattering was attributed to the riverine suspended particles. Overall, our results highlight the occurrence of DVM on the Siberian shelves, the cessation of synchronized DVM when a polynya opens up nearby, and the potential impact of significant trends toward a more extensive Laptev Sea polynya as part of changing ice conditions in the Eurasian Arctic and their impact on the Arctic shelf ecology.
Introduction
Zooplankton migrates vertically through the water column according to the daily cycle of illuminance through a process known as diel vertical migration (DVM). DVM is arguably the most widespread daily migration of animals on Earth (Hays, 2003) and the largest non-human migration (Brierley, 2014). DVM significantly impacts the biological pump and the biogeochemistry of the twilight zone (e.g., Archibald et al., 2019), with the carbon transported by DVM accounting for up to 30% of the total particulate flux and as much as 50% of the metabolic carbon dioxide produced in the twilight zone (Bianchi et al., 2013). DVM has been studied throughout the world’s Oceans, including the Arctic Ocean (e.g., Cottier et al., 2006; Berge et al., 2009; Wallace et al., 2010; Hobbs et al., 2018; Dmitrenko et al., 2020) and is known to be primarily driven by illuminance (e.g., Hobbs et al., 2021). Only recently was DVM observed to occur during the polar night (Berge et al., 2009, 2015), and more recent studies have analyzed the role of moonlight in modifying DVM during polar night (Last et al., 2016; Petrusevich et al., 2016). In the Arctic Ocean, the ice cover attenuates light transmission and therefore modifies DVM (Hobbs et al., 2018, 2021; Dmitrenko et al., 2020). Beyond light, the oceanographic factors that influence DVM in the seasonally ice-covered Arctic shelves remain poorly assessed (Hobbs et al., 2018). Recent studies revealed the role of wind-driven and tidal-driven water dynamics in modifying DVM (Petrusevich et al., 2016, 2020; Dmitrenko et al., 2020). In general, significant progress has been achieved in assessing DVM in the Arctic Ocean; however, to date there have yet to be observations of DVM over the Siberian shelf and no analysis of how DVM is modified by the opening of a polynya.
The Siberian shelf, consisting of the Kara, Laptev, and East Siberian seas, represents the shallowest and broadest shelf region of the entire World Ocean, extending a distance of 400–800 km offshore (Figure 1A). The dramatic changes in the Arctic environment in recent years mainly associated with sea-ice decline may have wide significance for the Siberian shelf water dynamics and ecosystem (e.g., Bouchard and Fortier, 2008; Lalande et al., 2009; Wassmann et al., 2010; Barber et al., 2015). For example, the sea-ice reduction results in the loss of a shading effect and enhanced illuminance of the surface water layer impacting DVM (e.g., Hobbs et al., 2018; Dmitrenko et al., 2020). The Laptev Sea connected in the west with the Kara Sea and in the east with the East Siberian Sea (Figure 1A) is seasonally ice-covered. Sea ice begins to form in October and the area is typically ice-free by July (Fetterer et al., 2017). A majority of the shelf area is covered by landfast sea ice, which extends offshore approximately to the 20 m depth contour and occupies up to 140 × 103 km2 of the southern Laptev Sea shelf (Selyuzhenok et al., 2015), while mobile first-year pack ice drifts beyond the landfast ice edge. The fast ice reaches a peak thickness in April between 1.5 m, further offshore (Belter et al., 2020) and ∼2.0 m at the front of the Lena Delta (Hendricks et al., 2018). The interface of the fast ice and pack ice is dynamic, and is routinely covered by a vast latent heat polynya that forms when offshore winds advect the mobile pack ice away from the fast ice edge (e.g., Dmitrenko et al., 2005b; Willmes et al., 2010, 2011; Kirillov et al., 2013; Rabenstein et al., 2013; Gutjahr et al., 2016). The mean ice thickness within the polynya is ∼11 cm, with approximately half of the polynya covered by ice 12–20 cm thick, and less than 2% of the polynya covered by open water and ice thinner than 2 cm (Willmes et al., 2011). The polynyas impact on sea-ice production and vertical mixing in the Laptev Sea has been extensively studied (e.g., Dmitrenko et al., 2008, 2009, 2010a,b, 2012; Willmes et al., 2010, 2011; Kirillov et al., 2013). However, the impact of this polynya, or any Arctic polynya on DVM has yet to be assessed. Finally, the Laptev Sea shelf is strongly impacted by river runoff. The study area in the eastern Laptev Sea shelf (Figure 1B) receives an average of 535 km3 of freshwater from the Lena River annually. Discharge is low from November to April, and peaks from June to October, with ∼35% of the annual discharge occurring in June (Yang et al., 2002).
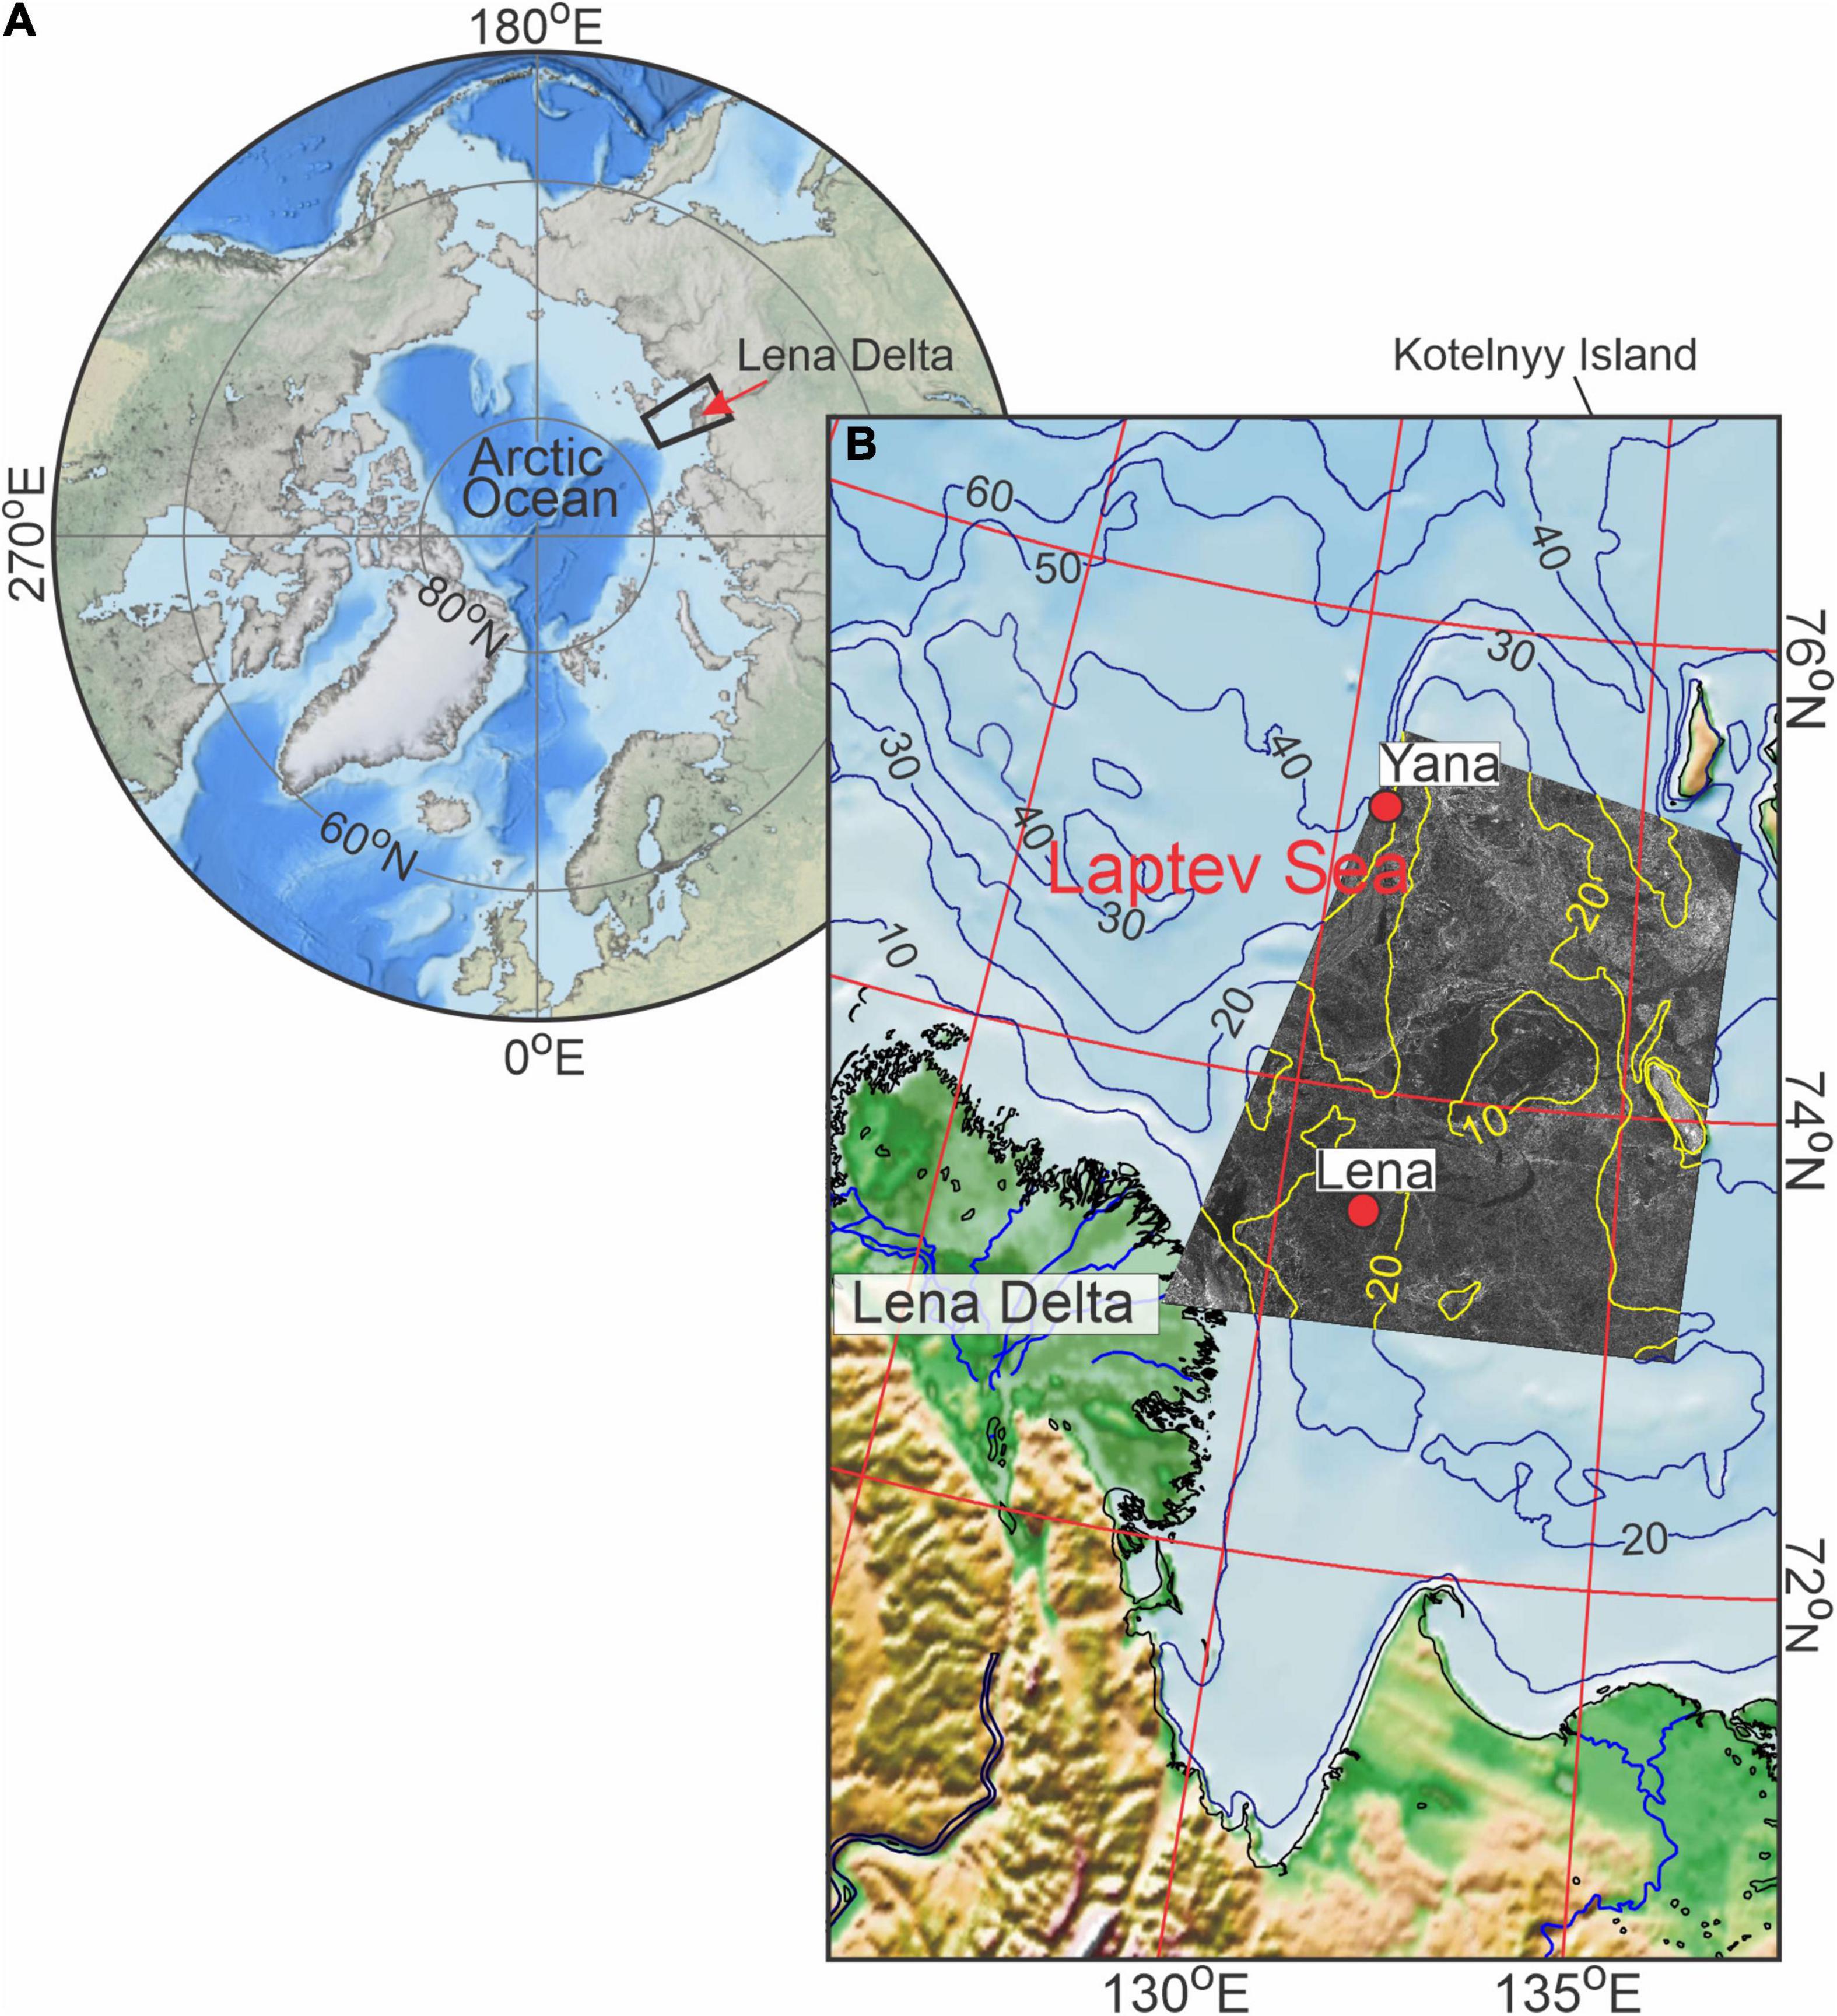
Figure 1. (A) Location of the eastern Laptev Sea in the Arctic Ocean depicted by the black rectangle with the Lena River Delta indicated by the red arrow. (B) Bathymetry of the eastern Laptev Sea shelf with overlaid RADARSAT-1 satellite image from 26 March 1999. Red dots mark positions of yearlong (August 1998–1999) moorings Yana and Lena at 75°09.01′N, 130°49.94′E and 73°27.37′N, 131°41.98′E, respectively. The maps of the Arctic Ocean and Laptev Sea were compiled based on the International Bathymetric Chart of the Arctic Ocean Version 4.0 [General Bathymetric Chart of the Oceans (Jakobsson et al., 2020)].
Here we provide the first analysis of DVM on the Siberian shelf and give a unique example of how the opening of a polynya affects the seasonal pattern of DVM. Observing the DVM seasonal cycle in ice-covered waters is difficult, however, moored acoustic Doppler current profilers (ADCPs) provide a time series of acoustic backscatter in the water column that can be used to track DVM below the ice-cover. Oceanographic moorings, equipped with ADCPs, have been deployed annually over the Laptev Sea shelf and the upper continental slope since 1998 (for example, see Table 1 in Janout and Lenn, 2014). Time series of velocity and acoustic backscatter from these moorings have been used extensively to study the impact of sea ice on wind-driven and tidal-driven water dynamics and the transport of suspended sediment (e.g., Dmitrenko et al., 2002; Wegner et al., 2005; Janout and Lenn, 2014). However, previously this data has not been used to analyze DVM. Within this paper we use the ADCP derived time series of acoustic backscatter at two moorings deployed in the eastern Laptev Sea in August 1998 (Figure 1) to examine DVM on the Siberian shelf. Moorings were located at ∼75°N and 73.5°N (Figure 1), the area where the sun is between 6° and 12° below the horizon all day on the winter solstice. At these latitudes, during the nautical polar night period, there is no trace of daylight, and only around midday there is slight light because of refraction, and the horizon and the brighter stars are visible during clear sky. During polar day around the summer solstice, the sun does not move below the horizon, and daylight lasts from sunset to sunrise.
Within this study, we specifically focus on the seasonal pattern of DVM and its modification following the formation of a polynya along the landfast ice edge in March–April 1999. Moreover, we qualitatively assess the intensity of acoustic backscatter during polar day and polar night, putting its spatial and interannual variability in the context of large-scale atmospheric circulation patterns that dictate the location of the Lena River plume.
Data
Observations of DVM were derived from two ADCPs deployed on bottom anchored oceanographic moorings, referred to as Yana and Lena, over the eastern Laptev Sea continental shelf from August 1998 to August 1999 (Figure 1). The moorings were deployed under the framework of the Russian-German program named Laptev Sea System (Kassens et al., 1998). More details on the geographical location of the moorings can be found in Wegner et al. (2005), but briefly Lena (73°27.37′N, 131°41.98′E) was deployed ∼90 km of the Lena River delta from 2 August 1998 to 29 August 1999, while Yana (75°09.01′N, 130°49.94′E) was deployed ∼205 km north of the river delta from 13 August 1998 to 30 August 1999 (Figure 1B). The ADCPs were 300 kHz upward-looking Workhorse Sentinel ADCPs from Teledyne RD Instruments and were deployed on the seafloor at a depth of 42 m (Yana) and 23 m (Lena) using the trawl resistant bottom mounts by Flotation Technologies Inc. For this study, we used only the acoustic backscatter intensity data that was obtained at intervals of 2 m (Yana) and 1.5 m (Lena), with a 30 min ensemble time interval and 30 pings per ensemble. The first bin was located at 4 m and 3.5 m above the transducer for Yana and Lena, respectively. Data from the upper most layers (down to 8 m depth at Yana and 5.5 m depth at Lena) were compromised by the reflection of the acoustic signal from the air-water and/or ice-water interface. Thus, the acoustic backscatter data above these levels cannot be used in this study.
Complimentary conductivity-temperature-depth (CTD) profiles (Bauch et al., 2009) were collected at each mooring location during deployment and recovery, as well as during April and May 1999 when the mooring locations were ice covered and accessed by helicopter (Figure 2). CTD profiles were collected with a CTD probe ME (Meerestechnik Elektronik) OTS-3. According to the manufacturer estimates, individual temperature and conductivity measurements are accurate to ±0.005°C and ±0.005 mS cm–1. The CTD instruments were calibrated by the manufacturer before each expedition.
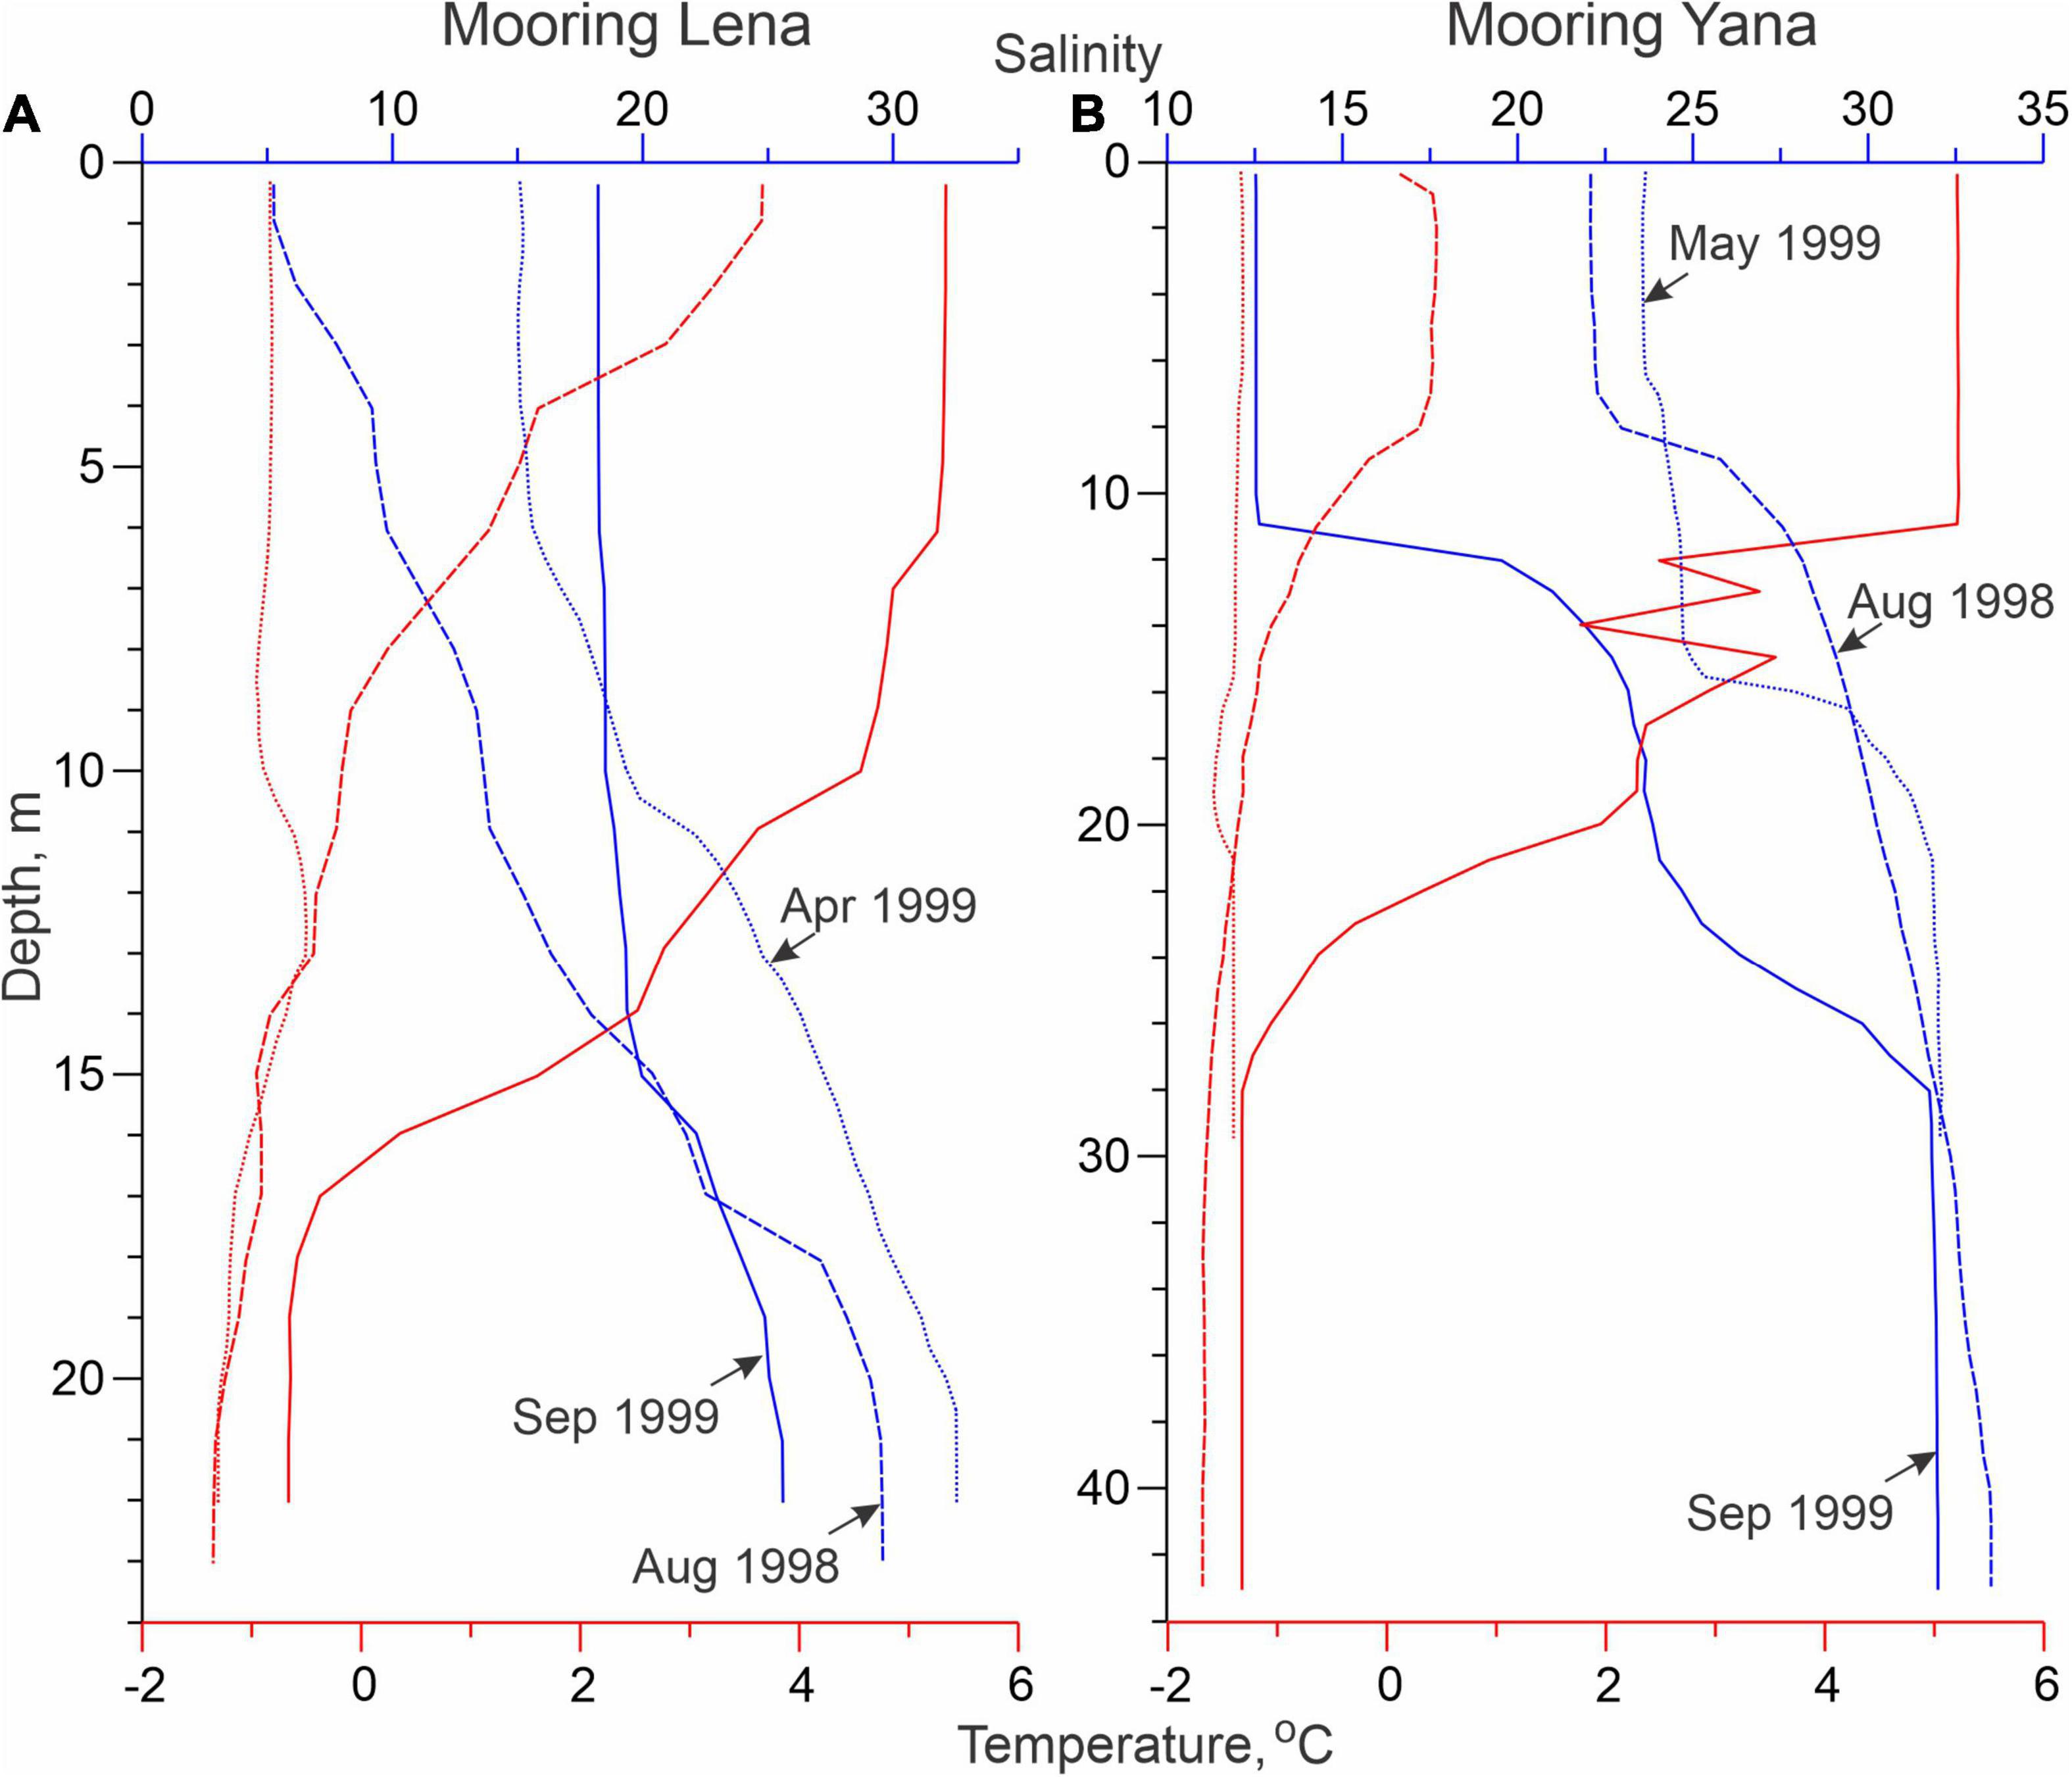
Figure 2. Vertical profiles of salinity (blue) and temperature (red,°C) taken at mooring deployment (solid line; August 1998) and recovery (dashed line; September 1990), and in April–May 1999 (dotted lines) at moorings (A) Lena and (B) Yana. Note that the CTD profile at Yana in May 1999 was taken approximately 10 km eastward from mooring location.
Fields of sea level pressure (SLP; Figure 3), 10-m wind velocity, 2-m air temperature at 6-h intervals (Figure 4) and daily mean total cloud cover data were retrieved from the ERA5 atmospheric reanalysis (Copernicus Climate Change Service [C3S], 2017; Hersbach et al., 2020). A comparison of wind speeds from ERA5 at Yana with in situ observations from the nearby Kotelny Island weather station (Figure 1B; Dmitrenko et al., 2005b) revealed an insignificant discrepancy between ERA5 and the meteorological observations. The horizontal resolution of ERA5 is 31 km.
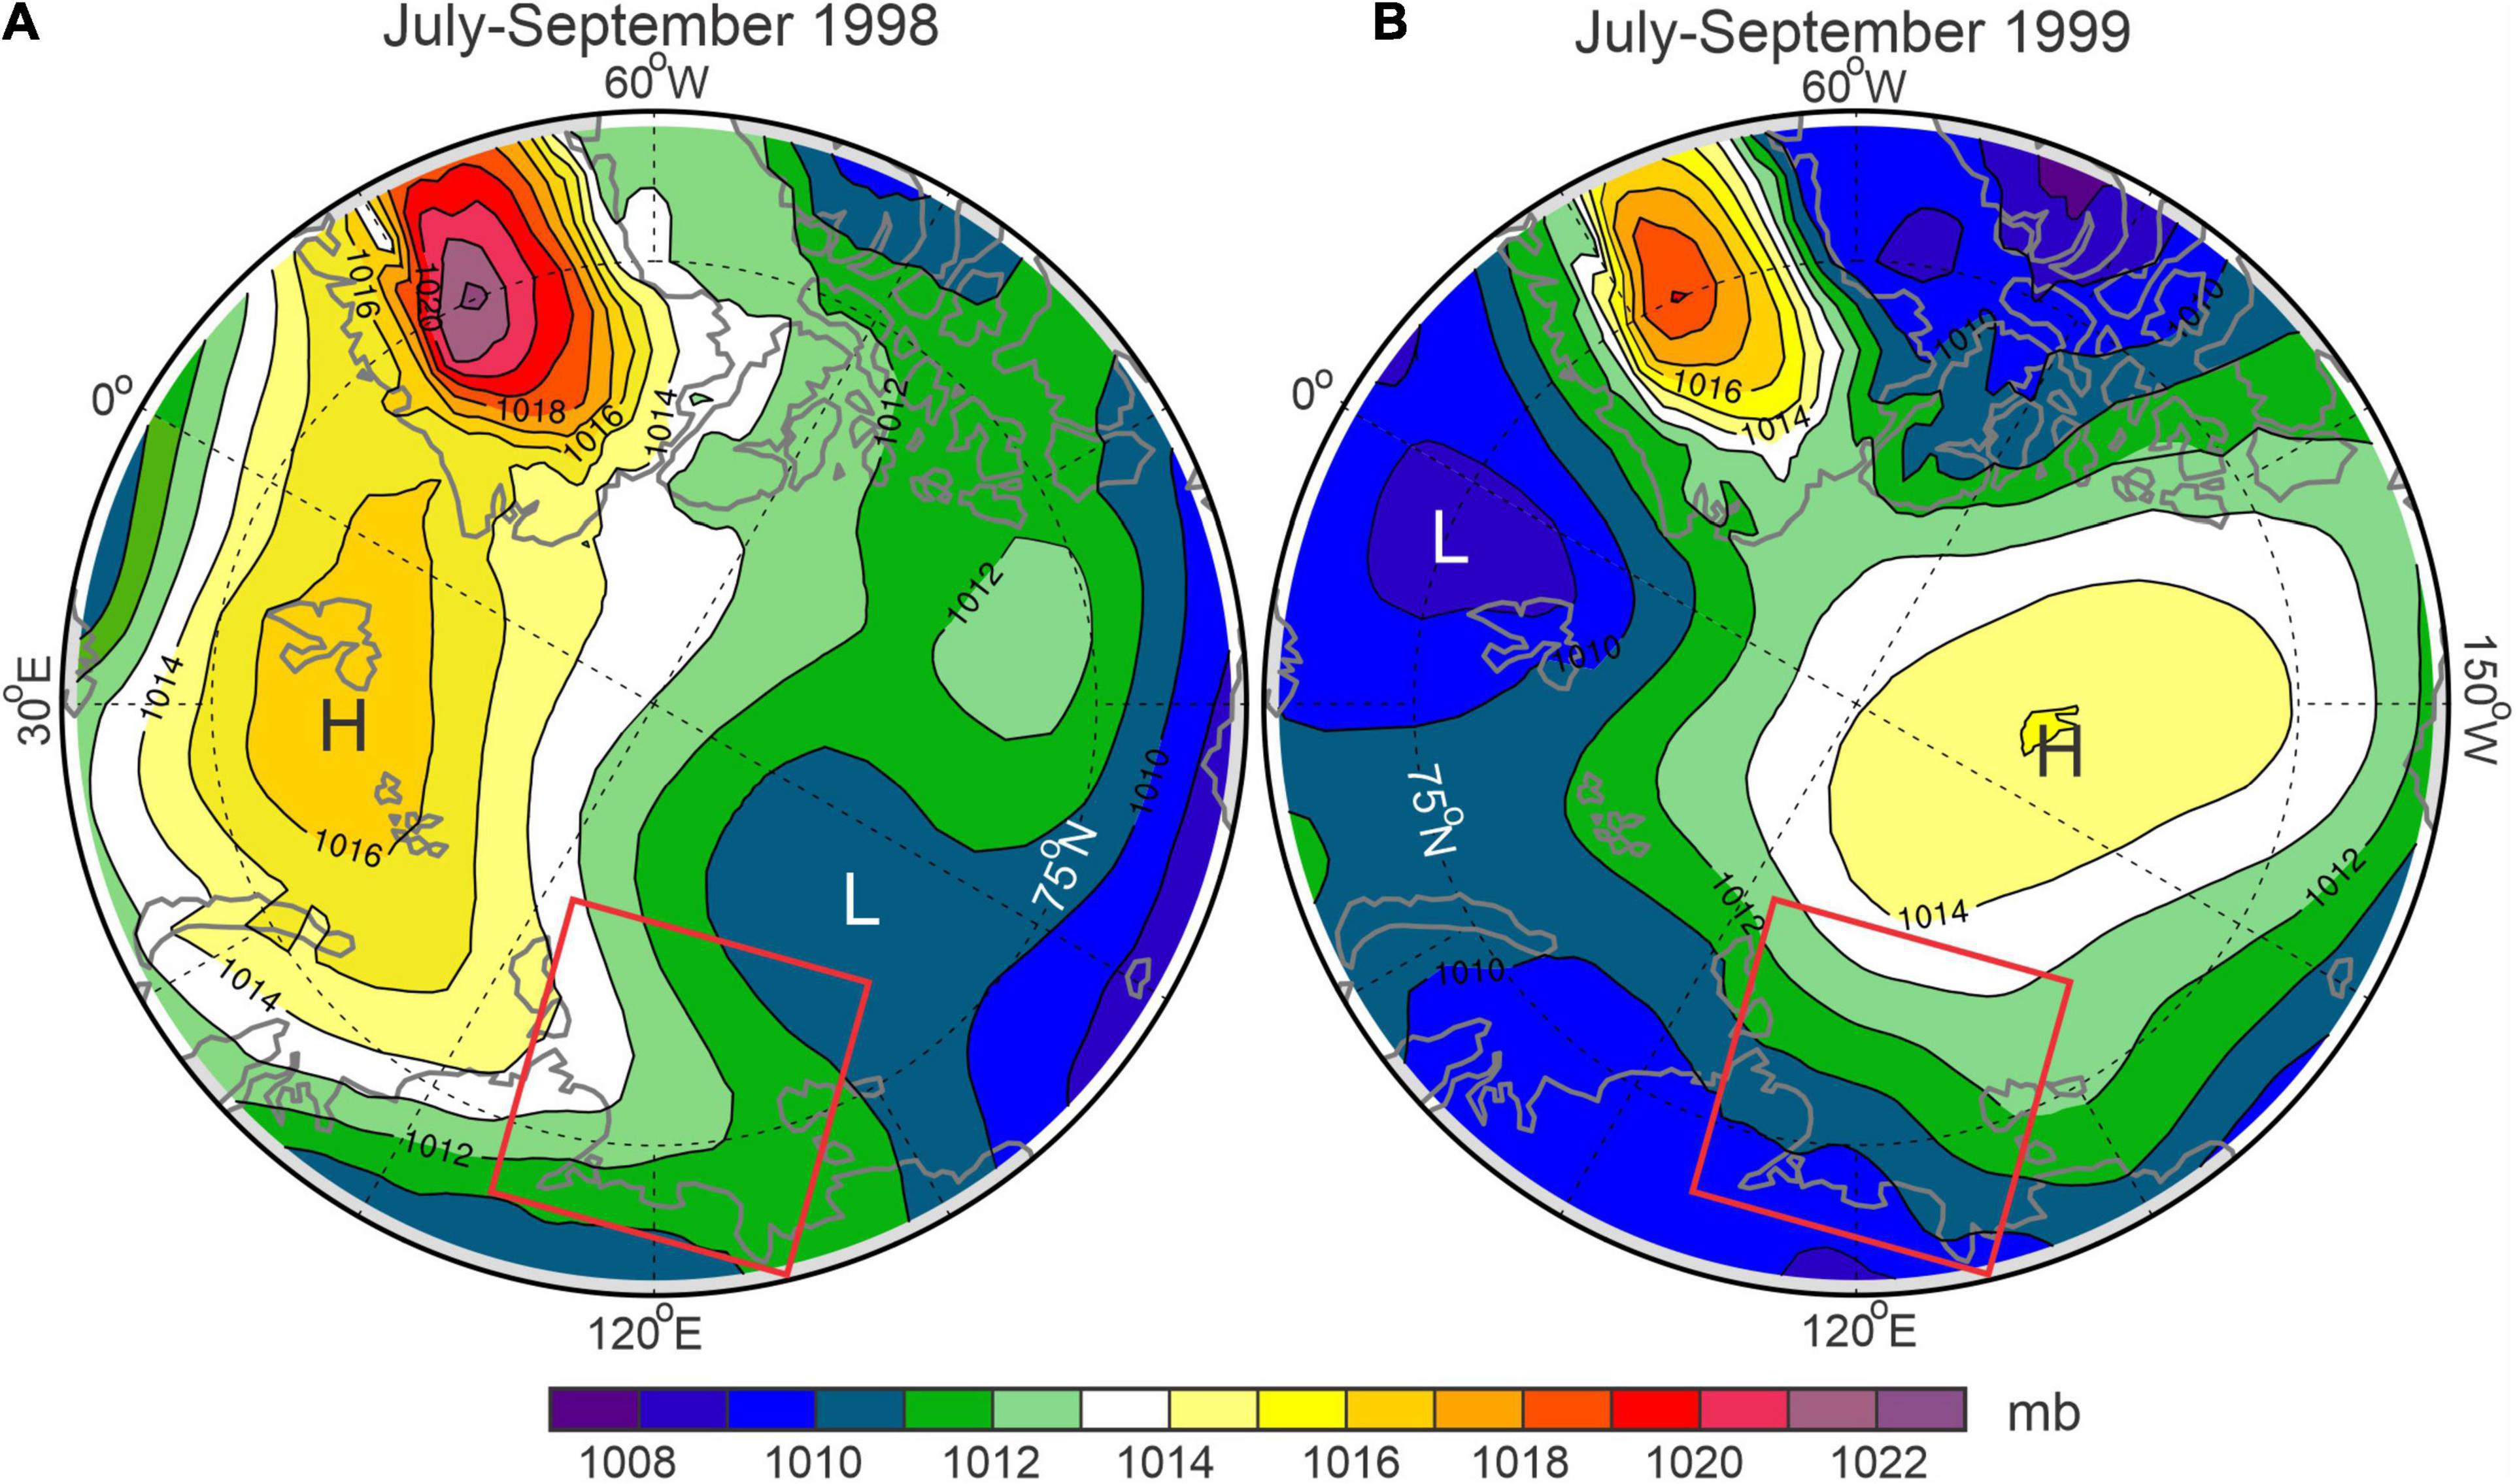
Figure 3. Sea-level atmospheric pressure (mb) derived from ERA5 reanalysis for July–September (A) 1998 and (B) 1999. The red rectangle encloses the Laptev Sea. The black dashed lines depict meridians and parallels.
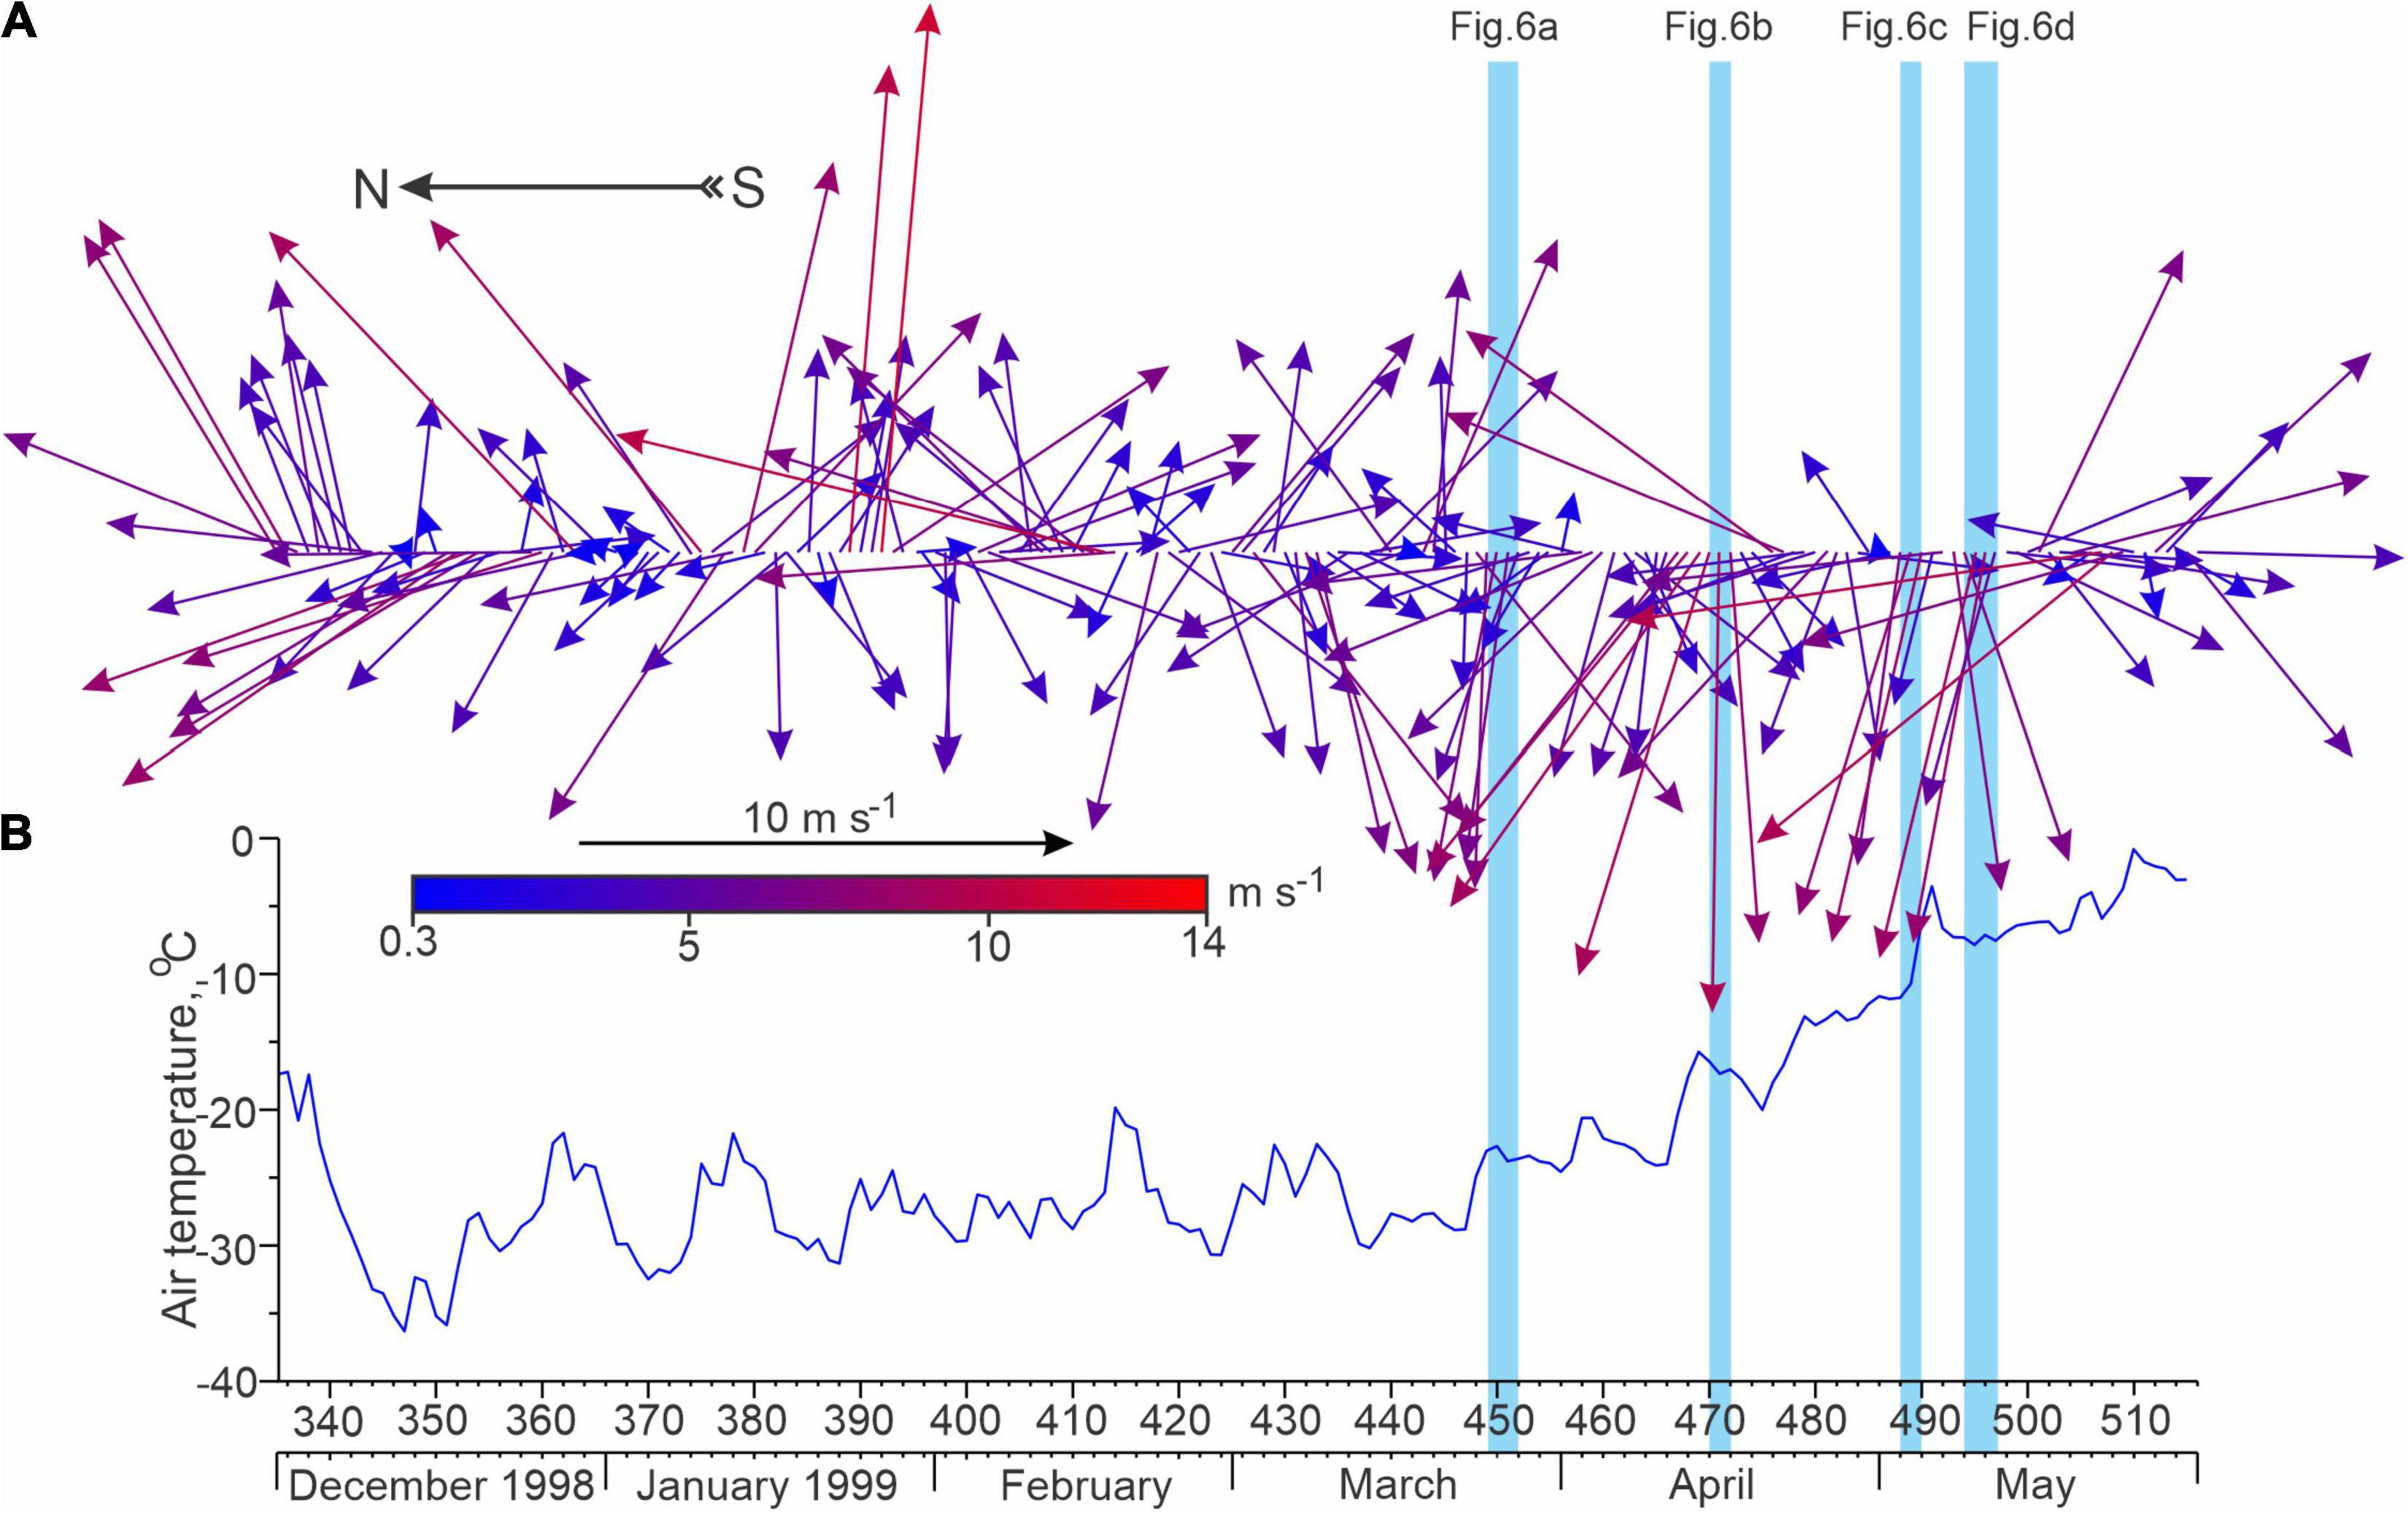
Figure 4. Time series of (A) daily mean 10-m wind (arrows; m s–1) and (B) 2-m air temperature (blue line;°C) from 1 December 1998 to 31 May 1999 derived from ERA5 at the location of mooring Yana. Blue shading highlights periods of strong easterly winds that forced polynya openings as shown in Figures 6A–D.
The extent and evolution of the sea-ice cover around the moorings between August 1998 and August 1999 was analyzed in 142 synthetic aperture radar (SAR) images collected by RADARSAT-1 (e.g., Figures 5–7) and acquired through the Alaska Satellite Facility (ASF). All of the images were presented in the same Universal Transverse Mercator (UTM) projection (zone 53) over the 300 km × 300 km area surrounding the midpoint between Yana and Lena. Within the radar images, areas of higher radar backscatter (gray and white in the Figures 5, 6) indicate the formation of new ice in the polynya (e.g., Figures 6B,C), while lower radar backscatter (black and gray) indicate open water within the coastal polynya (e.g., Figures 5C, 6A) and leads in the surrounding ice pack (Figure 5B). The fast ice edge separates the landfast ice from the coastal polynya and is usually evident in the radar images (e.g., Figure 5C).
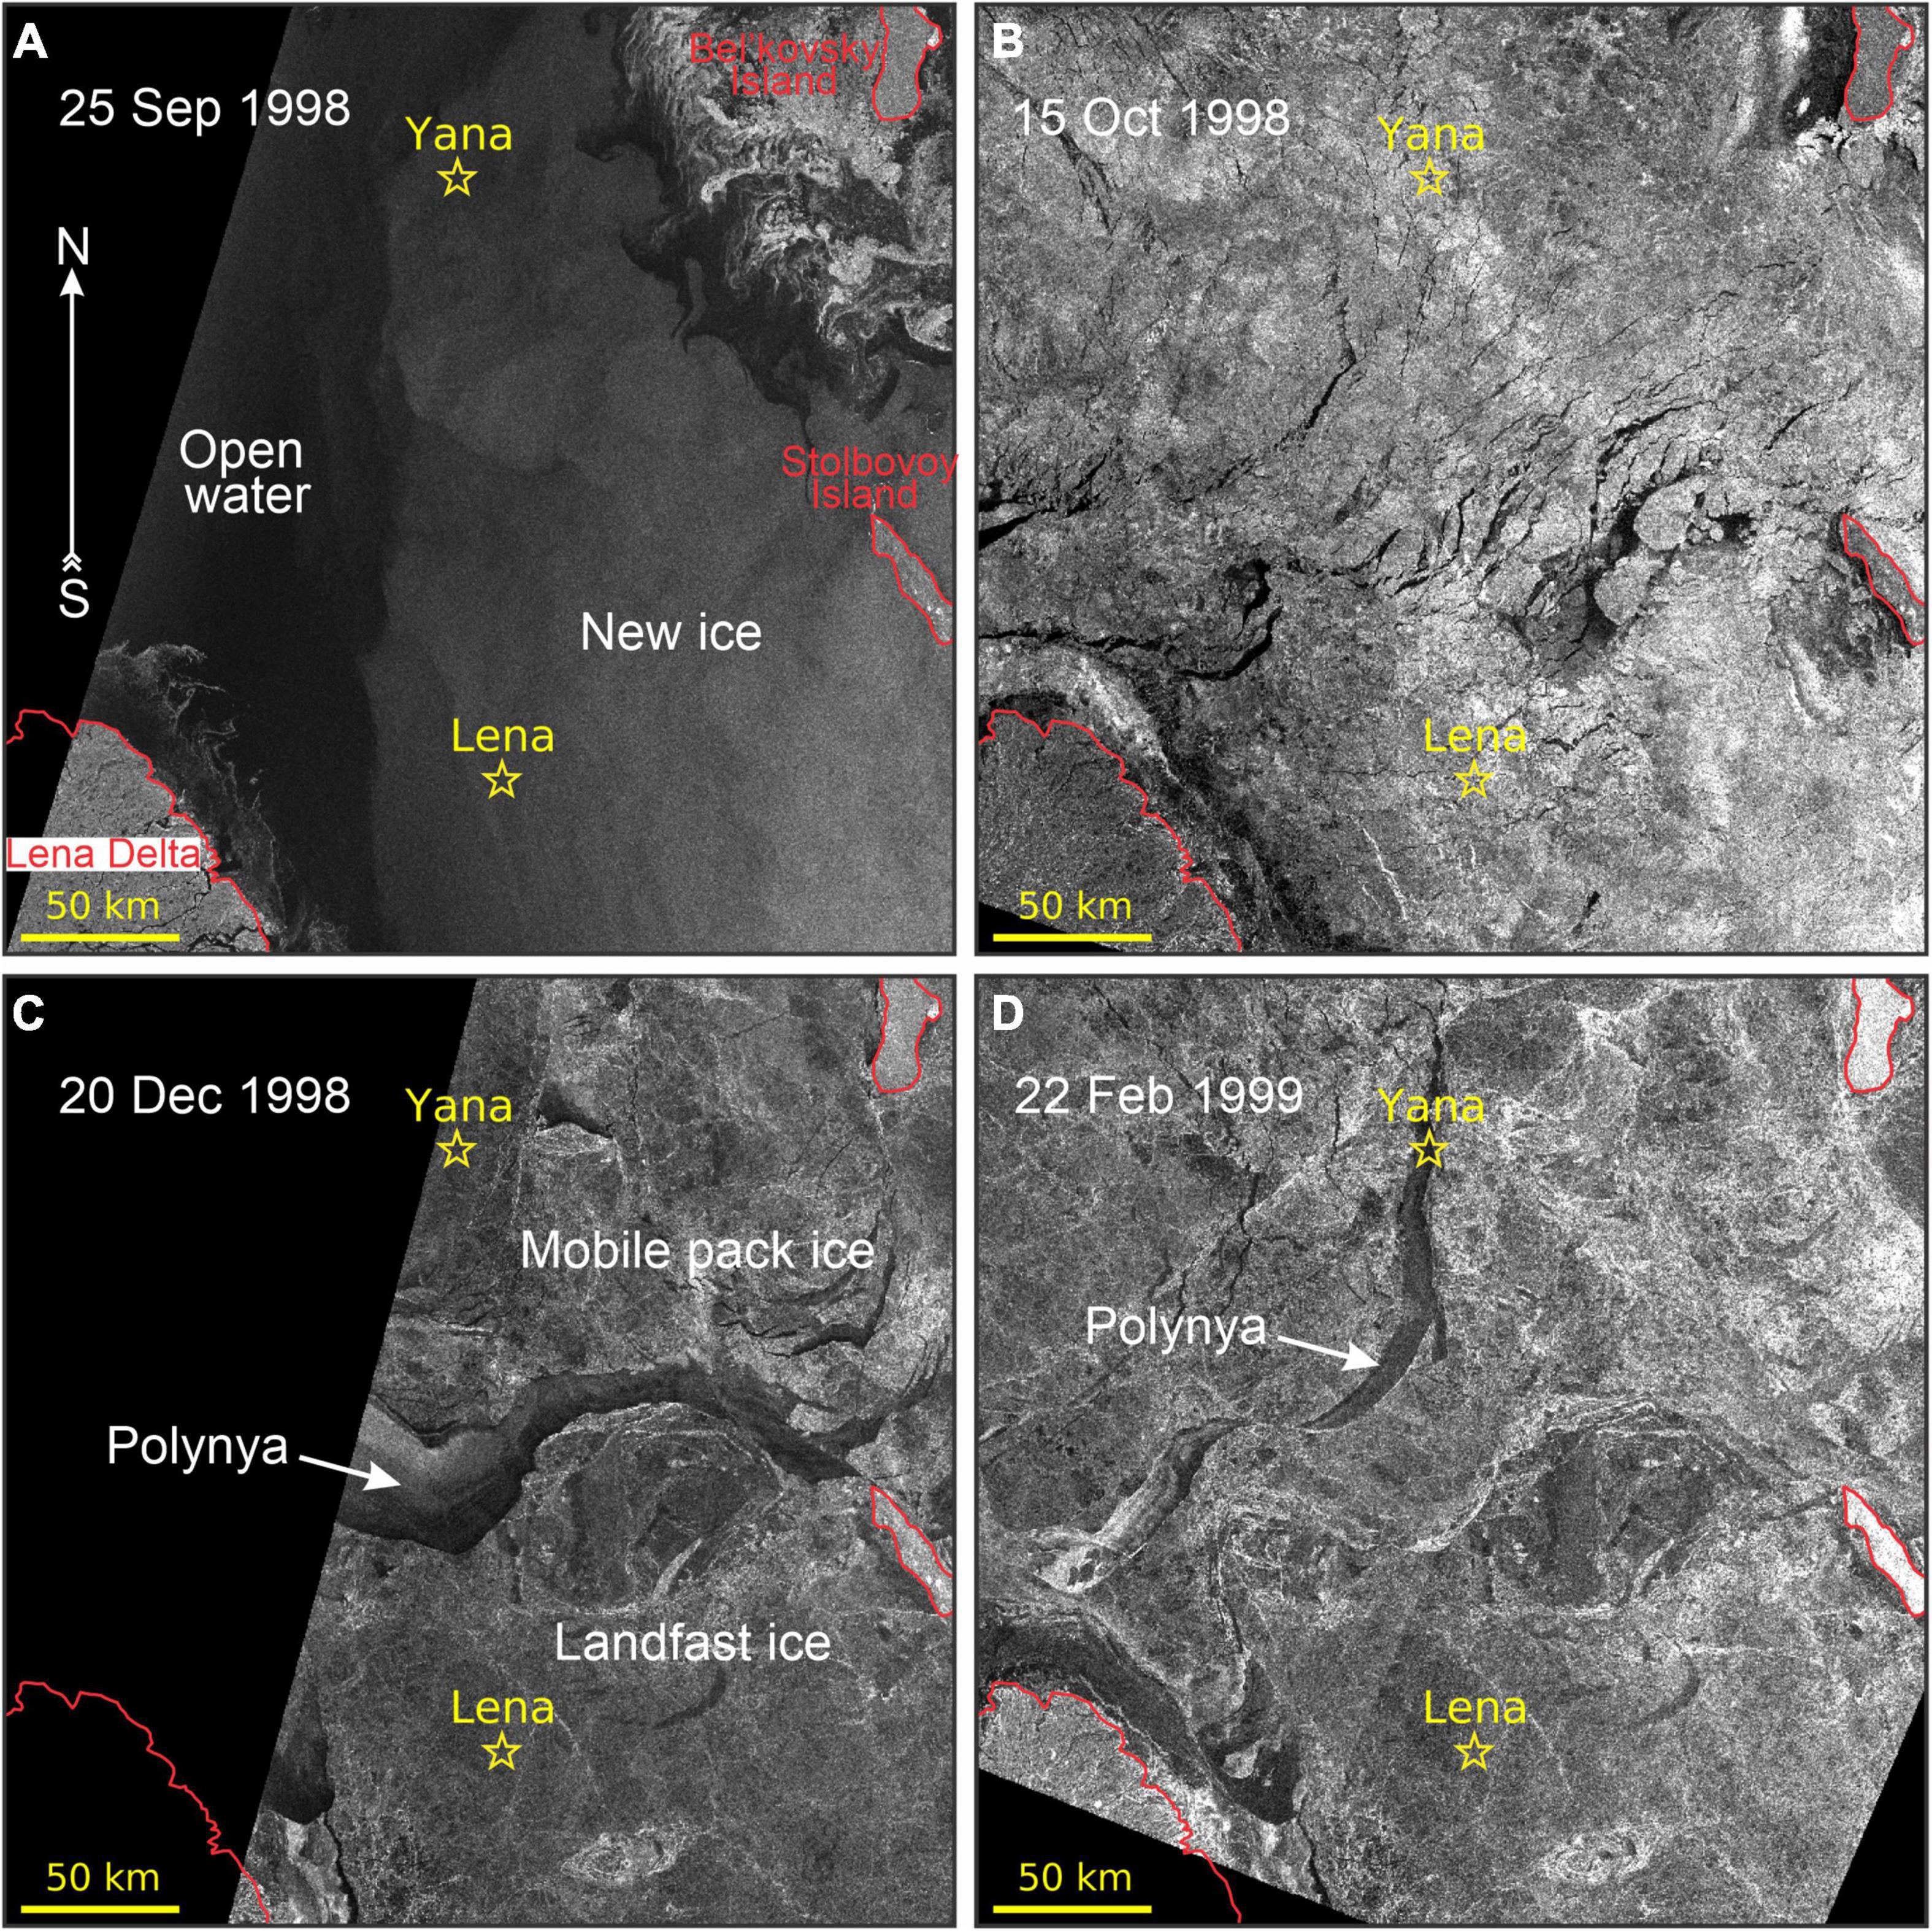
Figure 5. RADARSAT-1 ScanSAR satellite images show the evolution of ice conditions in the Laptev Sea between September 1998 and February 1999: (A) 25 September 1998, (B) 15 October 1998, (C) 20 December 1998, and (D) 22 February 1999. Yellow stars depict moorings Lena and Yana. (B) Low radar backscatter area corresponds to calm open water. The gray strips in (C,D) are associated with a thin sea-ice newly formed in leads and polynya area. In (C,D) polynya delimited the landfast ice area. The mobile ice pack is located offshore of the landfast ice. Red lines indicate the coastline of the Lena Delta and Bel’kovsky and Stolbovoy islands also shown in Figure 1B. © Canadian Space Agency (CSA) (1998–1999).
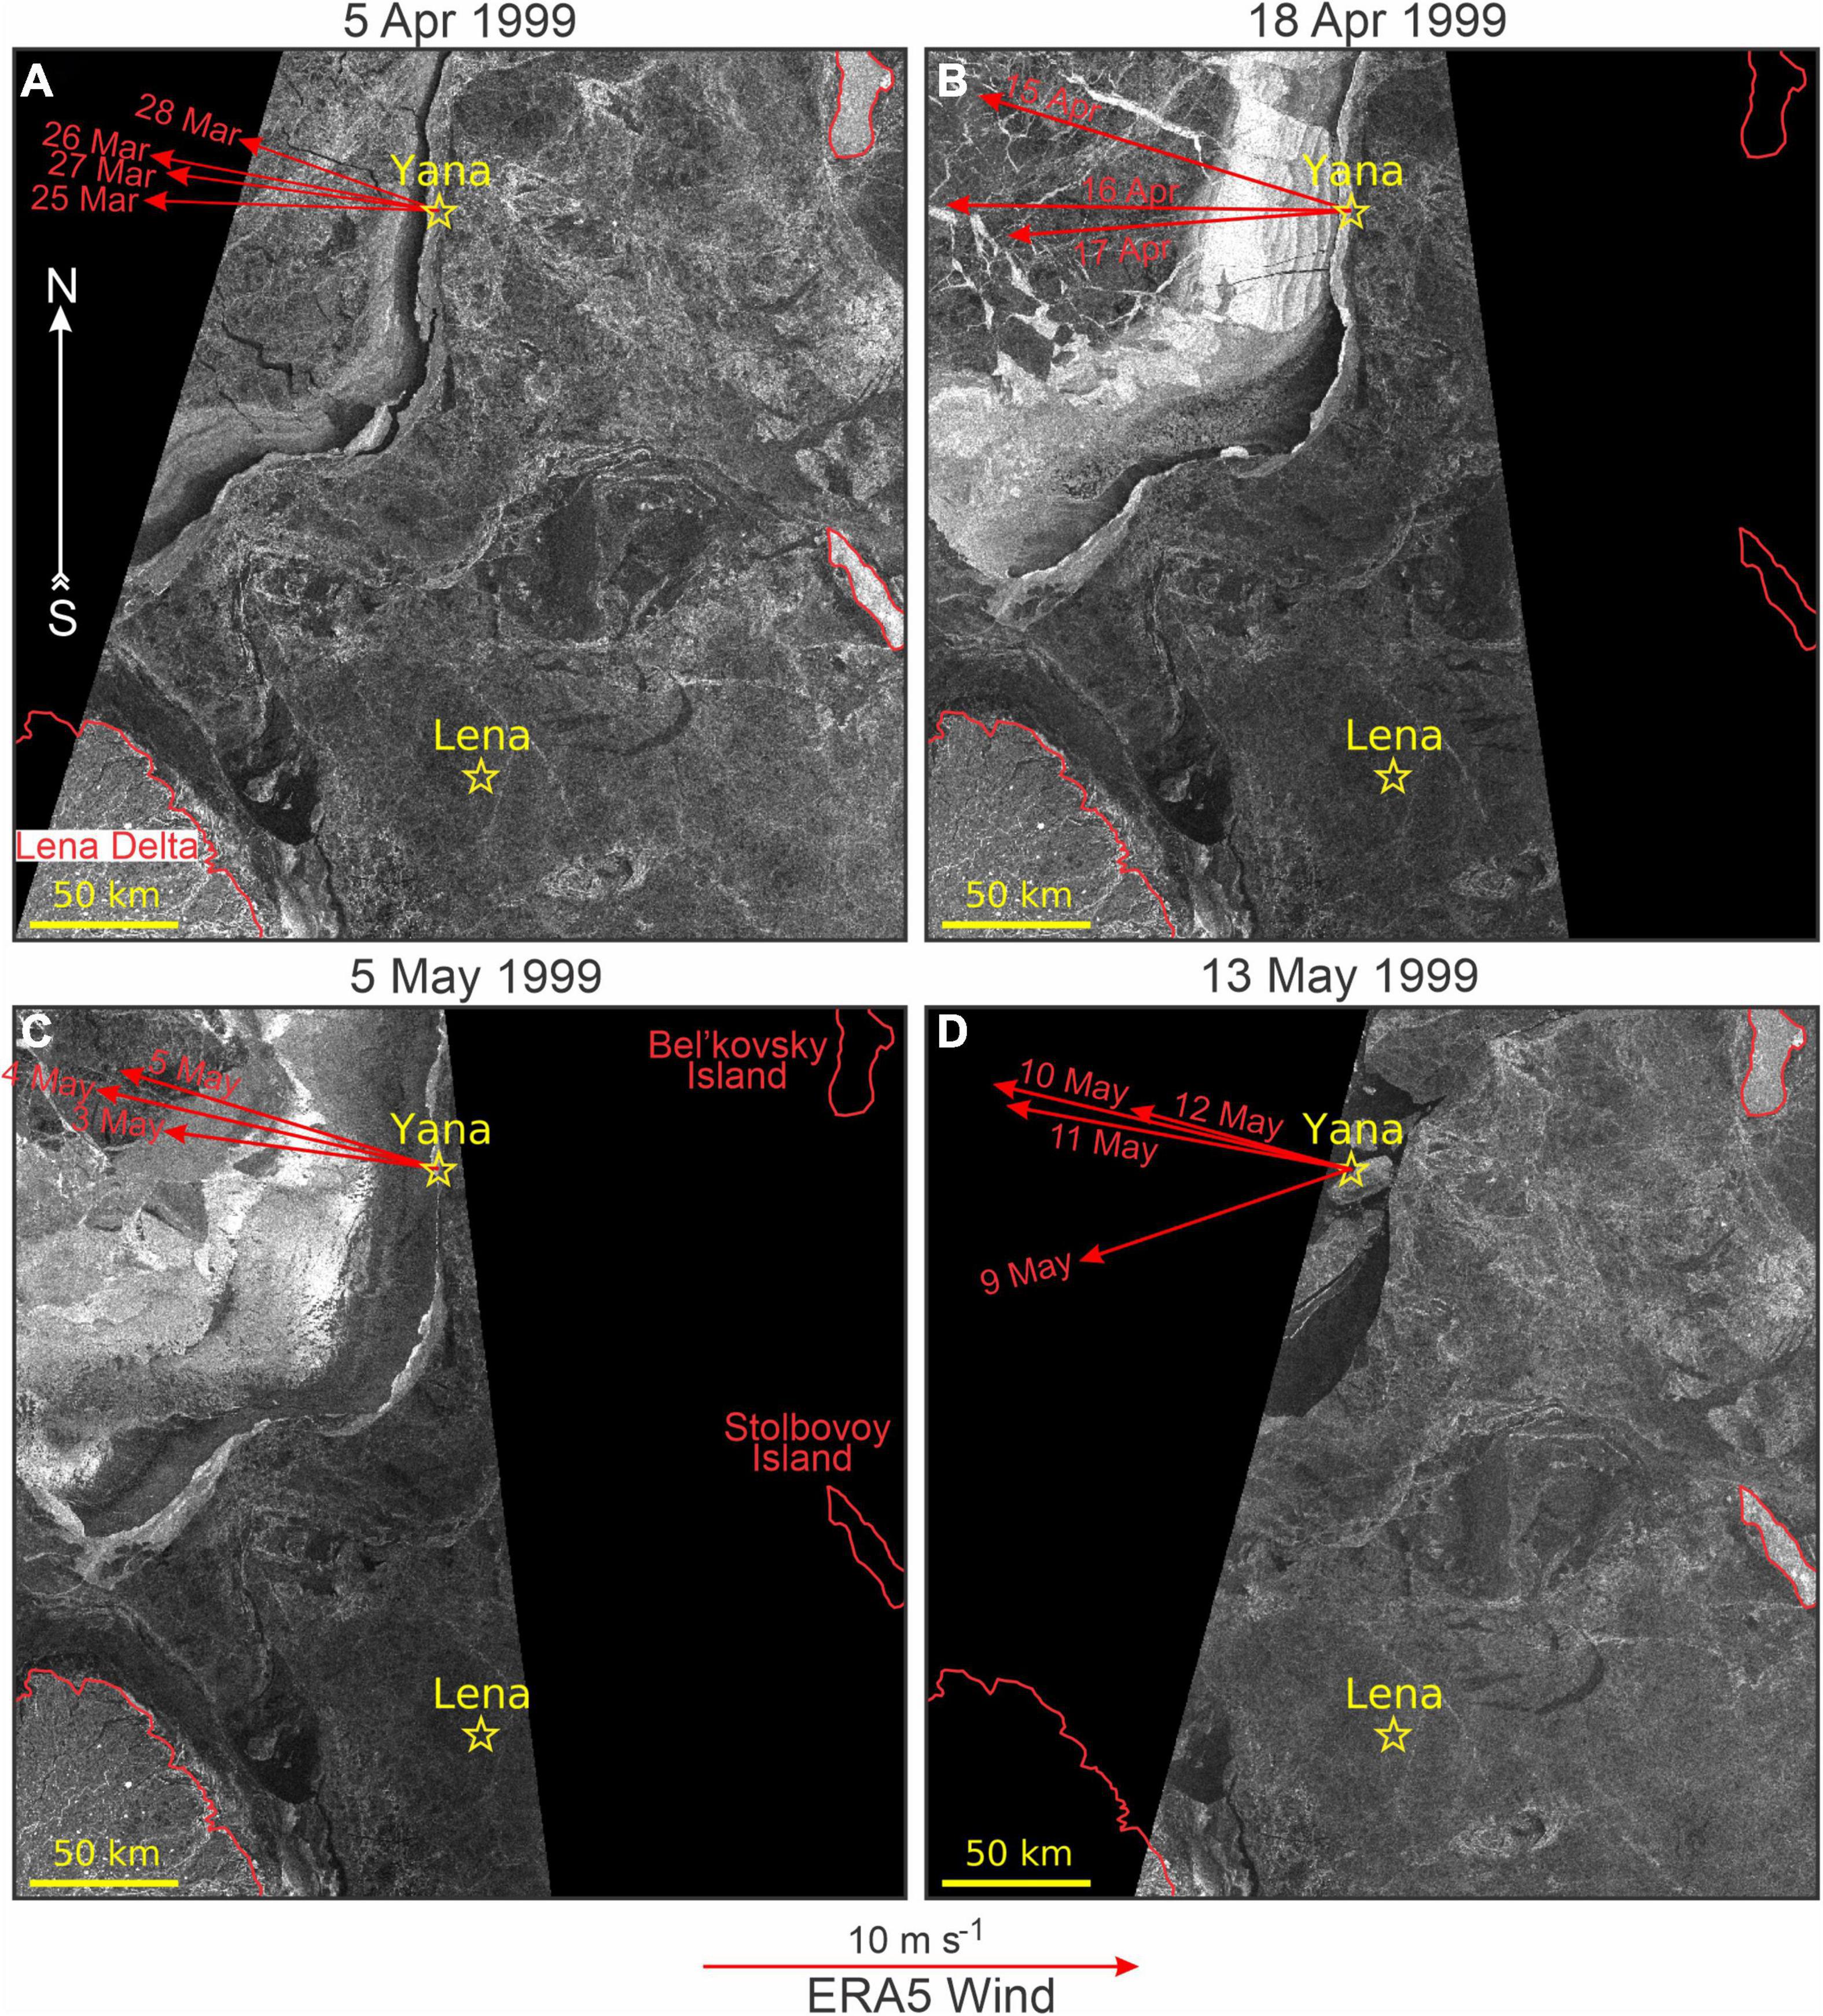
Figure 6. RADARSAT-1 ScanSAR satellite images show the evolution of the Laptev Sea polynya in April–May 1999: (A) 5 April 1999, (B) 18 April 1999, (C) 5 May 1999, and (D) 13 May 1999. Black areas off the landfast ice edge are associated with polynya open water. The gray and white strips in (A–C) are associated with 5–30 cm thick newly formed sea ice in polynya area. Red arrows show ERA5 winds observed at Yana before image was taken. All other designations are similar to those in Figure 5. © CSA (1999).
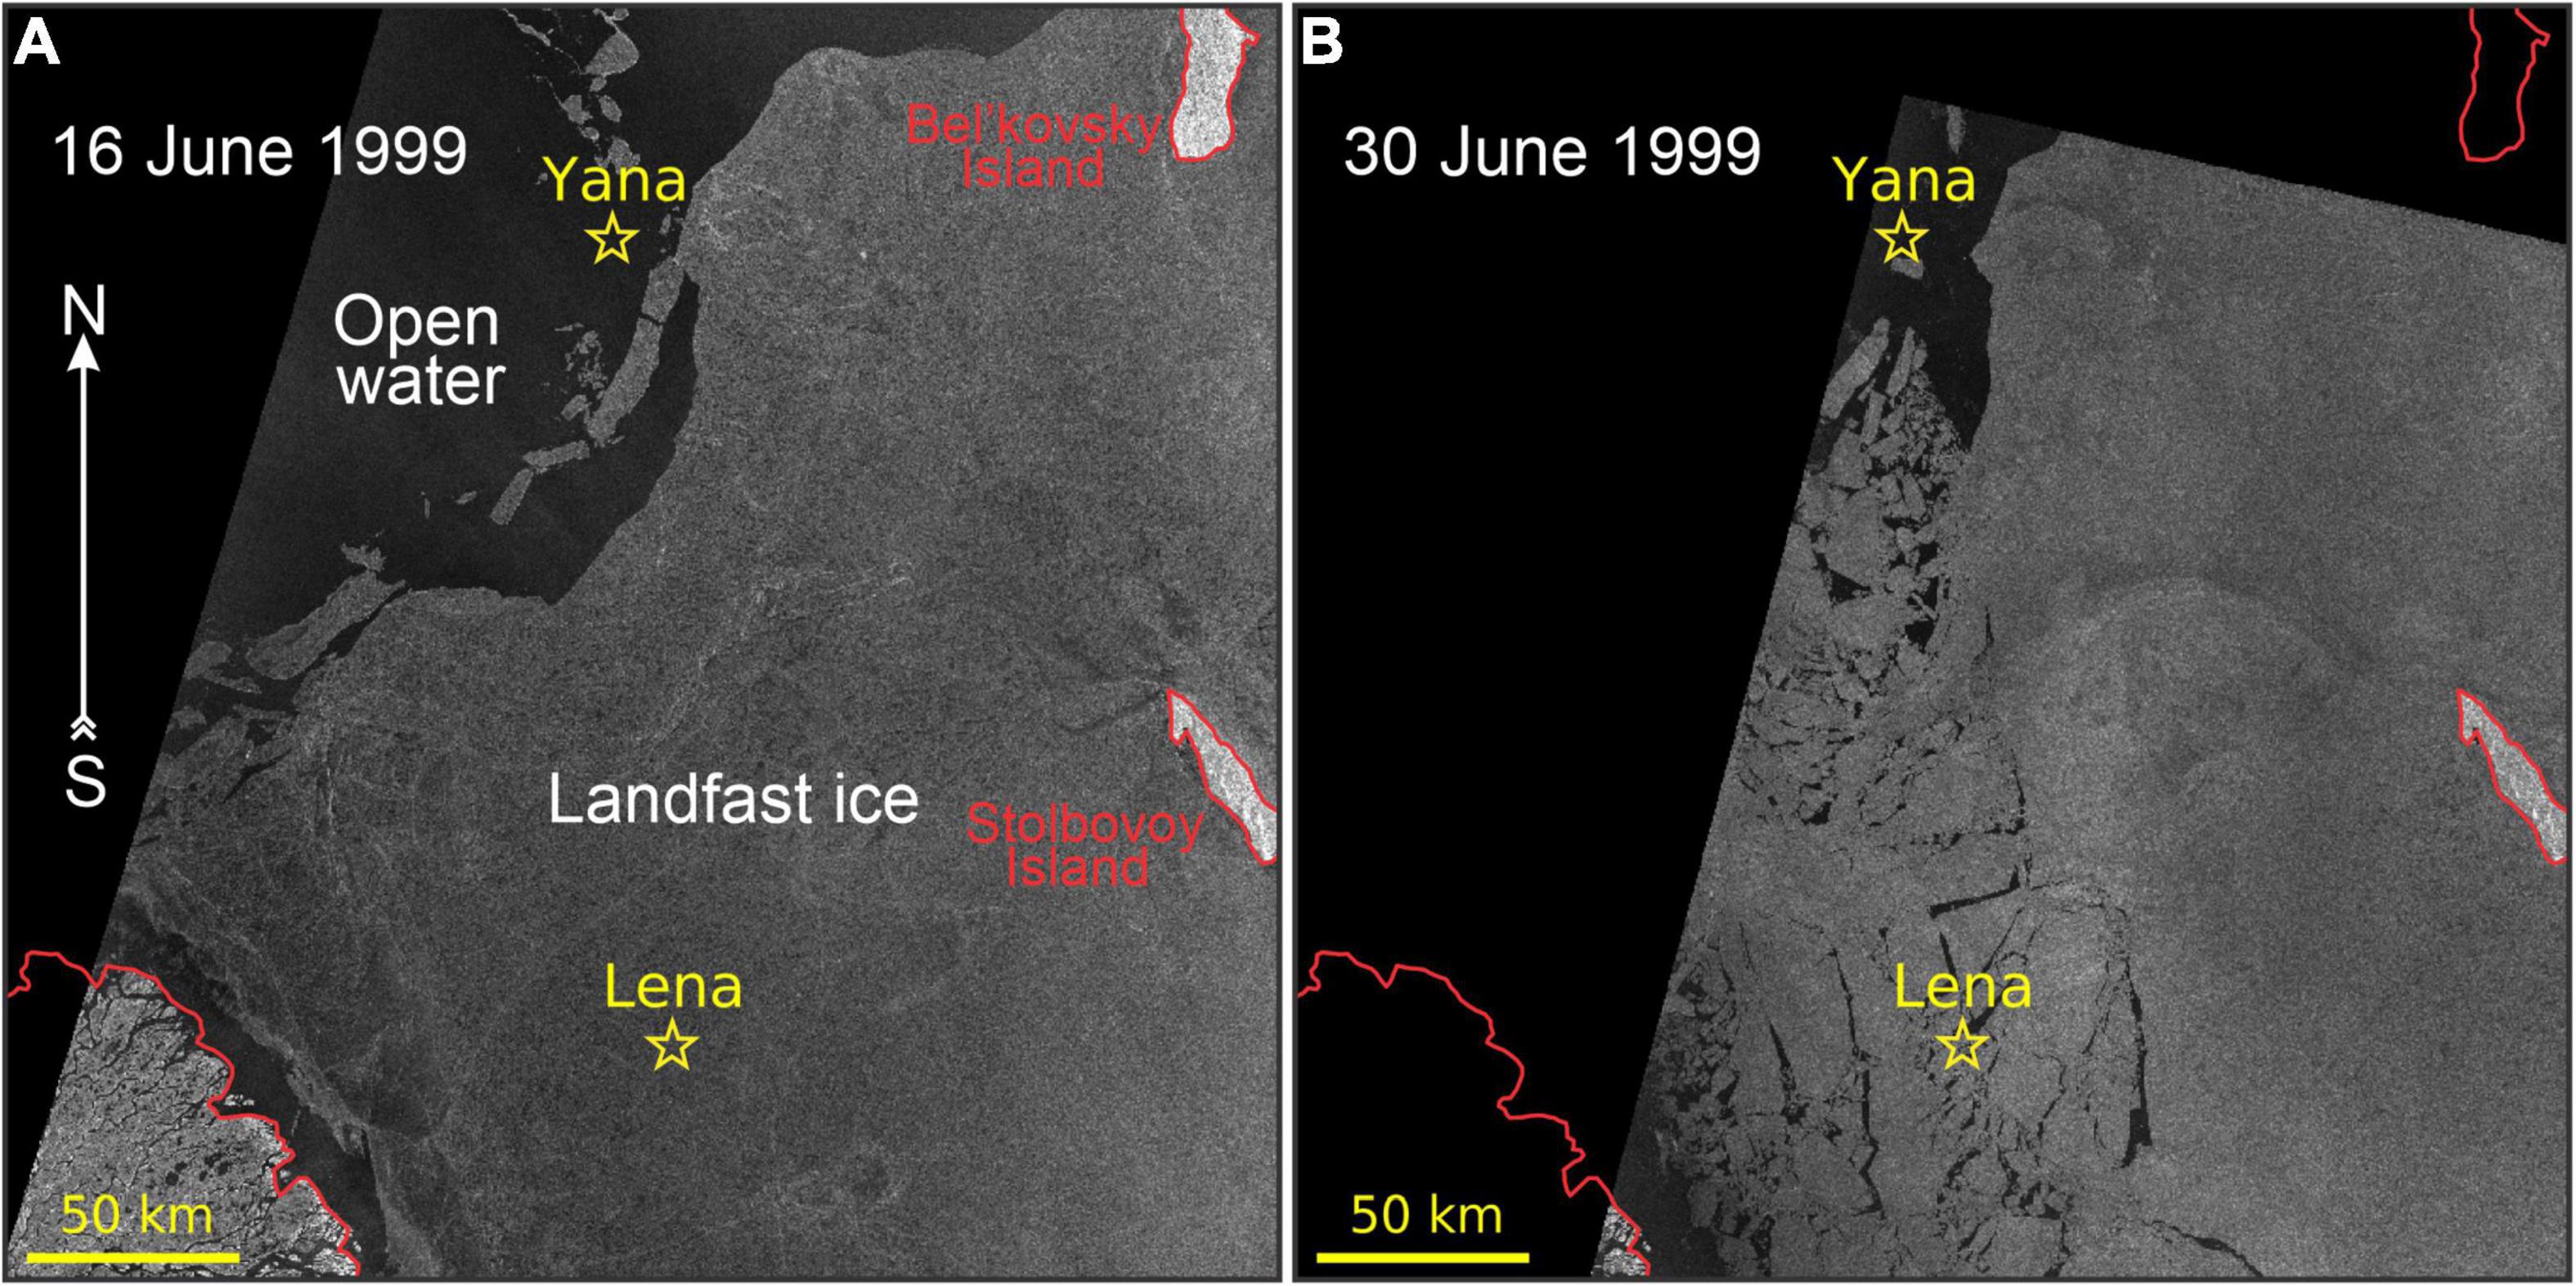
Figure 7. RADARSAT-1 ScanSAR satellite images show the evolution of ice conditions in the Laptev Sea during June 1999: (A) 16 June 1999 and (B) 30 June 1999. Black areas are associated with open water. All other designations are similar to those in Figure 5. © CSA (1999).
Monthly gridded fields of sea ice concentration around the mooring positions (red dotted lines in Figures 8A, 9A) were retrieved from the National Snow and Ice Data Center (Walsh et al., 2019). The dataset uses the NASA team algorithm (Comiso et al., 1997) to derive ice concentration from passive microwave brightness temperature data at 25 km resolution (Cavalieri et al., 1996)1. Observations of ice thickness and snow depth were not available from spaceborne satellites during winter 1998–1999, so modeled daily estimates of sea-ice thickness, concentration, and snow depth around the mooring positions, were retrieved from the Pan-Arctic Ice Ocean Modeling and Assimilation System (PIOMAS) (Figures 8A, 9A). PIOMAS was developed at the Polar Science Center, University of Washington, and is a coupled ocean and sea ice model that assimilates daily sea-ice concentration and sea surface temperature satellite products (Zhang and Rothrock, 2003). In general, PIOMAS tends to overestimate the thickness of thin ice and underestimate the thickness of thick ice (Schweiger et al., 2011). For the eastern Laptev Sea shelf, from 2003 to 2008 PIOMAS overestimated the thickness of ice relative to ICESat observations by ∼0.2–0.7 m (Schweiger et al., 2011). Additionally, PIOMAS tends to overestimate the mean snow depth in the Arctic Ocean compared to snow radar data by an average of about 4 cm (Garnier et al., 2021).
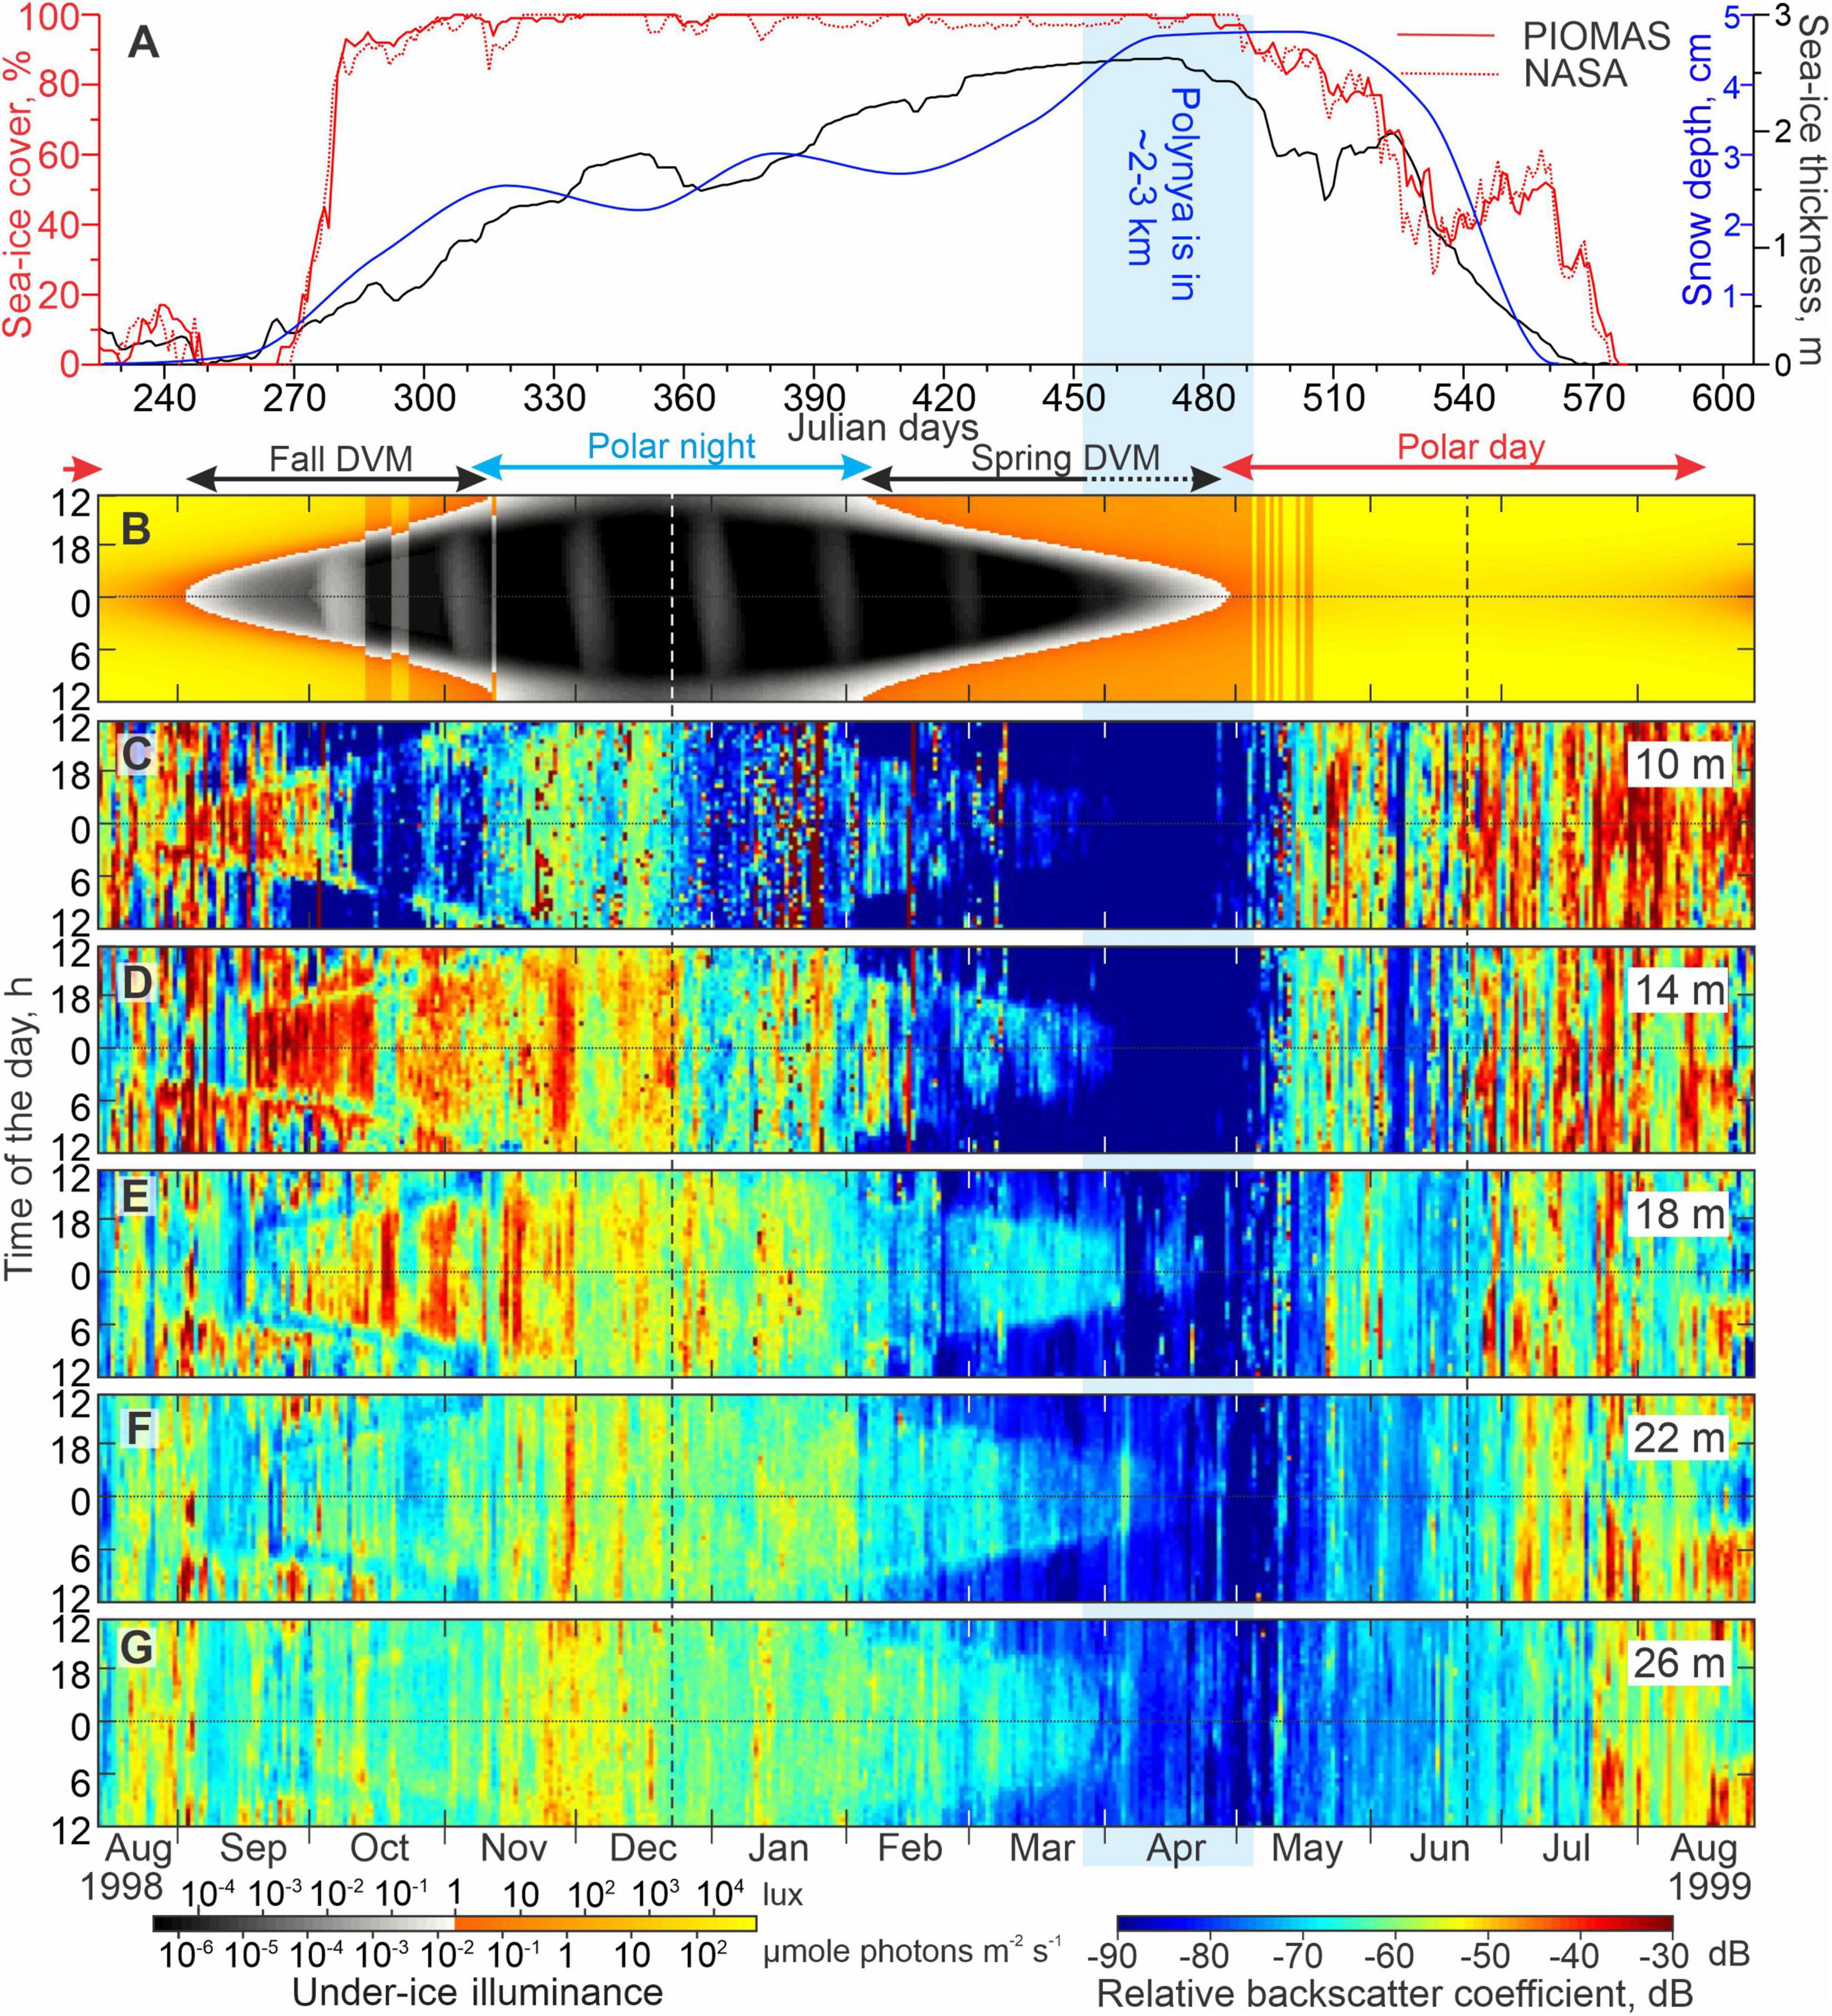
Figure 8. Sea-ice, illuminance, and acoustic backscatter data for mooring Yana. (A) Time series of the snow depth (cm, blue), sea-ice thickness (m, black), and concentrations (%, red) from PIOMAS and NASA (solid and dotted lines, respectively). Actograms of (B) modeled under-ice illuminance (lux) and (C–G) the mean volume backscatter strength (MVBS) (dB) at five depth levels: (C) 10, (D) 14, (E) 18, (F) 22, and (G) 26 m depth. Red, blue and black arrows at the top indicate the periods of polar day, polar night, and diel vertical migration (DVM) of zooplankton, respectively. Dashed black arrow indicates DVM observed only below 18 m depth. Black and white vertical lines depict solstices. Blue shading highlights the coastal polynya ∼2–3 km from Yana in March–April 1999.
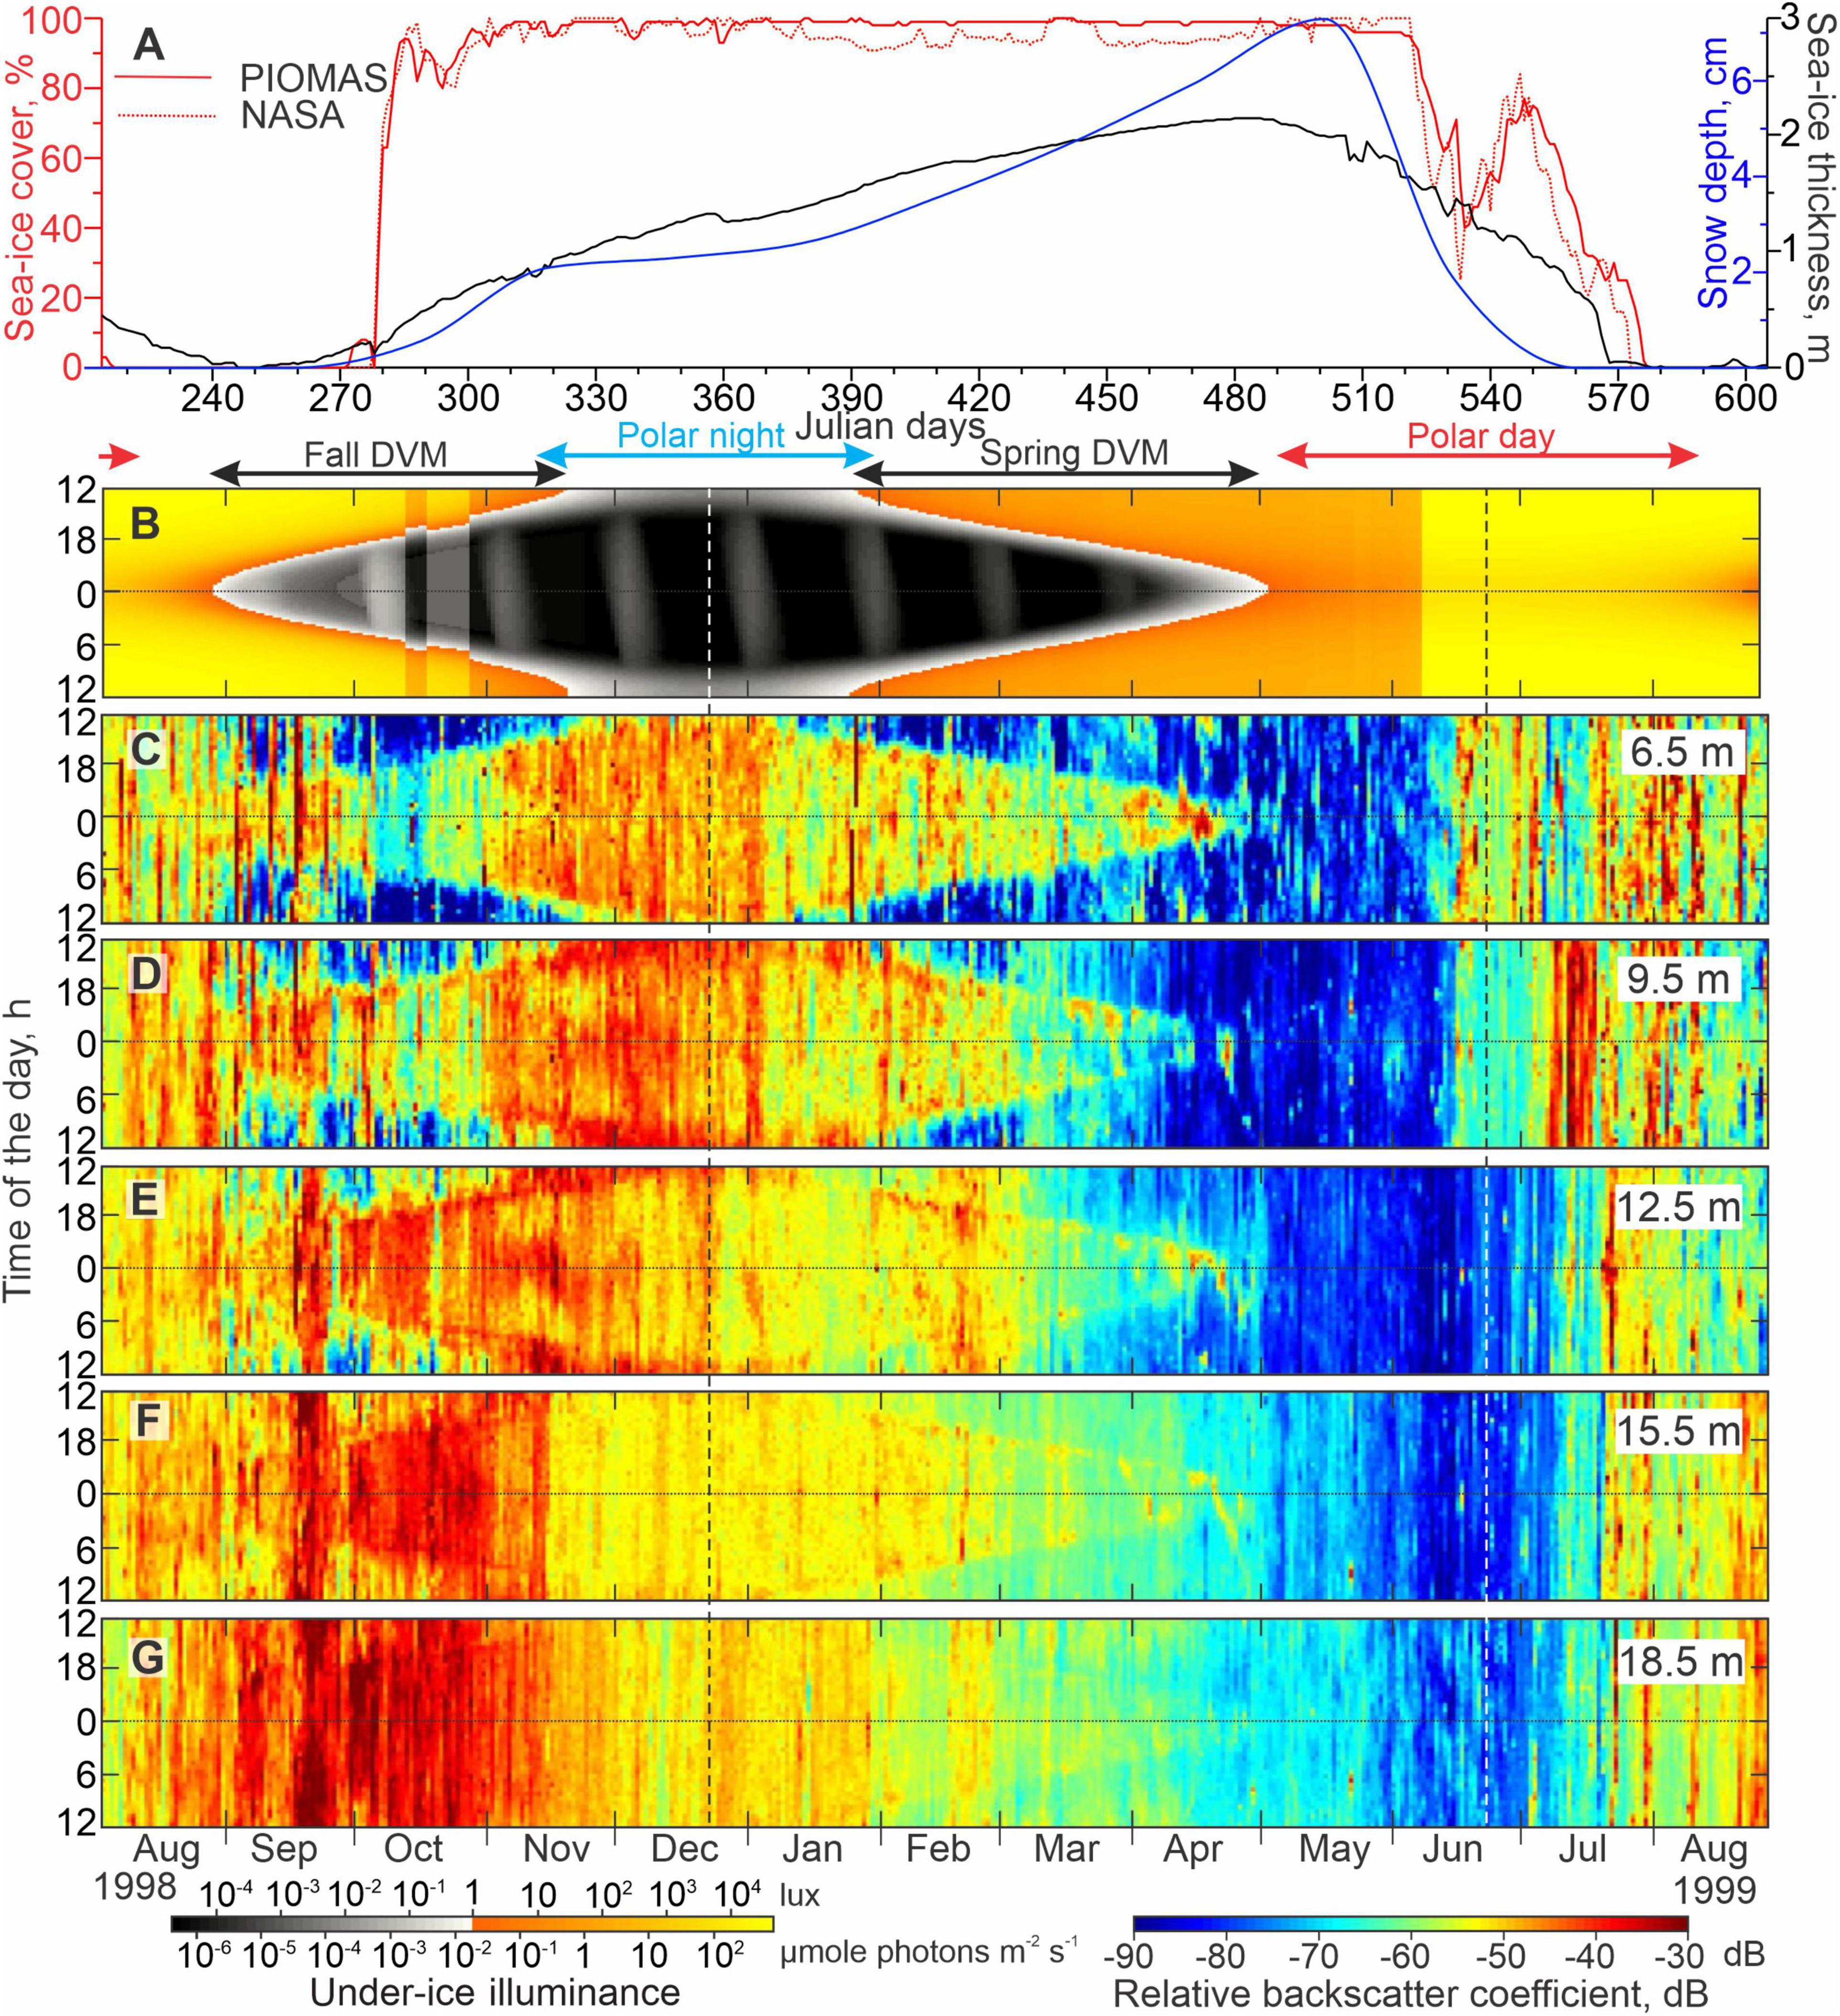
Figure 9. Sea-ice, illuminance, and acoustic backscatter data for mooring Lena. (A) Time series of the snow depth (cm, blue), sea-ice thickness (m, black), and concentrations (%, red) from PIOMAS and NASA (solid and dotted lines, respectively). Actograms of (B) modeled under-ice illuminance (lux) and (C–G) MVBS (dB) at five depth levels: (C) 6.5, (D) 9.5, (E) 12.5, (F) 15.5, and (G) 18.5 m depth. All other designations are similar to those in Figure 8.
Materials and Methods
The methodology used in this study is largely based on that applied by Petrusevich et al. (2016, 2020) and Dmitrenko et al. (2020). We analyzed the year-long time series of acoustic backscatter measured by the ADCPs to reveal modifications of the diurnal signal that is the result of DVM. In general, acoustic backscatter is explained by either suspended sediments (e.g., Wegner et al., 2005) or planktonic organisms (e.g., Petrusevich et al., 2020). Frazil ice crystals, generated during new ice growth within the Laptev Sea coastal polynya, also generate an enhanced acoustic backscatter (e.g., Dmitrenko et al., 2010a). However, because of DVM, the acoustic backscatter produced by zooplankton is more complex than the backscatter generated by sediment particles and frazil ice crystals (Stanton et al., 1994). Moreover, ADCPs, unlike echo sounders, are limited in deriving accurate quantitative estimates of zooplankton biomass (Lemon et al., 2001, 2008; Vestheim et al., 2014). This is mainly due to calibration issues (e.g., Lorke et al., 2004) and to the beam geometry (Vestheim et al., 2014). To account for the beam geometry, we derived mean volume backscatter strength (MVBS) in decibels (dB) from the acoustic backscatter echo intensity following the procedure described by Deines (1999) and updated by Mullison (2017). In what follows, we used ADCP acoustic backscatter below 10 m and 6.5 m depth for Yana and Lena, respectively. The MVBS in the surface layer above these depths appears to be contaminated by the reflection of the acoustic signal from the air-water and/or ice-water interface.
In terms of light at Yana and Lena, the polar day lasted from 27 April to 16 August 1999 and from 3 May to 11 August 1999, respectively, while the polar night continued from 6 November 1998 to 6 February 1999 and from 12 November 1998 to 31 January 1999, respectively (Figures 8B, 9B). To quantify the total sky illumination at each site we used the skylight.m function from the astronomy MATLAB package (Ofek, 2014). Under-ice illumination was modeled using the exponential decay radiative transfer model (Grenfell and Maykut, 1977; Perovich, 1996). Transmittance through the sea ice and snow cover to depth z in the ice was calculated using the following equation: T(z) = i0e–KtZ, where i0 is the fraction of the wavelength-integrated incident irradiance transmitted through the top 0.1 m of the surface layer, and Kt is the total extinction coefficient in the snow or sea-ice cover. The values adopted for the sea-ice and snow cover were i0 = 0.63 and Kt = 1.5 as well as i0 = 50.9 and Kt = 0.1, respectively (Grenfell and Maykut, 1977). For computing under-ice illumination in Figures 8B, 9B, we use PIOMAS estimates of sea-ice thickness and snow depth (Figures 8A, 9A), although we only accounted for the sea ice and snow cover if the sea-ice concentration exceeded 90%. This implies that if sea-ice concentration was less than 90%, the sea ice cover was not accounted for when calculating light transmission. Due to a high uncertainty in available cloud cover data (Liu and Key, 2016), this model does not account for the variation in solar irradiance from clouds.
Time series of MVBS (Figures 8C–G, 9C–G) and surface layer illumination (Figures 8B, 9B), computed from the PIOMAS estimates of sea-ice thickness and snow depth, are presented in the form of actograms. Variations during a day-long period are presented along the vertical axis of the actogram, while the long-term patterns of diurnal behavior can be assessed following the horizontal axis (e.g., Leise et al., 2013; Last et al., 2016; Petrusevich et al., 2016, 2020; Hobbs et al., 2018; Dmitrenko et al., 2020). For the actograms of illuminance we introduced an artificial visual boundary on the illuminance color scheme at 1 lux (gray to orange), which is the threshold that corresponds to illuminance during the deep twilight.
Regional Settings
Sea-Ice
During 1998–1999, the Laptev Sea was covered with sea-ice from the beginning of October 1998 to the end of July 1999 (Figures 5–7, 8A, 9A). According to daily ice concentration data, freeze-up began on 25 September 1998 (Figures 5A, 8A, 9A) and was persistent at Lena and Yana from 5 October onward (Dmitrenko et al., 2002). Sea-ice concentration from both PIOMAS and passive microwave NASA data reached 90% on 8 and 9 October 1998 for Yana and Lena, respectively (Figures 8A, 9A). PIOMAS estimates of landfast sea-ice thickness at Lena increased from ∼0.5 m on 15 October 1998 to 2.15 m on 30 April 1999 (Figure 9A), which corroborates our in situ observations from May 1999 and generally agrees with the latest satellite altimetry data from the area (e.g., Perovich et al., 2020). At Yana (Figure 8A) ice thickness increased from ∼0.65 m on 15 October 1998 (Figure 5B) to 2.6 m on 18 April 1999 (Figure 6B), which significantly exceeds ice thickness observations of the mobile pack ice in the Laptev Sea from the latest satellite and mooring observations (Hendricks et al., 2018; Belter et al., 2020). Overall, it seems that PIOMAS accurately represents landfast ice thickness but overestimates pack ice thickness in the eastern Laptev Sea.
The location and extent of the polynya varied throughout winter 1998–1999 according to the surface winds. Using the time series of winds and RADARSAT-1 imagery we provide the context on the ice cover relative to the mooring locations. South-westerly winds up to 8–9 m s–1 from 16 to 20 December 1998 (Figure 4A) led to the formation of a polynya along the landfast ice edge that bisected the area between Lena and Yana (Figure 5C). Between December and February the landfast ice edge extended offshore, and reached the location of Yana. During February 1999 the coastal polynya occurred only in a chain of separate, relatively narrow flaw leads that extended over Yana, as evident on 22 February 1999 (Figure 5D). By March 26, the landfast ice extended ∼2–3 km beyond Yana (Figure 1B), where it remained stable until its collapse in mid-May (Figure 6D). However, from mid-March to mid-May there were several large polynya events along the landfast ice edge (Figures 5, 6) that were driven by southeasterly winds (Figure 4A). These events led to considerable new ice growth within the polynya under cold air temperatures (Figure 4B). Between 24 and 27 March, southeasterly winds up to ∼8 m s–1 created a large polynya (Figures 4A, 6A). In situ data from Kotelny Island reveal that southeasterly winds peaked at 16 m s–1 during this period (Dmitrenko et al., 2005b). Following this event, winds decreased to 3–5 m s–1 during the first week of April, although they remained from the southeast and maintained a polynya around 10–13 km wide through to April 5 (Figure 6A). Strong southeasterly winds up to 9 m s–1 returned on 12 April, and gradually turned to a westerly heading around 14 April, which led to an expansion of the polynya by 18 April (Figure 6B). The largest polynya opening occurred in early May, when the southeasterly winds from 3 to 5 May (Figure 4A) caused the polynya to extend up to 130 km from the landfast ice edge and ∼70–80 km from Yana, which was still located under the landfast ice (Figure 6C). The opening of the polynya generated widespread formation of young ice between late March and early May, during a period of overall low air temperatures (Figure 4B) and subsequently high ice formation rates.
The landfast ice edge collapsed prior to 13 May, and was likely the result of strong southeasterly winds from 9 to 12 May (Figures 4A, 6D). This caused Yana to be covered by the polynya where pieces of broken off landfast ice were still located. This is also confirmed by the sea-ice concentrations from both PIOMAS and NASA (Figure 8A). Consequently, the landfast ice edge stabilized about 15 km east of Yana until the end of June 1999 (Figure 7).
In contrast to Yana, Lena was located beneath the landfast ice during the entire ice-covered period until the end of June when the landfast ice over the southern Laptev Sea started to breakup (Figure 7B). However, both the PIOMAS and NASA ice concentration data show a drop in sea ice concentration to 40% at Lena between 5 and 30 June (Figure 9A). This is an obvious error, and was likely caused by the onset of surface melt and presence of melt ponds on top of the landfast ice during June. In light of this error, the abrupt increase in under ice illuminance from ∼102 to 104 lux between 5 and 30 June (Figure 9B) seems to be artificial.
Salinity and Temperature
The CTD profiles collected during mooring deployment (August 1998) and recovery (September 1999), as well as in April and May 1999 at Lena and Yana show significant (i) spatial, (ii) seasonal, and (iii) interannual differences in the salinity profiles.
Spatial Variability
Due to its proximity to the Lena River Delta, the long-term (1920–2008) mean salinity at Lena is 11 ± 3.5, compared to 18 ± 4.5 at Yana (Dmitrenko et al., 2010b). In August 1998, the salinity of the surface water layer at Lena was ∼5, whereas during September 1999 it increased to ∼18. Conversely, the salinity of the surface water layer at Yana was about 21.5 in August 1998, but declined to 12.5 by September 1999 (Figure 2). This highlights the interannual variability of riverine water distribution over the Laptev Sea shelf, which impacts the local ecosystem and therefore DVM. This will be further discussed below.
Seasonal Variability
The Laptev Sea shelf is situated within the seasonally ice-covered zone. Intensive thermodynamic ice formation during winter provides a strong salt input to the underlying shelf water due to brine release that gives rise to the seasonal salinity changes. Dmitrenko et al. (2009) estimated the long-term mean (1960s–1990s) summer-to-winter seasonal salinity difference over the eastern Laptev Sea increasing from ∼2.5 at Lena to ∼4.5 at Yana. The regional difference was explained by sea-ice formation in the coastal polynya that is typically located closer to Yana. From August 1998 to April 1999, the surface salinity at Lena increased by ∼10, and the mean salinity of the entire water column increased by ∼7.5 (Figure 2A). This seasonal increase in salinity cannot be entirely explained by seasonal sea-ice growth, suggesting some contribution from seasonal water dynamics. At Yana, from August 1998 to May 1999, the surface salinity only increased by ∼2 (Figure 2B); however, we note that the CTD profile taken from the landfast ice in May 1999 was conducted approximately 10 km east of Yana, and was therefore further from the landfast ice edge and coastal polynya.
Interannual Variability
The interannual variability of the Laptev Sea hydrography is primarily wind driven (Dmitrenko et al., 2005a,2008). Interannual variability of summer surface salinity over the Laptev Sea shelf was attributed to the difference in local wind patterns for positive and negative phases of atmospheric vorticity over the adjacent Arctic Ocean (Dmitrenko et al., 2005a). In August 1998, strong freshening was observed in the southern Laptev Sea (Lena), while in August 1999 the surface salinity at this location increased by ∼13 (Figure 2A). In contrast, 190 km northward at Yana, the surface salinity decreased from ∼22 in August 1998 to 12.5 in August 1999 (Figure 2B). The atmospheric reanalysis data show that this variability in surface salinity was conditioned by the different patterns of SLP over the adjacent Arctic Ocean (Figure 3). During the ice-free season of 1998, the onshore north-westerly winds over the Laptev Sea were conditioned by a high pressure system centered over Svalbard and a low pressure system extending northward from the East Siberian Sea (Figure 3A). The southward onshore diversion of Lena River water resulted in a negative salinity anomaly over the southern Laptev Sea (Lena; Figure 2A) and a positive salinity anomaly over the eastern Laptev Sea (Yana; Figure 2B). In contrast, during the ice-free season of 1999, the opposite SLP pattern was observed (Figure 3B). This generated southeasterly wind over the Laptev Sea shelf forcing the freshwater plume northward and resulting in a positive salinity anomaly over the southern Laptev Sea (Lena; Figure 2A), and a salinity decrease northward (Yana; Figure 2B). In this context, winter hydrographic conditions at Yana are clearly linked to the previous summer conditions (Figure 2B), with winter salinity patterns preconditioned by summer atmospheric forcing (Figure 3A), as previously reported by Dmitrenko et al. (2010b).
Over the eastern Laptev Sea shelf, water temperature is mainly conditioned by salinity. During summer, the water temperature is generally dominated by the riverine water distribution. The temperature of the low salinity riverine water is generally higher compared to marine water. Below the surface mixed layer, water temperature gradually decreased from −1.5 to −1.7°C near the seafloor (Figure 2). During winter, temperature is vertically uniform, approaching the freezing temperature at a given salinity (Figure 2).
Zooplankton
The zooplankton communities of the Laptev Sea shelf have a low diversity, and are composed mostly of copepods, with a domination of small-sized organisms highly tolerant to low salinity. The structure of the zooplankton communities in different regions of the Laptev Sea shelf strongly depends on the spatial distribution of the riverine water (Abramova and Tuschling, 2005). Zooplankton communities of the coastal zone consist of freshwater and brackish-water species in summer, and brackish-water species in winter. In the eastern and southeastern Laptev Sea, where the surface salinity during summer gradually increases northward from ∼10 to 22 (Dmitrenko et al., 2010b), the zooplankton assemblages consist of brackish–water neritic species. In contrast, the western and northeastern Laptev Sea affected by the oceanic water is inhabited by marine neritic fauna (Kosobokova et al., 1998). Finally, the central Laptev Sea shelf is characterized by the transitional brackish–marine zooplankton species assemblage (Lischka et al., 2001; Abramova and Tuschling, 2005).
The brackish-water copepods Drepanopus bungei, Limnocalanus macrurus, and Pseudocalanus major are the major contributors to the zooplankton abundance and biomass in the coastal regions of the Laptev Sea (Abramova and Tuschling, 2005). In the eastern and southeastern coastal zone, the brackish-water copepods D. bungei, P. major, L. macrurus, and Acartia longiremis dominate during summer (Lischka et al., 2001; Abramova and Tuschling, 2005). The overall zooplankton abundance strongly depends on population of the copepod D. bungei (Abramova and Tuschling, 2005). The seasonal increase of its total abundance from winter to late summer ranges from 30- to 60-fold, while the interannual variations were only two-fold on average (Abramova and Tuschling, 2005). A transitional community with both the brackish-water and neritic marine components (20% and 15% of the total abundance, respectively) occupies the central Laptev Sea shelf (Abramova and Tuschling, 2005). Marine copepods Calanus glacialis, Metridia longa, Pseudocalanus acuspes, and Oithona similis are abundant in summer, with the first three species dominating the zooplankton biomass. The copepod nauplii constitute up to 48% during summer (Abramova and Tuschling, 2005). The range of interannual variability of zooplankton abundance in this region was assessed based on sampling in August 1998 and 1999 and in April–May 1999. In 1998, the total abundance was consistently higher compared to 1999 over the entire sampling area in the eastern Laptev Sea. Moreover, the regional patterns of zooplankton distribution were correlated with the riverine water spatial distribution (Abramova and Tuschling, 2005). Over the western and northeastern Laptev shelf, marine and neritic copepods dominate with Calanus spp., O. similis, and Pseudocalanus minutus comprising ∼44% of the total abundance. In the northeastern region, the copepod A. longiremis was also recorded (Abramova and Tuschling, 2005). The populations of large Arctic copepods M. longa and Calanus hyperboreus in the northern Laptev Sea seems to be mainly supplied by advection of Atlantic and Arctic water. Contrary, C. glacialis is known to maintain its local population over the central and northern Laptev Sea shelf with the highest reproductive activity in the ice marginal zone over the continental slope (Kosobokova and Hirche, 2001; Ershova et al., 2021).
A mosaic pattern of the zooplankton distribution along with strong regional and seasonal variability of abundance and biomass is typical for the Laptev Sea plankton ecosystem. Recent biomass assessments were presented by Kosobokova et al. (1998), Abramova (1999), and Lischka et al. (2001). During summer 1993, for the domain of our interest in the eastern Laptev Sea shelf, the maximum zooplankton biomass was found near the Lena Delta (104 mg DM m–3; Fahl et al., 2001). In the southeastern, central, western and northwestern Laptev Sea shelf, biomass values ranged from 8 to 119 mg DM m–3 demonstrating pronounced patchiness (Lischka et al., 2001). During fall 1995, maximum biomass was found close to the Lena Delta (263 mg DM m–3). In the coastal zone, biomass was very low, similar to the summer 1993, ranging from 0.3 to 31 mg DM m–3. Data from 1993 to 1995 indicate that there is enhanced production of zooplankton close to the river outlets. It was suggested that the extremely high zooplankton abundance and biomass in this area was related to dissolved and particulate matter input with the riverine waters resulting in enhanced phytoplankton production close to the river mouths (Lischka et al., 2001).
Results
Annual actograms of the modeled under ice illuminance and MVBS were computed for various depths at both Yana (Figure 8) and Lena (Figure 9) based on total sky illuminance, sea ice concentration, sea ice thickness, and snow depth. These actograms reveal a rhythm of activity with the diurnal cycle seen in the vertical axis and the yearlong variability of the diurnal cycle observed along the horizontal axis. The strength of acoustic backscatter is presented by colored contours and provides qualitative information on the concentration of scattering features in the water column.
Diurnal Signal of the Mean Volume Backscatter Strength
In general, the MVBS diurnal signal follows the seasonal variability of the sun illuminance except for the period of polar day and polar night when the sun is above and below the horizon 24 h a day, respectively. In Figures 8B, 9B, blue and red arrows depict the periods of polar day and polar night, respectively. During polar day and polar night, the diurnal pattern of MVBS completely vanishes through the water column resolved with ADCP data at both Yana and Lena (Figures 8C–G, 9C–G, respectively). During the transitional period between polar night and polar day (black arrows Figures 8B, 9B), the diurnal cycle in the sun illuminance is mimicked by a daily cycle in MVBS down to a depth of 26 m at Yana and 15.5 m at Lena. Below 15.5 m at Lena, the diurnal patterns of MVBS are not present (Figure 9G).
During the fall transition from polar day to polar night (approximately the end of August and beginning of September 1998 for Lena and Yana, respectively), the occurrence of the MVBS diurnal pattern corresponds to a decrease in the midnight surface layer illuminance below 1 lux (Figures 8D–G, 9D–G), the threshold, which is associated with illuminance during the deep twilight. Further onward, until the beginning of the polar night, the MVBS diurnal signal roughly follows the 1 lux illuminance threshold with acoustic backscatter enhanced during the dark time once illuminance falls below 1 lux. Once polar night begins and the under ice-illuminance falls below 1 lux for 24 h a day, the MVBS diurnal pattern vanishes.
The MVBS diurnal pattern resumed during the spring transition from polar night to polar day (approximately the end of January and beginning of February 1999 for Lena and Yana, respectively) (Figures 8D–G, 9D–G). This corresponds to an increase in the under-ice illuminance to >1 lux at noon (Figures 8B, 9B). At Lena, the MVBS diurnal signal followed the 1 lux threshold and vanished once the under-ice illuminance exceeded the threshold throughout the day shortly before the start of polar day at the beginning of May 1999 (Figures 9B–G). During this time, Lena was still located beneath the landfast ice that was ∼2 m thick (Figures 6C,D, 7, 9A).
In contrast, at Yana, the MVBS diurnal pattern completely vanished at shallower depths (10 and 14 m depth; Figures 8C,D) and was strongly disrupted at lower depths (18–26 m depth; Figures 8E–G) around the end of March, approximately 1-month prior to the start of polar day when the MVBS would be expected to end. The timing of this corresponds to the formation of the coastal polynya ∼2–3 km from Yana between 24 and 27 March 2007 (Figures 1A, 6A–C). By 29 April 1999, when the midnight under-ice illuminance first exceeded 1 lux (Figure 8B), the polynya extended ∼65 km eastward from Yana with open water extending approximately 15 km off the landfast ice edge (not shown). During this time, low MVBS (<−80 dB) was observed at 10 and 14 m depth throughout the day, with no diurnal cycle (Figures 8C,D). Low MVBS during April 1999 also confirms that Yana was still located beneath the landfast ice cover, otherwise, an enhanced acoustic backscatter would be recorded due to frazil ice generated by new ice growth within the polynya during a period when air temperatures remained relatively cold (−19°C; Figure 4B; Dmitrenko et al., 2010a). Note that the MVBS diurnal pattern at Lena located about 120 km from the landfast ice edge did not deviate until the very beginning of May 1999 when under-ice illuminance exceeded 1 lux (Figure 9).
Finally, actograms in Figures 8C–G, 9C–G suggest no deviation of the MVBS diurnal pattern that can be associated with moonlight. During full moons, the midnight under-ice illuminance increased to ∼0.001 lux in February–March 1999 and up to ∼0.01 lux in October 1998 (Figures 8B, 9B). During fall 1998 and spring 1999, the diurnal signal in MVBS at Yana was rather noisy; however, the consistent deviation of the diurnal pattern in response to the enhanced illuminance during the full moon phase is hardly recognizable (Figures 8B–G). The uncertain data on the total cloud cover from the ERA5 atmospheric reanalysis revealed relatively high cloudiness during full moon events from 33.7% (days 420–430) to 69.5% (days 303–313) (not shown). The moonlight illuminance is reduced by cloud cover from ∼200 × 10–3 lux to ∼0.2 × 10⁻³ lux (Krieg, 2021). We note, however, that DVM can be disrupted when under-ice illuminance is <0.002 lux (Petrusevich et al., 2016). Overall, the combination of highly uncertain cloud cover data from the atmospheric reanalysis with noisy MVBS during polar night makes any suggestions about the impact of moonlight on DVM to be very speculative. At Lena, the relatively stable MVBS diurnal cycle also shows no disruptions that could have been generated by moonlight (Figures 9B–G). During the full moon event in October 1998, the midnight MVBS at 6.5 m depth was reduced (Figures 9B,C), but the mean cloud cover of 38% (not shown) does not allow clear attribution of this DVM disruption to moonlight. However, the moonlight impact on DVM cannot be completely discriminated at Yana and Lena.
Mean Volume Backscatter Strength During Polar Day and Polar Night
During polar day and polar night, the MVBS diurnal signal vanished at both Yana and Lena. During polar day, the acoustic backscatter episodically increased 24 h a day up to −40 to −30 dB showing noisy spikes with a magnitude reducing with depth (Figures 8C–G, 9C–G). In contrast, during polar night, the MVBS signal is generally more stable, though it did begin to decrease around the winter solstice (Figures 8C–G, 9C–G).
At Yana, following the beginning of polar day, the increase in MVBS at 10–14 m occurred after the collapse of the landfast ice edge around 11–12 May 1999. Afterward, Yana was primarily covered by open water (e.g., Figure 7A) or pieces of broken off landfast ice (e.g., Figure 7B). Since the beginning of June 1999, 3 weeks before the summer solstice, the air temperature at Yana exceeded 0°C, and sea-ice started to melt with thickness gradually decreasing from a peak of 1.7 m in April (Figure 8A). The period from the beginning of June to ice-free conditions around 23–27 July 1999 is associated with deepening of the enhanced MVBS signal down to 22 m depth (Figures 8A,C–F). Afterward, and until mooring recovery on 30 August 1999, the maximum MVBS was recorded through the subsurface water layer at 10 m depth (Figure 8C), but MVBS gradually increased at depth over time (Figures 8D–G). During the end of polar day through August–September 1998 (illuminance >1 lux), MVBS increased in the subsurface water layer until freeze-up began on 25 September 1998 (Figures 5A, 8B,C). Overall, MVBS from 10 to 26 m depth in August 1999 exceeded that in August 1998 by ∼10–15 dB at Yana.
During polar night, MVBS at Yana was relatively high prior to the winter solstice (Figures 8C–G). Specifically in the subsurface water layer at 10 m depth, MVBS remained around −55 dB until the winter solstice, at which point it rapidly decreased to about −70 dB, and the acoustic signal became noisy, with random spikes up to −35 dB during January 1999 (Figure 8C). Similar MVBS patterns were recorded at 14–18 m depth, but MVBS values were ∼10–15 dB greater than at 10 m depth (Figures 8D,E).
During polar day at Lena, MVBS in the surface layer (6.5 and 9.5 m depth) began to increase around the time that sea ice concentration began to decrease and modeled under-ice illuminance increased around 5 June 1999 (Figures 9A,C,D). However, from RADARSAT-1 imagery we know that the ice cover remained in place (Figure 7A) and instead melt ponds are suggested to form at the surface. Around this time MVBS increased from <−70 dB to ∼−50 dB at 6.5 m (Figure 9C), followed by an increase in MVBS to −60 dB at 9.5 m approximately 1-week later (Figure 9D). After 6 July, MVBS increased through the entire water column up to a peak of −45 dB at 9.5 m depth (Figures 9C–G). During the end of polar day in August–September 1998 (illuminance >1 lux), increased MVBS was recorded until freeze-up began on 25 August 1998 (Figures 5A 9B,C). Moreover, during August 1998, MVBS exceeded that of August–September 1999 by ∼10–25 dB. For example, at 12.5 and 18.5 m depth, MVBS in August 1999 exceeded that in August 1998 by ∼10–15 dB, with MVBS gradually increasing with depth from about −55 dB at 6.5 m to ∼−40 dB at 18.5 m (Figures 9C,G).
In contrast, during the polar night at Lena, MVBS gradually decreased with depth and decreased over time at all depths. At 12.5 m depth, MVBS decreased shortly after the winter solstice, while at 6.5 and 9.5 m depth, this reduction lagged behind the winter solstice by about 2 weeks (Figures 9C–E). At 15.5 m depth, MVBS rapidly decreased from −40 dB to −53 dB in mid-November (Figure 9F). At 18.5 m depth, a gradual reduction in MVBS was recorded from −35 dB in September 1998 to −60 dB in February 1999 (Figure 9G).
Finally, there are spatial and interannual differences between MVBS at Yana and Lena (Figures 8C–G, 9C–G). In 1998, the polar day period is not sufficiently resolved with mooring observations. However, during August–September 1998, MVBS at Lena exceeded MVBS at Yana by ∼12 dB. In contrast, during the polar day of 1999, MVBS at Yana exceeded that at Lena by ∼15 dB. Moreover, during polar night in 1998–1999, MVBS at Lena exceeded that at Yana by ∼10 dB.
Discussion
Zooplankton Diel Vertical Migration During Spring and Fall
The year-long ADCP time series of MVBS over the eastern Laptev Sea shelf are consistent with seasonal DVM of zooplankton conducted during the transition periods between polar day and polar night (Figures 8, 9). During this time, the MVBS diurnal signal is generated by a diurnal movement of zooplankton toward the surface at dusk and descent before dawn the next morning. It is commonly accepted that DVM demonstrates predator-avoidance behavior (e.g., Hays, 2003). Zooplankton keep away from a relatively well-illuminated surface water layer during the day, reducing light-dependent mortality risk. In contrast, during the polar day and polar night, DVM completely vanished (Figures 8, 9).
The acoustic data from the single-frequency ADCP do not provide any information on the identity of organisms responsible for the observed DVM patterns. Among the zooplankton species abundant in the research area, only late copepodite stages of large-sized copepods Calanus glacialis and Metridia longa (total body length 2.0–5.0 mm) are known to perform DVM in the Laptev and Kara seas (Arashkevich et al., 2018). However, these species migrate to deeper regions from October to March, and were most likely absent from the study area. Small-sized brackish-water copepods Acartia longiremis and Drepanopus bungei (≤1.5 mm total body length) are abundant in the study region year round, although their DVM have not been studied in either the Laptev Sea, or other Siberian shelf seas. This is apparently related to the fact that their DVM in the Arctic, if any, is limited to a few meters (Drits et al., 2017), which is beyond the sensitivity of the conventional zooplankton collection methods. Moreover, from November to March, the size range of these species is below the sensitivity of 300 kHz ADCPs used in this research. The abundant small-sized copepod, Pseudocalanus spp. (predominantly P. minutus and P. acuspes; total body length of copepodite stages IV–V is ∼0.8–1.2 mm), may represent another zooplankton species comprising DVM in the study region. DVM of Pseudocalanus was recorded in the seasonally ice-covered White Sea (Pertsova, 1984), Kara Sea (Drits et al., 2017), and Hudson Bay (Runge and Ingram, 1991). Finally, DVM of two larger crustaceans with body size >2 mm, the amphipods Themisto spp. and mysids, recorded in the Arctic Ocean (e.g., Petryashov, 1989; Fortier et al., 2001), can also comprise DVM in the study region. We assume that copepods Pseudocalanus spp., amphipods Themisto spp., and mysids all may perform seasonal DVM in the eastern Laptev Sea. According to their size range, they can serve as prey for polar cod (e.g., Buckley and Whitehouse, 2017; Cusa et al., 2019; Bouchard and Fortier, 2020; Aune et al., 2021).
In general, DVM at Yana and Lena was controlled by light conditions (Figures 8, 9). Similar to other areas, DVM is triggered by local solar variations, and the timing of migration is sensitive to changes in seasonal day length (e.g., van Haren and Compton, 2013). Our results show that DVM responds to the seasonality of sunlight and the seasonality of sea-ice cover that attenuates light transmission to the water column. DVM at Yana and Lena started to occur once the surface layer midnight illuminance exceeded the threshold of 1 lux. Then DVM ceased entirely once the surface layer illuminance exceeded 1 lux for 24 h a day. These results are consistent with a seasonal cessation of DVM reported by Hobbs et al. (2018) at higher latitudes between 77° and 81° N.
Our results on the 1 lux threshold are consistent with the preferendum (isolume) hypothesis (e.g., Cohen and Forward, 2009). A variant of the preferendum hypothesis, the absolute intensity threshold hypothesis, suggests that an ascent at sunset is initiated once the light intensity decreases below a particular threshold level, and a descent at sunrise occurs when the light intensity increases above the threshold intensity (e.g., Cohen and Forward, 2019). This is in line with our findings on an absolute 1 lux threshold of light, which corresponds to illuminance during the deep twilight. It seems that the particular value of the illuminance threshold depends on the zooplankton species composition comprising DVM. For example, for the eastern Beaufort Sea continental slope, Dmitrenko et al. (2020) revealed an absolute 0.1 lux threshold of light controlling seasonal DVM. This threshold corresponds to moonlight illuminance during the gibbous moon under a clear sky. However, Hobbs et al. (2021) revealed a significantly lower value of light limit of photobehavior for species comprising the backscatter signal (∼10–7 μmol photons m–2 s–1 that is <10–5 lux; see color scale for under-ice illuminance at the bottom of Figures 8, 9).
While DVM at Yana and Lena was in general controlled by light conditions, during spring 1999 there was a principal difference between the two sites. At Lena, located ∼120 km from the landfast ice edge, DVM was entirely controlled by light conditions (Figure 9). In contrast, at Yana, located near the landfast ice edge, the light-driven behavior of zooplankton was completely disrupted following the polynya opening in March–April 1999 (Figures 8A,C,D). This suggests that DVM was not entirely controlled by illuminance, as there were no abrupt changes to the under-ice light conditions while the polynya was open during March–April 1999 (Figure 8B). Moreover, the acoustic backscatter derived from 2 year-long moorings Khatanga and Anabar deployed in the Laptev Sea polynya area in September 2007–2008 and the short-term moorings deployed along the land-fast ice edge in April 2008 and 2009 also showed no seasonal DVM during spring transition from polar night to polar day (not shown, for mooring locations see Dmitrenko et al., 2012).
We suggest that opening of the polynya near Yana generated far-field effects on zooplankton behavior. Since the opening of the polynya did not cause any change in illuminance at Yana (Figure 8B), the observed interruption of zooplankton DVM at Yana in March–April 1999 could potentially be explained by predator-avoidance behavior. Polar cod (Boreogadus saida) is one of the main predators of the zooplankton taxa likely responsible for the observed DVM (e.g., Buckley and Whitehouse, 2017; Cusa et al., 2019; Bouchard and Fortier, 2020; Aune et al., 2021). Polar cod is known to occupy surface waters over shallow coastal continental shelves in winter and spring (e.g., Gradinger and Bluhm, 2004; David et al., 2016). The zooplankton possibly stopped conducting DVM and remained closer to the seafloor, as a predator-avoidance behavioral response to the increase in polar cod abundance near the sea surface. We speculate on two possible scenarios in which the polynya opening could have increased polar cod abundance. In a first scenario, the opening of the polynya increased primary production in the area, which attracted herbivorous zooplankton, and in turn, polar cod. In a second scenario, polar cod were attracted toward the polynya by the enhanced irradiance, and a domino effect (fish following others in their aggregation) resulted in increased polar cod abundance in an area larger than the polynya, including at Yana ∼2–3 km from the ice edge. Unfortunately, the ADCPs echograms could not detect higher abundance of polar cod near the surface at Yana than at Lena to validate these scenarios because the ADCP signal below the ice is compromised due to strong acoustic reflection from the ice-water interface.
Regardless the mechanisms explaining the stop in DVM upon the opening of the polynya, this study clearly demonstrates that an earlier polynya opening and sea-ice breakup caused by climate change could have strong repercussions on the ecology of Arctic zooplankton. Indeed, if an earlier polynya opening and ice breakup reduce the period during which zooplankton conduct foraging DVM in spring, it also reduces their grazing activity and energy intake. This could result in higher mortality rates and reduced carbon export through the biological carbon pump. Polynya openings could further increase zooplankton mortality by increasing the predation pressure from polar cod because more light from polynya openings increase the prey detection distance of polar cod, improving its capacity to forage on zooplankton (Bouchard and Fortier, 2008; Jönsson et al., 2014; Cusa et al., 2019).
Acoustic Scattering During Polar Day
During polar day, when DVM ceased, the suspended particles and frazil ice crystals in the water column enhance acoustic scattering and therefore impact MVBS (Wegner et al., 2005; Dmitrenko et al., 2010a,2020; Petrusevich et al., 2020). Suspended particles and frazil ice crystals return the ADCP acoustic signal, producing enhanced MVBS 24 h a day. For example, Petrusevich et al. (2020) reported enhanced MVBS in Hudson Bay recorded by a 300 kHz ADCP. They attributed this signal to the suspended particles released into the water column during ice melt. Using the same type of ADCP, Dmitrenko et al. (2020) reported a high acoustic scattering attributed to the turbid water layer advected over the eastern Beaufort Sea continental slope. A 300 kHz ADCP moored at the edge of the Laptev Sea coastal polynya showed enhanced acoustical scattering from the frazil ice crystals within the surface mixed layer following the polynya opening in April–May 2008 (Dmitrenko et al., 2010a).
We suggest that at Yana, enhancement of MVBS during May 1999 can be attributed to the frazil ice crystals generated by new ice growth in the polynya following the collapse of the landfast ice edge between 9 and 12 May (Figure 6D). Until the end of May 1999, the air temperature at Yana was below the sea-water freezing temperature (Figure 4B), and formation of frazil ice can occur down to the bottom of the surface mixed water layer. The CTD profile taken below the landfast ice approximately 10 km east of Yana on 6 May 1999 revealed that the surface water layer was mixed down to ∼15.5 m depth (Figure 2B). This depth is expected to increase while approaching the polynya due to intense brine rejection and associated vertical mixing (e.g., Dmitrenko et al., 2005b; Kirillov et al., 2013). From the beginning of June through to July 1999, the noise-type MVBS at Yana in Figures 8C–E seemed to be impacted by the release of ice-rafted sediments from the melting sea ice. At Lena, the enhanced MVBS at 6.5 and 9.5 m depth in June 1999 (Figures 9C,D) was likely associated with release of sediments from the sediment-laden landfast ice. The formation of the sediment-laden sea-ice presumably occurred during fall and early winter due to suspension freezing in the coastal polynya (e.g., Ito et al., 2019; Barber et al., 2021). At Lena, the artificial reduction of sea-ice concentration in June 1999 (Figure 9A) was attributed to the formation of melt ponds on top of the landfast ice that confirms sea-ice melt occurred during June.
In contrast to MVBS in June, the enhanced MVBS at both Yana and Lena in July and August 1999 seem to be attributed to intrusions of turbid water associated with river runoff. The Lena River plume is enriched with suspended sediments (e.g., Pivovarov et al., 1999; Wegner et al., 2005). Based on observations from an oceanographic survey in May–June 1996, Pivovarov et al. (1999) revealed that the river runoff water enriched with suspended sediments was laterally advected >80 km off the Lena Delta in 1 week following spring breakup. Based on this result, we suggest that intrusions of turbid riverine water generated high MVBS at Lena and Yana in July–August 1999 (Figures 8C–G, 9C–G).
The interannual variability of MVBS during polar day also suggests the role of riverine turbid water in generating enhanced acoustic scattering. At Yana, MVBS in August 1999 exceeded that of August 1998 by ∼10 dB (Figures 8C–G). In contrast, at Lena, the MVBS pattern was opposite, with MVBS in August 1998 exceeding that in August 1999 by ∼5 dB at 6.5 m (Figure 9C) to ∼15 dB at 18.5 m (Figure 9G). This interannual variability is consistent with the interannual variability in wind forcing between these two summers (Figure 3). In summer 1998, northerly winds diverted the riverine water enriched with suspended sediments onshore, generating a positive salinity anomaly at Yana and negative salinity anomaly at Lena (Figures 2A, 3), and increasing the acoustic backscatter at Lena during August 1998 (Figures 9C–G). Conversely, in summer 1999, easterly winds caused a negative salinity anomaly at Yana due to the northward advection of riverine waters, which increased salinity at Lena (Figures 2B, 3) and enhanced acoustic backscatter at Yana in August 1998. Overall, this finding highlights the role of wind forcing in dictating the distribution of the river plume and in turn driving salinity anomalies and generating acoustic scattering over the eastern Siberian shelf (e.g., Dmitrenko et al., 2005a,2008, 2010b). In the cyclonic regime (e.g., summer 1998) the southeastward diversion of the Laptev Sea riverine water results in a negative salinity anomaly to the east of the Lena Delta and farther to the East Siberian Sea, and a positive anomaly to the north of the Lena Delta. Anticyclonic wind forcing (e.g., summer 1999) results in negative salinity anomalies northward from the Lena Delta due to freshwater advection toward the north, and a corresponding salinity increase southeastward (Dmitrenko et al., 2005a).
Conclusion and Final Remarks
Based on the year-long time series from two mooring, deployed over the eastern Laptev Sea shelf from August 1998 to August 1999, we conclude that the acoustic backscatter is impacted by DVM during the spring and fall transition periods between polar day and polar night. Overall, DVM shows a light-driven behavior with a seasonal cessation when the sun is either above or below the horizon 24 h a day. During the spring transition, the light-driven behavior of DVM ceased near the fast ice edge ∼1 month prior to its expected cessation at the start of polar day. We associate this disruption with a predator-avoidance behavior conditioned by higher polar cod abundance attracted by the polynya opening. In contrast, about 120 km shoreward from the landfast ice edge, DVM was entirely controlled by light and persisted through the spring transition until the start of polar day. Acoustic backscatter during polar day, when DVM had stopped, reflects scattering from suspended sediments within the Lena River plume. The spatial and interannual variability of this signal is suggested to be controlled by the interannual variability in atmospheric forcing that either forces the plume onshore or offshore.
Finally, given the fact that the formation of a polynya caused the cessation of DVM in the surrounding area, it is important to note that the size of the Laptev Sea polynya significantly increased at 362 km2 year–1 between 2002 and 2015 during the late freezing season from January to March (Preußer et al., 2016). Hence, one may suggest a long-term reduction of DVM during the spring transition from polar night to polar day due to greater coverage of the coastal polynya. This change may have repercussions on the ecology of Arctic zooplankton and disrupt the biological pump, which will have implications for carbon fluxes (e.g., Kelly et al., 2019).
Our analysis was limited by lack of zooplankton observations. It is logistically difficult to sample zooplankton in the seasonally ice covered and remote areas of the Siberian shelf, hence it is unclear which zooplankton species were observed to undergo DVM. Future work in the Siberian shelf could integrate either sediment traps on moorings or expand winter ice-based sampling to provide a comprehensive analysis of the zooplankton species comprising DVM.
Data Availability Statement
The original contributions presented in the study are included in the article/supplementary material, further inquiries can be directed to the corresponding author.
Author Contributions
ID and VP guided the overall research problem and developed methodology. ID, VP, CB, and MG conceptualized this research. ID, VP, AK, and NK conducted formal analysis and data curation. ID and SK performed the investigation. DBar allocated resources. ID, KK, CB, and MG wrote the original draft. ID and DBab revised and edited the original draft. ID, VP, and AK generated figures. ID and DBar supervised and administrated this project. DBar accomplished the funding acquisition. All authors contributed to the article and approved the submitted version.
Funding
Field research in the Laptev Sea was funded through the Bundesministerium für Bildung und Forschung projects “System Laptev Sea.” Funding for this work was provided by the Natural Sciences and Engineering Research Council of Canada (NSERC), Canada Excellence Research Chairs (CERC) program, and Canada Research Chairs (CRC) program. DBab was additionally supported by NSERC and Canadian Meteorological and Oceanographic Society (CMOS) and MG was supported by ArcticNet, a Networks of Centres of Excellence of Canada. KK conducted research within the framework of the state assignment of IO RAS (Theme No. 0128-2021-0007) and was partially supported by the Russian Foundation for Basic Research (Grant No. 19-04-00955) and by the Russian Science Foundation (Grant No. 19-17-00058).
Conflict of Interest
The authors declare that the research was conducted in the absence of any commercial or financial relationships that could be construed as a potential conflict of interest.
Publisher’s Note
All claims expressed in this article are solely those of the authors and do not necessarily represent those of their affiliated organizations, or those of the publisher, the editors and the reviewers. Any product that may be evaluated in this article, or claim that may be made by its manufacturer, is not guaranteed or endorsed by the publisher.
Acknowledgments
The authors thank NASA and ASF for granting access to RADARSAT-1 imagery used in this study. This work is a part of research conducted under the framework of the Arctic Science Partnership (ASP) and ArcticNet. The authors appreciate Ekaterina Abramova from the Lena Delta Nature Reserve for providing data on composition, distribution, and abundance of zooplankton in the Laptev Sea.
Footnotes
References
Abramova, E. (1999). “Composition, abundance and population structure of spring-time zooplankton in the shelf-zone of the Laptev Sea,” in Land-Ocean Systems in the Siberian Arctic: Dynamics and History, eds H. Kassens, H. A. Bauch, I. A. Dmitrenko, H. Eicken, H.-W. Hubberten, M. Melles, et al. (Berlin: Springer-Verlag), 161–168. doi: 10.1007/978-3-642-60134-7_16
Abramova, E., and Tuschling, K. (2005). A 12-year study of the seasonal and interannual dynamics of mesozooplankton in the Laptev Sea: significance of salinity regime and life cycle patterns. Glob. Planet. Change 48, 141–164. doi: 10.1016/j.gloplacha.2004.12.010
Arashkevich, E. G., Drits, A. V., Pasternak, A. F., Flint, M. V., Demidov, A. B., Amelina, A. B., et al. (2018). Distribution and feeding of herbivorous zooplankton in the Laptev Sea. Oceanology 58, 381–395. doi: 10.1134/S0001437018030013
Archibald, K., Siegel, D. A., and Doney, S. C. (2019). Modeling the impact of zooplankton diel vertical migration on the carbon export flux of the biological pump. Glob. Biogeochem. Cycles 33, 181–199. doi: 10.1029/2018GB005983
Aune, M., Raskhozheva, E., Andrade, H., Augustine, S., Bambulyak, A., Camus, L., et al. (2021). Distribution and ecology of polar cod (Boreogadus saida) in the eastern Barents Sea: a review of historical literature. Mar. Environ. Res. 166:105262. doi: 10.1016/j.marenvres.2021.105262
Barber, D. G., Harasyn, M. L., Babb, D. G., Capelle, D., McCullough, G., Dalman, L. A., et al. (2021). Sediment-laden sea ice in southern Hudson Bay: entrainment, transport and biogeochemical significance. Elem. Sci. Anth. 9:00108. doi: 10.1525/elementa.2020.00108
Barber, D. G., Hop, H., Mundy, C. J., Else, B., Dmitrenko, I. A., Tremblay, J.-E., et al. (2015). Selected physical, biological and biogeochemical implications of a rapidly changing Arctic Marginal Ice Zone. Progr. Oceanogr. 139, 122–150. doi: 10.1016/j.pocean.2015.09.003
Bauch, D., Dmitrenko, I., Wegner, C., Hölemann, J., Kirillov, S., Timokhov, L., et al. (2009). Data From: Physical Oceanography and Hydrochemistry From the Laptev Sea, Arctic Ocean. Bremerhaven: PANGAEA Data Publisher. doi: 10.1594/PANGAEA.761766
Belter, H. J., Janout, M., Hölemann, J. A., and Krumpen, T. (2020). Data from: Daily Mean Sea Ice Draft From Moored Upward-Looking Acoustic Doppler Current Profilers (ADCPs) in the Laptev Sea from 2003 to 2016. Bremerhaven: PANGAEA Data Publisher. doi: 10.1594/PANGAEA.912927
Berge, J., Cottier, F., Last, K. S., Varpe, Ø, Leu, E., Søreide, J., et al. (2009). Diel vertical migration of Arctic the zooplankton during the polar night. Biol. Lett. 5, 69–72. doi: 10.1098/rsbl.2008.0484
Berge, J., Renaud, P. E., Darnis, G., Cottier, F., Last, K., Gabrielsen, T. M., et al. (2015). In the dark: a review of ecosystem processes during the Arctic polar night. Prog. Oceanogr. 139, 258–271. doi: 10.1016/j.pocean.2015.08.005
Bianchi, D., Galbraith, E. D., Carozza, D. A., Mislan, K. A. S., and Stock, C. A. (2013). Intensification of open-ocean oxygen depletion by vertically migrating animals. Nat. Geosci. 6, 545–548. doi: 10.1038/ngeo1837
Bouchard, C., and Fortier, L. (2008). Effects of polynyas on the hatching season, early growth and survival of polar cod Boreogadus saida in the Laptev Sea. Mar. Ecol. Prog. Ser. 355, 247–256. doi: 10.3354/meps07335
Bouchard, C., and Fortier, L. (2020). The importance of Calanus glacialis for the feeding success of young polar cod: a circumpolar synthesis. Polar Biol. 43, 1095–1107. doi: 10.1007/s00300-020-02643-0
Brierley, A. S. (2014). Diel vertical migration. Curr. Biol. 24, R1074–R1076. doi: 10.1016/j.cub.2014.08.054
Buckley, T., and Whitehouse, A. (2017). Variation in the diet of Arctic Cod (Boreogadus saida) in the Pacific Arctic and Bering Sea. Environ. Biol. Fish. 100, 421–442. doi: 10.1007/s10641-016-0562-1
Cavalieri, D. J., Parkinson, C. L., Gloersen, P., and Zwally, H. J. (1996). Data from: Sea Ice Concentrations from Nimbus-7 SMMR and DMSP SSM/I-SSMIS Passive Microwave Data: Version 1. Boulder, CO: NASA National Snow and Ice Data Center Distributed Active Archive Centre, doi: 10.5067/8GQ8LZQVL0VL
Cohen, J. H., and Forward, R. B. (2009). Zooplankton diel vertical migration – A review of proximate control. Oceanogr. Mar. Biol. 47, 77–109. doi: 10.1201/9781420094220.ch2
Cohen, J. H., and Forward, R. B. (2019). “Vertical migration of aquatic animals,” in Encyclopedia of Animal Behavior, 2nd Edn, ed. J. C. Choe (Amsterdam: Elsevier), 546–552. doi: 10.1016/B978-0-12-809633-8.01257-7
Comiso, J. C., Cavalieri, D. J., Parkinson, C. L., and Gloersen, P. (1997). Passive microwave algorithms for sea ice concentration: a comparison of two techniques. Remote Sens. Environ. 60, 357–384. doi: 10.1016/S0034-4257(96)00220-9
Copernicus Climate Change Service [C3S] (2017). ERA5: Fifth Generation of ECMWF Atmospheric Reanalyses of the Global Climate. Copernicus Climate Change Service Climate Data Store (CDS). Available online at https://cds.climate.copernicus.eu/cdsapp#!/home (accessed September 21, 2021).
Cottier, F. R., Tarling, G. A., Wold, A., and Falk-Petersen, S. (2006). Unsynchronised and synchronised vertical migration of the zooplankton in a high Arctic fjord. Limnol. Oceanogr. 51, 2586–2599. doi: 10.4319/lo.2006.51.6.2586
Cusa, M., Berge, J., and Varpe, Ø (2019). Seasonal shifts in feeding patterns: individual and population realized specialization in a high Arctic fish. Ecol. Evol. 9, 11112–11121. doi: 10.1002/ece3.5615
David, C., Lange, B., Krumpen, T., Schaafsma, F., van Franeker, J. A., and Flores, H. (2016). Under-ice distribution of polar cod Boreogadus saida in the central Arctic Ocean and their association with sea-ice habitat properties. Polar Biol. 39, 981–994. doi: 10.1007/s00300-015-1774-0
Deines, K. L. (1999). “Backscatter estimation using broadband acoustic Doppler current profilers,” in Proceedings of the IEEE 6th Working Conference on Current Measurement Cat. No.99CH36331. (San Diego, CA: IEEE), 249–253.
Dmitrenko, I. A., Kirillov, S. A., and Tremblay, L. B. (2008). The long-term and interannual variability of summer fresh water storage over the eastern Siberian shelf: implication for climatic change. J. Geophys. Res. 113:C03007. doi: 10.1029/2007JC004304
Dmitrenko, I. A., Kirillov, S. A., Bloshkina, E., and Lenn, Y.-D. (2012). Tide-induced vertical mixing in the Laptev Sea coastal polynya. J. Geophys. Res. Oceans 117:C00G14. doi: 10.1029/2011JC006966
Dmitrenko, I. A., Wegner, C., Kassens, H., Kirillov, S. A., Krumpen, T., Heinemann, G., et al. (2010a). Observations of supercooling and frazil ice formation in the Laptev Sea coastal polynya. J. Geophys. Res. 115:C05015. doi: 10.1029/2009JC005798
Dmitrenko, I. A., Kirillov, S. A., Krumpen, T., Makhotin, M., Abrahamsen, P., Willmes, S., et al. (2010b). Wind-driven diversion of summer river runoff preconditions the Laptev Sea coastal polynya hydrography: evidence from summer-to-winter hydrographic records of 2007–2009. Cont. Shelf Res. 30, 1656–1664. doi: 10.1016/j.csr.2010.06.012
Dmitrenko, I. A., Kirillov, S. A., Tremblay, L. B., Bauch, D., and Willmes, S. (2009). Sea-ice production over the Laptev Sea shelf inferred from historical summer-to-winter hydrographic observations of 1960s–1990s. Geophys. Res. Lett. 36:L13605. doi: 10.1029/2009GL038775
Dmitrenko, I. A., Petrusevich, V., Darnis, G., Kirillov, S. A., Komarov, A. S., Ehn, J. K., et al. (2020). Sea-ice and water dynamics and moonlight impact the acoustic backscatter diurnal signal over the eastern Beaufort Sea continental slope. Ocean Sci. 16, 1261–1283. doi: 10.5194/os-16-1261-2020
Dmitrenko, I., Hölemann, J., Kirillov, S., Berezovskaya, S., Ivanova, D., Eicken, H., et al. (2002). “The impact of sea ice on the periodic shallow water dynamics in the Laptev Sea (Siberian Arctic),” in Proceedings of the 16th IAHR International Symposium on Ice Dunedin, New Zealand, 2nd–6th December 2002, International Association of Hydraulic Engineering and Research: Ice in the Environment, Vol. 2, eds V. A. Squire and P. J. Langhorne (Rotterdam: Balkema), 375–381.
Dmitrenko, I., Tyshko, K., Kirillov, S., Hölemann, J., Eicken, H., and Kassens, H. (2005b). Impact of flaw polynyas on the hydrography of the Laptev Sea. Glob. Planet. Change 48, 9–27. doi: 10.1016/j.gloplacha.2004.12.016
Dmitrenko, I., Kirillov, S., Eicken, H., and Markova, N. (2005a). Wind-driven summer surface hydrography of the eastern Siberian shelf. Geophys. Res. Lett. 32:L14613. doi: 10.1029/2005GL023022
Drits, A. V., Pasternak, A. F., and Flint, M. V. (2017). Distribution and grazing of dominant zooplankton species in the Ob estuary: influence of the runoff regime. Estuar. Coasts 40, 1082–1095. doi: 10.1007/s12237-016-0201-2
Ershova, E. A., Kosobokova, K. N., Banas, N. S., Ellingsen, I., Niehoff, B., Hildebrandt, N., et al. (2021). Sea ice decline drives biogeographical shifts of key Calanus species in the central Arctic Ocean. Glob. Change Biol. 27, 2128–2143. doi: 10.1111/gcb.15562
Fahl, K., Cremer, H., Erlenkeuser, H., Hanssen, H., Hölemann, J., Kassens, H., et al. (2001). Sources and pathways of organic carbon in the modern Laptev Sea (Arctic Ocean): implication from biological, geochemical and geological data. Polarforschung 69, 193–205.
Fetterer, F., Knowles, K., Meier, W. N., Savoie, M., and Windnagel, A. K. (2017). Data from: Sea Ice Index, Version 3, Data Set ID: G02135. Boulder, CO: NSIDC: National Snow and Ice Data Center. doi: 10.7265/N5K072F8
Fortier, M., Fortier, L., Hattori, H., Saito, H., and Legendre, L. (2001). Visual predators and the diel vertical migration of copepods under Arctic sea ice during the midnight sun. J. Plank. Res. 23, 1263–1278. doi: 10.1093/plankt/23.11.1263
Garnier, F., Fleury, S., Garric, G., Bouffard, J., Tsamados, M., Laforge, A., et al. (2021). Advances in altimetric snow depth estimates using bi-frequency SARAL/CryoSat-2 Ka/Ku measurements. Cryosphere Discuss. doi: 10.5194/tc-2021-79
Gradinger, R. R., and Bluhm, B. A. (2004). In-situ observations on the distribution and behavior of amphipods and Arctic cod (Boreogadus saida) under the sea ice of the high Arctic Canada Basin. Polar Biol. 27, 595–603. doi: 10.1007/s00300-004-0630-4
Grenfell, C. G., and Maykut, G. A. (1977). The optical properties of ice and snow in the Arctic Basin. J. Glaciol. 18, 445–463. doi: 10.3189/S0022143000021122
Gutjahr, O., Heinemann, G., Preußer, A., Willmes, S., and Drüe, C. (2016). Quantification of ice production in Laptev Sea polynyas and its sensitivity to thin-ice parameterizations in a regional climate model. Cryosphere 10, 2999–3019. doi: 10.5194/tc-10-2999-2016
Hays, G. C. (2003). A review of the adaptive significance and ecosystem consequences of the zooplankton diel vertical migrations. Hydrobiologia 503, 163–170. doi: 10.1023/B:HYDR.0000008476.23617.b0
Hendricks, S., Paul, S., and Rinne, E. (2018). Data from: ESA Sea Ice Climate Change Initiative (Sea_Ice_cci): Northern Hemisphere Sea Ice Thickness from the CryoSat-2 Satellite on a Monthly Grid (L3C), v2.0. Harwell: Centre for Environmental Data Analysis, doi: 10.5285/ff79d140824f42dd92b204b4f1e9e7c2
Hersbach, H., Bell, B., Berrisford, P., Hirahara, S., Horányi, A., Muñoz-Sabater, J., et al. (2020). The ERA5 global reanalysis. Q. J. R. Meteorol. Soc. 146, 1999–2049. doi: 10.1002/qj.3803
Hobbs, L., Banas, N. S., Cohen, J. H., Cottier, F. R., Berge, J., and Varpe, Ø (2021). A marine zooplankton community vertically structured by light across diel to interannual timescales. Biol. Lett. 17:20200810.
Hobbs, L., Cottier, F. R., Last, K. S., and Berge, J. (2018). Pan-Arctic diel vertical migration during the polar night. Mar. Ecol. Prog. Ser. 605, 61–72. doi: 10.3354/meps12753
Ito, M., Ohshima, K. I., Fukamachi, Y., Hirano, D., Mahoney, A. R., Jones, J., et al. (2019). Favorable conditions for suspension freezing in an Arctic Coastal Polynya. J. Geophys. Res. Oceans 124, 8701–8719. doi: 10.1029/2019JC015536
Jakobsson, M., Mayer, L. A., Bringensparr, C., Castro, C. F., Mohammad, R., Johnson, P., et al. (2020). Data from: the international bathymetric chart of the Arctic Ocean version 4.0. Sci. Data 7:176. doi: 10.1038/s41597-020-0520-9
Janout, M. A., and Lenn, Y.-D. (2014). Semidiurnal tides on the Laptev Sea shelf with implications for shear and vertical mixing. J. Phys. Oceanogr. 44, 202–219. doi: 10.1175/JPO-D-12-0240.1
Jönsson, M., Varpe, Ø, Kozłowski, T., Berge, J., and Kröger, R. H. H. (2014). Differences in lens optical plasticity in two gadoid fishes meeting in the Arctic. J. Comp. Physiol. A 200, 949–957. doi: 10.1007/s00359-014-0941-z
Kassens, H., Dmitrenko, I., Rachold, V., Thiede, J., and Timokhov, L. (1998). Russian and German scientists explore the Arctic’s Laptev Sea and its climate system. Eos Trans. Am. Geophys. Union 79, 317–323. doi: 10.1029/98EO00234
Kelly, T. B., Davison, P. C., Goericke, R., Landry, M. R., Ohman, M. D., and Stukel, M. R. (2019). The importance of mesozooplankton diel vertical migration for sustaining a mesopelagic food web. Front. Mar. Sci. 6:508. doi: 10.3389/fmars.2019.00508
Kirillov, S. A., Dmitrenko, I. A., Hölemann, J. A., Kassens, H., and Bloshkina, E. (2013). The penetrative mixing in the Laptev Sea coastal polynya pycnocline layer. Cont. Shelf Res. 63, 34–42. doi: 10.1016/j.csr.2013.04.040
Kosobokova, K. N., and Hirche, H.-J. (2001). Reproduction of Calanus glacialis in the Laptev Sea. Arctic Ocean. Polar Biol. 24, 33–43. doi: 10.1007/s003000000171
Kosobokova, K. N., Hanssen, H., Hirche, H.-J., and Knickmeier, K. (1998). Composition and distribution of zooplankton in the Laptev sea and adjacent Nansen Basin during summer, 1993. Polar Biol. 19, 63–76. doi: 10.1007/s003000050216
Krieg, J. (2021). Influence of moon and clouds on night illumination in two different spectral ranges. Sci. Rep. 11:20642. doi: 10.1038/s41598-021-98060-2
Lalande, C., Bélanger, S., and Fortier, L. (2009). Impact of a decreasing sea ice cover on the vertical export of particulate organic carbon in the northern Laptev Sea, Siberian Arctic Ocean. Geophys. Res. Lett. 36:L21604. doi: 10.1029/2009GL040570
Last, K. S., Hobbs, L., Berge, J., Brierley, A. S., and Cottier, F. (2016). Moonlight drives ocean-scale mass vertical migration of the zooplankton during the Arctic Winter. Curr. Biol. 26, 244–251. doi: 10.1016/j.cub.2015.11.038
Leise, T. L., Indic, P., Paul, M. J., and Schwartz, W. J. (2013). Wavelet meets actogram. J. Biol. Rhythms 28, 62–68. doi: 10.1177/0748730412468693
Lemon, D. D., Billenness, D., and Buermans, J. (2008). “Comparison of acoustic measurements of zooplankton populations using an Acoustic Water Column Profiler and an ADCP,” in Proceedings of the OCEANS 2008. (Quebec City, QC: IEEE Xplore). doi: 10.1109/OCEANS.2008.5152009
Lemon, D. D., Gower, J. F. R., and Clarke, M. R. (2001). “The acoustic water column profiler: a tool for long-term monitoring of zooplankton populations,” in Proceedings of the MTS/IEEE Oceans 2001. An Ocean Odyssey Conference Proceedings IEEE Cat. No.01CH37295, Vol. 3, Honolulu, HI, 1904–1909. doi: 10.1109/OCEANS.2001.968137
Lischka, S., Knickmeier, K., and Hagen, W. (2001). Mesozooplankton assemblages in the shallow Arctic Laptev Sea in summer 1993 and autumn 1995. Polar Biol. 24, 186–199. doi: 10.1007/s003000000195
Liu, Y., and Key, J. R. (2016). Assessment of arctic cloud cover anomalies in atmospheric reanalysis products using satellite data. J. Clim. 29, 6065–6083. doi: 10.1175/JCLI-D-15-0861.1
Lorke, A., Mcginnis, D. F., Spaak, P., and Wüest, A. (2004). Acoustic observations of zooplankton in lakes using a Doppler current profiler. Freshw. Biol. 49, 1280–1292. doi: 10.1111/j.1365-2427.2004.01267.x
Mullison, J. (2017). “Backscatter estimation using broadband acoustic doppler current profilers –updated,” in Proceedings of the ASCE Hydraulic Measurements & Experimental Methods Conference, Durham, NH, 9–12.
Ofek, E. O. (2014). MATLAB Package for Astronomy and Astrophysics. Astrophysics Source Code Library, Record ascl:1407.005.
Perovich, D., Meier, W., Tschudi, M., Hendricks, S., Petty, A. A., Divine, D., et al. (2020). “Sea Ice,” in NOAA Arctic Report Card 2020, eds R. L. Thoman, J. Richter-Menge, and M. L. Druckenmiller (Washington, DC: NOAA), doi: 10.25923/n170-9h57
Pertsova, N. M. (1984). Life Cycles of the Abundant Plankton Copepod Species in the White Sea. Ph.D. thesis. Moscow: Moskovskogo Gosudarstvennogo Universiteta, 189.
Petrusevich, V. Y., Dmitrenko, I. A., Niemi, A., Kirillov, S. A., Kamula, C. M., Kuzyk, Z. Z. A., et al. (2020). Impact of tidal dynamics on diel vertical migration of zooplankton in Hudson Bay. Ocean Sci. 16, 337–353. doi: 10.5194/os-16-337-2020
Petrusevich, V., Dmitrenko, I. A., Kirillov, S. A., Rysgaard, S., Falk-Petersen, S., Barber, D. G., et al. (2016). Wintertime water dynamics and moonlight disruption of the acoustic backscatter diurnal signal in an ice-covered Northeast Greenland fjord. J. Geophys. Res. Oceans 121, 4804–4818. doi: 10.1002/2016JC011703
Petryashov, V. V. (1989). “Arctic ocean mysids (Crustacea, Mysidacea): evolution, composition, and distribution,” in The Arctic Seas. Climatology, Oceanography, Geology, and Biology, ed. Y. Herman (New York, NY: Van Nostrand Reinhold Co.), 373–396. doi: 10.1007/978-1-4613-0677-1
Pivovarov, S. V., Hölemann, J. A., Kassens, H., Antonow, M., and Dmitrenko, I. (1999). “Dissolved oxygen, silicon, phosphorous and suspended matter concentrations during the spring breakup of the Lena River,” in Land-Ocean Systems in the Siberian Arctic: Dynamics and History, eds H. Kassens, H. A. Bauch, I. A. Dmitrenko, H. Eicken, H.-W. Hubberten, M. Melles, et al. (Berlin: Springer-Verlag), 251–264. doi: 10.1007/978-3-642-60134-7_23
Preußer, A., Heinemann, G., Willmes, S., and Paul, S. (2016). Circumpolar polynya regions and ice production in the Arctic: results from MODIS thermal infrared imagery from 2002/2003 to 2014/2015 with a regional focus on the Laptev Sea. Cryosphere 10, 3021–3042. doi: 10.5194/tc-10-3021-2016
Rabenstein, L., Krumpen, T., Hendricks, S., Koeberle, C., Haas, C., and Hoelemann, J. A. (2013). A combined approach of remote sensing and airborne electromagnetics to determine the volume of polynya sea ice in the Laptev Sea. Cryosphere 7, 947–959. doi: 10.5194/tc-7-947-2013
Runge, J. A., and Ingram, R. G. (1991). Under-ice feeding and diel migration by planktonic, copepods Calanus glacialis and Pseudocalanus minutus in relation to the ice algal production cycle in southeastern Hudson Bay, Canada. Mar. Biol. 108, 217–225. doi: 10.1007/BF01344336
Schweiger, A., Lindsay, R., Zhang, J., Steele, M., Stern, H., and Kwok, R. (2011). Uncertainty in modeled Arctic sea ice volume. J. Geophys. Res. 116:C00D06. doi: 10.1029/2011JC007084
Selyuzhenok, V., Krumpen, T., Mahoney, A., Janout, M., and Gerdes, R. (2015). Seasonal and interannual variability of fast ice extent in the southeastern Laptev Sea between 1999 and 2013. J. Geophys. Res. Oceans 120, 7791–7806. doi: 10.1002/2015JC011135
Stanton, T. K., Wiebe, P. H., Chu, D., Benfield, M. C., Scanlon, L., Martin, L., et al. (1994). On acoustic estimates of zooplankton biomass. ICES J. Mar. Sci. 51, 505–512. doi: 10.1006/jmsc.1994.1051
van Haren, H., and Compton, T. J. (2013). Diel vertical migration in deep sea plankton is finely tuned to latitudinal and seasonal day length. PLoS One 8:e64435. doi: 10.1371/journal.pone.0064435
Vestheim, H., Røstad, A., Klevjer, T. A., Solberg, I., and Kaartvedt, S. (2014). Vertical distribution and diel vertical migration of krill beneath snow-covered ice and in ice-free waters. J. Plankton Res. 36, 503–512. doi: 10.1093/plankt/fbt112
Wallace, M. I., Cottier, F. R., Berge, J., Tarling, G. A., Griffiths, C., and Brierley, A. S. (2010). Comparison of zooplankton vertical migration in an ice-free and a seasonally ice-covered Arctic fjord: an insight into the influence of sea ice cover on zooplankton behavior. Limnol. Oceanogr. 55, 831–845. doi: 10.4319/lo.2010.55.2.0831
Walsh, J. E., Chapman, W. L., Fetterer, F., and Stewart, S. (2019). Data from: Gridded Monthly Sea Ice Extent and Concentration, 1850 Onward, Version 2. Boulder, CO: National Snow and Ice Data Center, doi: 10.7265/jj4s-tq79
Wassmann, P., Duarte, C. M., Agustí, S., and Sejr, M. K. (2010). Footprints of climate change in the Arctic marine ecosystem. Glob. Change Biol. 17, 1235–1249. doi: 10.1111/j.1365-2486.2010.02311.x
Wegner, C., Hölemann, J. A., Dmitrenko, I., Kirillov, S., and Kassens, H. (2005). Seasonal variations in Arctic sediment dynamics – evidence from 1-year records in the Laptev Sea (Siberian Arctic). Glob. Planet. Change 48, 126–140. doi: 10.1016/j.gloplacha.2004.12.009
Willmes, S., Adams, S., Schroder, D., and Heinemann, G. (2011). Spatio-temporal variability of polynya dynamics and ice production in the Laptev Sea between the winters of 1979/80 and 2007/08. Polar Res. 30:5971. doi: 10.3402/polar.v30i0.5971
Willmes, S., Krumpen, T., Adams, S., Rabenstein, L., Haas, C., Hoelemann, J., et al. (2010). Cross-validation of polynya monitoring methods from multisensor satellite and airborne data: a case study for the Laptev Sea. Can. J. Remote Sens. 36, S196–S210. doi: 10.5589/m10-012
Yang, D., Kane, D. L., Hinzman, L., Zhang, X., Zhang, T., and Ye, H. (2002). Siberian Lena River hydrologic regime and recent change. J. Geophys. Res. 107:4694. doi: 10.1029/2002JD002542
Keywords: Laptev Sea shelf, sea-ice, coastal polynya, acoustic backscatter, zooplankton diel vertical migration (DVM)
Citation: Dmitrenko IA, Petrusevich VY, Kosobokova K, Komarov AS, Bouchard C, Geoffroy M, Koldunov NV, Babb DG, Kirillov SA and Barber DG (2021) Coastal Polynya Disrupts the Acoustic Backscatter Diurnal Signal Over the Eastern Laptev Sea Shelf. Front. Mar. Sci. 8:791096. doi: 10.3389/fmars.2021.791096
Received: 08 October 2021; Accepted: 30 November 2021;
Published: 16 December 2021.
Edited by:
Hervé Claustre, Centre National de la Recherche Scientifique (CNRS), FranceReviewed by:
Terry Whitledge, University of Alaska Fairbanks, United StatesFinlo Cottier, Scottish Association for Marine Science, United Kingdom
Copyright © 2021 Dmitrenko, Petrusevich, Kosobokova, Komarov, Bouchard, Geoffroy, Koldunov, Babb, Kirillov and Barber. This is an open-access article distributed under the terms of the Creative Commons Attribution License (CC BY). The use, distribution or reproduction in other forums is permitted, provided the original author(s) and the copyright owner(s) are credited and that the original publication in this journal is cited, in accordance with accepted academic practice. No use, distribution or reproduction is permitted which does not comply with these terms.
*Correspondence: Igor A. Dmitrenko, aWdvci5kbWl0cmVua29AdW1hbml0b2JhLmNh
†These authors share first authorship