 Jago Strong-Wright
 John R. Taylor
- 1St. John's College, University of Cambridge, Cambridge, United Kingdom
- 2Department of Applied Mathematics and Theoretical Physics, University of Cambridge, Cambridge, United Kingdom
- 3Centre for Climate Repair at Cambridge, Cambridge, United Kingdom
It has recently been proposed that macroalgae (e.g., kelp) could be grown in the open ocean as a CO2 removal strategy. Most macroalgae naturally grow in shallow coastal waters, and their ability to grow in open ocean conditions is largely untested. Here we quantify macroalgae growth potential in the North Atlantic using an established model of Saccharina latissima forced by an ocean state estimate. In the relatively clear open ocean waters, we find that growth is possible to depths of up to 50 m across most of the region, with the maximum depth-integrated growth potential between 40 and 50°N. The model exhibits a large carbon to nitrogen ratio at the southern end of the growth range. The ratio of kelp carbon to phytoplankton biomass is also relatively high in the southeastern portion of the growth range. Using a sensitivity analysis, we find that the position of the southern limit of the growth range is largely modulated by temperature tolerance on the western side of the basin in the Gulf Stream and low nitrate on the eastern side of the basin. We also find a statistically significant reduction in the kelp growth potential over the period from 2002 to 2019, reflecting the warming of the surface ocean over this period.
1. Introduction
There is an urgent need for carbon dioxide removal (CDR) strategies to be developed in order to limit the warming of the global mean surface air temperature to less than 2°C by 2100 (Lee et al., 2021). In order to meet this target, negative net CO2 emissions are required by 2050 (Rogelj et al., 2018). The biological sink of carbon in the North Atlantic removes between 4 and 18% of annual anthropogenic carbon dioxide emissions (Sanders et al., 2014; Canadell et al., 2021). There are several methods that have been explored to enhance this sink such as iron fertilization and artificial up-welling (Canadell et al., 2021).
One CDR strategy that has been proposed is the growth of benthic macroalgae on artificial substrates in the open ocean, away from their native habitat (rocky bottomed coastal waters). For example, Whiting et al. (2020) modeled kelp growth on free-floating platforms off the West Coast of the United States. Although they did not consider the influence of macroalgae on phytoplankton or the carbon cycle, they found that this strategy could yield significant macroalgal biomass at the end of a 3 month deployment. Using a coupled hydrodynamic-biogeochemical-kelp model for Saccharina latissima (S. latissima), Broch et al. (2019) found that the offshore waters were more suitable for kelp growth than the coastal waters off the coast of Norway. However, the ability of macroalgae to grow in broader open ocean conditions remains largely untested. Here, we quantify the growth potential for S. latissima in the North Atlantic ocean, using an established kelp growth model (Broch and Slagstad, 2012; Broch et al., 2013) forced with output from an ocean state estimate (E.U. Copernicus Marine Service Information, 2021a,b,c,d).
Our primary objectives are to uncover the spatial patterns associated with kelp growth in the open ocean and to quantify the carbon and nitrogen stored within the fronds at the end of a single growing season. This could help identify target regions for future field trials. It is important to note that we do not attempt to capture the influence of macroalgae on phytoplankton or other components of the biogeochemical system, and thus we do not quantify the carbon sequestration potential of this strategy. Studying these complex interactions in the open ocean would require either a coupled model consisting of hydrodynamic, biogeochemical, and macroalgae components and/or carefully coordinated field campaigns, and this is beyond the scope of the present study. Nevertheless, modeling the kelp growth potential in the open ocean is a useful first step and we hope that it leads to future work to quantify the CDR potential using fully coupled hydrodynamic-biogeochemistry-kelp models and field measurements.
Below, in section 2 we describe the configuration and forcing of the growth model for S. latissima. In section 3, we describe the geographical and vertical distribution of kelp biomass and the seasonal growth patterns and calculate the carbon:nitrogen ratio at the end of the growth period. The latter is important because nitrates that are consumed by the kelp could have been used by phytoplankton and hence uptake of nitrates by the kelp could reduce primary production in a coupled system. We also examine the sensitivity of the results to a few key parameters. Finally, we end in section 4 with a discussion of the results and the implications for future work.
2. Methods
2.1. Model
Here, we use a growth model for S. latissima (sugar kelp) first proposed by Broch and Slagstad (2012). This species was chosen because it is relatively well-studied due to its widespread use in aquaculture and it has been proposed as a candidate for offshore macroalgae farms (Broch et al., 2019; Whiting et al., 2020; Running Tide, 2021). Although other models for S. latissima have been developed (e.g., Venolia et al., 2020), we use the model first described in Broch and Slagstad (2012) because it has been tested in North Atlantic conditions (Broch and Slagstad, 2012; Broch et al., 2013, 2019; Molen et al., 2018) and its inputs (temperature, nitrate concentration, and irradiance) are readily available from ocean state estimates and reanalysis products.
The model for the growth of an individual kelp frond consists of three coupled ordinary differential equations for the three primary state variables; frond area (A), nitrogen reserves (N), and carbon reserves (C):
The model is forced by the ambient water temperature, T, nitrate concentration, X, irradiance, I, and water velocity, U. The constants Nstruct and Cstruct denote the amount of nitrogen and carbon per weight of structural mass. The area increases via the growth rate, μ, at the expense of the nitrogen and carbon reserves. Frond erosion is denoted by ν. The nitrogen reserves increase though nitrate uptake, denoted by J. The photosynthetic rate, P, provides a source of carbon reserves, and E and R are the exudation and respiration rates, respectively.
In setting the function forms and parameters in Equation (3), we followed the implementation described in Broch and Slagstad (2012) with the modifications later proposed in Broch et al. (2013). However, we used a more accurate and efficient fourth order Runge-Kutta scheme instead of the explicit Euler scheme used in Broch and Slagstad (2012). We validated the model by repeating the experiments reported in Broch and Slagstad (2012). Our implementation of the model has been made publicly available (Strong-Wright, 2021) in the Julia programming language. The reader is referred to the description of the code and Broch and Slagstad (2012); Broch et al. (2013) for further details of the implementation.
Each integration of Equation (3) was forced using a timeseries of temperature and nitrate concentrations sampled at a fixed location and depth from the Mercator Ocean physics and biogeochemical analysis and reanalysis (E.U. Copernicus Marine Service Information, 2021a,b,c,d). The photosynthetically available radiation (PAR) at the ocean surface was obtained from NASA's Joint Polar Satellite system and Moderate-resolution Imaging Spectroradiometer (NASA Goddard Space Flight Center, Ocean Ecology Laboratory, Ocean Biology Processing Group, 2021a,b). The depth dependence of the PAR was calculated using an attenuation coefficient derived using the method described by Morel (1988) and modified by Morel and Maritorena (2001) (the same method used in the biogeochemical model; Aumont et al., 2015) and the chlorophyll concentration from the Mercator Ocean biogeochemical analysis. The temperature was available at 1/12° resolution but this was sub-sampled at the 1/4° resolution of the biogeochemical model to force the kelp growth model. The PAR was available at 9 km resolution and was also subsampled at 1/4° resolution. Missing PAR values due to cloud cover or low light levels were filled in using linear interpolation.
The initial conditions for the state variables match the values used in Broch and Slagstad (2012), specifically A = 0.1dm2, N = 0.022gN(g sw)−1, and C = 0.3gC(g sw)−1. The sensitivity of the results to these initial conditions was evaluated by varying the initial conditions with constant forcing conditions (see Supplementary Material). This analysis revealed that for sufficiently small initial area, the model results are not very sensitive to the initial carbon and nitrogen reserves. Further, the analysis showed that for a large range of initial areas, all runs converged to the same equilibrium state with constant forcing. These results are shown in Supplementary Figures 1, 2 of the Supplementary Material.
After validation and testing, the kelp growth model was applied to a static grid over the area between 0 and 80°W, and 35 and 65°N. The depth range 0 to 75 m was used since we found no significant growth below this depth range. In the baseline runs a 1/4° grid with 2 m depth resolution was used, and for parameter variation analysis a 1° grid with the same depth resolution was used.
For the cases shown in the main text we run the model from December 1st to January 4th two calendar years later (i.e., for a period of 400 days). This time frame was chosen for several reasons: start dates around this time yield very similar results (variation in the temporal change of conditions over a small range is captured in the ensemble described below), and by the end date the maximum total carbon of the run has been surpassed. Supplementary Figure 4 shows the total carbon for various start dates. Unless otherwise noted, the model is run from the end of 2019 (01/12/2019) until the start of 2021 (04/01/2021).
We do not consider self-shading for the kelp or changes in the ambient nitrate concentration that would be caused by the kelp. There is a clear need for future work to consider a fully coupled biogeochemical model in order to assess the ecosystem impacts of offshore kelp growth and the associated carbon sequestration potential.
3. Results
Figures 1A,B shows the total carbon and total nitrogen from the kelp growth model, where each quantity is averaged in depth between 0 and 75 m and shown on the day integrated kelp carbon is maximum. The contour line in all panels shows the location where the average carbon content is equal to 5gC/frond. The kelp grows well across most of the North Atlantic with a sharp decline south of about 40°N. The maximum carbon content generally occurs near the southern end of the growth range, between 40 and 45°N with notably high values in the southeast corner of the growth range. The nitrogen content shows a notably distinct pattern compared to carbon with larger values at higher latitudes.
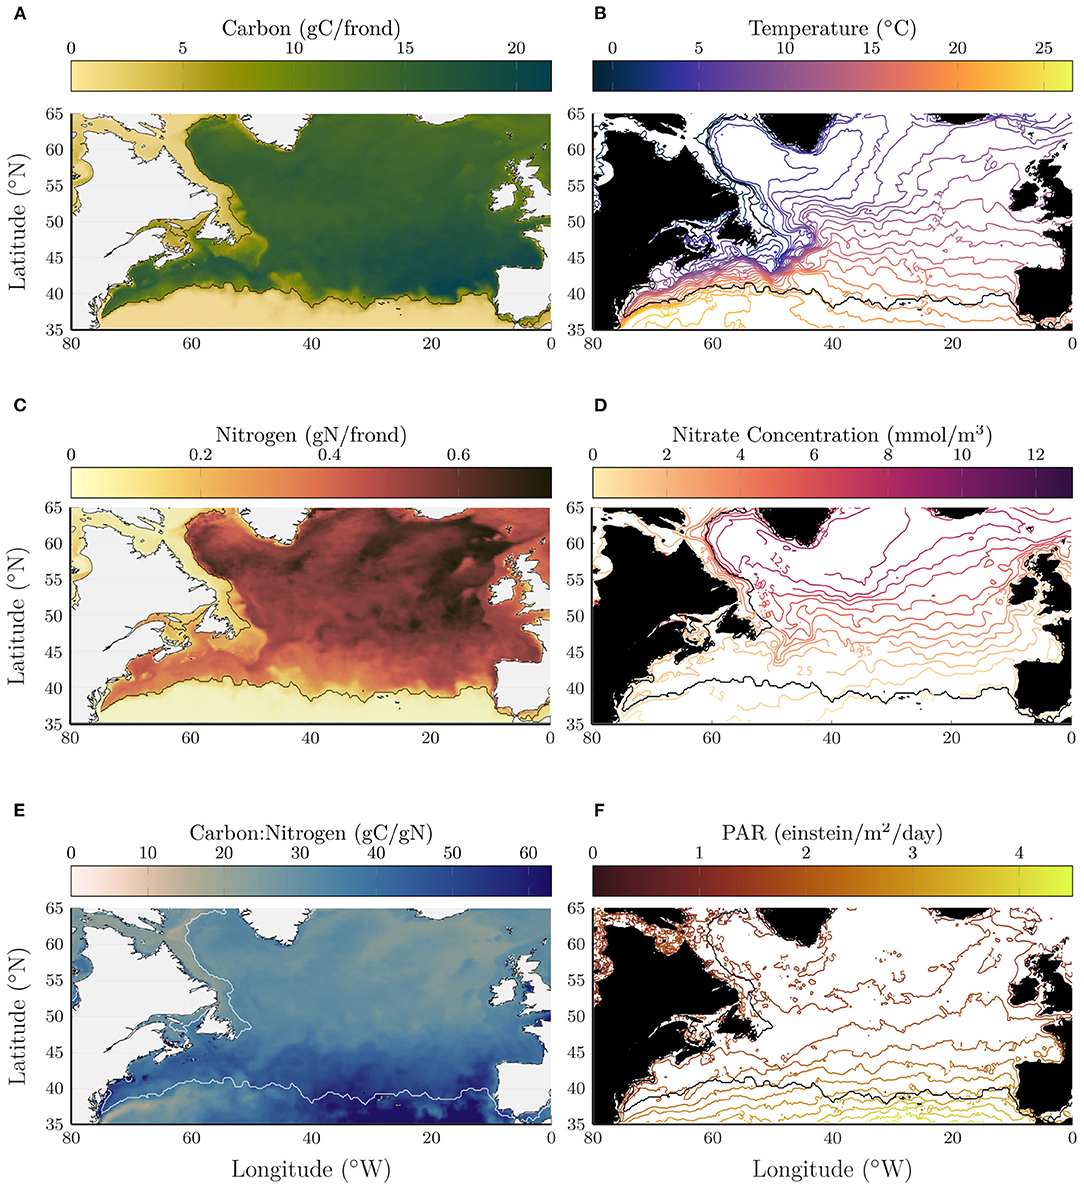
Figure 1. Depth-averaged carbon (A), nitrogen (B), and carbon:nitrogen ratio (C) on year day 344 in early November when the total carbon content is maximum in the kelp model. Temperature (D) and nitrate concentration (E) and photosynthetically available radiation (F) that were used as input to the kelp growth model, here shown averaged in time (400 days) and depth (0–75 m) over the kelp deployment. For reference the 5gC/frond contour is shown in black (white in C), indicating the limits of the region with significant kelp growth.
The carbon:nitrogen (C:N) ratio (Figure 1C) varies significantly across the region and reaches high values, in excess of 50 gC/gN near the southern end of the growth range (indicated in a white contour line). Note that the ratio is not meaningful south of the growth range where the carbon and nitrogen contents are small. The modeled C:N ratio is generally consistent with measurements made for kelp growing in coastal waters [22 to 32; Fossberg et al. (2018), 15 to 42; Nielsen et al. (2014), 23 to 131; Nielsen et al. (2016)].
To visualize the conditions that drive these patterns, Figures 1D–F shows ocean temperature, nitrate concentration, and PAR, averaged between 0 and 75 m depth and in time over the full kelp deployment. For reference, the southern end of the growth range is shown in a contour line as in Figures 1A–C. In the kelp growth model, the maximum growth rates occur for temperatures between 10 and 15°C. Interestingly, the largest carbon content occurs in locations that are on average warmer than 15°C. As will be discussed below, the kelp growth exhibits non-trivial depth and seasonal variations which likely explain the lack of a direct link between mean temperature and carbon content. This illustrates the utility of a dynamic kelp model that is capable of responding to time-varying local conditions.
On the western side of the North Atlantic basin, the 5gC/frond contour closely tracks the average temperature contours between 19 and 21°C, following the mean path of the Gulf Stream. On the eastern side of the basin, the 5gC/frond contour appears to more closely follow an average nitrate concentration of 0.5 mmol/m3. This, together with the observation that the C:N ratio is higher on the eastern side of the basin, suggests that kelp on the southwestern end of the growth range is primarily limited by temperature, while growth on the southeastern end of the growth range is primarily limited by nitrate. On the western side of the Labrador Sea, the 5gC/frond contour closely follows the 2°C average temperature contour. West of this contour, kelp growth is inhibited in the cold waters carried south by the Labrador Current.
Figures 2A,B shows the total carbon and nitrogen content per frond, averaged in depth and longitude, and plotted as a function of latitude and time, and Figure 2C shows the ratio of these quantities. The nitrogen content increases between April and June with the southern latitudes increasing earlier in the year. The carbon content rapidly increases in April but then plateaus before increasing again from June-August. The increase in carbon in the summer months draws down the nitrogen reserves that had been built up earlier, leading to an increase in the C:N ratio, particularly in the southern region where the ambient nitrate concentration is low and the kelp deplete their nitrogen reserves.
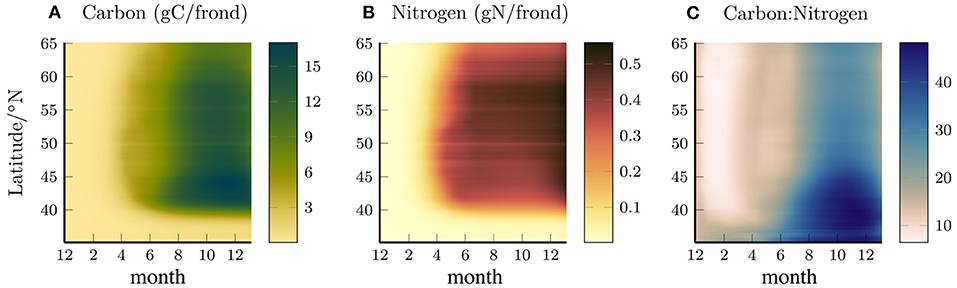
Figure 2. Longitude (0–80°W) and depth averaged (0–65 m) Carbon (A), Nitrogen (B), and carbon:nitrogen ratio per frond (gC/gN), as a function of time and latitude (C).
The vertical distribution of kelp also changes with latitude. The solid black curves in Figure 3A show vertical profiles of the growth rate (measured in terms of carbon accumulation) averaged over all longitudes for two latitudes. Solid gray curves show the sensitivity to the photosynthetic efficiency which will be discussed below. For comparison, the dotted curves show the net primary production per volume (NPPV) for phytoplankton at the same locations. At 41.5N, both curves exhibit a distinct subsurface maximum which is characteristic of nutrient limitation (e.g., Yang et al., 2021), but the peak in phytoplankton NPPV is significantly deeper than the peak in the kelp growth rate, despite the fact that the kelp and phytoplankton are exposed to the same nitrate and PAR profiles. Increasing the photosynthetic efficiency deepens the subsurface maximum for kelp (lower gray curve) which suggests that differences in the response to low light conditions might explain the different depth of the subsurface maximum for phytoplankton and kelp. It should also be noted that phytoplankton are subject to advection and diffusion while kelp are not in our model.
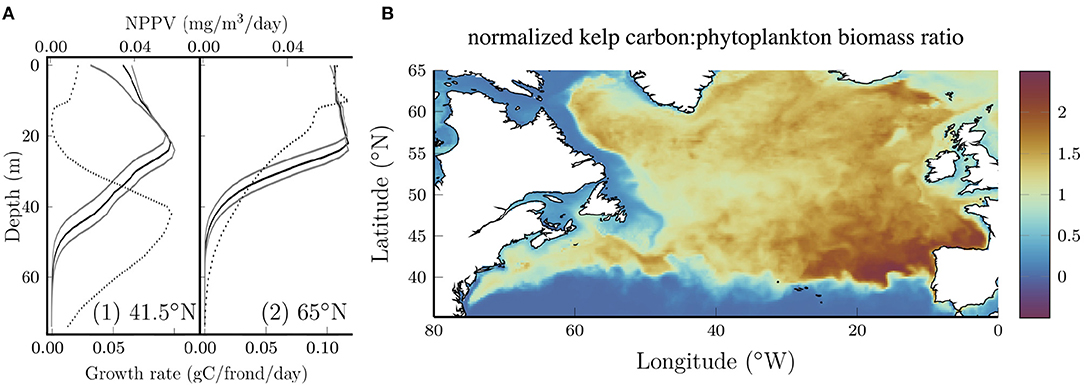
Figure 3. (A) Longitude average (0–80°W) kelp growth rate (solid) at two representative latitudes at the end of July. The depth of maximum growth rate is proportional to the photosynthetic efficiency as shown by the gray boundaries where the photosynthetic efficiency is varied by ±25%. Dotted curves show the longitude average of the net primary production per unit volume (NPPV) for phytoplankton at the same locations. (B) Ratio of the normalized kelp carbon content to the phytoplankton biomass. Each quantity is normalized by the area average such that the ratio is unitless and if the kelp carbon and phytoplankton biomass were uniformly distributed the ratio would be 1.
At 65°N (Figure 3A, right panel), the subsurface maximum for kelp and phytoplankton is less distinct and the curves are nearly constant at shallow depths. Interestingly, at this latitude the kelp growth rate remains high to a lower depth compared to the phytoplankton primary production. The reasons for this aren't immediately clear, but we speculate that this might be due to the fact that kelp in our model aren't subject to deep vertical mixing that limits phytoplankton growth at high latitudes, particularly in the winter (Williams and Follows, 2011).
Although our kelp growth model is not fully coupled with the biogeochemical model, it is of interest to compare the geographical distribution of kelp and phytoplankton growth. Figure 3B shows the ratio of normalized kelp carbon content and phytoplankton biomass. Each quantity has been normalized by the area average such that if the distribution of kelp and phytoplankton were uniform, the ratio would be 1. Interestingly, kelp grows comparatively better in the open ocean compared to the coastal waters that form their natural habitat. This can be explained by strong light attenuation in coastal waters. Together with the results shown above, this demonstrates significant growth potential for kelp in the open ocean. Within the open ocean the ratio is maximum in the southeastern region where the nitrate concentrations are relatively low (see Figure 1B) and highly seasonally dependent. The ability of kelp to store nitrogen in the spring and use these reserves for growth later in the year (Sjotun, 1993; Nielsen et al., 2014) (see Figure 2) confers an advantage over phytoplankton in regions where the nitrate concentration becomes low and is seasonally variable.
3.1. Sensitivity
The results above were produced with a kelp growth model with the parameters reported in Broch and Slagstad (2012) and Broch et al. (2013). We performed a sensitivity analysis to quantify the dependence on several key parameters and the initial conditions. Estimates of the photosynthetic rates for S. latissima vary considerably (Luning, 1979; Bartsch et al., 2008; Broch and Slagstad, 2012; Iñiguez et al., 2016; Olischläger et al., 2017). To explore the sensitivity of the results to the photosynthetic rate, we varied the photosynthetic efficiency, α, by ±25% about its baseline value. Varying α changed the depth average carbon content at all locations, primarily by changing the depth range over which kelp can grow. The gray curves in Figure 3A show this effect.
Estimates of the maximum temperature for S. latissima span a significant range. For example, it has been reported that there is a risk of death with no subsequent continuation of growth in water with temperatures as low as 17°C (Gerard and Du Bois, 1988) and that consistent growth could be possible up to 22°C (Bolton and Lüning, 1982). Some amount of this variability will be due to different ecotypes (Gerard and Du Bois, 1988), and some likely reflects different methods or inherent measurement uncertainties. In the Broch and Slagstad (2012) model the growth rate includes a term that is a piecewise linear function of temperature such that the growth rate is zero for temperatures warmer than an upper limit, Th. To examine the sensitivity of the results to the maximum temperature, we varied Th by ±2°C about the baseline value of C. Varying Th shifted the position of the southern boundary of the kelp growth range (i.e., the southern contour shown in Figure 1). When Th increased, the growth boundary shifted to the south, most prominently on the western side of the basin where temperature is the main limiting factor. When Th was reduced the growth boundary shifted to the north at all longitudes. It will be important to refine the estimates of the optimal and maximum temperatures of S. latissima if the region just north of the southern growth boundary, with large carbon content and large C:N ratio, is to be targeted for offshore kelp growth. It will also be necessary to refine estimates for the specific ecotypes suited to the region.
In addition to the model parameters, the kelp growth potential depends on the environmental conditions in a given year. To explore this dependence and the interannual variability, the model was run with data from 2002 to 2017 (i.e., runs started on 01/12/2002-2017 and ended 04/01/2004-2019). To sample the variability associated with all of these combined effects, a random ensemble of 300 runs was constructed where the photosynthetic efficiency and maximum temperature tolerance were normally distributed with standard deviations half the range given above, the year was uniformly distributed. An Analysis of Variance (ANOVA) was also performed on the ensemble and the full results of this analysis are reported in Supplementary Table 1. A regression analysis indicates that total kelp carbon growth and the phytosynthetic efficiency are positively correlated with the maximum temperature tolerance.
Figure 4 shows the maximum total carbon for each run in the ensemble as a function of starting year. The total carbon is normalized based on a density of 1 vertical line of kelp per km2, with 100 fronds per meter in the vertical direction. Since the kelp is not coupled with the biogeochemical model, the results can be scaled to other densities with the important caveat that at high densities the kelp could significantly influence the biogeochemical system (e.g., by modifying the light levels or depleting nitrate concentrations), thereby changing the results.
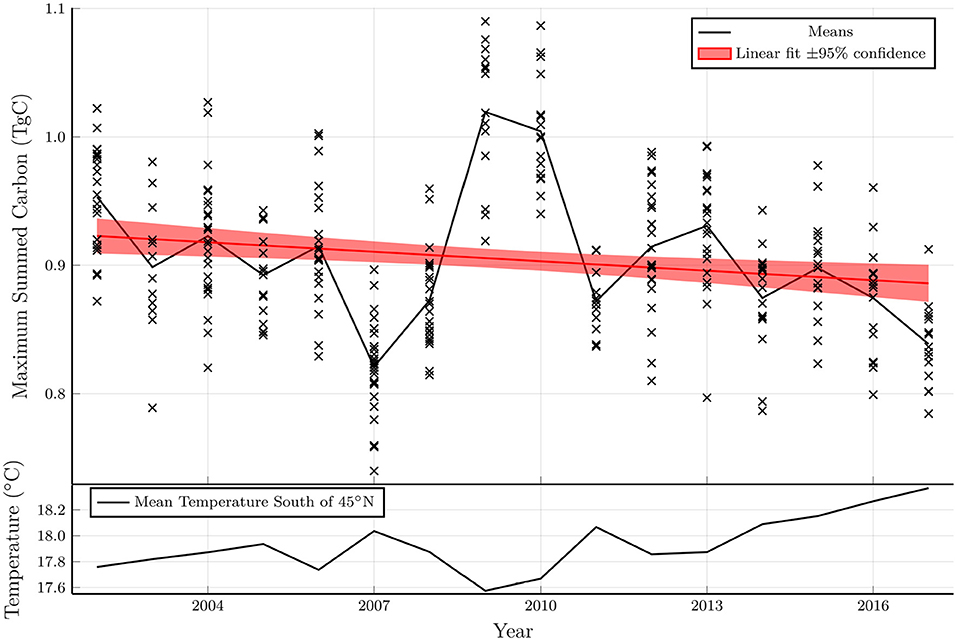
Figure 4. Top: Maximum total carbon of each model run from an ensemble with varying parameters plotted as a function of the model starting year. A linear fit to the model ensemble and a shaded region indicating the 95% confidence interval of the fit coefficients indicates a statistically significant downward trend. Bottom: Mean temperature averaged from 0 to 75 m in depth, 0–80°W in longitude and 35–45°N in latitude.
The total carbon exhibits a statistically significant negative trend over the period considered (2002–2019), as shown in a linear fit in the top panel of Figure 4. The interannual variability and the linear trend in the total carbon are inversely related to the mean temperature between 35 and 45°N (bottom panel of Figure 4). Indeed, a t-test demonstrates a strong negative correlation between these quantities (p < 10−29). In years when the temperature is anomalously high, the area that is viable for kelp growth shrinks leading to a reduction in the total carbon. As discussed below, the reduction in growth potential with increasing temperatures has important implications in the presence of climate change.
4. Discussion
Here, we used an existing model for S. latissima forced with reanalysis data and found that ocean conditions are favorable for kelp growth across most of the North Atlantic in a region bounded by extreme temperatures and low nitrate levels. A sensitivity study indicated that the geographical range that is favorable for growth depends on parameters in the kelp growth model and annually-varying ocean temperatures. Another notable result is the significant variability in the kelp carbon:nitrogen (C:N) ratio, with high values in regions where nitrate levels are low in the summer.
On the western side of the North Atlantic basin, the boundary of the growth region appears to be controlled by temperature constraints on kelp growth. Although the kelp growth model is forced with fields that vary in time and space, the southern growth boundary on the western side of the basin closely follows the 19–20°C annual and depth-averaged temperature contour. This is close to the maximum temperature for kelp growth in the model which is 19°C. Conversely, in the Labrador Sea the northern growth boundary closely follows the 2°C contour and the path of the Labrador Current. This provides a useful way to estimate the growth range, although as noted above and discussed in the Supplementary Material, the bounding temperatures are sensitive to the model parameters. The upper temperature limit is particularly uncertain with various estimates in the literature (e.g., Bolton and Lüning, 1982; Gerard and Du Bois, 1988) and this significantly influences the size of the growth region.
On the eastern side of the basin, the growth boundary follows contours of the mean nitrate concentration (between 0.2 and 0.5 mmol/m3), implying nitrate limitation in this area. This is consistent with observed minimum nitrate concentration limits of S. latissima with a significant drop in growth rate below 0.4 mmol/m3 (Jevne et al., 2020). Our results are consistent with the surveys reported in van Den Hoek (1982) and Breeman (1988) who discussed the role of temperature in controlling the growth range of various species of seaweed in coastal waters. However, while these studies considered only temperature control on the distribution, we find that low nitrate concentrations dictate the southern growth boundary in the eastern half of the North Atlantic basin.
In the southeastern part of the growth range (between the Azores and the Bay of Biscay), the modeled kelp C:N ratio at the end of the growing season is very high and kelp grow better relative to their average growth compared to phytoplankton. In these waters with low and seasonally variable nitrate concentration, the ability of kelp to store nitrogen (Sjotun, 1993; Nielsen et al., 2014) appears to be very important. The kelp nitrogen reserves increase in the spring when nitrate concentrations are relatively high, and the nitrogen reserve is then used to fuel growth in later months.
The model indicates kelp growth to depths of about 50 m in offshore conditions with a mean maximum growth rate at a depth just below 20 m. For depths shallower than 20 m, the mean growth rate is largely independent of photosynthetic efficiency, implying that the growth is not light limited. There are instances in very clear water where S. latissima has been observed at similar depths. For example, Krause-Jensen et al. (2019) observed kelp growing deeper than 61 m near the west coast of Greenland. However, this is significantly different to most coastal observations with a median maximum depth of 17.7 m (Krause-Jensen et al., 2019), where light attenuation is much stronger. Due to differences in water clarity, the e-folding depth for light admittance in our model PAR profiles is typically twice as large in the open ocean compared to coastal sites (see Supplementary Figure 3 for an illustration of this).
We tested the sensitivity of the results to key parameters and environmental conditions using an ensemble of 300 model runs. A key takeaway from the ensemble was the strong negative correlation between average temperature near the southern boundary and the total kelp carbon. This raises the possibility that in the future the viable area for kelp growth will be reduced as the North Atlantic warms (Krumhansl et al., 2016; Kwiatkowski et al., 2020). In the cold temperature-limited regions the growth range could expand northward as sea temperature increases (Khan et al., 2018). As sea ice recedes, the viable area might be extended to the north (Krause-Jensen et al., 2019). Another possible impact of the changing climate is the projected reduction in nitrate concentration, which would further decrease the viable area (Kwiatkowski et al., 2020).
The model exhibits significant geographical variability in the kelp C:N ratio across the North Atlantic. The range in the modeled C:N mass ratio is generally consistent with coastal observations of S. latissima (e.g., 22 to 32, 15 to 42, 23 to 131 Nielsen et al., 2014, 2016; Fossberg et al., 2018). The high modeled C:N ratio in the southeastern portion of the growth range can be explained by favorable light and temperature levels but low nitrate levels in these waters. The average molar ratio for kelp from our model is 31.1±0.5 which is significantly higher than the canonical Redfield ratio of 6.6 (Redfield, 1934). This suggests that kelp could represent a nitrogen-efficient sink of carbon.
There are several important caveats to this study that are worth noting. First, the kelp model assumes that nitrate is the only limiting nutrient. S. latissima is known to uptake ammonium (Ahn et al., 1998) and other nutrients such as phosphorus, iron, or other trace metals could limit kelp growth, particularly in the open ocean (Broch et al., 2019; Lubsch and Timmermans, 2019; Venolia et al., 2020). Offshore conditions could also expose the kelp to enhanced erosion due to strong wind and wave-generated currents. However, as noted by Broch and Slagstad (2012), there is little available information about the influence of water movement on frond erosion and this is not explicitly included in the model. Future work based on laboratory experiments or field trials could provide valuable information on these additional processes.
Here, our objective was to estimate the growth potential of S. latissima in the North Atlantic. We have not attempted to quantify possible enhancement in carbon sequestration rates or changes in the air/sea CO2 flux. To do so would require a coupled physics/biogeochemistry/kelp model including seawater chemistry and a representation of intentional or natural sinking of the kelp biomass, and/or an orchestrated field campaign. Efforts to develop fully coupled models of this system and measure the biogeochemical response to kelp growing in the open ocean are needed to evaluate the strategy of growing kelp for the purpose of removing excess carbon dioxide from the ocean and atmosphere.
Bach et al. (2021) recently discussed the CO2 removal (CDR) associated with Sargassum in the subtropical North Atlantic as an analogue of ocean afforestation using macroalgae. They identified a number of factors that could reduce the climate impact of this strategy. For example, they estimated that an increase in albedo associated with Sargassum could more than offset the reduction in radiative forcing associated with CO2 removal. This effect could be minimized by growing macroalgae at depth in the open ocean. Bach et al. (2021) also note that seaweed can be colonized by calcifiers which release particulate inorganic carbon and release CO2, thereby offsetting a fraction of the CO2 uptake associated with macroalgal growth which could be a significant factor within dense offshore kelp farms. As highlighted in Bach et al. (2021), the CDR potential of macroalgae is highly uncertain, and further work is urgently needed.
Data Availability Statement
The datasets presented in this study can be found in online repositories. The names of the repository/repositories and accession number(s) can be found in the article/Supplementary Material.
Author Contributions
JT conceived and supervised the project. JS-W wrote the model code, ran the simulations, and produced the figures. JS-W and JT wrote the paper. All authors contributed to the article and approved the submitted version.
Funding
JS-W was funded through the Undergraduate Summer Research Placement scheme from St. John's College, Cambridge.
Conflict of Interest
The authors declare that the research was conducted in the absence of any commercial or financial relationships that could be construed as a potential conflict of interest.
Publisher's Note
All claims expressed in this article are solely those of the authors and do not necessarily represent those of their affiliated organizations, or those of the publisher, the editors and the reviewers. Any product that may be evaluated in this article, or claim that may be made by its manufacturer, is not guaranteed or endorsed by the publisher.
Acknowledgments
The authors are grateful to the Centre for Climate Repair at Cambridge for stimulating conversations and encouraging this work. The authors also thank the team at Running Tide, Marty Odlin, Max Chalfin, Margaux Filippi, Olivia Alcabes, and Raj Saha, for helpful discussions and comments. This study has been conducted using data from E.U. Copernicus Marine Service Information, and NASA's Joint Polar Satellite System and Moderate-resolution Imaging Spectroradiometer.
Supplementary Material
The Supplementary Material for this article can be found online at: https://www.frontiersin.org/articles/10.3389/fmars.2021.793977/full#supplementary-material
References
Ahn, O., Petrell, R. J., and Harrison, P. J. (1998). Ammonium and nitrate uptake by Laminaria saccharina and nereocystis luetkeana originating from a Salmon sea cage farm. J. Appl. Phycol. 10, 333–340. doi: 10.1023/A:1008092521651
Aumont, O., Ethé, C., Tagliabue, A., Bopp, L., and Gehlen, M. (2015). Pisces-v2: an ocean biogeochemical model for carbon and ecosystem studies. Geosci. Model Dev. 8, 2465–2513. doi: 10.5194/gmd-8-2465-2015
Bach, L. T., Tamsitt, V., Gower, J., Hurd, C. L., Raven, J. A., and Boyd, P. W. (2021). Testing the climate intervention potential of ocean afforestation using the great Atlantic Sargassum belt. Nat. Commun. 12, 1–10. doi: 10.1038/s41467-021-22837-2
Bartsch, I., Wiencke, C., Bischof, K., Buchholz, C. M., Buck, B. H., Eggert, A., et al. (2008). The genus Laminaria sensu lato: recent insights and developments. Eur. J. Phycol. 43, 1–86. doi: 10.1080/09670260701711376
Bolton, J. J., and Lüning, K. (1982). Optimal growth and maximal survival temperatures of Atlantic Laminaria species (phaeophyta) in culture. Mar. Biol. 66, 89–94. doi: 10.1007/BF00397259
Breeman, A. M. (1988). Relative importance of temperature and other factors in determining geographic boundaries of seaweeds: experimental and phenological evidence. Helgoländer Meeresuntersuchungen 42, 199–241. doi: 10.1007/BF02366043
Broch, O. J., Alver, M. O., Bekkby, T., Gundersen, H., Forbord, S., Handå, A., et al. (2019). The kelp cultivation potential in coastal and offshore regions of Norway. Front. Mar. Sci. 5:529. doi: 10.3389/fmars.2018.00529
Broch, O. J., Ellingsen, I., Forbord, S., Wang, X., Volent, Z., Alver, M., et al. (2013). Modelling the cultivation and bioremediation potential of the kelp Saccharina latissima in close proximity to an exposed Salmon farm in Norway. Aquacult. Environ. Interact. 4, 187–206. doi: 10.3354/aei00080
Broch, O. J., and Slagstad, D. (2012). Modelling seasonal growth and composition of the kelp Saccharina latissima. J. Appl. Phycol. 24, 759–776. doi: 10.1007/s10811-011-9695-y
Canadell, J., Monteiro, P., Costa, M., Cotrim da Cunha, L., Cox, P., Eliseev, A., et al. (2021). Global carbon and other biogeochemical cycles and feedbacks, in Climate Change 2021: The Physical Science Basis. Contribution of Working Group I to the Sixth Assessment Report of the Intergovernmental Panel on Climate Change, eds Masson-Delmotte, V., Zhai, P., Pirani, A., Connors, S.L., Pean, C., Berger, S., Caud, N., Chen, Y., Goldfarb, L. , Gomis, M. I., Huang, M., Leitzell, K., Lonnoy, E., Matthews, J. B. R., Maycock, T. K., Waterfield, T., Yelekai, O., Yu, R., and Zhou, B., .
E.U. Copernicus Marine Service Information (2021a). Global Ocean 1/12A Physics Analysis and Forecast Updated Daily. Available online at: https://resources.marine.copernicus.eu/product-detail/GLOBAL_ANALYSIS_FORECAST_PHY_001_024
E.U. Copernicus Marine Service Information (2021b). Global Ocean Biogeochemistry Analysis and Forecast. Available online at: https://resources.marine.copernicus.eu/product-detail/GLOBAL_ANALYSIS_FORECAST_BIO_001_028
E.U. Copernicus Marine Service Information (2021c). Global Ocean Biogeochemistry Hindcast. Available online at: https://resources.marine.copernicus.eu/product-detail/GLOBAL_REANALYSIS_BIO_001_029
E.U. Copernicus Marine Service Information (2021d). Global Ocean Ensemble Physics Reanalysis. Available online at: https://resources.marine.copernicus.eu/product-detail/GLOBAL_REANALYSIS_PHY_001_031/
Fossberg, J., Forbord, S., Broch, O. J., Malzahn, A. M., Jansen, H., Hand, A., et al. (2018). The potential for upscaling kelp (Saccharina latissima) cultivation in salmon-driven integrated multi-trophic aquaculture (IMTA). Front. Mar. Sci. 5:418. doi: 10.3389/fmars.2018.00418
Gerard, V. A., and Du Bois, K. R. (1988). Temperature ecotypes near the southern boundary of the kelp Laminaria saccharina. Mar. Biol. 97, 575–580. doi: 10.1007/BF00391054
Iñiguez, C., Carmona, R., Lorenzo, M. R., Niell, F. X., Wiencke, C., and Gordillo, F. J. L. (2016). Increased temperature, rather than elevated Co2, modulates the carbon assimilation of the arctic kelps Saccharina latissima and laminaria solidungula. Mar. Biol. 163:248. doi: 10.1007/s00227-016-3024-6
Jevne, L. S., Forbord, S., and Olsen, Y. (2020). The effect of nutrient availability and light conditions on the growth and intracellular nitrogen components of land-based cultivated Saccharina latissima (phaeophyta). Front. Mar. Sci. 7:914. doi: 10.3389/fmars.2020.557460
Khan, A. H., Levac, E., Van Guelphen, L., Pohle, G., and Chmura, G. L. (2018). The effect of global climate change on the future distribution of economically important macroalgae (seaweeds) in the Northwest Atlantic. Facets 3, 275–286. doi: 10.1139/facets-2017-0091
Krause-Jensen, D., Sejr, M. K., Bruhn, A., Rasmussen, M. B., Christensen, P. B., Hansen, J. L. S., et al. (2019). Deep penetration of kelps offshore along the west coast of Greenland. Front. Mar. Sci. 6:375. doi: 10.3389/fmars.2019.00375
Krumhansl, K. A., Okamoto, D. K., Rassweiler, A., Novak, M., Bolton, J. J., Cavanaugh, K. C., et al. (2016). Global patterns of kelp forest change over the past half-century. Proc. Natl. Acad. Sci. U.S.A. 113, 13785–13790. doi: 10.1073/pnas.1606102113
Kwiatkowski, L., Torres, O., Bopp, L., Aumont, O., Chamberlain, M., Christian, J. R., et al. (2020). Twenty-first century ocean warming, acidification, deoxygenation, and upper-ocean nutrient and primary production decline from cmip6 model projections. Biogeosciences 17, 3439–3470. doi: 10.5194/bg-17-3439-2020
Lee, J.-Y., Marotzke, J., Bala, G., Cao, L., Corti, S., Dunne, J., et al. (2021). Future global climate: scenario-based projections and near-term information, in Climate Change 2021: The Physical Science Basis. Contribution of Working Group I to the Sixth Assessment Report of the Intergovernmental Panel on Climate Change, eds Masson-Delmotte, V., Zhai, P, Pirani, A., Connors, S.L., Pean, C., Berger, S., Caud, N., Chen, Y., Goldfarb, L., Gomis, M. I., Huang, M., Leitzell, K., Lonnoy, E., Matthews, J. B. R., Maycock, T. K., Waterfield, T., Yelekai, O., Yu, R., and Zhou., B.,
Lubsch, A., and Timmermans, K. R. (2019). Uptake kinetics and storage capacity of dissolved inorganic phosphorus and corresponding dissolved inorganic nitrate uptake in Saccharina latissima and Laminaria digitata (phaeophyceae). J. Phycol. 55, 637–650. doi: 10.1111/jpy.12844
Luning, K. (1979). Growth strategies of three laminaria species (phaeophyceae) inhabiting different depth zones in the sublittoral region of Helgoland (North Sea). Mar. Ecol. Prog. Ser. 1, 195–207. doi: 10.3354/meps001195
Molen, J., Ruardij, P., Mooney, K., Kerrison, P., O'Connor, N. E., Gorman, E., et al. (2018). Modelling potential production of macroalgae farms in UK and Dutch coastal waters. Biogeosciences 15, 1123–1147. doi: 10.5194/bg-15-1123-2018
Morel, A. (1988). Optical modeling of the upper ocean in relation to its biogenous matter content (case i waters). J. Geophys. Res. Oceans 93, 10749–10768. doi: 10.1029/JC093iC09p10749
Morel, A., and Maritorena, S. (2001). Bio-optical properties of oceanic waters: a reappraisal. J. Geophys. Res. Oceans 106, 7163–7180. doi: 10.1029/2000JC000319
NASA Goddard Space Flight Center Ocean Ecology Laboratory, Ocean Biology Processing Group. (2021a). Moderate-Resolution Imaging Spectroradiometer (MODIS) Aqua Photosynthetically Available Radiation.
NASA Goddard Space Flight Center Ocean Ecology Laboratory, Ocean Biology Processing Group. (2021b). Visible and Infrared Imager/Radiometer Suite (VIIRS) Photosynthetically Available Radiation Data.
Nielsen, M. M., Krause-Jensen, D., Olesen, B., Thinggaard, R., Christensen, P. B., and Bruhn, A. (2014). Growth dynamics of Saccharina latissima (laminariales, phaeophyceae) in Aarhus Bay, Denmark, and along the species' distribution range. Mar. Biol. 161, 2011–2022. doi: 10.1007/s00227-014-2482-y
Nielsen, M. M., Manns, D., D'Este, M., Krause-Jensen, D., Rasmussen, M. B., Larsen, M. M., et al. (2016). Variation in biochemical composition of Saccharina latissima and laminaria digitata along an estuarine salinity gradient in inner danish waters. Algal Res. 13, 235–245. doi: 10.1016/j.algal.2015.12.003
Olischläger, M., Iniguez, C., Koch, K., Wiencke, C., and Gordillo, F. J. L. (2017). Increased pCo2 and temperature reveal ecotypic differences in growth and photosynthetic performance of temperate and arctic populations of Saccharina latissima. Planta 245, 119–136. doi: 10.1007/s00425-016-2594-3
Redfield, A. C. (1934). On the Proportions of Organic Derivatives in Sea Water and Their Relation to the Composition of Plankton, Vol. 1. Liverpool: University Press of Liverpool.
Rogelj, J., Popp, A., Calvin, K. V., Luderer, G., Emmerling, J., Gernaat, D., et al. (2018). Scenarios towards limiting global mean temperature increase below 1.5°c. Nat. Clim. Change 8, 325–332. doi: 10.1038/s41558-018-0091-3
Running Tide (2021). Stripe Carbon Removal Proposal. Available online at: https://github.com/stripe/carbon-removal-source-materials/find/master
Sanders, R., Henson, S. A., Koski, M., De La Rocha, C. L., Painter, S. C., Poulton, A. J., et al. (2014). The biological carbon pump in the north Atlantic. Prog. Oceanogr. 129, 200–218. doi: 10.1016/j.pocean.2014.05.005
Sjotun, K. (1993). Seasonal lamina growth in two age groups of Laminaria saccharina (L.) lamour. in western Norway. Bot. Mar. 36, 433–442. doi: 10.1515/botm.1993.36.5.433
Strong-Wright, J. (2021). SugarKelp.jl. Available online at: https://github.com/jagoosw/SugarKelp.jl
van Den Hoek, C. (1982). The distribution of benthic marine algae in relation to the temperature regulation of their life histories. Biol. J. Linnean Soc. 18, 81–144. doi: 10.1111/j.1095-8312.1982.tb02035.x
Venolia, C. T., Lavaud, R., Green-Gavrielidis, L. A., Thornber, C., and Humphries, A. T. (2020). Modeling the growth of sugar kelp (Saccharina latissima) in aquaculture systems using dynamic energy budget theory. Ecol. Modell. 430:109151. doi: 10.1016/j.ecolmodel.2020.109151
Whiting, J. M., Wang, T., Yang, Z., Huesemann, M. H., Wolfram, P. J., Mumford, T. F., et al. (2020). Simulating the trajectory and biomass growth of free-floating macroalgal cultivation platforms along the US west coast. J. Mar. Sci. Eng. 8:938. doi: 10.3390/jmse8110938
Williams, R. G., and Follows, M. J. (2011). Ocean Dynamics and the Carbon Cycle: Principles and Mechanisms. Cambridge: Cambridge University Press. doi: 10.1017/CBO9780511977817
Keywords: seaweed, macroalgae, kelp, modeling, carbon
Citation: Strong-Wright J and Taylor JR (2022) Modeling the Growth Potential of the Kelp Saccharina Latissima in the North Atlantic. Front. Mar. Sci. 8:793977. doi: 10.3389/fmars.2021.793977
Received: 12 October 2021; Accepted: 13 December 2021;
Published: 31 January 2022.
Edited by:
Wei-Bo Chen, National Science and Technology Center for Disaster Reduction (NCDR), TaiwanReviewed by:
Concepcion Iñiguez, University of the Balearic Islands, SpainScott Bennett, University of Tasmania, Australia
Copyright © 2022 Strong-Wright and Taylor. This is an open-access article distributed under the terms of the Creative Commons Attribution License (CC BY). The use, distribution or reproduction in other forums is permitted, provided the original author(s) and the copyright owner(s) are credited and that the original publication in this journal is cited, in accordance with accepted academic practice. No use, distribution or reproduction is permitted which does not comply with these terms.
*Correspondence: John R. Taylor, Si5SLlRheWxvckBkYW10cC5jYW0uYWMudWs=