 Jonathan Sherman1*
 Ajit Subramaniam2
 Maxim Y. Gorbunov1
 Ana Fernández-Carrera3
 Rainer Kiko4
 Peter Brandt5,6Paul G. Falkowski1
- 1Environmental Biophysics and Molecular Ecology Program, Department of Marine and Coastal Sciences, Rutgers, The State University of New Jersey, New Brunswick, NJ, United States
- 2Lamont-Doherty Earth Observatory, Columbia University, Palisades, NY, United States
- 3Department of Biological Oceanography, Leibniz Institute for Baltic Sea Research Warnemünde, Rostock, Germany
- 4Laboratoire d’Océanographie de Villefranche-sur-Mer, Sorbonne Université, Villefranche-sur-Mer, France
- 5GEOMAR Helmholtz Centre for Ocean Research Kiel, Kiel, Germany
- 6Faculty of Mathematics and Natural Sciences, Kiel University, Kiel, Germany
In the Equatorial Atlantic nitrogen availability is assumed to control phytoplankton dynamics. However, in situ measurements of phytoplankton physiology and productivity are surprisingly sparse in comparison with the North Atlantic. In addition to the formation of the Equatorial cold tongue in the boreal summer, tropical instability waves (TIWs) and related short-term processes may locally cause episodic events of enhanced nutrient supply to the euphotic layer. Here, we assess changes in phytoplankton photophysiology in response to such episodic events as well as short-term nutrient addition experiments using a pair of custom-built fluorometers that measure chlorophyll a (Chl a) variable fluorescence and fluorescence lifetimes. The fluorometers were deployed during a transatlantic cruise along the Equator in the fall of 2019. We hypothesized that the Equatorial Atlantic is nitrogen-limited, with an increasing degree of limitation to the west where the cold tongue is not prominent, and that infrequent nitrate injection by TIW related processes are the primary source alleviating this limitation. We further hypothesized phytoplankton are well acclimated to the low levels of nitrogen, and once nitrogen is supplied, they can rapidly utilize it to stimulate growth and productivity. Across three TIW events encountered, we observed increased productivity and chlorophyll a concentration concurrent with a decreased photochemical conversion efficiency and overall photophysiological competency. Moreover, the observed decrease in photosynthetic turnover rates toward the western section suggested a 70% decrease in growth rates compared to their maximum values under nutrient-replete conditions. This decrease aligned with the increased growth rates observed following 24 h incubation with added nitrate in the western section. These results support our hypotheses that nitrogen is the limiting factor in the region and that phytoplankton are in a state of balanced growth, waiting to “body surf” waves of nutrients which fuel growth and productivity.
Introduction
The Atlantic Ocean is the best studied ocean basin. However, the vast majority of research on phytoplankton dynamics have been focused on the North Atlantic. On the other hand, the Equatorial Atlantic (EA) is greatly under-sampled, specifically with regard to phytoplankton productivity and community structure. Moreover, in situ data in the EA is sporadic, and is based mostly on data collected during Equatorial crossings of European ships of opportunity such as the Atlantic Meridional Transect (AMT) program transiting to and from the Southern Ocean (Rees et al., 2015). These cruises mostly occur between April–June and September–November, and as such, generally miss the most productive boreal summer months when, based on satellite observations, phytoplankton bloom (Longhurst, 1993; Pérez et al., 2005; Grodsky et al., 2008). As a result, phytoplankton dynamics in this region are poorly understood. This sampling disparity is interesting, since satellite primary productivity assessments estimate that the EA (between 10°N and 10°S) contributes more to global carbon fixation than the entire spring bloom region of the North Atlantic (Longhurst, 1993). Nonetheless, studies have shown that most of the tropical Atlantic, including the EA where equatorial upwelling occurs, can be considered at times as a low-nutrient low-chlorophyll (LNLC) region in which nitrogen is hypothesized to be the limiting factor for phytoplankton growth and photosynthetic yields (Mills et al., 2004; Davey et al., 2008; Moore et al., 2008, 2013).
Phytoplankton in the EA rely on the supply of nutrient-rich waters from below the thermocline into the surface waters. Such a supply occurs particularly during the cold tongue development in the boreal summer in the central and eastern EA due to seasonally enhanced wind-driven upwelling and associated vertical advection and mixing of nutrients (Radenac et al., 2020). Otherwise along the whole equator, including the western EA, infrequent localized events of upward nutrient supply may occur that seems to be tied to energetic intraseasonal variability (Menkes et al., 2002). Such upward nitrate transport promotes new production, i.e., primary production fueled by nitrate, rather than regenerated ammonium (Dugdale and Goering, 1967). Under steady-state conditions, new production is balanced by export production (in order to maintain a mass balance) (Laws et al., 2011). In order to successfully utilize these nutrient pulses, phytoplankton need to rapidly adjust and synthesize key photosynthetic components that will allow bursts of growth and productivity (Falkowski et al., 2017). In layman’s terms, phytoplankton in LNLC regions need to optimize their physiological state in a manner that will allow them to rapidly “body surf” upwelling waves contributing to new production and as result, export production.
The intraseasonal variability in the EA is dominated by Tropical Instability Waves (TIWs) in the central and western part and by mixed Rossby-gravity waves forced dominantly by biweekly meridional winds in the eastern part (Athie and Marin, 2008). TIWs are westward propagating, cusp-shaped, oscillations along the Equator (Athie and Marin, 2008). They are visible in satellite data of sea surface temperature or salinity (Chelton et al., 2000; Menkes et al., 2002; Lee et al., 2014) or in subsurface velocity data (Weisberg and Weingartner, 1988). While TIWs in the EA can occur anytime in the year, they happen more frequently and with greater intensity during the boreal summer months (Emery et al., 2006; Tuchen et al., 2018). TIWs form due to barotropic and baroclinic instabilities of the energetic upper ocean wind-driven current system (Philander, 1978; von Schuckmann et al., 2008). The waves have wavelength of ∼1,000 km and a westward phase velocity of 30–50 cm/s, resulting in periods of ∼30 days (Cox, 1980; Emery et al., 2006). The role of TIWs on the nutrient budget of the equatorial oceans is still quite uncertain. Studies in the Equatorial Pacific suggest that TIWs may reduce the availability of nutrients at the equator due to subduction of nutrient-poor waters north of the equator that is advected equatorward (Evans et al., 2009). However, locally TIWs may be associated with strong mixing events (Moum et al., 2009) or the generation of fronts (Warner et al., 2018) that both can drive upward nutrient supply. It is thus apparent that the role TIWs and related processes play in nutrient supply for phytoplankton is of great interest, however, direct measurements linking the physical processes and phytoplankton dynamics have lacked so far (Menkes et al., 2002).
Variable fluorescence measurements of the maximum quantum yield of photochemistry (Fv/Fm) in photosystem II (PSII) are widely used to rapidly assess the extent of nutrient limitation in situ (Falkowski, 1994; Greene et al., 1994; Parkhill et al., 2001; Bonnet et al., 2008; Kerkar et al., 2020; Ko et al., 2020). Rapid (<48 h) increases in Fv/Fm following the addition of the limiting nutrient have been used to further support the existence of limitation (Falkowski et al., 1992; Suggett et al., 2009; Ko et al., 2020). Variable fluorescence techniques, such as fast repetition rate (FRR) or fluorescence induction and relaxation (FIRe), provide additional parameters and information regarding the photophysiological state of PSII, which can be used to assess and quantify the extent of nutrient limitation. These parameters include the effective absorption cross section of PSII (σPSII), kinetics of electron transport on the acceptor side of PSII, and the maximum electron transfer rate through PSII () (Gorbunov et al., 2000, 2001).
Variable fluorescence measurements can be combined with simultaneous picosecond fluorescence lifetime measurements in order to resolve the three pathways in which phytoplankton can utilize or dissipate the absorbed solar energy; photochemistry, fluorescence emission, and non-radiative thermal dissipation (Butler and Strasser, 1977; Butler, 1978; Lin et al., 2016; Gorbunov and Falkowski, 2021). Chlorophyll a (Chl a) fluorescence lifetimes measure the time it takes for an excited state Chl a molecule to return to the ground state, which is directly proportional to the quantum yield of the fluorescence emission in the photosynthetic unit (ΦF) (Brody and Rabinowitch, 1957; Brody, 2002; Lakowicz, 2006). The simultaneous measurements of variable fluorescence and fluorescence lifetime provide further insight into the photophysiological response of phytoplankton to nutrient limitation and relief.
Even though Fv/Fm is commonly used to assess nutrient limitation this parameter alone is insufficient to indicate nitrogen limitation, as its relationship with growth rate is highly non-linear (Parkhill et al., 2001; Gorbunov and Falkowski, 2020). Several ship-board nutrient addition experiments conducted in the oligotrophic sub-tropical Atlantic and tropical Pacific showed that while alleviation from nitrogen limitation results in increased chlorophyll synthesis, a lack of response, or even a slight decline, was observed in Fv/Fm (Behrenfeld et al., 2006; Moore et al., 2008). A key contributor to such response was the predominance of cyanobacteria across the LNLC regions. In cyanobacteria the primary light harvesting complex (LHC) for PSII (and PSI) is the phycobilisome. The phycobilisome is a large, water-soluble, peripheral structure on the thylakoid membrane, which consists of phycobilins, a group of photosynthetic pigments. The phycobilins transfer excited state energy to the reaction center (RC) via an energy gradient between the three main pigments, phycoerythrin, phycocyanin and allophycocyanin (Sidler, 1994). The energy transfer is not 100% and the two latter pigments overlap spectrally with the fluorescence bands of Chl a, resulting in an increased background fluorescence when measuring Fv/Fm (Campbell et al., 1998). This further complicates the use of Fv/Fm alone to assess the extent of nitrogen limitation in LNLC tropical regions. On the other hand, the maximum electron transport rate () at saturating irradiances, conventionally derived from kinetic-based variable fluorescence (Gorbunov et al., 2000) provides a better quantitative indicator for nitrogen limitation. Recently, Gorbunov and Falkowski (2020) developed a method to calculate electron transport rates from the photosynthetic turnover rate measured at saturating irradiances, referred to as ETRτ, using a kinetic fluorescence analysis. Using this method improves the accuracy of ETR measurements substantially, in addition to being very sensitive to nitrogen limitation. Moreover, Gorbunov and Falkowski showed that the photosynthetic turnover rate at saturating irradiances can be used to quantify the reduction in growth rates and electron yield of carbon fixation (i.e., the number of electrons required to accumulate one carbon molecule) due to nitrogen limitation. This allows to potentially model net primary production from variable fluorescence, and in the case of new production fueled by upwelled nutrients, even export production.
In this study, we examined the response of phytoplankton photophysiology across the EA to events of upward nutrient injection occurring locally along the equator during a period of strong TIWs. A pair of custom-built fluorometers were deployed on-board the R/V Meteor during a trans-Equatorial cruise (Figure 1). The first, a FIRe instrument measured Fv/Fm, σPSII and ETRτ. The second instrument, the Picosecond Lifetime Fluorescence (PicoLiF) measured fluorescence lifetimes.
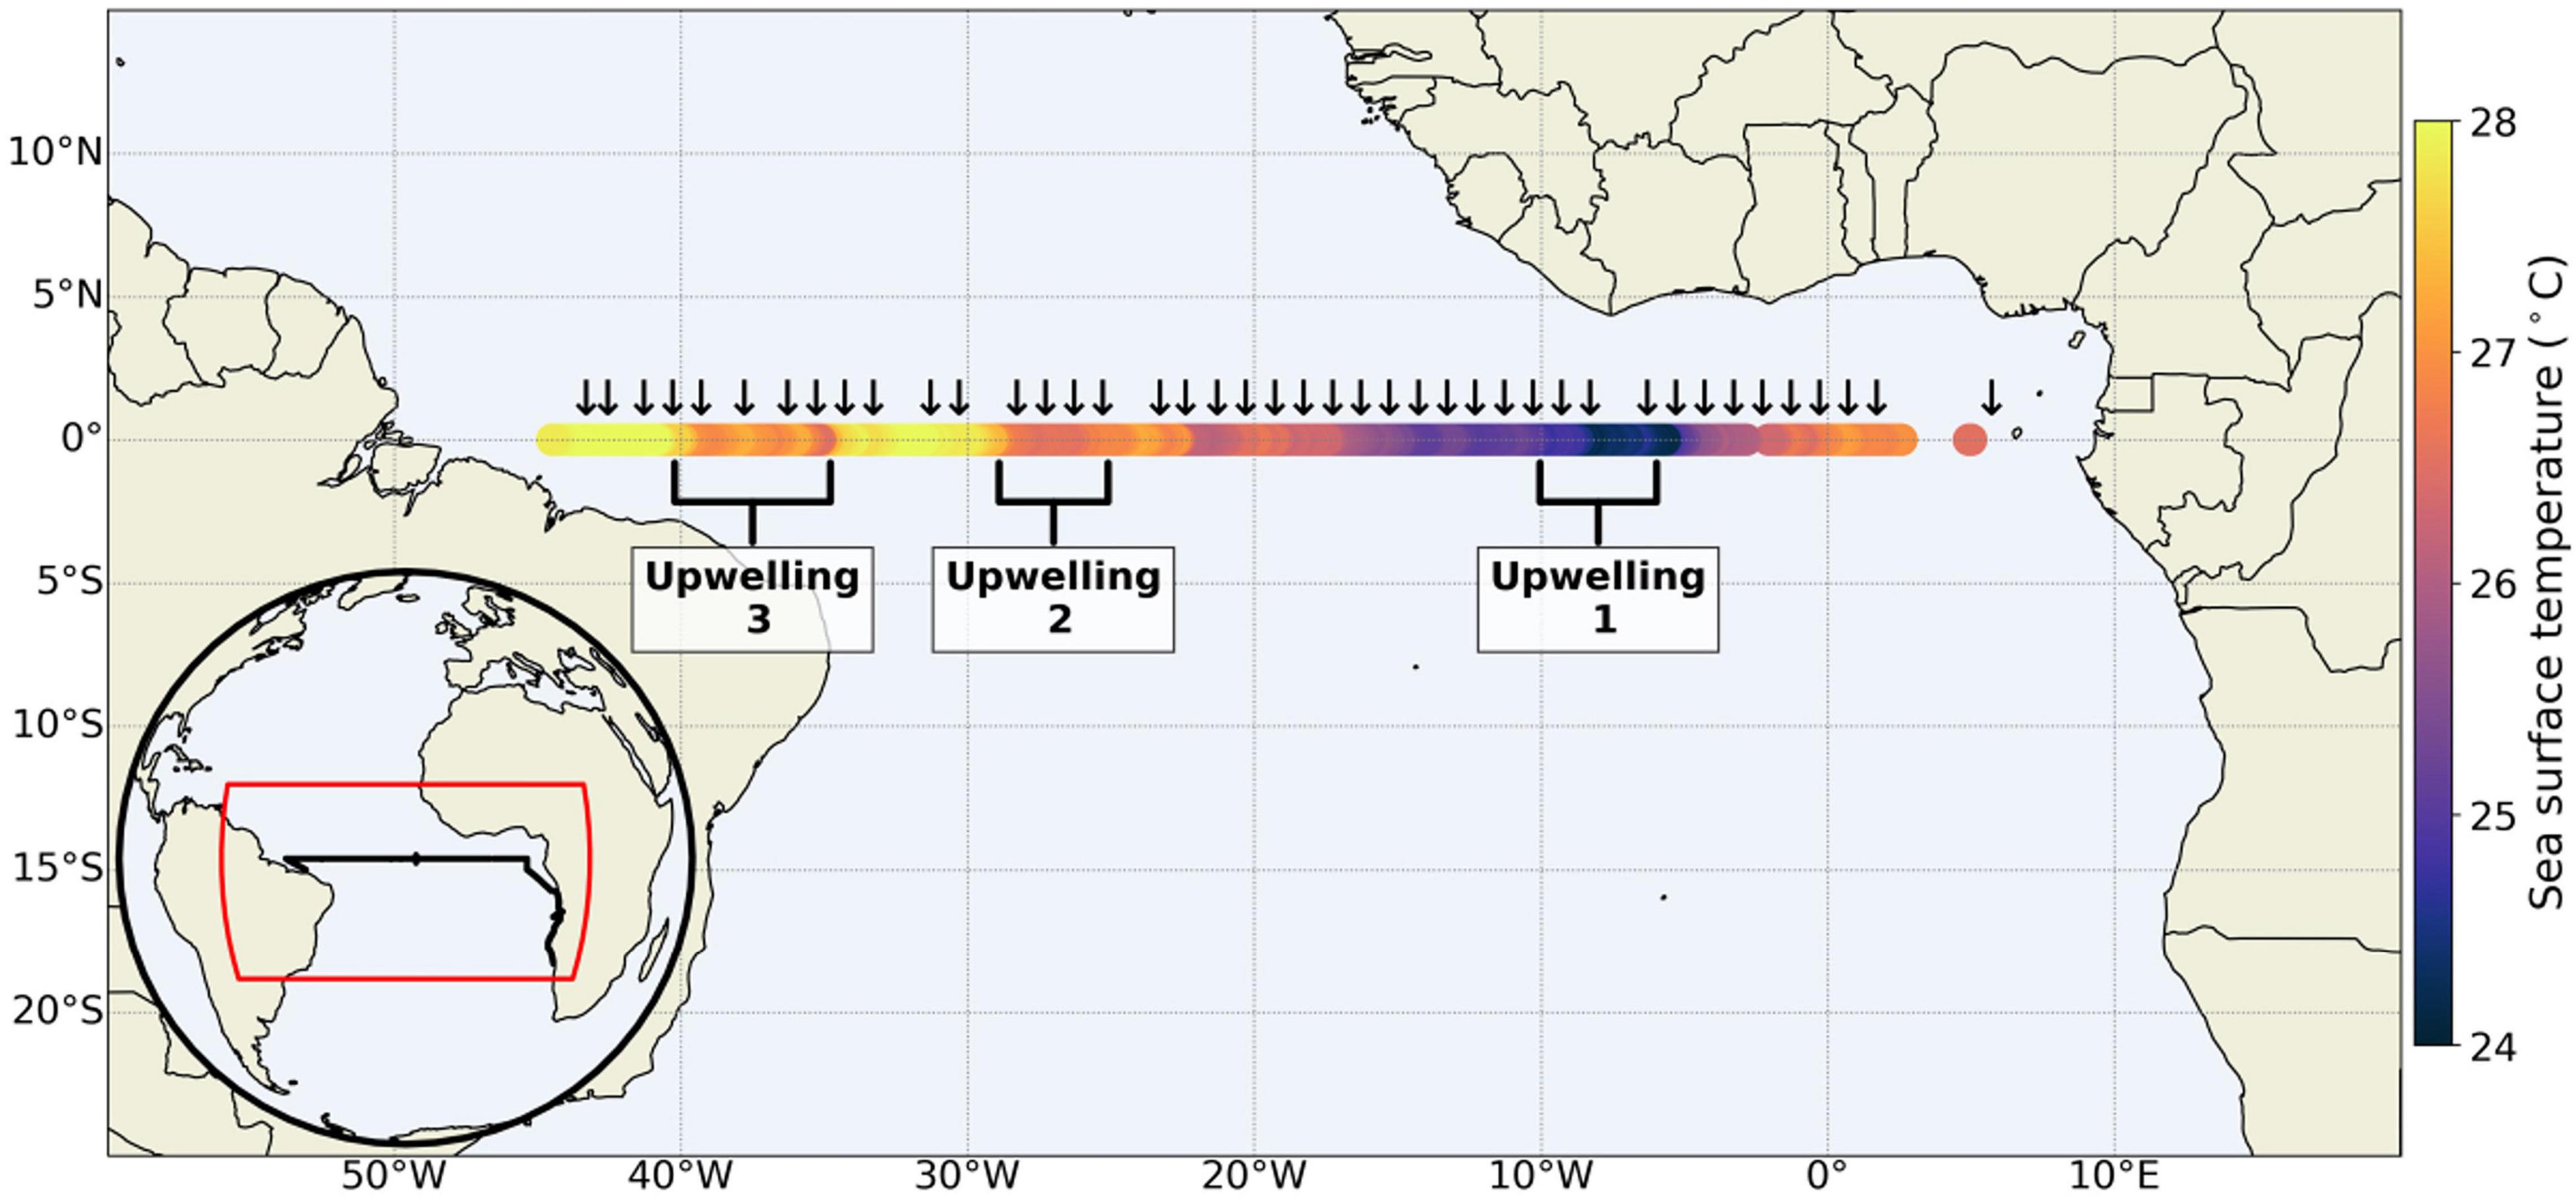
Figure 1. Black arrows denote stations along the Equator which included CTD casts with concurrent collection of samples for nutrient and FIRe analysis (not all CTD casts are represented here). Insert at bottom left shows the full cruise track (black line). Three regions are marked as Upwelling 1, 2, and 3 that are associated with events of upward nutrient supply.
Our main hypothesis was that the paucity of nitrogen is the primary factor limiting productivity in the EA, and TIWs related processes are among the most important mechanism supplying nitrogen to the surface via upwelling and mixing. Moreover, we hypothesized that since the Equatorial cold tongue is prevalent East of about 18°W, the degree of nitrogen limitation increases to the west in the boreal summer. Interestingly, a natural system like this, where nitrogen limitation is hypothesized to be disrupted infrequently by events of upward nutrient supply, allowed us to test a third hypothesis. Here, we hypothesized phytoplankton in the EA surface waters can rapidly “body surf” these nitrogen “waves” uplifted to the surface by quickly fine-tuning their photophysiology and optimizing energy harvesting and transfer to fuel growth and primary productivity.
Materials and Methods
Study Area and Sample Collection and Analysis
Data were collected on board the R/V Meteor as part of the Transatlantic Equatorial Cruise I (TRATLEQ I) between 5°E and 44°45′W during September–October 2019 (Figure 1). Along the Equator Conductivity, Temperature, and Depth (CTD) sampling stations were conducted at every degree of longitude. At each station water samples were collected for Chl a and dissolved macro inorganic nutrients (nitrate, nitrite, phosphate, and silicate). The nutrient samples were collected in 15 mL falcon tubes and immediately frozen. The frozen samples were analyzed using an autoanalyzer at GEOMAR, Kiel. Depths sampled included at the least the surface as well as above, in and below the deep chlorophyll maximum (DCM). Variable fluorescence and fluorescence lifetime data were collected continuously from surface waters (∼5 m depth) while underway with FIRe and PicoLiF fluorometers, respectively, as described by Sherman et al. (2020). The two instruments were connected to the ship’s surface water intake pump. Prior to entering the instruments cuvette, the water passed through two de-bubblers. To decrease the potential impact of pressure-related stress on phytoplankton and their photophysiology as they pass through the intake pump, the underway system was connected to a membrane type pump which results in less shear (Cetinić et al., 2016). Furthermore, photophysiological data collected from the underway system was compared with measurements conducted on water collected from CTD casts during data quality control.
Photophysiology
A mini-FIRe instrument measured fluorescence before and after a saturating single turnover flash (STF) from blue light-emitting diodes (450 ± 30 nm half bandwidth), which cumulatively reduces all PSII RCs within ca. 80 μs. This STF protocol results in minimum and maximum fluorescence yields (F0 and Fm). The quantum yield of photochemistry in PSII was then calculated as (Fm-F0)/Fm = Fv/Fm (Butler, 1978; Kolber et al., 1998). The effective absorption cross section of PSII, σPSII (at 450 nm), is calculated by fitting the fluorescence rise to a cumulative one-hit Poisson function (Ley and Mauzerall, 1982). The rate of fluorescence relaxation after the STF recorded under saturating irradiance is then used to calculate the photosynthetic turnover rate (Gorbunov and Falkowski, 2020).
Every ∼30 min. the water flow into the mini-FIRe instrument was automatically paused to conduct Slow Light Curves, i.e., fluorescence-versus-irradiance (FE) curves. These were used to calculate ETR as a function of irradiance and to depict the state of phytoplankton photoacclimation to their light history (Falkowski, 1994; Ralph and Gademann, 2005). During FE curves, water was trapped in the cuvette for ca. 10 min to allow for low-light acclimation, and then exposed to increasing photosynthetically active radiation (PAR) levels (0–900 μmol photons m–2 s–1) with an actinic blue light source (450 nm). From FE curves, we calculated ETRτ per PSII RC (units of e– s–1 RC–1) achieved at saturation following Gorbunov and Falkowski (2020).
Here, E is irradiance and ΔF′/F′m is the quantum yield of photochemistry at a given PAR level. Their multiplication represents the relative ETR. The prime notation indicates that the measurement was conducted under ambient light (ΔF′ = F′m – F′, where F′ is the steady state fluorescence at a given light step). The relative ETR is then divided by the relative ETR under saturating irradiance (Emax) to normalize to unity and multiplied by the photosynthetic turnover rate (1/τ in Eq. 1) to calculate the absolute ETR (ETRτ) per PSII RC. Emax is defined as ∼3 times EK, the saturating light level (Falkowski and Raven, 2014).
The PicoLiF measured picosecond fluorescence decays which were deconvoluted from the instrument response function and then fitted to a sum of three exponentials with a custom TCSPFIT Matlab package utilizing a Nelder-Mead simplex algorithm (Enderlein and Erdmann, 1997). ΦF was then calculated from,
Where τ is the measured lifetime and τ0 is the natural lifetime of chlorophyll a (Brody and Rabinowitch, 1957; Brody, 2002). The natural lifetime is the time that would be required for a molecule to return to the ground state from an excited state if fluorescence were the sole dissipation pathway. For Chl a, τ0 is 15 ns and is constant, independent of solvent, organism or environmental condition (Brody and Rabinowitch, 1957; Brody, 2002; Lakowicz, 2006). We then calculated the quantum yield for thermal dissipation (ΦT) as,
All fluorescence measurements were corrected for the blank signal measured routinely from filtered seawater (0.2 μm) (Bibby et al., 2008).
Nutrient Amendment Experiments
At five CTD stations along the Equator additional surface water was collected to initiate short term nutrient amendment experiments (NAE). The NAEs were conducted at 4°W, 12°W, 28°W, 35°W, and 40°W and consisted of an unamended control and experimental groups in which nitrate (5 μM), phosphate (1 μM), nitrate and phosphate combined, or iron (2 nM) were added. The collected water was distributed into 250 mL polycarbonate bottles, spiked with nutrients, and placed in a deck-board incubator with flowing water to maintain in situ temperatures. Bottles were covered with neutral density screens to approximate the light levels in the surface waters. Each treatment included triplicates. At the time of collection, standard FIRe measurements were conducted both in the dark and at saturating light level. Following this, measurements were conducted after 24 h. To minimize photophysiological changes due to the diel cycle, we attempted to keep all measurements around noon. Measurements included 5 technical replicates for each biological replicate (i.e., each bottle). The saturation level was chosen from an FE curve conducted on a control sample at t0. To account for photophysiological variability in the control group due to changes in the light conditions and various other bottle effects, all measurements were normalized to the control group. We decided to focus on data collected after 24 h to characterize the rapid response in phytoplankton physiology to nutrient amendments. In the warm Equatorial waters this time frame is sufficient. Longer term incubations would introduce changes that can be due to a change in the community composition. Lastly, we calculated the reduction in growth rates (μ/μreplete) and electron yield of net primary production (ΦNPc) under nutrient limitation (particularly by nitrogen) following (Gorbunov and Falkowski, 2020) as,
In Eqs. 4, 5 represents the relative decrease in photosynthetic turnover rate by nitrogen stress, where τ is the photosynthetic turnover time and τreplete is the photosynthetic turnover time in nutrient replete conditions. We understand that the double use of τ here and for the average fluorescence lifetime may be confusing. This stems from the fact that both measurements are measuring relaxation kinetics commonly denoted by τ, however, the two measure different processes operating at vastly different time scales. Aside from the Equations above we refrain from using the term τ alone in order to avoid confusion. In Eq. 5 represents the maximum electron yield of net carbon production for nutrient-replete conditions (0.076 e–/C) (Gorbunov and Falkowski, 2020).
Note that at 12°W there was no nitrate and phosphate combined group, and that iron additions were only done at 12°W, 28°W, and 35°W.
Statistical Analysis
In this study, we present the mean and standard deviation of each parameter measured. Significant difference, at ρ < 0.05, between the means of regions was determined with a two-sample, two-tailed T-test. To test if the response in the nutrient amendment experiments resulted in a statistically significant increase in mean photophysiological parameter measured compared to the control a two-sample, one-tailed T-test was used.
Results
The Equatorial Atlantic System
Oceanographic conditions across the EA reflected the tropical ocean’s stratified, oligotrophic mean state. The upper mixed layer extended down to the 25°C isotherm, denoting the top of the thermocline (dashed black line in all Figure 2 panels). As expected, the thermocline was deep in the west (125–150 m) and shoaled toward the east (∼60 m) (Figure 2A). Similarly, the pycnocline followed the shoaling trend (24 kg m–3 isopycnal in Figure 2B). Macronutrient (nitrate and phosphate) distributions along the Equator were strongly controlled by the water column structure. In the mixed layer nutrient concentrations were vanishingly low. Below the thermocline they significantly increased by ∼2–3 orders of magnitude (Figure 2C, phosphate not shown). The nitrate/phosphate ratio across the EA, calculated from the first 120 m averaged ∼7, a value below the canonical 16/1 Redfield ratio. In the stratified near-surface sections, the nitrate/phosphate ratio was significantly lower, averaging 1.7.
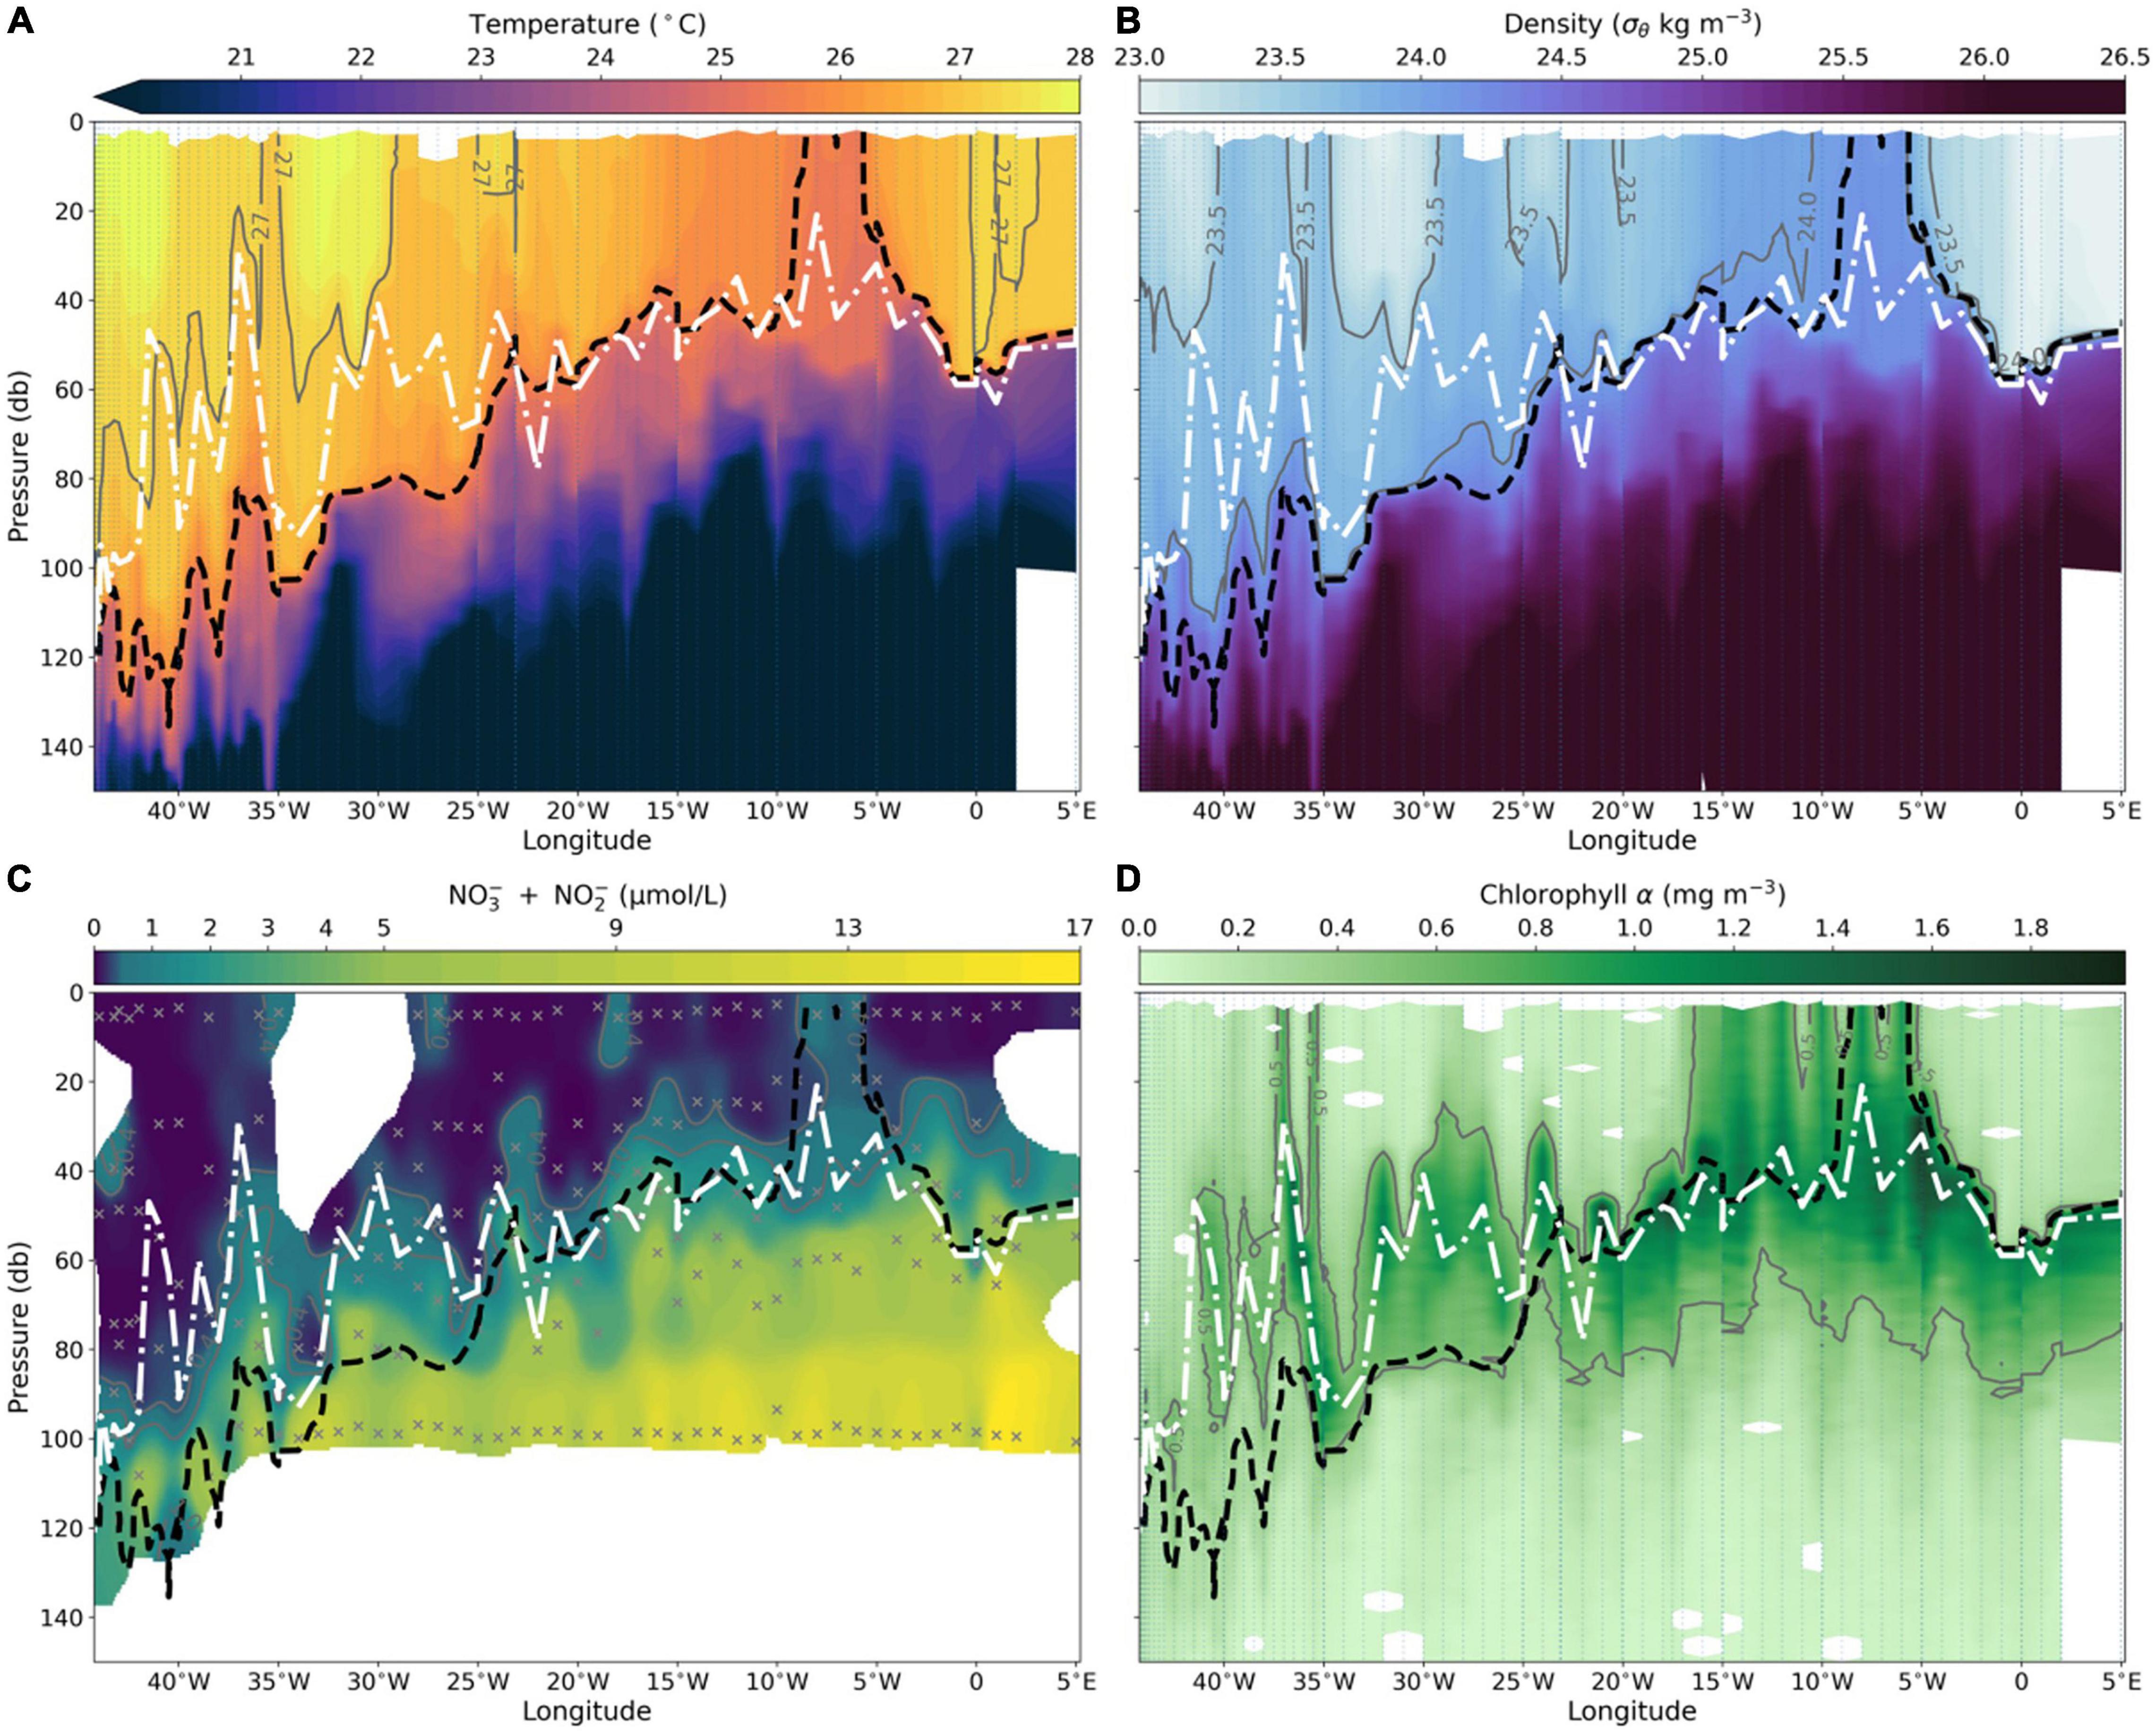
Figure 2. Section plots along the Equator of physical and biophysiochemical parameters. (A) Temperature (from CTD), (B) potential density (from CTD), (C) nitrite + nitrate (sampled from Niskin bottles) and (D) chlorophyll a (measured by a CTD mounted fluorometer). Note that the color bar in (C) is non-uniform in order to highlight changes across orders of magnitude. Gray dotted lines in plots (A,B,D) denote the CTD stations. Black X in plot (C), represent the Niskin bottle sampling locations. Black dashed line and white dash-dot line in each panel represent the 25°C isotherm and the DCM, respectively.
Chlorophyll a concentration in the stratified near-surface layer was remarkably low (Figure 2D). Generally, the DCM (white dash-dot line in all Figure 2 panels) formed on top of the thermocline and similarly sloped down to the west. Moreover, the DCM was located below the nutricline (denoted by the 1 μmol L–1 isoline, Figure 2C). Lastly, Chl a concentration in the DCM decreased significantly (by an order of magnitude) in the west (Figure 2D). Below, we will refer to the warm, nutrient-poor, stratified near- surface layer described here as the steady-state, unperturbed, sections.
Across the EA we came across three distinct upwelling events associated with TIWs that perturbed the steady-state. The first, termed uw1, occurred between 6°W and 10°W and was the most pronounced event encountered in which the thermocline (25°C isotherm) upwelled to the surface resulting in a ∼2°C drop in SST (Figure 2A). In this event surface nitrate and Chl a increased by an order of magnitude (Figures 2C,D). In addition to the localized increase in Chl a associated with uw1, we observed elevated Chl a as far west as 18°W related to the seasonal presence of the cold tongue (Figure 2D). A second event, uw2, occurred between 26°W and 30°W. While higher nitrate concentrations were measured in the surface waters along uw2, surface Chl a only slightly increased. This is highlighted by a slight shoaling of the 0.5 mg m–3 Chl a isoline at 40 m (which reached the surface in uw1). The third event, uw3, occurred between 35°W and 40°W and represented a TIW front we crossed twice, evident by a narrow double peak most clearly seen in the density and Chl a data (Figures 2B,D). In uw3, both nitrate and Chl a concentration increased. As upwelled waters along uw2 and uw3 originated from above the thermocline SST didn’t drop drastically, nonetheless these sections diverged from the steady-state, unperturbed conditions. Overall, these upwelling events increased surface nitrate and Chl a concentration by roughly 5- and 8-fold, as well as increasing the average nitrate/phosphate ratio to 3.5.
Near-Surface Phytoplankton Photophysiology
Figure 3 presents a general overview of the underway measurements of sea surface temperature and the photophysiological parameters measured by the FIRe and PicoLiF instruments. Table 1 summarizes the dawn-time means of the main photophysiological parameters across the steady-state and the three upwelling events encountered. The means of each upwelling section presented in Table 1 are statistically different from the steady-state (ρ < 0.05). Under steady-state conditions, photophysiology was characterized by extremely low chlorophyll biomass (as evident from low Fm and F0), relatively high Fv/Fm and photosynthetic turnover rates, average fluorescence lifetimes of ∼1 ns and small σPSII (Figure 3 and Table 1). Across uw1 significant increases in Fm (and F0, to an even larger degree), fluorescence lifetimes and σPSII were observed. Concurrently, Fv/Fm and photosynthetic turnover rates significantly decreased (Figure 3 and Table 1). Across uw2 we observed similar trends, however, these were far more moderate. Fm and σPSII across uw3 were on par in magnitude with uw1, while Fv/Fm, photosynthetic turnover rates and fluorescence lifetimes displayed a moderate response, as seen in uw2 (Figure 3 and Table 1).
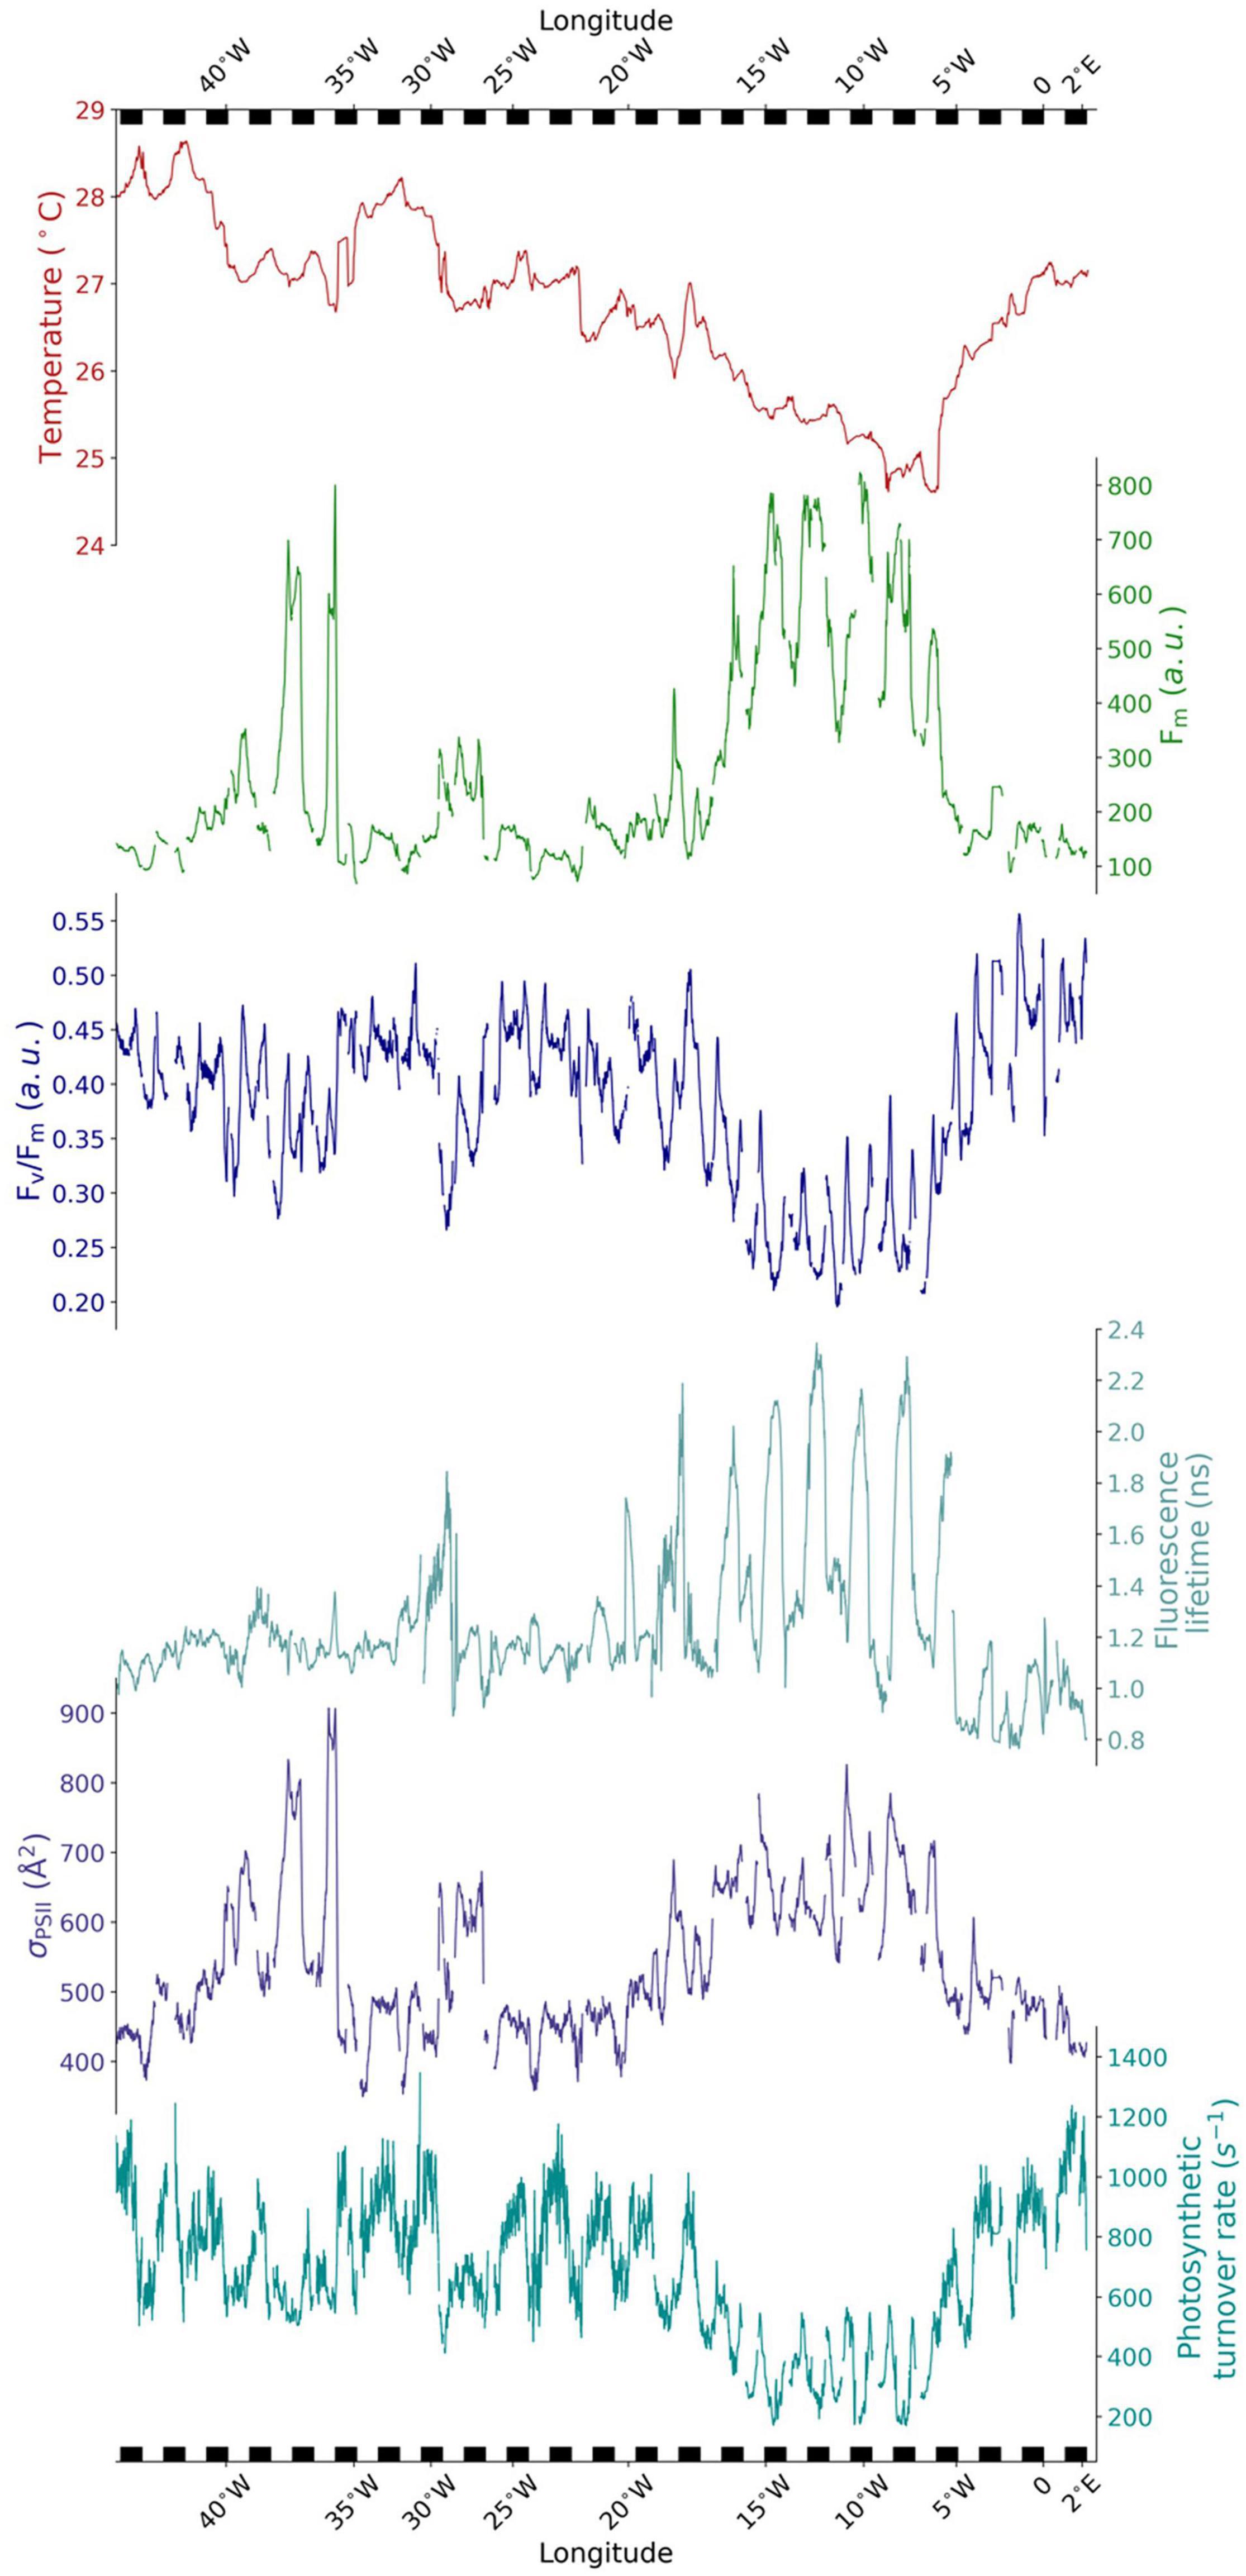
Figure 3. Time series of near-surface temperature and photophysiology derived along the Equator. Photophysiological data from underway FIRe and PicoLiF, representing low-light acclimated phytoplankton. Temperature is measured by the ship thermosalinograph. From top to bottom; sea surface temperature (red), Fm (green), Fv/Fm (blue), fluorescence lifetime (cyan), σPSII (dark blue), and photosynthetic turnover rate (dark cyan). Note the top and bottom x-axis ticks reflect the longitude in order to easily locate the steady-state sections and the upwelling events. The black and white bars at top and bottom denote night and day, highlighting the temporal variability of the data. Each series was smoothed using a rolling mean (30-min window).
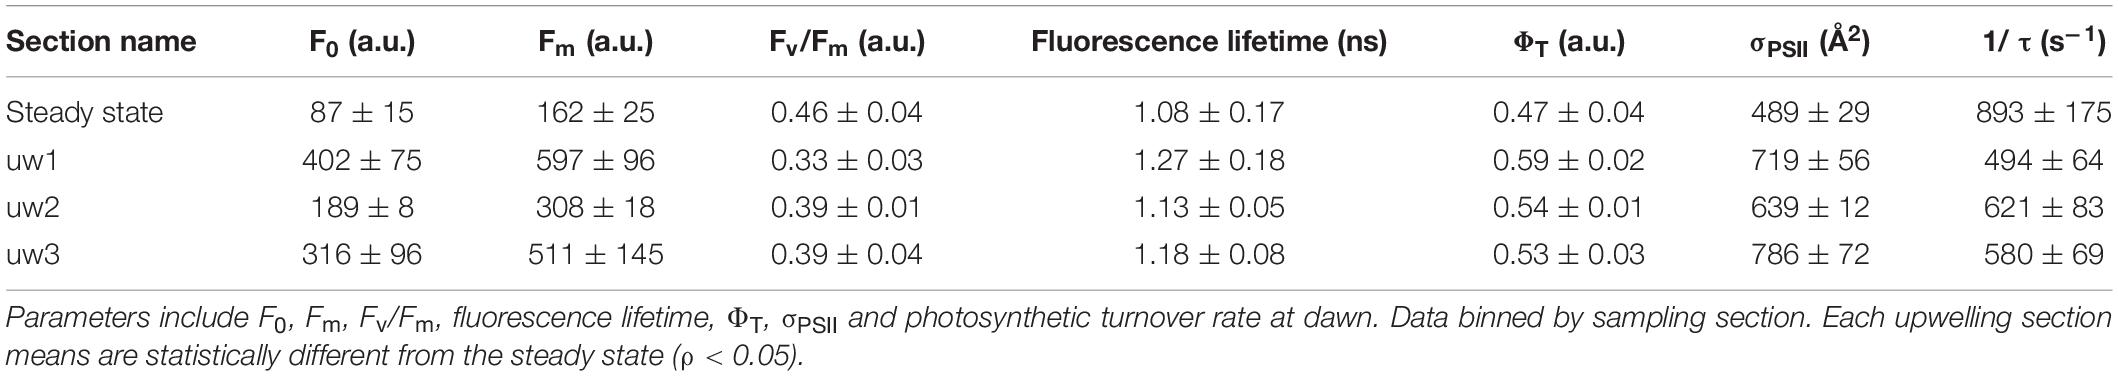
Table 1. Mean values and standard deviation of photophysiology at dawn.
Maximum ETRτ under saturating irradiance, calculated from the underway FE curves, revealed a ∼40% decrease in dawn ETRτ from the east to west steady-state sections. Between 5°E and 4°W dawn ETRτ averaged 242 ± 66 e– s–1 RC–1. Further west, between 19°W–25°W and 30°W–34°W ETRτ decreased significantly to 151 ± 29 e– s–1 RC–1 and 149 ± 38 e– s–1 RC–1, respectively. This east-west gradient was statistically significant (ρ < 0.05). Across uw1 dawn ETRτ averaged 223 ± 81 e– s–1 RC–1 and was not statistically different from the eastern steady-state ETRτ mean. On the other hand, ETRτ values across uw2 and uw3 were similar to the values seen in the western steady-state sections surrounding them.
To better contrast the photophysiology of the steady-state and the upwelling sections, we compared the mean trend in diel cycles between the two. Since uw1 had the most pronounced response and it was the only event that we tracked for several days, providing statistical significance, we will focus on this event. Both in steady-state and uw1, the mean diel cycles of F0 and Fm were characterized by a night-time maximum and a daytime minimum (Figure 4A, F0 not shown). However, we did observe a difference in the dusk to dawn dynamics. Across the steady-state sections, after reaching the night-time maximum at dusk, F0 and Fm plateaued until dawn when they began to decrease. On the other hand, across uw1, F0 and Fm continually increased from the midday minima until a midnight maximum followed by an abrupt decrease into the next day (Figure 4A). In both sections, the mean diel cycle in Fv/Fm was characterized by double maxima, one at dusk, and a second, higher, dawn peak. The two peaks were flanked with midday and midnight minima (Figure 4B). While the mean diel trend in Fv/Fm was consistent throughout the EA, the magnitude of the nighttime decrease was ∼3 times higher along uw1 in comparison to the steady-state (35 vs. >10% decrease) (Figure 4B).
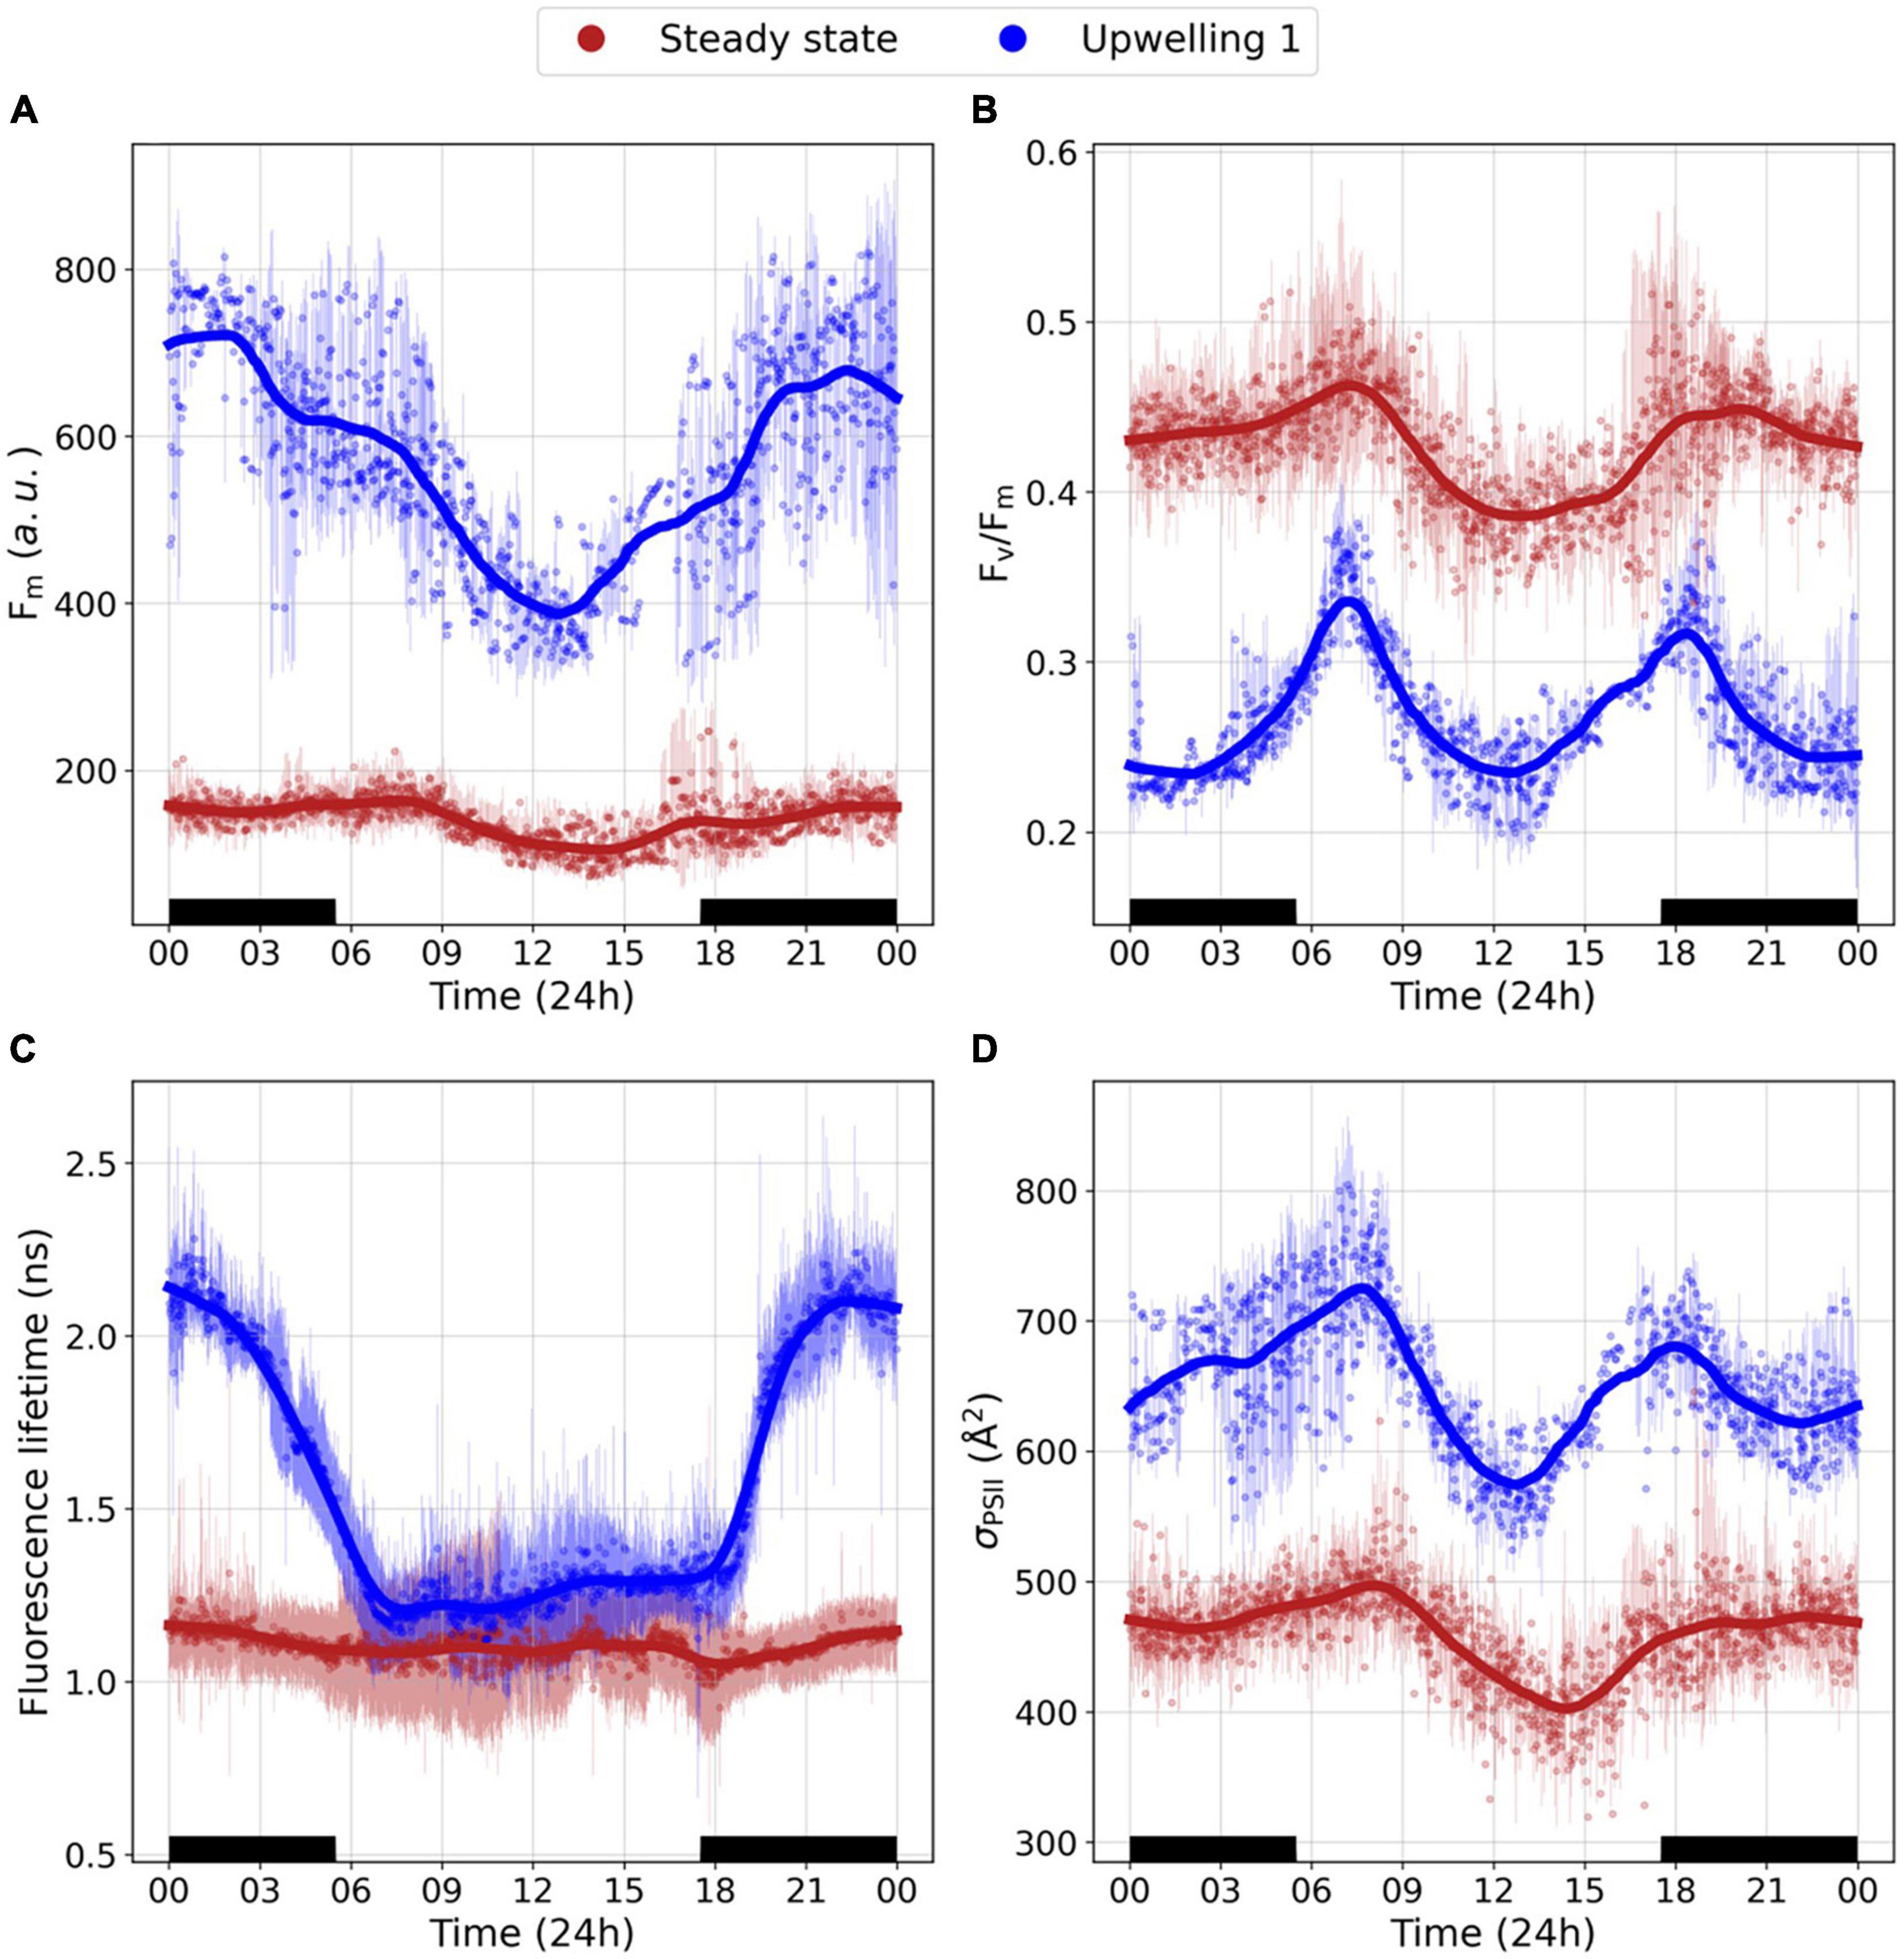
Figure 4. Mean diel cycles in photophysiology. (A) Fm, (B) Fv/Fm, (C) Fluorescence lifetime, and (D) σPSII. Red dots represent the mean diel cycle averaged across the steady state section (n = 17 days) and blue dots represent the mean diel cycle averaged across uw1 (n = 5 days). Red and blue translucent lines denote the standard deviation. A lowess smoother was applied to each section’s mean diel cycle (red and blue lines).
Fluorescence lifetimes were characterized by two distinct patterns (Figure 4C). Along the steady-state sections fluorescence lifetimes ranged between 0.8 and 1.2 ns. Despite this range, fluorescence lifetimes in these sections lacked a diel periodicity with similar day and night mean values (∼1.1 ns). On the other hand, while daytime fluorescence lifetimes across uw1 were comparable to the steady-state sections (∼1 ns), we observed dramatic increases in night-time values (as high as 2.2 ns) producing a distinct mean diel cycle. The mean diel cycle in σPSII was relatively similar between the sections, with dawn/dusk maxima and daytime minima. In uw1 the daytime minima were reached earlier in the day in comparison to the steady-state section minima. Moreover, along uw1, σPSII exhibited a night-time decrease (∼20%), not observed along the steady-state sections (Figure 4D).
The unique diel cycle along uw1 is further characterized by a remarkable night to dawn transition in the fraction of energetically uncoupled PSII LHC-RC complexes (Figure 5). In uw1, we observed a very high fraction of uncoupled complexes during the night (ranging from 25% to over 40% uncoupling), however, at dawn, these complex recoupled and the fraction of uncoupled complexes drastically reduced and resembled the values along the steady-state (10–20%). This night to dawn shift is absent in the steady state. Based on these results (Figures 3–5), data collected during the dawn represented the optimal state for PSII photophysiology [i.e., no evidence of non-photochemical quenching (NPQ), photoinhibition or state transitions].
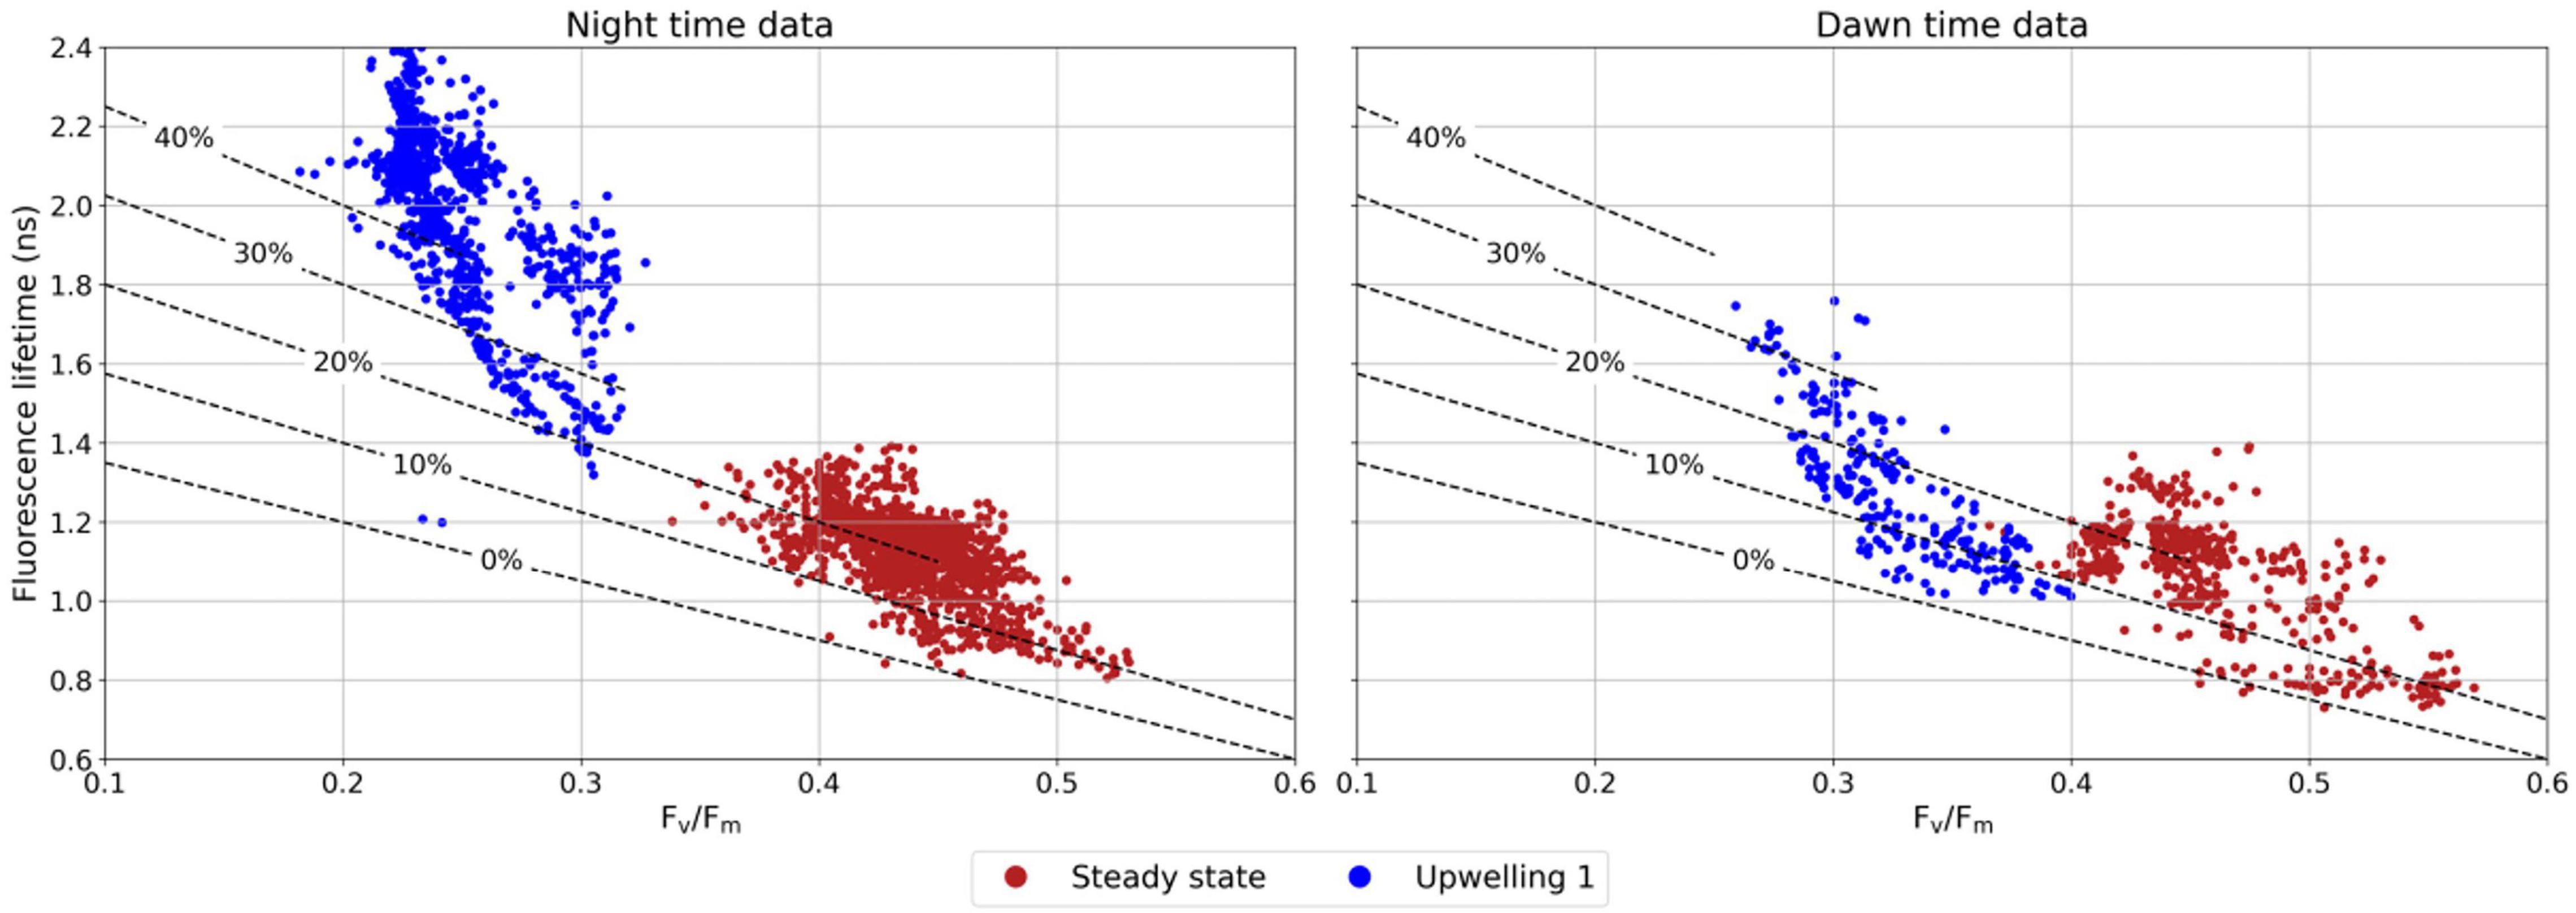
Figure 5. Relationship between Fv/Fm and fluorescence lifetime along the steady state and uw1. Left- data collected during the night, right- data collected at dawn. In both cases NPQ is assumed to be nil, thereby removing the nonlinear effect of NPQ on the otherwise linear relationship between Fv/Fm and fluorescence lifetime (Lin et al., 2016). Dashed lines indicate the fraction of uncoupled reaction centers. 0% dashed lines represents the modeled linear dependency of Fv/Fm and fluorescence lifetime (Butler, 1978). 10–40% dashed lines represent the dependency of these parameters in detached antenna PSII reaction centers complexes.
Nutrient Amendment Experiments
Within 24 h of nutrient amendment we observed significant changes in the photophysiological parameters measured in the stations further to the west (28°W, 35°W, and 40°W) (Figure 6). The addition of nitrate alone, or in combination with phosphate, resulted in a 100–200% significant increase in Fm at these stations relative to the control (ρ < 0.05) (Figure 6A). On the other hand, at 4°W and 12°W Fm did not change or only increased mildly, as compared to the control. Similarly, the addition of phosphate alone or iron caused no increase in Fm relative to control (Figure 6A). While not as pronounced as the changes in Fm, we observed similar trends in Fv/Fm in response to the nutrient amendments. In the three western NAEs the addition of nitrate alone increased Fv/Fm relative to control by ∼30–40% (ρ < 0.05). Moreover, amendment with nitrate and phosphate together further increased Fv/Fm relative to control (40–50%) (ρ < 0.05) (Figure 6B). The eastern NAEs on the other hand had either no response or only a very slight one in response to the addition of nitrate alone or with phosphate (Figure 6B). Overall, changes in ETRτ, measured under saturating irradiances, aligned with the trends observed in Fm and Fv/Fm (Figure 6C). At 4°W regardless of the treatment we observed no change relative to control in ETRτ. At 12°W the addition of nitrate or iron resulted in a 20% increase in ETRτ relative to control (ρ < 0.05), while phosphate had no change. We observed the most significant changes in ETRτ at 28°W and 40°W. At 28°W ETRτ increased by 40% relative to control in response to the addition of either nitrate or phosphate (ρ < 0.05). In response to the combination of nitrate and phosphate ETRτ further increased by 60% relative to control (ρ < 0.05). In contrast, the addition of iron here had no effect. Similarly, at 40°W we observed increased ETRτ when nitrate was added alone, and a higher increase when added in combination with phosphate (35 and 45% relative to control, respectively). In contrast, at 40°W, the addition of phosphate alone had little effect. Supplementary Figure 1 presents the mean and standard deviation of each NAE.
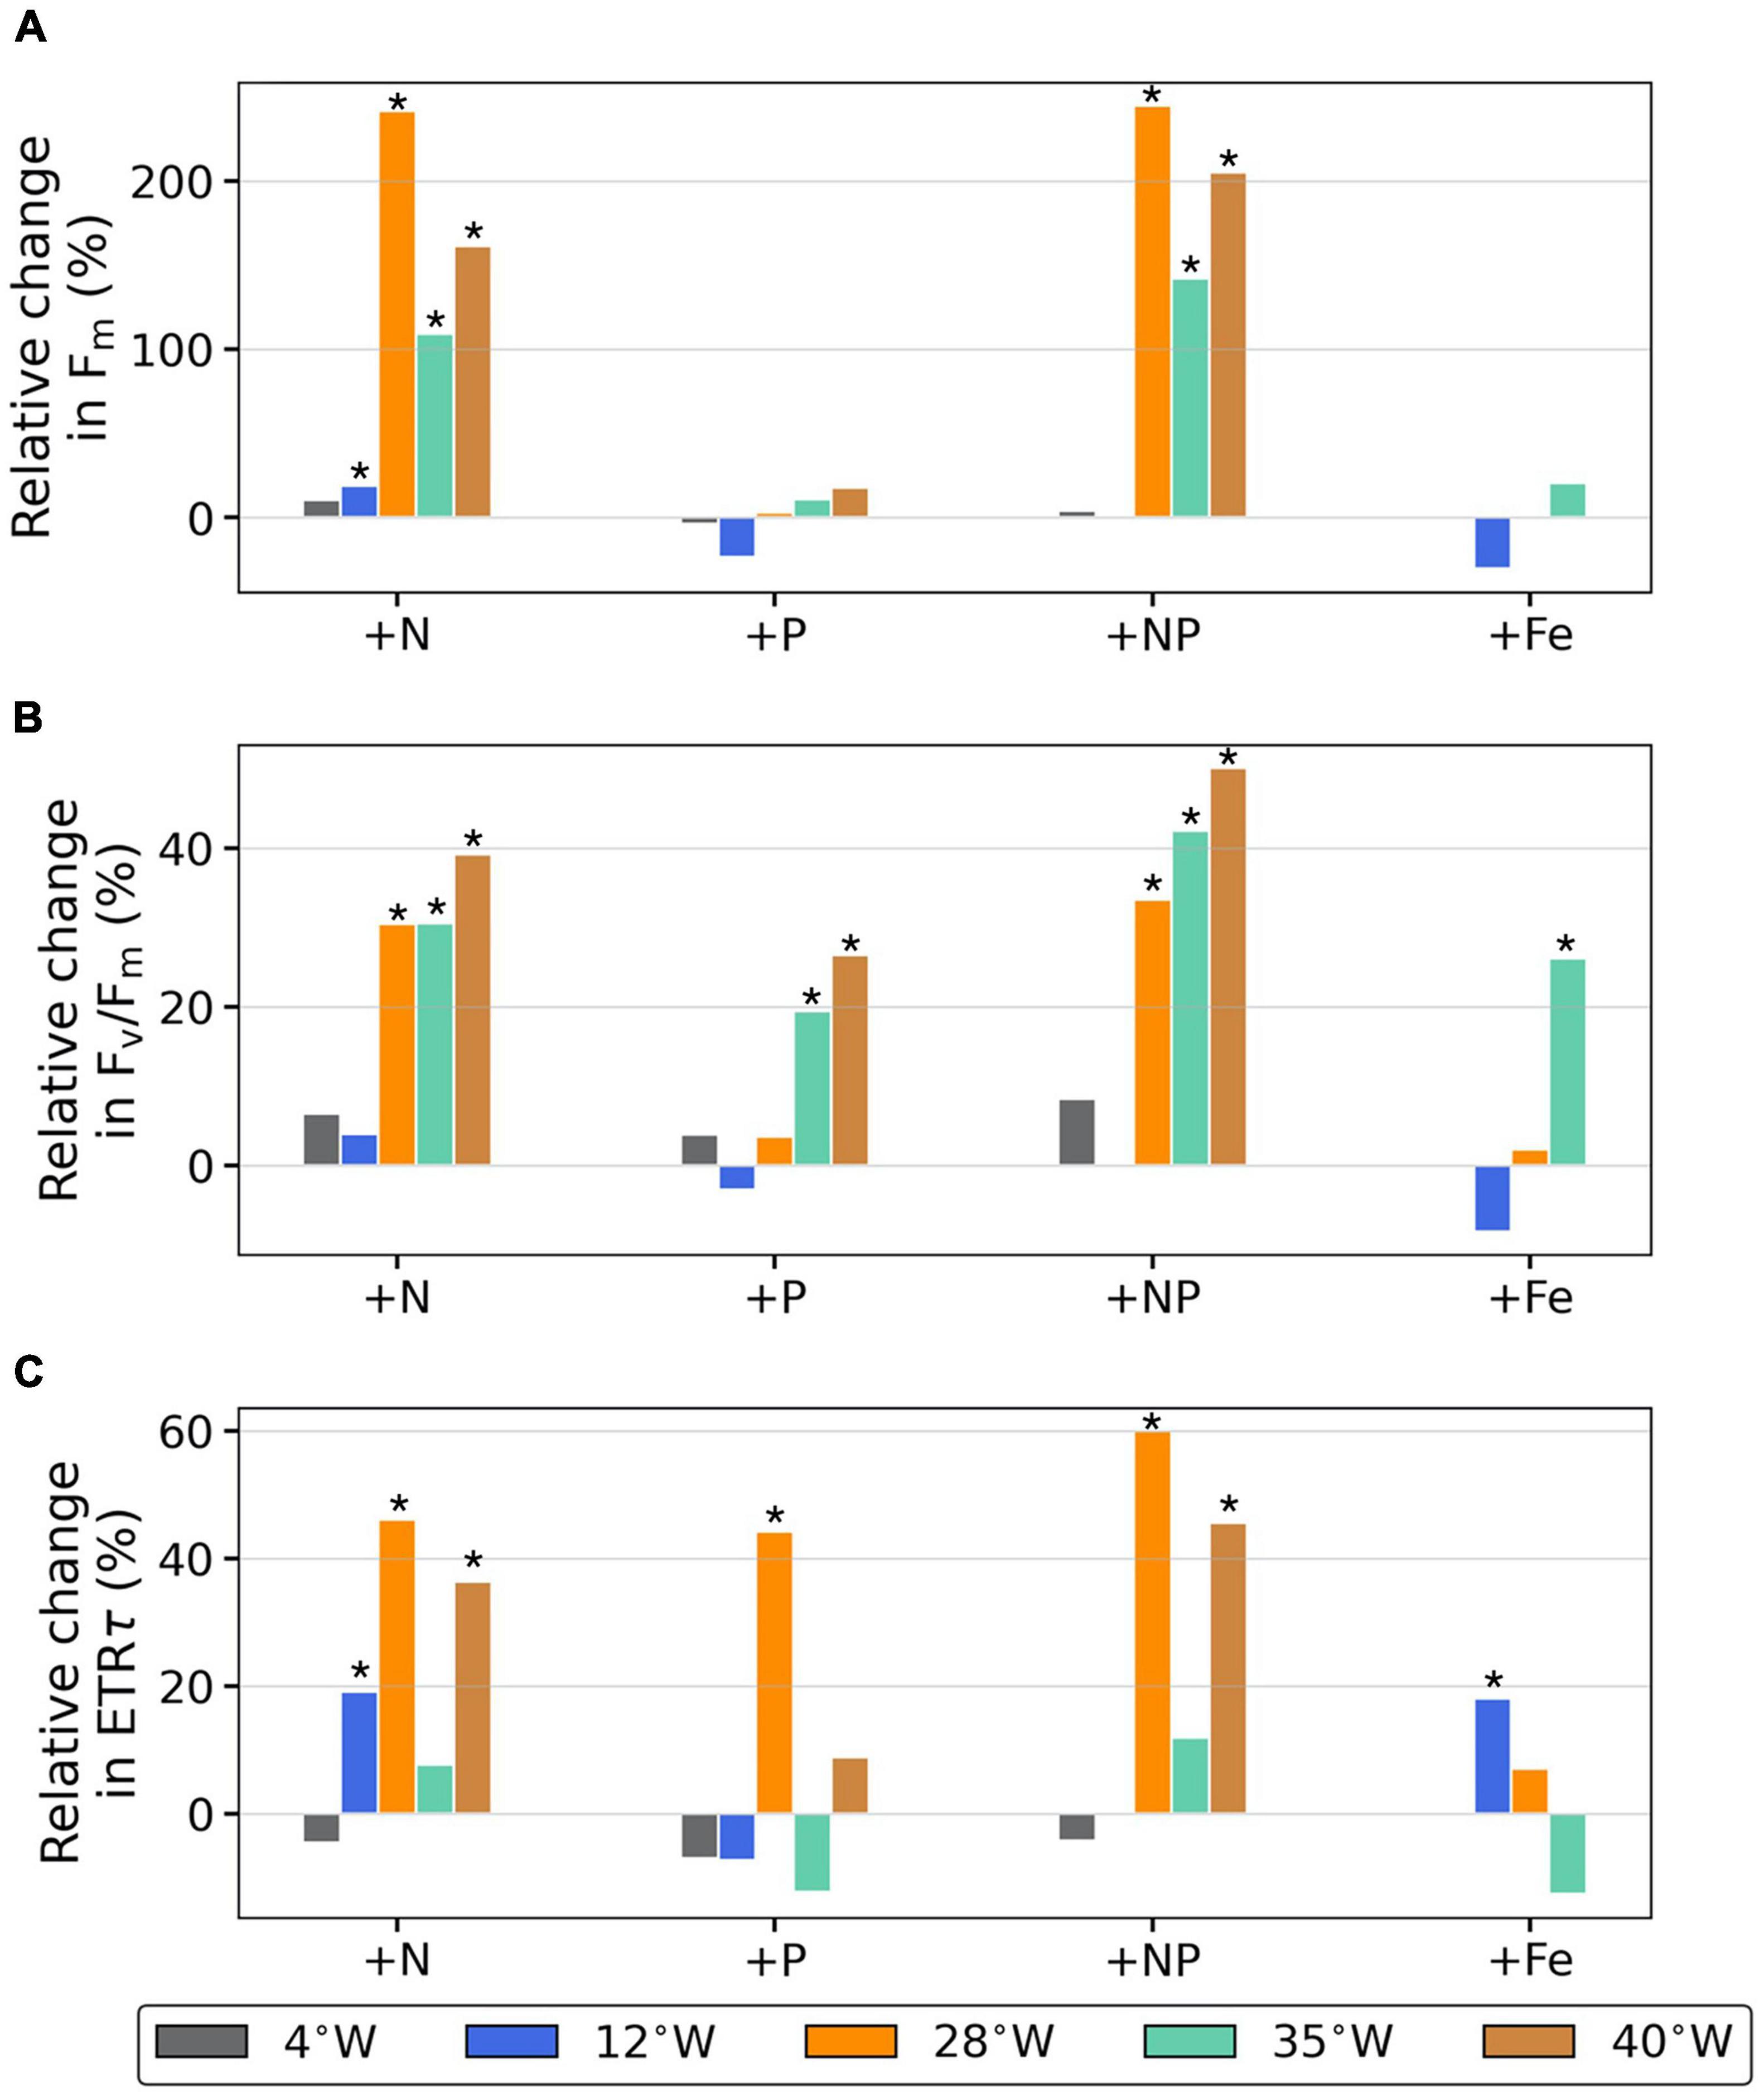
Figure 6. Relative changes in photophysiology 24 h after nutrient amendment. (A) Fm, (B) Fv/Fm, and (C) ETRτ. Treatments included amendment with, nitrate (+N), phosphate (+P), nitrate and phosphate combined (+NP) and iron (+Fe). Each bar color indicates location where NAE was initiated. Change was calculated as for each parameter. Note the NAE at 4°W (gray bars) didn’t include a +Fe treatment, and the NAE 12°W (blue bars) didn’t include a +NP treatment. An * denotes a statistically significant increase in the mean of the treatment compared to the control.
Discussion
Nitrogen Availability Modulates Phytoplankton Dynamics
In this study we hypothesized that across the EA dissolved fixed nitrogen is the primary factor limiting phytoplankton productivity and that the degree of limitation intensifies to the west. In the western EA the cold tongue is absent during the boreal summer, and the sloping thermocline means that an upward nutrient supply from larger depths is needed to bring the cold, nutrient-rich water to the surface. We further hypothesized that such events of upward nutrient supply are associated with TIW related processes, i.e., frontal processes and/or intense vertical mixing events, and that they are the primary mechanism alleviating this limitation. In effect, we propose that phytoplankton in the EA surface waters “body surf” the infrequent events of upward supply of new nutrients (“waves”), driven by TIWs. In this manner nutrient-limited phytoplankton adjust their photophysiology, enabling them to maintain some degree of steady state growth while waiting for pulses of new nutrients to utilize rapidly, resulting in increased new production.
Overall, we observed significant increases in Chl a and nitrate concentrations across the three upwelling events encountered along the EA compared to the steady-state, non-upwelling, regions (Figures 2, 3). The upwelling of the nutricline as well as the doubling in the average nitrate/phosphate ratio from 1.7 to 3.5 across the upwelling sections may suggest that nitrate was upwelled in a greater proportion in comparison to phosphate. Likewise, across the upwelling sections primary production rates increased significantly (manuscript in prep). The 40% decrease in dawn ETRτ, recorded at saturating irradiances, observed from East to West further supports our hypotheses that nitrogen limits phytoplankton dynamics and that the degree of limitation increases to the west.
Interestingly, however, in the LNLC steady-state sections, we observed photophysiologically competent phytoplankton with high Fv/Fm and photosynthetic turnover rates, low σPSII and ΦT, as well as relativity short fluorescence lifetimes (Figure 3 and Table 1). This apparent disconnection between PSII photophysiology and environmental conditions may suggest that phytoplankton along the Equator are well acclimated to low nitrogen availability and have maintained a state of balanced growth (Parkhill et al., 2001). Likewise, as suggested by Gorbunov and Falkowski (2020) the high Fv/Fm across the steady-state EA sections could reflect the non-linearity between Fv/Fm and growth rates. Moreover, Gorbunov and Falkowski (2020) showed that ETRτ at saturating irradiances is better suited to infer the degree of nitrogen limitation and can be used to quantify the reduction in growth rates and net primary production in nitrogen limited phytoplankton. Following their methodology, we used the average photosynthetic turnover time at dawn measured under saturating irradiance in the eastern steady-state section (∼4,130 s) as our nutrient replete term and the corresponding average value from the western steady-state section (∼6,620 s) as the nitrogen limited term in Eq. 4. From this, we calculated a 70% decrease in growth rates in the western steady-state section as compared to the eastern section. Moreover, this decrease equates to a ∼50% decrease in ΦNPc (Eq. 5), indicating that, as hypothesized, the degree of nitrogen limitation in the EA intensifies to the west.
Additional evidence supporting our hypotheses was the rapid (within 24 h) and significant changes in phytoplankton physiology in response to nutrient amendment. The substantial increases in Fm, and modest increases of Fv/Fm and ETRτ following nitrate amendment (with or without phosphate) corroborates the existence of nitrogen limitation and its intensification to the west (Figure 6 and Supplementary Figure 1). Furthermore, the 40–60% increase in maximum ETRτ values following the addition of nitrate (Figure 6C) reflected a 60–70% reduction in growth rates in the control treatment, which is in good agreement with the 70% reduction in growth rates due to nitrogen stress estimated from the underway ETRτ measurements above. Likewise, the 100–200% increases in Fm in the western NAEs (Figure 6A) corresponds as well with this postulation of a reduction in growth. The exception to this general pattern is the NAE at 35°W in which the responses in Fm and ETRτ were either small or lacking altogether (Figure 6 and Supplementary Figure 1). This NAE was conducted in uw3, where nitrate levels were much higher than in the surrounding waters. In essence, this NAE further highlights the importance of TIW related processes in relieving nitrogen limitation.
While nitrogen is the proximal limiting factor as we show, in certain conditions a degree of co-limitation may develop (Davey et al., 2008; Moore et al., 2008). At 28°W the addition of phosphate resulted in a similar increase in ETRτ as the addition of nitrate and the combination of the two resulted in an even greater increase (Figure 6C). However, this is not reflected in the response of Fm or in Fv/Fm to phosphate addition (Figures 6A,B). This NAE was initiated in uw2 where surface nitrate concentrations increased slightly (Figure 2C). As such we suggest that the relative relief from nitrogen limitation and increased growth disrupted the balanced growth. Phosphate was then needed to promote physiological adjustments to the rapid growth and nutrient utilization, resulting in a co-limitation in this section.
The changes we observed in response to nitrate amendment align well with previous nutrient addition experiments conducted in the North and South Atlantic subtropical gyres where nitrogen was found to be the limiting factor as well (Moore et al., 2008, 2013).
Additional Environmental Factors That May Affect Phytoplankton Dynamics
Counterintuitively, however, along the upwelling sections, where Chl a and primary production increased (manuscript in prep.), PSII photosynthetic competency was significantly reduced, i.e., very low Fv/Fm, high σPSII and ΦT and long fluorescence lifetimes (Figure 3 and Table 1). What then causes this discrepancy between the photophysiological status and the Chl a concentration and productivity in the upwelling sections? In addressing this issue, we will focus on uw1 specifically.
At first, the photophysiological data alone would suggest that phytoplankton are limited by iron. The effects of iron limitation on phytoplankton photophysiology, growth and production are well documented in the literature (Behrenfeld and Kolber, 1999; Schuback et al., 2015; Strzepek et al., 2019; Sherman et al., 2020), and align with our underway data along the upwelling sections. In addition, the pillared dial cycle of Fv/Fm (Figure 4B), with significant night-time decreases along uw1 (35%), resembles the diel cycle observed by Behrenfeld and Kolber (1999) in the LNLC iron limited South Pacific subtropical gyre dominated by cyanobacteria. In contrast, the diel cycle across the EA steady-state sections, with minor nighttime Fv/Fm decreases (<10%) resembles Behrenfeld and Kolber’s data collected in the North and South Atlantic subtropical gyres. Behrenfeld and Kolber (1999) argued that the unique diel cycle seen in the Southern Pacific, but not in the Atlantic Ocean, was the result of iron limitation effecting the fluorescence signature of state transitions.
This current study didn’t measure iron concentrations, nor maintain trace metals clean methodology, preventing us from fully ruling out iron-limitation across the upwelling sections. Nonetheless, the argument for iron limitation in the EA is difficult to defend. The Atlantic Ocean is not considered iron limited, including in its lower latitudes (Moore et al., 2013). Aeolian deposition of iron along the Equator ranges between 10 and 100 mg m–2 yr–1, an order of magnitude or two higher than in the Pacific (Duce and Tindale, 1991). While in situ iron concentration measurements are sparse at the Equator, data from AMT cruises have shown that iron levels in the region are ∼3–6 times higher than the global dissolved iron mean surface concentration (Bowie et al., 2002). Moreover, values along the Equator are 6–10 times higher than in situ iron concentrations measured in the South Pacific subtropical gyre (Bonnet et al., 2008). Here, we acknowledge the fact that during the 12°W NAE, we observed a 20% increase in ETRτ in response to iron amendment, which was on par with the response to nitrate amendment (Figure 6C). While ETRτ did increase, Fm and Fv/Fm decreased (Figures 6A,B). This NAE was conducted at the outskirts of the uw1 core where Chl a was high, while ambient nitrate levels were low and photophysiology was very impaired (Figures 2, 3). These trends resemble the response to the addition of phosphate in uw2 discussed above and could indicate that although iron is considered replete in this region as shown, a shift toward iron co-limiting phytoplankton could occur following the utilization of upwelled nitrogen which disrupts the balanced growth.
While iron co-limitation might occur when nitrogen is upwelled and rapidly utilized, it still does not fully explain the overall discrepancy between the impaired photophysiology and growth/production. We therefore hypothesize that the seemingly impaired photophysiology reflects both an imprint of the underlying dominant cyanobacterial community and their light-history.
First, let us consider the decline in Fv/Fm across the upwelling sections. For this, it is critical we highlight an inherent issue in variable fluorescence measurements in cyanobacteria dominated communities. Due to a spectral overlap between the fluorescence bands of Chl a and phycobilins, in particular phycocyanin and allophycocyanin, the contribution of phycobilisome fluorescence to F0 is nontrivial. Campbell et al. (1996) showed that F0 increases as the ratio of phycocyanin/Chl a increases. This overestimation of F0 causes a significant underestimation of Fv/Fm, particularly in healthy, nutrient-replete cells (Campbell et al., 1998). In our current study, F0 along uw1 increased disproportionately more than Fm, resulting in the apparent decline of Fv/Fm (Table 1).
More critically, at uw1 the stratified steady-state structure of the water column broke down and the DCM reached the surface (Figure 2D). This exposed low-light acclimated, nitrogen-replete cells from the DCM to high surface irradiances. Across uw1 at dawn the light saturation parameter, Ek, averaged 159 ± 71 μmol photons m–2 s–1, 25% lower than the steady-state EK average of 214 ± 55 μmol photons m–2 s–1 (ρ < 0.05). In addition, high σPSII and low photosynthetic turnover rates across the upwelling sections (Figure 3 and Table 1) are typically associated with low-light acclimated phytoplankton (Gorbunov and Falkowski, 2020). This low-light acclamation also aligns with the stronger midday activation of photoprotective mechanisms (increased ΦT, decreased Fv/Fm and σPSII) observed across uw1 in comparison to the steady-state (Figure 4 and Table 1). This activation also occurred earlier in the day (∼1–2 h) along uw1 (Figure 4), further supporting the notion that these low-light acclimated communities need to respond rapidly to the high irradiance they are exposed to upon upwelling. Additionally, the 35% decrease in Fv/Fm during the night across uw1 compared to a minor decrease across the steady-state (<10%) (Figure 4B) indicates a greater degree of state-transitions in uw1. State transitions, which redistribute absorbed energy between PSII and PSI (Van Thor et al., 1998) have been suggested to play an important role in cyanobacterial acclimation to low-light (Mullineaux and Emlyn-Jones, 2005).
Summary
Combined, our results strongly suggest that dissolved nitrogen is the primary limiting nutrient for phytoplankton across the EA in the boreal summer and that TIW related processes are critical to its supply and ensuing new production. The agreement between underway measurements in and out of upwelling sections as well as shipboard nutrient additions showed that limitation by nitrate leads to a decrease of ∼70% in growth rates that can be recovered rapidly (<24 h), particularly in the western section. Overall, phytoplankton are able to acclimate to this limitation by balancing their low growth rate and photophysiology while they wait for events that uplift the nutricline and inject new nitrogen to the surface that can be rapidly assimilated to fuel increased growth and primary production (i.e., “body surf”). Moreover, the apparent uncoupling of photophysiology and growth/production across the upwelling sections highlights the notion that as phytoplankton rapidly “body surf” the nitrogen “waves,” they must also employ efficient mechanisms to cope with the inherently more variable and saturating light levels seen in turbulent water columns. This biological, “body surfing” strategy is almost certainly ubiquitous across the low nutrient, low chlorophyll regions of the tropical and sub-tropical oceans.
Data Availability Statement
The datasets presented in this study can be found in online repositories. The names of the repository/repositories and accession number(s) can be found below: SeaWiFS Bio-optical Archive and Storage System (SeaBASS). https://seabass.gsfc.nasa.gov/experiment/TRATLEQ1/ and DOI:10.5067/SeaBASS/TRATLEQ1/DATA001.
Author Contributions
JS, AS, AF-C, RK, and PB collected all physical, chemical, and biological data onboard the TRATLEQ I cruise. JS, MG, and PF processed and analyzed the photophysiological data. AS and AF-C analyzed the nutrient data. JS wrote the first draft of the manuscript. All authors contributed to data interpretation and synthesis through discussion and comments during manuscript preparation and writing.
Funding
This study was supported by the NASA Ocean Biology and Biogeochemistry Program (grants NNX16AT54G and 80NSSC18K1416 to MG and PF and 80NSSC21K0439 to AS) and EU H2020 under grant agreement 817578 TRIATLAS project. JS was supported by a graduate fellowship from the Department of Marine and Coastal Sciences at Rutgers University. AS was also funded by the Climate Center, Climate and Life Fellowship of Lamont-Doherty Earth Observatory and NSF Grant OCE-1737128. RK also acknowledges support via a “Make Our Planet Great Again” grant of the French National Research Agency within the “Programme d’Investissements d’Avenir,” reference “ANR-19-MPGA-0012.”
Conflict of Interest
The authors declare that the research was conducted in the absence of any commercial or financial relationships that could be construed as a potential conflict of interest.
Publisher’s Note
All claims expressed in this article are solely those of the authors and do not necessarily represent those of their affiliated organizations, or those of the publisher, the editors and the reviewers. Any product that may be evaluated in this article, or claim that may be made by its manufacturer, is not guaranteed or endorsed by the publisher.
Acknowledgments
The authors thank the captain and crew of the R/V METEOR during the TRATLEQ I cruise. The authors also thank Ben Ramcharitar for his assistance in the fieldwork and subsequent laboratory analysis and Eric Achterberg for the analysis of the nutrient samples at GEOMAR.
Supplementary Material
The Supplementary Material for this article can be found online at: https://www.frontiersin.org/articles/10.3389/fmars.2021.814663/full#supplementary-material
References
Athie, G., and Marin, F. (2008). Cross-equatorial structure and temporal modulation of intraseasonal variability at the surface of the Tropical Atlantic Ocean. J. Geophys. Res. 113:C08020. doi: 10.1029/2007JC004332
Behrenfeld, M. J., and Kolber, Z. S. (1999). Widespread iron limitation of phytoplankton in the south pacific ocean. Science 283, 840–843. doi: 10.1126/science.283.5403.840
Behrenfeld, M. J., Worthington, K., Sherrell, R. M., Chavez, F. P., Strutton, P., McPhaden, M., et al. (2006). Controls on tropical Pacific Ocean productivity revealed through nutrient stress diagnostics. Nature 442, 1025–1028. doi: 10.1038/nature05083
Bibby, T. S., Gorbunov, M. Y., Wyman, K. W., and Falkowski, P. G. (2008). Photosynthetic community responses to upwelling in mesoscale eddies in the subtropical North Atlantic and Pacific Oceans. Deep Sea Res. II Top. Stud. Oceanogr. 55, 1310–1320. doi: 10.1016/j.dsr2.2008.01.014
Bonnet, S., Guieu, C., Bruyant, F., Prášil, O., Van Wambeke, F., Raimbault, P., et al. (2008). Nutrient limitation of primary productivity in the Southeast Pacific (BIOSOPE cruise). Biogeosciences 5, 215–225. doi: 10.5194/bg-5-215-2008
Bowie, A. R., Whitworth, D. J., Achterberg, E. P., Mantoura, R. F. C., and Worsfold, P. J. (2002). Biogeochemistry of Fe and other trace elements (Al, Co, Ni) in the upper Atlantic Ocean. Deep Sea Res. I Oceanogr. Res. Pap. 49, 605–636. doi: 10.1016/S0967-0637(01)00061-9
Brody, S. S. (2002). Fluorescence lifetime, yield, energy transfer and spectrum in photosynthesis, 1950-1960. Photosynth. Res. 73, 127–132. doi: 10.1023/A:1020405921105
Brody, S. S., and Rabinowitch, E. (1957). Excitation Lifetime of Photosynthetic Pigments in vitro and in vivo. Science 125:555. doi: 10.1126/science.125.3247.555
Butler, W. L. (1978). Energy distribution in the photochemical apparatus of photosynthesis. Annu. Rev. Plant Physiol. 29, 345–378. doi: 10.1146/annurev.pp.29.060178.002021
Butler, W. L., and Strasser, R. J. (1977). Tripartite model for the photochemical apparatus of green plant photosynthesis. Proc. Natl. Acad. Sci. U. S. A. 74, 3382–3385. doi: 10.1073/pnas.74.8.3382
Campbell, D., Bruce, D., Carpenter, C., Gustafsson, P., and Öquist, G. (1996). Two forms of the photosystem II D1 protein alter energy dissipation and state transitions in the cyanobacterium Synechococcus sp. PCC 7942. Photosynth. Res. 47, 131–144. doi: 10.1007/BF00016176
Campbell, D., Hurry, V., Clarke, A. K., Gustafsson, P., and Öquist, G. (1998). Chlorophyll Fluorescence Analysis of Cyanobacterial Photosynthesis and Acclimation. Microbiol. Mol. Biol. Rev. 62, 667–683. doi: 10.1128/mmbr.62.3.667-683.1998
Cetinić, I., Poulton, N., and Slade, W. H. (2016). Characterizing the phytoplankton soup: pump and plumbing effects on the particle assemblage in underway optical seawater systems. Opt. Express 24:20703. doi: 10.1364/oe.24.020703
Chelton, D. B., Wentz, F. J., Gentemann, C. L., de Szoeke, R. A., and Schlax, M. G. (2000). Satellite microwave SST observations of transequatorial tropical instability waves. Geophys. Res. Lett. 27, 1239–1242. doi: 10.1029/1999GL011047
Cox, M. D. (1980). Generation and propagation of 30-day waves in a numerical model of the Pacific. J. Phys. Oceanogr. 10, 1168–1186.
Davey, M., Tarran, G. A., Mills, M. M., Ridame, C., Geider, R. J., and LaRoche, J. (2008). Nutrient limitation of picophytoplankton photosynthesis and growth in the tropical North Atlantic. Limnol. Oceanogr. 53, 1722–1733. doi: 10.4319/lo.2008.53.5.1722
Duce, R. A., and Tindale, N. W. (1991). Atmospheric transport of iron and its deposition in the ocean. Limnol. Oceanogr. 36, 1715–1726. doi: 10.4319/lo.1991.36.8.1715
Dugdale, R. C., and Goering, J. J. (1967). Uptake of new and regenerated forms of nitrogen in primary productivity. Limnol. Oceanogr. 12, 196–206. doi: 10.4319/lo.1967.12.2.0196
Emery, W. J., Talley, L. D., and Pickard, G. L. (2006). Descriptive Physical Oceanography. Boston: Academic Press
Enderlein, J., and Erdmann, R. (1997). Fast fitting of multi-exponential decay curves. Opt. Commun. 134, 371–378. doi: 10.1016/S0030-4018(96)00384-7
Evans, W., Strutton, P. G., and Chavez, F. P. (2009). Impact of tropical instability waves on nutrient and chlorophyll distributions in the equatorial Pacific. Deep Sea Res. I Oceanogr. Res. Pap. 56, 178–188. doi: 10.1016/J.DSR.2008.08.008
Falkowski, P. G. (1994). The role of phytoplankton photosynthesis in global biogeochemical cycles. Photosynth. Res. 39, 235–258. doi: 10.1007/BF00014586
Falkowski, P. G., Greene, R., and Geider, R. (1992). Physiological limitations on phytoplankton productivity in the ocean. Oceanography 5, 84–91. doi: 10.5670/oceanog.1992.14
Falkowski, P. G., Lin, H., and Gorbunov, M. Y. (2017). What limits photosynthetic energy conversion efficiency in nature? Lessons from the oceans. Philos. Trans. R. Soc. B Biol. Sci. 372:20160376. doi: 10.1098/rstb.2016.0376
Falkowski, P. G., and Raven, J. A. (2014). Aquatic Photosynthesis, 2nd Edn. Princeton: Princeton University Press. doi: 10.1515/9781400849727
Gorbunov, M. Y., and Falkowski, P. G. (2020). Using chlorophyll fluorescence kinetics to determine photosynthesis in aquatic ecosystems. Limnol. Oceanogr. 66, 1–13. doi: 10.1002/lno.11581
Gorbunov, M. Y., and Falkowski, P. G. (2021). Using Chlorophyll Fluorescence to Determine the Fate of Photons Absorbed by Phytoplankton in the World’s Oceans. Annu. Rev. Mar. Sci. doi: 10.1146/annurev-marine-032621-122346 [Online ahead of print].
Gorbunov, M. Y., Falkowski, P. G., and Kolber, Z. S. (2000). Measurement of photosynthetic parameters in benthic organisms in situ using a SCUBA-based fast repetition rate fluorometer. Limnol. Oceanogr. 45, 242–245.
Gorbunov, M. Y., Kolber, Z. S., Lesser, M. P., and Falkowski, P. G. (2001). Photosynthesis and photoprotection in symbiotic corals. Limnol. Oceanogr. 46, 75–85.
Greene, R. M., Kolber, Z. S., Swift, D. G., Tindale, N. W., and Falkowski, P. G. (1994). Physiological limitation of phytoplankton photosynthesis in the eastern equatorial Pacific determined from variability in the quantum yield of fluorescence. Limnol. Oceanogr. 39, 1061–1074. doi: 10.4319/lo.1994.39.5.1061
Grodsky, S. A., Carton, J. A., and McClain, C. R. (2008). Variability of upwelling and chlorophyll in the equatorial Atlantic. Geophys. Res. Lett. 35:L03610. doi: 10.1029/2007GL032466
Kerkar, A. U., Tripathy, S. C., Minu, P., Baranval, N., Sabu, P., Patra, S., et al. (2020). Variability in primary productivity and bio-optical properties in the Indian sector of the Southern Ocean during an austral summer. Polar Biol. 43, 1469–1492. doi: 10.1007/s00300-020-02722-2
Ko, E., Gorbunov, M. Y., Jung, J., Joo, H. M., Lee, Y., Cho, K. H., et al. (2020). Effects of Nitrogen Limitation on Phytoplankton Physiology in the Western Arctic Ocean in Summer. J. Geophys. Res. Oceans 125:e2020JC016501. doi: 10.1029/2020JC016501
Kolber, Z. S., Prášil, O., and Falkowski, P. G. (1998). Measurements of variable chlorophyll fluorescence using fast repetition rate techniques: defining methodology and experimental protocols. Biochim. Biophys. Acta 1367, 88–106. doi: 10.1016/S0005-2728(98)00135-2
Lakowicz, J. R. (2006). Principles of Fluorescence Spectroscopy, 3rd Edn. Boston: Springer. doi: 10.1007/978-0-387-46312-4
Laws, E. A., D’Sa, E., and Naik, P. (2011). Simple equations to estimate ratios of new or export production to total production from satellite-derived estimates of sea surface temperature and primary production. Limnol. Oceanogr. Methods 9, 593–601. doi: 10.4319/lom.2011.9.593
Lee, T., Lagerloef, G., Kao, H. Y., McPhaden, M. J., Willis, J., and Gierach, M. M. (2014). The influence of salinity on tropical Atlantic instability waves. J. Geophys. Res. Oceans 119, 8375–8394. doi: 10.1002/2014JC010100
Ley, A. C., and Mauzerall, D. C. (1982). Absolute absorption cross-sections for Photosystem II and the minimum quantum requirement for photosynthesis in Chlorella vulgaris. Biochim. Biophys. Acta 680, 95–106. doi: 10.1016/0005-2728(82)90320-6
Lin, H., Kuzminov, F. I., Park, J., Lee, S., Falkowski, P. G., and Gorbunov, M. Y. (2016). The fate of photons absorbed by phytoplankton in the global ocean. Science 351, 264–267. doi: 10.1126/science.aab2213
Longhurst, A. (1993). Seasonal cooling and blooming in tropical oceans. Deep Sea Res. I Oceanogr. Res. Pap. 40, 2145–2165. doi: 10.1016/0967-0637(93)90095-K
Menkes, C. E., Kennan, S. C., Flament, P., Dandonneau, Y., Masson, S., Biessy, B., et al. (2002). A whirling ecosystem in the equatorial Atlantic. Geophys. Res. Lett. 29, 3–6. doi: 10.1029/2001GL014576
Mills, M. M., Ridame, C., Davey, M., La Roche, J., and Geider, R. J. (2004). Iron and phosphorus co-limit nitrogen fixation in the eastern tropical North Atlantic. Nature 429, 292–294. doi: 10.1038/nature02550
Moore, C. M., Mills, M. M., Arrigo, K. R., Berman-Frank, I., Bopp, L., Boyd, P. W., et al. (2013). Processes and patterns of oceanic nutrient limitation. Nat. Geosci. 6, 701–710. doi: 10.1038/ngeo1765
Moore, C. M., Mills, M. M., Langlois, R., Milne, A., Achterberg, E. P., la Roche, J., et al. (2008). Relative influence of nitrogen and phosphorus availability on phytoplankton physiology and productivity in the oligotrophic sub-tropical North Atlantic Ocean. Limnol. Oceanogr. 53, 291–305. doi: 10.4319/lo.2008.53.1.0291
Moum, J. N., Lien, R. C., Perlin, A., Nash, J. D., Gregg, M. C., and Wiles, P. J. (2009). Sea surface cooling at the Equator by subsurface mixing in tropical instability waves. Nat. Geosci. 2, 761–765. doi: 10.1038/ngeo657
Mullineaux, C. W., and Emlyn-Jones, D. (2005). State transitions: an example of acclimation to low-light stress. J. Exp. Bot. 56, 389–393. doi: 10.1093/jxb/eri064
Parkhill, J., Maillet, G., and Cullen, J. J. (2001). Fluorescence based maximal quantum yield for ps2 as a diagnostic of nutrient stress. J. Phycol. 37, 517–529. doi: 10.1046/j.1529-8817.2001.037004517.x
Pérez, V., Fernández, E., Marañón, E., Serret, P., and García-Soto, C. (2005). Seasonal and interannual variability of chlorophyll a and primary production in the Equatorial Atlantic: in situ and remote sensing observations. J. Plankton Res. 27, 189–197. doi: 10.1093/plankt/fbh159
Philander, S. G. H. (1978). Instabilities of zonal equatorial currents, 2. J. Geophys. Res. Oceans 83, 3679–3682.
Radenac, M.-H., Jouanno, J., Tchamabi, C. C., Awo, M., Bourlès, B., Arnault, S., et al. (2020). Physical drivers of the nitrate seasonal variability in the Atlantic cold tongue. Biogeosciences 17, 529–545. doi: 10.5194/bg-17-529-2020
Ralph, P. J., and Gademann, R. (2005). Rapid light curves: a powerful tool to assess photosynthetic activity. Aquat. Bot. 82, 222–237. doi: 10.1016/j.aquabot.2005.02.006
Rees, A., Robinson, C., Smyth, T., Aiken, J., Nightingale, P., and Zubkov, M. (2015). 20 Years of the Atlantic Meridional Transect—AMT. Limnol. Oceanogr. Bull. 24, 101–107. doi: 10.1002/LOB.10069
Schuback, N., Schallenberg, C., Duckham, C., Maldonado, M. T., and Tortell, P. D. (2015). Interacting Effects of Light and Iron Availability on the Coupling of Photosynthetic Electron Transport and CO2-Assimilation in Marine Phytoplankton. PLoS One 10:e0133235. doi: 10.1371/journal.pone.0133235
Sherman, J., Gorbunov, M. Y., Schofield, O., and Falkowski, P. G. (2020). Photosynthetic energy conversion efficiency in the West Antarctic Peninsula. Limnol. Oceanogr. 65, 2912–2925. doi: 10.1002/lno.11562
Sidler, W. A. (1994). “Phycobilisome and Phycobiliprotein Structures,” in The Molecular Biology of Cyanobacteria, ed. D. A. Bryant (Netherlands: Springer), 139–216. doi: 10.1007/978-94-011-0227-8_7
Strzepek, R. F., Boyd, P. W., and Sunda, W. G. (2019). Photosynthetic adaptation to low iron, light, and temperature in Southern Ocean phytoplankton. Proc. Natl. Acad. Sci. U. S. A. 116, 4388–4393. doi: 10.1073/pnas.1810886116
Suggett, D. J., Stambler, N., Prášil, O., Kolber, Z., Quigg, A., Vázquez-Dominguez, E., et al. (2009). Nitrogen and phosphorus limitation of oceanic microbial growth during spring in the Gulf of Aqaba. Aquat. Microbial Ecol. 56, 227–239. doi: 10.3354/ame01357
Tuchen, F. P., Brandt, P., Claus, M., and Hummels, R. (2018). Deep Intraseasonal Variability in the Central Equatorial Atlantic. J. Phys. Oceanogr. 48, 2851–2865. doi: 10.1175/JPO-D-18-0059.1
Van Thor, J. J., Mullineaux, C. W., Matthijs, H. C. P., and Hellingwerf, K. J. (1998). Light harvesting and state transitions in cyanobacteria. Bot. Acta 111, 430–443. doi: 10.1111/j.1438-8677.1998.tb00731.x
von Schuckmann, K., Brandt, P., and Eden, C. (2008). Generation of tropical instability waves in the Atlantic Ocean. J. Geophys. Res. Oceans 113:C08034. doi: 10.1029/2007JC004712
Warner, S. J., Holmes, R. M., Hawkins, E. H. M., Hoecker-Martínez, M. S., Savage, A. C., and Moum, J. N. (2018). Buoyant Gravity Currents Released from Tropical Instability Waves. J. Phys. Oceanogr. 48, 361–382. doi: 10.1175/JPO-D-17-0144.1
Keywords: phytoplankton, photophysiology, variable fluorescence, fluorescence lifetimes, Equatorial Atlantic, tropical instability waves (TIWs)
Citation: Sherman J, Subramaniam A, Gorbunov MY, Fernández-Carrera A, Kiko R, Brandt P and Falkowski PG (2022) The Photophysiological Response of Nitrogen-Limited Phytoplankton to Episodic Nitrogen Supply Associated With Tropical Instability Waves in the Equatorial Atlantic. Front. Mar. Sci. 8:814663. doi: 10.3389/fmars.2021.814663
Received: 14 November 2021; Accepted: 20 December 2021;
Published: 11 January 2022.
Edited by:
Jie Xu, University of Macau, Macao SAR, ChinaReviewed by:
Sarat Chandra Tripathy, National Centre for Polar and Ocean Research (NCPOR), IndiaHaimanti Biswas, National Institute of Oceanography, Council of Scientific and Industrial Research (CSIR), India
Copyright © 2022 Sherman, Subramaniam, Gorbunov, Fernández-Carrera, Kiko, Brandt and Falkowski. This is an open-access article distributed under the terms of the Creative Commons Attribution License (CC BY). The use, distribution or reproduction in other forums is permitted, provided the original author(s) and the copyright owner(s) are credited and that the original publication in this journal is cited, in accordance with accepted academic practice. No use, distribution or reproduction is permitted which does not comply with these terms.
*Correspondence: Jonathan Sherman, c2hlcm1hbkBtYXJpbmUucnV0Z2Vycy5lZHU=