 Zhifeng Yu1,2†
 Jingwen Wang1†Yuan Li3
 CK Shum4,5
 Ben Wang1
 Xianqiang He6Huiyan Xu1,2Yuzhuang Xu6Bin Zhou1,2,7*
- 1Institute of Remote Sensing and Earth Sciences, School of Information Science and Technology, Hangzhou Normal University, Hangzhou, China
- 2Zhejiang Provincial Key Laboratory of Urban Wetlands and Regional Change, Hangzhou, China
- 3School of Tourism and Urban & Rural Planning, Zhejiang Gongshang University, Hangzhou, China
- 4Division of Geodetic Science, School of Earth Sciences, The Ohio State University, Columbus, OH, United States
- 5Innovation Academy for Precision Measurement Science and Technology, Chinese Academy of Sciences, Wuhan, China
- 6State Key Laboratory of Satellite Ocean Environment Dynamics, Second Institute of Oceanography, Ministry of Natural Resources, Hangzhou, China
- 7School of Engineering, Hangzhou Normal University, Hangzhou, China
The suspended sediment in water infers water quality, and directly reflects optical properties such as water transparency, turbidity, and water color. Thus, these physical properties provide a viable basis to rigorously retrieve for suspended sediment concentration (SSC) using satellite remote sensing water color measurements in estuaries. The contemporary Ocean and Land Color Instrument (OLCI) on Sentinel-3A, provides more waveband options for remote sensing of water color and an opportunity for retrieval of suspended sediment in estuarine coast. Yet, accurate retrieval of SSC in high turbid waters from OLCI is still challenging due primarily to the high uncertainty of atmospheric correction. Here, we use OLCI images to measure water quality in Hangzhou Bay, and construct a retrieval model of SSC, and cross-validated using Geostationary Ocean Color Imager (GOCI) data. The study shows that: (1) the atmospheric correction algorithm based on ultraviolet wavelengths (UV-AC) can achieve better results for both OLCI and GOCI data, and the overall correction accuracy for OLCI is higher than that for GOCI data; (2) the multi-band index model constructed by using Rrs(Oa16)/Rrs(Oa5) of OLCI data has higher retrieval accuracy and model stability, with R2 is 0.96, MRE is 17.52%, and RMSE is 69.10 mg/L; (3) the spatial distribution of SSC in the study area is complex, mainly showing that the SCC in the top of the bay is larger than the mouth of the bay, and the south shore is larger than the north shore; (4) whe distribution of SSC obtained from retrieving OLCI and GOCI data in general is consistent, with the OLCI SSC estimates with higher accuracy than GOCI data, and the numerical difference between the two retrieval results is more obvious in the ocean with high SSC; and (5) with appropriate atmospheric corrections and retrieval models, OLCI data can be used to estimate improved SSC observables in Hangzhou Bay. We conclude that the SSC retrieval models proposed here provide a good reference method for retrieval of water color observable in Hangzhou Bay coastal estuary.
Introduction
Estuaries and coastal areas are located at the junction of the continent and the coastal ocean, where the interaction of Earth’s atmosphere, hydrosphere, lithosphere, biosphere, and biochemical processes and the feedback they bring are quite complex and covers a wide range of temporal scales (Lyons et al., 1982). As an important water quality parameter of inland and near-shore Class II water, the relevant water color information is directly related to the suspended sediment content in the coastal ocean, including water transparency/turbidity, underwater light field, and water primary productivity, etc. (Liu et al., 2013; Sun et al., 2013; Shi et al., 2015; Gao et al., 2018). Further, improved knowledge of the suspended sediment concentration (SCC) is the key to better understand the natural regulation processes of estuarine and coastal zones.
With the rapid development of nearshore and coastal economies, estuaries have been adversely affected by major human activities and anthropogenic climate changes in recent years (Wu et al., 2018), and water pollution has worsen significantly. The suspended sediment is one of the main optically active substances in the water, and its concentration is directly related to the strength of the water color satellite remote sensing signal. Remote sensing quantitative technology has the advantages of good instantaneous synchronization and a short period of repeated data acquisition. It can greatly improve the acquisition of SSC data in coastal estuary. Therefore, remote sensing observation is an effective approach for obtaining large-scale and long-term observation of water quality/color. The research on remote sensing retrieval of estuarine and coastal SSC is significant for the protection of the surrounding ecological environment and utilization of related sensor data (Chen et al., 2021; Wang et al., 2021). In addition, the corresponding research results can also provide auxiliary decision-making support for government departments to monitor estuary water quality evolution, assess water quality, and manage regional water, which has important theoretical and practical significance.
In recent years, the use of remote sensing satellites to study water color and water environment has been popular. Liu et al. (2013) used small environmental satellite CCD (HJ CCD) images to construct an SSC retrieval model, and they performed relevant atmospheric correction to investigate the applicability of HJ CCD images to estimate SSC in the Hangzhou Bay, China. Peng and Shen (2014) adopted the method of Shen et al. (2010) to retrieve and calculate the radiance at the entrance pupil of Terra/MODIS, FY-3A/MERSI, COMS/GOCI sensors, and obtained the data of remote sensing reflectance (Rrs) and suspended particle concentration. Then, they compared the retrieval results using the Envisat/MERIS retrieval results and performed a correlation analysis. Li et al. (2019) compared 6 atmospheric correction models and 8 suspended matter estimation models based on OLCI data. Then, combined with synchronous sampling data, they selected and analyzed atmospheric correction methods and TSM estimation models suitable for the Hangzhou Bay and OLCI data. Besides, they verified the accuracy and applicability of OLCI data secondary products. Hu et al. (2018) used Geostatic Ocean Color Imager (GOCI) data and in-situ data over Hangzhou Bay, to develop a suitable remote sensing model to quantify SSC of the Hangzhou Bay, and analyzed the impact of ocean tides on SSC retrieval; Shao et al. (2020) combined with in-situ data and remote sensing spectral data in the study area to construct an retrieval model, and they performed cross-validation using the satellite data with known stable results to explore the monitoring ability of the GF-4 satellite on SSC. Blix et al. (2018) studied the derived chlorophyll-a (Chl-a), colored dissolved organic matter (CDOM), and total suspended matter (TSM) in complex waters based on the in-situ measurement data of the Balaton Lake and to verify the feasibility of using S3 OLCI L2 products to monitor optically highly complex shallow lakes. Tuuli et al. (2020) derived an applicable atmospheric correction algorithm based on Sentinel-2/MSI and Sentinel-3/OLCI data, and then they obtained the Baltic lake water quality product through the cross-validation of case-2 optical water quality products and in-situ data. Pahlevan et al. (2021) calculated and analyzed radiometric derivative data from more than 1000 measurement points in freshwater (rivers, lakes, reservoirs) and coastal waters based on Landsat-8 and Sentinel-2 data to perform a global assessment of the applicability of eight state-of-the-art atmospheric correction methods. The above research results show that it is significant to conduct remote sensing monitoring of suspended sediment in estuarine and coastal areas.
In 2016, a new generation of ocean color satellite Sentinel-3A was launched by the European Space Agency, which provides a new data source for remote sensing monitoring of ocean color (see Table 1 for specific parameters). The OLCI sensor retains the band setting of the MERIS sensor, and it adds spectral channels in the blue, red, and near-infrared spectral regions [up to 21 bands, including the band range of 392.5 to 1040 nm (Bi et al., 2018)], thus providing more band options for remote sensing estimation of water color elements. Moreover, since the Sentinel-3B satellite is also equipped with OLCI sensors in 2018, with the cooperation of the two satellites, a scene image can be obtained from OLCI data in less than two days, which greatly improves the time resolution. In addition, the spatial resolution is up to 300 m. Many previous studies have shown that the GOCI water color products launched and put into use in South Korea in 2010 are highly reliable for monitoring the water environment in a complex short time range (Lamquin et al., 2012; Jiang et al., 2015; Liu et al., 2016; Yang, 2016; Sun et al., 2017). Therefore, to evaluate the applicability of OLCI data in remote sensing monitoring of suspended sediment, this study combines the spectral response function of the OLCI sensor, measured spectral data and SSC data, establishes the retrieval model of SSC based on OLCI data, and cross-verifies the retrieval accuracy of OLCI satellite data by using GOCI satellite data. The research results will make up for the low spatial resolution of suspended sediment retrieval from GOCI data and provide a new model and method for the retrieval of suspended sediment from OLCI data in the Hangzhou Bay area.
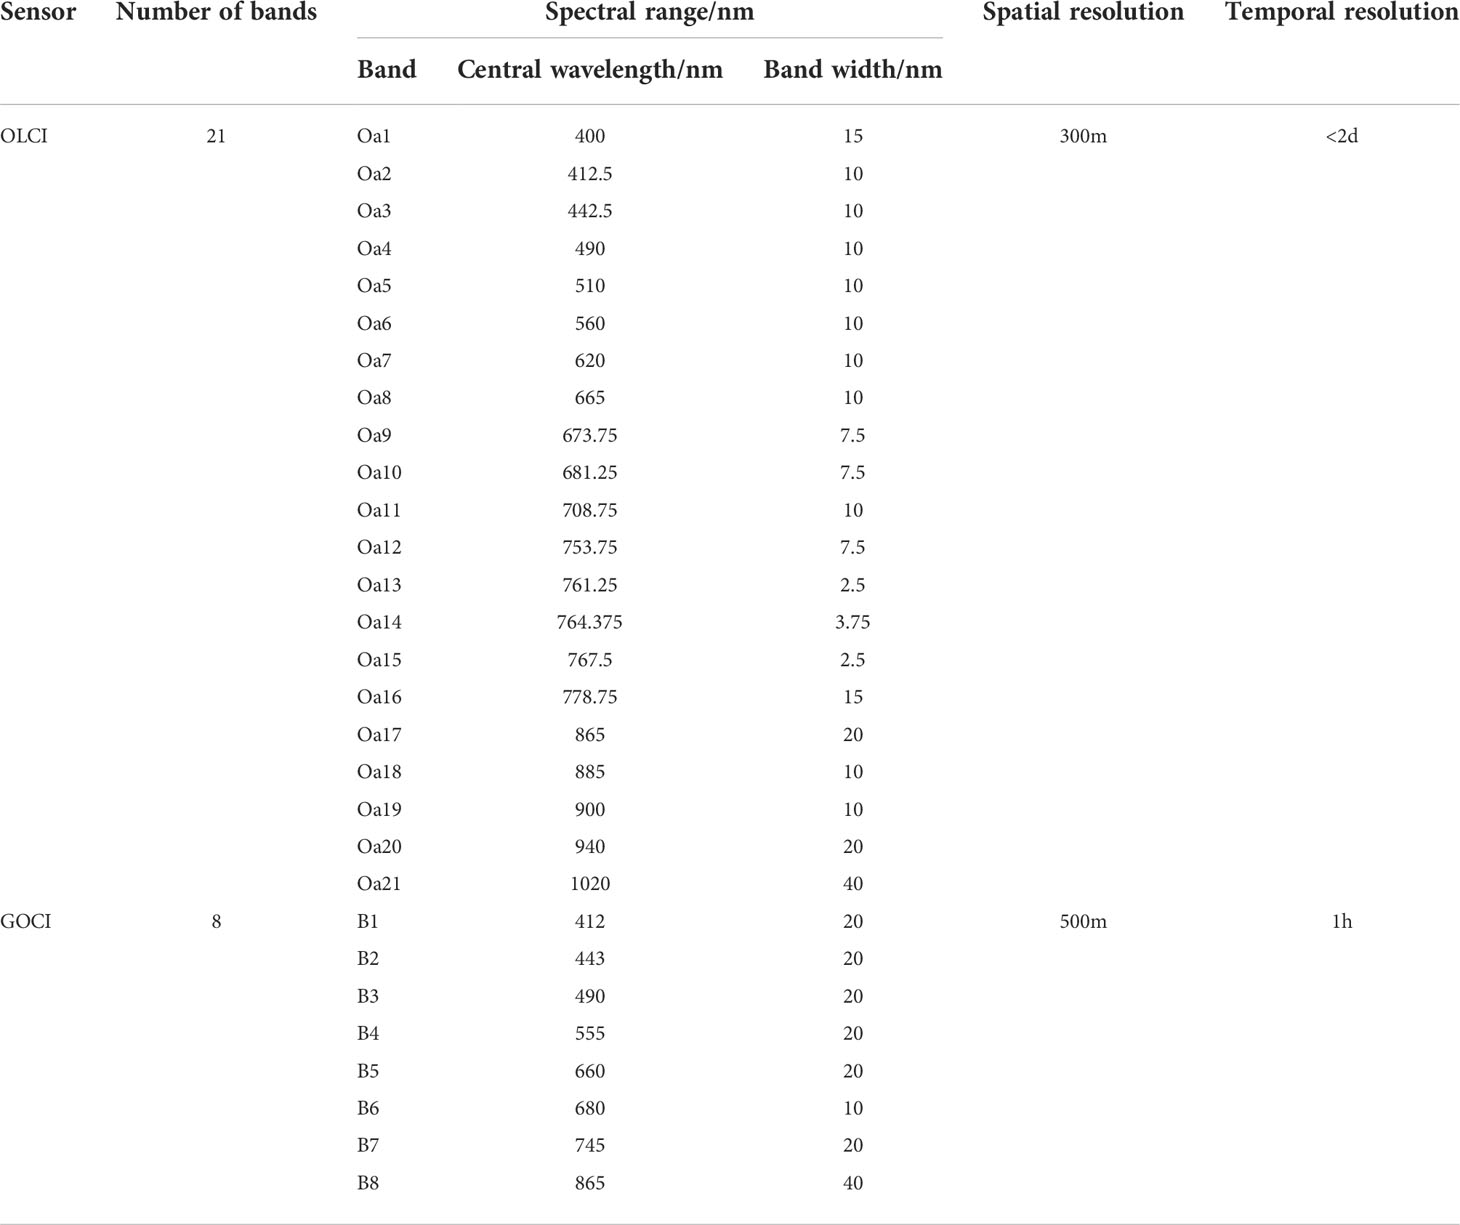
Table 1 Basic parameters of OLCI and GOCI sensors.
Data and methods
Study Area
In this study, Hangzhou Bay, China, is studied as a typical estuarine coast to investigate the remote sensing retrieval of SSC based on OLCI data. Hangzhou Bay is located in the middle section of China’s coastline, in the north of Zhejiang Province, with a trumpet-like shape (Figure 1). The top and the mouth of the bay are about 20 km and 100 km wide respectively, and the maximum water depth is about 10 m. The total water area is about 5000 km2, and the port channel, mudflats, and aquatic resources are abundant. The topography of Hangzhou Bay differs from other places and has special characteristics. Its atypical topography of the funnel-shaped estuary makes the strong tidal action caused by suspended sediment combined with the diluted water of the Yangtze River, which leads to a large amount of sediment accumulated at the south shore of Hangzhou Bay every year (Su and Wang, 1989), thus characterized by high tides, rapid currents, and high sediment content (He et al., 2013). The high SSC has a great impact on the port, so it is crucial to grasp the distribution of SSC in the Hangzhou Bay marine area for making future engineering decisions, understanding regional topographic evolutions, and obtaining the accumulation corrosion rate in the marine area.
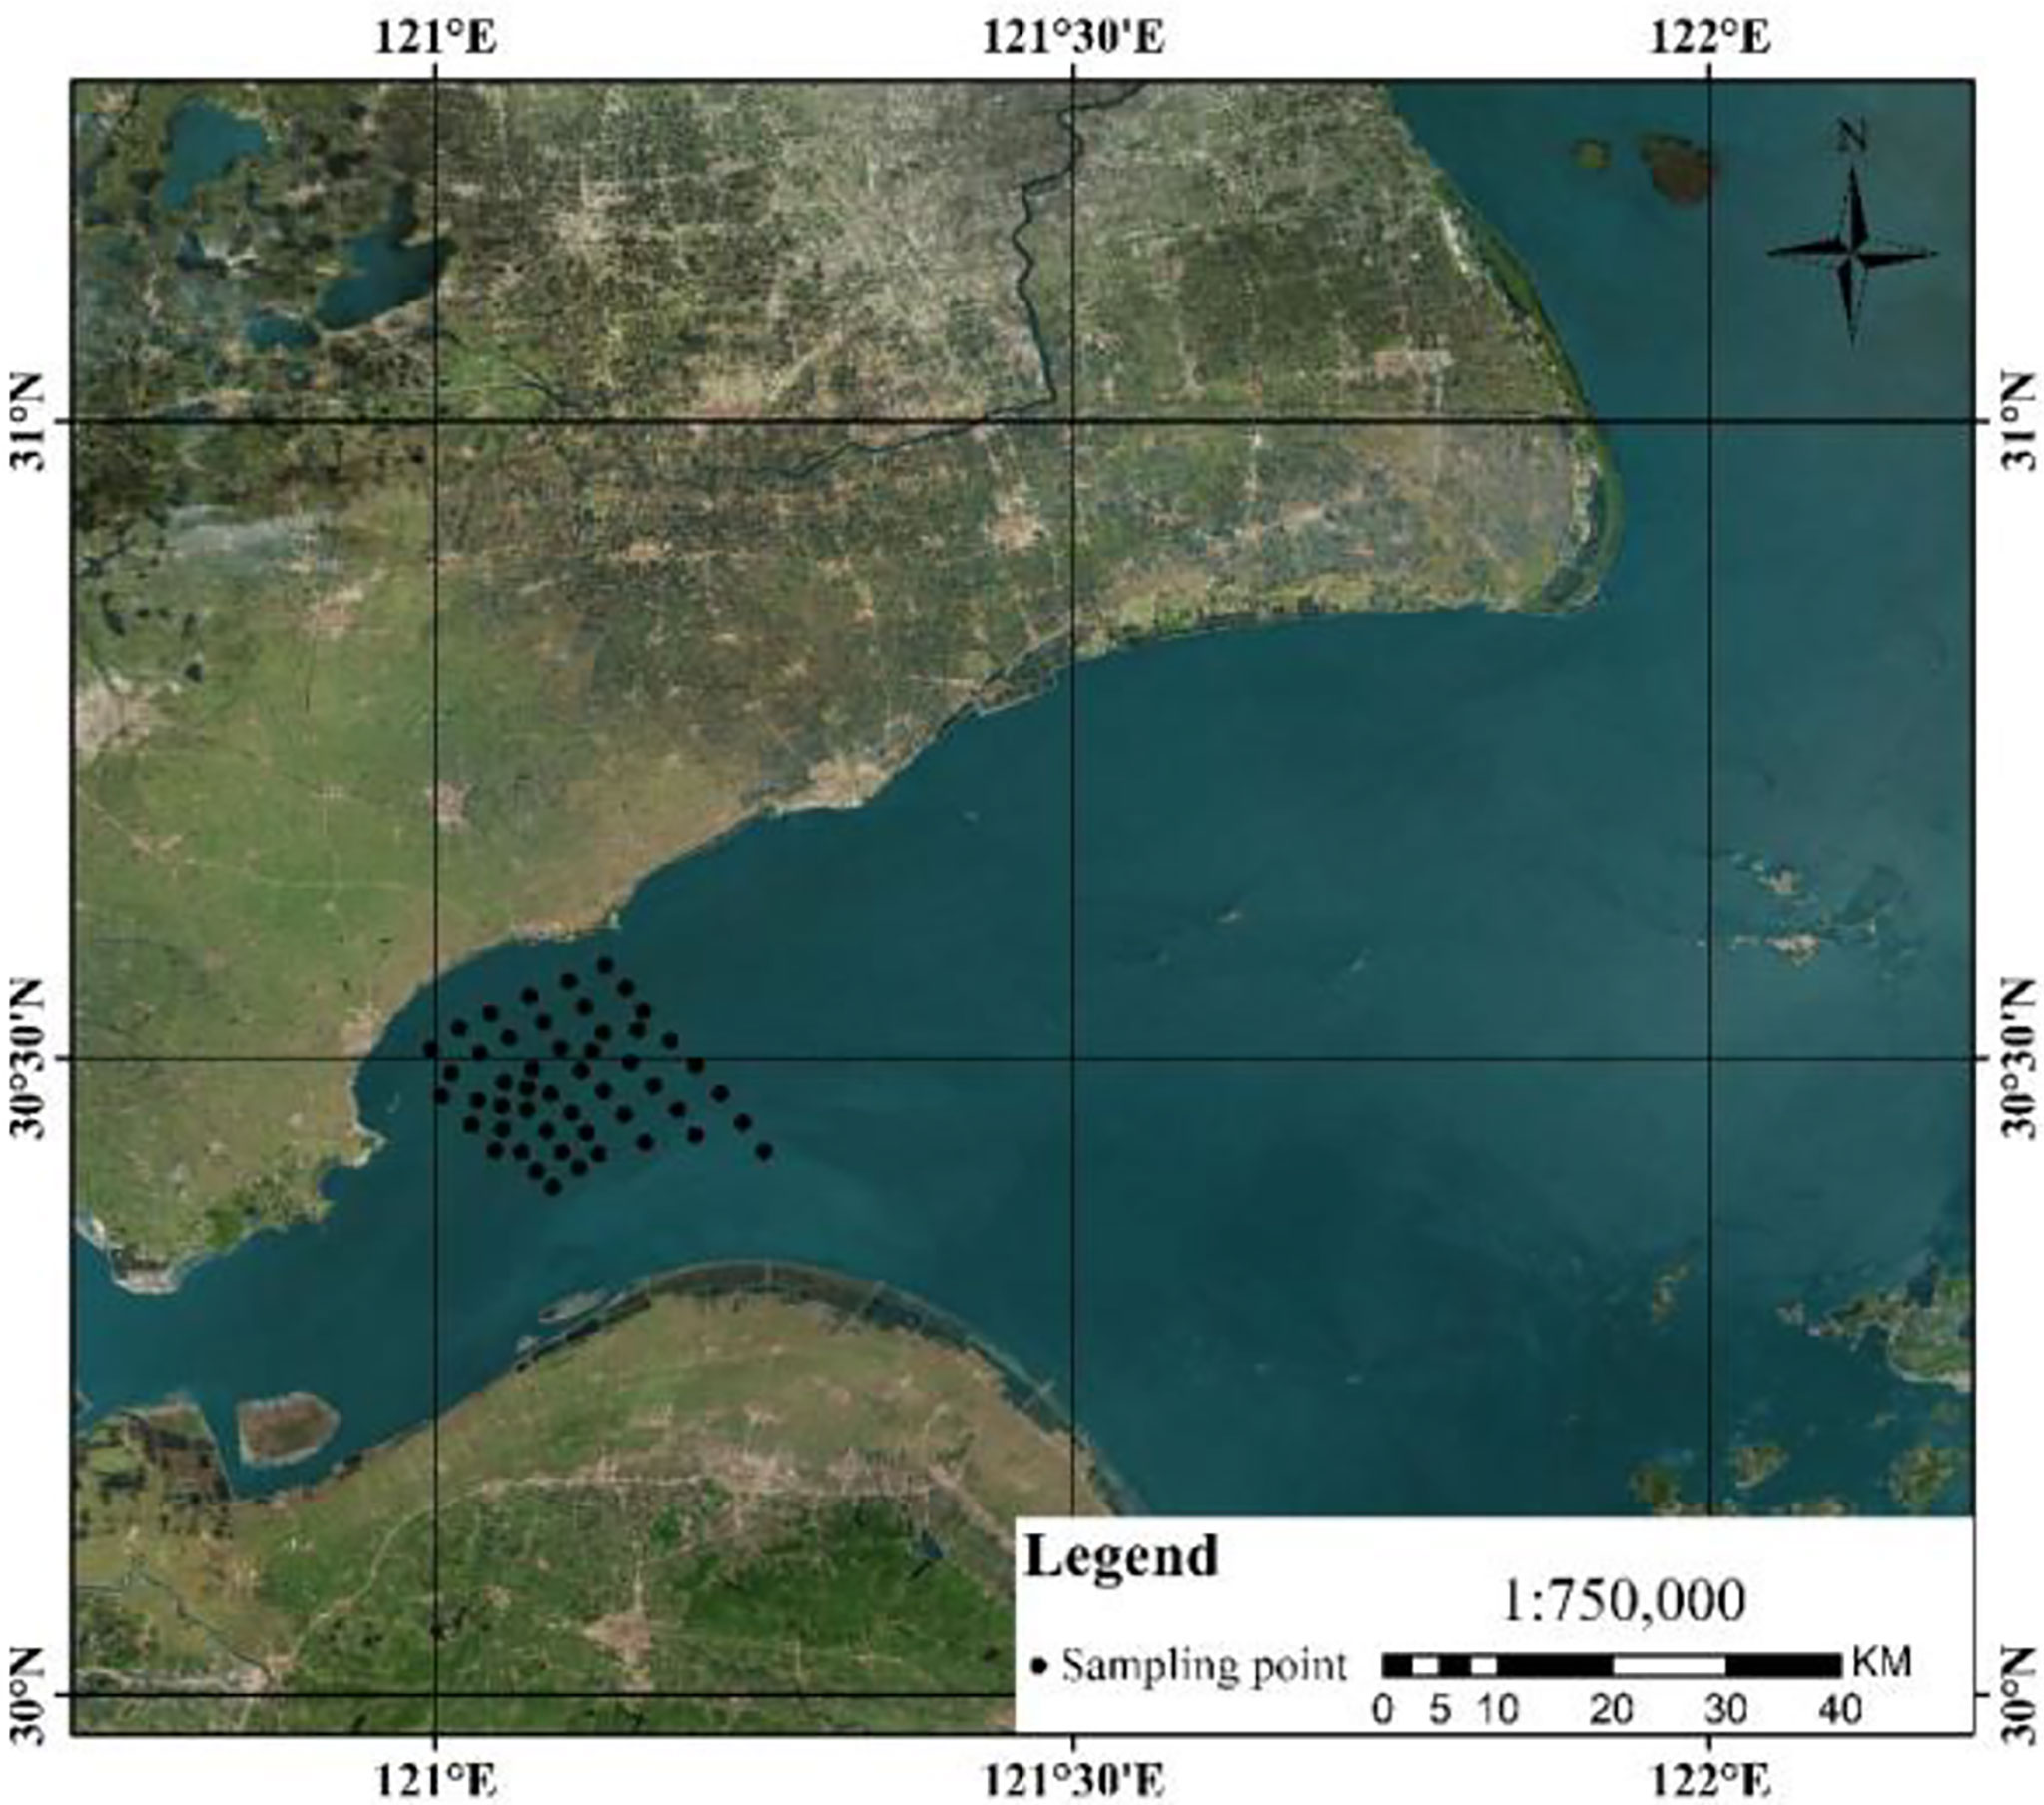
Figure 1 Study area and the distribution of in situ points.
In situ data and processing
The in-situ data required for this study include water quality data and spectral data, and a combination of continuous flow observation and fixed-point observation methods are adopted to collect and measure the in-situ data. From July 22 to 24, 2017, field water sampling and remote sensing reflectance measurements were conducted sequentially at 50 in-situ sampling sites in Hangzhou Bay, as shown in Figure 1.
Water sampling was performed with remote sensing reflectance measurements. Specifically, the sample water was collected by standard samplers from the surface layer of the water at each sampling point. Then, the concentration of suspended sediment in water was measured by conventional methods of drying, roasting, and weighing (Li et al., 2017). Finally, the in-situ SSC at each sampling point was obtained through analysis and calculation, thereby obtaining 50 sets of effective observation data. Remote sensing reflectance data were obtained based on the above-water spectral measurement method proposed by Tang et al. (2004), which uses a hand-held ASD portable spectral radiometer and a standard reflectivity board (30%), to obtain the remote sensing reflectance data of each sampling point at observation angles of 40° and 135°.
Remote sensing data and processing
Combined with the time of the in-situ data, the Level-1 Earth Observation Full Resolution (EFR) product imaged at 10:13 on July 23, 2017 is used as the Sentinel-3A/OLCI image data in this study. It covers the Hangzhou Bay area under sunny and less cloudy conditions, and it is obtained from the official website of the European Space Agency (https://codarep.eumetsat.int). Meanwhile, the Level-1B product imaged at 10:16 on July 23, 2017 is used as GOCI image data, and it is obtained from the Korea Ocean Satellite Center (http://kosc.kiost.ac.kr/index.nm). The band settings and detailed parameter information of OLCI and GOCI sensors are presented in Table 1.
This study employs the processing software SNAP (8.0) released on the official website of the European Space Agency to preprocess the OLCI and GOCI data, such as cropping and geometric correction. The image data requires atmospheric correction to reduce the influence of atmospheric scattering when the sensor receives the optical signal. Atmospheric correction refers to the process of removing atmospheric scattering and water surface reflection noise from the total radiance received by satellite remote sensors and extracting the water-leaving radiance that carries the information of water elements (Windle et al., 2022). The atmospheric correction for remote sensing of ocean color is extremely challenging because it needs to extract weak effective water signals from about 90% of the background noise. He et al. (2012) proposed the ultraviolet wavelengths atmospheric correction (UV-AC) algorithm for the low and stable water-leaving radiance values at the UV band of highly turbid water. This algorithm regards the UV band as a dark pixel band and assumes that the water-leaving radiance at the UV band isnegligible. Then, it uses the medium-precision extrapolation model proposed by Gordon and Wang (1994) to estimate the aerosol scattering radiance in the long and near-infrared band, i.e.,.
In Eq. 1 and Eq. 2, the superscript “(e)” means the estimated value instead of the actual value, and are the short near-infrared band and the long near-infrared band, respectively. Finally, the UV-AC algorithm assumes that the aerosol scattering reflectance is the same in each band, thus further retrieving the water-leaving radiance in each band.
He et al. (2017) applied the UV-AC algorithm to the Tiangong II Moderate-resolution Wide-wavelengths Imager (MWI) in 2017. Then, they conducted a comparative analysis of the performance of the UV-AC algorithm, SWIR (Shortwave Infrared Wavelength Module) algorithm (Wang and Shi, 2005; Wang, 2007), and MUMM (Management Unit Mathematical Models) algorithm (Ruddick et al., 2000) in the Hangzhou Bay region. The analysis results showed that the retrieval results of the UV-AC algorithm were in the best agreement with the measured spectra of Hangzhou Bay. Therefore, this study also uses the UV-AC algorithm for OLCI and GOCI images. Specifically, for the OLCI data, this study uses 400 nm as the UV band (i.e., the water-leaving radiance at 400 nm is assumed to be 0), 754 nm and 865 nm as the NIRs band and NIRL band, respectively; for the GOCI data, 412 nm is used as the UV band, and 745 nm and 865 nm as the NIRs band and NIRL band, respectively.
Model establishment
Since the SSC retrieval model constructed based on remote sensing images requires the simulated remote sensing reflectance at the sensor band, this study combines the in-situ remote sensing reflectance obtained from field sampling with the spectral response function of each band of the corresponding sensor and then calculates the band equivalent value of the corresponding band according to its band settings. The calculation equation is as follows:
In Eq. 3, is the remote sensing reflectance equivalent to the sensor x-th band, with integration from to ; is the spectral response function of the sensor x-th band; and are the wavelength range of the spectral response function; is the in-situ remote sensing reflectance.
The multi-band exponential model is used in this study mainly because the exponential model is one of the most common models in the current water color retrieval studies (Liu et al., 2013; Shi et al., 2019). After the in-situ SSC data obtained from field sampling and the equivalent band remote sensing reflectance data are ordered one by one, 50 pairs of sample data are obtained. Then, in the modeling process, the data are randomly divided into a modeling set (33 pairs) and a validation set (17 pairs) at the ratio of 2:1. The former is used to construct the retrieval model, while the latter is used to verify the model accuracy. In this study, the accuracy of the retrieval model is evaluated by three indicators, namely, coefficient of determination (R2), root mean square error (RMSE), and mean relative error (MRE). These indicators are used to analyze the degree of fit of the regression model coefficients, and their calculation equations are shown as follows:
In Eqs. 4-6, is the in-situ SSC for the i-th sample; is the SSC estimated by the retrieval model for the i-th sample; is the average value of in-situ SSC for the i-th sample; n is the total number of samples.
Results and analysis
Analysis of spectral characteristics of hangzhou bay water
The relationship between the in-situ remote sensing reflectance curves and the spectral bands for some of the water bodies in Hangzhou Bay with different SCCs acquired on July 23, 2017 is shown in Figure 2. Two reflection peaks appear in the band ranges of about 600-700 nm and 765-810 nm. Previous experiments have shown (Han et al., 2003) that the reflectance spectra of water bodies containing suspended sediment are characterized by two peaks in the band of about 600-700 nm and 760-820 nm, where the former is the main peak and the latter is the secondary peak; when the sediment content of the water body is low, the main peak is generally higher than that of the secondary peak, and the reflectance of the secondary peak will gradually increase as the sediment content. The SSC values at most of the experimental measurement points taken in this study are relatively low, and it can be seen from the figure that most of the main peaks of the spectral curves are higher than the secondary peaks, except for the line corresponding to the SSC of 695.24 mg/L. The reflectance of the secondary reflectance peaks in the figure shows an increase with the SSC, which also verifies the pattern shown in the previous study. Particularly, when the SSC reaches 695.24 mg/L, the reflectance of the secondary peak approaches the reflectance of the main peak. Additionally, although the reflectance of the whole visible spectral band generally shows that the higher the SSC of the water body, the stronger the spectral signal of remote sensing reflectance. This is consistent with the previous findings (Doxaran et al., 2002), but the “redshift” phenomenon is not obvious, and the positions of the reflectance peaks of different SCCs in the band are generally consistent. Moreover, for each waveband of the OLCI data (see Table 1 for the specific waveband settings), the remote sensing reflectance in the NIR waveband shows a good agreement with the SCC of the water body. Generally, the in-situ remote sensing reflectance and SSC show a good correlation, which is mainly because of the high concentration of suspended sediment in Hangzhou Bay, and thus a strong optical signal is obtained, which is convenient for computational analysis and research.
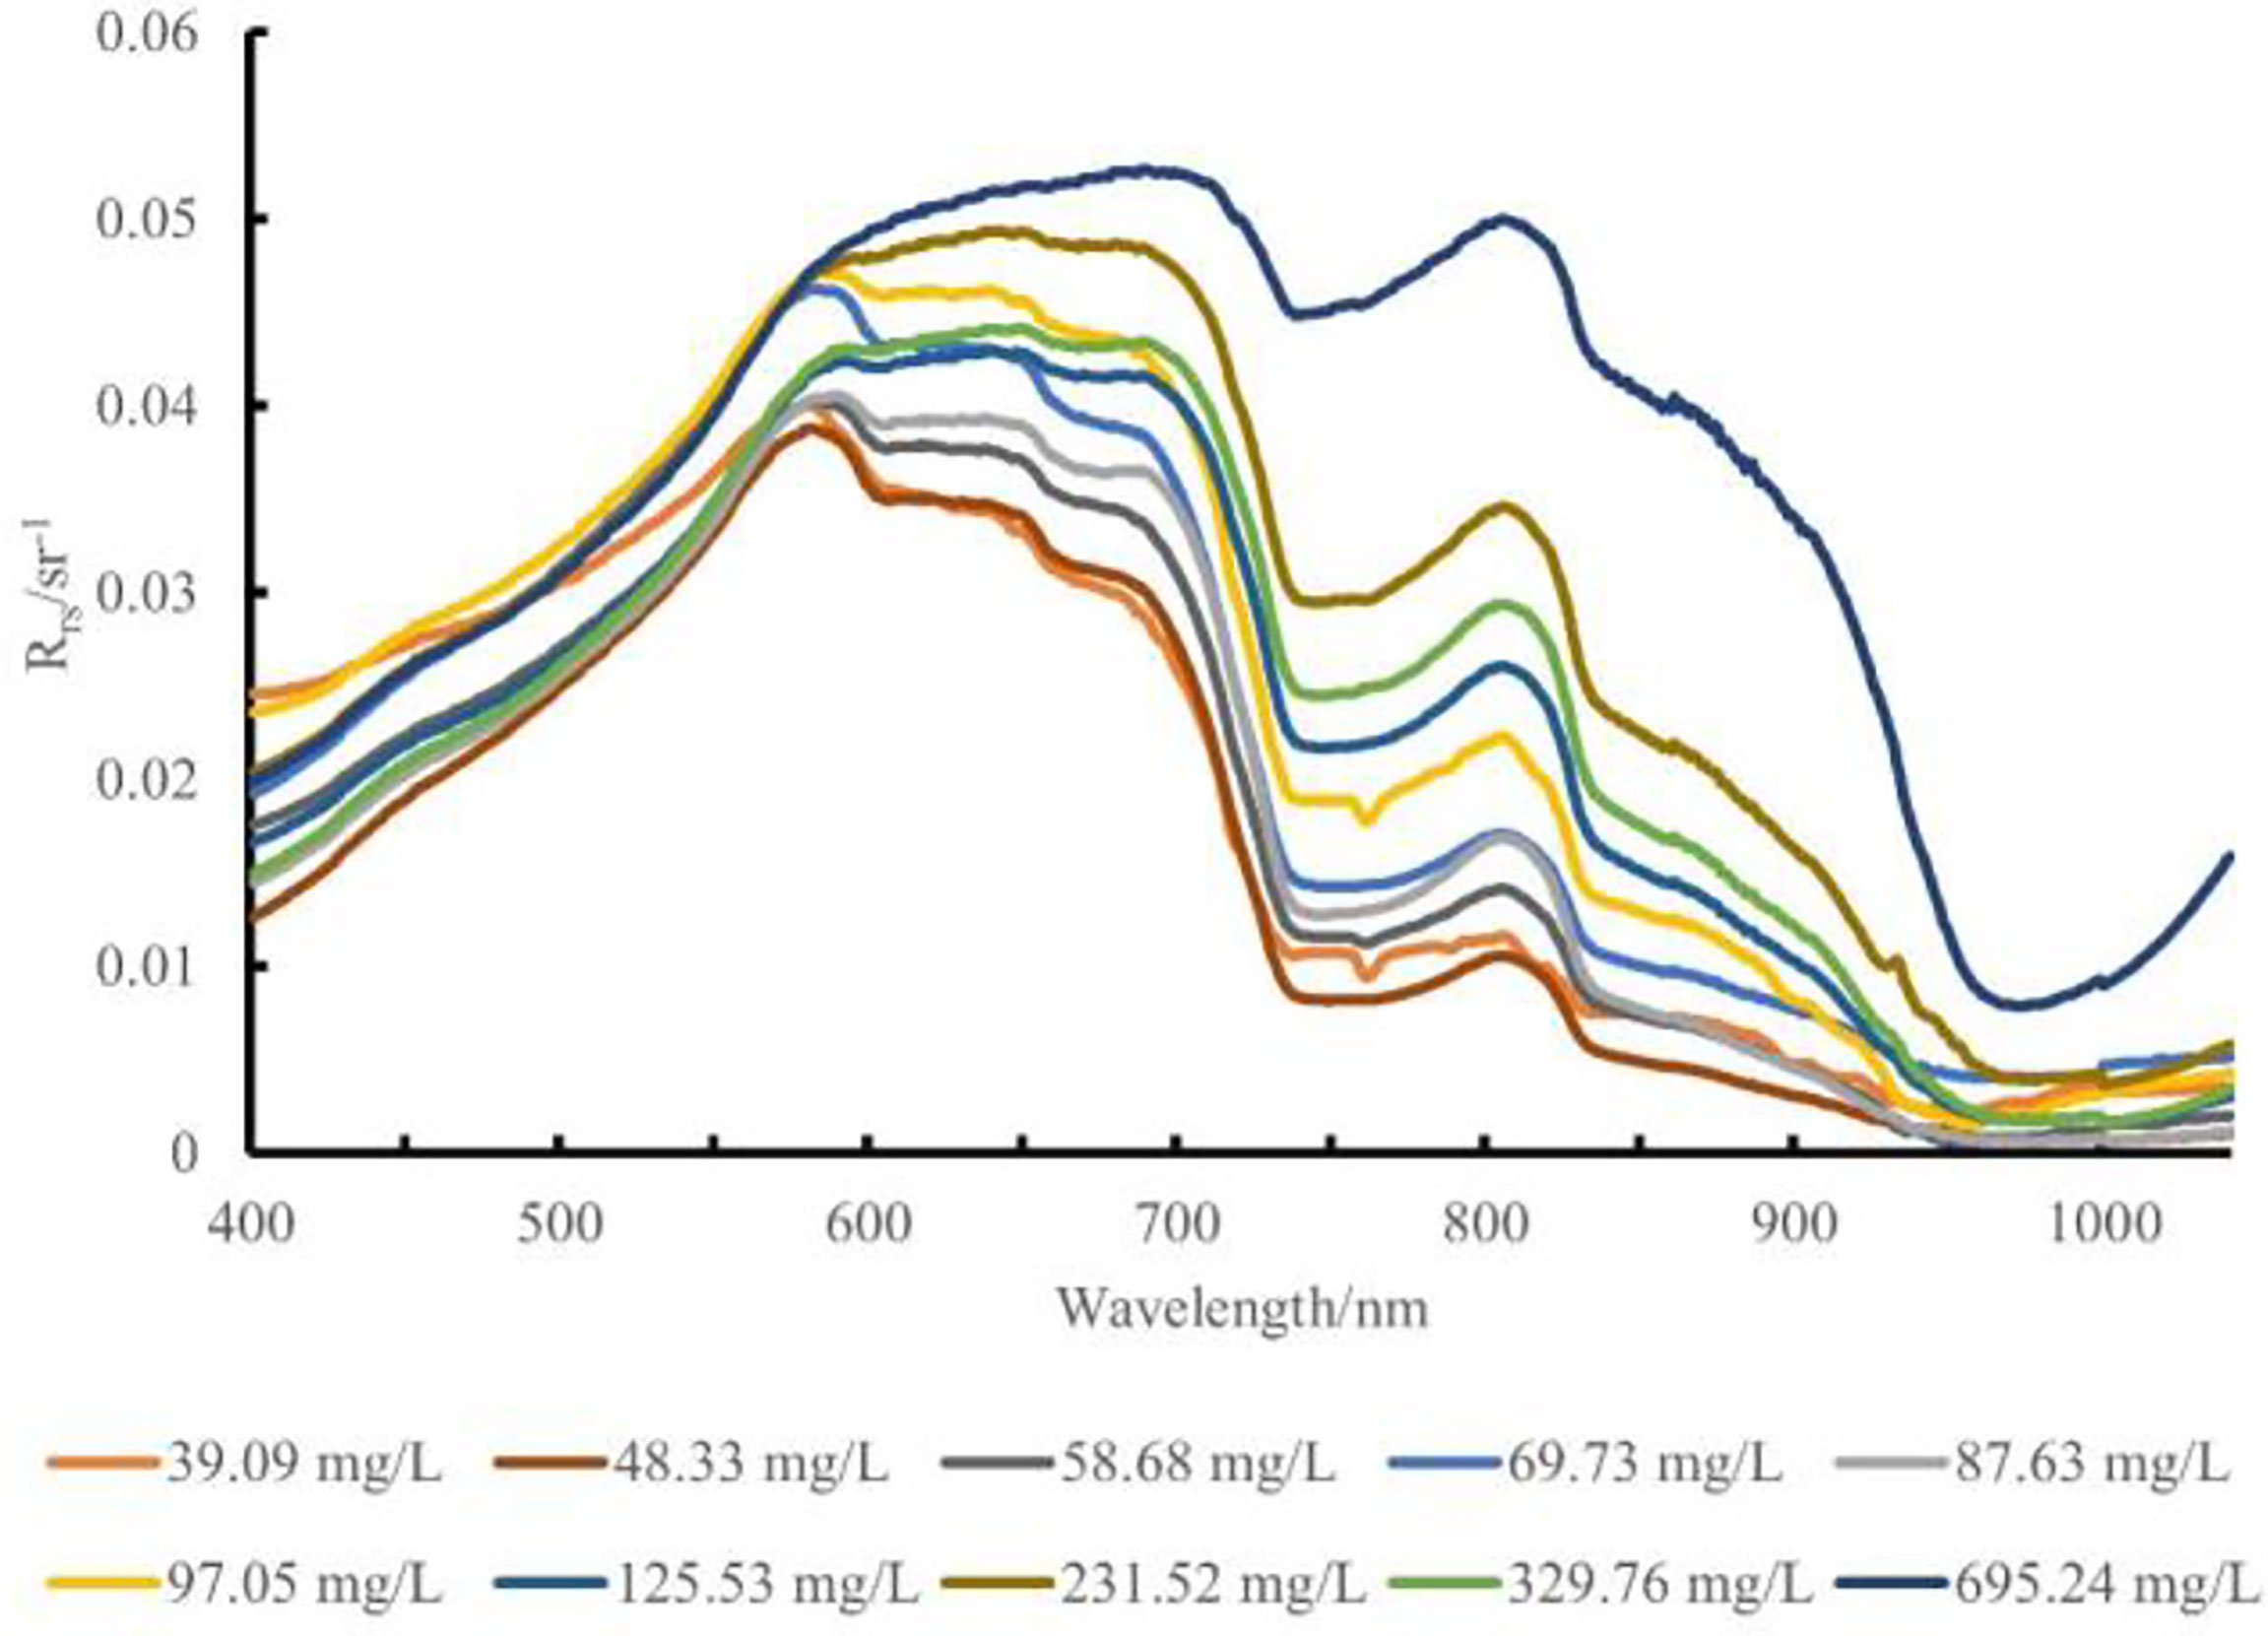
Figure 2 The relationship between in situ Rrs and SSC in the study area.
Atmospheric correction accuracy inspection and analysis
To verify the atmospheric correction accuracy of OLCI and GOCI images based on the UV-AC algorithm, this study combines the satellite imaging time with the sampling time of each sampling point, selects the four sampling points closest to each other, and combines the in-situ remote sensing reflectance data acquired at the corresponding points with the remote sensing reflectance data of the atmospherically corrected images at that point for comparative analysis (Figure 3). Specifically, for the OLCI data, this study only performs atmospheric correction for the bands (bands Oa1~Oa12 and bands Oa16~Oa17) in the visible part of its primary product.
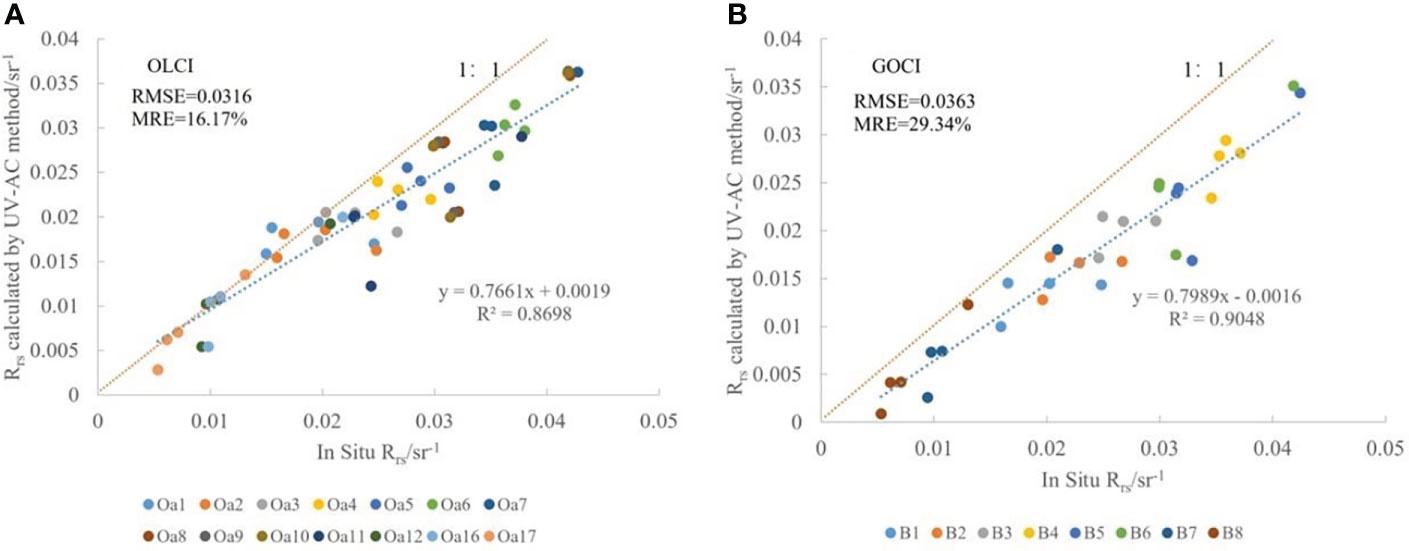
Figure 3 Scatter validation of atmospheric correction accuracy based on OLCI (A) and GOCI (B) data.
It can be seen from Figure 3 that the atmospheric correction results of both OLCI and GOCI data are lower than those of the in-situ data (except for a small portion of the Oa1 and Oa2 bands of OLCI), but in general, the atmospheric correction accuracy of both is not much different, and their atmospheric correction results are more satisfactory. In comparison, the atmospheric correction results of the former are relatively better than those of the latter. Specifically, the slope of the regression equation of the atmospheric correction validation points based on the OLCI data is about 0.7661 with an intercept of about 0.0019; while the slope of the regression equation of the atmospheric correction validation points based on the GOCI data is about 0.7989 with an intercept of about -0.0016. Also, the distribution of the latter validation points is relatively closer to the 1:1 line. However, the RMSE and the MRE of the atmospheric calibration results calculated based on the OLCI data are 0.0316 sr-1 and 16.17%, respectively, while those of the atmospheric calibration results calculated based on the GOCI data are 0.0363 sr-1 and 29.34%, respectively. Therefore, the atmospheric correction results based on the OLCI data are more accurate than those of the GOCI data.
Additionally, combining Figure 3A with Table 2, it can be seen that for the OLCI data, the atmospheric correction results are satisfactory for the Oa1~Oa3, Oa12, and Oa16~Oa17 bands, with RMSEs of less than 0.007 sr-1, while the atmospheric correction errors are relatively large for the Oa5~Oa7 and Oa11 bands. Combining Figure 3B with Table 2, it can be seen that for the GOCI data, the atmospheric correction results for the B7 and B8 bands are relatively satisfactory, with RMSEs of less than 0.008 sr-1, and the atmospheric correction results for the rest of the bands have a certain degree of error.
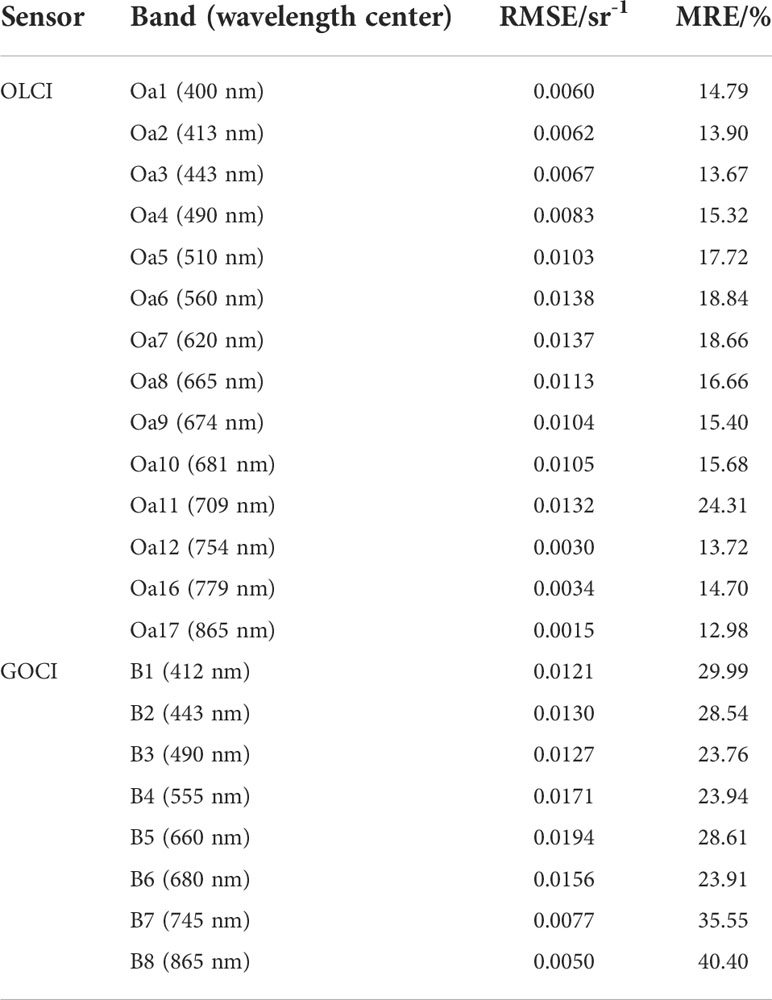
Table 2 Band-by-band RMSE and MRE statistics of the atmospheric correction results based on the OLCI and GOCI data.
To sum up, it is concluded that:
1. The atmospheric correction accuracy of the OLCI data is higher than that of the GOCI data.
2. The atmospheric correction results of both the OLCI and GOCI data are underestimated.
3. For OLCI data, the highest atmospheric correction accuracy is obtained in the blue, red, and near-infrared bands; for GOCI data, the highest atmospheric correction accuracy is obtained in the red and near-infrared bands.
4. The atmospheric correction of OLCI and GOCI data based on the UV-AC algorithm can achieve quite satisfactory results.
Model accuracy validation and analysis
By analyzing the correlation between the equivalent band remote sensing reflectance of each band of the OLCI sensor and the in-situ SSC, and combined with the existing research results (Li et al., 2019; Lu and Su, 2020), this study adopts the equivalent band remote sensing reflectance of Oa5, Oa12, Oa16, and Oa17 of the OLCI data to construct the remote sensing factor. In the modeling process, the R2 obtained based on the modeling set data, the RMSE and MRE obtained based on the validation set data are used as accuracy evaluation indexes, and the three are analyzed in combination with each other to compare and determine the overall strengths and weaknesses of the model.
It can be seen from Figure 4 that in order to construct a multi-band index model for retrieval of SSC, four combinations of remote sensing factors were selected in this studyretrieval. When Rrs(Oa12)/Rrs(Oa5), Rrs(Oa16)/Rrs(Oa5) and Rrs(Oa17)/Rrs(Oa5) are used as remote sensing factors, the R2 values of the three models are very similar and all are greater than 0.9, indicating that the fit of the coefficients of these three regression models is very high. Specifically, when Rrs(Oa16)/Rrs(Oa5) is used as the remote sensing factor, the R2 reaches 0.956; when Rrs(Oa17)/Rrs(Oa12) is used as the remote sensing factor, the R2 of the model is slightly lower than the first three, but it still reaches nearly 0.87. In addition, it can be seen from the figure that when Rrs(Oa12)/Rrs(Oa5) and Rrs(Oa16)/Rrs(Oa5) are used as remote sensing factors, the distribution of modeling points is very close to the 1:1 line, which can reflect the in-situ data well. However, when Rrs(Oa17)/Rrs(Oa5) and Rrs(Oa17)/Rrs(Oa12) are used as remote sensing factors, their retrieval SSC is relatively low, and the modeling points are mostly distributed below the 1:1 line with large relative errors.
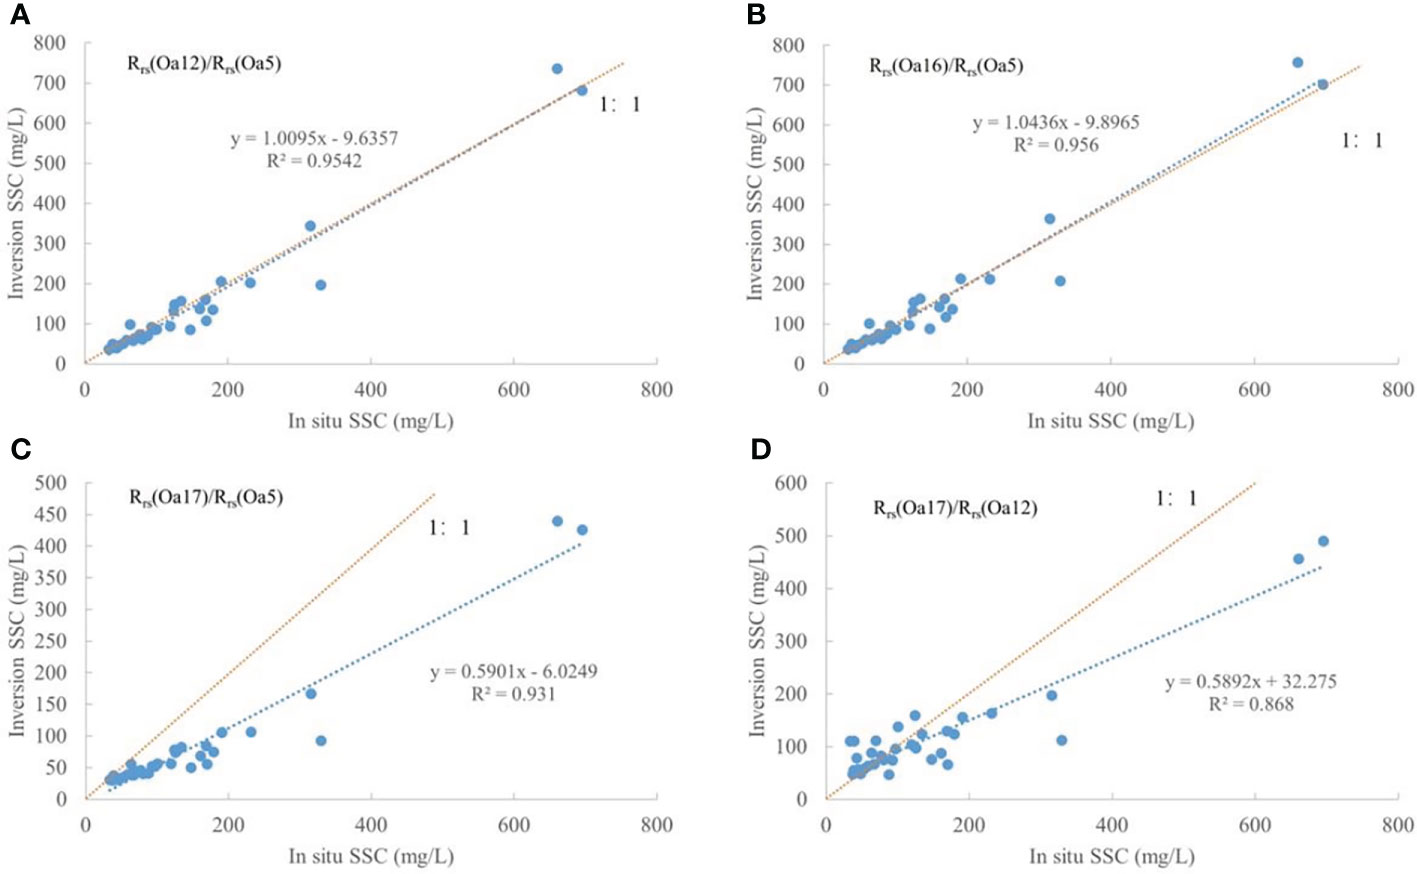
Figure 4 Scatter validation of estimated SSC based on OLCI data with in situ concentration. (A) Rrs(Oa12)/Rrs(Oa5); (B) Rrs(Oa16)/Rrs(Oa5); (C) Rrs(Oa17)/Rrs(Oa5); (D) Rrs(Oa17)/Rrs(Oa12).
Combined with Table 3, it can be seen that when Rrs(Oa12)/Rrs(Oa5) and Rrs(Oa16)/Rrs(Oa5) are used as remote sensing factors, the two models constructed have superior accuracy. Generally, the difference between the two values is not very large, and their RMSEs are both less than 100 mg/L and close to 70 mg/L; meanwhile, their MREs are both less than 20% and close to 17%. Specifically, the model has the minimum RMSE of 69.10 mg/L when Rrs(Oa16)/Rrs(Oa5) is used as the remote sensing factor, and the minimum MRE of 17.31% when Rrs(Oa12)/Rrs(Oa5) is used as the remote sensing factor. However, when Rrs(Oa17)/Rrs(Oa5) and Rrs(Oa17)/Rrs(Oa12) are used as remote sensing factors, the errors of the two constructed models are relatively large. Their RMSEs reach 156.52 mg/L and 126.12 mg/L respectively, and their MREs reach 35.34% and 43.31% respectively.
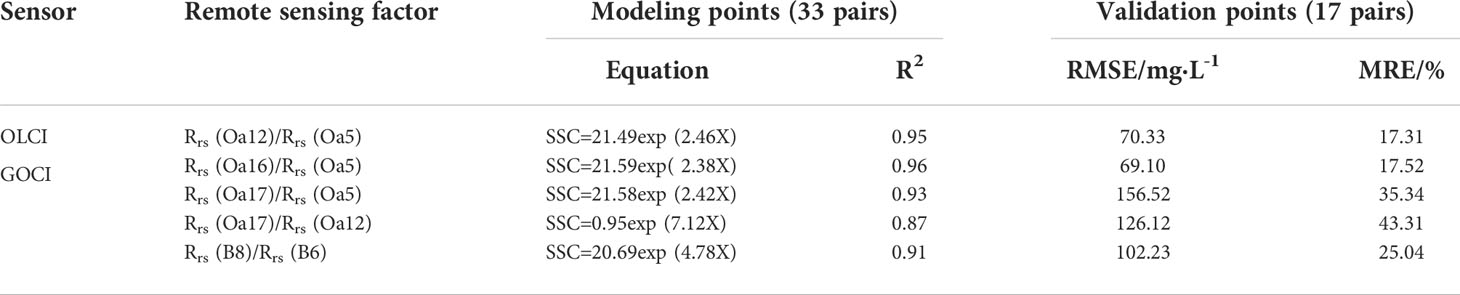
Table 3 Band-by-band RMSE and MRE statistics of atmospheric correction results based on OLCI and GOCI.
Then, the model developed for selecting the remote sensing factor Rrs(Oa16)/Rrs(Oa5) is applied to the retrieval of SSC in the study area based on OLCI data. The retrieval model is calculated as:
In Eq. 7, SSC is the suspended sediment retrieval concentration; X is the ratio of the equivalent band remote sensing reflectance of the 16th to the 5th band of the OLCI sensor.
Similarly, for the construction of the retrieval model based on GOCI data, the multi-band index model is also used in this study. According to the existing research results (Lamquin et al., 2012; Hu et al., 2018), the final retrieval model is determined through analysis and summarization as follows:
In Eq. 8, SSC is the suspended sediment retrieval concentration; X is the ratio of the equivalent band remote sensing reflectance of the 8th and 6th bands of the GOCI sensor. Combining Figure 5 and Table 3, it can be seen that the R2 of this retrieval model reaches 0.91, and the RMSE and MRE reach 102.23 mg/L and 25.04%, respectively. These results indicate that this model achieves good performances and can better reflect the actual values of SSC.
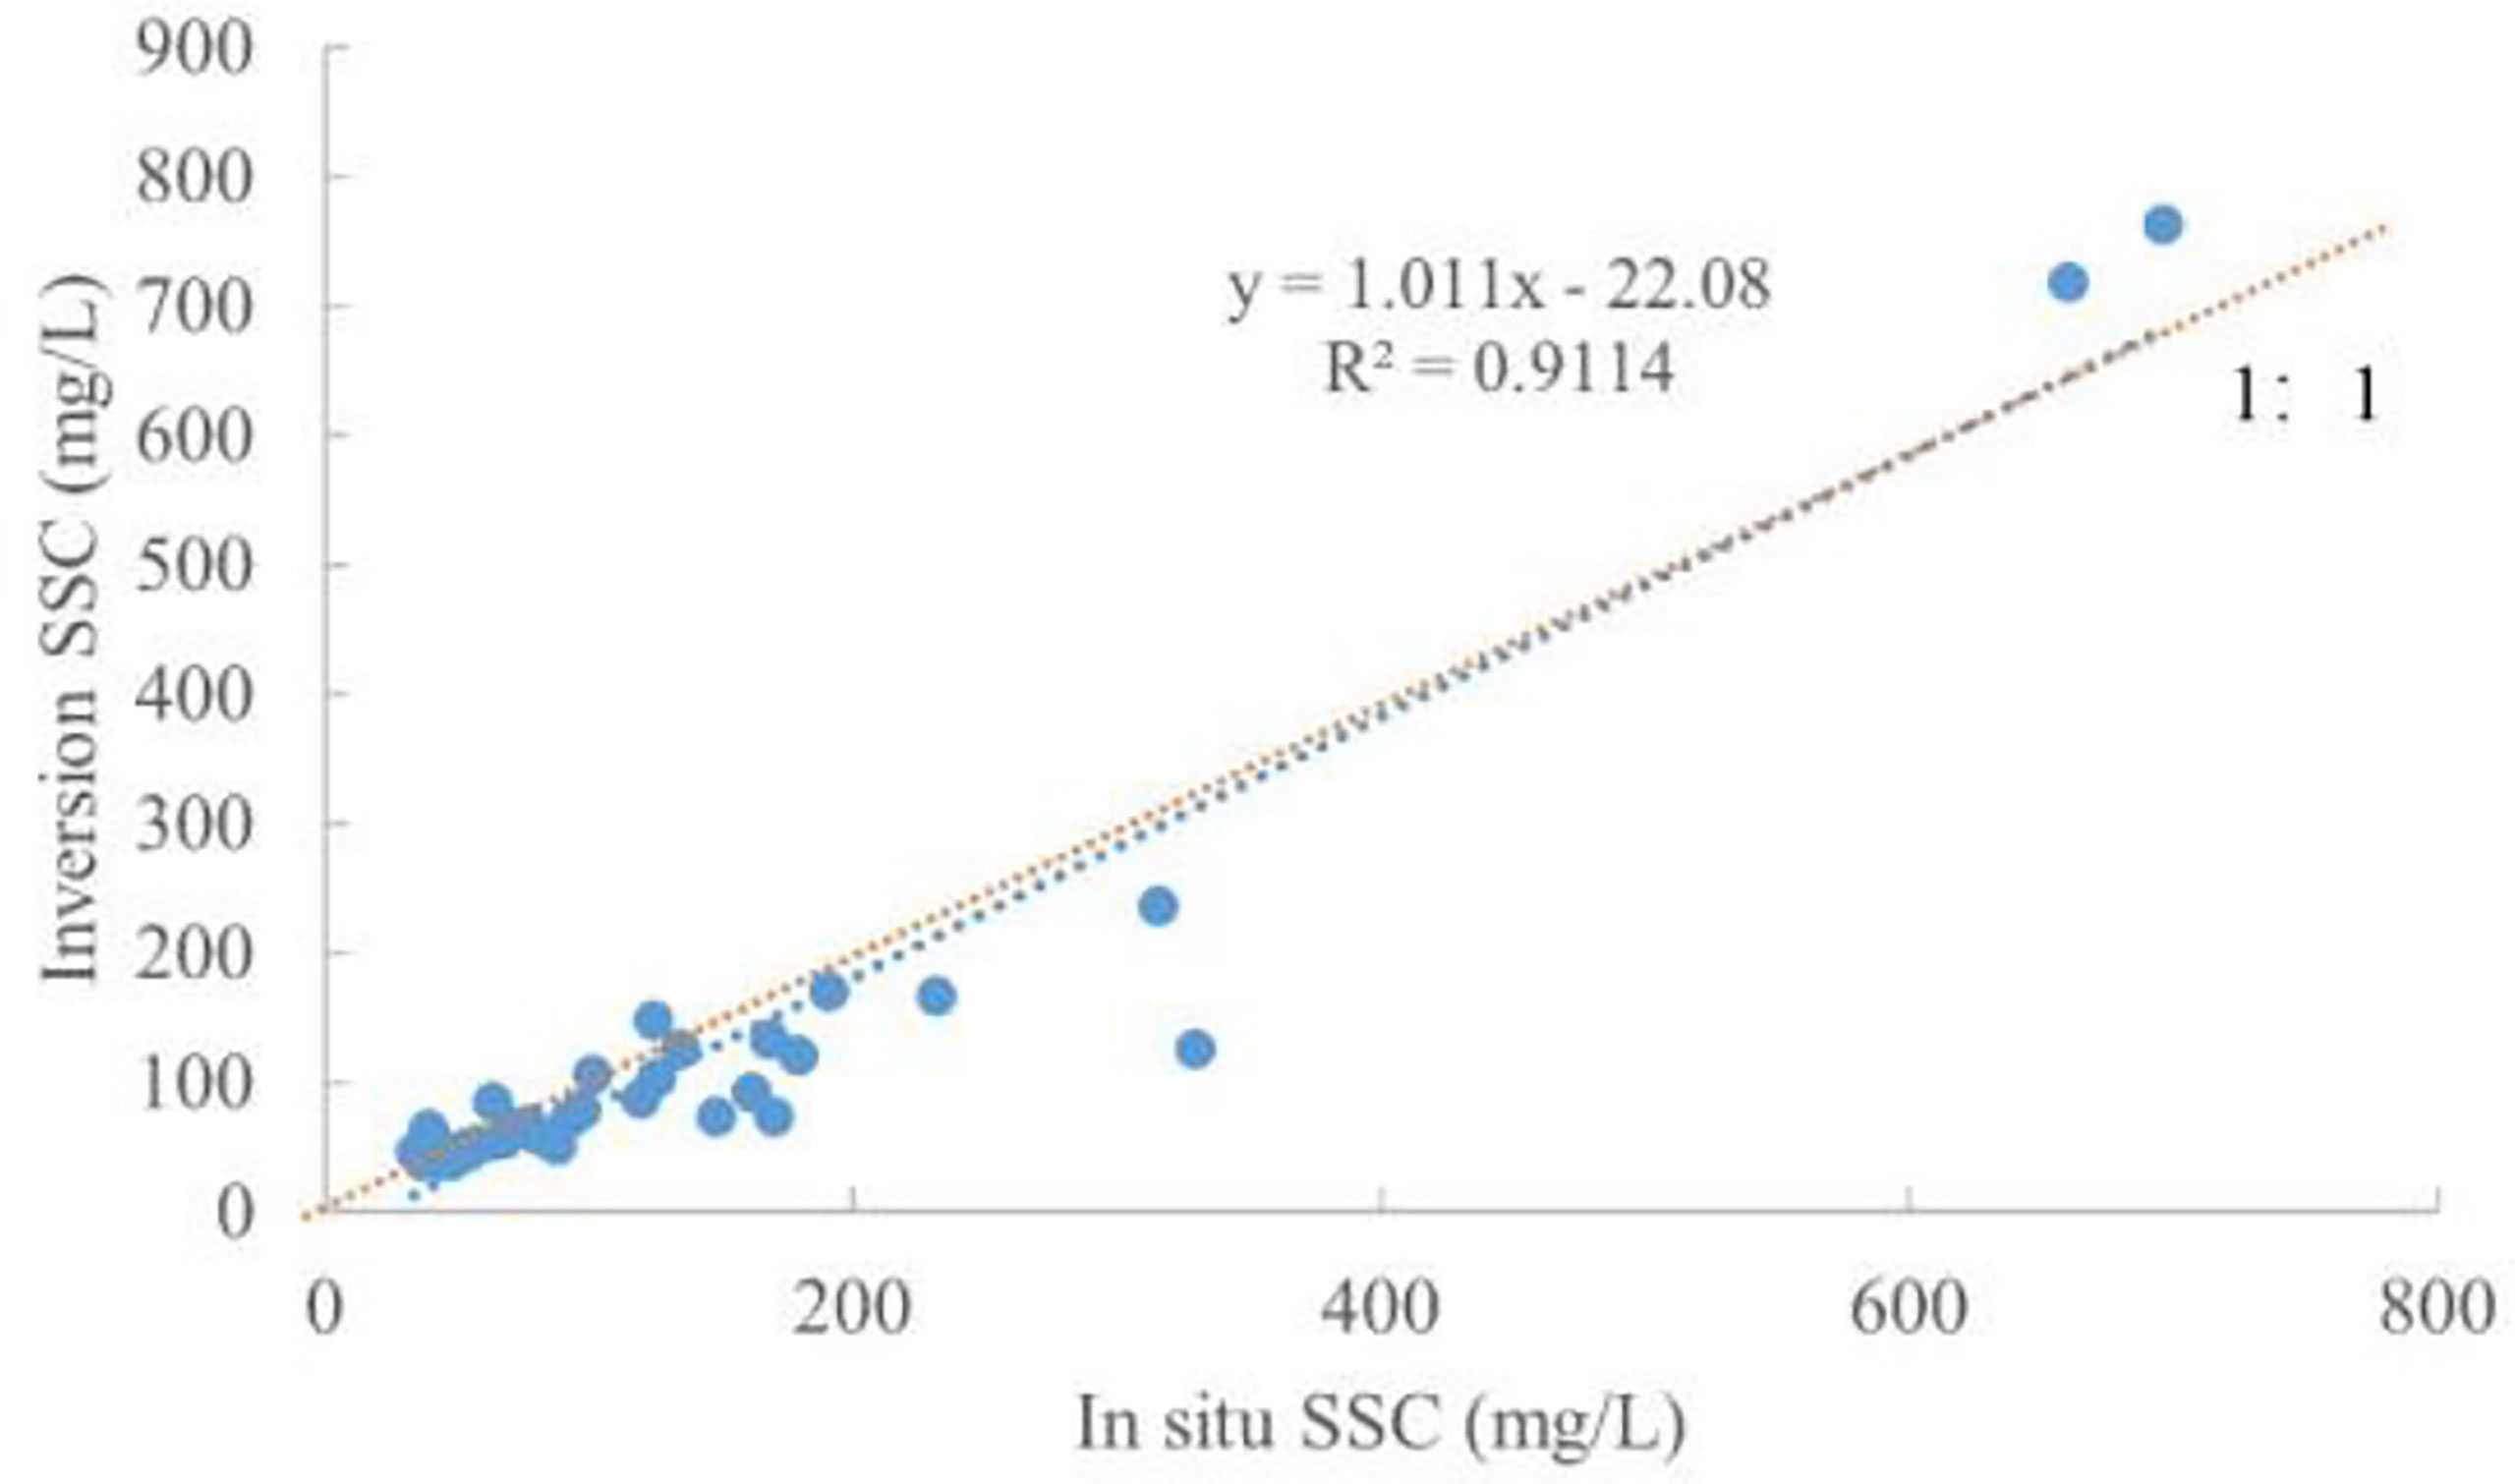
Figure 5 Scatter validation of estimated SSC based on GOCI data with in situ concentration.
Overall, it can be seen from Table 3 that the retrieval model of SSC in the study area based on OLCI data has higher accuracy and lower error than the model based on GOCI data, with better values of R2, RMSE, and MRE. Combined with Figures 4, 5, it can be seen that for the estimated SSC based on OLCI data and GOCI data obtained by model retrieval, the main error between the estimation result and in-situ concentrations is from the waters with an SSC of greater than about 300 mg/L. In waters where the SSC is less than 100 mg/L, the errors are the minimum, and the model can reflect the actual SSC more accurately.
Analysis of SSC retrieval results
The retrieval model of SSC based on OLCI and GOCI data is applied to the corresponding remote sensing images after pre-processing, and the final retrieval results of SSC in the study area are obtained (Figures 6, 9). The land mask part in the resulting map adopts the shoreline information extraction method proposed by Chen et al. (2022).
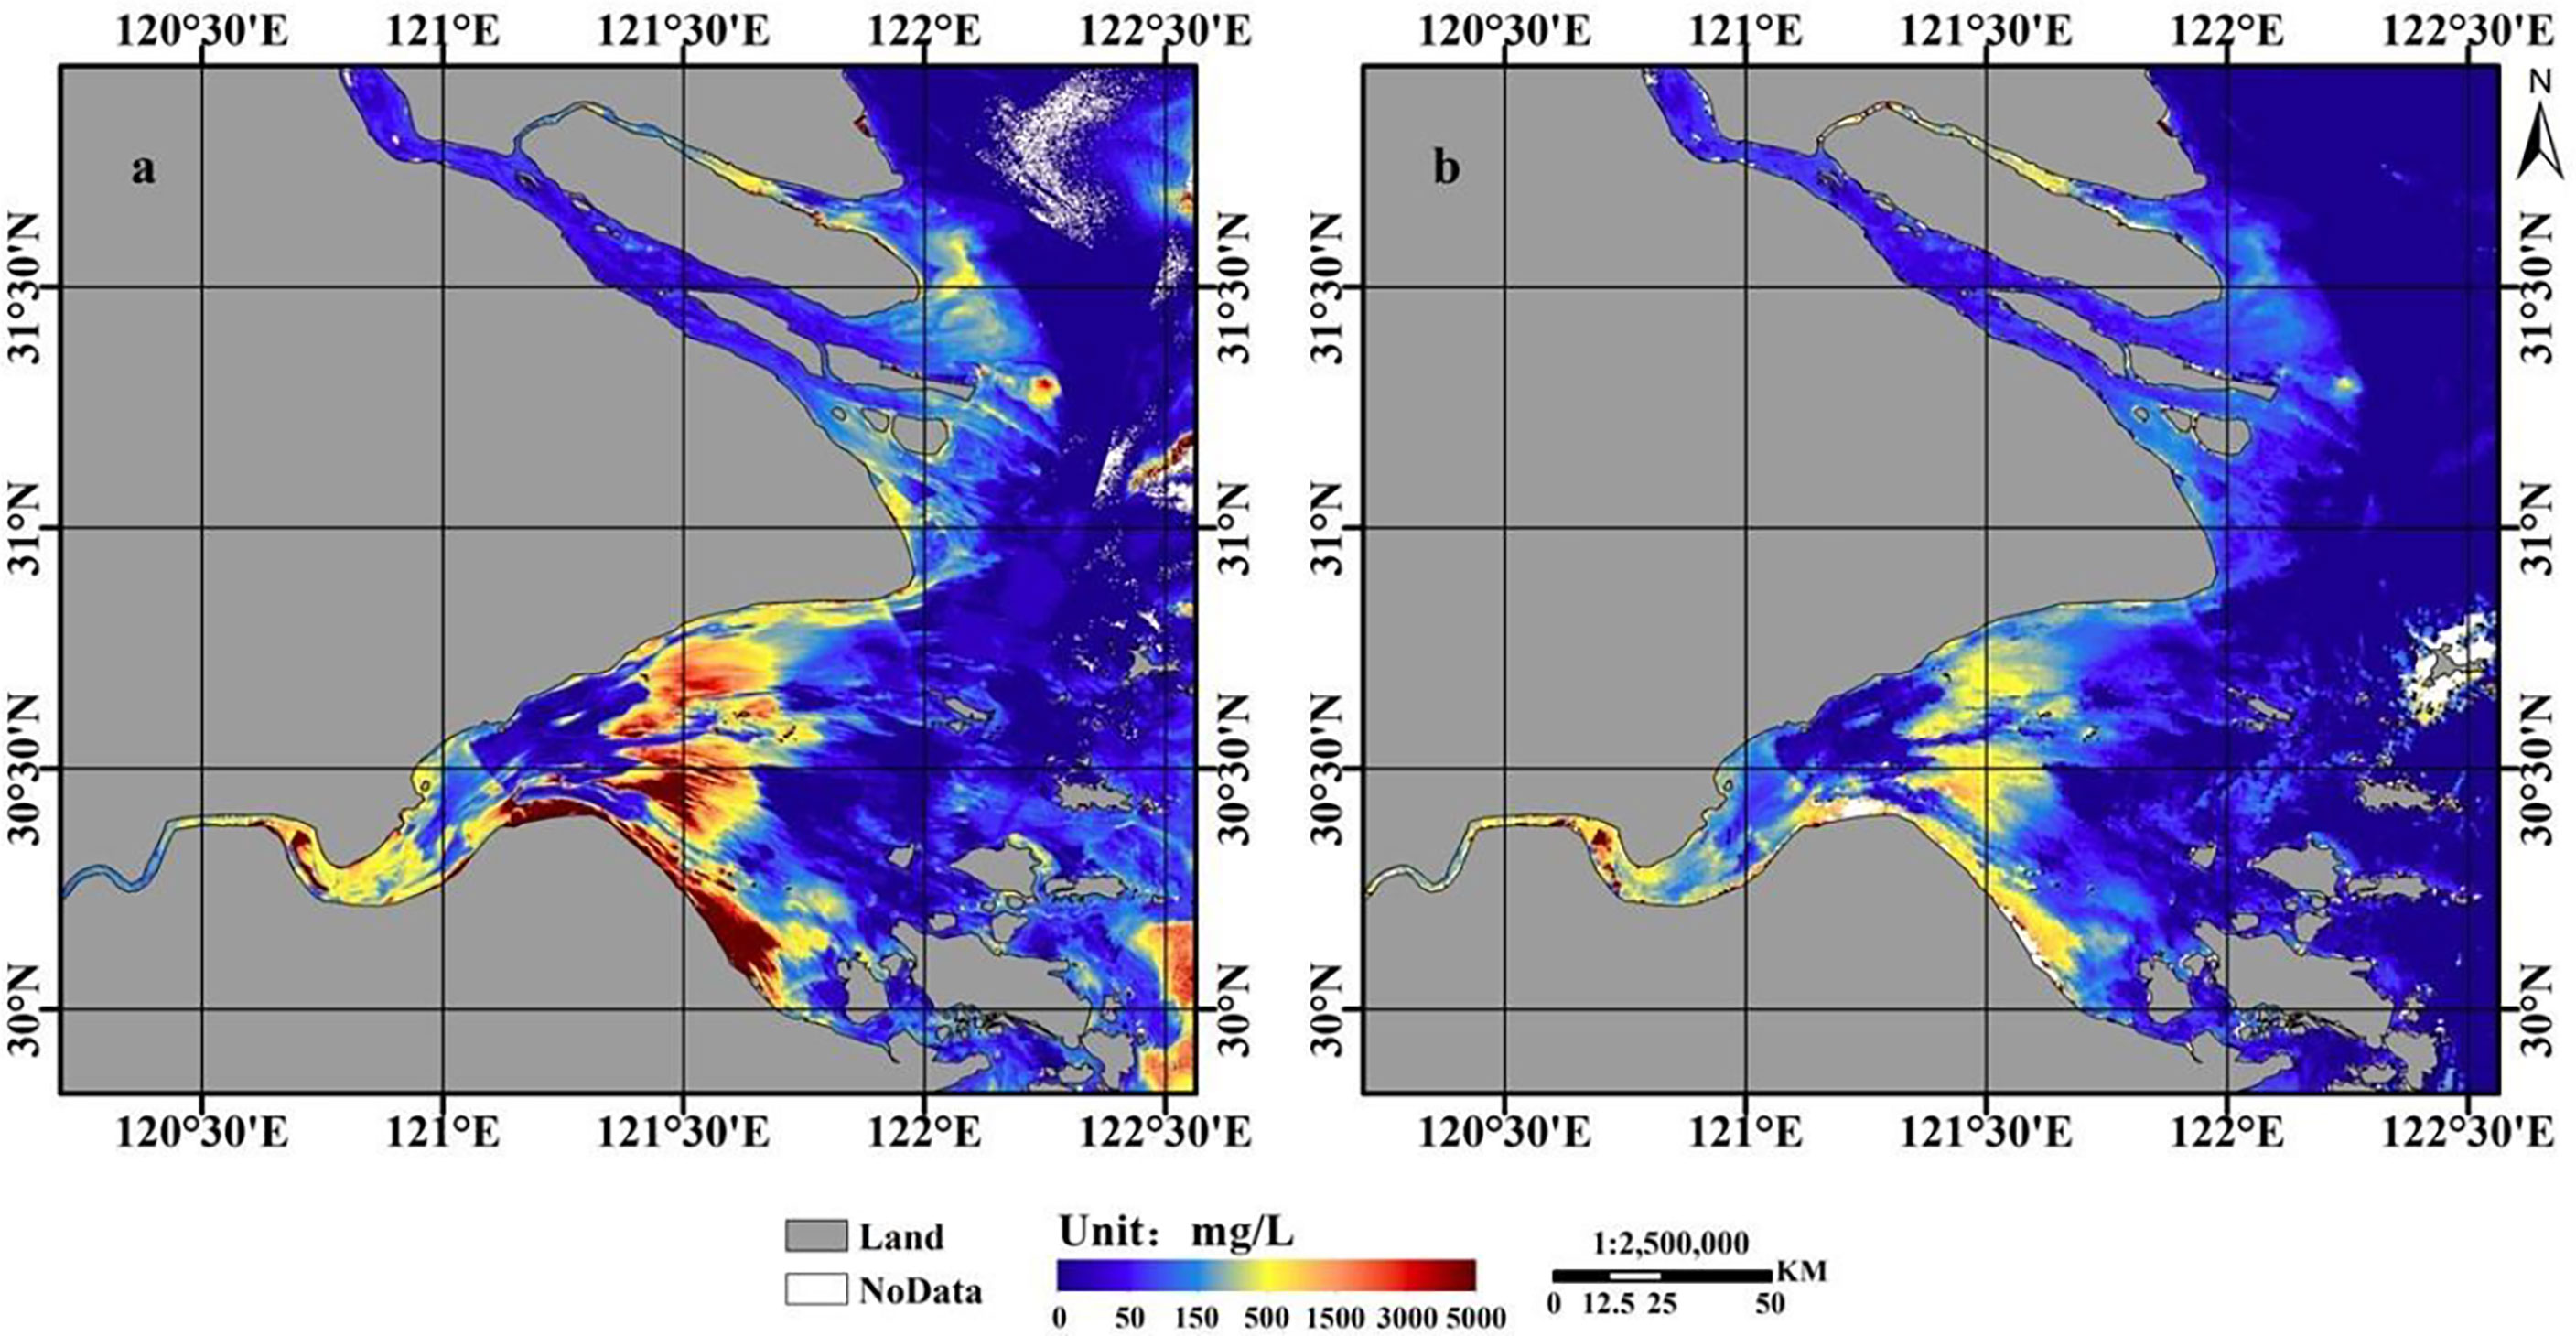
Figure 6 Retrieval results of SSC based on OLCI (A) and GOCI (B) data (July 23, 2017).
As can be seen from Figure 6 that the variation trend of SSC distribution in the study area based on the retrieval of OLCI and GOCI data tends to be consistent. Generally, the SSC at the top of the bay near the upstream area of the river is higher, while the SSC at the mouth of the bay near the inlet of the river is lower; the SSC at the south bank of the river is higher, while the SSC at the north bank of the river is lower. Specifically, a strip-shaped area with a high concentration of suspended sediment is formed at the convex bank of the river. It is also the place with the highest concentration of suspended sediment in the study area. This is caused by the centrifugal force of water flow because the convex shore is easy to accumulate suspended sediment and form mudflats. Particularly, there are two regions of high concentration of suspended sediment accumulation at the longitude of about 121°30′E at the mouth of the bay, showing an up-and-down position distribution, and the concentration of the sediment accumulation region near the southern shore is higher than that near the northern shore. Additionally, the water between the top of the bay and the mouth of the bay (between longitudes of about 121°00′E and 121°20′E) has a low concentration of suspended sediment, which is caused by the artificial blocking of objects in the middle of the river.
Since July 23, 2017 was a high tide day (Figure 7), the tidal changes on that day had a large impact on the distribution of suspended sediment in the study area. The two images in Figure 6 were imaged at around 10:00 on that day, when the tide in Hangzhou Bay was rising, with a high current rate. Meanwhile, the seawater at the mouth of the bay was flooding into the top of the bay, which led to the SSC at the mouth of the bay being significantly lower than that at the top of the bay. To sum up, the distribution of SSC in the waters of the study area shown in the figure is complex due to the combined effects of tidal shape, topography, and human factors in the Hangzhou Bay area.
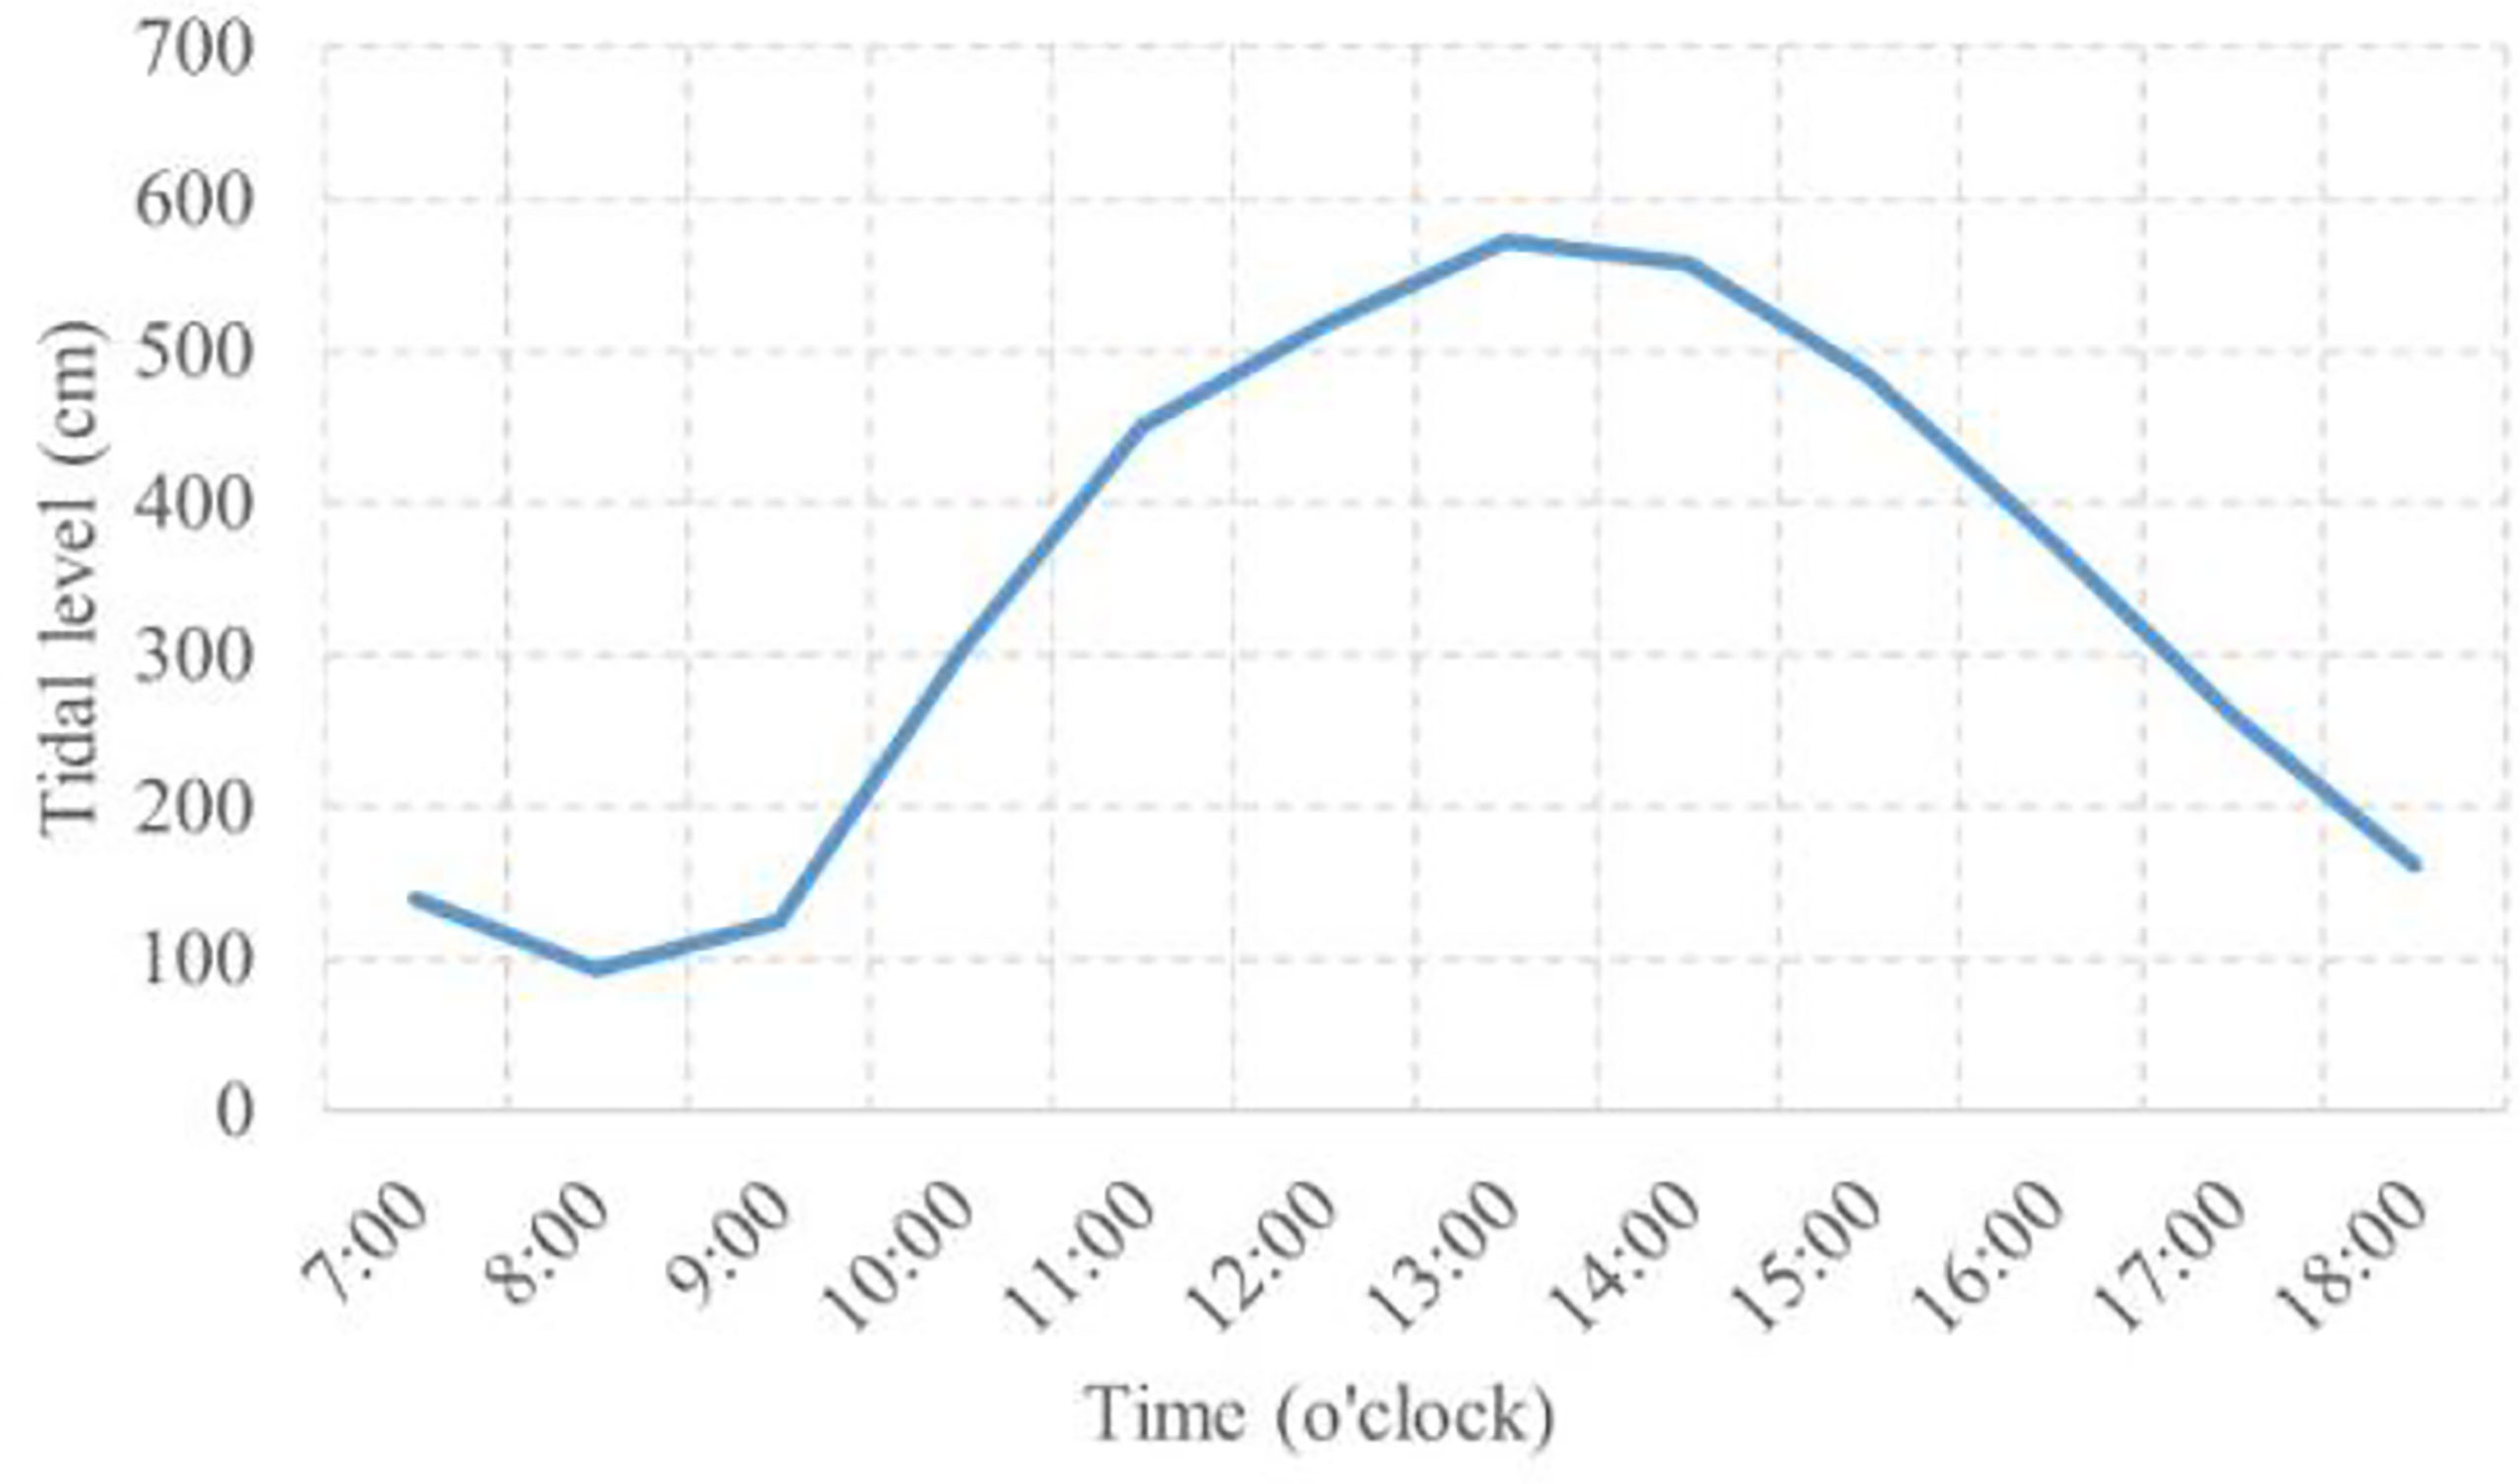
Figure 7 Tidal changes in the study area (July 23, 2017).
Figure 8 selects the region with low SSC in Hangzhou Bay on that day for the 2017 data. From the figure, it can be seen that the retrieval results of OLCI data can reflect the distribution of SSC in the study area in more details than GOCI data, which can be obtained that its SNR and digitization level are better than GOCI data.
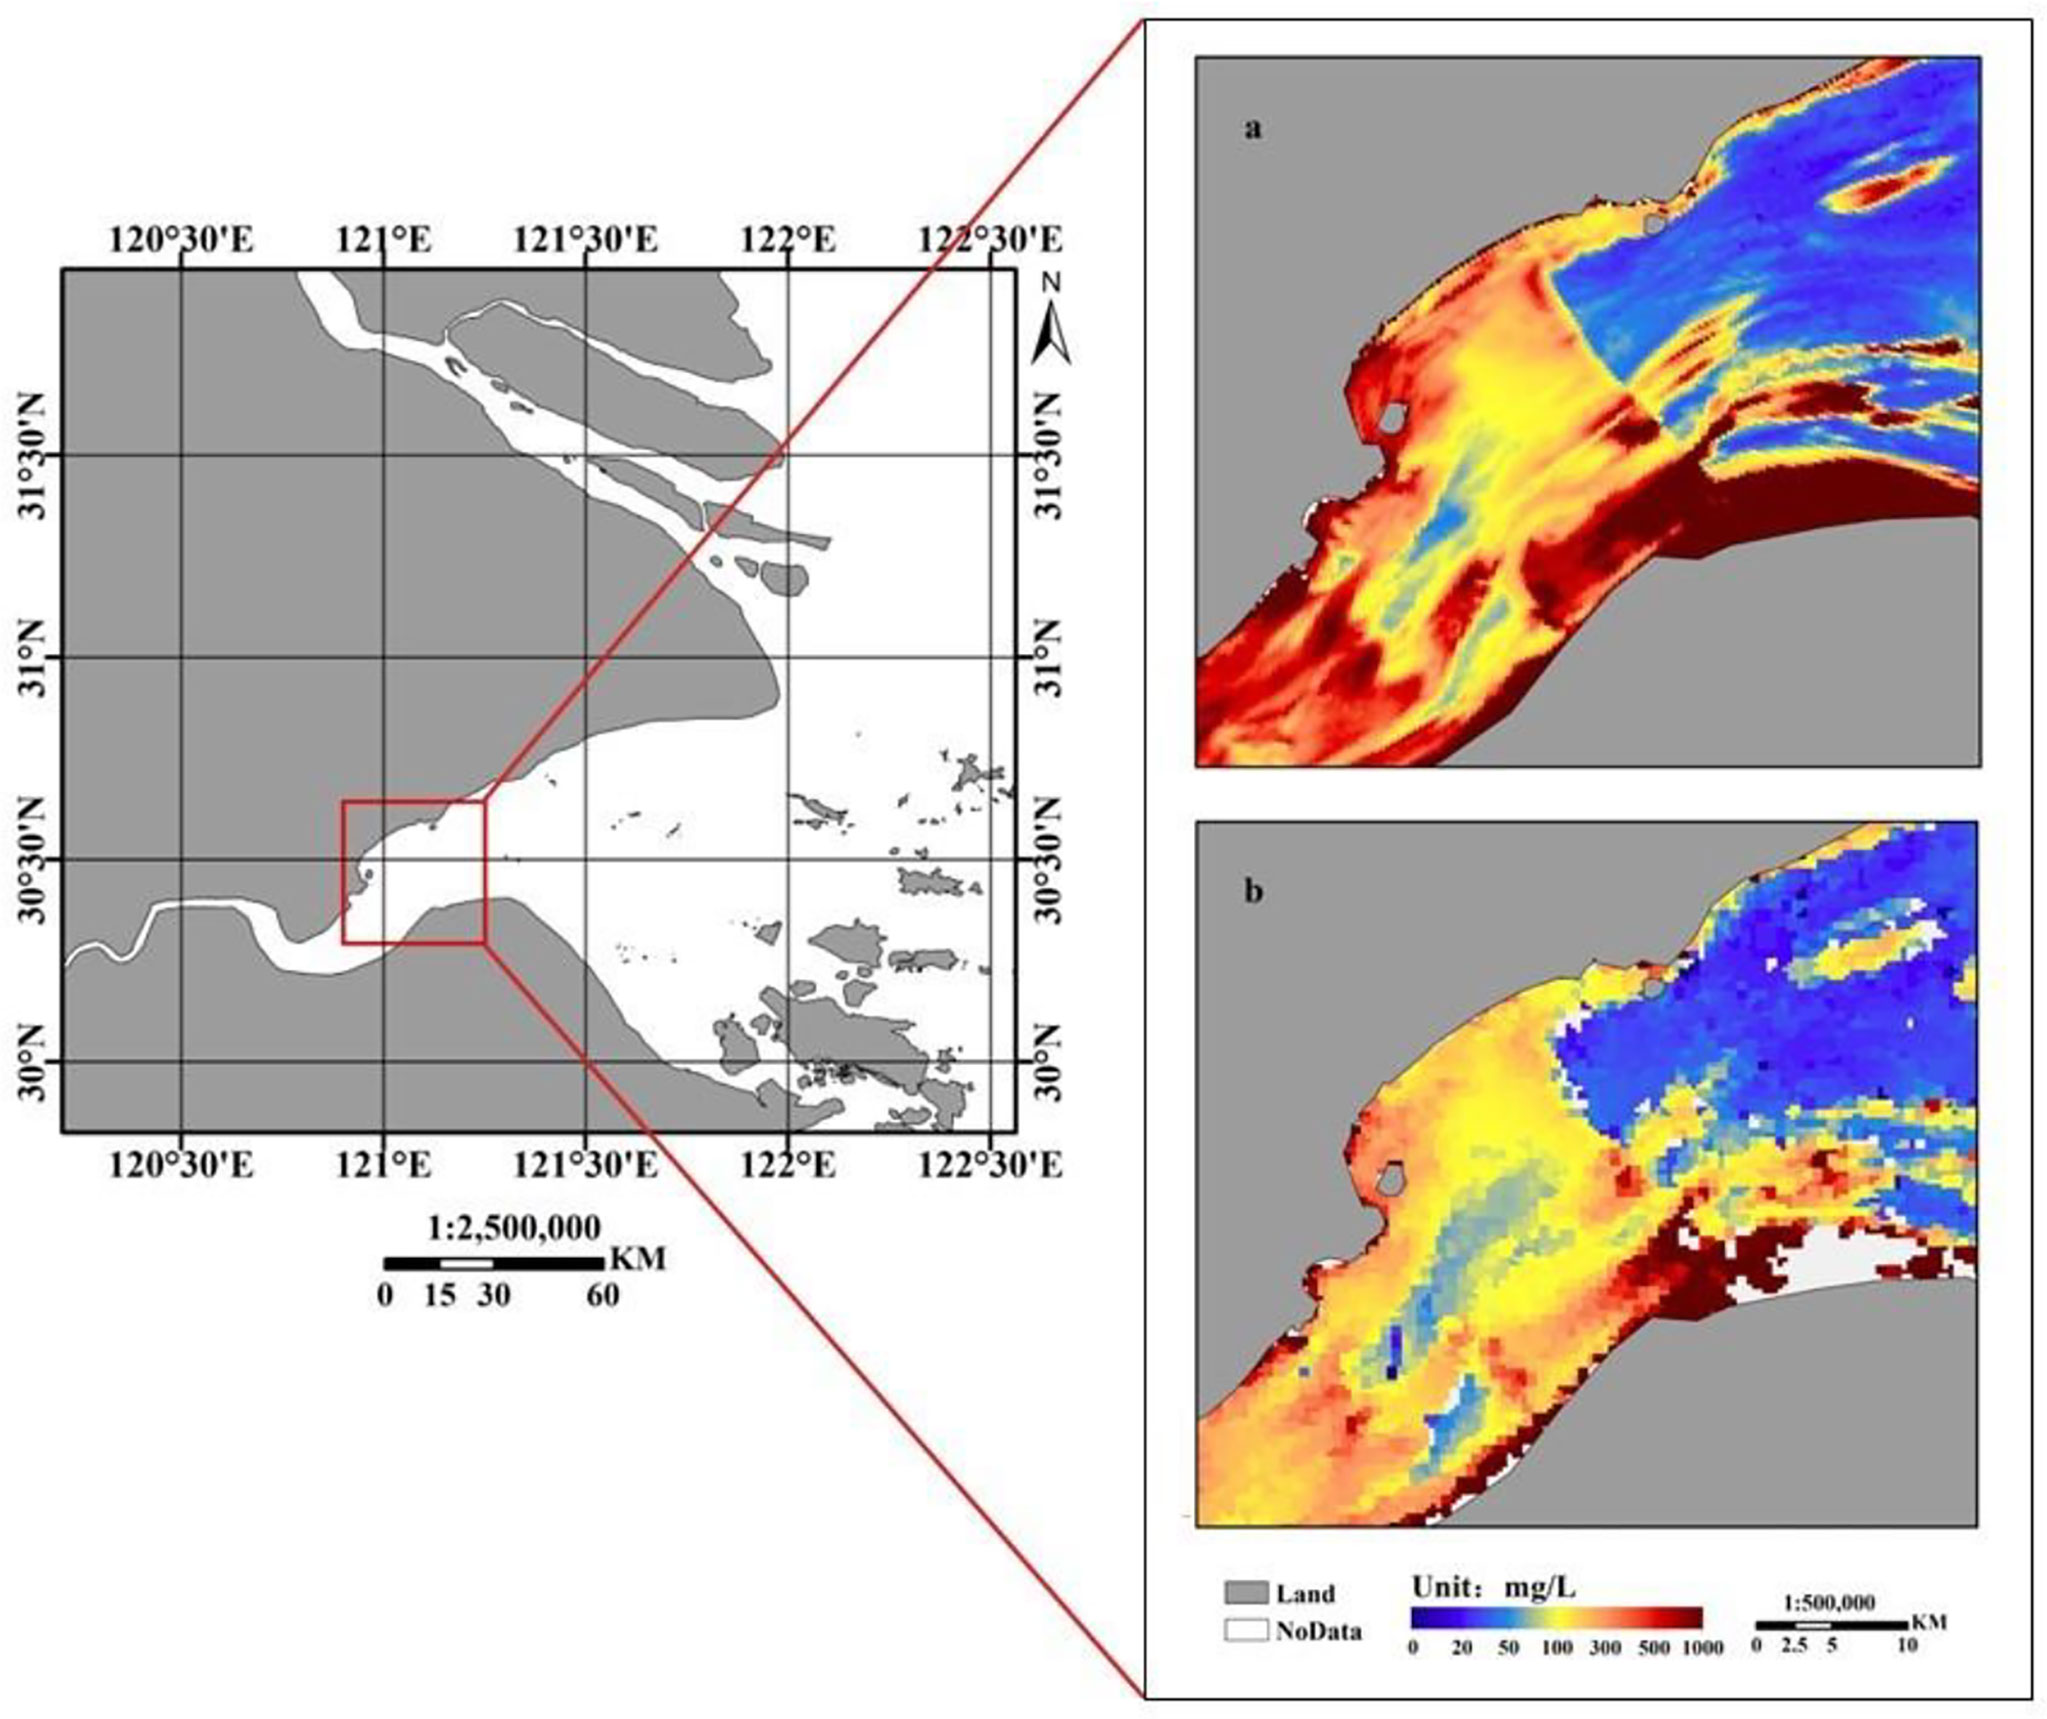
Figure 8 Comparison of partial SSC retrieval results of the study area based on OLCI (A) and GOCI (B) data.
To further verify the reliability of the retrieval model, another set of remote sensing images covering the Hangzhou Bay area under clear and low cloud conditions are selected and retrieved by the same method (Figure 9). The OLCI data was imaged at 10:17 a.m. on April 13, 2020, and the GOCI data was imaged at 10:16 a.m. on April 13, 2020. As shown in the figure, the waters in the study area showed a high SSC on that date. Specifically, the SSC on the north bank of the river is lower than that on the south bank of the river, and the lowest SSC in the study area is formed at a longitude of about 121°30′E on the north bank. Specifically, Figure 9A indicates that the SSC in the area at the top of the bay is lower than that in the area at the mouth of the bay. Also, at the longitude of about 121°15′E on the south bank of the river, the SSC increases steeply and forms a suspended sediment accumulation area with a high concentration.
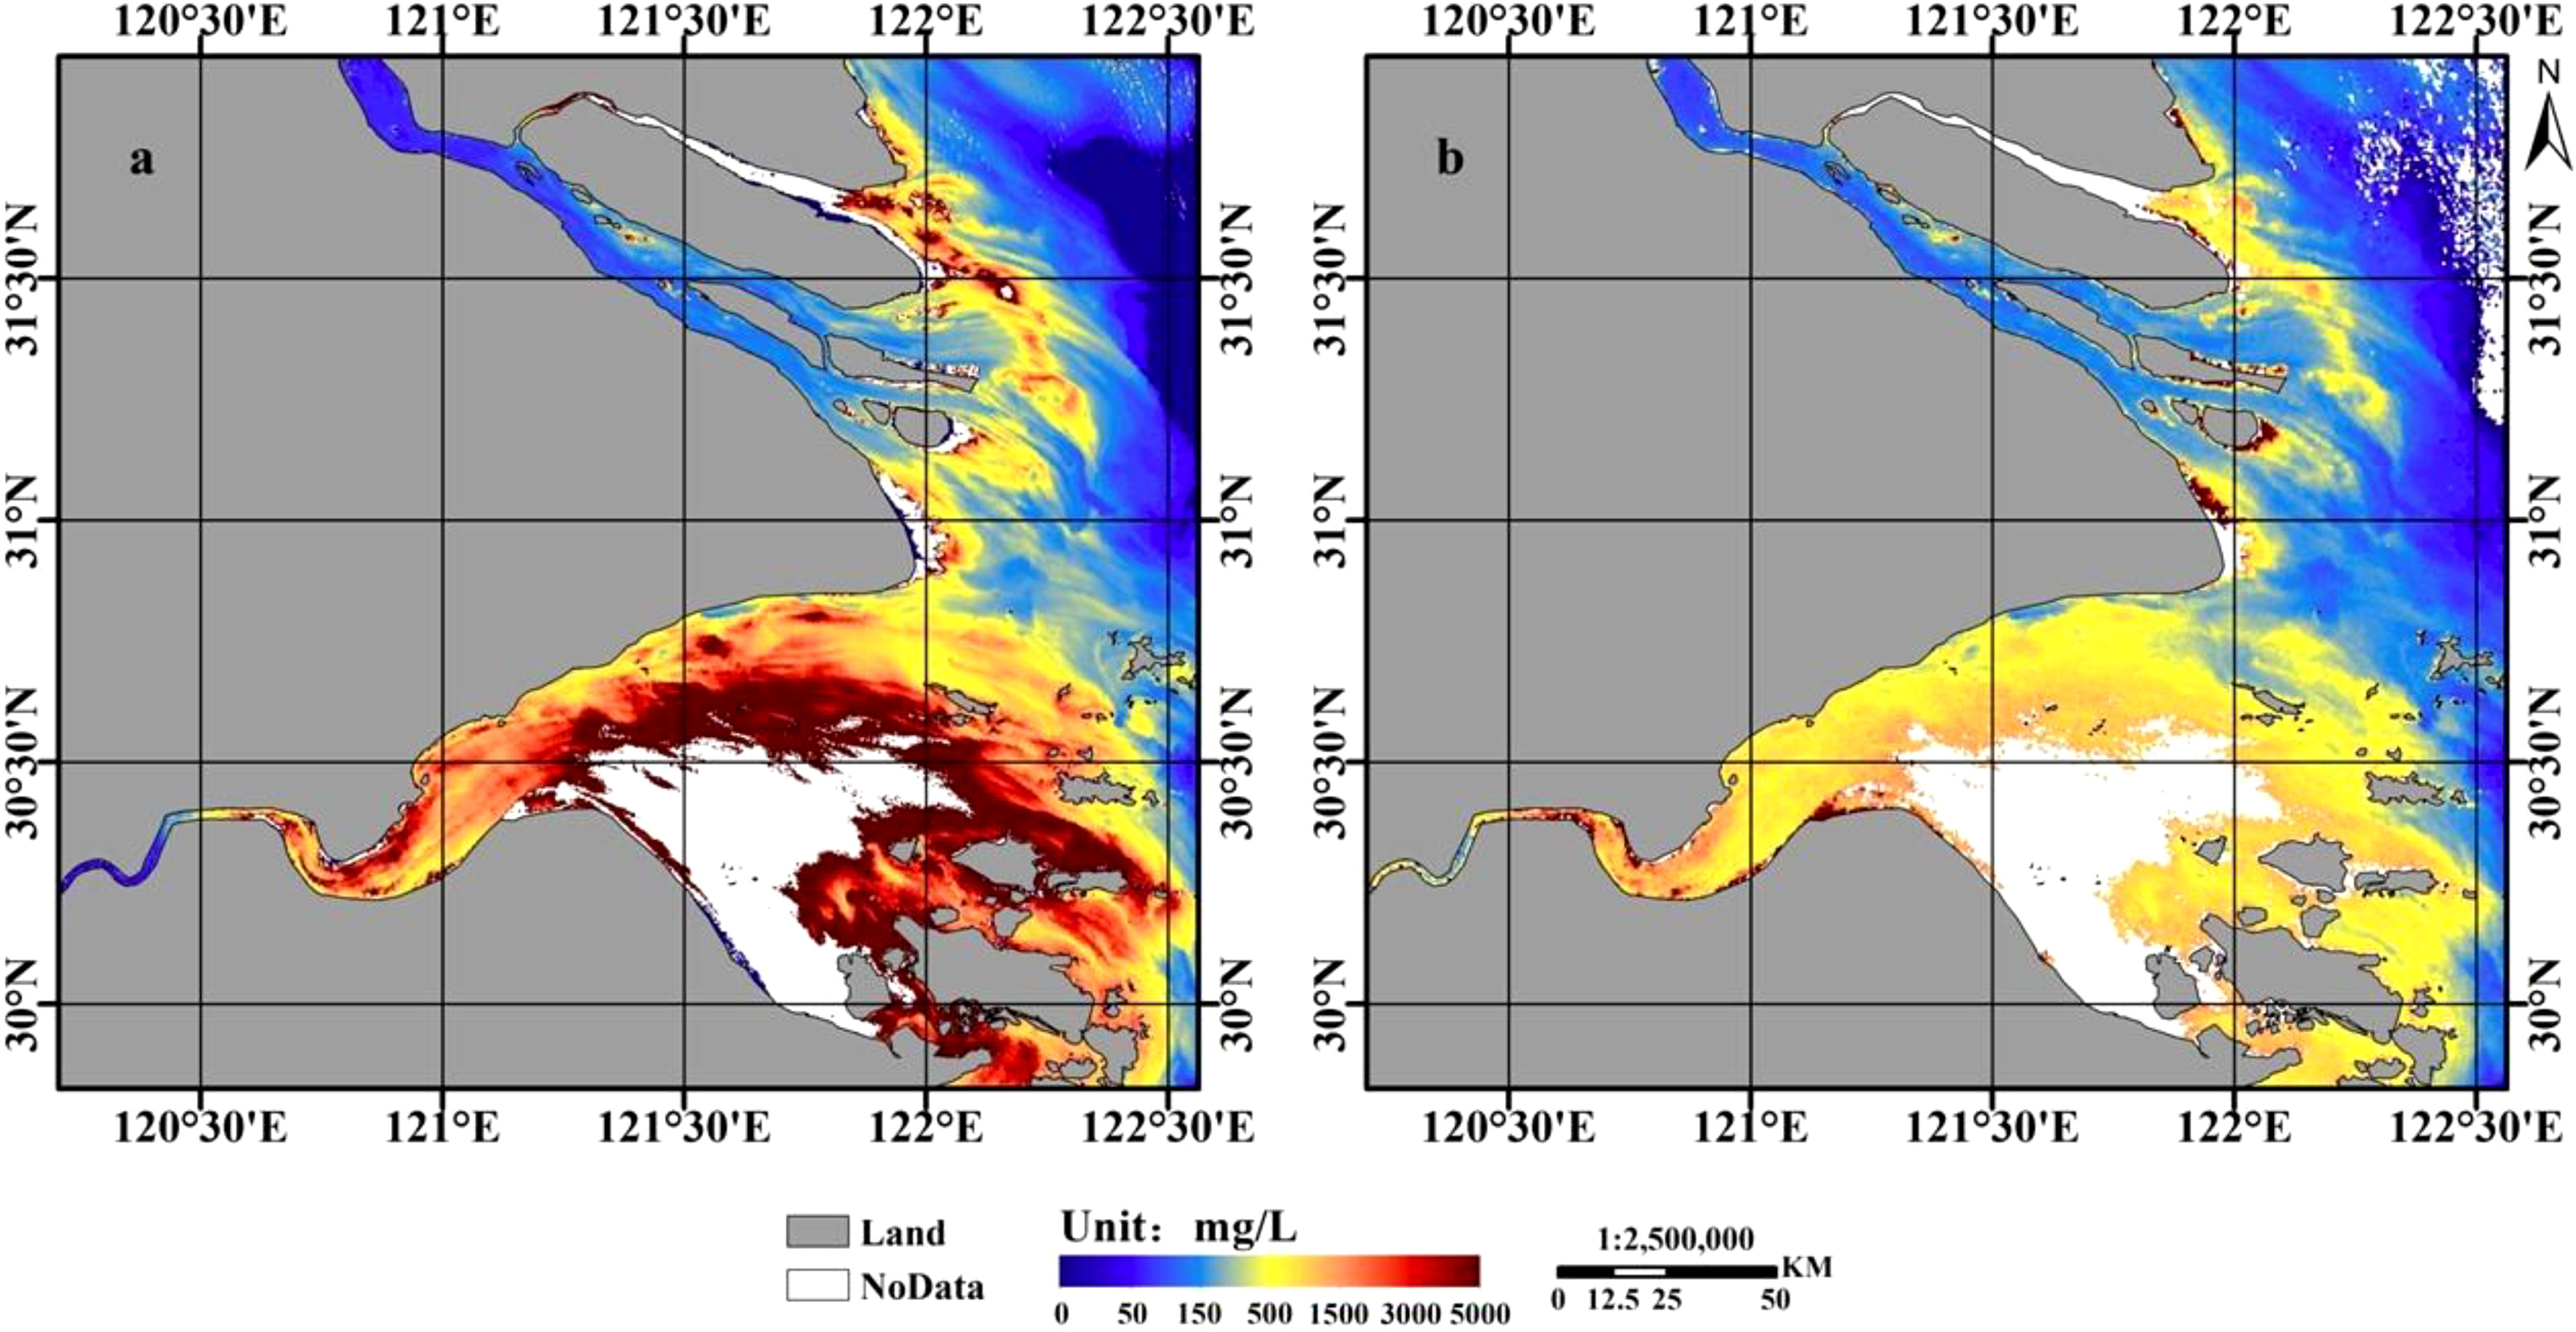
Figure 9 Retrieval results of SSC based on OLCI (A) and GOCI (B) data (April 13, 2020).
Combining the fieldwork experience with the theoretical basis, since the Hangzhou Bay area is located in the eastern coastal region of the continent near 30°N, it has a typical subtropical monsoon climate. Meanwhile, since the image was imaged at 10:17 a.m. on April 13, 2020, which was a mid-tide day (Figure 10), the tidal change has a certain influence on the suspended sediment distribution in the study area. Therefore, it can be seen that since the water level of the Hangzhou Bay area is not high in spring, and the tide was receding at this time. In this case, a large amount of suspended sediment accumulated at the bottom of the river bed on the convex bank of the river was exposed, resulting in the distribution of suspended sediment shown in the figure. Figure 6 and Figure 9 indicate that the distribution of SSC in the Hangzhou Bay waters under the influence of different tidal patterns in different seasons varies greatly, which further confirms the diversity of suspended sediment distribution in Hangzhou Bay waters.
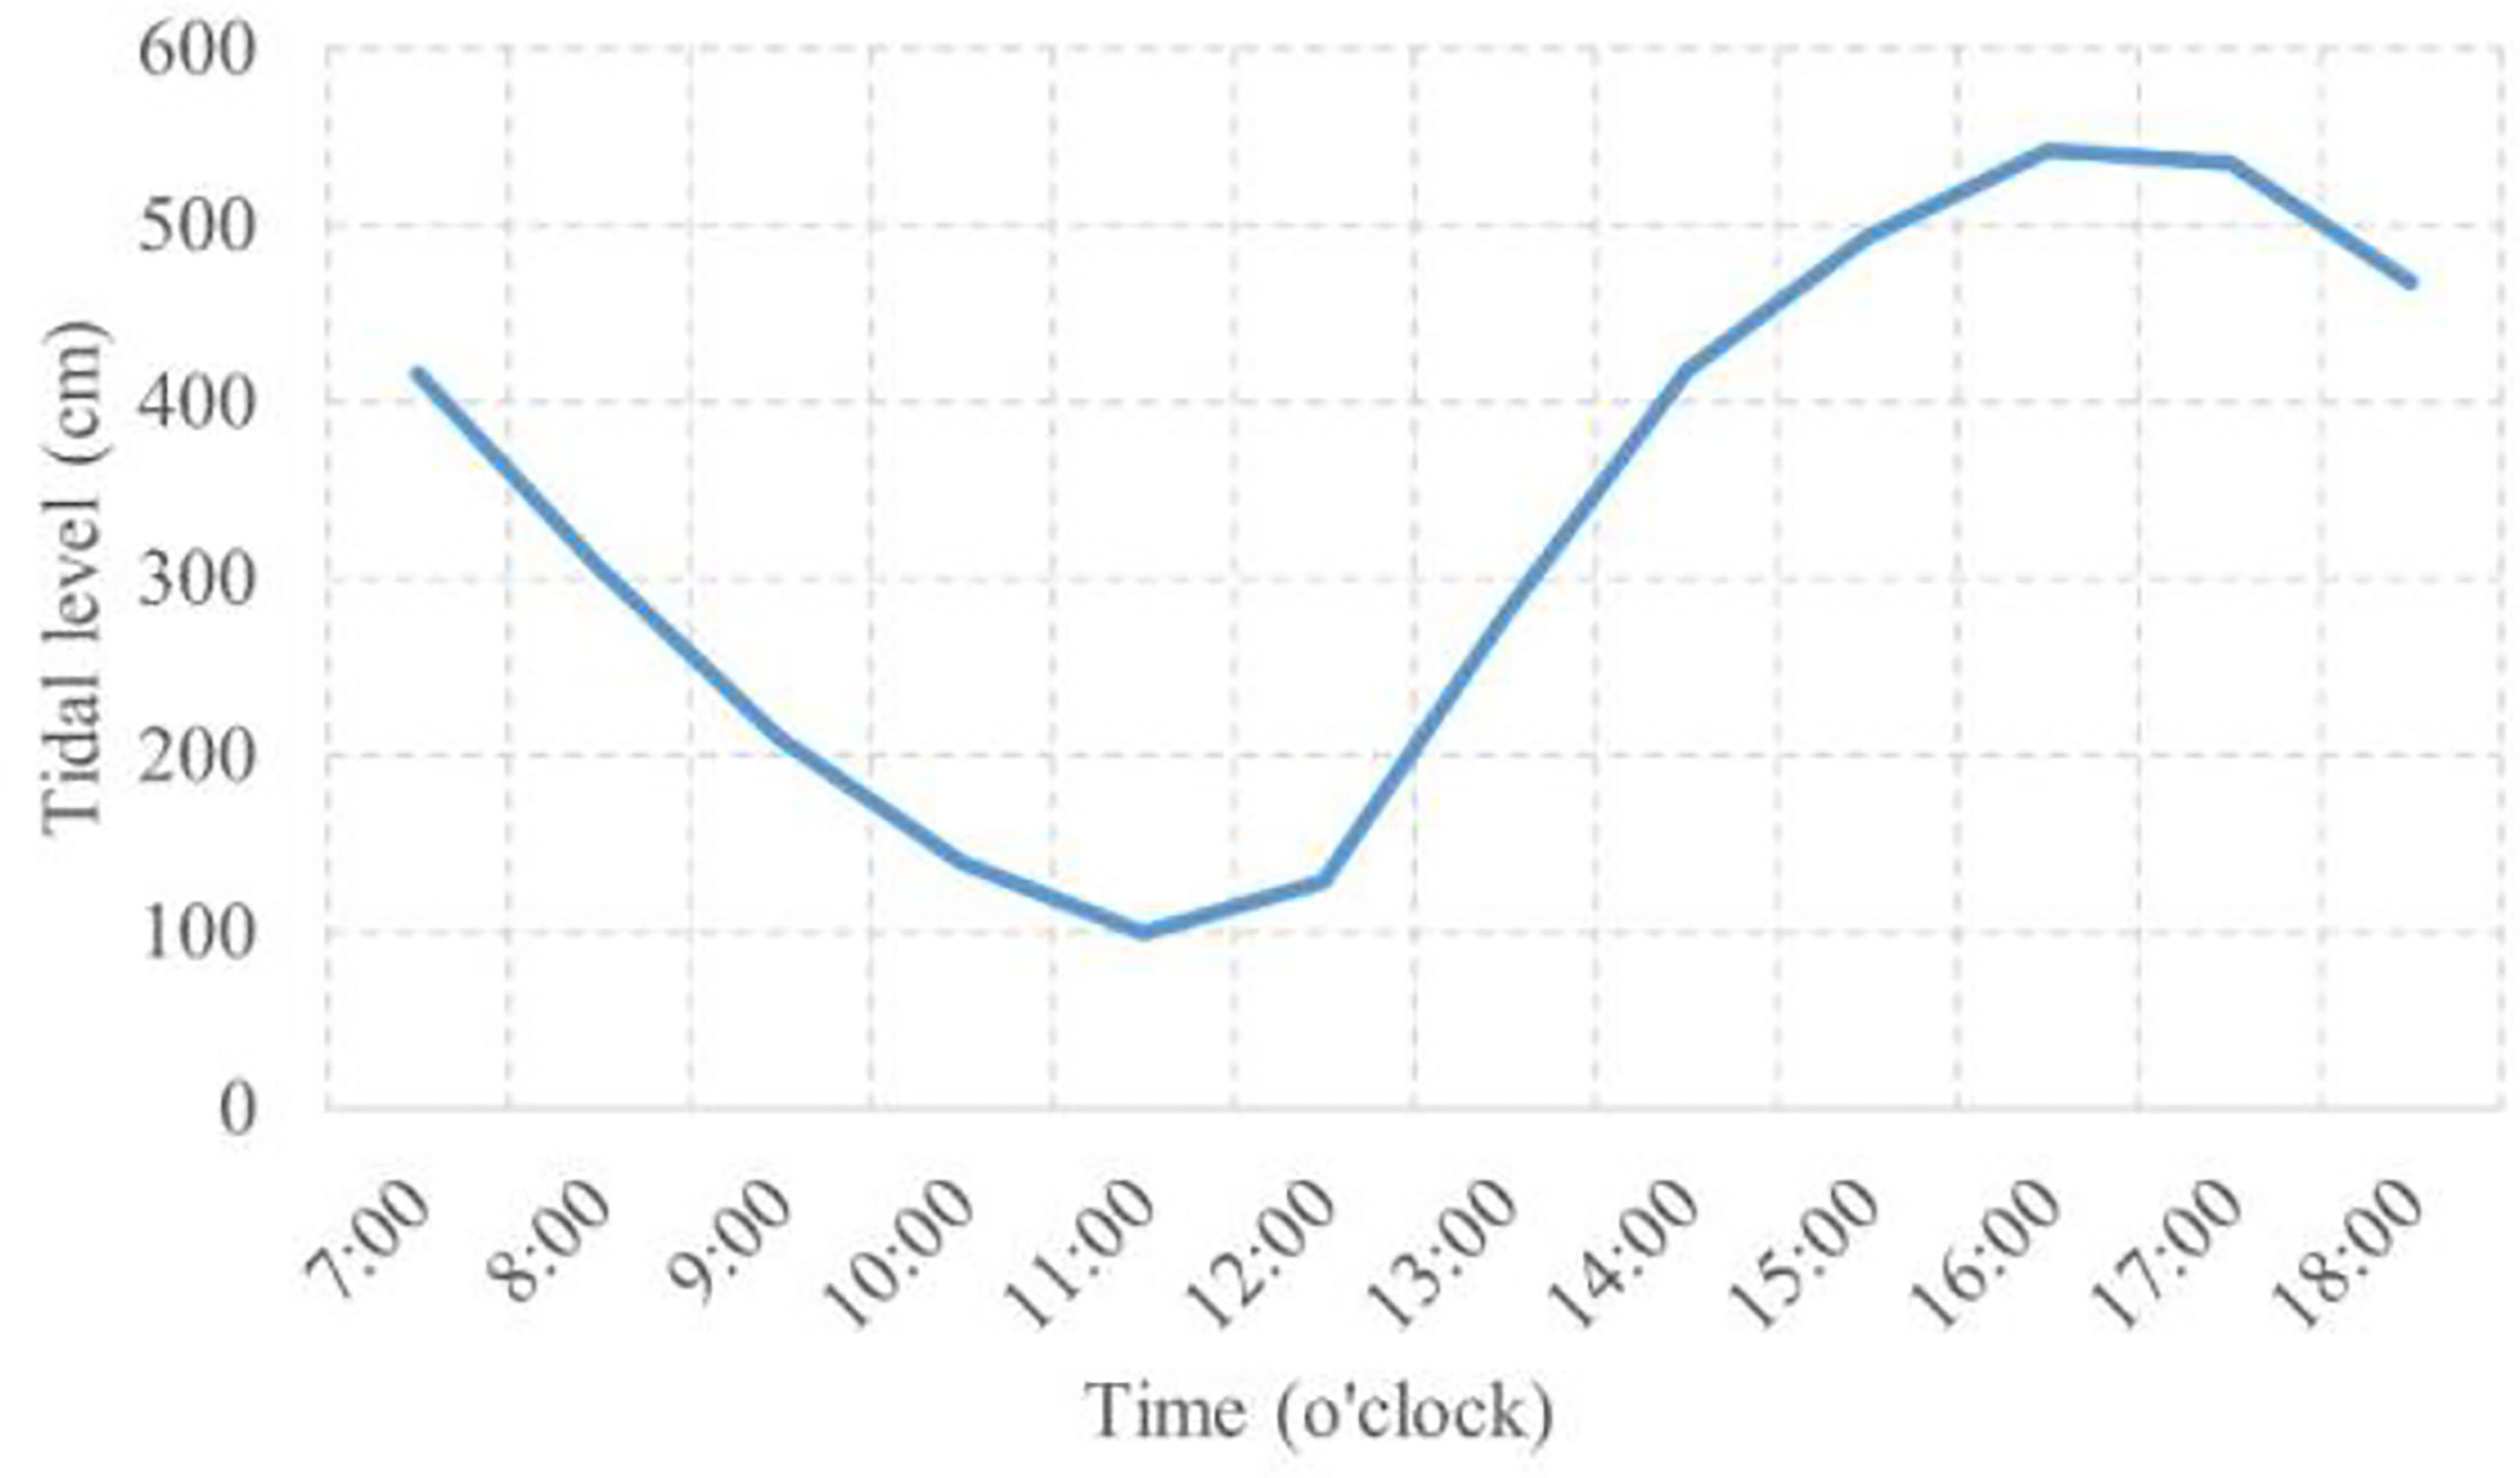
Figure 10 Tidal changes in the study area (April 13, 2020).
To sum up, the high complexity and diversity of the distribution of SSC in the study area are mainly due to the special topography and other objective factors in the Hangzhou Bay area. This results in complex and diverse internal hydrodynamic conditions [it mainly shows a trend of decreasing and then increasing from the bay mouth area to the top of the bay (Ye, 2019)], thus presenting a large variation of regional SSC.
Comparison of satellite retrieved results
Comparing Figure 6 and Figure 9, the distribution of SSC based on the retrieval of the two data sources shows that the SSC in the study area based on the retrieval of OLCI data is higher than that based on the retrieval of GOCI data. This phenomenon is more obvious in waters with a high SSC, while there is little difference between the two in waters with a low concentration. Specifically, in the top area of the bay where the channel is the narrowest, the SSC is high in the entire study area due to the rapid flow and the strong resuspension of suspended materials in this water. Comparing the two images in Figure 6, it can be found that the SSC based on the retrieval of OLCI data is slightly higher than that based on the retrieval of GOCI data, which is consistent with the result shown in Figure 9. Meanwhile, in the area near the convex bank, the SSC in this water is the maximum because it is on the south bank of the river; the flow velocity is slower, and the sinking and siltation effect is more obvious. By comparing Figure 6 and Figure 9, it can be seen that the SSC obtained from the retrieval based on OLCI data are significantly higher than that obtained from the retrieval based on GOCI data. This result can be also observed for the waters with a high SSC near the longitude of 121°30′E. In Figure 6, the SSC between the top of the bay and the mouth of the bay and near the north coast (121°00′E to 121°20′E) is low, and the same result can be obtained based on the retrieval of the two data sources.
To further improve the visualization of the retrieval data, the following will divide the area (Figure 11), and select 4 waters under the influence of different hydrodynamic conditions as the experimental region. As shown in Figure 12 and Figure 13, the retrieval results were quantitatively analyzed (the specific values are shown in Table 4 and Table 5 respectively) to evaluate the applicability of using OLCI data to retrieve the SSC in the study area. Among them, Region A is located at the top of the bay, with a narrow and curved channel, faster current flow and stronger re-suspension capacity; Region B is near the south coast of Hangzhou Bay, with slower current flow and shallower water depth; Region C is located in the key part of Hangzhou Bay tidal channel, mainly affected by the scouring effect of the current; Region D is located in Zhoushan archipelago near the mouth of the bay, less affected by Hangzhou Bay tides. Due to the threshold setting in the atmospheric correction process (the specific atmospheric correction calculation procedure can be found in He et al., 2012), the data for 2020 has the problem that the values in the area of high SSC located on the south bank of the river and near the mouth of the bay are covered by a mask. Therefore, this study will avoid these regions with missing values for cross-validation and analysis.
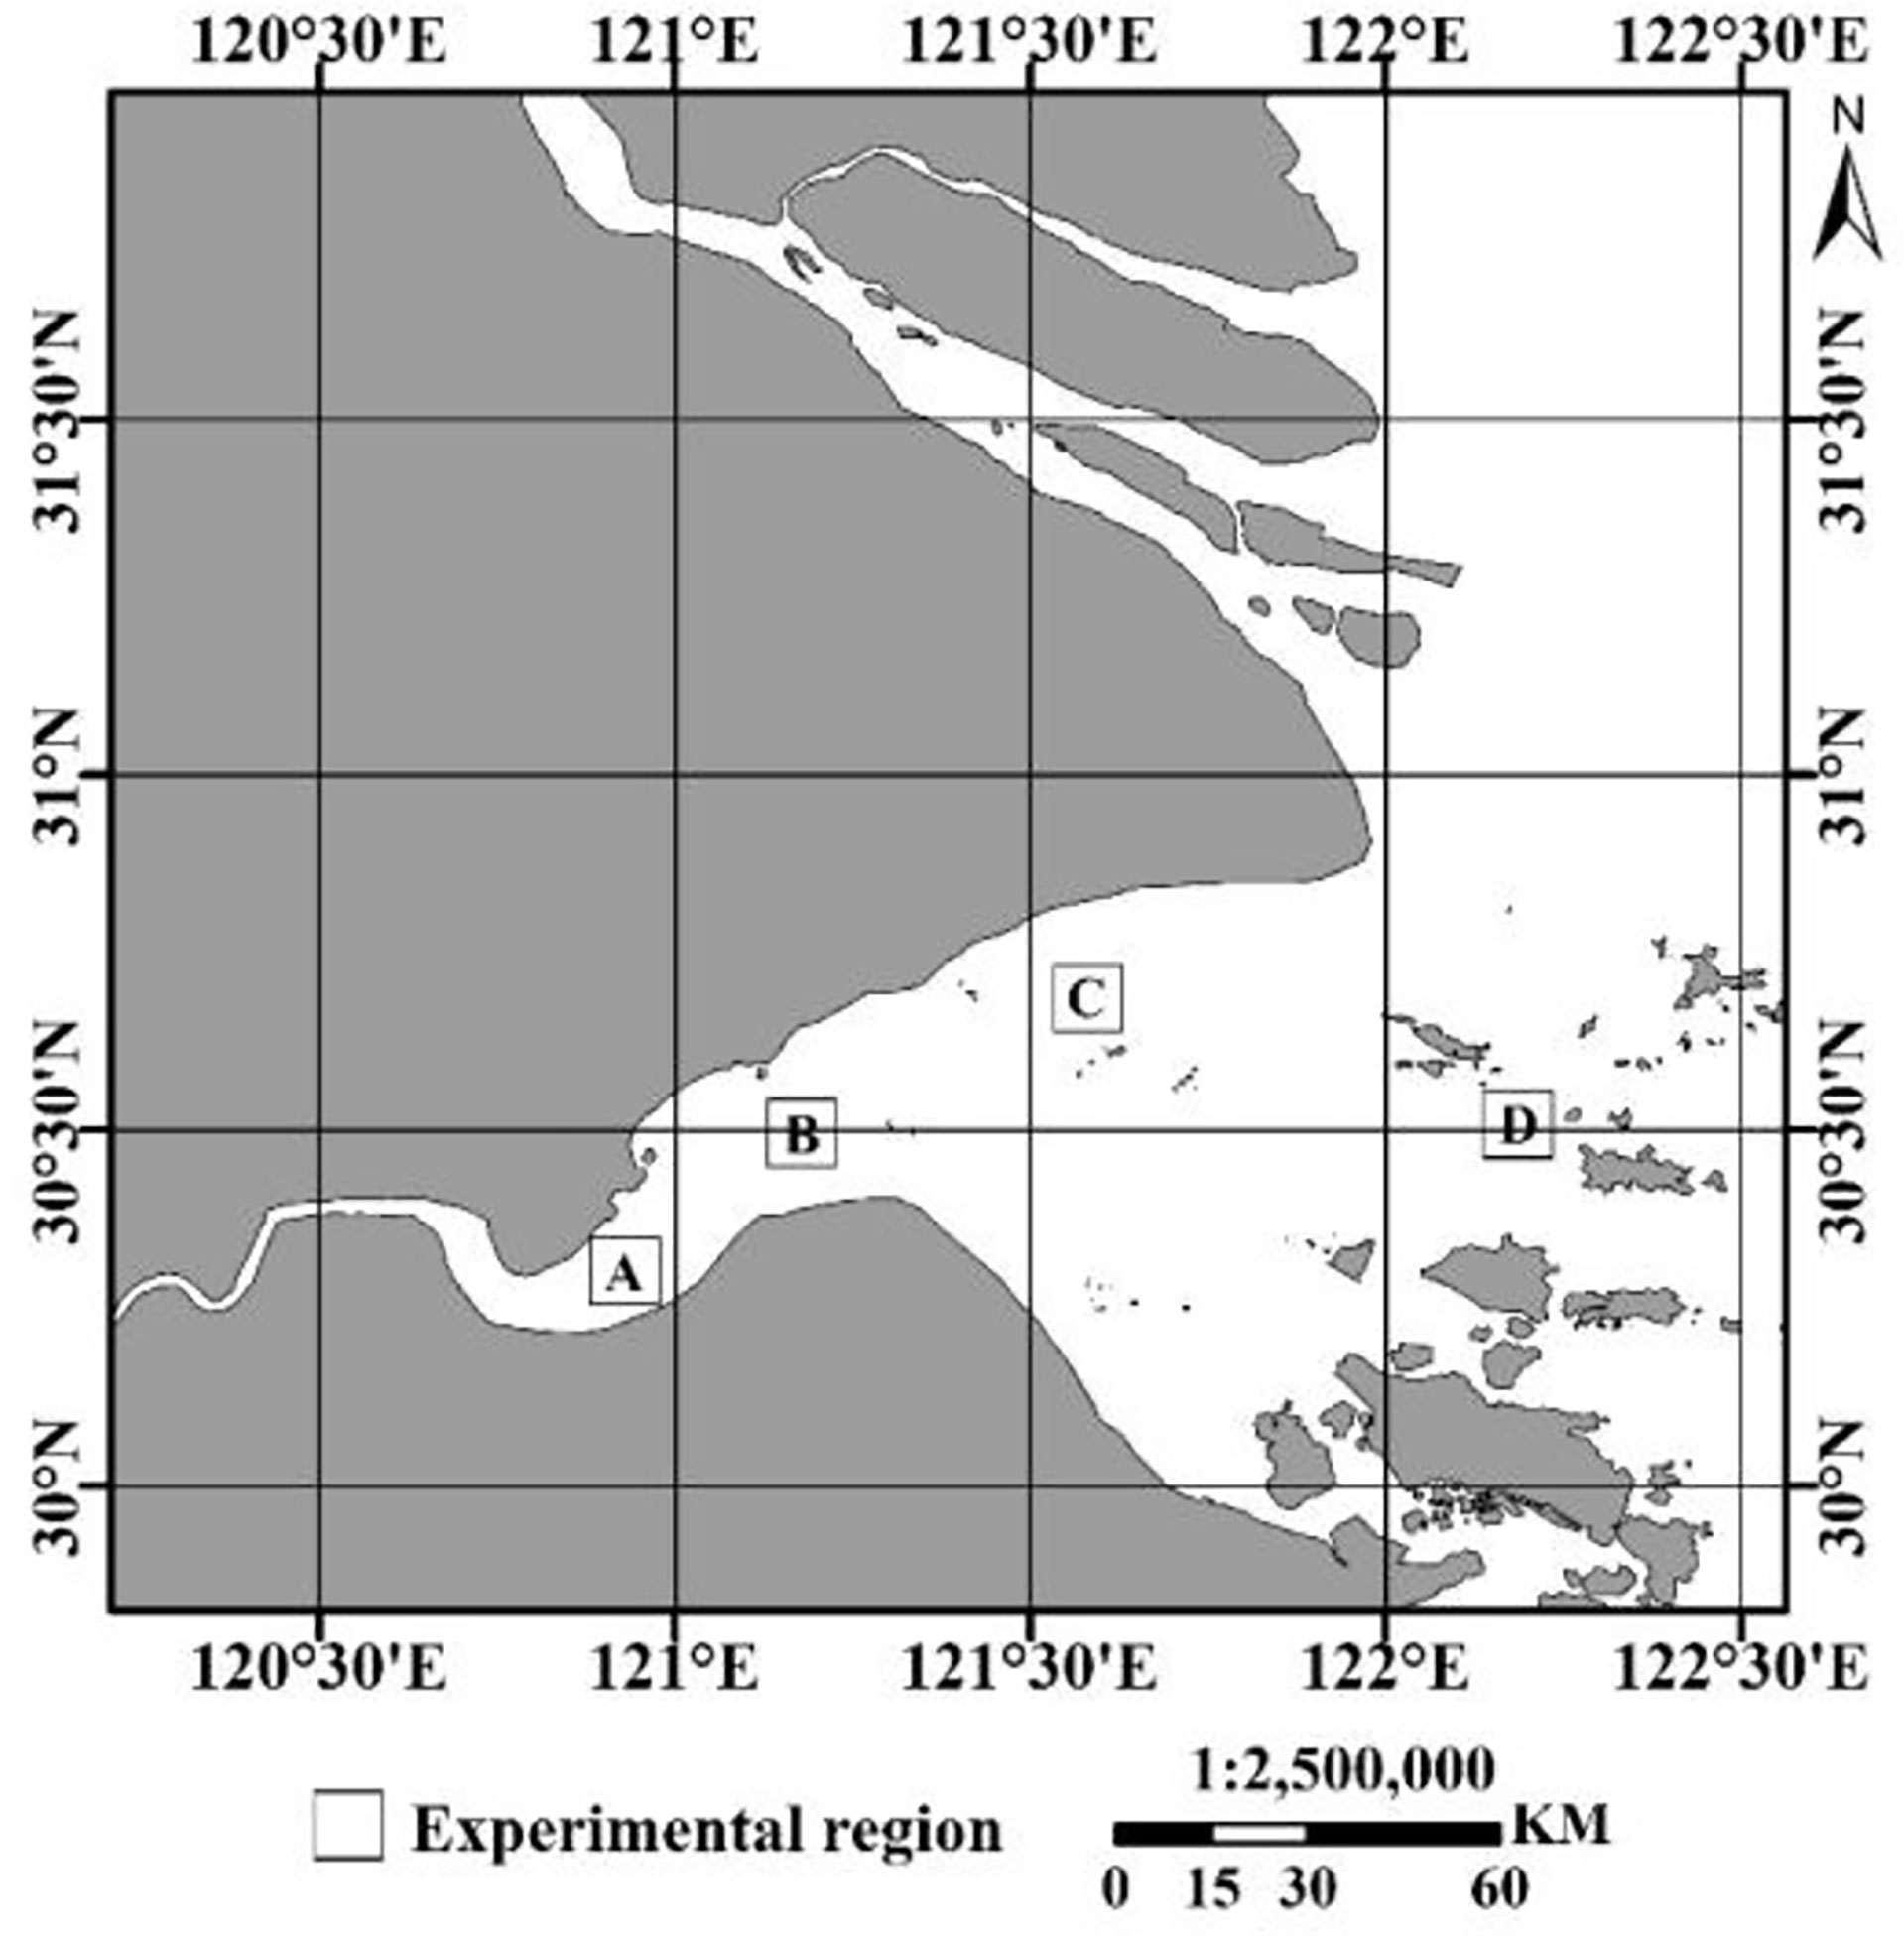
Figure 11 Experimental region division of suspended sediment average concentration statistics.
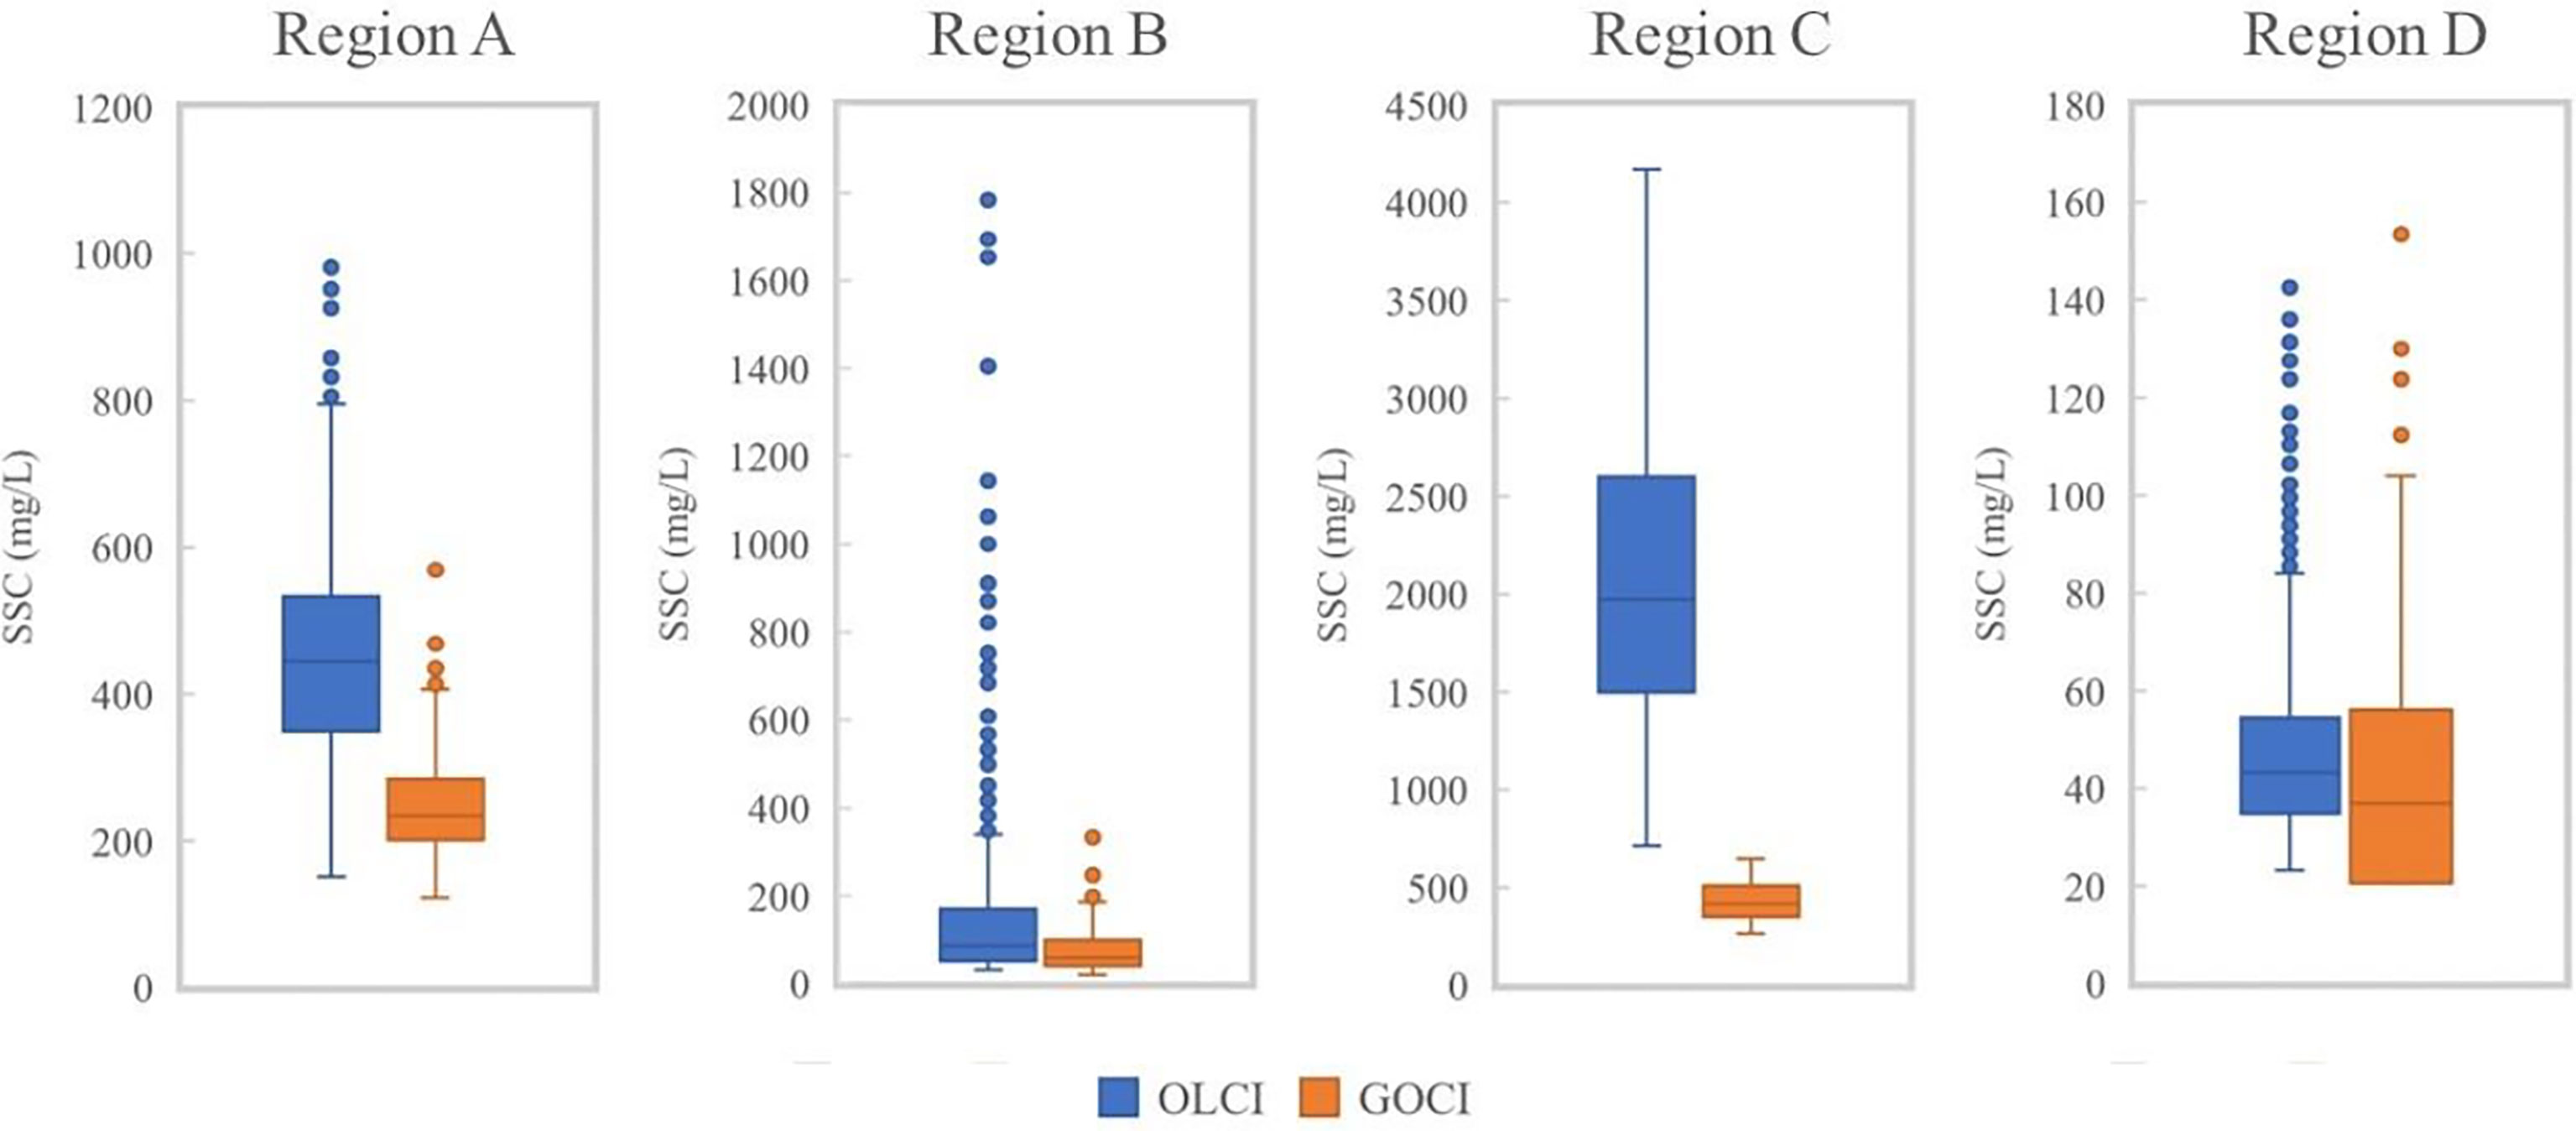
Figure 12 Box line plots of SSC in four experimental regions based on 2017 data.
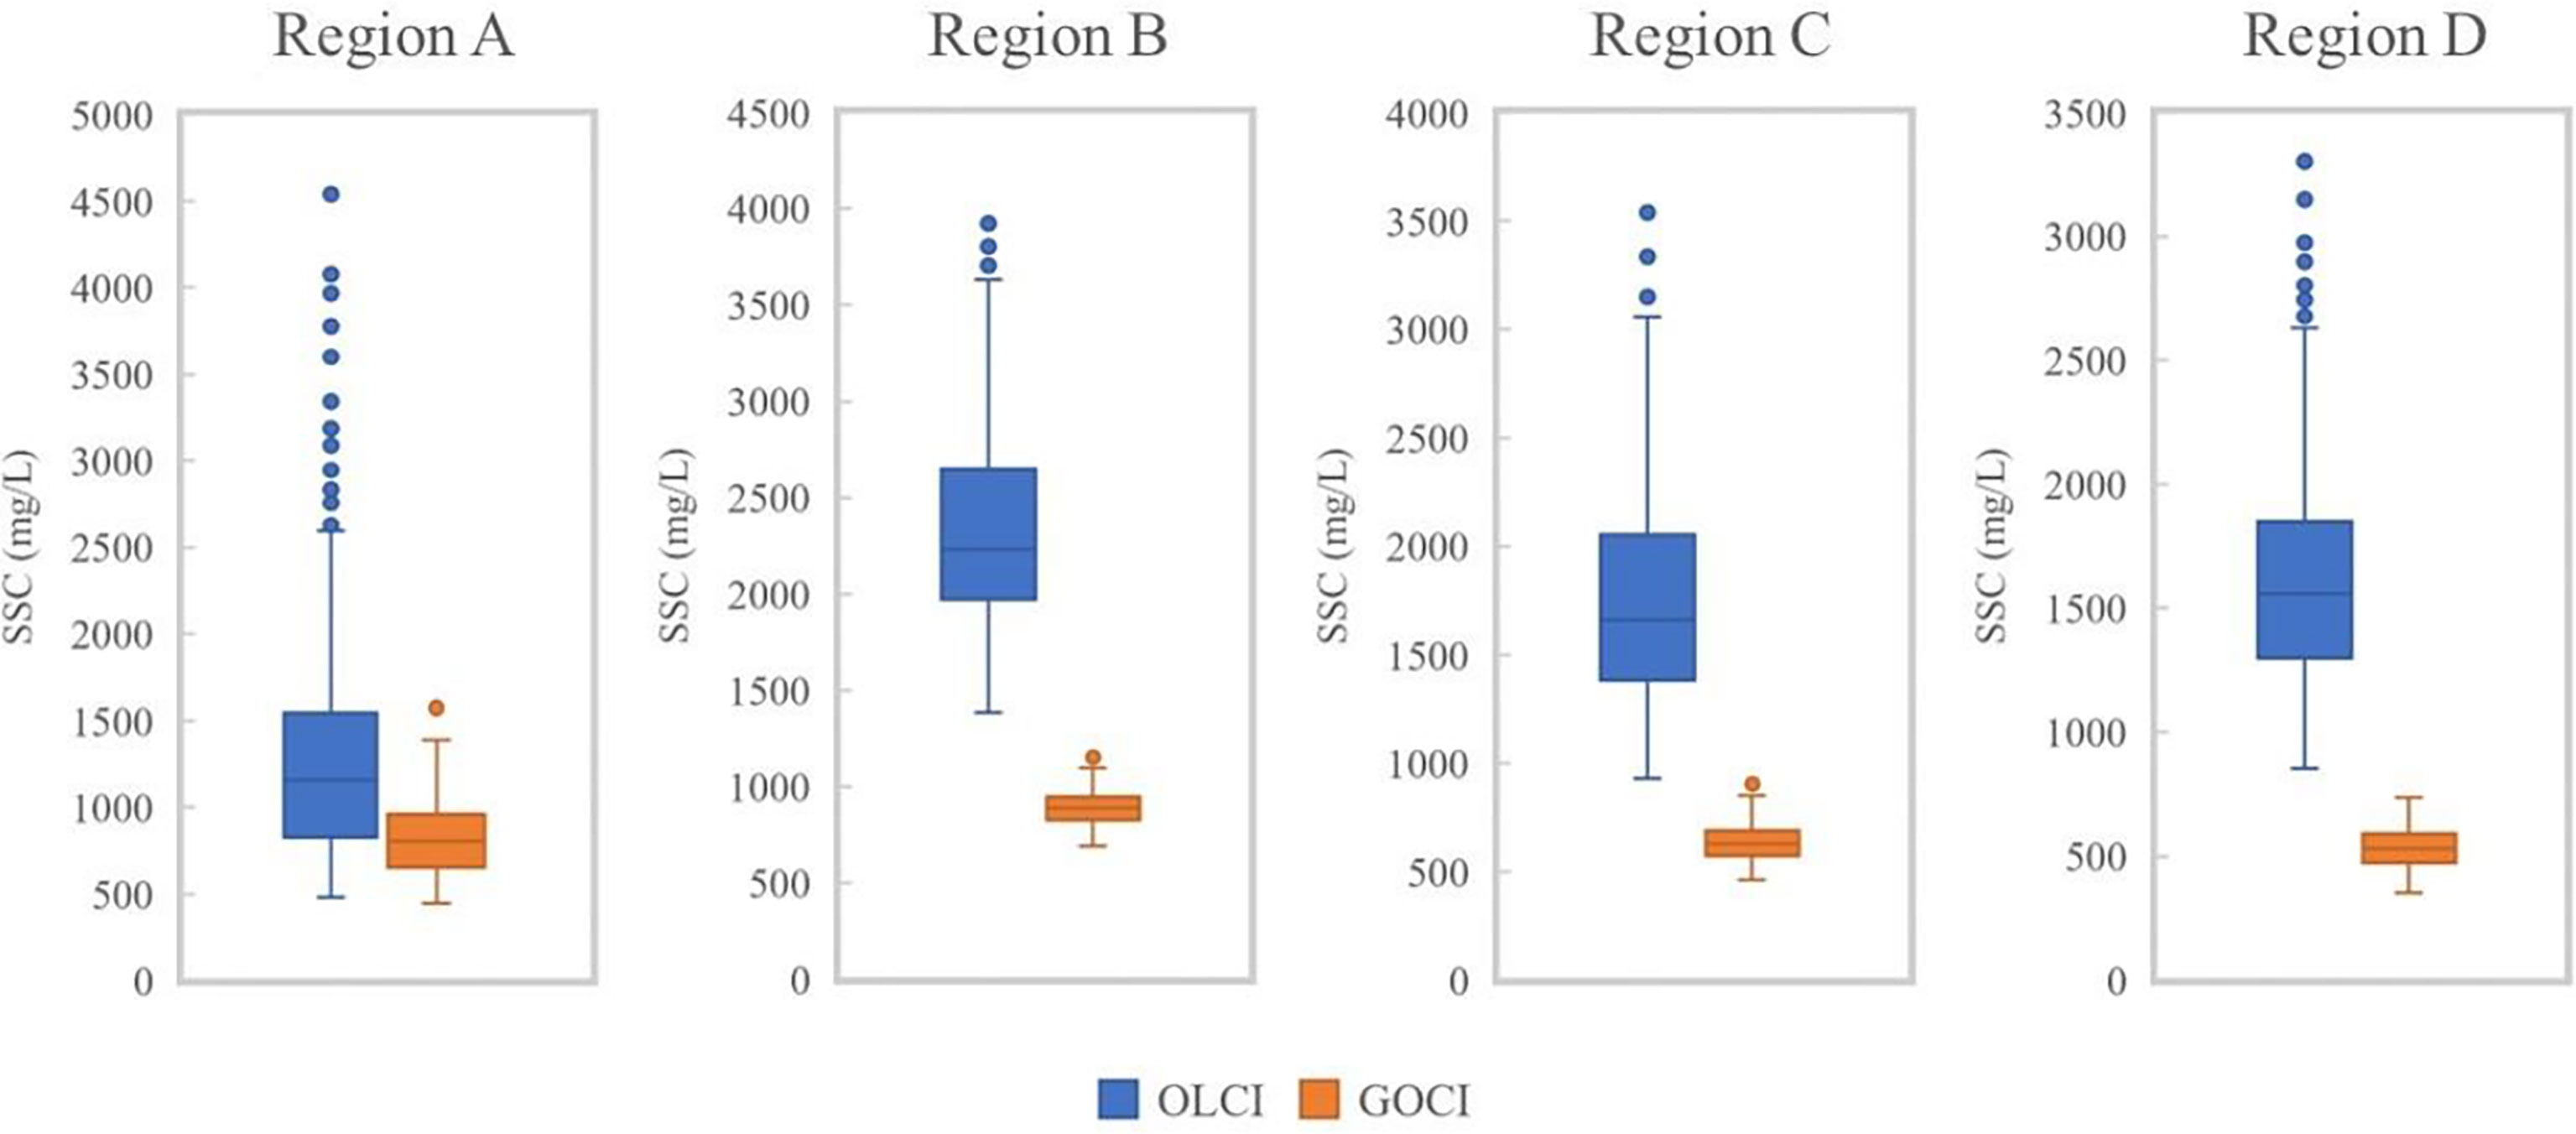
Figure 13 Box line plots of SSC in four experimental regions based on 2020 data.
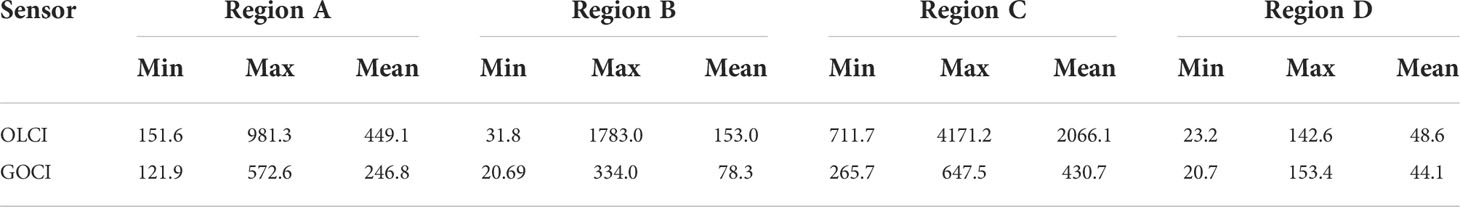
Table 4 Statistics of SSC in the experimental regions based on 2017 data (unit: mg/L).
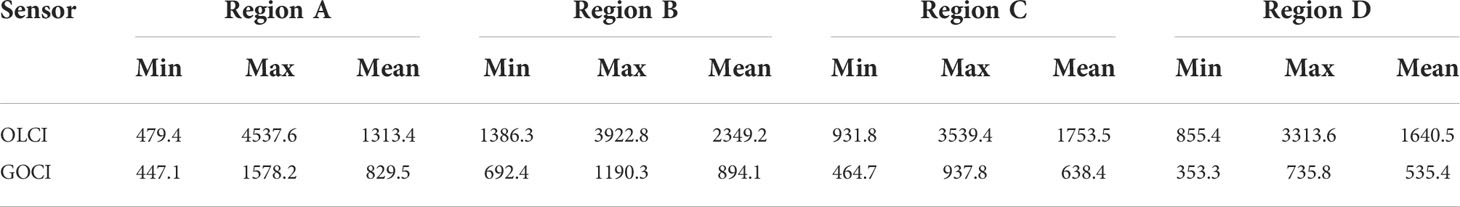
Table 5 Statistics of SSC in the experimental regions based on 2020 data (unit: mg/L).
Combining Figure 12 with Table 4, it can be seen that the SSC in the water bodies of Region D and Region B belong to the lower level in the range of the study area in the retrieval results of the 2017 data. Among them, the average SSC based on OLCI data were about 48.6 mg/L and 153.0 mg/L, while the average SSC based on GOCI data retrieval were about 44.1 mg/L and 78.3 mg/L, the former was about 10.2% and 95.4% higher than the latter, respectively. The SSC in the water bodies of region A and region C are at high levels within the study area, where the average SSC based on OLCI data are about 449.1 mg/L and 2066 mg/L, respectively, while the average SSC based on the retrieval of GOCI data are about 246.8 mg/L and 430.7 mg/L, respectively, the former being higher than the latter by about 82.0% and 379.7%, respectively. In summary, comparing the retrieval results based on the two data sources, the numerical difference is more obvious in the waters with higher SSC; comparing the average SSC in different areas in the retrieval results of each data source, the difference between the areas with high SSC and low SSC is larger in the retrieval results based on OLCI data, while the results based on GOCI data are relatively smaller. During the high tide (July 23, 2017), SSC levels were high in Region C and at low levels in Region B.
In addition, for the retrieval results in 2020, combining Figure 13 with Table 5, it can be seen that the SSC in the study area is generally at a high level during the mid-tide (April 13, 2020). Among them, the SSC in the water body of Region B is relatively the highest, and its average SSC based on OLCI data is about 2349.2 mg/L, while the average SSC based on GOCI data retrieval is about 894.1 mg/L, and the former is about 162.7% higher than the latter. In summary, the overall SSC in the study area based on OLCI data is generally higher than that based on GOCI data, and the difference in the estimated SSC between the two retrievals becomes more and more obvious as the SSC in water increases.
In different SSC intervals in the study area, the estimated concentrations with different numerical differences are obtained based on the retrieval of OLCI and GOCI data. The main reason is that the retrieval models applied to the two images are exponential models with e-based parameters. Since the base as an index is greater than 1, the estimation results will keep increasing with the increase of the independent variable and its rate will also increase rapidly, which leads to a larger difference between the estimated concentrations obtained from the retrieval based on OLCI and GOCI data in the region of high SSC, while in the region of low concentration, the difference between the two shows less obvious. In addition, since the SSC in the in-situ data are all relatively low, the retrieval accuracy of the proposed retrieval model is higher in the low concentration region, while there are some errors in the high concentration region. Furthermore, the atmospheric correction results of COCI data also have some influence on the error of the final retrieval results. A study (Li et al., 2015) pointed out that the atmospheric correction algorithm of GOCI satellite is not accurate enough in highly turbid water bodies, and the water-leaving radiance in the near-infrared band is not accurate enough, which leads to the difference of remote sensing reflectance of GOCI satellite with the increase of water turbidity, and this is the main reason for the difference of the retrieval results based on OLCI and GOCI data in this study.
Conclusions
In this study, the remote sensing retrieval model of SSC on the Hangzhou Bay estuar based on OLCI data was investigated using Sentinel-3A/OLCI. The main research method is to calculate the equivalent band remote sensing reflectance by combining in-situ data and satellite sensor spectral response function, then do the correlation analysis between remote sensing reflectance and in-situ data to select the applicable band. The equivalent band remote sensing reflectance of well-correlated bands is used to construct the remote sensing factor, and the best retrieval model is obtained by computational analysis. The retrieval model is finally applied to the pre-processed remote sensing images to obtain the distribution of SSC in the study area based on remote sensing images.
To evaluate the applicability of the retrieval results of SSC in the study area obtained based on the OLCI sensor, this study also utilized the retrieval results based on GOCI data for cross-validation. Through the computational analysis of the experimental data and results, the following conclusions were reached from this study:
1. The atmospheric correction based on the UV-AC algorithm for both OLCI and GOCI data can obtain more satisfactory results, and the former has a higher overall correction accuracy than the latter. For OLCI data, the bands with the highest atmospheric correction accuracy are blue, red and NIR bands; for GOCI data, the bands with the highest atmospheric correction accuracy are red and NIR bands.
2. The multi-band index model constructed with Rrs(Oa16)/Rrs(Oa5) of OLCI data as remote sensing factors has higher retrieval accuracy and model stability; the R2 is 0.96, the MRE is 17.52%, and the RMSE is 69.10 mg/L.
3. The spatial distribution of SSC in the study area is mainly as follows: the SSC at the top of the bay is greater than that at the mouth of the bay; the SSC at the south shore is greater than that at the north shore. The special geographical environment of Hangzhou Bay makes the hydrodynamic conditions in the area very diverse, which is one of the reasons for the complexity of the spatial distribution of SSC in the area.
4. By comparing the retrieval results of OLCI data and GOCI data, the general trend of SSC distribution in the study area obtained from both retrievals tends to be consistent, but the estimated SSC based on OLCI data is higher than the estimated concentration from GOCI data. Moreover, the numerical differences between the retrieval results of the two data sources are more obvious in the waters with high SSC, but not much in the waters with low SSC. This phenomenon is mainly attributed to the fact that the structure of the retrieval models constructed based on the two data sources is an exponential model with an e-base, the in-situ data used to construct the models have lower SSC, and the atmospheric correction error of the GOCI data in highly turbid waters.
5. The study shows that the OLCI data can be better used for monitoring SSC in Hangzhou Bay with suitable atmospheric correction methods and retrieval models. Moreover, its excellent spectral resolution can provide more options for remote sensing retrieval of suspended sediment, and its experimental results can meet more application requirements. The research method and retrieval model proposed in this study can also provide a certain reference value and basis for the research involving remote sensing water color retrieval.
Data availability statement
The data set generated to support the conclusions of this article will be made available by the authors upon request.
Author contributions
ZY: Investigation, Supervision, Methodology, Reviewing. JW: Conceptualization, Data curation, Methodology, Writing-Original draft. YL: Validation, Methodology, Reviewing. CS: Reviewing and Editing. BW: Reviewing and Editing. XH: Methodology and Editing. HX: Reviewing and Editing. YX: Editing. BZ: Methodology and Editing. All authors contributed to the article and approved the submitted version.
Funding
This research was jointly supported by National Key Research and Development Program of China (2016YFC1400906), National Natural Science Foundation of China (42071333; 41206169, and 41931076), and the Scientific Research Foundation of Hangzhou Normal University (2020QDL015).
Conflict of interest
The authors declare that the research was conducted in the absence of any commercial or financial relationships that could be construed as a potential conflict of interest.
Publisher’s note
All claims expressed in this article are solely those of the authors and do not necessarily represent those of their affiliated organizations, or those of the publisher, the editors and the reviewers. Any product that may be evaluated in this article, or claim that may be made by its manufacturer, is not guaranteed or endorsed by the publisher.
References
Bi S., Li Y., Lv H., Zhu L., Mou M., Lei S., et al. (2018). Estimation of chlorophyll-a concentration in lake erhai based on OLCI data. J. Lake Science. 30 (3), 701–712. doi: 10.18307/2018.0312
Blix K., Pálffy K., Tóth V., Eltoft T. (2018). Remote sensing of water quality parameters over lake balaton by using sentinel-3 OLCI. Water 10 (10), 1428. doi: 10.3390/w10101428
Chen H., Chen C., Zhang Z., Lu C., Wang L., He X., et al. (2021). Changes of the spatial and temporal characteristics of land-use landscape patterns using multi-temporal landsat satellite data: a case study of zhoushan island, China. Ocean Coast. Manage. 213. doi: 10.1016/J.OCECOAMAN.2021.105842
Chen C., Liang J., Xie F., Hu Z., Sun W., Yang G., et al. (2022). Temporal and spatial variation of coastline using remote sensing images for zhoushan archipelago, China. Int. J. Appl. Earth Observation Geoinformation. 107. doi: 10.1016/J.JAG.2022.102711
Doxaran D., Froidefond J. M., Lavender S., Castaing P. (2002). Spectral signature of highly turbid waters-application with SPOT data to quantify suspended particulate matter concentrations. Remote Sens. Environ. 81 (1), 149–161. doi: 10.1016/S0034-4257(01)00341-8
Gao Y., Gao L., Zhu L., Li D.. (2018). Spatiotemporal variations in concentration and size of suspended particulate matter in the changjiang (Yangtze river) estuary and its adjacent sea. Haiyang Xuebao 40 (3), 62–73. doi: 10.3969/j.issn.0253-4193.2018.03.006
Gordon H. R., Wang M. (1994). Retrieval of water-leaving radiance and aerosol optical thickness over the oceans with SeaWiFS: a preliminary algorithm. Appl. optics 33 (3), 443–52. doi: 10.1364/AO.33.000443
Han Z., Yun C., Jiang X. (2003). Experimental study on reflected spectrum of suspended sediment. J. Hydraulic Eng. 12, 118–122. doi: 10.3321/j.issn:0559-9350.2003.12.019
He X., Bai Y., Pan D., Tang J., Wang D.. (2012). Atmospheric correction of satellite ocean color imagery using the ultraviolet wavelength forhighly turbid waters. Optics Express 20 (18), 20754–20770. doi: 10.1364/OE.20.020754
He X., Bai Y., Pan D., Huang N., Dong X., Chen J., et al. (2013). Using geostationary satellite ocean color data to map the diurnal dynamics of suspended particulate matter in coastal waters. Remote Sens. Environ. 133, 225–239. doi: 10.1016/j.rse.2013.01.023
He X., Bai Y., Wei J., Ding J., Shanmugam P., Wang D., et al. (2017). Ocean color retrieval from MWI onboard the tiangong-2 space Lab: preliminary results. Optics express 25 (20), 23955–73. doi: 10.1364/OE.25.023955
Hu Y., Yu Z., Zhou B., Li Y., Yin S., He X., et al. (2018). Tidal-driven variation of suspended sediment in hangzhou bay based on GOCI data. Int. J. Appl. Earth Observations Geoinformation 82. doi: 10.1016/j.jag.2019.101920
Jiang B., Zhang X., Huang D., Du Y., Yang D., Yao L., et al. (2015). Retrieving high concentration of suspended sediments based on GOCI: An example of coastal water around hangzhou bay, China. J. Zhejiang University: Natural Sci. 42 (2), 213–220. doi: 10.3785/j.issn.1008-9497.2015.02.017
Lamquin N., Mazeran C., Doxaran D., Ryu J. H., Park Y. J.. (2012). Assessment of GOCI radiometric products using MERIS, MODIS and field measurements. Ocean Sci. J. 47 (3), 287–311. doi: 10.1007/s12601-012-0029-z
Li Y., Guo Y., Cheng C., Zhang Y., Hu Y., Xia Z., et al. (2019). Remote estimation of total suspended matter concentration in the hangzhou bay based on OLCI and its water color product applicability analysis. Haiyang Xuebao 41 (9), 156–169. doi: 10.3969/j.issn.0253–4193.2019.09.015
Liu B., Cheng Q., Zeng H., Yang R.. (2016). On the suspended sediment concentration distribution and diversity of the waters on both sides of hangzhou bay Sea-crossing bridge based on GOCl data. J. Hangzhou Normal University: Natural Sci. 15 (1), 102–107. doi: 10.3969/j.issn.1674-232X.2016.01.019
Liu W., Yu Z., Zhou B., Jiang J., Pan Y., Ling Z. (2013). Assessment of suspended sediment concentration at the hangzhou bay using HJ CCD imagery. J. Remote Sens. 17 (4), 905–918. doi: 10.11834/jrs.20132195
Li Y., Zhang Y., Shi K., Zhu G., Zhou Y., Zhang Y., et al. (2017). Monitoring spatiotemporal variations in nutrients in a large drinking water reservoir and their relationships with hydrological and meteorological conditions based on landsat 8 imagery. Sci. Total Environ. 599–600, 1705–17. doi: 10.1016/j.scitotenv.2017.05.075
Li J., Zhu J., Gao F., Yang A., Chen C. (2015). Cross-check analysis on MODIS and GOCI satellite remote sensing reflectances in turbid sea areas. J. Ocean Technol. 34 (1), 15–20.
Lu X., Su H. (2020). Retrieving total suspended matter concentration in fujian coastal waters using OLCl data. Acta Scientiae Circumstantiae 40 (08), 2819–2827. doi: 10.13671/j.hjkxxb.2020.0176
Lyons W. B., Neilson B. J., Cronin L. E. (1982). Estuaries and nutrients. Estuaries 5 (4), 326. doi: 10.2307/1351759
Pahlevan N., Mangin A., Balasubramanian S. V., Smith B., Alikas K., Arai K., et al. (2021). ACIX-aqua: A global assessment of atmospheric correction methods for landsat-8 and sentinel-2 over lakes, rivers, and coastal waters. Remote Sens. Environ. 258. doi: 10.1016/J.RSE.2021.112366
Peng X., Shen F. (2014). Comparative analysis of suspended particulate matter concentration in Yangtze estuary derived by several satellite sensors. INFRARED 35 (04), 31–37. doi: 10.3969/j.issn.1672-8785.2014.04.006
Ruddick K. G., Ovidio F., Rijkeboer M. (2000). Atmospheric correction of SeaWiFS imagery for turbid coastal and inland waters. Appl. optics 39 (6), 897–912. doi: 10.1364/AO.39.000897
Shao Y., Hu Y., Zhou B., Chen F., He X., Wang G., et al. (2020). Remote sensing monitoring of suspended sediment concentration based on GF-4 satellite in the hang zhou bay. Haiyang Xuebao 42 (9), 134–142. doi: 10.3969/j.issn.0253–4193.2020.09.014
Shen F., Verhoef W., Zhou Y., Salama M. S., Liu X. (2010). Satellite estimates of wide-range suspended sediment concentrations in Changjiang(Yangtze) estuary using MERIS data. Estuaries Coasts 33 (6), 1420–1429. doi: 10.1007/s12237-010-9313-2
Shi K., Zhang Y., Qin B., Zhou B. (2019). Remote sensing of cyanobacterial blooms in inland waters: Present knowledge and future challenges. Sci. Bull. 64 (20), 1540–56. doi: 10.1016/j.scib.2019.07.002
Shi K., Zhang Y., Zhu G., Liu X., Zhou Y., Xu H., et al. (2015). Long-term remote monitoring of total suspended matter concentration in lake taihu using 250m MODIS-aqua data. Remote Sens. Environ. 164, 43–56. doi: 10.1016/j.rse.2015.02.029
Sun L., Jiang J., Zhu W. (2017). Remote sensing inversion and daily variation of CDOM based on GOCl in the changjiang estuary and adjacent waters. Haiyang Xuebao 39 (9), 133–145. doi: 10.3969/j.issn.0253-4193.2017.09.013
Sun D., Li Y., Le C., Shi K., Huang C., Gong S., et al. (2013). A semi-analytical approach for detecting suspended particulate composition in complex turbid inland waters (China). Remote Sens. Environ. 134, 92–99. doi: 10.1016/j.rse.2013.02.024
Su J., Wang K. (1989). Changjiang river plume and suspended sediment transport in hangzhou bay. Continental Shelf Res. 9 (1), 93–111. doi: 10.1016/0278-4343(89)90085-X
Tang W., Tian G., Wang X., Wang X., Song Q. (2004). The methods of water spectra measurement and analysis I: Above-water method. J. Remote Sens. 8 (1), 37–44. doi: 10.11834/jrs.20040106
Tuuli S., Kristi U., Dainis J., Agris B., Matiss Z., Tiit K. (2020). Validation and comparison of water quality products in Baltic lakes using sentinel-2 MSI and sentinel-3 OLCI data. Sensors 20 (3), 742. doi: 10.3390/s20030742
Wang M. (2007). Remote sensing of the ocean contributions from ultraviolet to near-infrared using the shortwave infrared bands: Simulations. Appl. optics 46 (9), 1535–47. doi: 10.1364/AO.46.001535
Wang L., Chen C., Xie F., Hu Z., Zhang Z., Chen H., et al. (2021). Estimation of the value of regional ecosystem services of an archipelago using satellite remote sensing technology: A case study of zhoushan archipelago, China. Int. J. Appl. Earth Observation Geoinformation. 105, 25. doi: 10.1016/J.JAG.2021.102616
Wang M. H., Shi W. (2005). Estimation of ocean contribution at the MODIS near-infrared wavelengths along the east coast of the US: Two case studies - art. no. L13606. Geophysical Res. Lett. 32 (13), 13606.
Windle A. E., EversKing H., Loveday B. R., Ondrusek M., Silsbe G. M. (2022). Evaluating atmospheric correction algorithms applied to OLCI sentinel-3 data of Chesapeake bay waters. Remote Sens. 14 (8), 1881. doi: 10.3390/RS14081881
Wu W., Yang Z., Tian B., Huang Y., Zhou Y., Zhang T. (2018). Impacts of coastal reclamation on wetlands: Loss, resilience, and sustainable management. Estuar. Coast. Shelf Sci. 210, 153–161. doi: 10.1016/j.ecss.2018.06.013
Yang X. (2016). Diurnal variation of suspended sediment concentration coupled GOCI and numerical simulation in coastal waters of the East China Sea. (Doctoral Dissertation, Graduate School of Chinese Academy of Sciences (Shanghai Institute of Technical Physics).
Keywords: Sentinel-3A/OLCI, GOCI, suspended sediment concentration, water color element retrieval, Hangzhou bay
Citation: Yu Z, Wang J, Li Y, Shum CK, Wang B, He X, Xu H, Xu Y and Zhou B (2022) Remote sensing of suspended sediment in high turbid estuary from sentinel-3A/OLCI: A case study of Hangzhou Bay. Front. Mar. Sci. 9:1008070. doi: 10.3389/fmars.2022.1008070
Received: 31 July 2022; Accepted: 05 September 2022;
Published: 30 September 2022.
Edited by:
Chao Chen, Zhejiang Ocean University, ChinaReviewed by:
Kun Shi, Chinese Academy of Sciences (CAS), ChinaYulong Guo, Henan Agricultural University, China
Deyong Sun, Nanjing University of Information Science and Technology, China
Copyright © 2022 Yu, Wang, Li, Shum, Wang, He, Xu, Xu and Zhou. This is an open-access article distributed under the terms of the Creative Commons Attribution License (CC BY). The use, distribution or reproduction in other forums is permitted, provided the original author(s) and the copyright owner(s) are credited and that the original publication in this journal is cited, in accordance with accepted academic practice. No use, distribution or reproduction is permitted which does not comply with these terms.
*Correspondence: Bin Zhou, emhvdWJpbkBoem51LmVkdS5jbg==
†These authors have contributed equally to this work and share first authorship