 Bingxu Geng
 Lingyan Lu2*
 Qian Cao
 Wen Zhou
 Ding Wen
- 1Marine Environment Engineering Center, South China Sea Institute of Oceanology, Chinese Academy of Sciences, Guangzhou, China
- 2Guangdong Center for Marine Development Research, Guangzhou, China
- 3South China Institute of Environmental Sciences, Ministry of Ecology and Environment of the People’s Republic of China, Guangzhou, China
- 4School of Environmental Science and Engineering, Sun Yat-Sen University, Guangzhou, China
The impact of thermal pollution caused by cooling water discharge of power plant on the surrounding marine ecology has been a hot issue in oceanographic research. To reveal the distribution pattern of cooling water discharge of Daya Bay Nuclear Power Plant in summer and the impact on the surrounding marine environment, this research established a high-resolution three-dimensional (3D) numerical model based on ECOMSED in the Daya Bay. The model results are consistent with the observations on the distribution of tide level and temperature. The simulated horizontal distribution of temperature rise is consistent with the distribution trend of remote sensing images. The study showed that the stratification of the Daya Bay water is stronger in summer. The cooling water mainly spreads in the surface layer, and the temperature rise in the bottom layer is not apparent. Quantitative analysis showed that around 18.8-21.6 km2 of the area has 1°C surface temperature rises. The area of temperature rises that exceeds 2 °C is between 6.2 and 8.1 km2. The area of temperature rises that exceeds 4 °C is between no more than 1.2 km2. The area with a bottom temperature rises of 1 °C does not exceed 2.2 km2, and there is no area that has a bottom temperature rise over 1 °C. The tidal dynamics process influences on the dispersion of cooling water discharge from Daya Bay Nuclear Power Plant, where the influence is more significant in the spring tide period than in the neap tide period. Our findings are consistent with previous researches.
1. Introduction
The impact of cooling water discharge on the environment from nuclear power plants has attracted increased attention, especially after the accident at Fukushima Daiichi Nuclear Power Plant in Japan and agreement on carbon neutrality. The nuclear power plants contribute to the reduction of fossil fuel consumption, helping the earth’s atmospheric temperature to reduce somehow (Hassan et al., 2020; Mahmood et al., 2020). However, the serious concerns on long-term radioactive and environmental impact had always been a popular topic (Musyoka and Field, 2018; Wu et al., 2013; Kaviani et al., 2021). Not only the radionuclide release from cooling water could have ecological consequences, but also the heat carried (Liu et al., 2022). Daya Bay is a large semi-closed drowned valley-type bay along the coast of Guangdong Province, China, surrounded by the Dapeng Peninsula, the southern coast of Huiyang, and the Pinghai Peninsula of Huidong (Figure 1). It is located on the east side of the Pearl River Estuary, adjacent to Hong Kong in the southwest, connected to Honghai Bay in the east and the continental shelf of the South China Sea in the south, covering an area of about 600 km2. Daya Bay Nuclear Power Plant (DBNPP) is located in the west coast of Daya Bay on the north shore of Dapeng’ao with a total installed capacity of 6 million kilowatts (Figure 1). The environmental impact of the cooling water discharge from the DBNPP has received great attention from society (Wang et al., 2008; Hao et al., 2016; Ye et al., 2018). Many scholars have conducted a lot of research work on the impact of the cooling water discharge from the plant on the marine environment and marine ecosystem dynamics of Daya Bay (Yue et al., 2018; Jiang and Wang, 2020; Mao et al., 2021).
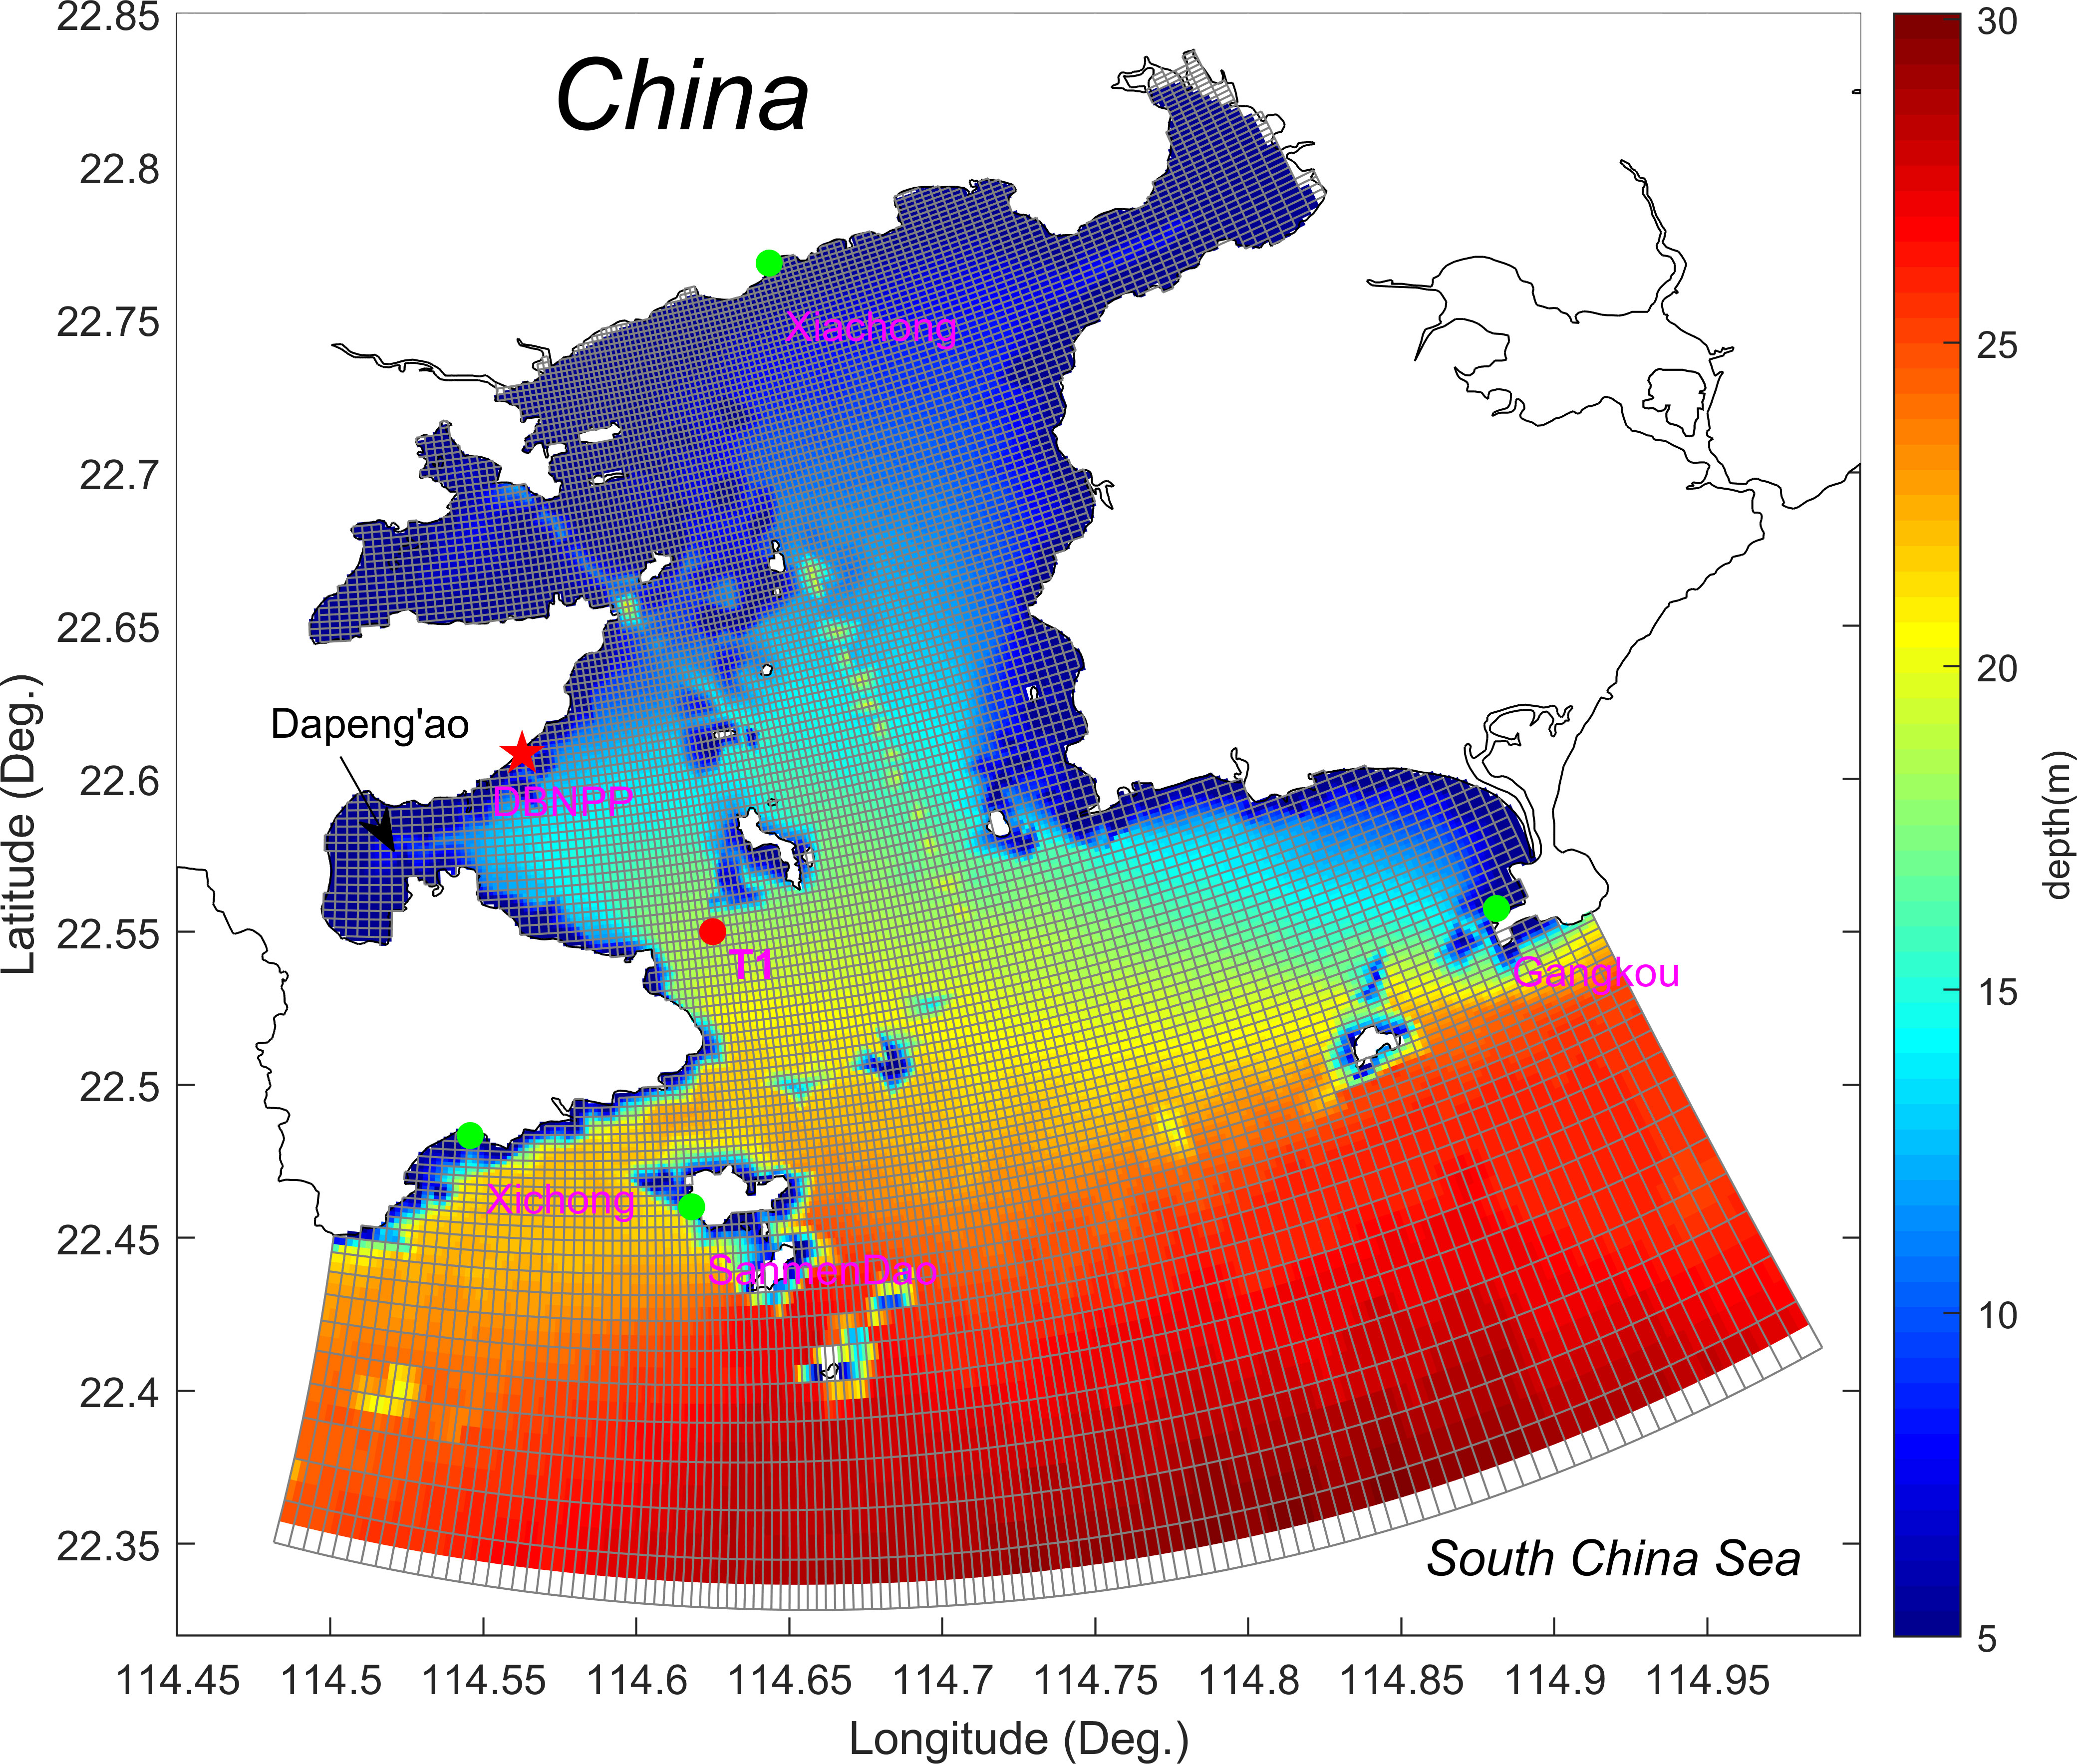
Figure 1 Horizontal curvilinear orthogonal grid (curves) and bottom bathymetry (shaded) of the three-dimensional numerical model of Daya Bay. The bathymetry was interpolated from nautical charts. Red star indicates the position of the Daya Bay Nuclear Power Plant (DBNPP). Green dots demonstrate the four tidal gauge stations (i.e., Gangkou, SanmenDao, Xiachong, and Xichong). Red dot illustrates the T1 station with temperature observations conducted.
Various research methods are applied to predict the extent and impact of power plant cooling water discharge (George, 2017; Lin et al., 2021), including field observation, remote sensing observations (Lima and Wethey, 2012; Liu et al., 2020), physical models, and numerical simulations (George, 2017). With the continuous development of computer technology and numerical calculation methods, the computing speed of mathematical models is getting higher and higher, and the application of the method is more and more extensive (Lin et al., 2021).
In bays with deep water depths, the diffusion of cooling water discharge is a three-dimensional process. Baroclinic effect caused by temperature gradient has certain influence on the surrounding hydrodynamic process and cooling water diffusion. Therefore, three-dimensional baroclinic model for cooling water discharge has been gradually promoted recently.
Previous research had been conducted on the three-dimensional numerical stimulation of cooling water discharge from power plant and discussed on the diffusion and effect of warm water discharge from Daya Bay (Zhang and Zhou, 2004; Zhou, 2007; Wei et al., 2013). In these researches, the heat transfer coefficient of the sea surface was directly introduced to characterize the heat exchange process at the air-sea interface. These methods did not consider the dynamic exchange processes of latent heat flux due to evaporation, sensible heat flux due to air-sea temperature difference at the interface, and the forcing processes of solar short-wave and long-wave radiation. As a result, the cooling water discharge model might not simulate the spatial and temporal distribution of the background temperature field well, which in turn affects the simulation of the temperature rise and diffusion process of cooling water discharge. In this paper, we construct a three-dimensional (3D) baroclinic model of Daya Bay based on the ECOMSED model (Blumberg and Mellor, 1987), using real-time sea surface momentum and heat forcing to simulate the spatio-temporal distributions of hydrodynamic, thermal dynamic processes and diffusion of cooling water discharge in Daya Bay in summer.
2. Methodology
2.1. Cooling water discharge model of Daya Bay
This paper carried out three-dimensional (3D) baroclinic stimulation for Daya Bay using the ECOMSED model. The vertical turbulent mixing coefficient was calculated using the Mellor-Yamada level 2.5 turbulent closure scheme (Mellor and Yamada, 1974). The model consists of nonlinear momentum equations that consider upwelling and downwelling flows and horizontal convection of fluids due to differences in fluid density caused by temperature and salt. It simulates several state variables, including sea surface elevation, 2D and 3D flow velocity, temperature, salinity, turbulent kinetic energy, and turbulent mixing length. The model is solved by a mode splitting technique, where the horizontal movement of the fluid volume and the vertical shear flow rate are solved separately and independently. Thus, the model can take a more extensive computational time step to improve computational efficiency (Ahsan and Blumberg, 1999). This model has been widely used to study the coastal circulation dynamics, hypoxia and eutrophication processes in rivers, estuary, and continental shelf regions around the world (Hellweger et al., 2004; Hu and Li, 2009; Zhang and Li, 2010).
2.2. Model grid and bathymetry
The shoreline and topographic data required for the model was obtained from the nautical chart released by the Guangdong Provincial Maritime Bureau. Figure 1 shows the model domain, including the whole Daya Bay and the regions within the 30-meter isobath outside the bay. It maintains a high resolution around the DBNPP and keeps the inner area of the bay away from the open boundary of the model to reduce the influence of the open boundary on the inner computational area. A curvilinear orthogonal grid is used in the horizontal (Figure 1). The number of grids in the x and y directions is 266×292, and the minimum horizontal resolution of the grid is about 75 m, while the grid resolution in the outer sea is lower (about 500 m).
The bathymetry of the Daya Bay model is interpolated from nautical charts (Figure 1). The model uses sigma coordinates in the vertical and there are 5 sigma levels in the vertical. As the bathymetry is shallow in the coastal regions of DBNPP with the maximum water depth less than 10 m. And previous model studies always used vertical levels less than 5 (Wu et al., 2007; Zhou, 2007). So, it is meaningful for our model to use 5 sigma levels in the vertical. The external mode time step of the model is taken 2 seconds, and the inner mode time step is taken 30 seconds.
2.3. Setup of the numerical model
In the model, the initial water level and horizontal flow velocity is taken as 0. Thus, the model is calculated from the stationary state. Except some small rivers, there are no big rivers with large freshwater discharged into the Daya Bay. Furthermore, the Pearl River plume with low salinity water detaches offshore with the Yuedong coastal current and has little influence on the salinity distribution in Daya Bay during summer (Gan et al., 2009). As a result, the seasonal variability of salinity in the Daya Bay is not significant. Thus, the model only calculates the convective diffusion process of temperature, salinity is kept constant during the simulation, and the effect of salinity change on the density gradient is not considered.
The time-series of tidal elevation on the lateral open boundary are calculated using eight primary harmonic constituents (M2, S2, N2, K2, K1, O1, P1, and Q1). The above harmonic constituents are interpolated from the global tidal inversion model (TPXO version 7.2) developed by Oregon State University (USA). The temperature lateral boundary condition is given by the field observed data.
The heat fluxes (solar short-wave radiation, long-wave radiation, latent heat flux, and sensible heat flux) at the air-sea interface are mainly governed by the solar altitude angle, the air temperature at 2m above the sea surface, the atmospheric pressure at the sea surface, the relative humidity at 2m above the sea surface, the cloud, and the wind speed at 10m above the sea surface. In this paper, the dynamic processes of the above meteorological parameters related to heat fluxes are considered. Sea surface momentum forcing uses summer mean wind field. The meteorological parameters are derived from the National Oceanic and Atmospheric Administration’s (NOAA) NCAR/NCEP reanalysis data, which has a temporal resolution every 6 hours.
Firstly, the model ran for 30 days forced with summer mean surface meteorological parameters and wind. After the spin-up, we carried out prognostic simulations from August 5, 2008 to September 30, 2008 forced with summer mean wind forcing and real-time surface meteorological parameters. Model simulated hourly results were used to do model verifications and thermal influence analysis.
2.4. Cooling water discharge sources
Based on the above 3D numerical model of Daya Bay, we simulated the diffusion process of the cooling water discharge from the DBNPP in summer. The source strength of the cooling water discharge is taken as 190 m3/s, and the temperature rise at the discharge point is 8°C. The model results are compared with the field observational data to verify the performance of the model. Then the model results are used to analyze the dispersion pattern of the DBNPP’s cooling water.
3. Results and discussion
3.1. Model validation
The time series of modeled tidal elevations were compared with the measured data at four stations: Gangkou, SanmenDao, Xiachong, and Xichong (with positions shown in Figure 1). The results showed that the model reasonably reproduced the trend of tidal rise and fall in Daya Bay, and the amplitude and phase of tide levels calculated by the model were generally consistent with the measured results (Figure 2). As our model did not consider M4 and M6 tide, the model could not simulate the double peak structure well during spring and neap tide which mainly attributed to the interaction of bottom topography and shallow water tidal constituents (Song et al., 2016). The model predictive capability for temperature was tested by comparing model results with the measured temperatures at the surface, middle, and bottom of the T1 station (Figure 3). The result indicated that the model could reproduced the temporal variations of temperature in different layers of the water column. Even though, there was some discrepancy between the model results and observations because of the low spatial resolution (about 2.5 degree) of the NCAR/NCEP reanalysis data used in our model.
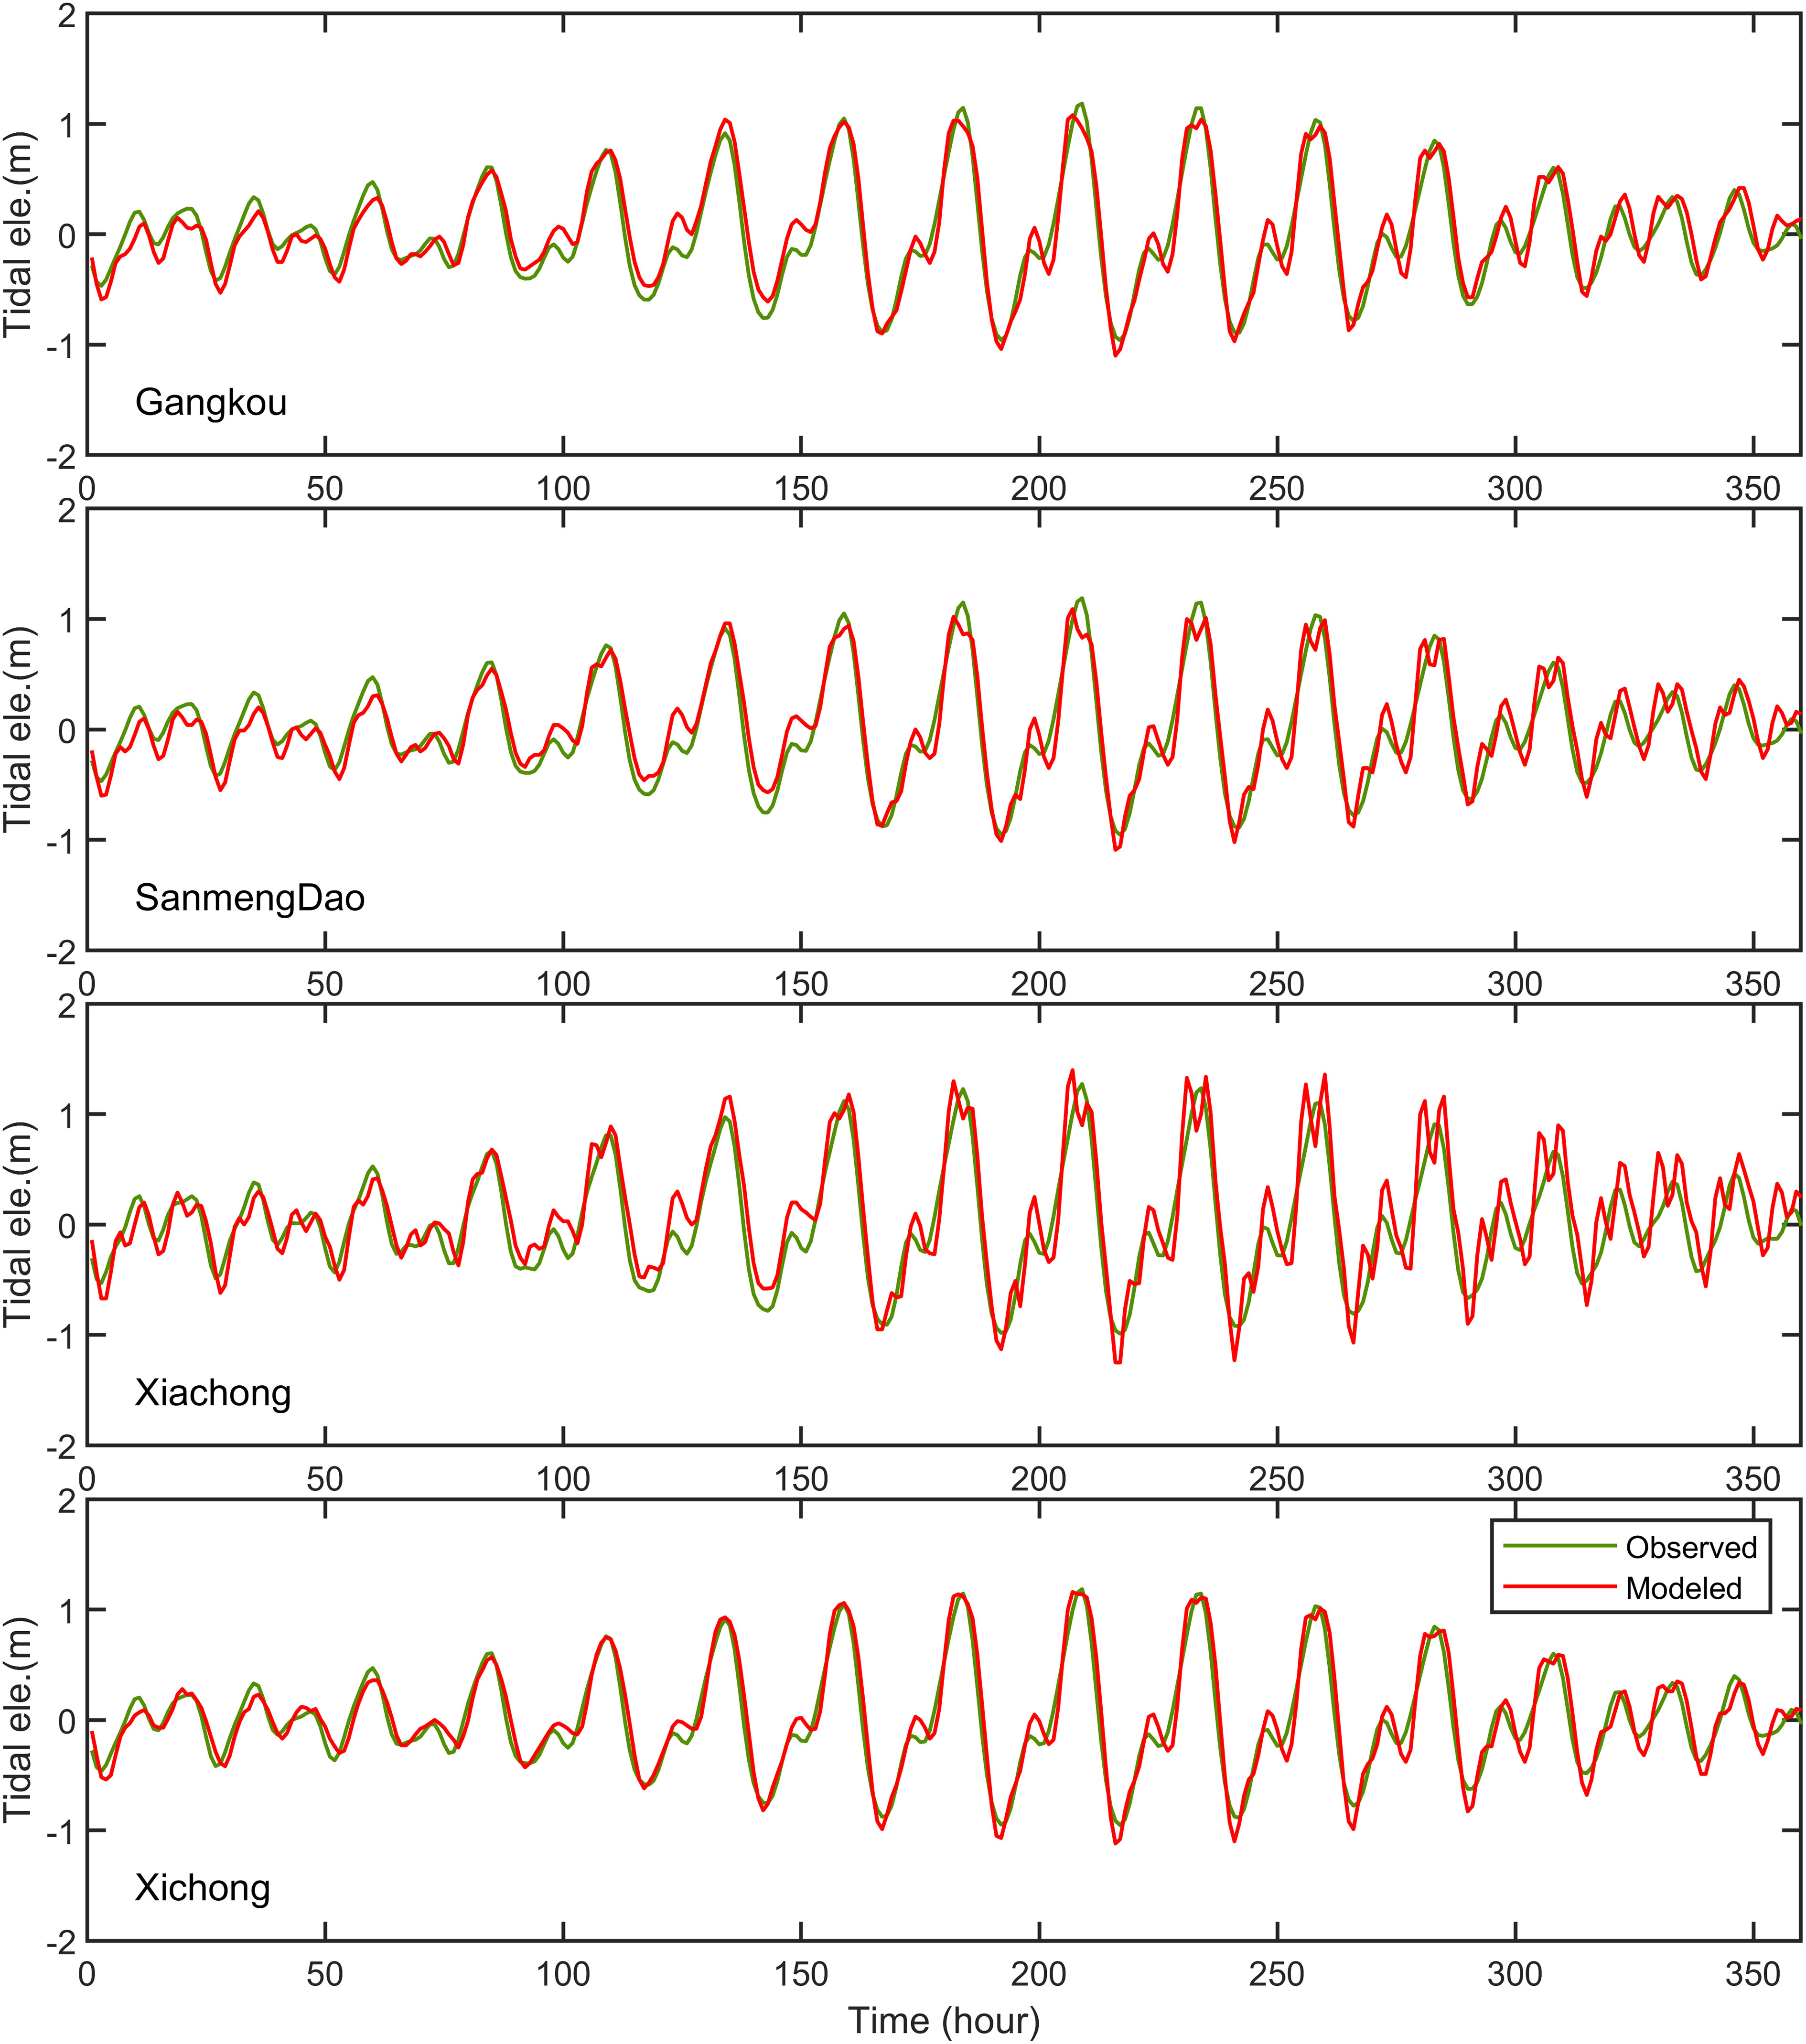
Figure 2 Comparisons of modeled hourly tidal level (red curves) with field observations (green curves) at four stations (i.e., Gangkou, SanmenDao, Xiayong, and Xichong) with the positions shown in Figure 1.
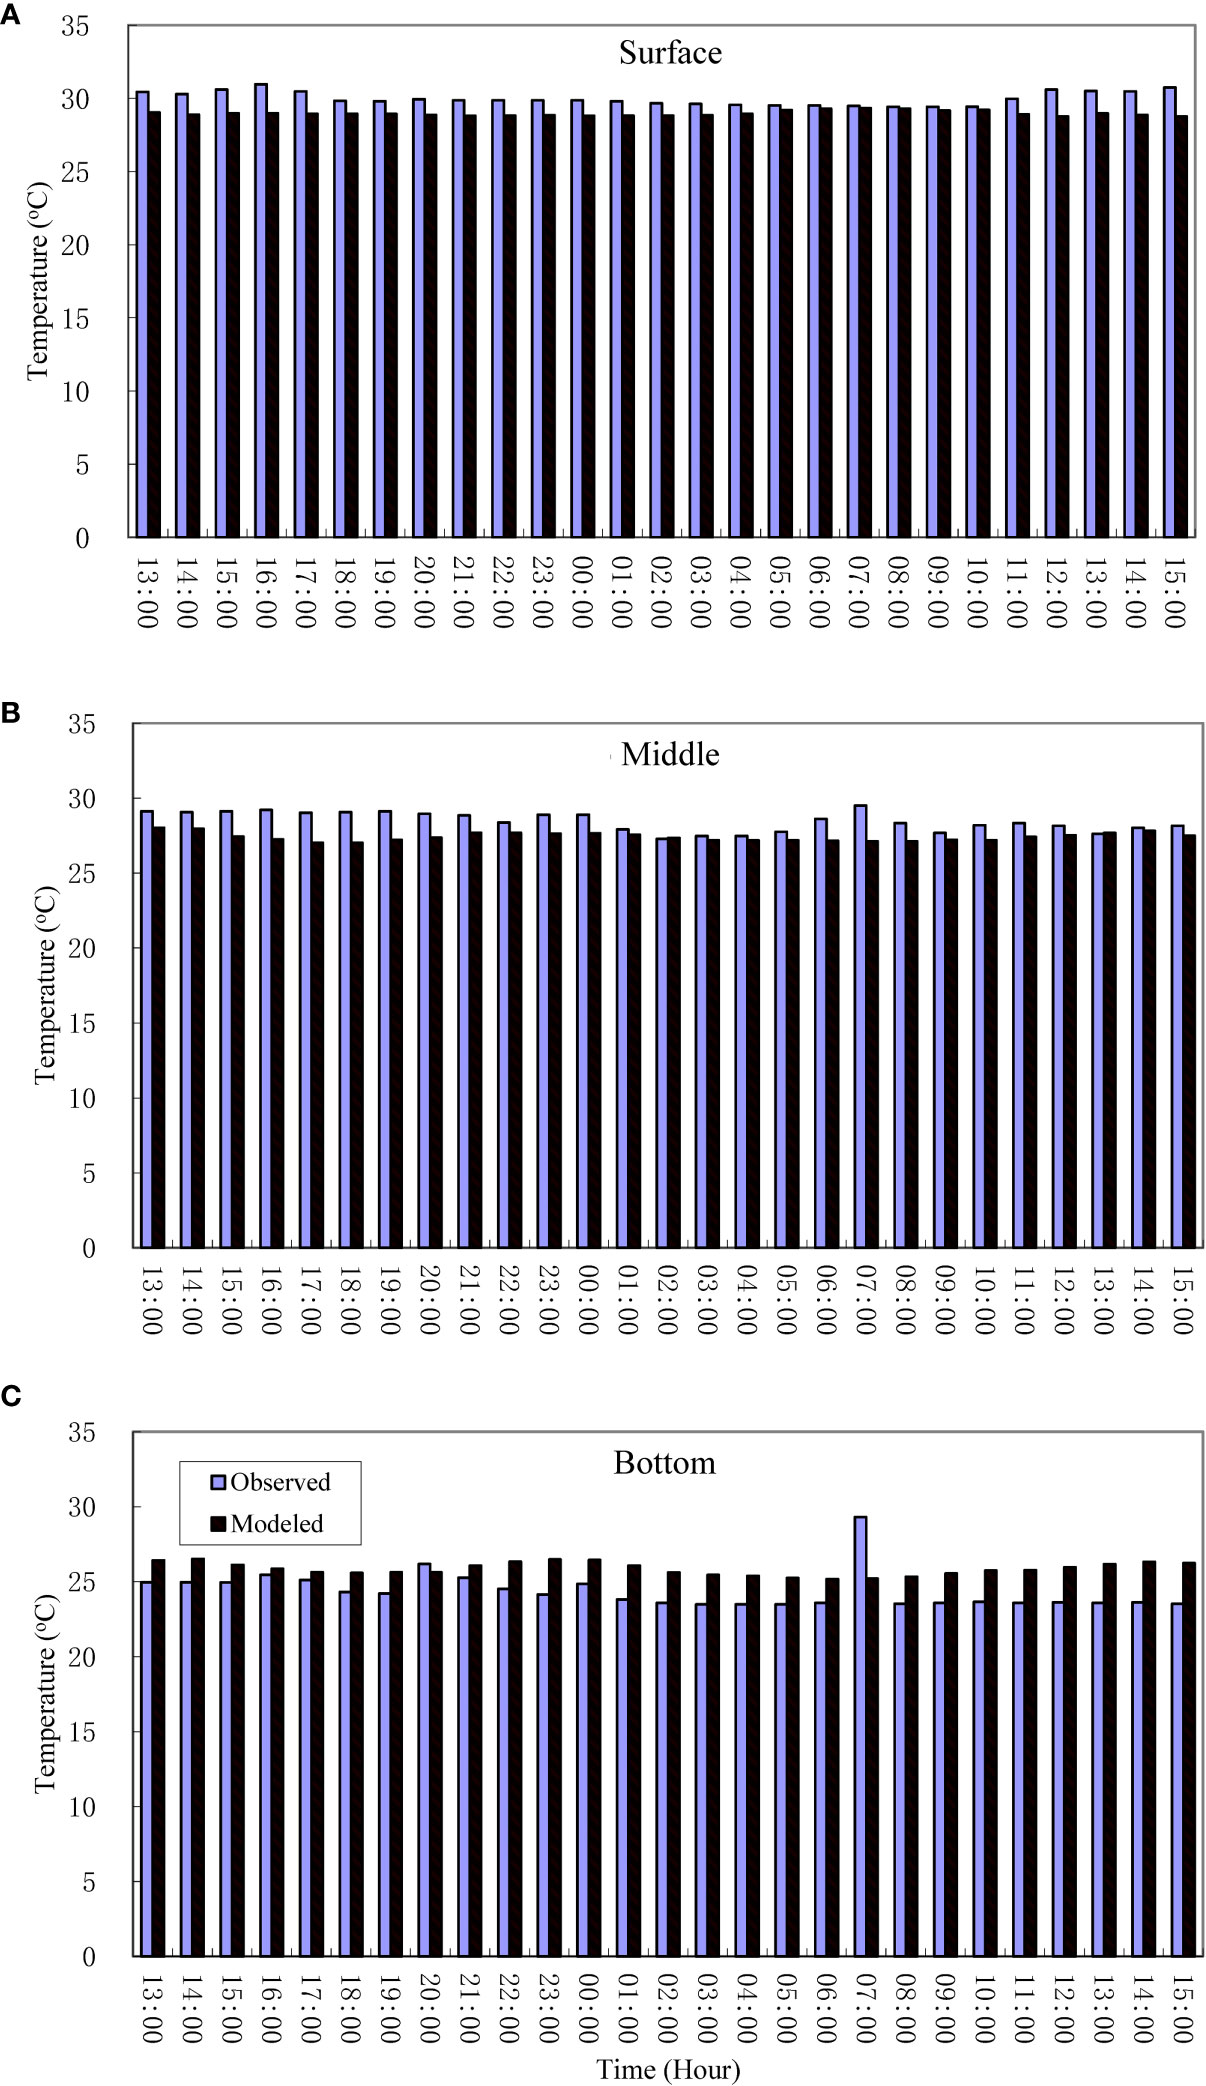
Figure 3 Comparisons of modeled temperature with field observations at stations T1: (A) Surface; (B) Middle layer; and (C) Bottom layer. The field observations conducted at September 12 and 13, 2008.
Figures 4 and 5 compared the temperature rise calculated by the model with the remote sensing results for the corresponding periods. Both remote sensing data and numerical model results show that the temperature rise intensity due to the cooling water discharge from the DBNPP gradually decreases from the center of the discharge point. The 4°C temperature rise area is mainly confined to the area near the outfall, and generally the simulation results are similar to the remote sensing observations.
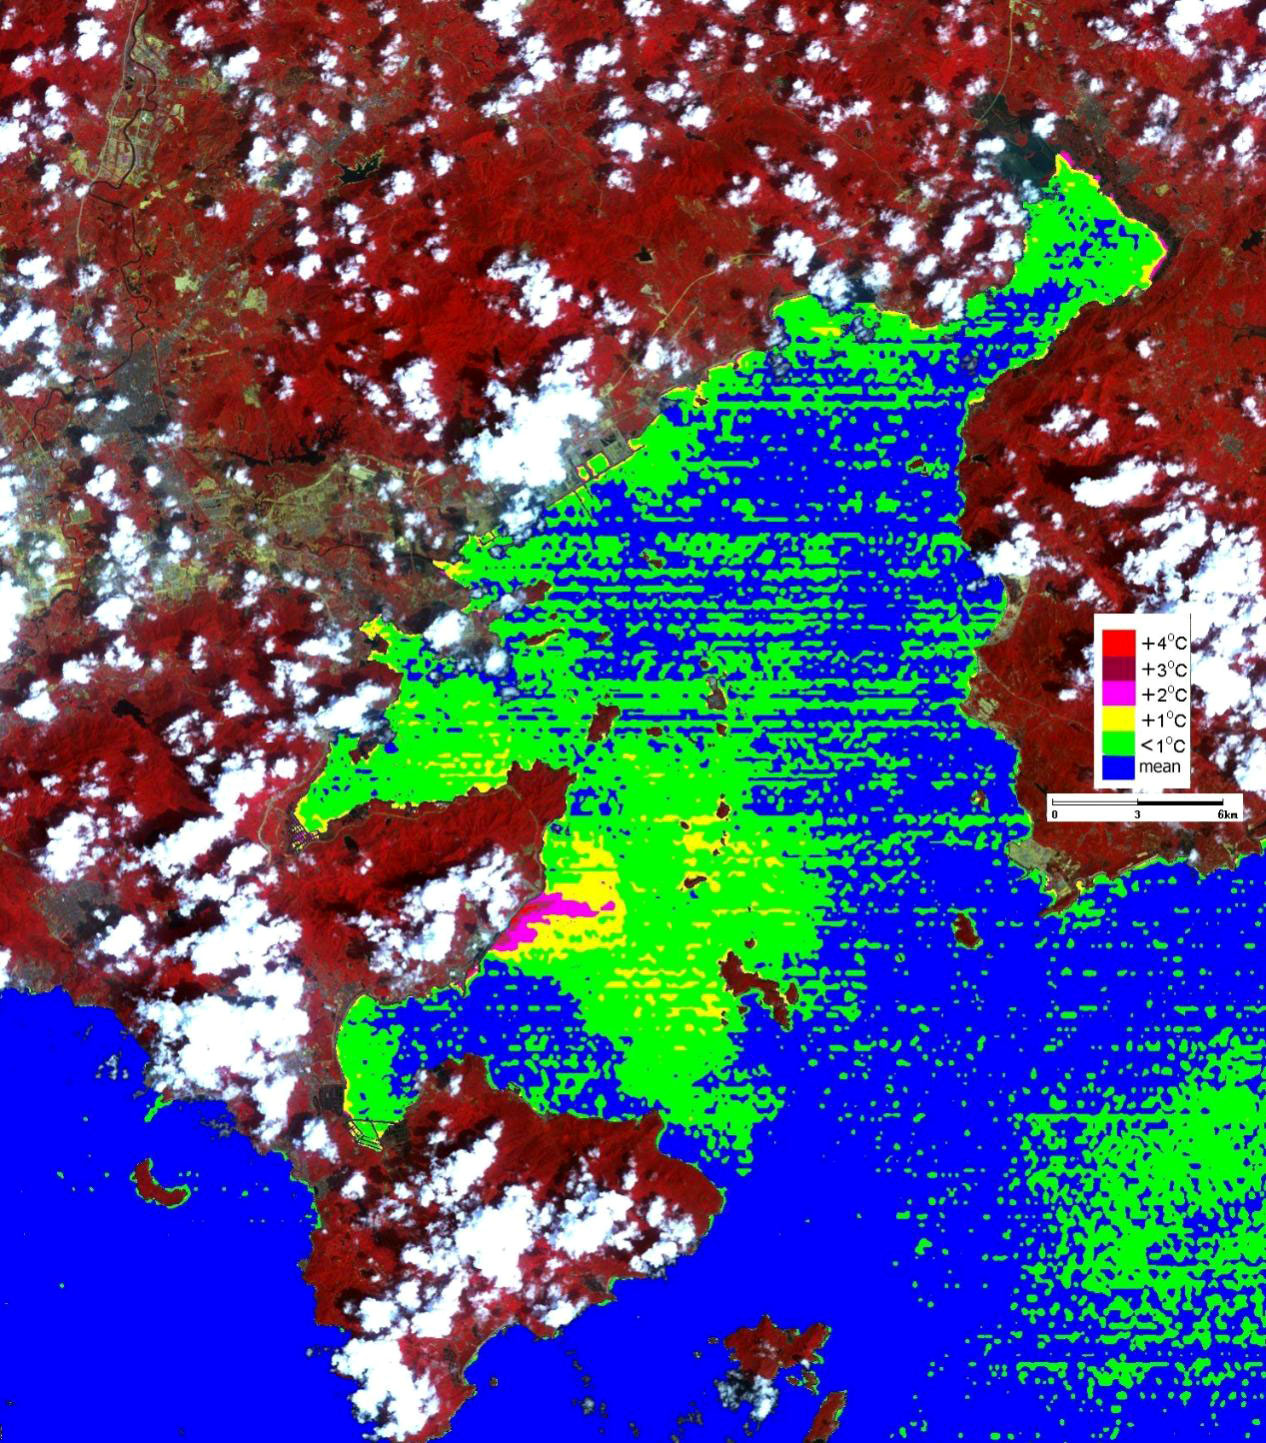
Figure 4 Distributions of temperature rise intensity of Daya Bay nuclear power cooling water discharge on September 21, 2008 (TM data) derived from satellite observations.
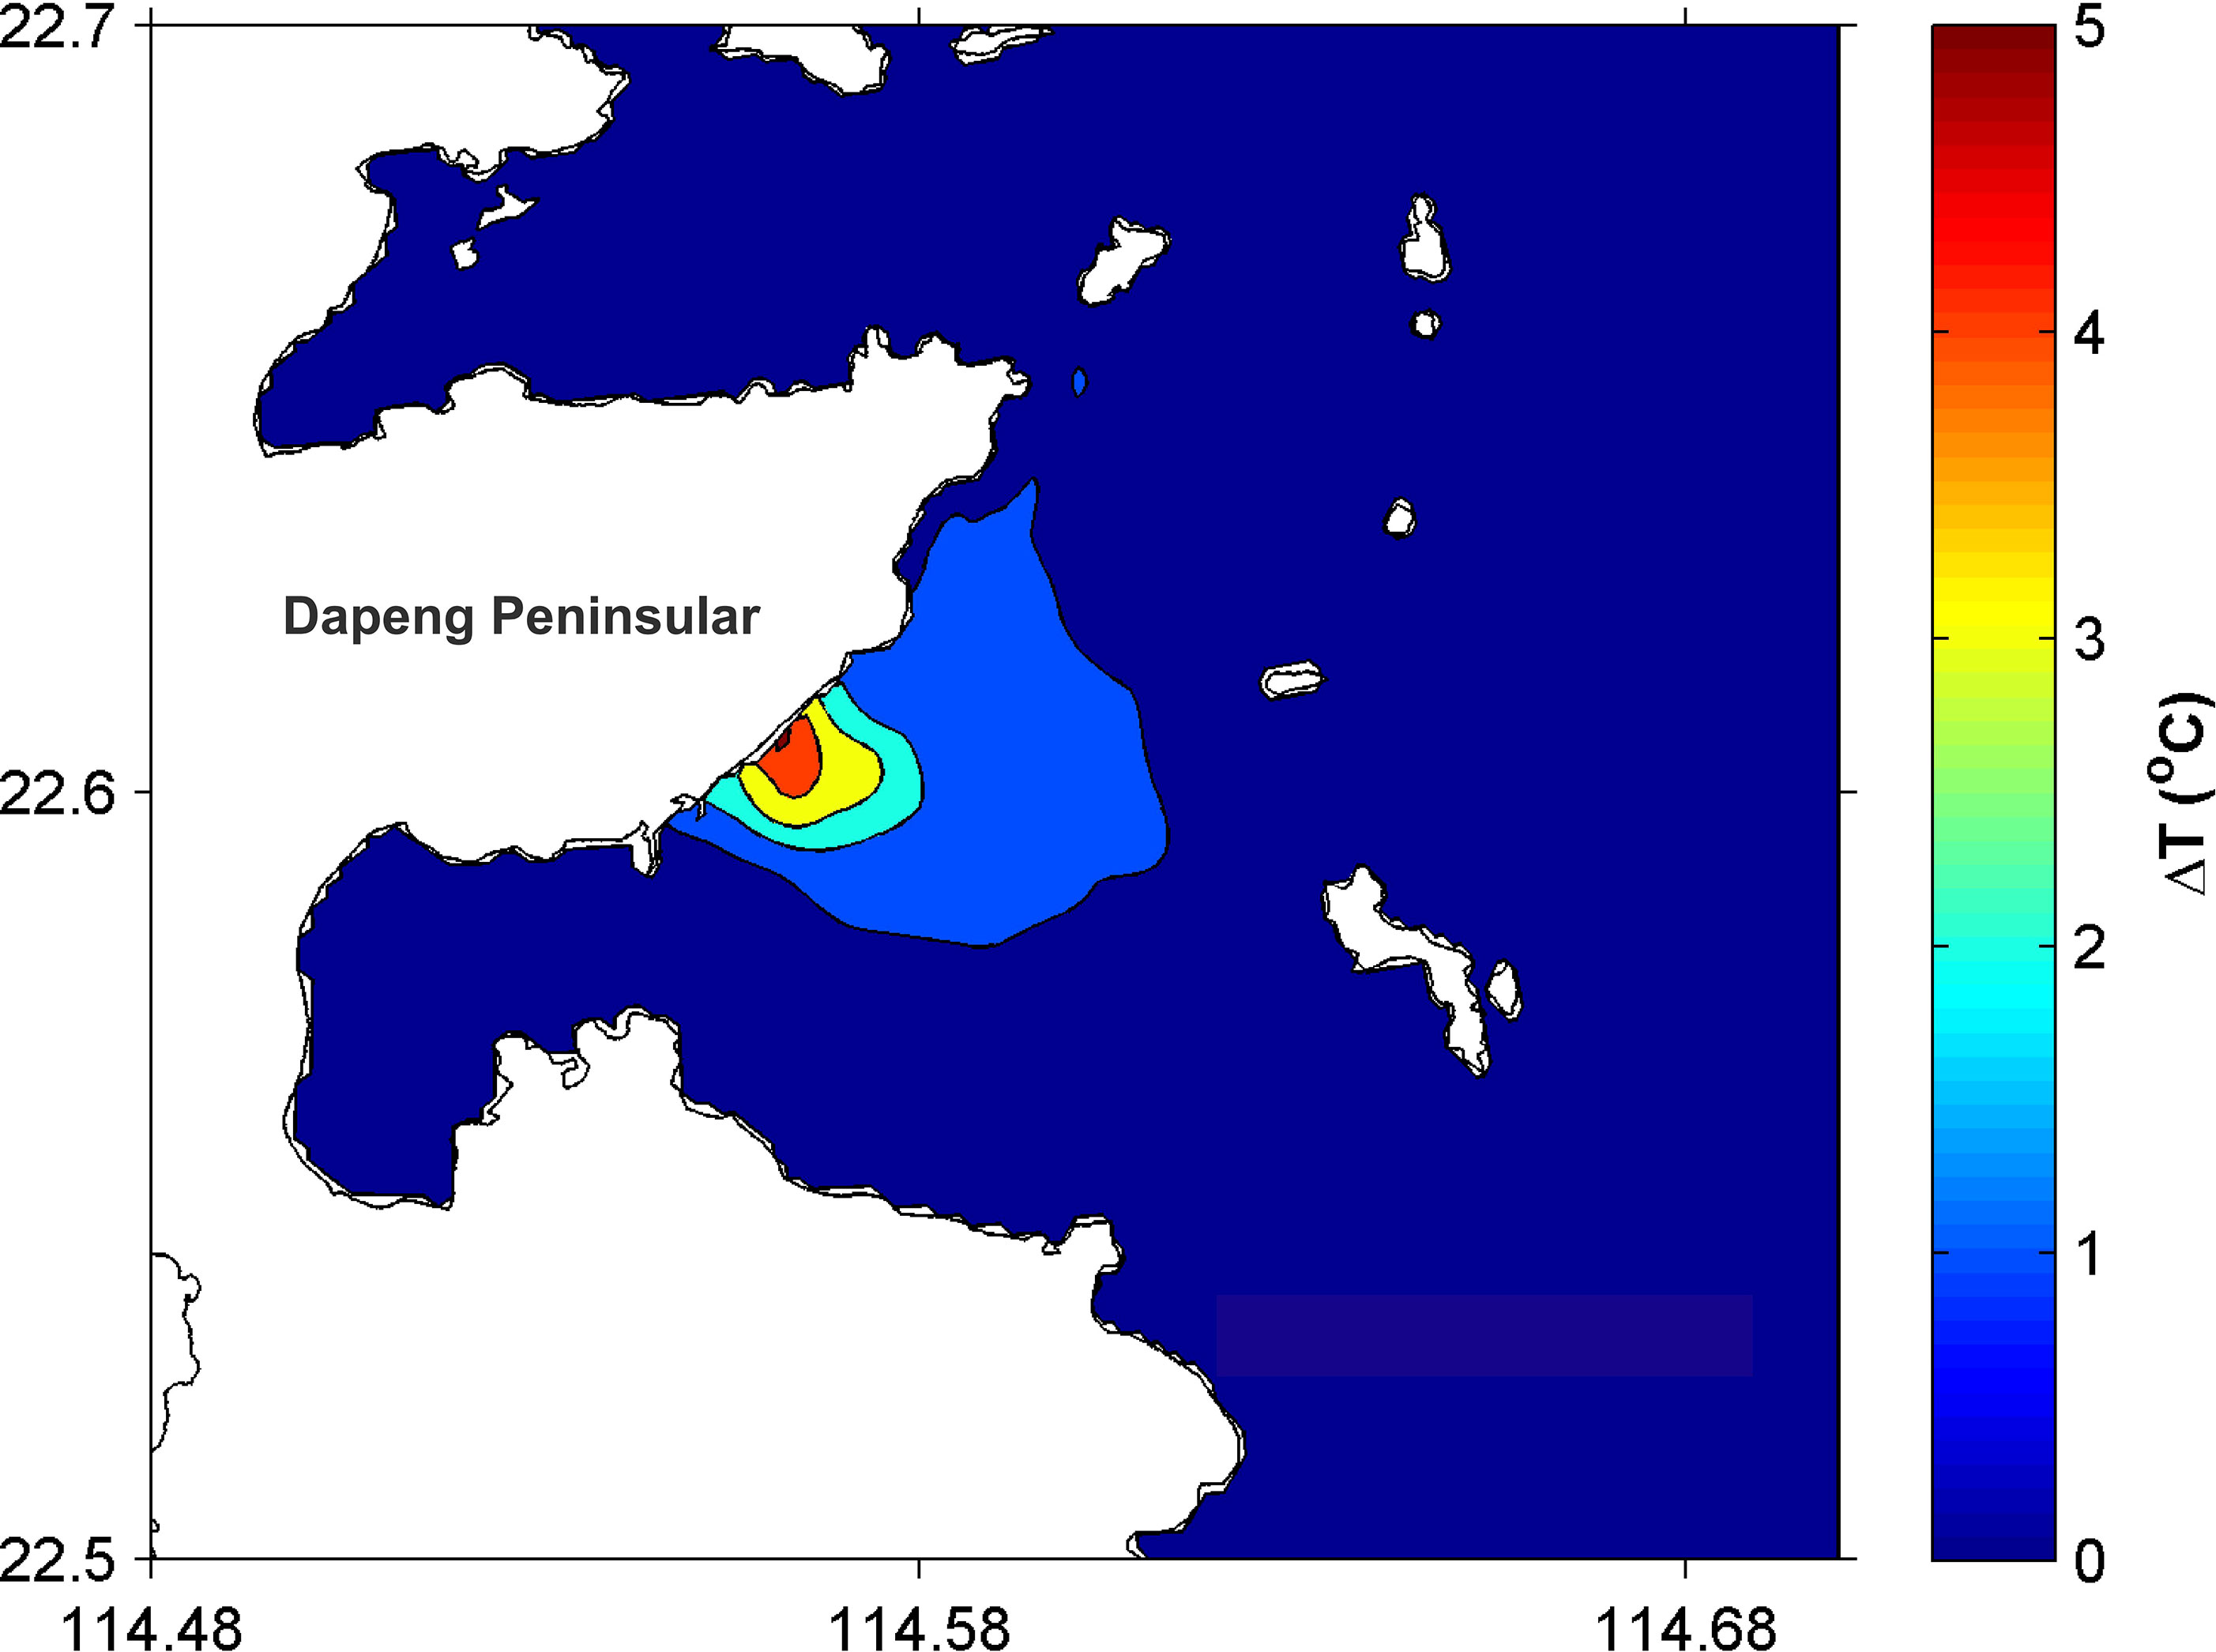
Figure 5 Distribution of daily mean surface temperature rise on September 21, 2008 calculated by the model of Daya Bay.
3.2. Horizontal tidal currents
Figures 6 and 7 show the distribution of flood and ebb tidal currents calculated by the model. Constrained by the shoreline and bottom topography, the tidal flow in Daya Bay is basically reciprocal. Flooding tidal currents at Daya Bay basically flows from south to north. The direction of ebb tide is generally opposite to that of the flood tide, but its flow velocity is stronger than that of the flood tide. The island in the middle of Daya Bay roughly divides the sea into two halves, with the eastern side having a wide area and a deeper water depth, which is the main channel for tidal currents. The water bodies at the top of Daya Bay exchange with the outer sea mainly through the eastern part, while the water bodies in Yaling Bay and Dapeng’ao flow out of Daya Bay mainly through the western channel. The tidal currents distributions were consistent with the results of Wu et al. (2007) and Zhou (2007).

Figure 6 Simulated surface tidal currents during flood tide period in the Daya Bay.
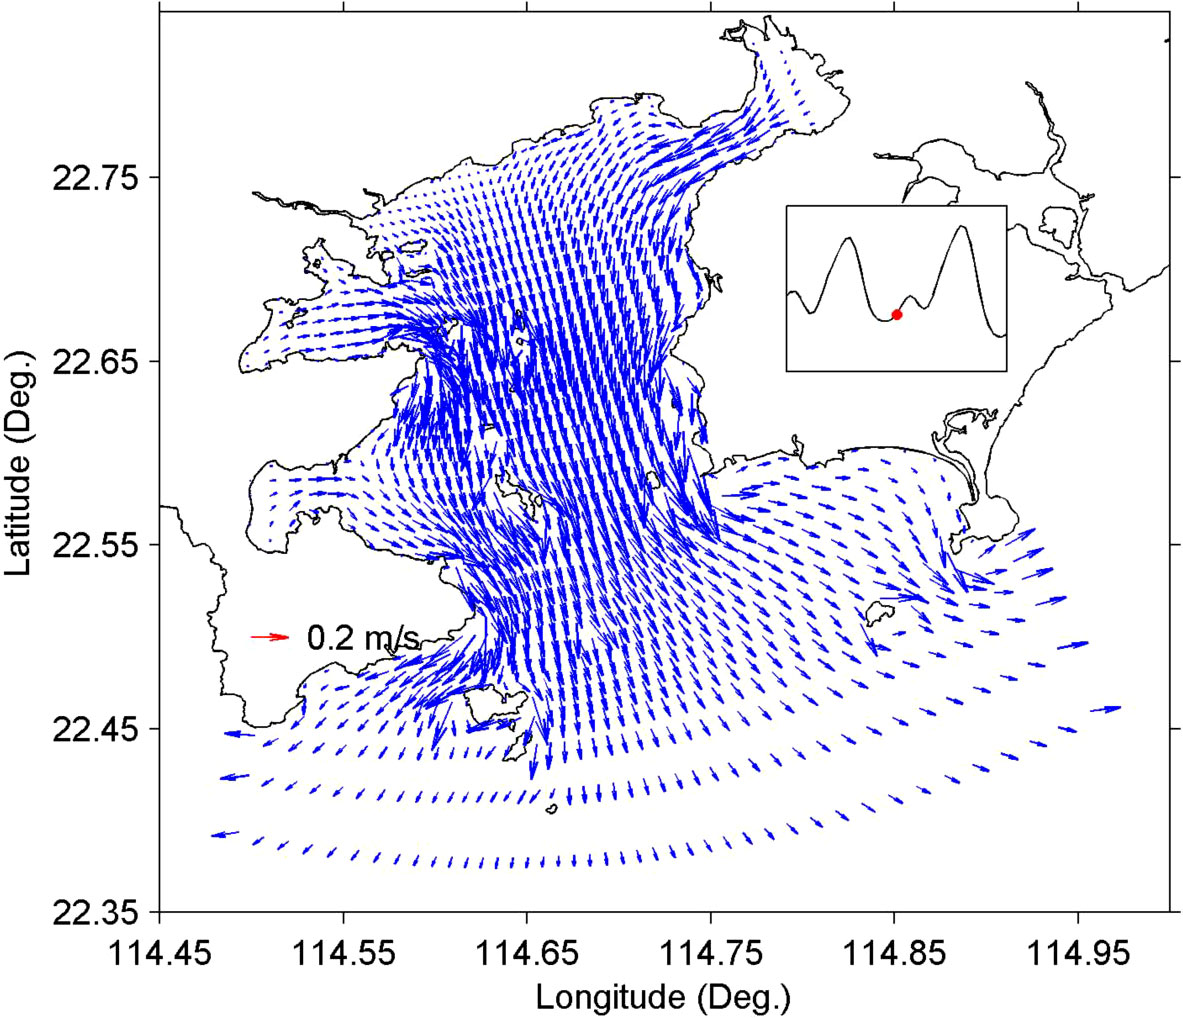
Figure 7 Same as Figure 7, but for the tidal currents during ebb tide period.
3.3. Sea surface temperature
Away from the open ocean, the water depth in Daya Bay is shallow (Figure 1). The spatio-temporal variations in temperature field is mainly controlled by the heat flux at the air-sea interface in addition to the influence of hydrodynamic processes in Daya Bay. In this section, we analyzed the spatial distributions of the surface and bottom temperature in summer based on the model results.
In summer, the solar radiation in Daya Bay is strong, which results to strong water column stratification. The sea surface temperature (SST) of the whole area is above 28°C. The temperature distributions in the surface and bottom layer in the mouth of the bay and the outer sea are obviously different (Figures 8, 9). In the top of the bay and near-shore area, due to the shallow water depth, the temperature difference between the surface and bottom layers is not significant and the stratification is weak. In summer, the eastern coast of Guangdong in the northern South China Sea produces a more significant upwelling process under the influence of the southwest monsoon (Gan et al., 2009). The results also show that very strong outer seawater invasion with lower temperature occurred at the bottom in the entrance of the bay during summer, and its influence can reach to the area near Gangkou (Figure 9).
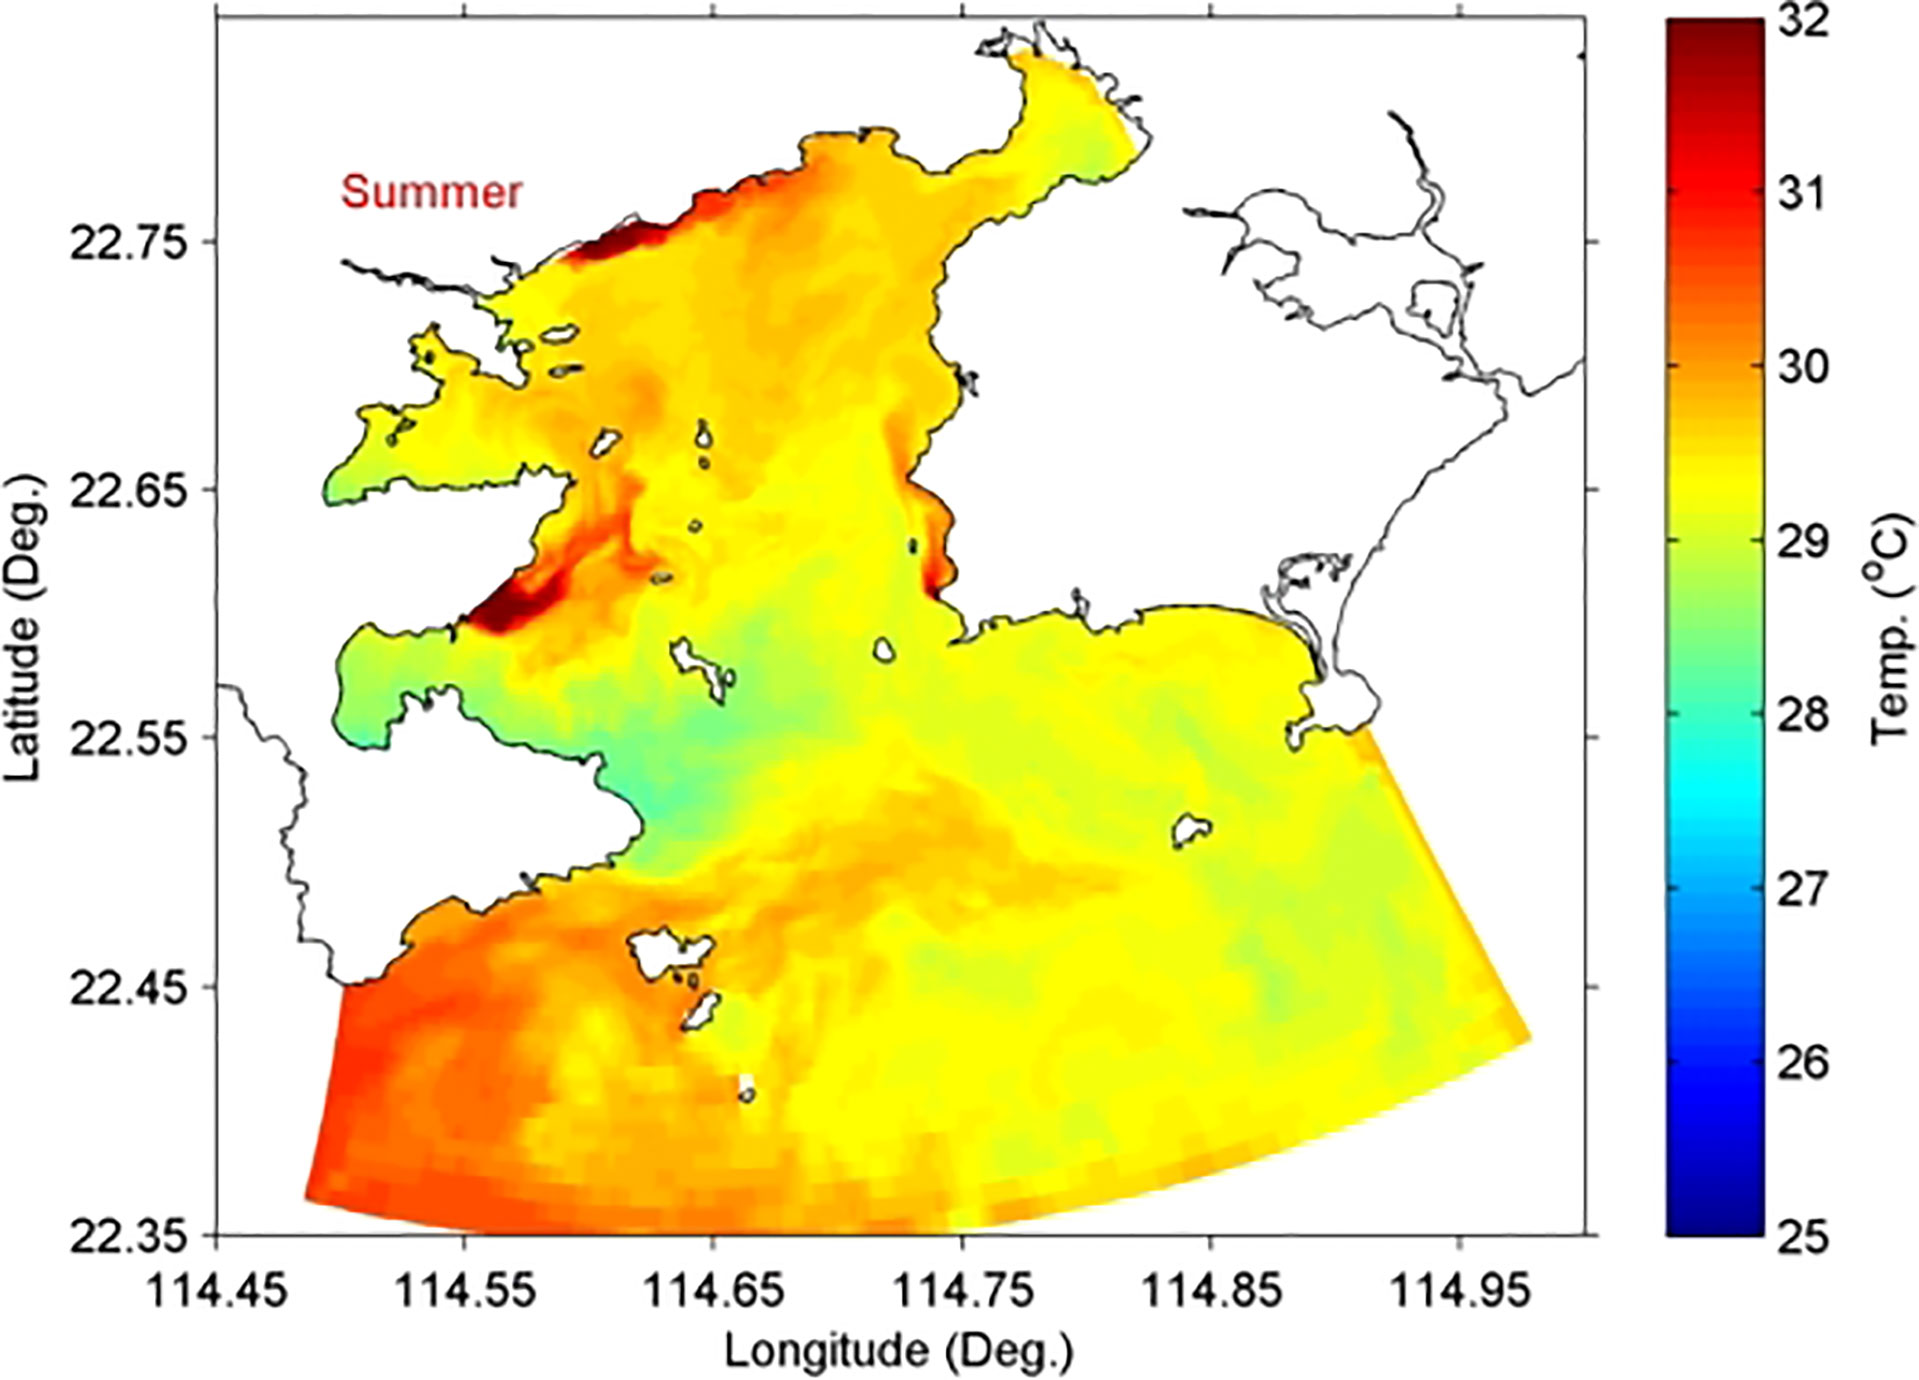
Figure 8 Model simulated summer mean surface temperature distribution in the Daya Bay.

Figure 9 Model simulated summer mean bottom temperature distribution in the Daya Bay.
The results also show that the temperature distribution in summer is significantly influenced by the cooling water discharge from the nuclear power plant (Figure 8). Under the influence of southwest monsoon, the cooling water discharge from nuclear power plant spreads to the northeast, which has less influence on the temperature distribution in Dapeng’ao.
3.4. Temperature rise area distribution
Figures 10 and 11 illustrate the model simulated surface and bottom temperature rise during spring and neap tide period, respectively. Model results show that the cooling water discharge from the DBNPP first expands in a fan shape far out to sea near the outfall, and then spreads mainly to the northeast under the influence of the southwest monsoon. In summer, the water column stratification in Daya Bay is strong, and the cooling water discharge mainly tend to diffuse in the surface layer, and the temperature rise in the bottom layer is not significant (Figures 10B, D, 11B, D). Statistical analysis showed that the total area for summer cooling water discharge led to 1 °C surface temperature rise area near the power plant of about 18.8 to 21.6 km2. The area with temperature rises of 2 °C is between 6.2 and 8.1 km2. The area with temperature rises of 4 °C is no more than 1.2 km2. In the bottom layer, the area within 1°C temperature rise near the power plant is no more than 2.2 km2. There is no area with temperature rise above 1°C (Table 1).

Figure 10 Model simulated temperature rise: (A) surface and flood tide period; (B) bottom and flood tide period; (C) surface and ebb tide period; and (D) bottom and ebb tide period, near the Daya Bay Nuclear Power Plant (DBNPP) during spring tide in summer.
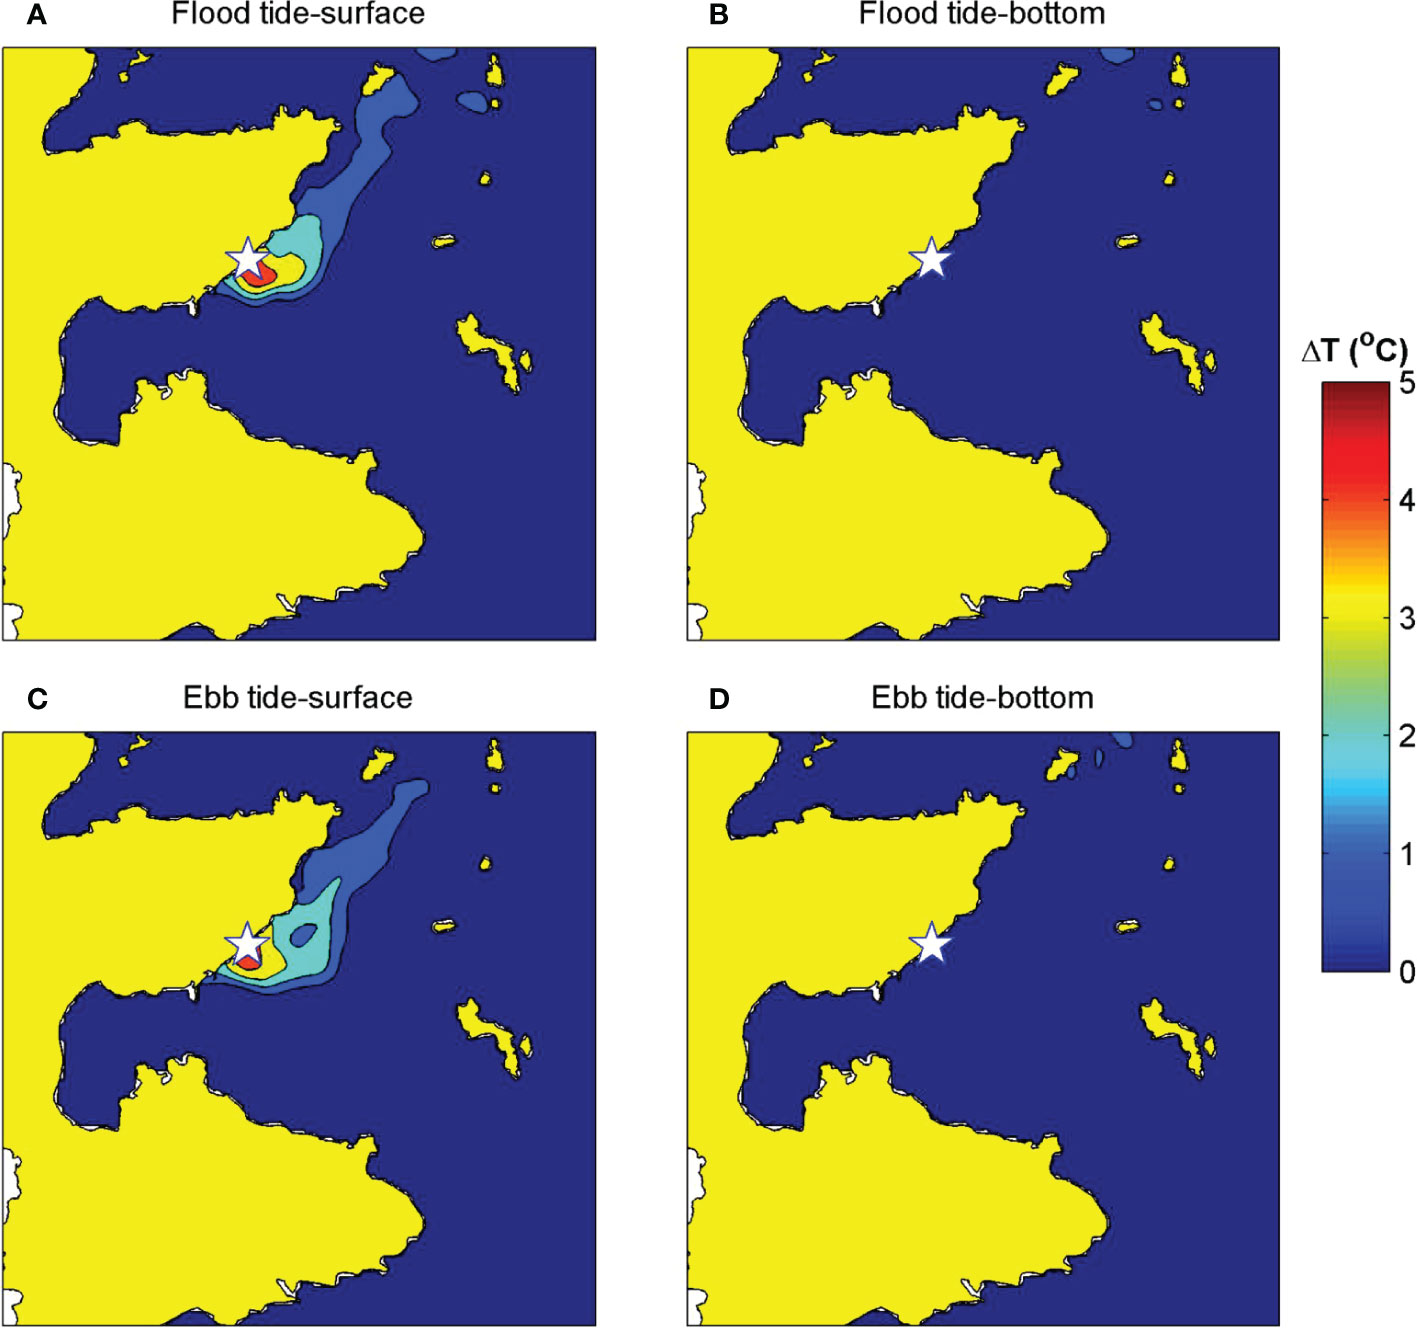
Figure 11 Same as Figure 11, but during neap tide.
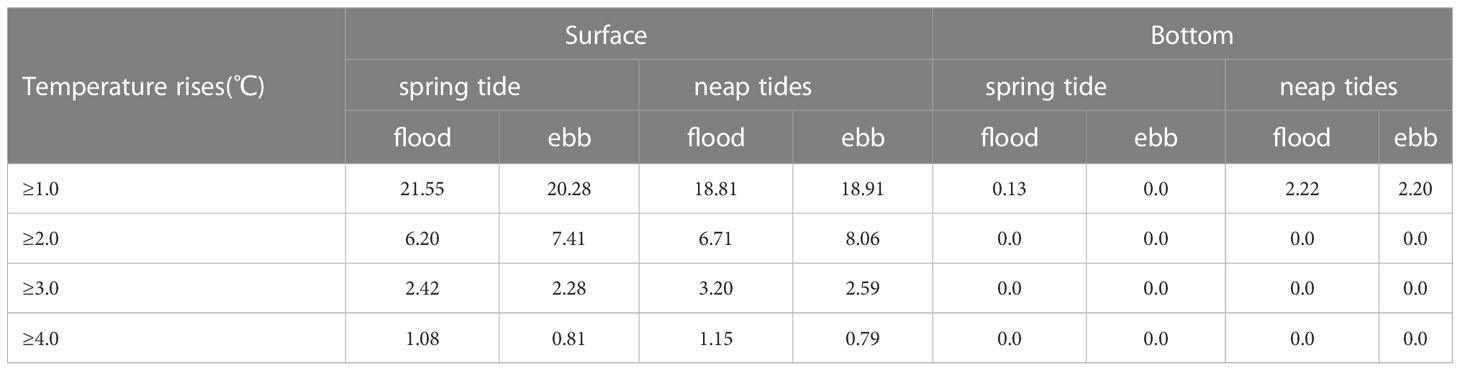
Table 1 Statistics of model simulated surface and bottom temperature rise area (Unit: km2) during spring and neap tide periods due to the cooling water discharge from the Daya Bay Nuclear Power Plant (DBNPP) in summer.
Further comparison of the temperature rise area near the outfall of the DBNPP during spring tide and neap tide shows that the tide also has effect on the diffusion of warm discharge water, with a more significant influence during spring tide (Table 1). According to the tidal dynamics in Daya Bay calculated by the model (Figures 6, 7), the flood tidal current in the sea near the power plant outfall basically flows in the northeast direction along the shoreline, while the direction of the ebb tidal current is opposite. Under the action of such tidal dynamics, the cooling water discharge will expand to the northeast during the flood tide period, which is basically in the same direction as the action of the monsoon, thus extending the temperature rise envelope farther to the northeast (Figure 10A). At ebb tide period, the surface warm water is influenced by the southwestward ebbing tide, and the temperature rise envelope is deflected clockwise. Under the joint influences of summer wind and ebbing tide, the cooling water spreads east-northeastward (Figure 10C). During the period of neap tide, the difference between the expansion pattern of warm water at the time of flood and neap tide is small, indicating that the diffusion of cooling water at this time is mainly controlled by the monsoon (Figure 11).
Modeled hourly time-series of surface 1°C and 4°C temperature rises area, surface tidal current speed and direction, and tidal elevation during spring and neap tide periods are shown in Figures 12. The temperature rise area illustrates obvious flood and ebb tide variations. And the distribution pattern has significant difference during spring and neap tide periods (Figures 12A, B). It demonstrates that the flooding and ebbing tides play important roles on the offshore spreading of cooling water discharge from the DBNPP. The influence is more significant during spring tide, especially for the 4°C temperature rise area with the maximum value occurred during the end of flooding and ebbing tide. The results further support our previous findings. And our findings are consistent with the results of Jiang and Wang (2020) who also had reported the different distributions of temperature rise area during spring and neap tide periods.
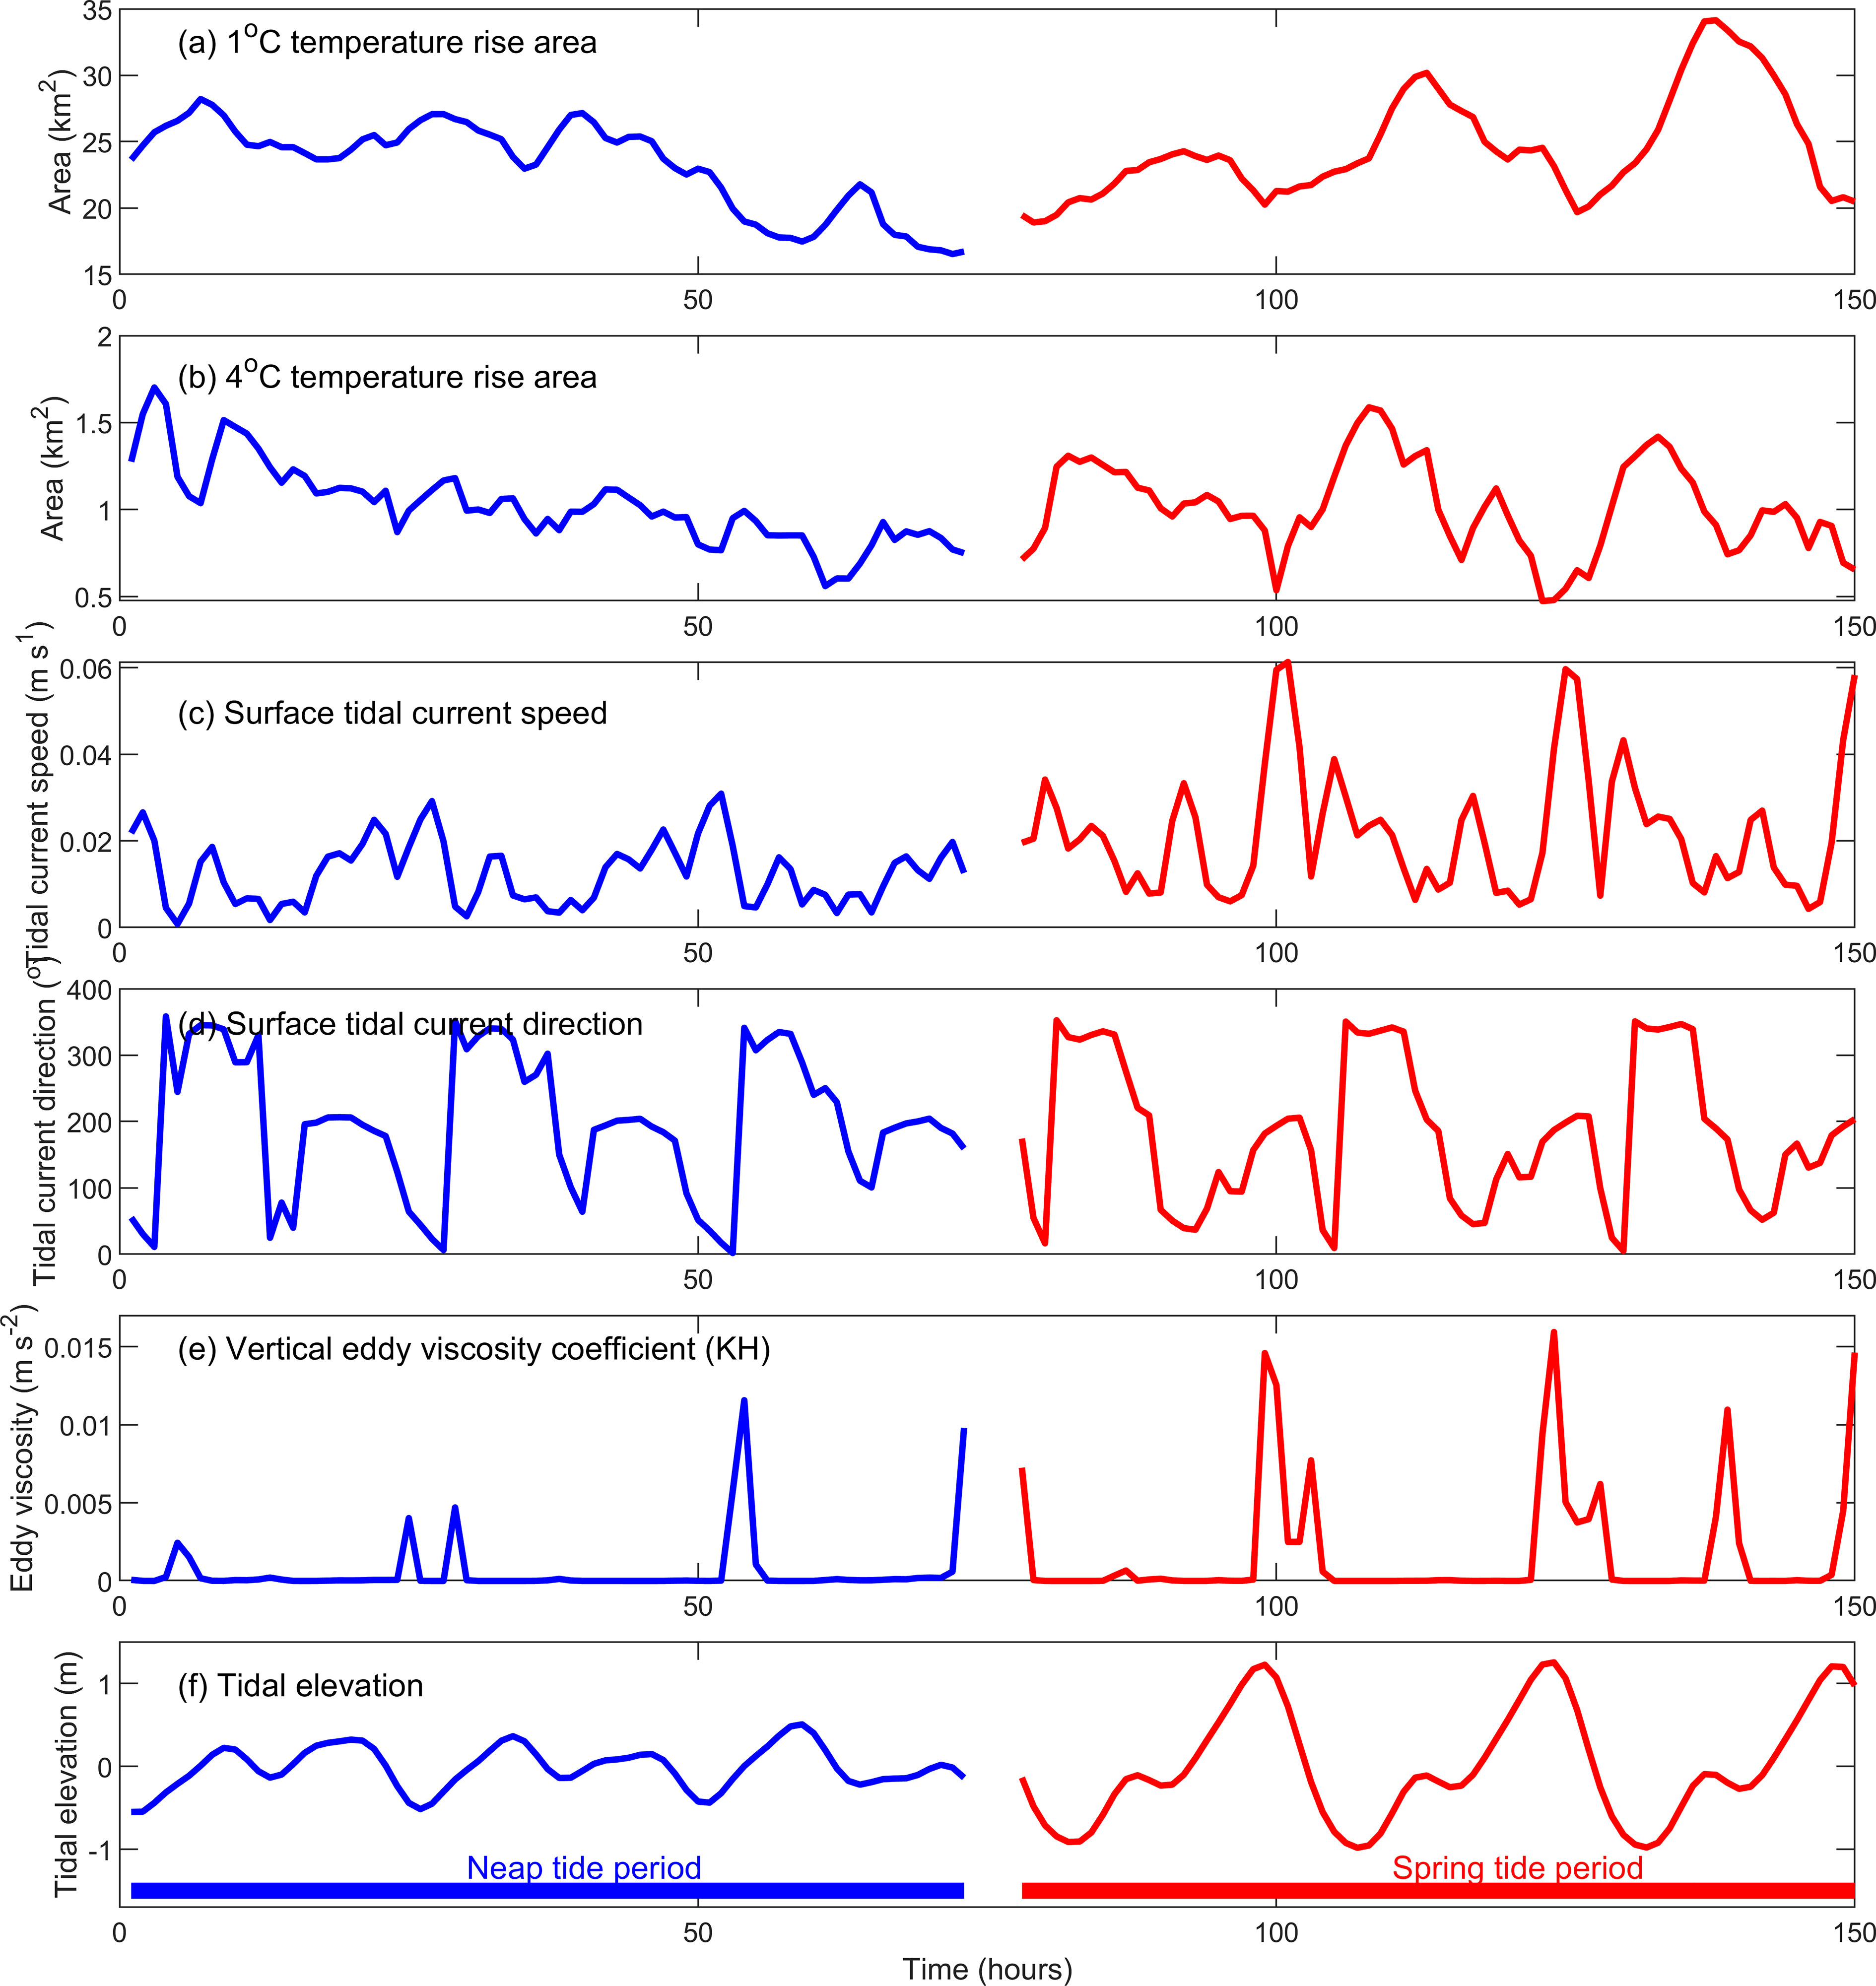
Figure 12 Modeled time-series of: (A) 1℃ temperature rise area; (B) 4℃ temperature rise area; (C) Surface tidal current speed; (D) Surface tidal current direction; (E) Vertical eddy viscosity coefficient and (F) Tidal elevation during spring and neap tide periods.
In order to quantitatively estimate the tidal influence on the diffusion of cooling water discharge from the DBNPP. We calculated the correlation coefficients between the surface temperature rise area with the tidal elevation and tidal current (tidal current speed and direction) shown in Table 2. Generally, negative correlation relationships were found between the tides (i.e., tidal elevation, tidal current speed and direction and temperature rise area). And significant correlations were found between the 4°C temperature rise area and tidal elevation, tidal current speed and direction during spring tide period. Among them, the largest absolute value of correlation coefficient (with R=-0.72) was occurred between the 4°C temperature rise area and tidal elevation. The negative correlation coefficient between the 4°C temperature rise area and tidal current speed indicates that the strong tidal current induced significantly vertical mixing inhibited the horizontal diffusion of cooling water discharge to offshore (Figures 12C, E). Jiang and Wang (2020) also found that the weaker current in neap tide than in spring tide period affected the mixing of cooling water less. Besides the cooling water discharge, the spring-neap tide can also influence the nutrient supply and the primary production of the phytoplankton (Sharples, 2008).
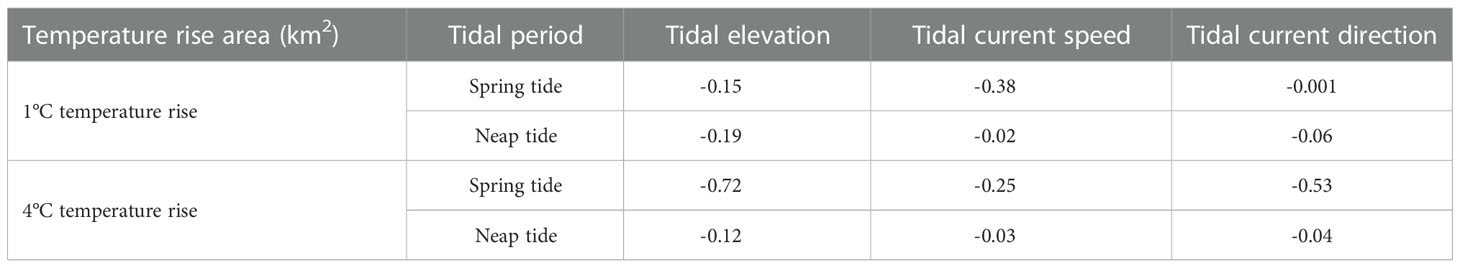
Table 2 Correlation coefficients between the temperature rise (1°C and 4°C) envelope area and tidal elevation, tidal current during spring and neap tide periods.
Our findings imply that tidal effects should not be neglected in the numerical simulation of cooling water discharge in coastal regions. Clearly understanding of the driving mechanisms of tidal influence on the cooling water discharge can improve the capability of the numerical model to precict the dispersion of cooling water discharge. It can also help us to better understand the effects of cooling water discharge on marine environment and ecosystem dynamics.
4. Conclusions
Thermal pollution caused by cooling water discharge from power plants is a severe marine ecological problem of great concern. To reveal the diffusion of cooling water discharge from Daya Bay Nuclear Power Plant (DBNPP) and its impact on the surrounding marine environment, this paper establishes a high-resolution three-dimension (3D) baroclinic model in Daya Bay. The main conclusions are:
(1) The model results are consistent with the observations. The simulated temperature rise distribution and the remote sensing results both show that the intensity of temperature rise gradually decreases from the center of the outfall to the outer sea. 4°C temperature rise area is mainly confined to the area near the outfall. It shows that the model can better reproduce the hydrodynamic and thermodynamic processes in Daya Bay.
(2) The results show that the horizontal tidal currents in Daya Bay is basically reciprocal due to the shoreline and bottom topography constraints. At flood tide, the tide in Daya Bay basically flows from south to north, from the mouth of the bay to the top of the bay, and the ebb tide is roughly opposite to the flood tide, but its strength is stronger than that of the flood tide.
(3) In summer, the surface and bottom temperatures in Daya Bay are high, especially at the top of the bay and near-shore waters, and the bottom water temperature at the mouth of the bay and in the outer sea is low. The warm water discharge led to 1°C surface temperature rise in the sea near the power plant envelope area of about 18.8 to 21.6 km2. The area where the rising temperature over 2 °C is between 6.2 and 8.1 km2. The area with rising temperature over 4 °C is no more than 1.2 km2. The area with 1°C temperature rise near the power plant is no more than 2.2 km2 at the bottom layer.
(4) The tidal process also has certain influence on the diffusion of cooling water diffusion in the DBNPP. The diffusion trend in different tidal processes will have some differences, among which the influence of the spring tide period is more significant than that of the neap tide period.
Data availability statement
The original contributions presented in the study are included in the article/Supplementary Material. Further inquiries can be directed to the corresponding authors.
Author contributions
BG: main contributor to conception, design of the work and result analysis LL: revise the article and ensure the discussions related to the work QC: Drafting the article, revising it critically for important intellectual content WZ : Data analysis and interpretation, check for content, and approval of publications SL: Validation of model DW: Data collection and analysis MH: Data collection and analysis. All authors contributed to the article and approved the submitted version.
Funding
This study is supported by the Guangdong Basic and Applied Basic Research Foundation (No. 2019A1515012108), the National Natural Science Foundation of China (U20A20103, 42230402), and the research fund from the State Key Laboratory of Tropical Oceanography (LTOZZ2101).
Conflict of interest
The authors declare that the research was conducted in the absence of any commercial or financial relationships that could be construed as a potential conflict of interest.
Publisher’s note
All claims expressed in this article are solely those of the authors and do not necessarily represent those of their affiliated organizations, or those of the publisher, the editors and the reviewers. Any product that may be evaluated in this article, or claim that may be made by its manufacturer, is not guaranteed or endorsed by the publisher.
References
Ahsan A. Q., Blumberg A. F. (1999). Three-dimensional hydrothermal model of Onondaga lake, new York. J. Hydraulic Eng. 125, 912–923. doi: 10.1061/(ASCE)0733-9429(1999)125:9(912)
Blumberg A. F., Mellor G. L. (1987). A description of a three-dimensional coastal ocean circulation model. Three-dimensional Coast. Ocean Models 4, 1–16. doi: 10.1029/CO004p0001.
Gan J. P., Li L., Wang D. X., Guo X. Y. (2009). Interaction of a river plume with coastal upwelling in the northern south China Sea. Continental Shelf Res. 29, 728–740. doi: 10.1016/j.csr.2008.12.002
George A. M. (2017). Numerical simulation of warm discharge in cold fresh water (Loughborough University). Thesis. Available at: https://hdl.handle.net/2134/27376
Hao Y., Tang D., Boicenco L., Wang S. (2016). Environmental ecological response to increasing water temperature in the daya bay, southern China in 1982-2012. Natural Resour. 7, 184. doi: 10.4236/nr.2016.74017
Hassan S. T., Baloch M. A., Tarar Z. H. (2020). Is nuclear energy a better alternative for mitigating CO2 emissions in BRICS countries? an empirical analysis. Nucl. Eng. Technol. 52, 2969–2974. doi: 10.1016/j.net.2020.05.016
Hellweger F. L., Blumberg A. F., Schlosser P., Ho D. T., Caplow T., Lall U., et al. (2004). Transport in the Hudson estuary: a modeling study of estuarine circulation and tidal trapping. Estuaries 27 (3), 527–538. doi: 10.1007/BF02803544
Hu J. T., Li S. Y. (2009). Modeling the mass fluxes and transformations of nutrients in the pearl river delta, China. J. Mar. Syst. 78, 146–167. doi: 10.1016/j.jmarsys.2009.05.001
Jiang R., Wang Y.-S. (2020). Modeling the ecosystem response of the semi-closed daya bay to the thermal discharge from two nearby nuclear power plants. Ecotoxicology 29, 736–750. doi: 10.1007/s10646-020-02229-w
Kaviani F., Memarian M. H., Eslami-Kalantari M. (2021). Radioactive impact on Iran and the world from a postulated accident at bushehr nuclear power plant. Prog. Nucl. Energy 142, 103991. doi: 10.1016/j.pnucene.2021.103991
Lima F. P., Wethey D. S. (2012). Three decades of high-resolution coastal sea surface temperatures reveal more than warming. Nat. Commun. 3, 1–13. doi: 10.1038/ncomms1713
Lin J., Zou X., Huang F. (2021). Quantitative analysis of the factors influencing the dispersion of thermal pollution caused by coastal power plants. Water Res. 188, 116558. doi: 10.1016/j.watres.2020.116558
Liu M., Yin X., Xu Q., Chen Y., Wang B. (2020). Monitoring of fine-scale warm drain-off water from nuclear power stations in the daya bay based on landsat 8 data. Remote Sens. 12, 627. doi: 10.3390/rs12040627
Liu Q., Zhou L., Zhang W., Zhang L., Tan Y., Han T., et al. (2022). Rising temperature contributed to the outbreak of a macrozooplankton creseis acicula by enhancing its feeding and assimilation for algal food nearby the coastal daya bay nuclear power plant. Ecotoxicology Environ. Saf. 238, 113606. doi: 10.1016/j.ecoenv.2022.113606
Mahmood N., Wang Z., Zhang B. (2020). The role of nuclear energy in the correction of environmental pollution: Evidence from Pakistan. Nucl. Eng. Technol. 52, 1327–1333. doi: 10.1016/j.net.2019.11.027
Mao H., Qi Y., Qiu C., Luan Z., Wang X., Cen X., et al. (2021). High-resolution observations of upwelling and front in daya bay, south China Sea. J. Mar. Sci. Eng. 9, 657. doi: 10.3390/jmse9060657
Mellor G., Yamada T. (1974). Development of a turbulence closure model of geophysical layers. J. Atmospheric Sci. 33, 1791–1896. doi: 10.1175/1520-0469(1974)031<1791:AHOTCM>2.0.CO;2
Musyoka D., Field R. M. (2018). Review of the environmental oversight framework in Kenya, in light of a nuclear power programme. Prog. Nucl. Energy 108, 89–98. doi: 10.1016/j.pnucene.2018.05.005
Sharples J. (2008). Potential impacts of the spring-neap tidal cycle on shelf sea primary production. J. Plankton Res. 30 (2), 183–197. doi: 10.1093/plankt/fbm088
Song D. H., Yan Y. H., Wu W., Diao X. L., Ding P., And Bao X. W. (2016). Tidal distortion caused by the resonance of sexta-diurnal tides in a micromesotidal embayment. J. Geophysical Rsearch: Oceans 121, 7599–7618. doi: 10.1002/2016JC012039
Wang Y.-S., Lou Z.-P., Sun C.-C., Sun S. (2008). Ecological environment changes in daya bay, China, from 1982 to 2004. Mar. Pollut. Bull. 56, 1871–1879. doi: 10.1016/j.marpolbul.2008.07.017
Wei X., Ni P., Zhan H. (2013). Monitoring cooling water discharge using Lagrangian coherent structures: A case study in daya bay, China. Mar. Pollut. Bull. 75, 105–113. doi: 10.1016/j.marpolbul.2013.07.056
Wu R. H., Cai S. Q., Wang S. A., Zhang W. J. (2007). Three-dimensional numerical simulation of tidal current and residual current at daya bay. J. Trop. Oceanography 26 (3), 18–23.
Wu J. W., Zhou K. B., Dai M. H. (2013). Impacts of the Fukushima nuclear accident on the China Seas: Evaluation based on anthropogenic radionuclide 137Cs. Chinese Science Bulletin 58 (4-5), 552–558. doi: 10.1007/s11434-012-5426-2
Ye Y., Chen K., Zhou Q., Xiang P., Huo Y., Lin M. (2018). Impacts of thermal discharge on phytoplankton in Daya Bay. J. Coast. Res., 83 (10083), 135–147. doi: https://doi.org/10.2112/SI83-022.1
Yue W.-Z., Sun C.-C., Shi P., Engel A., Wang Y.-S., He W.-H. (2018). Effect of temperature on the accumulation of marine biogenic gels in the surface microlayer near the outlet of nuclear power plants and adjacent areas in the daya bay, China. PloS One 13, e0198735. doi: 10.1371/journal.pone.0198735
Zhang H., Li S. Y. (2010). Effects of physical and biochemical processes on the dissolved oxygen budget for the pearl river estuary during summer. J. Mar. Syst. 79, 65–88. doi: 10.1016/j.jmarsys.2009.07.002
Zhang W., Zhou R. (2004). Thermal impact analysis of discharge of circulating cooling water at daya bay nuclear power station (GNPS) and ling'ao nuclear power station (LNPS). Radiat. Prot. (Taiyuan) 24, 257–262.
Keywords: Nuclear power plant, cooling water discharge, 3D numerical model, tidal dynamics, monsoon
Citation: Geng B, Lu L, Cao Q, Zhou W, Li S, Wen D and Hong M (2023) Three-dimensional numerical study of cooling water discharge of Daya Bay Nuclear Power Plant in southern coast of China during summer. Front. Mar. Sci. 9:1012260. doi: 10.3389/fmars.2022.1012260
Received: 05 August 2022; Accepted: 19 December 2022;
Published: 09 January 2023.
Edited by:
Dilip Kumar Jha, National Institute of Ocean Technology, IndiaReviewed by:
Wentao Ma, Shanghai Jiao Tong University, ChinaQiyan Ji, Zhejiang Ocean University, China
Heng Zhang, School of Marine Sciences, Sun Yat-sen University, China
Copyright © 2023 Geng, Lu, Cao, Zhou, Li, Wen and Hong. This is an open-access article distributed under the terms of the Creative Commons Attribution License (CC BY). The use, distribution or reproduction in other forums is permitted, provided the original author(s) and the copyright owner(s) are credited and that the original publication in this journal is cited, in accordance with accepted academic practice. No use, distribution or reproduction is permitted which does not comply with these terms.
*Correspondence: Wen Zhou, emhvdXdlbkBzY2llcy5vcmc=; Lingyan Lu, OTM2NTAxMzY1QHFxLmNvbQ==