 Jiongjiang Chen1
 Jialin Tang1*Shounan Lin1Wanxin Liang1Binghua Su1Jinghui Yan1Dujuan Zhou1,2Lili Wang1Yunting Lai1Benxi Yang1
- 1Key Laboratory of Intelligent Detection in Complex Environment of Aerospace Land and Sea, Beijing Institute of Technology, Zhuhai, China
- 2Faculty of Innovation Engineering, Macau University of Science and Technology, Macau, China
Ocean exploration has always been an important strategic direction for the joint efforts of all mankind. Many countries in the world today are developing their own underwater autonomous explorers to better explore the seabed. Vision, as the core technology of autonomous underwater explorers, has a great impact on the efficiency of exploration. Different from traditional tasks, the lack of ambient light on the seabed makes the visual system more demanding. In addition, the complex terrain on the seabed and various creatures with different shapes and colors also make exploration tasks more difficult. In order to effectively solve the above problems, we combined the traditional models to modify the structure and proposed an algorithm for the super-resolution fusion of enhanced extraction features to perform semantic segmentation of seabed scenes. By using a structurally reparameterized backbone network to better extract target features in complex environments, and using subpixel super-resolution to combine multiscale feature semantic information, we can achieve superior ocean scene segmentation performance. In this study, multiclass segmentation and two-class segmentation tests were performed on the public datasets SUIM and DeepFish, respectively. The test results show that the mIoU and mPA indicators of our proposed method on SUIM reach 84.52% and 92.33%mPA, respectively. The mIoU and mPA on DeepFish reach 95.26% and 97.38%, respectively, and the proposed model achieves SOTA compared with state-of-the-art methods. The proposed model and code are exposed via Github1.
1 Introduction
As we all know, the area of the ocean is about 360 million square kilometers, accounting for about 71% of the total surface area of the earth, but the degree of human exploration and development of the ocean is less than 5%. However, the ocean is an important source of food, energy, and minerals in the world, such as rich marine life, oil, natural gas, coal, and various rare metal resources. In addition, about 40% of the world’s population live in coastal areas, and three quarters of the world’s largest cities are located in coastal areas (Rayner et al., 2019).
In the process of using autonomous underwater explorers to explore the seabed, the detection and perception accuracy of the vision system is relatively high. For example, for challenging problems such as insufficient ambient light, related research studies have used convolutional neural networks to detect and identify marine organisms (Li et al., 2020; Xu et al., 2021; Zhang et al., 2021; Kraft et al., 2022). However, using target detection to achieve target object positioning is still not accurate enough. In order to effectively solve the above problems, we take semantic segmentation as an important research direction and use semantic segmentation to perform pixel-level segmentation of target objects so that pixel-level segmentation can be achieved. We then locate the target object.
Most of the previous studies are dealing with single-class or less-classification tasks, i.e., segmentation only of the foreground and the background (Saleh et al., 2020; Zhang et al., 2021). For example, Zhang et al. (2021) proposed a dual-pool aggregated attention network called DPANet, through which the pool-aggregated location attention module and the pool-aggregated channel attention module process the feature maps to perform pixel-level segmentation of marine organisms. The above research performs semantic segmentation of fish; that is, only the fish and the ocean background need to be segmented. For the multi-objective semantic segmentation task of the ocean, Islam et al. (2020) proposed a fully convolutional encoder–decoder model called SUIM-Net, which has two versions. One is to combine the residual structure and skip connection. The residual skip block (RSB) is formed, which can solve the problem of gradient explosion and gradient disappearance in relatively deep network training (He et al., 2015a). This improves the performance of the model by adding RSB connections to the decoder. The other version is to use the VGG convolutional neural network as the backbone network of SUIM-Net (Simonyan and Zisserman, 2014), which has the advantage of improving the segmentation performance of the network. Finally, the authors of this study chose SUIM-Net (VGG) as their final model, which shows that segmentation performance is still the key research direction of ocean image segmentation. In addition, the authors of this study published a large dataset they produced for the semantic segmentation of underwater images (Islam et al., 2020).
The above-mentioned previous studies used more traditional and classical neural networks, and most of them were binary classification tasks, that is, background and target objects. However, in an actual marine exploration environment, various creatures will appear, and using only a few classification tasks cannot meet practical engineering needs. In order to effectively improve the operational efficiency of autonomous underwater explorers, we propose a novel structure-reparameterization and subpixel convolutional super-resolution network (RMP-Net), which uses a structure-reparameterized backbone feature extraction network. It enables the network to have better feature extraction performance and certain real-time performance (Ding et al., 2021), and the subpixel convolution super-resolution module can better help the performance of the backbone network to better migrate to downstream tasks in feature recovery (Shi et al., 2016; Bousmalis et al., 2016). In the process of feature fusion, more pieces of contour and shallow semantic information of the target object are retained, so that the network model can realize the multitarget semantic segmentation task of the marine environment. In this study, we use the SUIM dataset (Islam et al., 2020) and the DeepFish dataset (Saleh et al., 2020) for experimental testing to better evaluate the comprehensive performance of the model through these two challenging datasets.
The contributions of this study can be summarized as follows:
1. This study proposes RMP-Net for the multiclassification semantic segmentation of marine scenes to meet the needs of autonomous underwater explorers for multitarget recognition and segmentation in seabed operations. It is expected to improve the performance of underwater operations’ efficiency.
2. RMP-Net uses subpixel convolution to perform semantic information super-resolution recovery and fusion of the features learned by the backbone feature extraction network, which can efficiently fuse the multiscale feature layers obtained by the backbone network to further enhance the model’s ability to operate under the sea. This shows the accuracy of the multiclass object segmentation in the environment.
3. RMP-Net is evaluated using both SUIM and DeepFish datasets and outperforms state-of-the-art methods. At the same time, the RMP-Net proposed in this study and the entire framework source code can be downloaded from Github.
The rest of the paper is organized as follows. We discuss the method proposed in this study in Section 2, present the experimental results in Section 3, discuss the results in Section 4, and summarize the results in Section 5.
2 Materials and methods
2.1 Structural reparameterization
Early convolutional neural networks achieved better results by stacking convolutional layers continuously, such as VGG and AlexNet (Krizhevsky et al., 2012; Simonyan and Zisserman, 2014). In recent years, in order to improve network performance, researchers have also developed many complex structures, such as introducing multibranch structures and using different convolution methods (Szegedy et al., 2014). Although these schemes can improve model performance, they will also bring other problems such as increasing memory consumption and affecting model inference speed (Zhang et al., 2017); therefore, VGG and ResNet are still widely used today (Simonyan and Zisserman, 2014; He et al., 2015a).
In order to effectively improve the accuracy of the plain structure of VGG, RepVGG is proposed (Ding et al., 2021). RepVGG introduces a multibranch structure based on VGG, which can greatly improve the model performance during training. In addition, RepVGG uses multibranch fusion technology to merge the convolution kernels BN in the multibranch structure during inference, which greatly improves the speed of the model in the inference phase.
Figure 1 shows a RepVGG Block structure, which uses a multibranch structure during training and a single-way structure during the inference phase above. Assuming that F(X) represents a 3x3 convolution and G(X) represents a 1x1 convolution, then the calculation made in a block can be expressed as Equation 1:
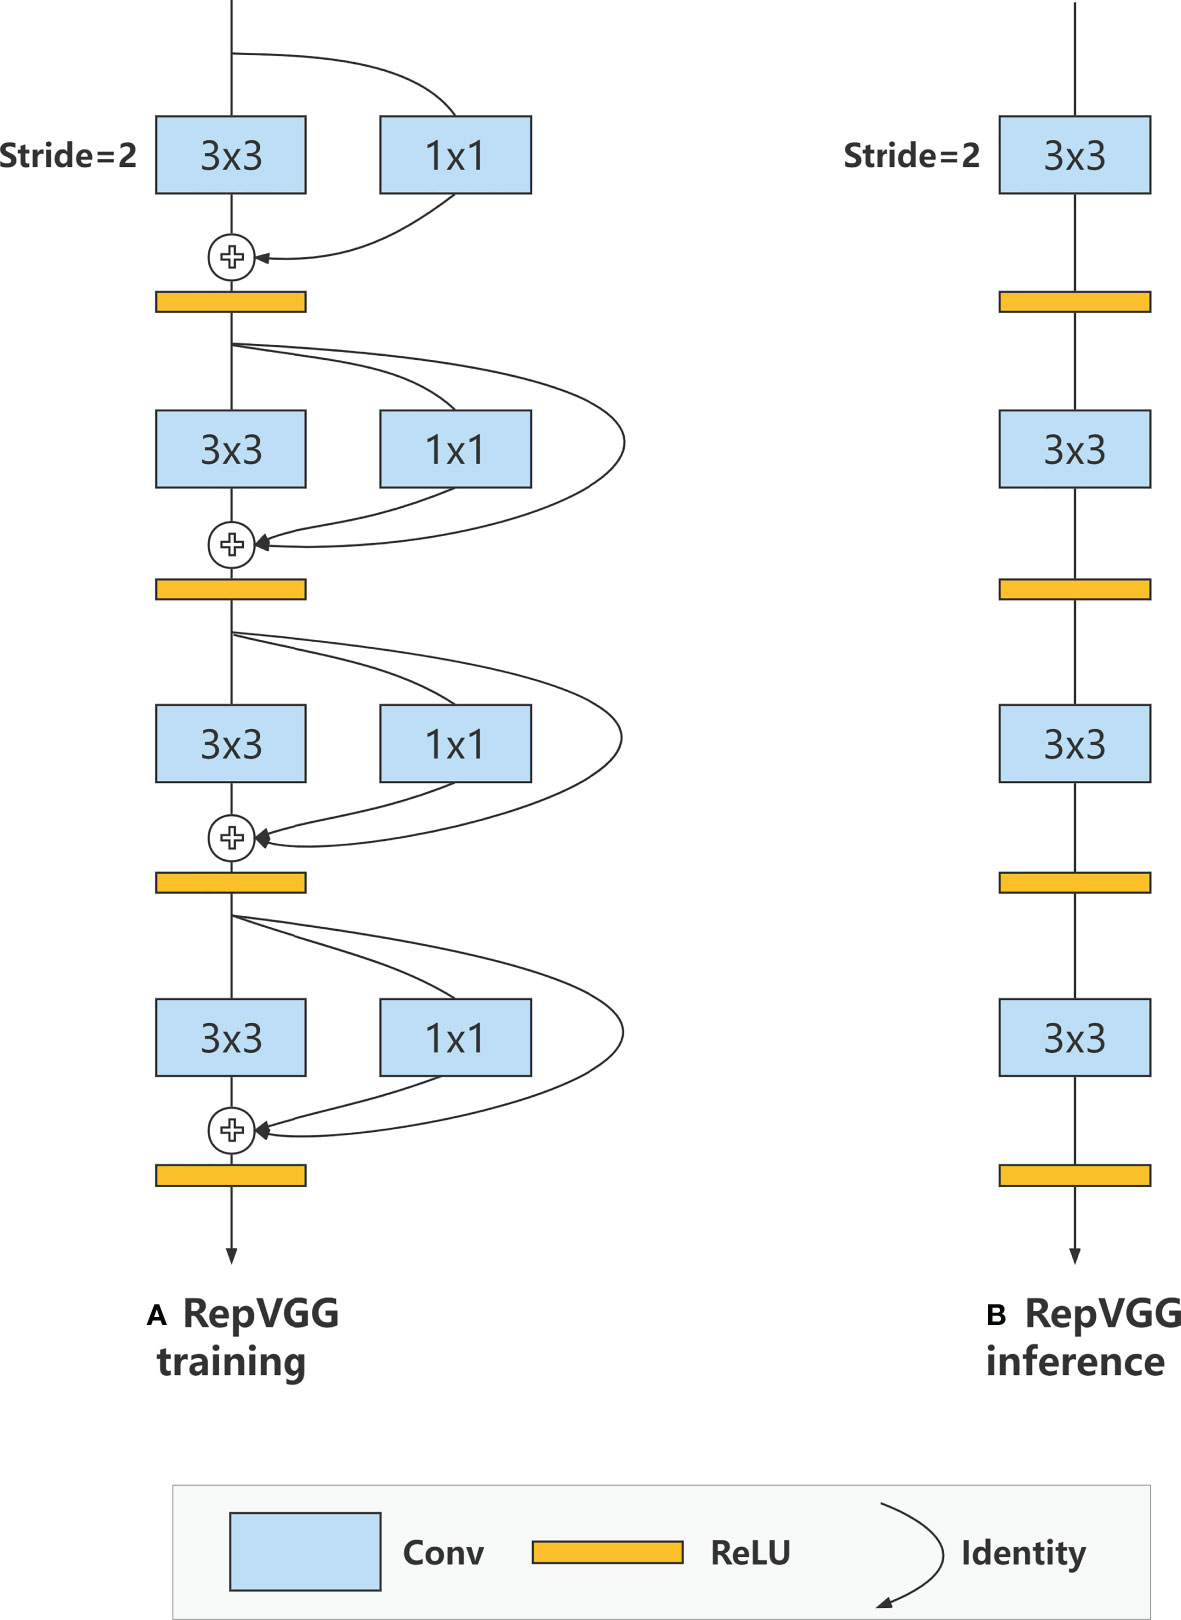
Figure 1 RepVGG Block structure, using a multibranch structure during training and a single-way structure during the inference phase.
In the process of structural reparameterization, we will fuse the convolutional and pooling layers, where it is assumed that W is the convolutional kernel weight, i is the ordinal number of the convolutional kernel, μ denotes the mean of the BN layer, and the variance of the BN layer is denoted by σ; γi and βi denote the scale factor and the offset factor of the BN layer, respectively; and W’ and b’ denote the convolutional weight and bias after fusion, respectively. Then the weight of the ith convolutional kernel after fusion can be expressed as follows:
The weight of the ith BN layer after fusion can then be expressed as Equation 3:
Figure 2 shows RepVGG, which performs the process of structural reparameterization, i.e., multibranch structural fusion above. For the 1x1 convolutional branch in the structure, we can first replace it with a 3x3 convolutional kernel and then move the values in the 1x1 convolutional kernel to the center of the 3x3 convolutional kernel, and fill the rest with zeros. For the identity branch, we can also equivalently convert it to a 3x3 convolution kernel, which gives us three 3x3 convolution kernels.
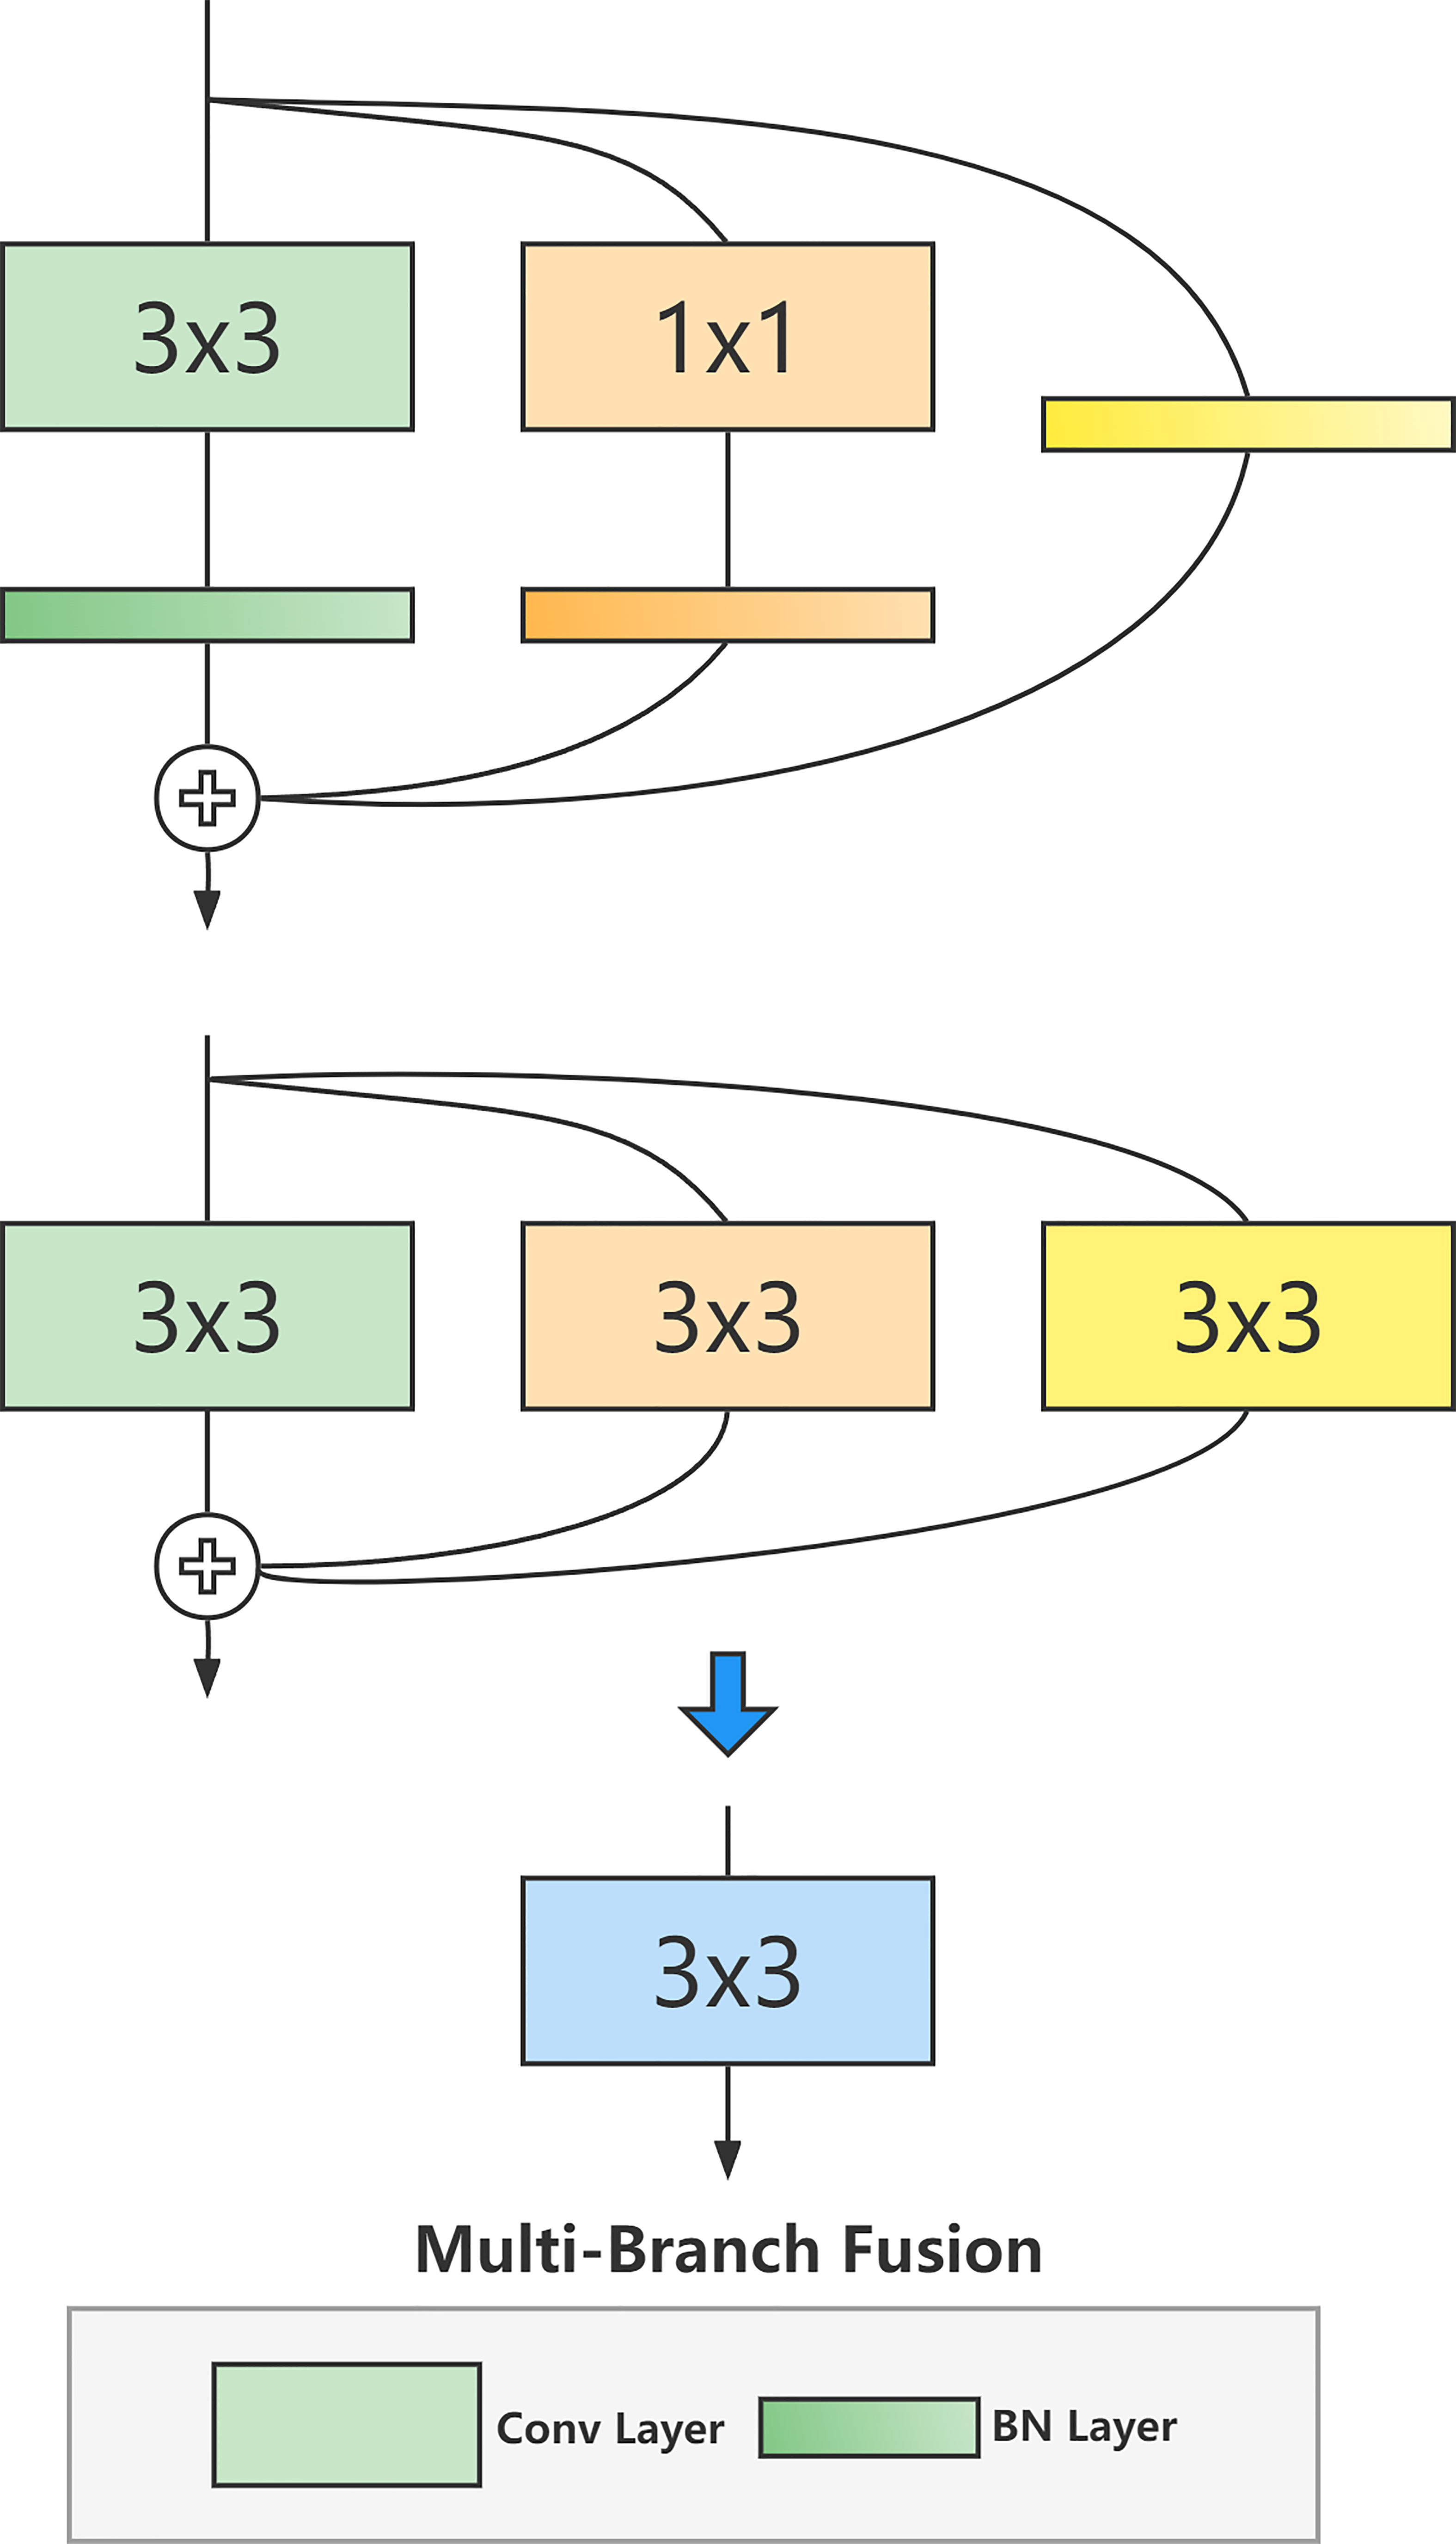
Figure 2 RepVGG performs the process of structural reparameterization, i.e., multibranch structural fusion.
Finally, we only need to fuse and merge multiple convolutional kernels, i.e., to ßuck BN. Assuming that the weights of all branches are W, the input and output matrices are M, and the bias is B, we can represent the fused 3x3 convolution as Equation 4:
We use RepVGG as the U-Net backbone feature extraction network, and the output of the five stages is effectively used as multiscale fusion features, which can increase the model’s ability to extract features at different scales while reducing the number of computational parameters in model inference, and can effectively extract features and fuse them to improve model segmentation accuracy.
2.2 Subpixel convolution
In the process of camera imaging, the resulting image is actually discretized; where two adjacent pixels are connected macroscopically, in reality, there are countless tiny things between them microscopically. These are called subpixels. Subpixels actually exist, but due to the physical limitations of the acquisition device’s sensor, the data can only be represented by approximation. To maximize the use of information in the image itself to improve super-resolution, Shi et al. (2016) proposed subpixel convolution.
Figure 3 shows a high-resolution image obtained by upsampling a low-resolution image using subpixel convolution. By super-resolution, upsampling a high-dimensional low-resolution feature map to obtain a low-dimensional high-resolution image can effectively recover the detailed information in the feature map. The principle of subpixel convolution is to learn the convolution of the corresponding number of channels in the penultimate layer of the model, (r2, c), where c is the number of channels in the final output, and r is the upsampling multiplier to be performed. For example, if a 9-channel 3x3 feature map is upsampled by a factor of 3, the final size is a single-channel 9x9 feature map. The above pixel alignment operation can be described by the following principle:
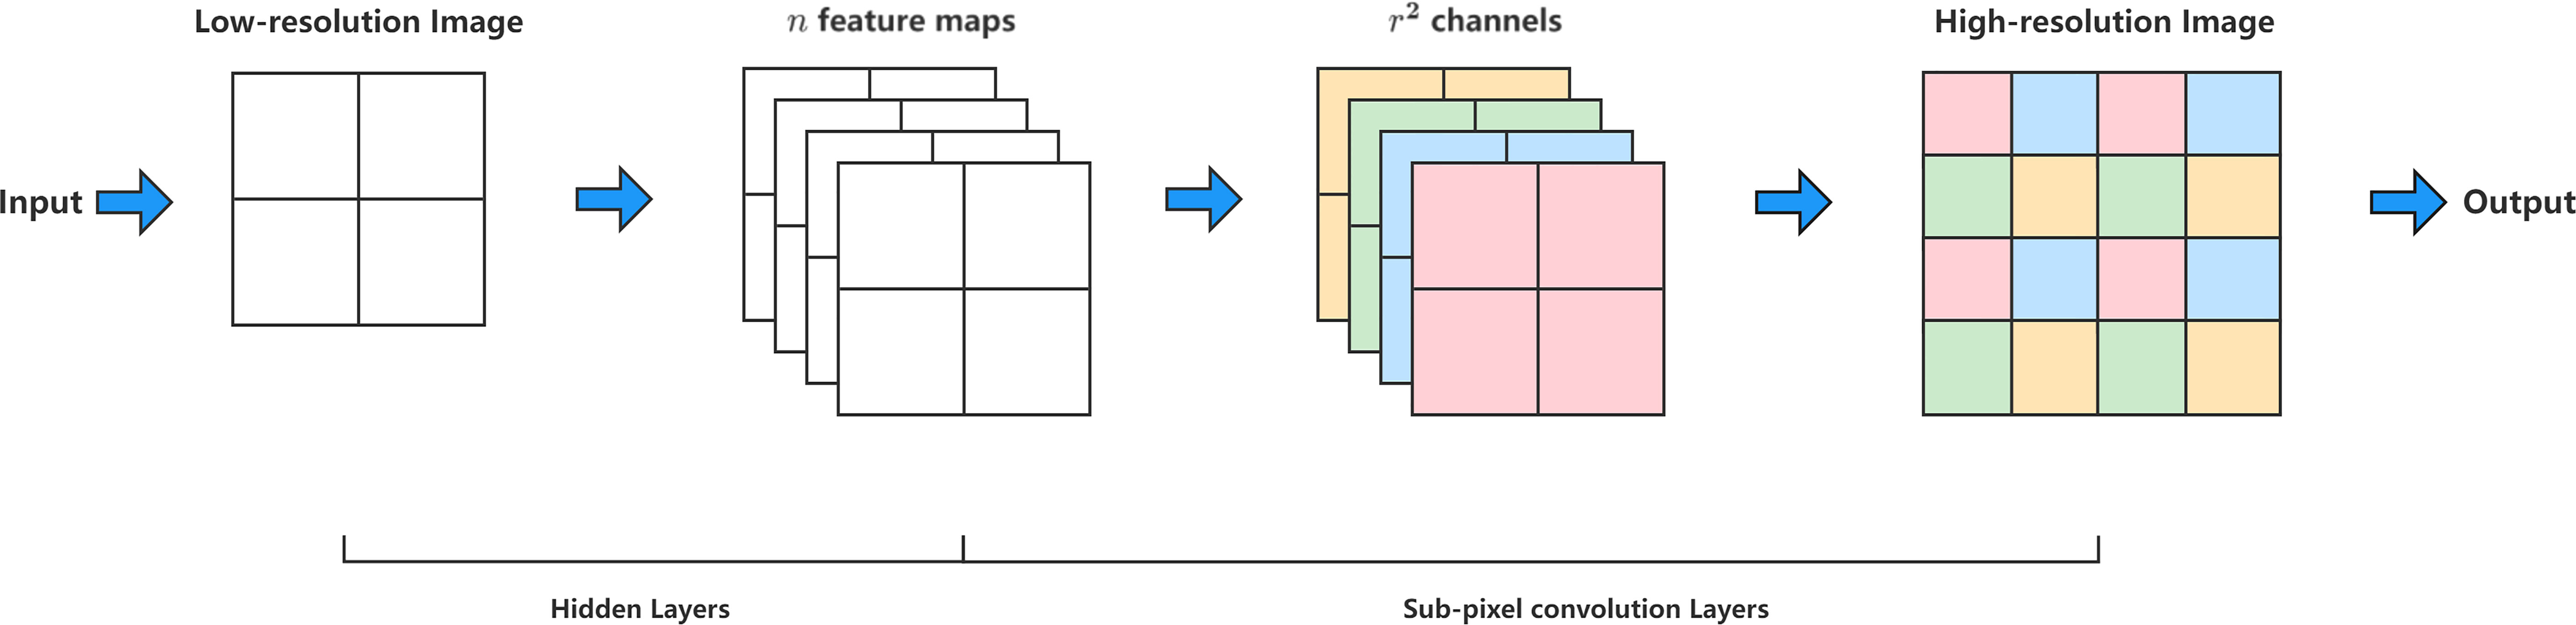
Figure 3 The high-resolution image is obtained by upsampling the low-resolution image using subpixel convolution. By super-resolution, upsampling a high-dimensional low-resolution feature map to obtain a low-dimensional high-resolution image can effectively recover the detailed information in the feature map.
From the above equation, we can see that in subpixel convolution, consecutive c channels are taken from the number of channels of the feature map as a whole, and then the final multichannel upsampled map is obtained by rearranging the pixels. For a feature vector of size HxW channel number r2, we can upsample it with subpixel convolution, assuming that H’ is the output feature vector length, W’ is the output feature vector width, and r’ is the output feature vector channel number. Then the final output scale can be expressed by the following equation:
We connect the subpixel convolution to the decoder in U-Net, pass the fused features at each scale to the subpixel convolution for super-resolution upsampling, set different subpixel convolution upsampling multipliers for each layer (Sun et al., 2020), and upsample the output of each layer into a feature vector of size 256x256. The advantage of this is that the edge information in the deep semantic information of low resolution and high dimension can be recovered and preserved as much as possible, whereas the consistent scale makes it convenient to fuse and sum the feature vectors.
2.3 Structure of RMP-Net model
The RMP-Net network is based on the improved U-Net model (Ronneberger et al., 2015) [19], and B2 is selected as the backbone feature extraction network after comparing the structure of multiple versions of RepVGG. The five stages of RepVGG-B2 have [1,4,6,14,1] layers and [64,128,256,512] widths, and the scaling hyperparameters are 2.5 and 5, respectively. Figure 4 shows the overall structure of the RMP-Net network, where the backbone RepVGG is composed using a RepVGG block and uses subpixel convolution to upsample multiscale effective features for semantic information recovery below. The RMP-Net is mainly composed of four parts: input, backbone, multiscale fusion, and output prediction.
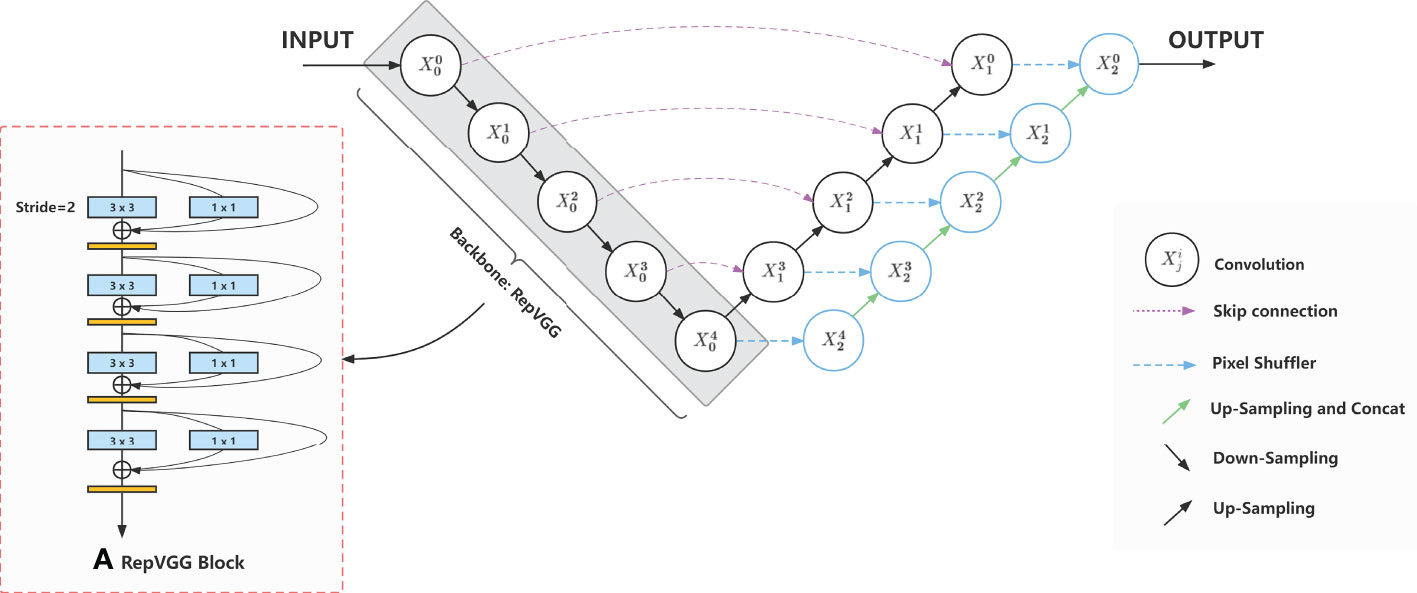
Figure 4 The overall structure of the RMP-Net network; the backbone RepVGG is composed using a RepVGG Block and uses subpixel convolution to upsample multiscale effective features for semantic information recovery.
The first part of the data input is actually a pre-processing operation of the data, which contains the enhancement of the dataset, such as the rotation, cropping, and enlargement operations corresponding to the original image and labels, and the 1.5 times expansion of the dataset, which can effectively improve the robustness and accuracy of the model through data enhancement (Cubuk et al., 2018). Here we will unify the input images to a size of 512x512.
The backbone network uses the RepVGG network, which mainly consists of multiple stages with different numbers of RepVGG blocks, and the RepVGG blocks are composed of VGGs with multibranch structure; the multibranch structure is used to obtain high performance during training (Szegedy et al., 2014), and the inference stage is turned into a single-way structure by the multibranch fusion algorithm to speed up the model inference. This allows the model to have high performance and faster inference speed at the same time. We will select five stages of RepVGG as the effective multiscale feature vectors for the subsequent enhanced feature fusion operation, which are [64,256,256], [160,128,128], [320,64,64], [640,32,32], and [2560,16,16] in order of scale, which can be referred in Table 1.
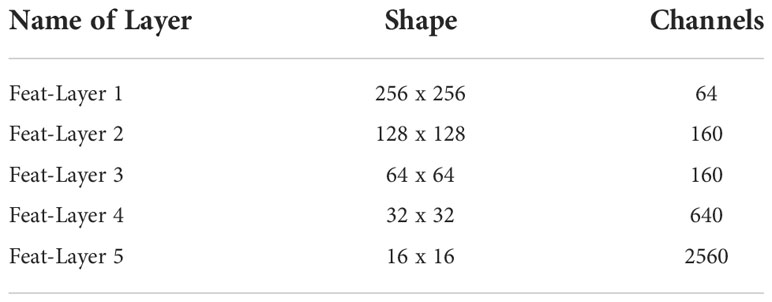
Table 1 The scale of different effective feature layers of the backbone.
In the multiscale fusion part, the feature vectors extracted from the backbone network at different scales are first super-resolved by subpixel convolutional scale normalization, where we will process the five feature vectors output from the backbone network and upsample them by subpixel convolutional scale unification so that we can get five feature vectors with scales of [10,256,256], [8,256,256], [16,256,256], [32,256,256], and [64,256,256]. After summing the above feature vectors, we can obtain a feature vector map with the scale [130,256,256], which is the final fused feature vector map we need. Table 2 shows the scale of different layers.
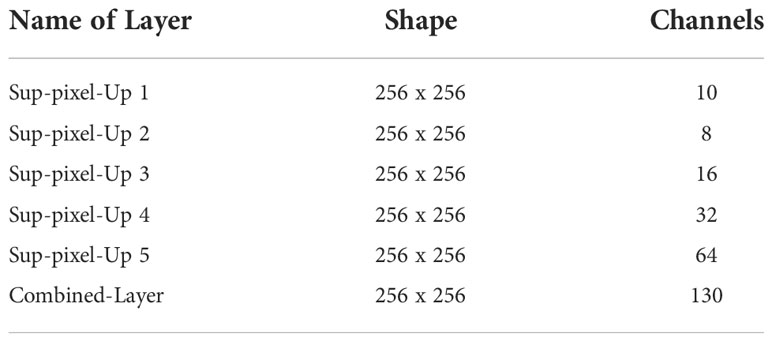
Table 2 Model hyperparameters at different training stages.
The final prediction part classifies the output of the model by performing a Softmax operation on the predicted values of each pixel to obtain the multicategorization probability of the model for each pixel. The maximum probability value is obtained by argmax to determine the class of the pixel. After classifying a pixel, it is simply assigned a different color and mapped to the location of the corresponding pixel to complete the segmentation.
2.4 Loss function
The loss function used in the training model in this paper is cross-entropy loss (Rubinstein and Kroese, 2004; Ma et al., 2021), which is used when classifying pixel points using Softmax. It can be used to measure the difference between two probability distributions, and thus the difference between the distribution learned by the model and the true distribution. When using cross-entropy loss for multiclassification tasks, the mathematical relation can be expressed by the following equation:
where M denotes the number of categories, and yic denotes the symbolic function (if the true category of sample i is equal to c, take 1; otherwise, take 0). pic then denotes the prediction probability that sample i belongs to category c. Different tasks may require the use of different loss functions, and the loss function will, to some extent, affect the final effect of the model after training. When using the cross-entropy loss function, the learning speed will be faster when the model is poor and slower when the model is good (Gonzalez and Miikkulainen, 2019).
Because the semantic segmentation we study this time is a multiclassification task, here we directly use cross-entropy loss as the loss function of the neural network to optimize the model.
2.5 Model training
The computer hardware and software environment for model training and the main performance indicators are shown as follows:
(1) CPU: Intel Xeon Silver 4110; (2) memory: 128G DDR4; (3) graphics card: 4 x Nvidia GeForce Titan Xp; (4) operating system: Ubuntu 18.04; (5) development environment: Python 3.8; PyTorch 1.11.0.
The network model training in this paper uses ImageNet-based pretraining weights as the initial parameters of the backbone network RepVGG for migration learning training (Deng et al., 2009). The parts other than the backbone network will be initialized with Kaiming to accelerate the model convergence speed (He et al. (2015b)). The whole training process will be divided into two parts: freeze trunk training and unfreeze trunk training. Between them, 0–50 is for freezing training, and 50–100 is for thawing training. The initial learning rate for frozen training is set to 5e-3, and the batch size is set to 16. The initial learning rate for unfreezing training is set to 5e-5, and the batch size is set to 8. The training optimizer used is the Adam optimizer (Kingma and Ba, 2014), and its parameters and learning rate are optimized by the StepLR adjuster; the step size is 1, and the gamma is 0.96. The training parameters are referred to in Table 3. Freeze training only loads the weights of the backbone network because the preweights used are obtained by training the ImageNet dataset. Such a classification network already has very good feature extraction capabilities, so the weights of the backbone network remain unchanged during the training process (Pan and Yang, 2010). Only the weight parameters of the decoder part are changed. Unfreezing training releases the weight of the entire network, so the weight parameters of the entire network will change during the training process, but the parameters of the backbone network are generally only fine-tuned and will not change too much.

Table 3 Model hyperparameters at different training stages.
Transfer learning can transfer the ability of the network used for one task to another task, which greatly improves the speed and effect of model training and enables the network to have relatively good results in different tasks and therefore in preweighting. The loading of is essential for 99% of model training.
3 Results
3.1 Results on SUIM
3.1.1 Qualitative analysis
The SUIM dataset focuses on the segmentation of ocean scenes [11]. It includes a total of 1,525 training images and 110 verification images. The entire dataset contains a total of eight categories of target objects. The codes corresponding to the specific categories are shown in Table 4.
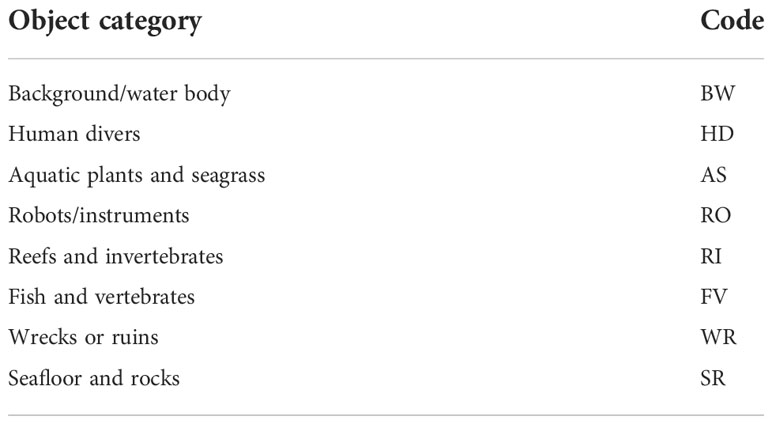
Table 4 Classes of objects annotated with pixels in the dataset and the corresponding codes.
In Figure 5, the visualization results of the comparison test of each model network on the SUIM dataset are shown. We use images of each category from the test set as the test input of the model to more intuitively compare the multiclass segmentation performance of the model.
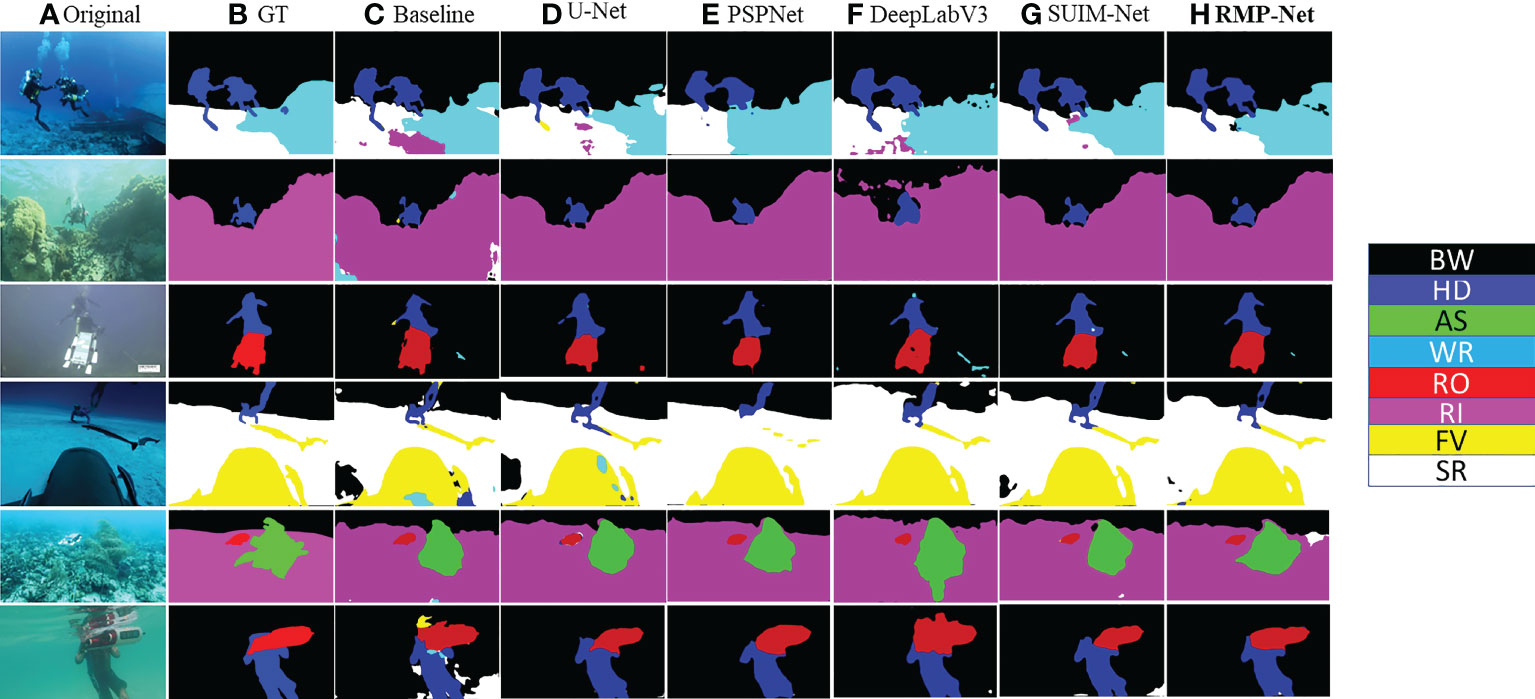
Figure 5 Qualitative comparative experiments on state-of-the-art segmentation models. (A) Input image. (B) Label. (C) Baseline. (D) U-Net (ResNet50). (E) PSPNet. (F) DeepLabV3. (G) SUIM-Net. (H) RMP-Net.
It can be seen from the segmentation comparison diagram in Figure 5 that the segmentation effect of the original U-Net is relatively poor, and there will be many misjudgments of target categories. In addition, the recovery effect of target segmentation integrity and edge information is also very broad. The U-Net model that replaces the VGG backbone with ResNet50 has relatively good prediction results, and there are much fewer misjudgments of the target category. Most of the pixels can be classified correctly, and most of the target area can be predicted. The prediction results of PSPNet are still very good (Zhao et al., 2017). Compared with the previous two, it can be seen from the fourth picture that the pixel accuracy of the model is much higher, and the segmentation effect is very good. The performance of the DeepLab model is comprehensively between the U-Net of the PSPNet and ResNet50 versions (Chen et al., 2017). The overall prediction effect of SUIM-Net is also good, but there will be some misclassifications.
The last column is the prediction result of RMP-Net proposed in this paper. It can be seen intuitively that its effect is better than that of the other models. There are a few cases of misjudgment of the target category in the six test images. The prediction results of the first picture show that RMP-Net has a high degree of restoration for the target contour feature recovery. From the results of the fourth picture, it can also be seen that the model has a better recovery effect on the edge contour feature details of the human hand. Experiments show that the test results of the RMP-Net model are better than those of the other models.
3.1.2 Quantitative analysis
The evaluation metrics use two metrics commonly utilized in semantic segmentation tasks: mIoU and mPA, which can better reflect the comprehensive performance of the model.
The mIoU is the weighted average of the IoU of each class. The IoU of each class can be calculated by the confusion matrix, and the value on the diagonal of the confusion matrix is the intersection of the class; each row plus each column minus the value on the diagonal is the sum of the class.
After getting the IOU of each class, we only need to obtain the average to get the mIoU. Let N be the number of categories and Sum be the summation; then mIoU is given as follows:
The mPA is the proportion of the number of pixels correctly classified for each class calculated separately, i.e., the CPA and then averaged cumulatively. Assuming that P is the accuracy of each category pixel, the mPA is given as follows:
The SUIM dataset is used to test the segmentation accuracy of the model, and the corresponding verification models are RMP-Net, UNet (ResNet50), UNet (VGG16), PSPNet, DeepLabV3, DeepLabV3, and SUIM-Net. As mentioned above, the evaluation indicators mIoU and mPA are used to evaluate the model, and the final evaluation results are shown in Figure 5 and Table 5, 6.
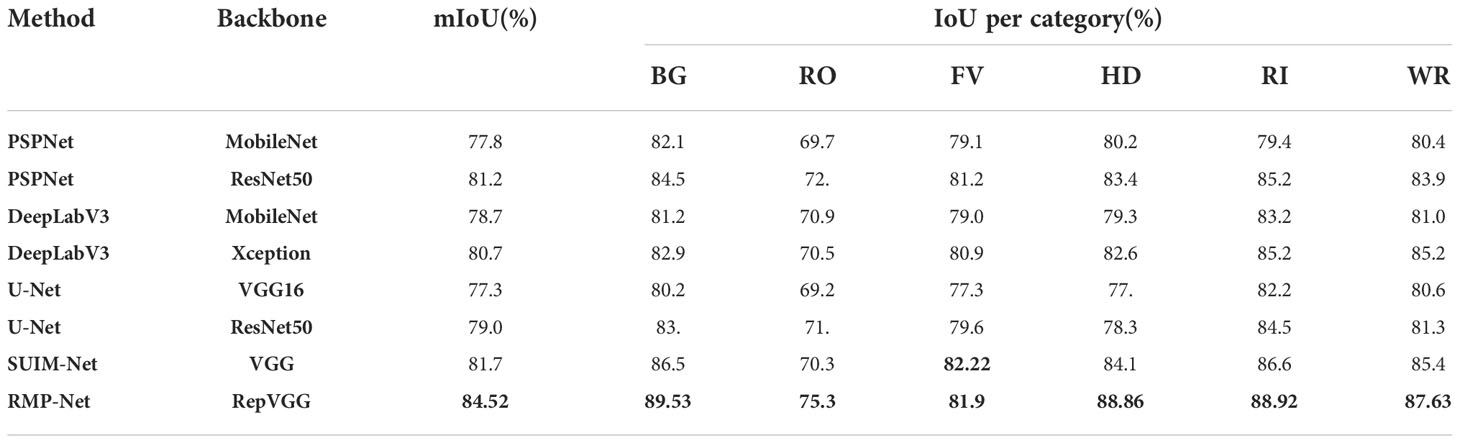
Table 5 Comparing mIoU metrics between different models on the SUIM dataset, where the metrics with the highest rankings are shown in bold.
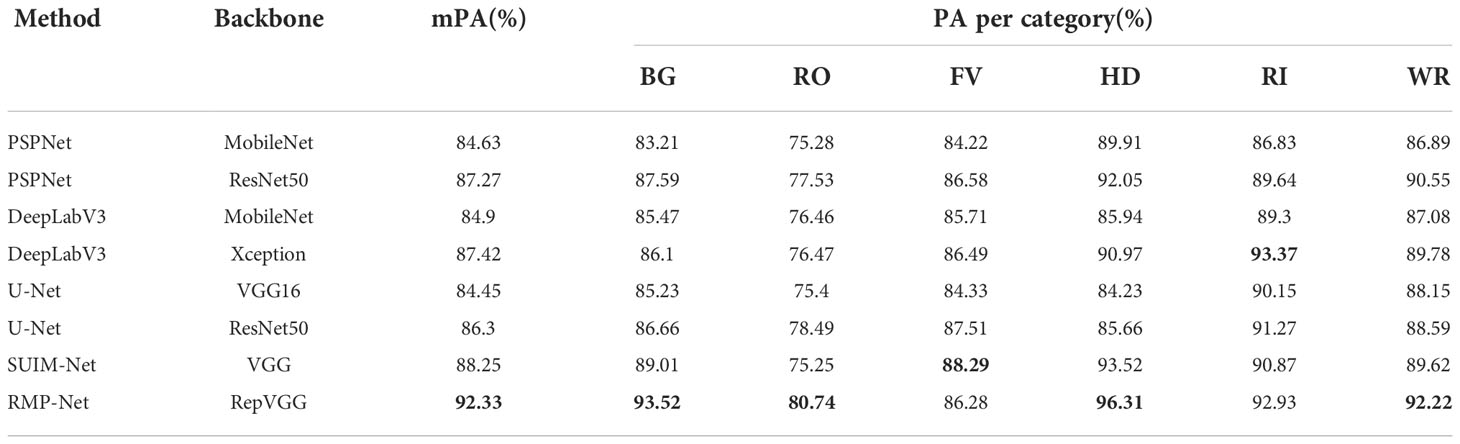
Table 6 Comparing mPA metrics between different models on the SUIM dataset, where the metrics with the highest rankings are shown in bold.
Observing the two data comparison tables, the RMP-Net proposed in this paper is the best among all models in terms of comprehensive indicators. In the segmentation test on the SUIM dataset, mIoU reached 84.52%, and mPA reached 92.33%. Compared with the baseline, mIoU and mPA are improved by about 9.25% and 9.33%, respectively. We can see that among the eight categories in the dataset, the model has the highest classification accuracy for humans and coral reefs and invertebrates, reaching 96.31% and 92.93%, respectively. Compared with the SUIM-Net model, our proposed model achieves about 3.37% and 4.62% higher mIoU and mPA, respectively. The experimental results show that the effect of RMP-Net in this seabed image segmentation task has reached the expectation and can meet the needs of ocean multitarget segmentation. ()
In Figure 6, data visualization of the performance of different segmentation models on the dataset can be seen. It can be seen that RMP-Net has achieved the best results in multiple classifications and achieved SOTA in comparison with the most advanced methods, which further reflects the effectiveness of using RMP-Net in the task of ocean scene segmentation from the data.
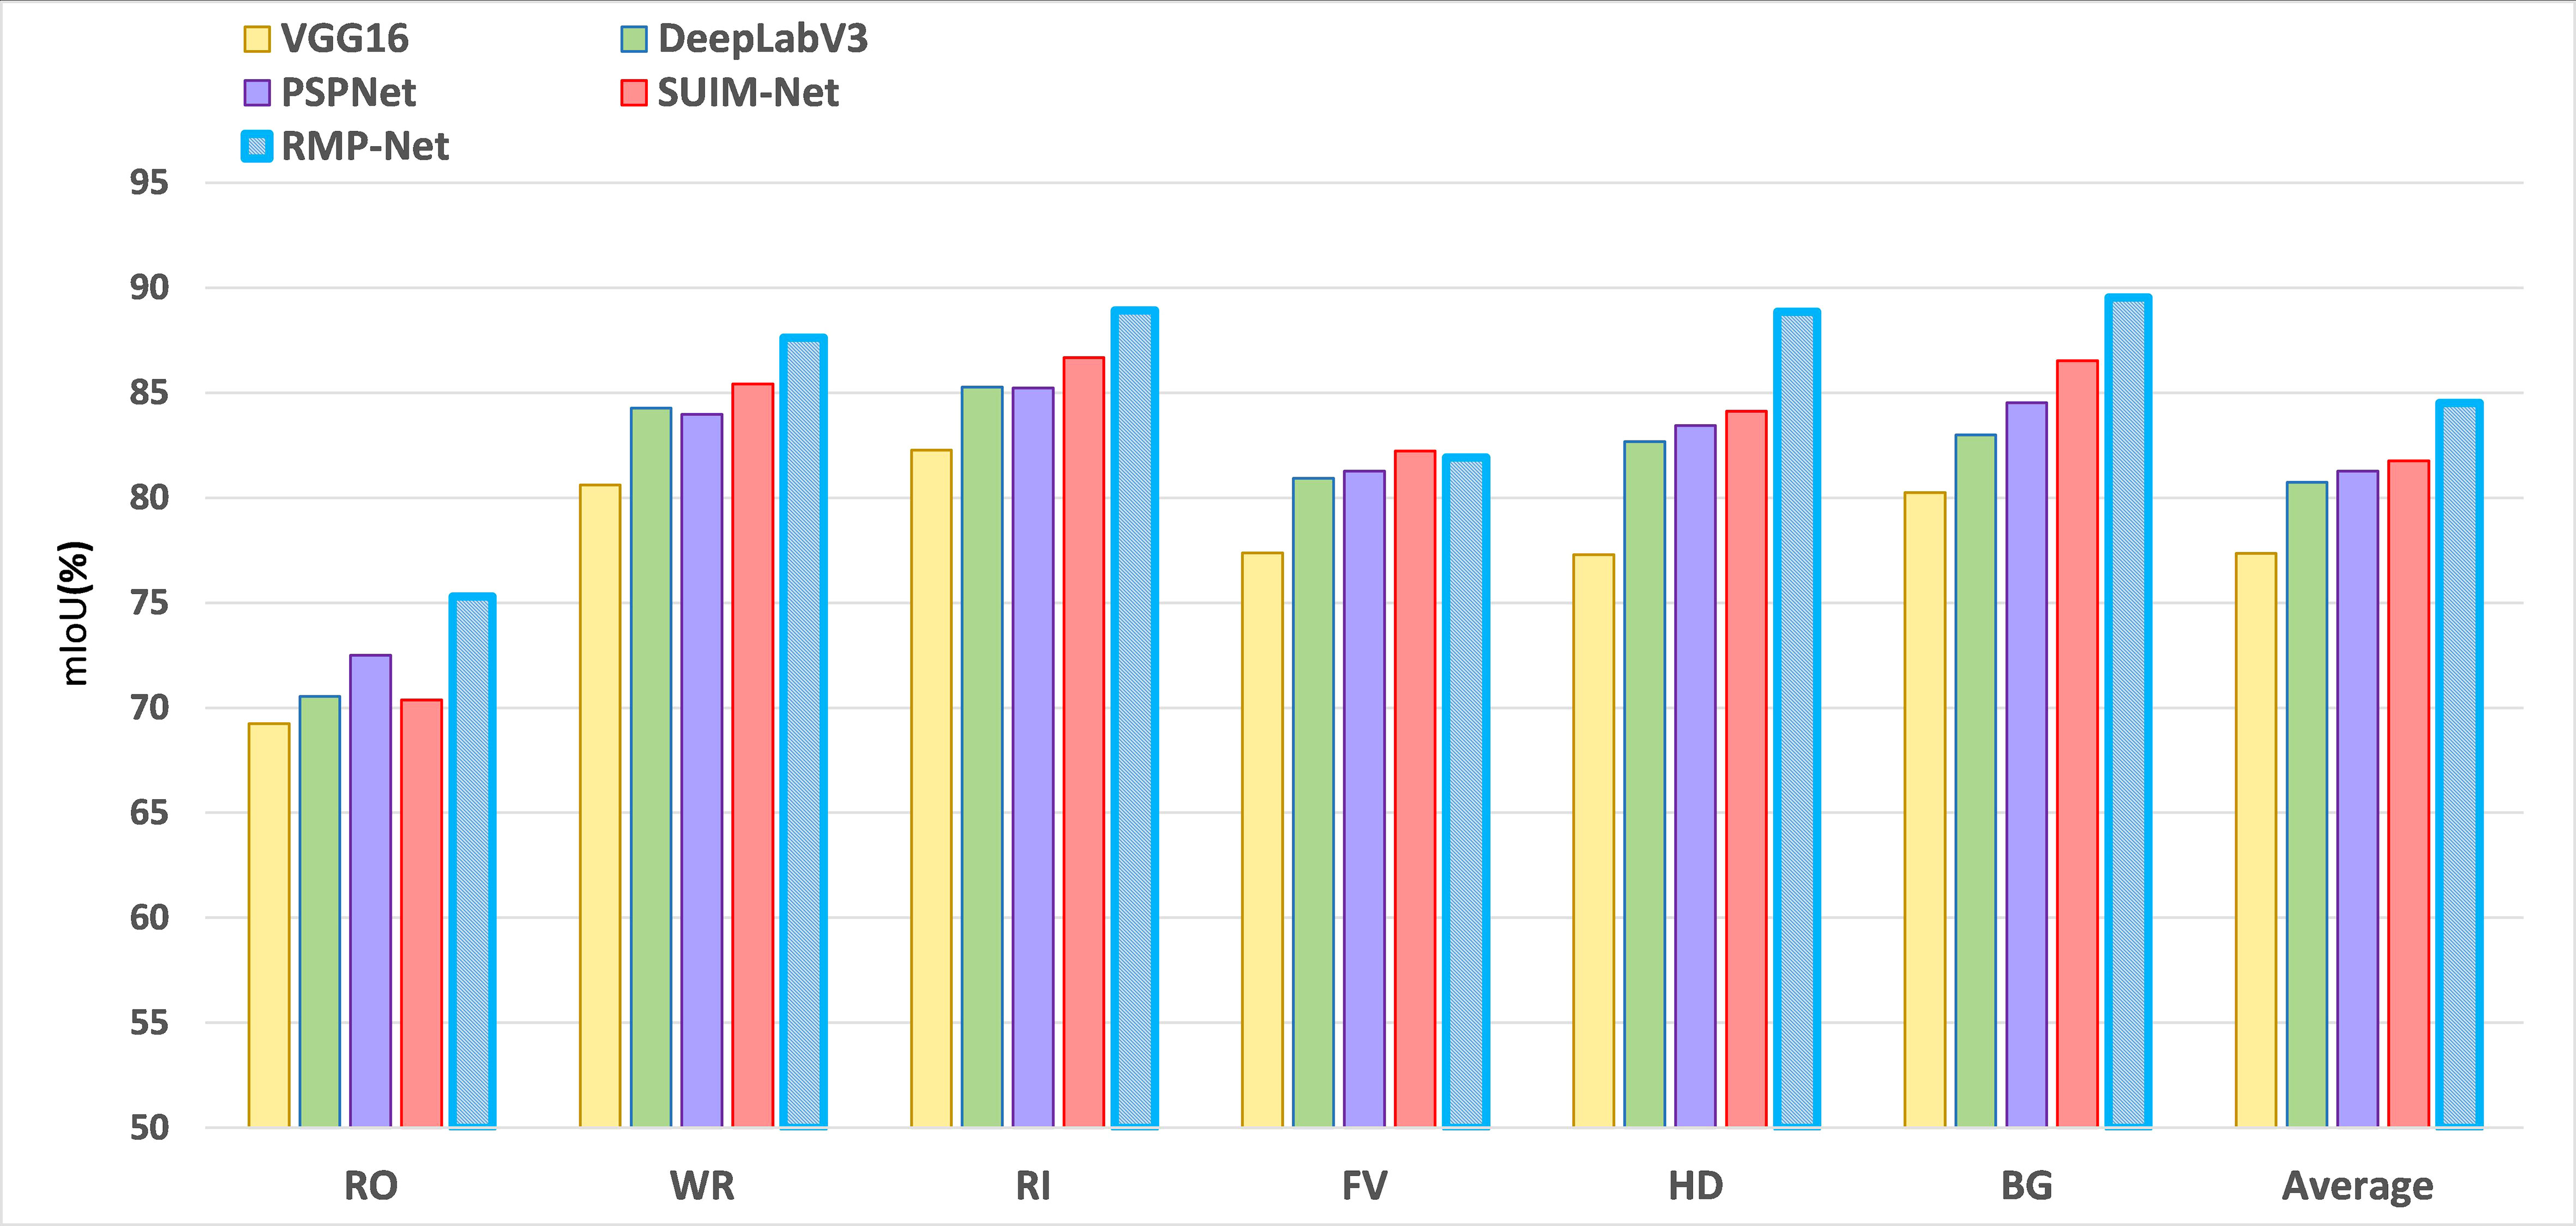
Figure 6 Testing different mainstream segmentation networks on the SUIM dataset, RepVGG, and subpixel convolution helps to improve the performance of the segmentation model, illustrating the effectiveness of RMP-Net in the task of ocean scene segmentation.
3.2. Results on DeepFish
3.2.1. Qualitative analysis
In order to further verify the robustness and effectiveness of the proposed model, we selected the binary segmentation dataset DeepFish to test the model (Saleh et al., 2020). The DeepFish dataset focuses on fish in the marine environment and can be used in the fields of target detection, classification, and segmentation. In this experiment, we use the semantic segmentation part of the dataset as the experimental data. The segmentation dataset has a total of 620 images, and the corresponding label of the picture only contains two categories: fish and background. We will divide the training and verification set given by an official for model training and model verification. Figure 7 shows the final prediction effect of the model.
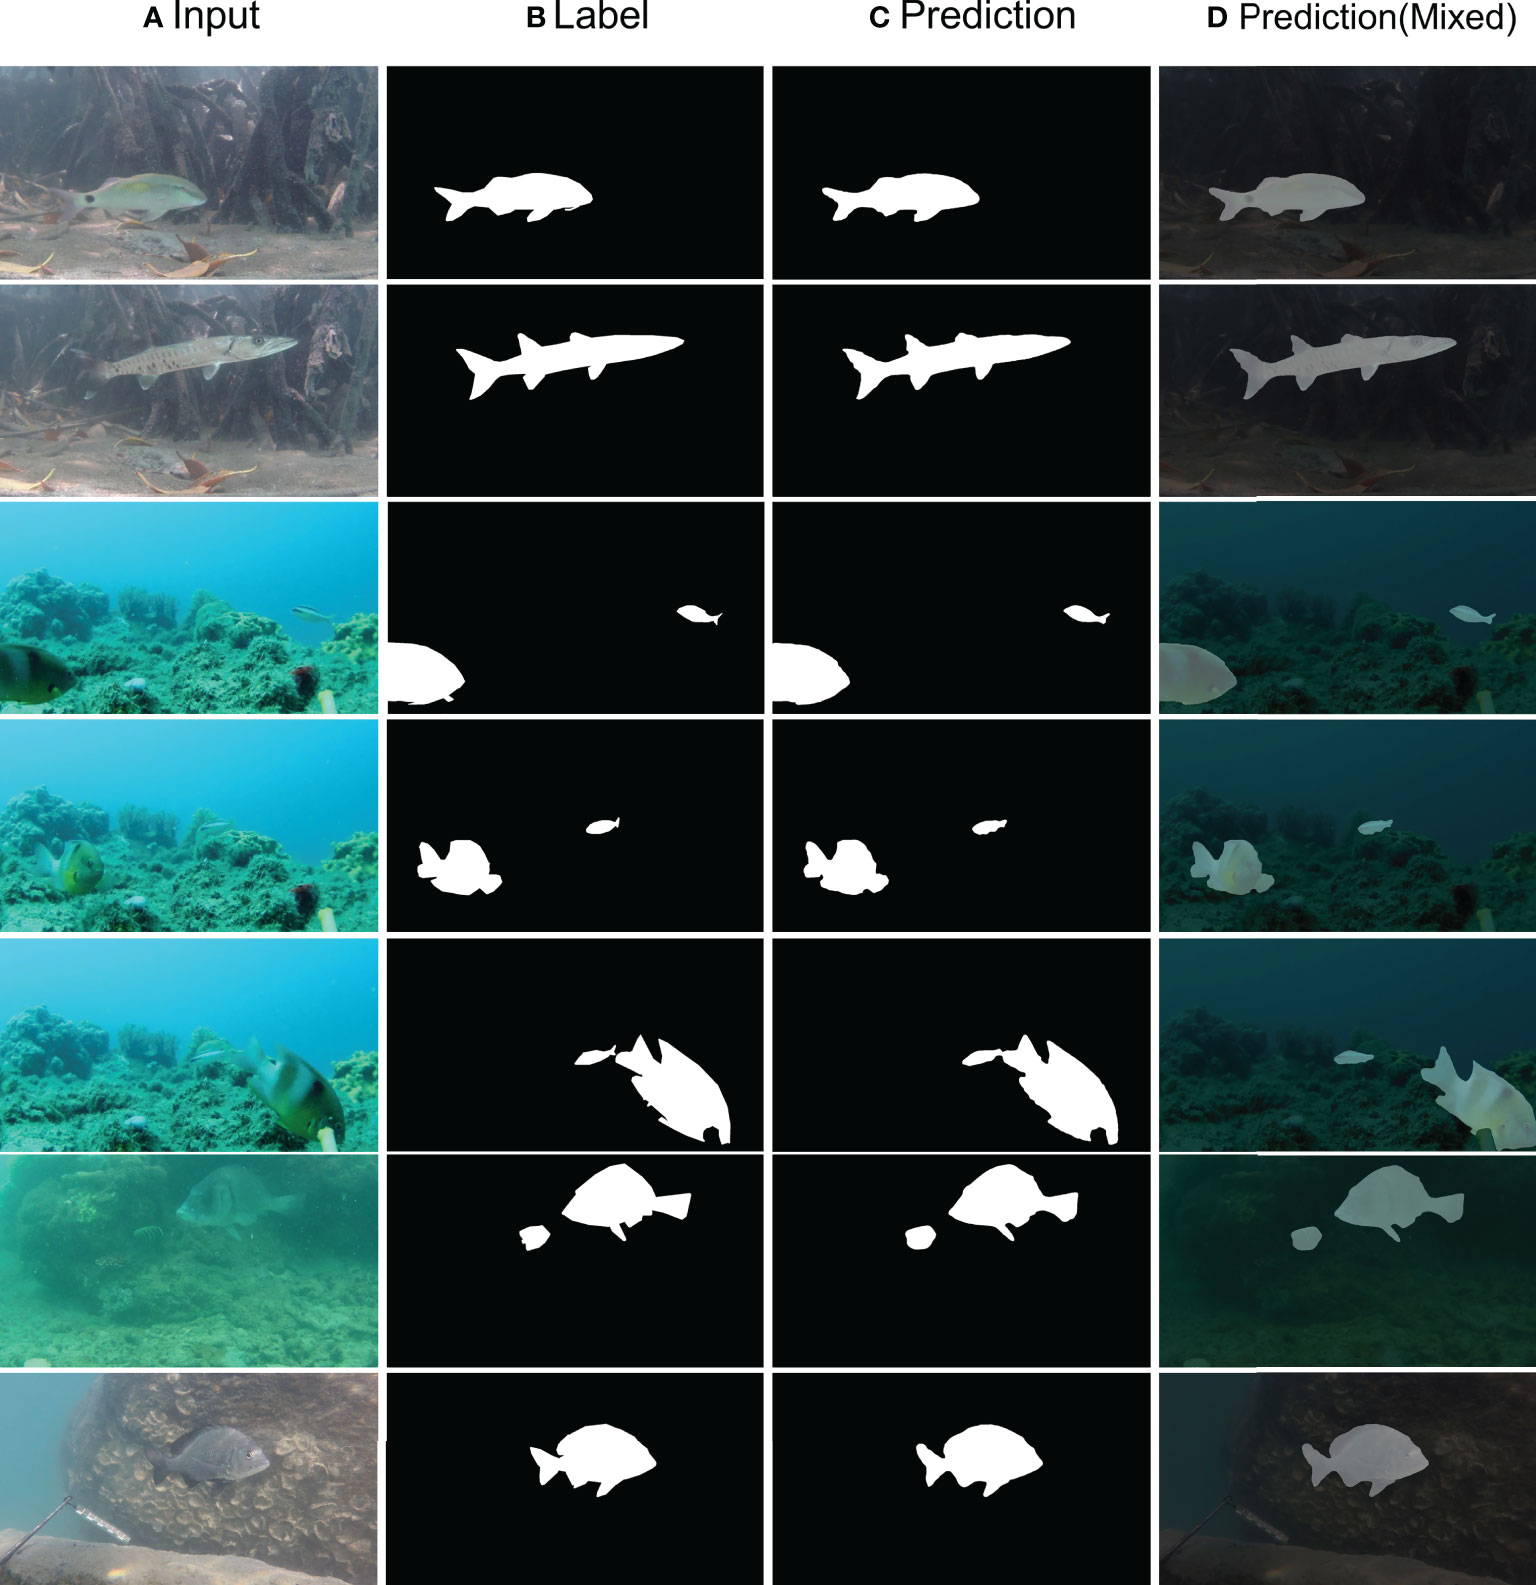
Figure 7 Results on DeepFish. (A) Input image. (B) Label. (C) Prediction. (D) Mixed image of original image and predicted image.
Renderings of the seven images verify the result of concentrated random screening. From the model-predicted results, there can be found two different ambient lights of ocean scene. We put forward the model to forecast the effect of fish, which is still very ideal; at the same time, for different sizes of fish, the model can also be fully used. We need to pick up the goal for fish edge contour feature recovery. From the above results, we can see that subpixel convolution can well-integrate the features of different scales, so that the back-end network can retain and fuse the semantic information of features of different scales extracted from the front-end network, which is very effective for the task of ocean scene segmentation.
3.2.2 Quantitative analysis
We use the mIoU and mPA evaluation indicators to test different models on the DeepFish dataset, and the final test results are shown in Table 7.
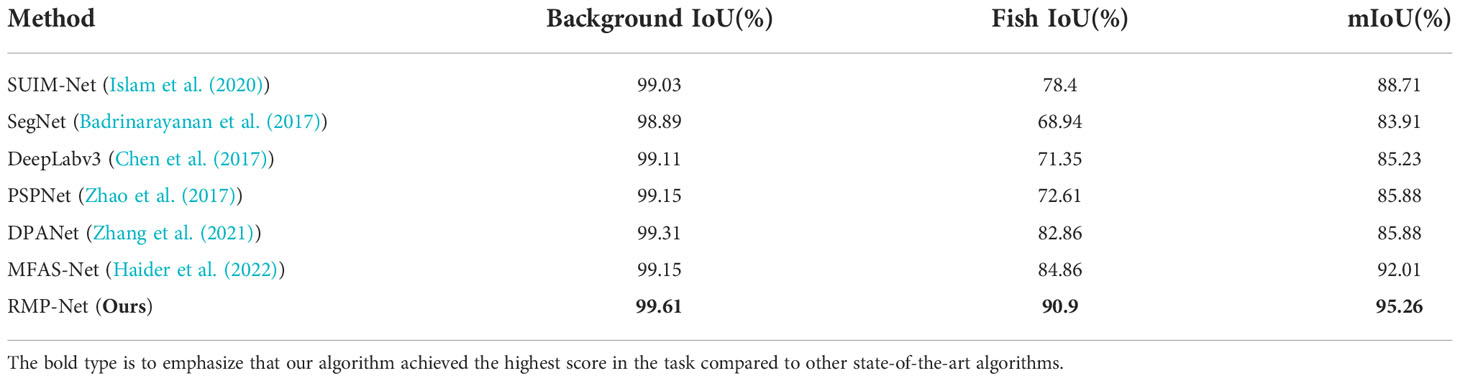
Table 7 Comparing our proposed method with state-of-the-art methods on the DeepFish dataset.
It is not difficult to analyze the experimental data: our proposed model is very competitive in both background and fish (foreground) segmentation performance, with an IoU of 99.61% verified on the background and reached 90.90%. The DeepFish dataset contains many fish of different sizes and shapes. Experiments show that our proposed model can achieve very good segmentation results for the above targets, which further confirms the multibranch backbone and subpixel in RMP-Net. The convolution module has a very good effect on feature processing of complex underwater environments and can fully cope with complex ocean scene segmentation tasks.
4 Discussion
4.1 Ablation study
Although the performance of RMP-Net is significantly improved compared with the baseline, it is not clear how each model affects the performance of the whole model. Therefore, ablation experiments are needed to verify the impact of each module on the performance of the network model separately. The ablation results are shown in Table 8.
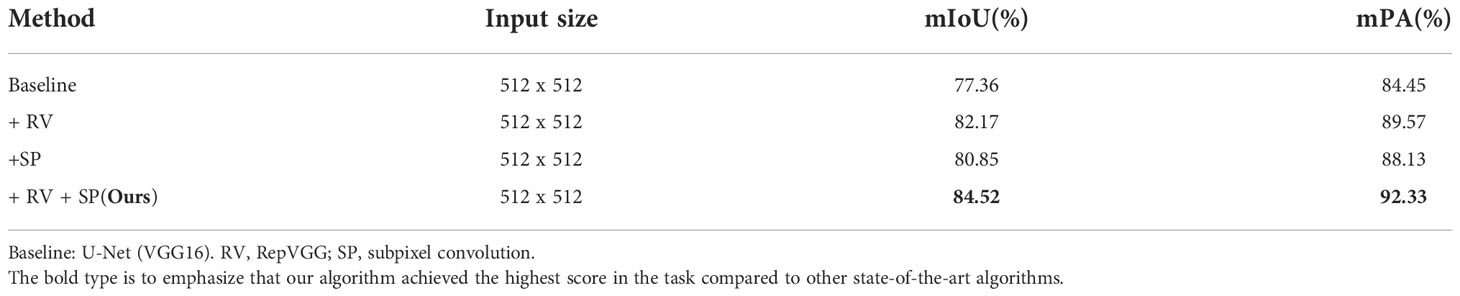
Table 8 Ablation study.
The data in Table 8 are obtained from the ablation experiment. We can know from the data that RepVGG and subpixel convolution both play a significant role in improving the performance of the network model whether added separately or together. Therefore, in RMP-Net, we apply both structures to the model, which is helpful for the overall performance improvement, and it is not an accidental combination. The above experiments prove the effectiveness of RepVGG and subpixel convolution. This combination may be used in network models of other structures.
4.2 Comparison of model inference speed
We tested and compared different models with a parameter amount, FLOPS, and the inference speed of the model on the test set. It can be seen that compared with other advanced models, RMP-Net has strong backbone feature extraction capabilities and is deployed in inference. When multibranch fusion is performed, the model inference speed can be further accelerated, but the performance in terms of model parameters and inference speed is still not good enough. The test results are detailed in Table 9.
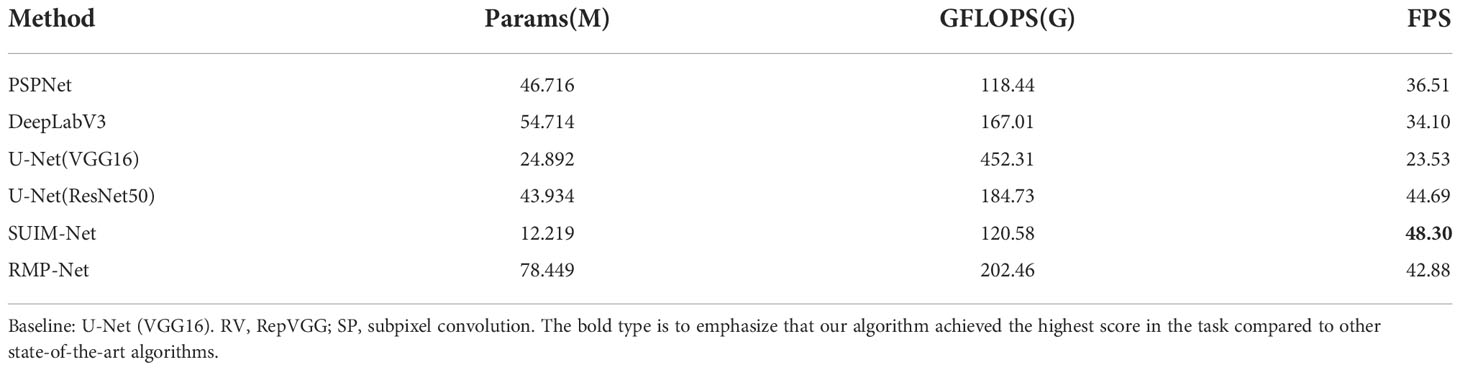
Table 9 Results of comparison of Params, FLOPS, and inference speed of different models (Single Nvidia RTX2080 GPU).
4.3 Future work
With the continuous improvement of computer hardware’s computing power and the in-depth exploration and research of machine learning by researchers, deep learning has been widely used in all aspects of human society. Among them, many achievements have been made in object detection, image processing, and natural language processing. These technologies have facilitated people’s lives in various aspects. However, there are still very few related applications in ocean observation. In addition to the high cost of equipment required for ocean observation, the main reason is that people do not pay enough attention to the ocean, and there are relatively few research studies related to ocean observation. Through testing, we found that, although the performance of the model is very strong, the operation of the algorithm still requires certain hardware conditions to achieve satisfactory results. Therefore, we aim to compress and optimize the proposed network model based on the work performed in this research, so that it can become more lightweight and can meet the hardware environment with lower requirements.
Realizing that the existing work is far from enough, if there is an opportunity in the future, we will go to the field to conduct ocean observations and will also carry out some data collection, which can also help more researchers to promote ocean observation research and contribute to the development of ocean exploration.
5 Summary
In this paper, a segmentation network RMP-Net based on structural reparameterization and subpixel convolution was proposed for effective and accurate segmentation of seafloor-related targets, which can be used to construct 3D semantic maps to facilitate ocean observation. This study was carried out to enhance the comprehensive performance of the model for segmentation by introducing a structurally reparameterized classification network as the backbone feature extraction network, while redesigning the decoder side of the network to use subpixel convolution for upsampling to recover the information in the deep feature maps, and then using multiscale fusion to segment the target features in the images accurately. The backbone network can be compressed by a multibranch fusion algorithm to further improve the model inference and prediction speed without losing performance, making the model simultaneously have high performance and high real-time performance. Several mainstream semantic segmentation networks are tested for evaluation metrics using the SUIM underwater image dataset, and the experimental results show that RMP-Net achieves 84.52% mIoU and 92.33% mPA. Compared with PSPNet, mIoU and mPA are improved by 1.57% and 1.28%, respectively, and the overall performance metrics are the highest compared with other segmentation networks, which also shows that the high performance of RMP-Net is fully capable of meeting the segmentation task requirements in ocean observation scenarios.
Data availability statement
Publicly available datasets were analyzed in this study. This data can be found here: SUIM, https://irvlab.cs.umn.edu/resources/suim-dataset; DeepFish, https://alzayats.github.io/DeepFish/.
Ethics statement
Ethical review and approval were not required for the animal study because, in this research, we used two open databases of DeepFish and SUIM, which can be freely used for academic purposes.
Author contributions
JC completes the main work of this paper. JT, SL and DZ guide JC in the research of this work. WL, JY, BS and YL help complete the part of experiment. All authors are involved in revising the manuscript, proofreading, and approving the submit.
Funding
This work was supported by Special Fund for Scientific and Technological Innovation and Cultivation of College Students in Guangdong Province: pdjh2021 a0625 and the Science and Technology Program of Social Development,Zhuhai,2022 under grant 2220004000195 and the Guangdong Province universities key field special 2022ZDZX4061.
Acknowledgments
Throughout the process of conducting the experiment and writing the paper. I received great support and help, and received many valuable comments. I would like to express my sincere gratitude to all those who have helped me throughout the process. First of all, I would like to thank my supervisor, Tang Jialin, who gave me valuable advice on academic matters. This thesis would not have been possible without his patient guidance, insightful criticism and professional instruction.
Conflict of interest
The authors declare that the research was conducted in the absence of any commercial or financial relationships that could be construed as a potential conflict of interest.
Publisher’s note
All claims expressed in this article are solely those of the authors and do not necessarily represent those of their affiliated organizations, or those of the publisher, the editors and the reviewers. Any product that may be evaluated in this article, or claim that may be made by its manufacturer, is not guaranteed or endorsed by the publisher.
Footnotes
References
Badrinarayanan V., Kendall A., Cipolla R. (2017). Segnet: A deep convolutional encoder-decoder architecture for image segmentation. IEEE Trans. Pattern Anal. Mach. Intell. 39 (12), 2481–2495 doi: 10.1109/TPAMI.2016.2644615
Bousmalis K., Trigeorgis G., Silberman N., Krishnan D., Erhan D. (2016). Domain separation networks. Neural Inf. Process. Syst. 29, 343–351. doi: 10.48550/arXiv.1608.06019
Chen L.-C., Papandreou G., Schroff F., Adam H. (2017). Rethinking atrous convolution for semantic image segmentation. arXiv: Comput. Vision Pattern Recognit. abs/1706.05587. doi: 10.48550/arXiv.1706.05587
Cubuk E. D., Zoph B., Mane D., Vasudevan V. K., Le Q. V. (2018). Autoaugment: Learning augmentation policies from data. arXiv: Comput. Vision Pattern Recognit. abs/1706.05587. doi: 10.48550/arXiv.1805.09501
Deng J., Dong W., Socher R., Li L.-J., Li K., Fei-Fei L. (2009). Imagenet: A large-scale hierarchical image database. Comput. Vision Pattern Recognit. 248–255. doi: 10.1109/CVPR.2009.5206848
Ding X., Zhang X., Ma N., Han J., Ding G., Sun J. (2021). Repvgg: Making vgg-style convnets great again. Comput. Vision Pattern Recognit. abs/2101.03697, 13733–13742. doi: 10.1109/CVPR46437.2021.01352
Gonzalez S., Miikkulainen R. (2019). Improved training speed, accuracy, and data utilization through loss function optimization. congress evol. Comput. abs/1905.11528, 1–8. doi: 10.48550/arXiv.1905.11528
Haider A., Arsalan M., Choi J., Sultan H., Park K. R. (2022). Robust segmentation of underwater fish based on multi-level feature accumulation. Front. Mar. Sci. 9, 1010565. doi: 10.3389/fmars.2022.1010565
He K., Zhang X., Ren S., Sun J. (2015a). Deep residual learning for image recognition. arXiv: Comput. Vision Pattern Recognit. abs/1512.03385, 770–778. doi: 10.1109/CVPR.2016.90
He K., Zhang X., Ren S., Sun J. (2015b). Delving deep into rectifiers: Surpassing human-level performance on imagenet classification. Int. Conf. Comput. Vision. abs/1502.01852, 1026–1034. doi: 10.1109/ICCV.2015.123
Islam J., Edge C., Xiao Y., Luo P., Mehtaz M., Morse C., et al. (2020). Semantic segmentation of underwater imagery: Dataset and benchmark. Intell. Robots Syst. abs/2004.01241, 1769–1776. doi: 10.1109/IROS45743.2020.9340821
Kingma D. P., Ba J. (2014). Adam: A method for stochastic optimization. arXiv: Learn. doi: 10.48550/arXiv.1412.6980
Kraft K., Velhonoja O., Eerola T., Suikkanen S., Tamminen T., Haraguchi L., et al. (2022). Towards operational phytoplankton recognition with automated high-throughput imaging, near-real-time data processing, and convolutional neural networks. Ocean Science Discussions 2020, 1–20. doi: 10.3389/fmars.2022.867695
Krizhevsky A., Sutskever I., Hinton G. E. (2012). Imagenet classification with deep convolutional neural networks. Commun. ACM. 60, 84–90. doi: 10.1145/3065386
Li L., Rigall E., Dong J., Chen G. (2020). Mas3k: An open dataset for marine animal segmentation. Int. Symp. Benchmarking Meas. Optim. 12614, 194–212. doi: 10.1007/978-3-030-71058-3_12
Ma J., Chen J., Ng M., Huang R., Li Y., Li C., et al. (2021). Loss odyssey in medical image segmentation. Med. Image Anal. 71, 102035. doi: 10.1016/j.media.2021.102035
Pan S. J., Yang Q. (2010). A survey on transfer learning. IEEE Trans. Knowl. Data Eng. 22, 1345–1359. doi: 10.1109/TKDE.2009.191
Rayner R., Jolly C., Gouldman C. (2019). Ocean observing and the blue economy. Front. Mar. Sci. 6, 330. doi: 10.3389/fmars.2019.00330
Ronneberger O., Fischer P., Brox T. (2015). U-Net: Convolutional networks for biomedical image segmentation. Med. image comput. Comput. assist. intervention. abs/1505.04597, 234–241. doi: 10.48550/arXiv.1505.04597
Rubinstein R. Y., Kroese D. P. (2004). The cross-entropy method: a unified approach to combinatorial optimization, Monte-Carlo simulation, and machine learning Vol. 133 (New York: Springer).
Saleh A., Laradji I. H., Konovalov D. A., Bradley M., Vazquez D., Sheaves M. (2020). A realistic fish-habitat dataset to evaluate algorithms for underwater visual analysis. Sci. Rep. 10, 1–10. doi: 10.1038/s41598-020-71639-x
Shi W., Caballero J., Huszar F., Totz J., Aitken A. P., Bishop R., et al. (2016). Real-time single image and video super-resolution using an efficient sub-pixel convolutional neural network. Comput. Vision Pattern Recognit. abs/1609.05158, 1874–1883. doi: 10.1109/CVPR.2016.207
Simonyan K., Zisserman A. (2014). Very deep convolutional networks for large-scale image recognition. Comput. Vision Pattern Recognit.
Sun Y., Chen J., Liu Q., Liu G. (2020). Learning image compressed sensing with sub-pixel convolutional generative adversarial network. Pattern Recognit. 98, 107051. doi: 10.1016/j.patcog.2019.107051
Szegedy C., Liu W., Jia Y., Sermanet P., Reed S., Anguelov D., et al. (2014). Going deeper with convolutions. arXiv: Comput. Vision Pattern Recognit. abs/1409.4842, 1–9. doi: 10.48550/arXiv.1409.4842
Xu G., Xie W., Dong C., Gao X. (2021). Application of three deep learning schemes into oceanic eddy detection. Front. Mar. Sci. 8, 715. doi: 10.3389/fmars.2021.672334
Zhang W., Wu C., Bao Z. (2021). Dpanet: Dual pooling-aggregated attention network for fish segmentation. Iet Comput. Vision. 16, 67–82. doi: 10.1049/cvi2.12065
Zhang X., Zhou X., Lin M., Sun J. (2017). Shufflenet: An extremely efficient convolutional neural network for mobile devices. Comput. Vision Pattern Recognit. abs/1707.01083, 6848–6856. doi: 10.48550/arXiv.1707.01083
Keywords: submarine exploration, underwater scene, RMP-Net, structural re-parameterization, multiscale fusion
Citation: Chen J, Tang J, Lin S, Liang W, Su B, Yan J, Zhou D, Wang L, Lai Y and Yang B (2022) RMP-Net: A structural reparameterization and subpixel super-resolution-based marine scene segmentation network. Front. Mar. Sci. 9:1032287. doi: 10.3389/fmars.2022.1032287
Received: 30 August 2022; Accepted: 28 October 2022;
Published: 29 November 2022.
Edited by:
Hong Song, Zhejiang University, ChinaReviewed by:
Amjad Ali Amjad, Peking University, ChinaPeiyi Zhu, Changshu Institute of Technology, China
Copyright © 2022 Chen, Tang, Lin, Liang, Su, Yan, Zhou, Wang, Lai and Yang. This is an open-access article distributed under the terms of the Creative Commons Attribution License (CC BY). The use, distribution or reproduction in other forums is permitted, provided the original author(s) and the copyright owner(s) are credited and that the original publication in this journal is cited, in accordance with accepted academic practice. No use, distribution or reproduction is permitted which does not comply with these terms.
*Correspondence: Jialin Tang, MDEwNjhAYml0emguZWR1LmNu