 Weifang Hu1,2,3
 Congsheng Zeng2,3
 Chuan Tong2,3Guoliang Li1Xue Lan4
 Jiacong Zhou2,3Meiying Zhang2,3
 Yuehmin Chen2,3*Linhai Zhang2,3,5*
- 1Institute of Agricultural Resources and Environment, Guangdong Academy of Agricultural Sciences, Guangzhou, China
- 2College of Geographical Science, Fujian Normal University, Fuzhou, China
- 3State Key Laboratory of Subtropical Mountain Ecology (Funded by Ministry of Science and Technology and Fujian Province), Fujian Normal University, Fuzhou, China
- 4College of Marine Sciences, South China Agricultural University, Guangzhou, China
- 5Fujian Provincial Key Laboratory for Plant Eco-physiology, Fujian Normal University, Fuzhou, China
Microbial evolution-mediated CO2 from litter has aroused widespread concern, and knowing the factors controlling litter-derived CO2 is important when considering the effects of accumulative CO2 release from litter on the global greenhouse. We conducted a short-term N addition (6, 16, and 24 g N m‒2 yr‒1) experiment in Cyperus malaccensis var. brevifolius (shichito matgrass) litter decomosition. Phospholipid fatty acid (PLFA) method and enzyme method were used to analysis litter microbial community composition and enzymatic activity. During a 220-day decomposition period, there was little effect of the N amendments on litter CO2 evolution rates (9.97‒307.54 μg C g−1 h−1) with a notable exception regarding the increase of the high-N treatment at day 20. The accumulative CO2 release significantly increased after N addition in the medium and late phases. The facilitation effect on accumulative CO2 release by N amendments was more and more obvious over the decomposition time, especially for the low- and intermediate-N treatments. At the end of our experiment, compared with the control treatment, accumulative CO2 release increased 69.75%, 76.62%, and 39.93% for low-, intermediate-, and high-N treatments, respectively. These observations highlight that N deposition could cause high losses of litter C as CO2.
Introduction
Humans continue to transform the global nitrogen (N) cycle at a record pace, and serious N pollution could generate unacceptable environmental change (Galloway et al., 2008; Rockström et al., 2009). Significant fractions of this anthropogenic N enter coastal estuaries, and contributed to numerous eco-environmental problems, such as widespread eutrophication and accelerating greenhouse gasses emission (Simas and Ferreira, 2007; Lin et al., 2017; Lin and Lin, 2022). Previous studies have revealed that N deposition significantly promoted plant height and biomass, changed litter matrix, inhibited litter decomposition, and affected soil carbon (C) storage in the estuarine wetlands (Guan et al., 2019; Tao et al., 2019). To sequester more C in soil, we need to consider how to divert more litter into humus (Prescott, 2010), and to decrease fraction of litter C released as CO2 to the atmosphere.
Despite growing research interest, uncertainties remain on the response of litter decomposition to the N amendments due to the different ecosystems, species, decomposition stages, and N thresholds (Knorr et al., 2005; Xu et al., 2016; Zhang et al., 2018; Ochoa-Hueso et al., 2019). Previous studies have demonstrated that N amendments may promote (Gerdol et al., 2007), inhibit (Tao et al., 2019) or no significant effect (Yu et al., 2019) on the litter decomposition rate in wetland. For decades, litter-derived CO2 has aroused widespread concerns (Kuehn et al., 2000; Chambers et al., 2001; Kuehn et al., 2004; Zhang et al., 2014b; Hall et al., 2017; Mao et al., 2021). The fraction of litter C released as CO2 to the atmosphere is nearly 30% of the total C (TC) (Rubino et al., 2010), that represents a substantial pathway of C input to the atmosphere (Day et al., 2018). Li et al. (2015) suggested that the combination of litter and N addition increased CO2 release although N fertilization alone significantly inhibited CO2 release rates. Simulated CO2 emissions from soil fertilized with litter averaged across years were approximately 0.8 times higher than soil fertilized with NH4NO3 (Yang et al., 2019). Magill and Aber (2000) suggested that N inputs appear to affect the quantity of litter C consumed or released by increasing respiration (as measured by weight loss), rather than increasing litter-derived DOC release into the soil solution. In freshwater marshes, the N addition could significantly increase CO2 emission (Hu et al., 2019a), however, the response of litter-derived CO2 to N amendments remain poorly understood (Li et al., 2015). To better understand the C cycle in estuarine marshes, the fate of litter-derived CO2 and its driving mechanism need to be identified.
Here, we asked a simple question: Does N deposition affect litter-derived CO2 evolution rates and accumulative CO2 release during litter decomposition? According to the results of previous research concerning an increase in litter-derived respiration (Magill and Aber, 2000) and an increase in litter input (Liu and Greaver, 2010; You et al., 2017), and a decrease in litter decomposition (Tu et al., 2011; Xu et al., 2016) after N fertilization, we hypothesized that, (1) N addition could increase litter-derived CO2 evolution rates; and (2) consequently increase accumulative CO2 release due to large amounts of remaining litter residue.
Materials and methods
Site description
Our study was conducted in a freshwater marsh, namely Tajiaozhou (25°56′48″ N; 119°22′1″ E), in the Min River Estuary (Figure 1). Located in the transition zone between the middle and southern subtropical zones, this area is exposed to an East Asian monsoon climate with annual mean temperature and precipitation of 19.7°C and 1200–1740 mm, respectively (Luo et al., 2019). Background N deposition of southeast China was estimated as 41.7 kg N ha‒1 a‒1 (Xu et al., 2015). This marsh experiences a semi-diurnal tide, and the inundation frequency at the measurement sites generally varied between 0 and 31.80%. The sediment is neutral or faintly acidic (~pH 6.11). Cyperus malaccensis var. brevifolius (shichito matgrass), a type of grass-like perennial, is a typical native species in this marsh.

Figure 1 Study sites for the leaf-bag decomposition experiments.
Experimental design and treatments
We conducted a short-term N addition experiment during 220 days. To evaluate the effects of future elevated N-saturated conditions on litter-derived CO2, the N levels applied in this study were in line with background N loading. N eutrophication symptoms in rivers discharging to oceans are mainly driven by nitrate in subtropical and temperate estuarine areas (Meybeck and Ragu, 2012), and thus additional reactive N was applied as NaNO3 in this experiment. Three N treatments were designed with doses of 6 g N m‒2 yr‒1 (low N), 16 g N m‒2 yr‒1 (intermediate N), and 24 g N m‒2 yr‒1 (high N), and a control treatment was set up with no N added.
Two experimental blocks (I and II) were established at the sites with uniform vegetation, soil, and hydrological characteristics, which remained completely exposed during low or neap tide. In each block, there were four 0.6 m × 0.6 m plots (decomposition boxes, polyvinyl chloride) with 1-m buffers that were assigned to receive N treatments, giving a total of 12 treatment plots in each block. Additional N was added to in situ tidewaters (1 L) and supplied at neap tide twice a month, whereas control plots received additional and equivalent tidewater only. In block II, 12 porewater sample collectors were placed in each plot. Litter from block I was analyzed to determine the 2elemental composition of litter remains and litter properties. Litter from block II was used to determine CO2 evolution rates and phospholipid fatty acid (PLFA) content of litter.
Standing dead litter of shichito matgrass stems were collected to serve as test material in March 2017. To unify the microbial levels of initial decomposition material, the collected litter was first washed with filtered stream water and then with deionized water in the laboratory. Litter material was cut into 5-cm long pieces, and then air-dried at approximately 18°C (mean daily temperature) for several weeks. A subsample of this air-dried material was weighed, oven-dried at 60°C, and reweighed to calculate the moisture correction factor for calculating the initial mass of the air-dried litter. Litter decay processes were investigated using the experimental leaf-bag technique (pre-dried litter enclosed in litterbags). For this, an aliquot of approximately 15 g (dry weight) was transferred to each litterbag (20 cm × 15 cm, prepared using 0.2-mm fiberglass mesh). Total 192 litterbags were placed in the experimental field (i.e., 2 blocks × 8 sampling time points × 4 treatments × 3 replicates). These litter-bags were tied to polypropylene canes that were buried in the ground to prevent their displacement by the tide (Zhang et al., 2014a). Based on the findings of Hu et al. (2019b) regarding shichito matgrass litter decay, and the litter decay phases described by Valiela et al. (1985), we set three retrieval phases. Litterbags were retrieved at 10-day intervals (early phase: days 10, 20, and 30), 30-day intervals (medium phase: days 60, 90, and 120), and 50-day intervals (late phase: days 170 and 220). In total, 24 litterbags were collected at each sampling interval. Litterbags were carefully retrieved and placed in sealed plastic bags in a portable cooler, and then immediately transported to the laboratory.
Litter properties
Litter remaining in the bags was washed gently and weighed after oven-drying to a consistent mass. The dried litter was then ground and passed through a 100-mesh (0.149-mm) sieve, and litter TC, total nitrogen (TN), and total sulfur (TS) concentrations were determined using a Vario EL Elemental Analyzer (Elementar Vario EL, Frankfurt, Germany). Litter-derived DOC was extracted from 0.5 g dry litter as described by Uselman et al. (2012), and analyzed using a total organic carbon analyzer (Shimadzu TOC-VCPH, Kyoto, Japan)
Environmental parameters
The in-situ sediment pH was measured using an IQ150 instrument (IQ Scientific Instruments, Carlsbad, CA, USA), and electrical conductivity (EC) was measured using a 2265FS EC meter (Spectrum Technologies Inc., Aurora, CO, USA). TC and TN concentrations of the top 2 cm of sediment were determined using a Vario MAX CN element analyzer (Elementar). Porewater from the sample collectors was transferred into 50-mL plastic cups (polypropylene, acid washed) and filtered (0.45-μm membrane filters), and then analyzed for TN and dissolved inorganic N using a continuous flow-injection analyzer (SKALAR San++, Breda, the Netherlands) (Huang et al., 2021). The crab hole density, plant height, and plant density were measured within the plots (0.6 m × 0.6 m).
Litter CO2 evolution rate assay
The assay we used for determining litter CO2 evolution rates has been described previously (Zhang et al., 2014b). In brief, sterile tweezers were used to carefully remove visible debris and soil from fresh litter. Then the fresh litter samples (4 g fresh weight) were placed into sterile glass incubation jars (250 mL) containing sterile filter paper. An additional three jars containing a filter paper without plant material were used as controls. All jars were wetted until saturation with sterile deionized water, placed in an incubator, pre-incubated for 2 h, and then sealed and incubated at 20°C (annual mean temperature). Gas samples were collected at 0, 4, and 8 h after the chamber was closed using a 20-mL syringe equipped with a three-way stopcock and were stored in gas sampling bags (Dalian Delin Gas Packing Co., Ltd., Dalian, China). The CO2 concentrations were determined within 12 h of sampling using a gas chromatograph (GC-2010, Shimadzu).
Litter phospholipid fatty acid and enzyme assay
Litter PLFAs were extracted from 1 g of fresh litter according to Hassett and Zak (2005) and Rejmánková and Houdková (2006). Microbial biomass was calculated by summing total PLFAs (C14–C20), and PLFAs specific to fungi (18:2ω6,9c), gram-positive bacteria (i14:0, a16:0, i15:0, a15:0, i16:0, i17:0, and a17:0), and gram-negative bacteria (16:1ω7c, cy17:0, 18:1ω7c and cy19:0) were summarized separately (Feng and Simpson, 2009).
Fresh litter samples were assayed following published protocols for β-glucosidase and cellobiohydrolase using methyumbelliferyl-β-glucoside and methyumbelliferyl-cellobioside as substrates, respectively (Saiya-Cork et al., 2002; Sinsabaugh et al., 2005). Fluorescence was measured using a Multiscan Spectrum (Synergy H4, USA) calibrated for excitation at 365 nm, and with emissions set at 460 nm. All enzymatic activities were calculated as nmol h‒1 g‒1 OM.
Statistical calculation
We focused on CO2 evolution from the residual mass of litter; thus, the litter residual mass (R, %) was calculated as follows:
where W0 (g) is the original dry mass, and Wt(g) is the dry mass at a time “t”, and t (d) is decomposition time in days.
CO2 evolution rates were calculated according to previous research as follows (Zhang et al., 2014b):
where yT is the CO2 evolution rate (μg g−1 dry weight h−1); dc/dt is the slope of the linear regression for gas concentration gradient through time (μL L–1 C h–1); M is the atomic mass of C (12); V is the volume of the jar (L); P is the atmospheric pressure (MPa); m is the litter mass in jars (g); T is the absolute temperature during sampling (K); and V0, P0, and T0 are the gas mole volume (L), atmospheric pressure (MPa), and absolute temperature (K) under standard conditions, respectively.
Accumulative CO2 release (per initial dry weight per m2) was calculated by integrating the area under the curve for all dates, based on the assumption that rates of CO2 loss scaled linearly between time points (Jacobs et al., 2018) as follows:
where ARi is the accumulative CO2 release per initial dry weight per m2 at time i (g m‒2); xt and yT are the CO2 evolution rates per hour (μg g−1 h−1) and per day (mg), respectively; Mt is the residue mass of litter at time “t” (g); f(y) is the accumulative CO2 release during decomposition; Si is accumulative CO2 release at the interval between sampling times (mg g‒1); M0 is the initial litter mass per m2 (g m‒2), and the average yield of litter at control, low-N, intermediate-N, high-N treatments were 558.38 g m‒2, 1000.18 g m‒2, 723.67 g m‒2, and 633.52 g m‒2, respectively (unpublished data); n is the number of sampling time.
Data analysis
All datasets were tested for normality by the Shapiro-Wilk test, and homogeneity of variance by the Brown-Forsythe test. If these assumptions were not met, then the raw data were log transformed before further statistical analysis. One-way analysis of variance (ANOVA) and repeated measure analysis of covariance (ANCOVA) were used to assess differences among samples (SPSS 19.0, IBM, Armonk, NY, USA) with a significance level of p < 0.05.
Redundancy analysis (RDA) was used to partition the variation in CO2 evolution rates and accumulative CO2 release explained by environmental parameters, microbial biomass, and litter quality (Wang et al., 2015), and to interpret the extent and direction of compositional changes; these analyses were performed using Canoco 5.0.
Structural equation modeling (SEM) was performed to analyze the causal mechanisms underlying the response of litter accumulative CO2 release to N addition using SPSS Amos 21.0 (IBM). The best-fit SEM was derived by maximum likelihood and the model fit was determined using chi-square tests (χ2), p-values, goodness-of-fit index (GFI), root mean square errors of approximation (RMSEA), and Akaike information criteria (Zhu et al., 2018). The litter CO2 evolution rates and accumulative release were generated using Origin 9.3 (OriginLab Corporation, Northampton, MA, USA), and a conceptual framework was created using Microsoft Office Visio 2016 (Microsoft Corporation, Redmond, Washington, DC, USA).
Results
Litter quality, environmental, and microbial parameters
All N treatment in the medium phase and intermediate-N addition increased litter residual mass (p < 0.05), although N treatment had no impact on the litter residual mass in the early phase (p > 0.05, Table 1). Litter TC, TN, TS, litter-derived DOC contents, and the ratios of C/N were similar irrespective of the treatment with the exception of significantly low C/N ratio and TC and TS concentrations under low- and intermediate-N addition in the medium phase (p < 0.05, Table 1). The EC and pH of the sediment were similar irrespective of the treatment except for an increase in pH values after N addition in the early phase (p < 0.05, Table 2). Sediment TC and TN in the medium and TC in the late phase significantly decreased under the three N treatments (p < 0.05, Table 2). Most of the TN and DIN of the porewater were unchanged with the exception of the intermediate-N treatment in the early phase and the high-N treatment in the late phase (Table 2). Crab hole density tended to decrease after N addition in the early phase but increased in the medium phase and was unchanged in the late phase (Table 2). In addition, except a significantly low fungal biomass in high-N treatments and a relatively low cellobiohydrolase activities in low–N treatments, the biomass of gram-positive and gram-negative bacteria, fungi, total PLFA, β-glucosidase, and cellobiohydrolase did not change significantly after N addition (Table 3).
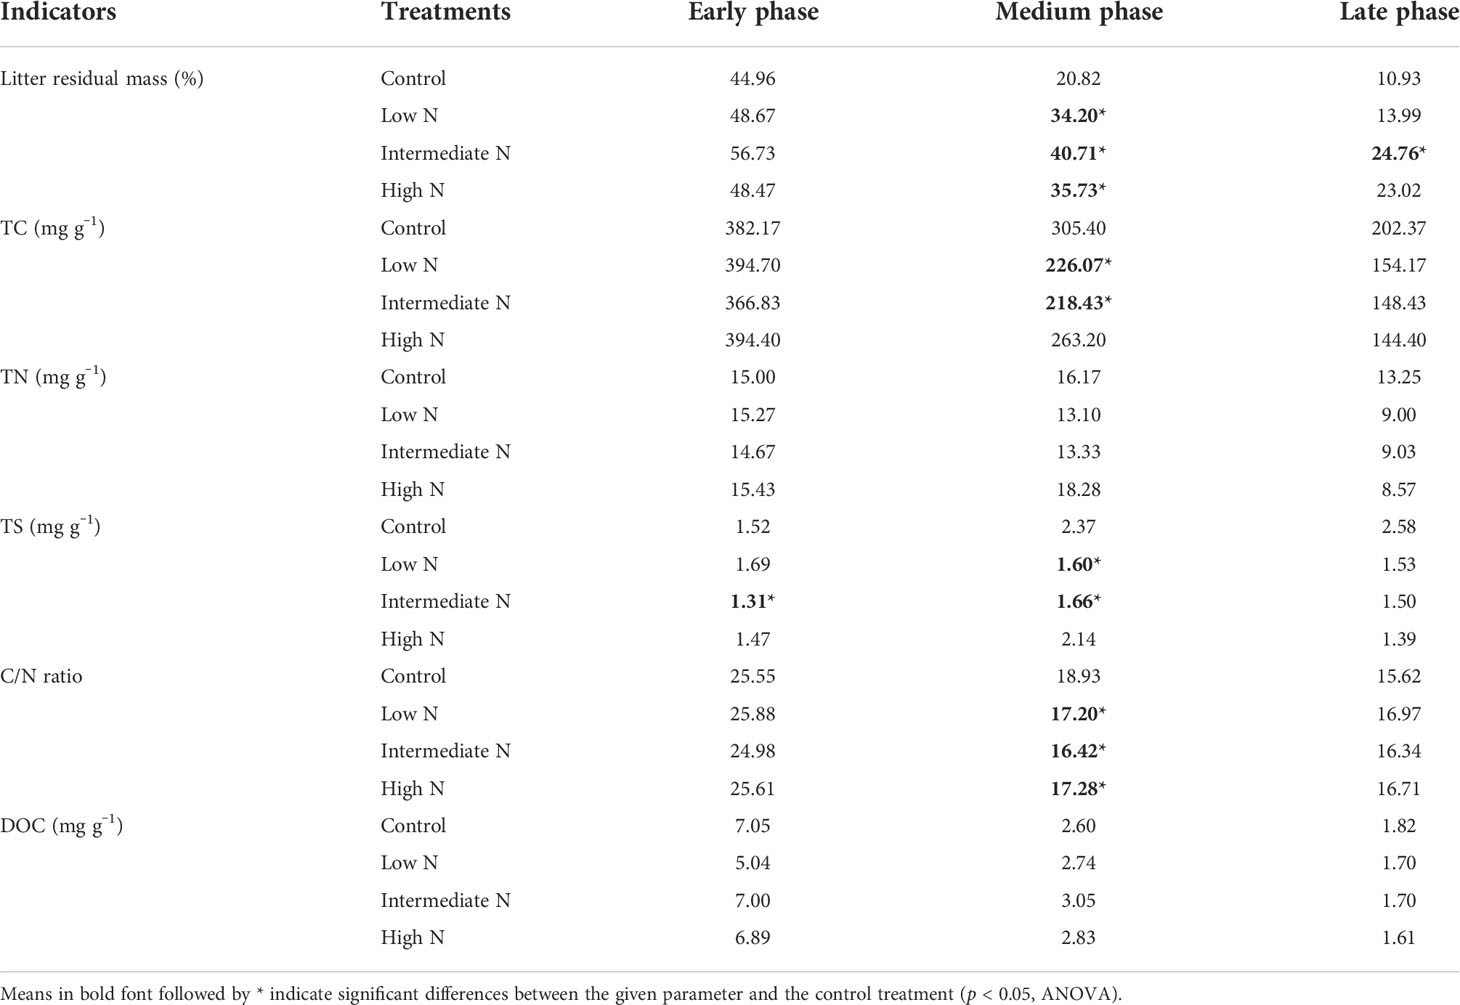
Table 1 Litter residual mass; total carbon (TC), total nitrogen (TN), and total sulfur (TS) concentrations; dissolved organic carbon (DOC); and the ratios of TC to TN (C/N) during the decomposition phase.
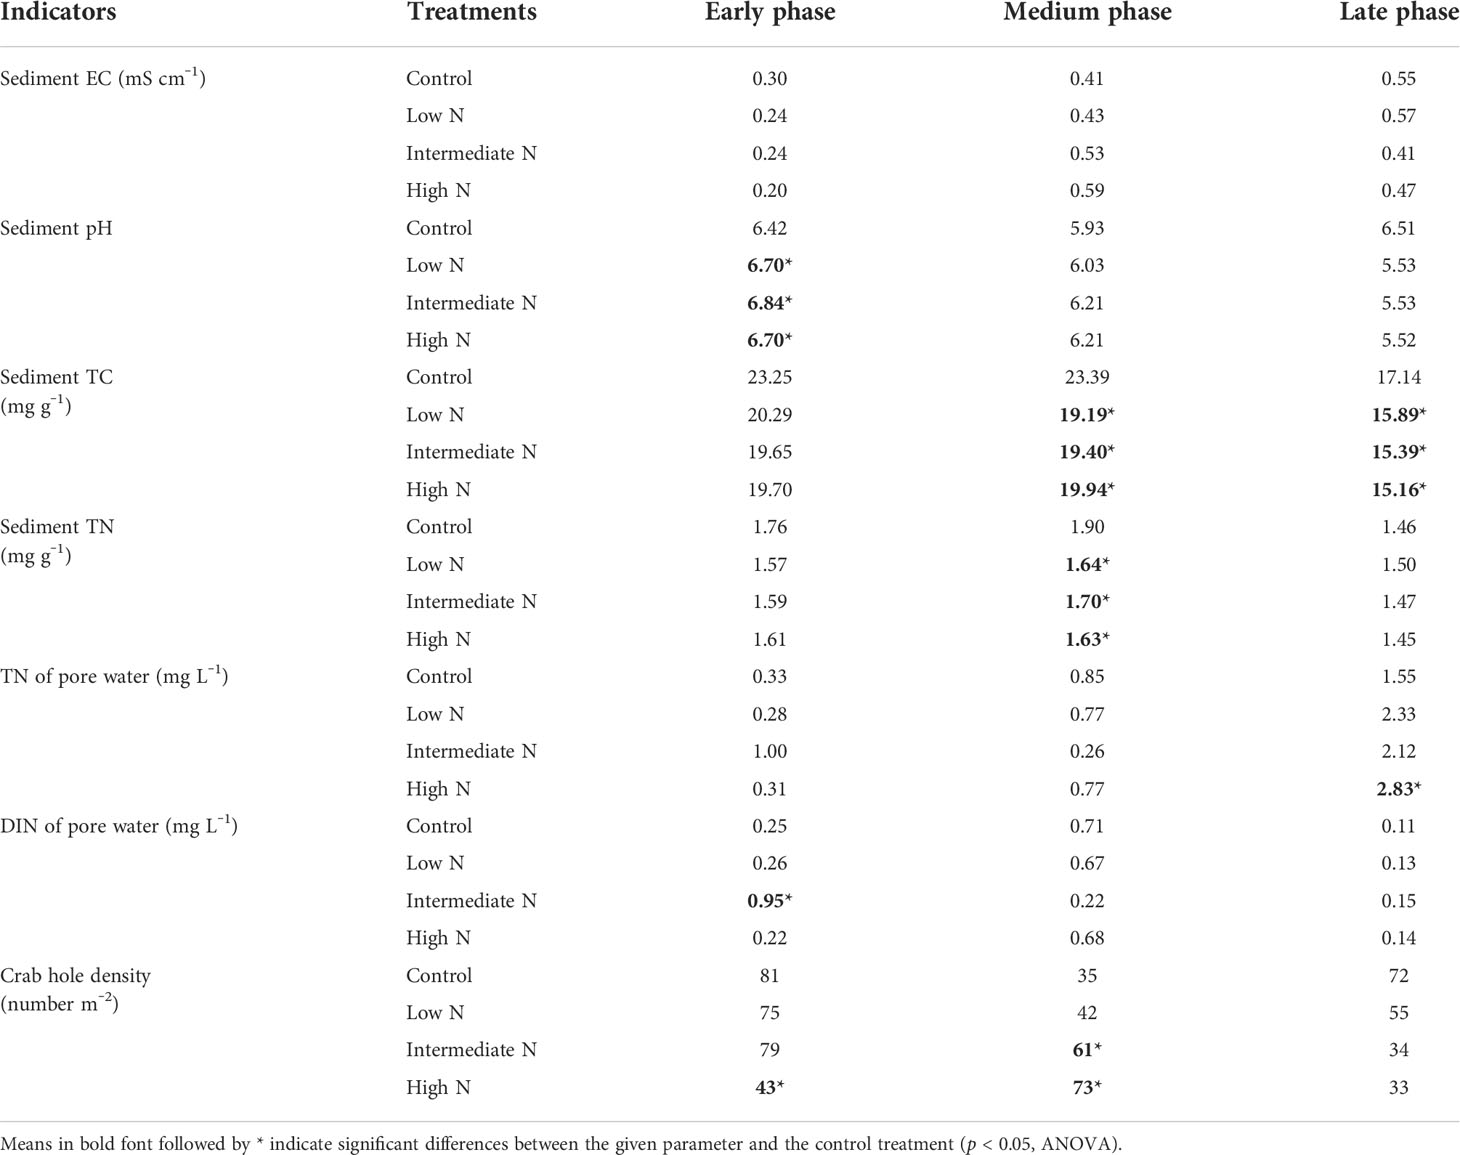
Table 2 Environmental parameters (physicochemical properties of sediment and pore water, vegetation, and crab hole density) during the decomposition phase.
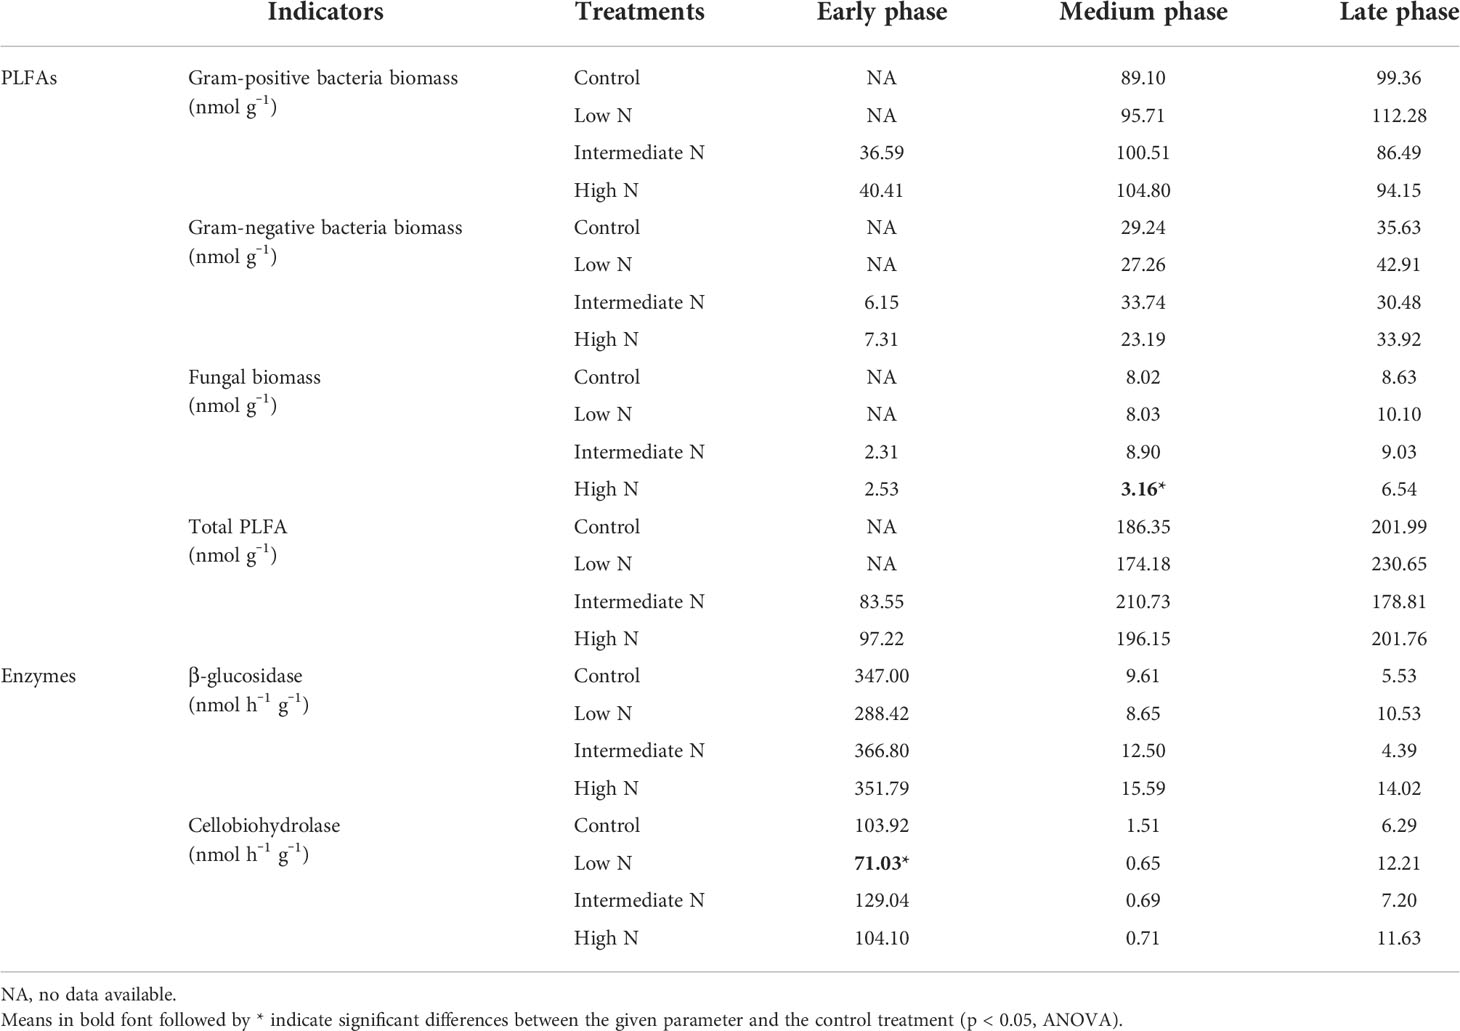
Table 3 Litter phospholipid fatty acids (PLFA) and enzymes activities during the decomposition phase.
Response of litter CO2 evolution rates and accumulative release to N addition
During decomposition, litter CO2 evolution rates (9.97‒307.54 μg C g−1 h−1) significantly decreased over time (p < 0.001, Figure 2). In most decomposition times, there was no significant difference on litter CO2 evolution rates with N treatment or interaction term [time × treatments] (Figure 2). Litter CO2 evolution rates showed a similar temporal pattern among different N addition treatments, in that they peaked in the early phase, weakened in the medium phase, and maintained a low level into the late phase. A notable exception was day 20, when litter CO2 evolution rates were significantly higher in the high-N treatment relative to those of the control. Another anomaly was that higher litter CO2 evolution rates were observed with intermediate-N levels compared with those under high-N addition at days 30 and 120 (p < 0.05, Figure 2).
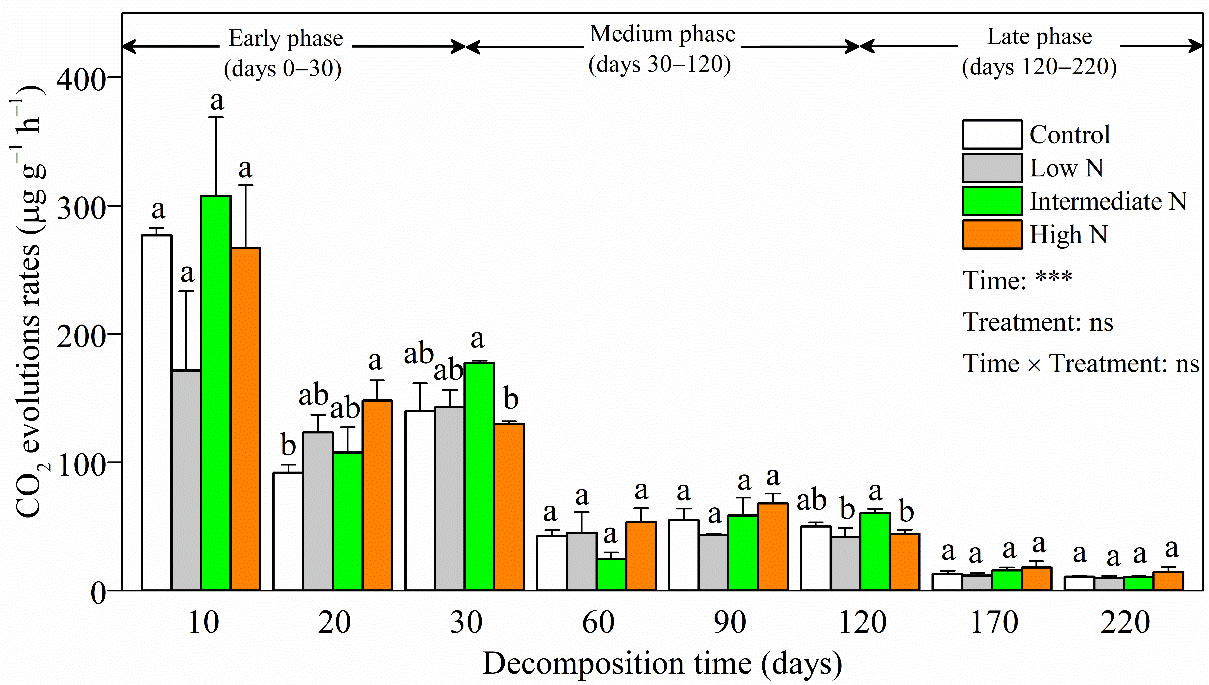
Figure 2 CO2 evolution rates (mean ± SE) of C. malaccensis litter under different N addition treatments. Different letters above error bars indicate significant difference (ANOVA, p > 0.05). The results of repeated measure analysis of covariance are also noted and “Time × Treatment” is the combined effect of time and N treatment. *** significant at p < 0.001; ns, not significant.
Accumulative CO2 release significantly increased over time (p < 0.001), and there was a significant difference for the interaction term [time × treatments] (p < 0.001) but no significant difference for N treatment over time (Figure 3A). In the early phase, there was no significant difference in accumulative CO2 release among different N amendments (Figure 3A). By moving into the medium phase, accumulative CO2 release significantly increased under the low- and intermediate-N amendments relative to the control; and ultimately, all N treatment significantly increased accumulative CO2 release (p < 0.05, Figure 3A). At the end of our experiment, compared with the control treatment, accumulative CO2 release increased 69.75%, 76.62%, and 39.93% for low-, intermediate-, and high-N treatments, respectively. The facilitation effect on accumulative CO2 release by N amendments was more and more obvious over the decomposition time, especially for the low- and intermediate-N treatments (Figure 3B).
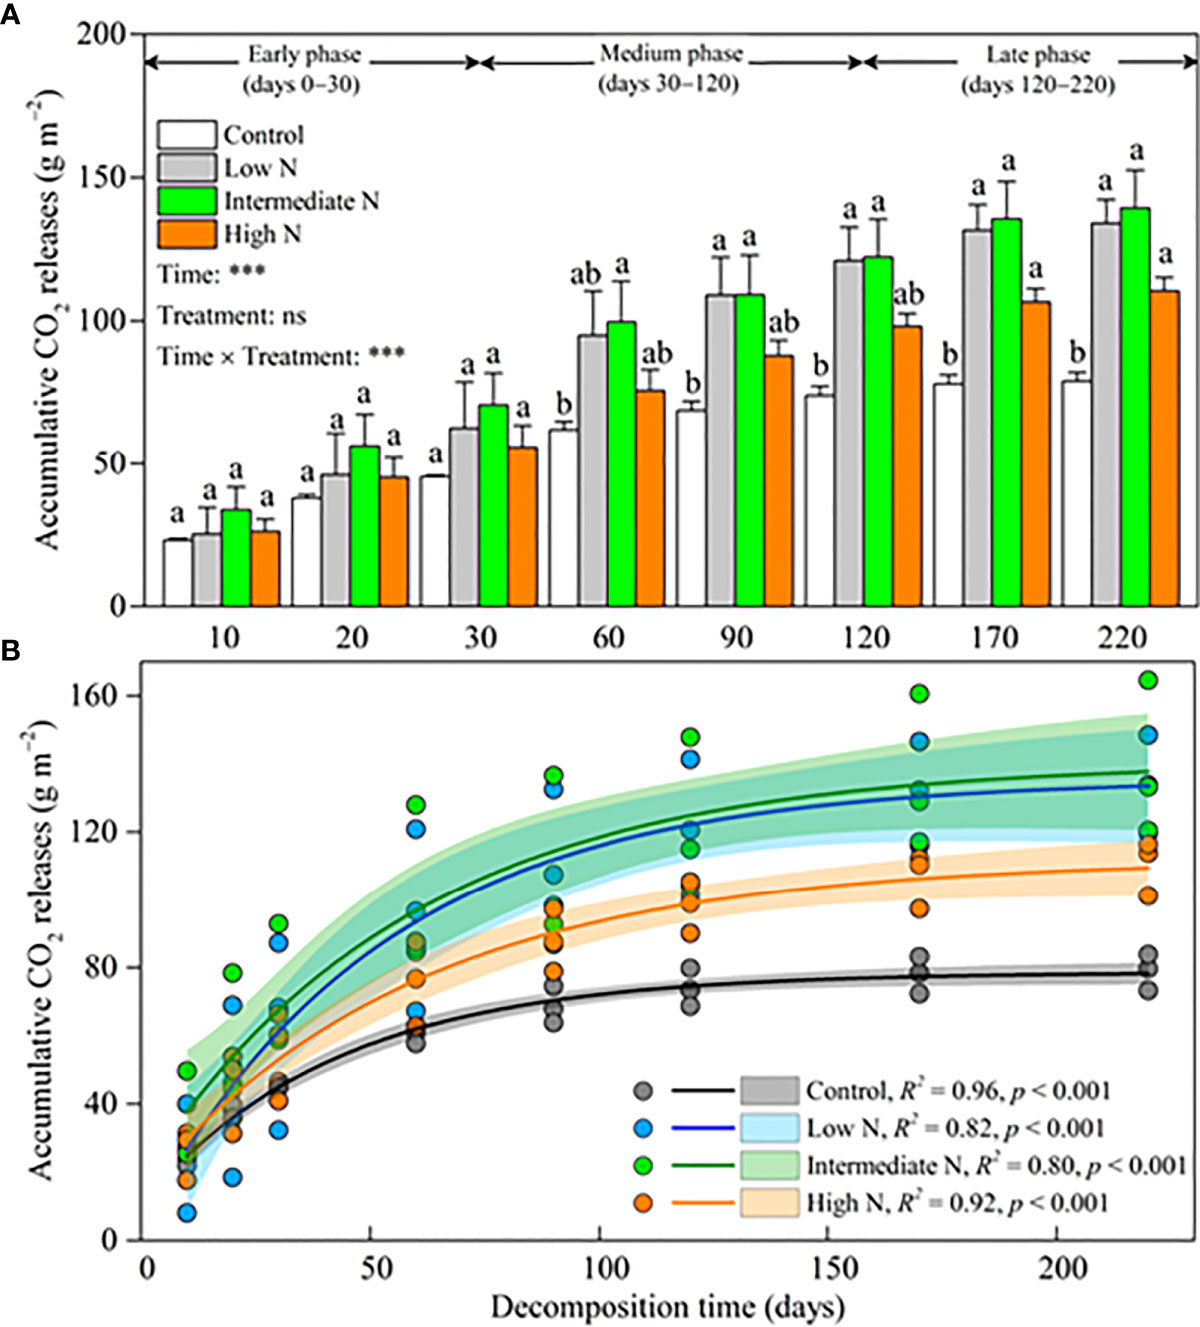
Figure 3 (A) Litter accumulative CO2 release (mean ± SE) under different N addition treatments. Different letters above error bars indicate significant difference (ANOVA, p > 0.05). The results of repeated measure analysis of covariance are also noted, and “Time × Treatment” is the combined effect of time and N treatment. ** significant at p < 0.01; *** significant at p < 0.001; ns, not significant. (B) exponential regressions under different N addition treatments. The scatters are litter accumulative CO2 release (three duplicates). The lines are asymptotic for exponential regressions. Shaded areas are 95% confidence intervals. R2 and p values are from exponential regressions.
Redundancy analysis and structural equation modeling analysis
RDA results showed that litter quality and environmental and microbial parameters could explain 95.46% of the variance in CO2 evolution rates and accumulative CO2 release (Figure 4). Litter TC contributed the most to changes, explaining 74.6% of the variance, and was significantly positively correlated with CO2 evolution rates. Moreover, both litter residual mass (explaining 12.8% of the variance) and sediment TN (explaining 1.6% of the variance) were positively correlated with CO2 evolution rates, but negatively correlated with accumulative CO2 release (Figure 4). Litter TS (explaining 1.5% of the variance) was negatively correlated with CO2 evolution rates, however, it was positively correlated with accumulative CO2 release (Figure 4). In addition, CO2 evolution rates were positively correlated with porewater DIN and crab hole density (Figure 4).
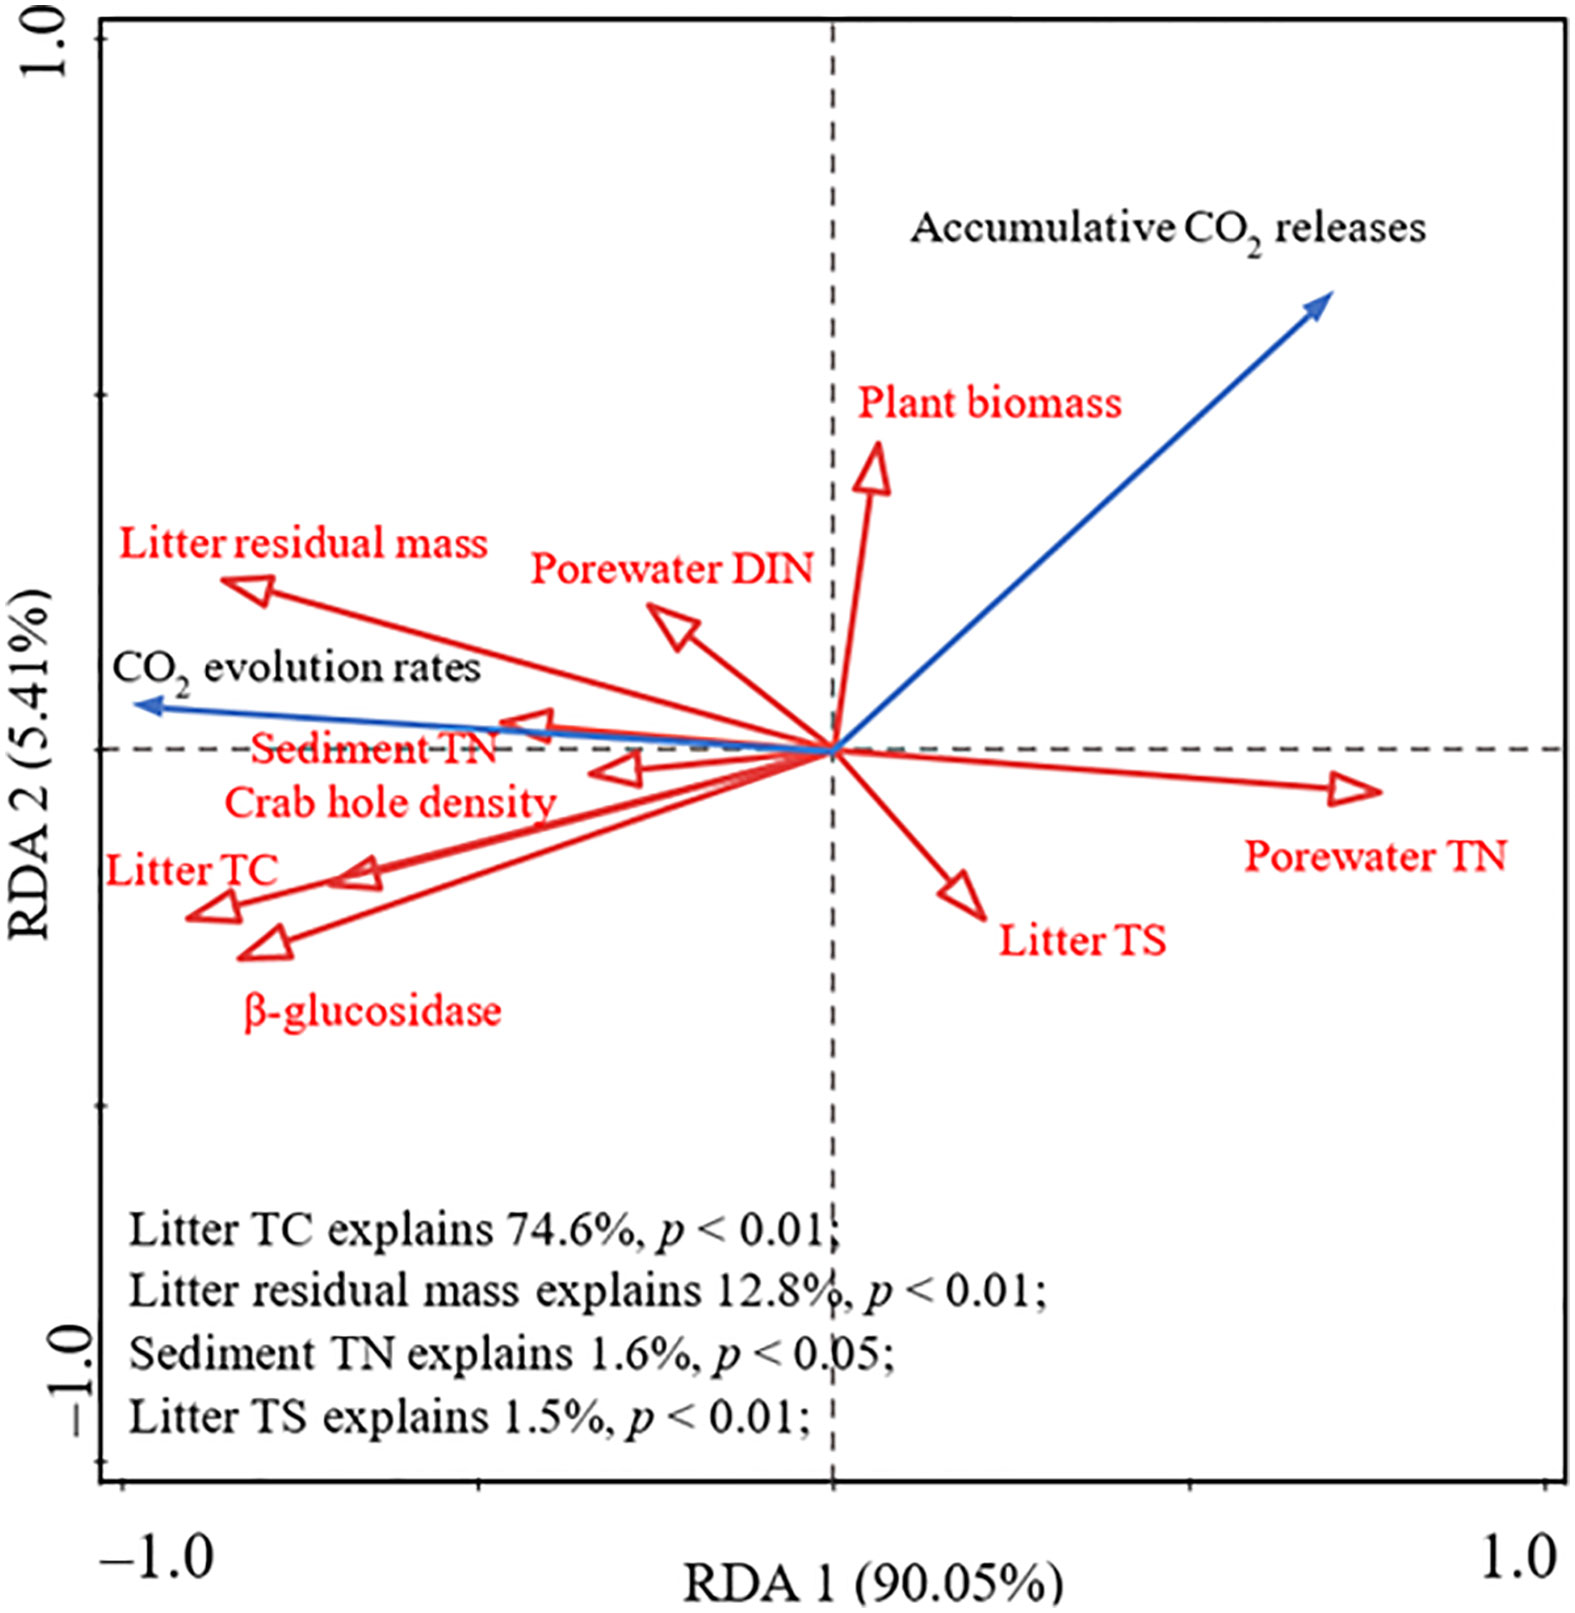
Figure 4 Redundancy analysis (RDA) ordination plots for the first two principal dimensions of the relationship among CO2 evolution rate, accumulative CO2 release, environmental parameters, microbial biomass, and litter matrix.
The SEM of the direct and indirect effects of both sediment and porewater TN on accumulative CO2 release showed reasonable fits (χ2 = 9.33, p = 0.87, GFI = 0.95, RMSEA < 0.001), and the model accounted for 87% and 71% of the variance in litter CO2 evolution rates and accumulative CO2 release, respectively (Figure 5). We found negative relationships between both sediment and porewater TN and sediment pH, between sediment pH and gram-negative bacteria, and between gram-negative bacteria and both litter residual mass and litter-derived DOC (Figure 5). Conversely, we observed positive relationships between sediment TN and litter residual mass, between sediment pH and litter-derived DOC, between litter residual mass and CO2 evolution rates, and between litter-derived DOC and CO2 evolution rates (Figure 5). In addition, both litter CO2 evolution rates and litter production were negatively correlated to accumulative CO2 release, whereas gram-negative bacteria and litter residual mass were positively correlated to accumulative CO2 release (Figure 5).
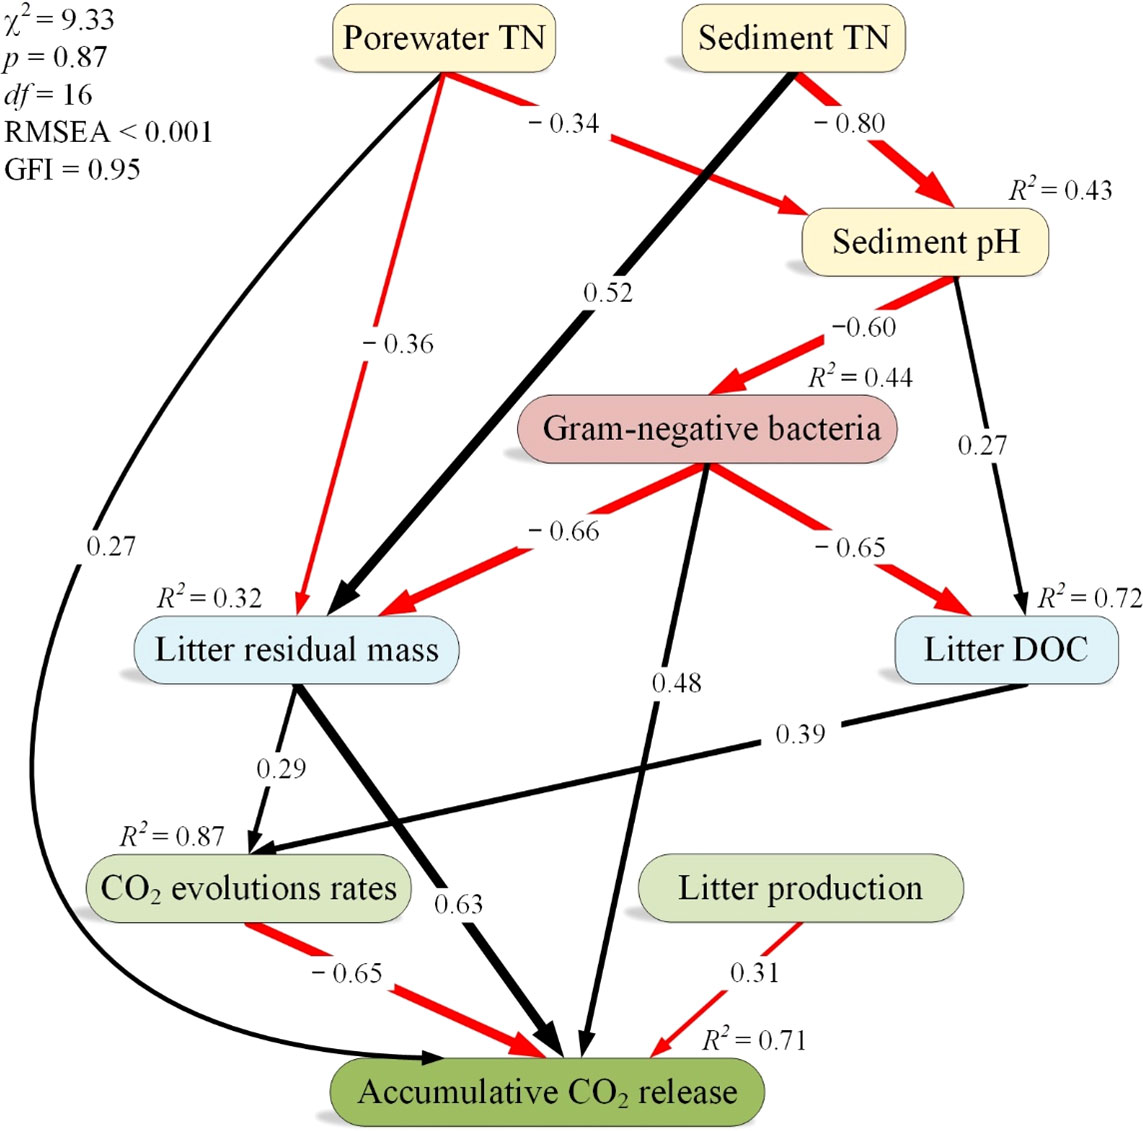
Figure 5 A structural equation model analysis of the effects of porewater total nitrogen (TN) on accumulative CO2 release. The width of arrows indicates the strength of the standardized path coefficient. Black lines indicate positive path coefficients, while red lines indicate negative path coefficients (p < 0.05). R2 values associated with response variables indicate the proportion of variation explained by relationships with other variables. GFI, goodness-of-fit index; RMSEA, root mean square errors of approximation; χ2, chi-square tests.
Discussion
Litter CO2 evolution rates
The results of this study show that litter CO2 evolution rates of shichito matgrass were similar to those of standing-dead leaf blades (10–295 µg C g−1 h−1) (Kuehn et al., 2004) but higher than those of culms litter (6.38‒148.01 μg C g−1 h−1) and lower than those of leaf litter (40.37‒741.91 μg C g−1 h−1) of Phragmites australis (Zhang et al., 2014b). During decomposition time, litter CO2 evolution rates peaked in the early phase, weakened in medium phase, and maintained a low-level proceeding into the late phase (Figure 2), that was consistent with Li et al. (2015). The pattern of CO2 evolution rates could be partly explained by C availability (Figures 4, 5), the variation in litter TC and DOC concentration were in line with the trend observed for CO2 evolution rates (Table 1). Uselman et al. (2012) suggested that approximately 36% of the DOC was either respired or stored in the early phase. This labile pool was a source of microbial respiration rates (Day et al., 2018). The downtrend in CO2 evolution rates did not mean that microbes would die or activity decline in a short time (Li et al., 2015), and this was further confirmed by the PLFA data (Table 3). Previous studies suggested that the increasing easily-available matter (especially labile C) would accelerate the turnover of microorganisms (r-strategists, mainly bacteria) in the early phase, and later replaced by k-strategists (mainly fungi) due to growth-limiting substrate concentrations (Fontaine et al., 2003; Dilly et al., 2004; McTee et al., 2017), however, our bacteria and fungi biomass data did not show this trend during decomposition process.
Response of litter CO2 evolution rates to nitrogen addition
Our results do not support our first hypothesis that N addition did not change litter-derived CO2 evolution rates in most decomposition times (Figure 2). On the one hand, crab may affect litter decomposition and respiration through consumption, an increase of soil drainage and soil oxidation-reduction potential (Bertness, 1985), colonization by bacteria and resulted in a rapid decline in the C/N ratio (Werry and Lee, 2005). Since some crabs may have a preference for ingesting high N and low C/N foods, N amendments may affect the crab burrows (Nordhaus and Wolff, 2007), and the increase in crab hole density and decrease in litter C/N ratio in the medium phase (Tables 1, 2) were corroborating these results. On the other hand, available C sources could facilitate microbial respiration initiated by high β-glucosidase activity (Badiane et al., 2001; Sinsabaugh et al., 2009; Turner and Wright, 2014). The studied N amendments had little effect on β-glucosidase, further led to a similar litter DOC for microbial respiration (Tables 1 and 3), although low litter TC and sediment TC were found after N addition in the medium phase. Eventually, although low litter TC and sediment TC may decrease litter-derived CO2 evolution rates after N addition in the medium phase, these negative effects may offset by the positive effect of crab activity.
Interestingly, litter CO2 evolution rates were significantly higher in the high-N treatment relative to the control in day 20 (Figure 2), this unexpected result indicated that high-N may be explained by sediment pH (Table 2 and Figure 5). In the early phase, litter leaching would increase in pH (Nykvist, 1963), consistent with our findings. In weak acidic or neutral environments (pH 6.19‒7.13), acidobacteria subgroups 4 and 6 had higher sediment pH values (Jones et al., 2009; Keyport et al., 2019). These increases in relative pH may indirectly increase microbial respiration (Tables 2, 3 Figure 5).
By moving into the late phase, traditionally, litter remains were relatively refractory materials (i.e., lignin), and lignin-degradation rates regulated litter decomposition (Valiela et al., 1985; Berg and Matzner, 1997). The refractory lignin was decomposed by white-rot basidiomycetes and phenol oxidase, and they were greatly decreased by increased N availability (Dix and Webster, 1995; Carreiro et al., 2000; Gallo et al., 2005). Previous studies have suggested that N has a retarding effect on decomposition in the late phase when significant negative correlations were noted between N content in humus and respiration rate (Berg and Matzner, 1997). Our results challenge the traditional view that there was no significant difference in litter CO2 evolution rates among the different N addition treatments in the late phase.
Response of litter accumulative CO2 release to nitrogen addition
Our data supports hypothesis 2 based on the significant increase in accumulative CO2 release in the medium and late phase, though this motivating effect was not observed in the early phases (Figure 3B). Rubino et al. (2010) reported the fraction of litter C released as CO2 to the atmosphere to be nearly 30% of the total litter C loss. Based on this estimate, litter CO2 release could reach 53% of the total litter C loss under intermediate-N deposition (16 g N m‒2 yr‒1). The accumulative CO2 released from litter was directly affected by litter CO2 evolution rates, litter residual mass, and litter production (Figure 5). Because of no significant litter CO2 evolution rates under different N treatments, we suggested that litter production and residual mass were the most important factors regulating accumulative CO2 release.
Meta-analysis results indicated that N addition significantly increased aboveground biomass and litter input by 31% and 20%, respectively (Liu and Greaver, 2010; You et al., 2017). A similar relationship was found in our studies. Not only N fertilization increases litter production, but also ameliorates litter chemistry (Wedin and Tilman, 1996; Gerdol et al., 2007). Higher N availability increased plant lignin and protein, but decreased plant hemicellulose (Liu et al., 2016). On the other hand, litter residual mass increased after N addition in the medium and late phases. The retarding effect of increasing N on decomposition in the late phase has been demonstrated by previous studies, and there are four possible nonexclusive explanations: (i) decreasing sediment pH, further decreasing bacterial diversity (Geisseler and Scow, 2014); (ii) directly inhibiting the decay of lignin and cellulose (Tu et al., 2011); (iii) decreasing white-rot basidiomycetes and phenol oxidase, resulting in slow lignin decomposition (Dix and Webster, 1995; Carreiro et al., 2000; Gallo et al., 2005); (iv) causing more humus to be left, and the resulting lower levels of Mn further retards humus decomposition (Berg and Matzner, 1997). Ultimately, the combined effect of the increased litter input and the inhibiting effect of external N on litter decomposition increased accumulative CO2 release (Figure 6).
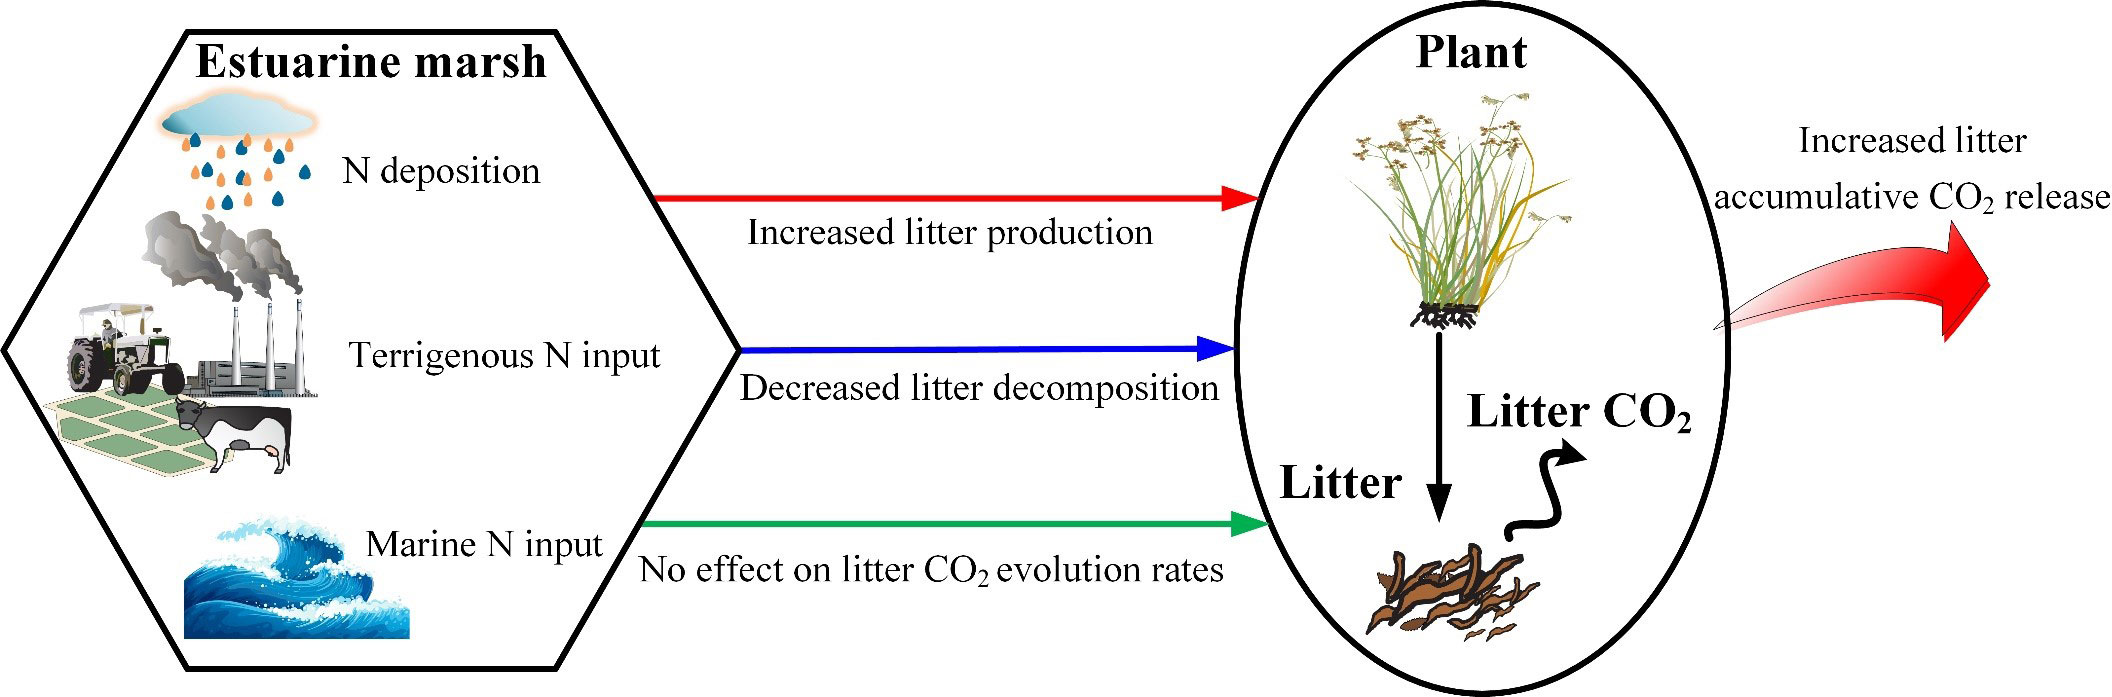
Figure 6 Conceptual schematic of the effect of N load on litter accumulative CO2 release in estuarine marshes.
Uncertainties and future study
To the best of our knowledge, our study was the first time to investigate the response of litter CO2 evolution rates and accumulative release to N addition in a subtropical estuarine marsh. Nevertheless, there remains a great deal of uncertainty in our results. Our data highlights the role of litter production and decomposition as important environmental factors influencing litter CO2 production and emissions. The increase in litter input and inhibition of litter decomposition by N loading increased accumulative CO2 release. This indicates that N input could greatly cause loss of litter C as CO2 at the regional level and globally, particularly in tidal freshwater marshes. Previous studies have demonstrated that increases in sediment CO2 emissions induced by N loads were counteracted by sea-level rise and the subsequent inhibition of the increase in N on C emissions (Hu et al., 2019a); to some extent, the litter CO2 emissions played a similar role. Our findings provide a comprehensive perspective for understanding the underlying response of litter CO2 release to N addition in an estuarine marsh, and thus, improve predictions and climate adaptation strategies.
Owing to the limitations of the study region, we selected litter of shichito matgrass for analysis. Nitrogen deposition is an ongoing process. Since litter quality, especially plants N matrix (i.e., C/N), is crucial for litter CO2 evolution and decomposition (Chambers et al., 2001; Uselman et al., 2012; Zhang et al., 2014b; Day et al., 2018; Jacobs et al., 2018), the CO2 evolution and release from litter of different vegetation types and the initial litter produced under different N deposition conditions are needed to investigate in further studies. In addition, the N added in the sample plots may be difficult to infiltrate or easily carried away by the tides. Therefore, it is necessary to carry out a microcosms experiment.
Conclusions
Our results, overall, provide a basis for developing guidelines for CO2 emission predictions. Litter CO2 evolution rates peaked in the early phase, weakened in the medium phase, and maintained a low-level proceeding into the late phase. Litter-derived CO2 evolution rates were similar after N addition in most decomposition times. Although low litter TC and sediment TC may decrease litter-derived CO2 evolution rates after N addition in the medium phase, these negative effects may offset by the positive effect of crab activity. Generally, the average accumulative CO2 release increased after N addition, mainly driven by litter production and decomposition. Our results indicated that an increase in N load significantly increased the litter CO2 release, and thus, improves predictions and provides key information for developing climate adaptation strategies.
Data availability statement
The original contributions presented in the study are included in the article/supplementary material. Further inquiries can be directed to the corresponding authors.
Author contributions
WH: Writing – Original Draft, Conceptualization, Software, Formal analysis, Data Curation. CZ, CT, and GL: Conceptualization, Methodology, Writing – Review & Editing. XL, JZ, and MZ: Methodology, Software, and Formal analysis. YC and LZ: Writing – Review & Editing, Project administration, Funding acquisition. All authors contributed to the article and approved the submitted version.
Funding
The project was supported by the Public Service Foundation of Science and Technology Department of Fujian Province (no. 2017R1034-6), the National Science Foundation of China (no. 41877335), and Program for Innovative Research Teams of Fujian Normal University (no. IRTL1205), and the Special fund for scientific innovation strategy-construction of high-level Academy of Agriculture Science (R2020YJ-YB3006). We are greatly grateful to the Wetland Ecosystem Research Station of Minjiang Estuary, State Forestry and Grassland Administration, China, for logistical support and laboratory assistance.
Conflict of interest
The authors declare that the research was conducted in the absence of any commercial or financial relationships that could be construed as a potential conflict of interest.
Publisher’s note
All claims expressed in this article are solely those of the authors and do not necessarily represent those of their affiliated organizations, or those of the publisher, the editors and the reviewers. Any product that may be evaluated in this article, or claim that may be made by its manufacturer, is not guaranteed or endorsed by the publisher.
References
Badiane N. N. Y., Chotte J. L., Pate E., Masse D., Rouland C. (2001). Use of soil enzyme activities to monitor soil quality in natural and improved fallows in semi-arid tropical regions. Appl. Soil Ecol. 18 (3), 229–238. doi: 10.1016/S0929-1393(01)00159-7
Berg B., Matzner E. (1997). Effect of n deposition on decomposition of plant litter and soil organic matter in forest systems. Environ. Rev. 5, 1–25. doi: 10.1139/er-5-1-1
Bertness M. D. (1985). Fiddler crab regulation of Spartina alterniflora production on a new England salt marsh. Ecology 66 (3), 1042–1055. doi: 10.2307/1940564
Carreiro M. M., Sinsabaugh R. L., Repert D. A., Parkhurst D. F. (2000). Microbial enzyme shifts explain litter decay responses to simulated nitrogen deposition. Ecology 81 (9), 2359–2365. doi: 10.1890/0012-9658(2000)081[2359:MESELD]2.0.CO;2
Chambers J. Q., Schimel J. P., Nobre A. D. (2001). Respiration from coarse wood litter in central Amazon forests. Biogeochemistry 52, 115–131. doi: 10.1023/A:1006473530673
Day T. A., Bliss M. S., Tomes A. R., Ruhland C. T., René G. (2018). Desert leaf litter decay: coupling of microbial respiration, water-soluble fractions and photodegradation. Global Change Biol. 24 (11), 5454–5470. doi: 10.1111/gcb.14438
Dilly O., Bloem J., Vos A., Munch J. C. (2004). Bacterial diversity in agricultural soils during litter decomposition. Appl. Environ. Microb. 70 (1), 468–474. doi: 10.1128/AEM.70.1
Feng X., Simpson M. J. (2009). Temperature and substrate controls on microbial phospholipid fatty acid composition during incubation of grassland soils contrasting in organic matter quality. Soil Biol. Biochem. 41 (4), 804–812. doi: 10.1016/j.soilbio.2009.01.020
Fontaine S., Mariotti A., Abbadie L. (2003). The priming effect of organic matter: a question of microbial competition? Soil Biol. Biochem. 35 (6), 837–843. doi: 10.1016/S0038-0717(03)00123-8
Gallo M., Lauber C., Waldrop M., Sinsabaugh R., Zak D. (2005). Soil organic matter and litter chemistry response to experimental n deposition in northern temperate deciduous forest ecosystems. Global Change Biol. 11 (9), 1514–1521. doi: 10.1111/j.1365-2486.2005.001001.x
Galloway J., Townsend A., Erisman J., Bekunda M., Cai Z., Freney J., et al. (2008). Transformation of the nitrogen cycle: Recent trends, questions, and potential solutions. Science 320 (5878), 889–892. doi: 10.1126/science.1136674
Geisseler D., Scow K. M. (2014). Long-term effects of mineral fertilizers on soil microorganisms–a review. Soil Biol. Biochem. 75, 54–63. doi: 10.1016/j.soilbio.2014.03.023
Gerdol R., Petraglia A., Bragazza L., Iacumin P., Brancaleoni L. (2007). Nitrogen deposition interacts with climate in affecting production and decomposition rates in Sphagnum mosses. Global Change Biol. 13 (8), 1810–1821. doi: 10.1111/j.1365-2486.2007.01380.x
Guan B., Xie B., Yang S., Hou A., Chen M., Han G. (2019). Effects of five years’ nitrogen deposition on soil properties and plant growth in a salinized reed wetland of the yellow river delta. Ecol. Eng. 136, 160–166. doi: 10.1016/j.ecoleng.2019.06.016
Hall S. J., Huang W., Hammel K. E. (2017). An optical method for carbon dioxide isotopes and mole fractions in small gas samples: Tracing microbial respiration from soil, litter, and lignin. Rapid Commu Mass Sp 31 (22), 1938–1946. doi: 10.1002/rcm.7973
Hassett J. E., Zak D. R. (2005). Aspen harvest intensity decreases microbial biomass, extracellular enzyme activity, and soil nitrogen cycling. Soil Sci. Soc. Am. J. 69 (1), 227–235. doi: 10.2136/sssaj2005.0227
Huang F., Lin X., Hu W., Zeng F., He L., Yin K. (2021). Nitrogen cycling processes in sediments of the pearl river estuary: Spatial variations, controlling factors, and environmental implications. Catena 206, 105545. doi: 10.1016/j.catena.2021.105545
Hu M., Peñuelas J., Sardans J., Huang J., Li D., Tong C. (2019a). Effects of nitrogen loading on emission of carbon gases from estuarine tidal marshes with varying salinity. Sci. Tot. Environ. 667, 648–657. doi: 10.1016/j.scitotenv.2019.02.429
Hu W., Zhang L., Lai D. Y., Gao J., Sun Z., Tong C., et al. (2019b). The difference of litter decay, litter- and sediment-associated hydrolytic enzymes between brackish and freshwater tidal marshes. Estuar. Coast. 42 (5), 1328–1341. doi: 10.1007/s12237-019-00565-7
Jacobs L. M., Sulman B. N., Brzostek E. R., Feighery J. J., Phillips R. P. (2018). Interactions among decaying leaf litter, root litter and soil organic matter vary with mycorrhizal type. J. Ecol. 106 (2), 502–513. doi: 10.1111/1365-2745.12921
Jones R. T., Robeson M. S., Lauber C. L., Hamady M., Knight R., Fierer N. (2009). A comprehensive survey of soil acidobacterial diversity using pyrosequencing and clone library analyses. ISME J. 3 (4), 442–453. doi: 10.1038/ismej.2008.127
Keyport S., Carson B. D., Johnson O., Lawrence B. A., Lishawa S. C., Tuchman N. C., et al. (2019). Effects of experimental harvesting of an invasive hybrid cattail on wetland structure and function. Restor. Ecol. 27, 389–398. doi: 10.1111/rec.12859
Knorr M., Frey S. D., Curtis P. S. (2005). Nitrogen additions and litter decomposition: a meta-analysis. Ecology 86 (12), 3252–3257. doi: 10.1890/05-0150
Kuehn K., Lemke M., Suberkropp K., Wetzel R. (2000). Microbial biomass and production associated with decaying leaf litter of the emergent macrophyte Juncus effusus. Limnol Oceanogr 45 (4), 862–870. doi: 10.4319/lo.2000.45.4.0862
Kuehn K. A., Steiner D., Gessner M. O. (2004). Diel mineralization patterns of standing-dead plant litter: implications for CO2 flux from wetlands. Ecology 85 (9), 2504–2518. doi: 10.1890/03-4082
Li H. C., Hu Y. L., Rong M., Zhao Q., Zeng D. H. (2015). Effects of nitrogen addition on litter decomposition and CO2 release: considering changes in litter quantity. PloS One 10 (12), e0144665. doi: 10.1371/journal.pone.0144665
Lin G., Lin X. (2022). Bait input altered microbial community structure and increased greenhouse gases production in coastal wetland sediment 2022. Water Res. 218, 118520. doi: 10.1016/j.watres.2022.118520
Lin X., Liu M., Hou L., Gao D., Li X., Lu K., et al. (2017). Nitrogen losses in sediments of the East China Sea: Spatiotemporal variations, controlling factors and environmental implications. J. Geophys. Res.: Biogeosci. 122 (10), 2699–2715. doi: 10.1002/2017JG004036
Liu L., Greaver T. L. (2010). A global perspective on belowground carbon dynamics under nitrogen enrichment. Ecol. Lett. 13, 819–828. doi: 10.1111/j.1461-0248.2010.01482.x
Liu J., Wu N., Wang H., Sun J., Peng B., Jiang P., et al. (2016). Nitrogen addition affects chemical compositions of plant tissues, litter and soil organic matter. Ecology 97 (7), 1796–1806. doi: 10.1890/15-1683.1
Luo M., Zhu W., Huang J., Liu Y., Duan X., Wu J., et al. (2019). Anaerobic organic carbon mineralization in tidal wetlands along a low-level salinity gradient of a subtropical estuary: Rates, pathways, and controls. Geoderma 337, 1245–1257. doi: 10.1016/j.geoderma.2018.07.030
Magill A. H., Aber J. D. (2000). Dissolved organic carbon and nitrogen relationships in forest litter as affected by nitrogen deposition. Soil Biol. Biochem. 32 (5), 603–613. doi: 10.1016/S0038-0717(99)00187-X
Mao R., Wu P. P., Xu J. W., Wan S. Z., Zhang Y. (2021). Leaf litter decomposition in the air should not be ignored in subtropical plantations of China. For. Ecol. Manag 499, 119614. doi: 10.1016/j.foreco.2021.119614
McTee M. R., Lekberg Y., Mummey D., Rummel A., Ramsey P. W. (2017). Do invasive plants structure microbial communities to accelerate decomposition in intermountain grasslands? Ecol. Evol. 7 (24), 11227–11235. doi: 10.1002/ece3.3608
Meybeck M., Ragu A. (2012). GEMS-GLORI world river discharge database (Paris: Laboratoire de Géologie Appliquée, Université Pierre et Marie Curie). doi: 10.1594/PANGAEA.804574
Nordhaus I., Wolff M. (2007). Feeding ecology of the mangrove crab Ucides cordatus (Ocypodidae): food choice, food quality and assimilation efficiency. Mar. Biol. 151 (5), 1665–1681. doi: 10.1007/s00227-006-0597-5
Nykvist N. (1963). Leaching and decomposition of water-soluble organic substancesfrom different types of leaf and needle litter. Studia Forestalla Suecica, 3, 1–29.
Ochoa-Hueso R., Delgado-Baquerizo M., King P. T. A., Benham M., Arca V., Power S. A. (2019). Ecosystem type and resource quality are more important than global change drivers in regulating early stages of litter decomposition. Soil Biol. Biochem. 129, 144–152. doi: 10.1016/j.soilbio.2018.11.009
Prescott C. E. (2010). Litter decomposition: what controls it and how can we alter it to sequester more carbon in forest soils? Biogeochemistry 101, 133–149. doi: 10.1007/s10533-010-9439-0
Rejmánková E., Houdková K. (2006). Wetland plant decomposition under different nutrient conditions: what is more important, litter quality or site quality? Biogeochemistry 80 (3), 245–262. doi: 10.1007/s10533-006-9021-y
Rockström J., Steffen W., Noone K., Persson Å., Chapin F. S. III, Lambin E. F., et al. (2009). A safe operating space for humanity. Nature 461, 472. doi: 10.1038/461472a
Rubino M., Dungait J., Evershed R., Bertolini T., De Angelis P., D’Onofrio A., et al. (2010). Carbon input belowground is the major c flux contributing to leaf litter mass loss: Evidences from a 13C labelled-leaf litter experiment. Soil Biol. Biochem. 42 (7), 1009–1016. doi: 10.1016/j.soilbio.2010.02.018
Saiya-Cork K., Sinsabaugh R., Zak D. (2002). The effects of long term nitrogen deposition on extracellular enzyme activity in an Acer saccharum forest soil. Soil Biol. Biochem. 34 (9), 1309–1315. doi: 10.1016/S0038-0717(02)00074-3
Simas T. C., Ferreira J. G. (2007). Nutrient enrichment and the role of salt marshes in the tagus estuary (Portugal). Estuar. Coast. Shelf S 75 (3), 393–407. doi: 10.1016/j.ecss.2007.05.046
Sinsabaugh R. L., Gallo M. E., Lauber C., Waldrop M. P., Zak D. R. (2005). Extracellular enzyme activities and soil organic matter dynamics for northern hardwood forests receiving simulated nitrogen deposition. Biogeochemistry 75 (2), 201–215. doi: 10.1007/s10533-004-7112-1
Sinsabaugh R. L., Hill B. H., Follstad Shah J. J. (2009). Ecoenzymatic stoichiometry of microbial organic nutrient acquisition in soil and sediment. Nature 462 (7274), 795–798. doi: 10.1038/nature08632
Tao B., Zhang B., Dong J., Liu C., Cui Q. (2019). Antagonistic effect of nitrogen additions and warming on litter decomposition in the coastal wetland of the yellow river delta, China. Ecol. Eng. 131, 1–8. doi: 10.1016/j.ecoleng.2019.02.024
Tu L., Hu H., Hu T., Zhang J., Liu L., Li R., et al. (2011). Decomposition of different litter fractions in a subtropical bamboo ecosystem as affected by experimental nitrogen deposition. Pedosphere 21 (6), 685–695. doi: 10.1016/S1002-0160(11)60171-9
Turner B. L., Wright S. J. (2014). The response of microbial biomass and hydrolytic enzymes to a decade of nitrogen, phosphorus, and potassium addition in a lowland tropical rain forest. Biogeochemistry 117 (1), 115–130. doi: 10.1007/s10533-013-9848-y
Uselman S. M., Qualls R. G., Lilienfein J. (2012). Quality of soluble organic c, n, and p produced by different types and species of litter: Root litter versus leaf litter. Soil Biol. Biochem. 54 (6), 57–67. doi: 10.1016/j.soilbio.2012.03.021
Valiela I., Teal J. M., Allen S. D., Van Etten R., Goehringer D., Volkmann S. (1985). Decomposition in salt marsh ecosystems: the phases and major factors affecting disappearance of above-ground organic matter. J. Exp. Mar. Biol. Ecol. 89 (1), 29–54. doi: 10.1016/0022-0981(85)90080-2
Wang Y., Yang J., Liu L., Yu Z. (2015). Quantifying the effects of geographical and environmental factors on distribution of stream bacterioplankton within nature reserves of fujian, China. Environ. Sci. pollut. R 22 (14), 11010–11021. doi: 10.1007/s11356-015-4308-y
Wedin D. A., Tilman D. (1996). Influence of nitrogen loading and species composition on the carbon balance of grasslands. Science 274 (5293), 1720–1723. doi: 10.1126/science.274.5293.172
Werry J., Lee S. (2005). Grapsid crabs mediate link between mangrove litter production and estuarine planktonic food chains. Mar. Ecol. Prog. Ser. 293, 165–176. doi: 10.3354/meps293165
Xu Y., Fan J., Ding W., Bol R., Chen Z., Luo J., et al. (2016). Stage-specific response of litter decomposition to n and s amendments in a subtropical forest soil. Biol. Fert Soils 52 (5), 711–724. doi: 10.1007/s00374-016-1115-7
Xu W., Luo X., Pan Y., Zhang L., Tang A., Shen J., et al. (2015). Quantifying atmospheric nitrogen deposition through a nationwide monitoring network across China. Atmos Chem. Phys. 15 (21), 12345–12360. doi: 10.5194/acp-15-12345-2015
Yang W., Feng G., Tewolde H., Li P. (2019). CO2 emission and soil carbon sequestration from spring-and fall-applied poultry litter in corn production as simulated with RZWQM2. J. Clean Prod 209, 1285–1293. doi: 10.1016/j.jclepro.2018.10.251
You C., Wu F., Gan Y., Yang W., Hu Z., Xu Z., et al. (2017). Grass and forbs respond differently to nitrogen addition: a meta-analysis of global grassland ecosystems. Sci. Rep-UK 7 (1), 1563–1573. doi: 10.1038/s41598-017-01728-x
Yu X., Guo J., Lu X., Wang G., Jiang M., Zou Y. (2019). Comparative analyses of wetland plant biomass accumulation and litter decomposition subject to in situ warming and nitrogen addition. Sci. Tot. Environ. 691, 769–778. doi: 10.1016/j.scitotenv.2019.07.018
Zhang T. A., Luo Y., Chen H. Y. H., Ruan H. (2018). Responses of litter decomposition and nutrient release to n addition: A meta-analysis of terrestrial ecosystems. Appl. Soil Ecol. 128, 35–42. doi: 10.1016/j.apsoil.2018.04.004
Zhang X., Mao R., Gong C., Qiao T., Song C. (2014b). CO2 evolution from standing litter of the emergent macrophyte Deyeuxia angustifolia in the sanjiang plain, northeast China. Ecol. Eng. 63, 45–49. doi: 10.1016/j.ecoleng.2013.12.002
Zhang L., Tong C., Marrs R., Wang T., Zhang W., Zeng C. (2014a). Comparing litter dynamics of Phragmites australis and Spartina alterniflora in a sub-tropical Chinese estuary: Contrasts in early and late decomposition. Aquat Bot. 117, 1–11. doi: 10.1016/j.aquabot.2014.03.003
Keywords: litter-derived CO2, litter decomposition, nitrogen addition, estuarine marsh, accumulative CO2 release
Citation: Hu W, Zeng C, Tong C, Li G, Lan X, Zhou J, Zhang M, Chen Y and Zhang L (2022) Nitrogen deposition may increase litter accumulative CO2 release in a subtropical estuarine marsh. Front. Mar. Sci. 9:1035095. doi: 10.3389/fmars.2022.1035095
Received: 02 September 2022; Accepted: 26 September 2022;
Published: 10 October 2022.
Edited by:
Xianbiao Lin, Ocean University of China, ChinaReviewed by:
He Tao, Jinan University, ChinaYifei Zhang, Northeast Institute of Geography and Agroecology (CAS), China
Copyright © 2022 Hu, Zeng, Tong, Li, Lan, Zhou, Zhang, Chen and Zhang. This is an open-access article distributed under the terms of the Creative Commons Attribution License (CC BY). The use, distribution or reproduction in other forums is permitted, provided the original author(s) and the copyright owner(s) are credited and that the original publication in this journal is cited, in accordance with accepted academic practice. No use, distribution or reproduction is permitted which does not comply with these terms.
*Correspondence: Yuehmin Chen, eW1jaGVuQGZqbnUuZWR1LmNu; Linhai Zhang, bWFyeTEybWFyeXpoYW5nQDEyNi5jb20=