 Erin L. Pulster1,2*
 Kylee Rullo2
 Sherryl Gilbert2Thomas M. Ash3Barbara Goetting3Kevin Campbell3Sara Markham3
 Steven A. Murawski2
- 1United States Geological Survey, Columbia Environmental Research Center, Environmental Chemistry and Toxicology Program, Columbia, MO, United States
- 2College of Marine Science, University of South Florida, St. Petersburg, FL, United States
- 3Environmental Protection Commission of Hillsborough County, Water Management Division, Tampa, FL, United States
The primary source of chronic exposures to per- and polyfluoroalkyl substances (PFASs) in humans is through the ingestion of contaminated foods and drinking water, with fish and other seafood being a major contributor. Nevertheless, there is scant literature on the dietary exposure to PFASs for the general United States (U.S.) population. The Tampa Bay (Florida, USA) region has the highest population density in the State and communities and their attendant support services are arrayed in an urban to semi-rural continuum from the head of the Bay to the ocean mouth. Tampa Bay supports productive recreational and commercial fisheries, providing a diverse community of species. A variety of potential PFAS sources surround Tampa Bay including airports, industry, wastewater treatment plants, fire-fighting training areas and military installations. The objective of this study is to quantify PFASs in sediment and fishes collected from Tampa Bay to further estimate human health risks from dietary exposures. Sediment (n = 17) and fish (24 species, n = 140) were collected throughout Tampa Bay in 2020 and 2021 and analyzed for 25 PFAS compounds. Concentrations of PFASs in sediments and edible tissues of fish ranged from 36.8 to 2,990 ng kg-1 (dry weight) and 307 to 33,600 ng kg-1 (wet weight), respectively. Generally, levels were highest in Old Tampa Bay and decreased south towards the Gulf of Mexico. Profiles in both matrices were generally dominated by perfluorooctane sulfonic acid (PFOS) with variations by location. Estimated human health risks from the consumption of contaminated fish collected in Tampa Bay exceeded concentration thresholds for minimum risk levels (MRLs) and tolerable weekly intake (TWIs) values for adults and youths. Additionally, concentrations of PFOS in edible fish tissues of several recreationally important species collected in Tampa Bay exceeded consumption guideline levels established by several governmental agencies. In the current context, the elevated levels of PFAS in Tampa Bay and the exceedances of available thresholds for potential human health risks are a cause for concern and justify a more intensive examination especially for more heavily utilized species, particularly those used in subsistence-level fishing, which, as elsewhere may be significantly under documented.
1 Introduction
Per- and polyfluorinated alkyl substances (PFASs) were first developed in the 1940s and later manufactured for product applications in the 1950s (3M, 2021). PFASs are a group of over 9,000 synthetic chemicals comprised of materials with properties that include electrical insulating and oil, water, temperature, chemical and fire resistance. These characteristics are appealing to a variety of industries resulting in their extensive use as surfactants and coatings in major applications including packaging, nonstick cookware, aqueous film forming foams (AFFF) for firefighting, electronic devices, aircraft and vehicle applications, and various textiles (e.g., carpets, leather products, furniture, clothing, surgical gowns, etc.). Since PFAS compounds are extremely pervasive, persistent, and environmentally stable, they have been detected globally in all environmental media (air, water, soil), wildlife, food items, and humans (Buck et al., 2011; ATSDR, 2018; Nakayama et al., 2019; Podder et al., 2021; Fiedler et al., 2022; Sims et al., 2022).
One of the most commonly used PFASs, perfluorooctanoate acid (PFOA) is a possible human carcinogen (IARC, 2017). Additionally, another common PFAS, perfluorooctanesulfonic acid (PFOS) and a replacement compound, known as GenX (aka HFPO-DA), both have carcinogenic potential (USEPA, 2016b; 2018). Major concerns regarding the persistence and toxicity of PFASs have led to regulatory actions to phase-out the manufacturing and emissions of PFOS and PFOA related compounds; however, replacement chemicals are equally persistent, and their inherent toxicity is often unknown (USEPA, 2000; Buck et al., 2011). Primary routes of exposures in humans are through ingestion of contaminated food, food-packaging, water, dust, and hand-to-mouth transfer from carpets (Trudel et al., 2008; Carnero et al., 2021; Curtzwiler et al., 2021). Although the United States Environmental Protection Agency (USEPA) has issued non-enforceable drinking water health advisories for individual and combined concentrations (70 ng L-1) of PFOA and PFOS, there are currently no maximum contaminant levels (MCLs) established for any PFASs (USEPA, 2009; OECD/UNEP, 2013; USEPA, 2016a). The lack of federal guidelines has resulted in seven states adopting their own drinking water guidelines ranging from 14 to 1,000 ng L-1 (Cordner et al., 2019).
Considering the greatest source of chronic exposures to PFOS and PFOA in the general population is through the ingestion of contaminated food and drinking water, there are, surprisingly, no published studies on the dietary exposure of PFAS for the general United States (U.S.) population, nor has the U.S. established any consumption guidelines for contaminated foods, such as daily or weekly intake values. However, intermediate-duration oral minimal risk levels (MRL) have been derived in the United States for five PFASs, PFOA (0.000003 mg kg-1 day-1), PFOS (0.000002 mg kg-1 day-1), PFNA (0.000003 mg kg-1 day-1), and PFHxS (0.00002 mg kg-1 day-1; (ATSDR, 2015). In addition, the USEPA has derived reference doses (RfD) for noncancerous health effects based on oral exposures of PFOS (0.00002 mg kg-1 day-1), PFOA (0.00002 mg kg-1 day-1), and PFBS (0.0003 mg kg-1 day-1) (USEPA, 2017; 2021). These RfDs have been utilized by several states to develop fish advisories based on PFAS concentrations measured in local fish. For instance, the Great Lakes Consortium has recommended dietary restrictions on fish containing greater than 10 µg kg-1 of PFOS in edible tissues (GLCFCA, 2019). More extensive research evaluating food and dietary exposures has been conducted mainly outside the United States including in Europe, Asia, and Canada. Fish and other seafoods were found to be the most important contributor to PFOA and PFOS exposure followed by eggs, meat and fruit (EFSA, 2020). In 2020, the European Food Safety Authority (EFSA) updated their 2018 guidance on PFAS levels in food and established new recommended total weekly intake (TWI) values of 4.4 ng kg-1 bw-1 (bw = body weight) per week for the sum of four PFAS compounds: PFOA, PFOS, PFNA, and PFHxS (EFSA, 2020).
Tampa Bay is Florida’s largest open-water estuary, inhabited by over 200 fish species, including dozens that support fisheries. The State of Florida is considered a prime recreational and commercial fishing destination resulting in $38 million in annual saltwater license sales and providing $14 billion in economic impact from both saltwater and freshwater recreational fishing (https://myfwc.com/conservation/value/saltwater-fishing/). Tampa Bay is a popular fishing destination for the four million state-wide anglers in Florida. There are various potential PFAS sources surrounding the Tampa Bay region including military installations, airports, and wastewater treatment plants. Thus, it is surprising there are currently no available data on PFAS levels in fish from this region, considering the popularity of fishing in this area.
The objectives of the present study were to: (1) determine if PFASs were present in sediments and edible tissues of fish collected in Tampa Bay, and (2) compare detectable levels of PFASs in the edible tissues of fishes to available consumption guidelines to estimate potential human health risks from fish consumption. Consequently, we expect this research will guide future research needs regarding PFAS contamination in Florida, and particularly focus attention on species presenting elevated risks for consumption. This information will assist resource managers in determining if fish consumption advisories should be considered in the Tampa Bay region.
2 Materials and methods
2.1 Site description
Tampa Bay is located on the central west coast of Florida and is the largest open water estuary in the state. The Bay has a surrounding watershed of 5,700 km2, covers a surface area of approximately 1,030 km2, with a mean depth of 3 m, and a maximum depth of 13.3 m. Tampa Bay consists of eight segments, Old Tampa Bay, Hillsborough Bay, McKay Bay, Middle Tampa Bay, Lower Tampa Bay, Manatee River, Terra Ceia Bay and Boca Ciega Bay (Figure 1) (Karlen et al., 2015). The greater Tampa Bay area is considered a humid subtropical climate with annual temperatures typically ranging from 11 to 32°C. The region’s human population in 2019 was estimated at 3.1 million with a 2% annual growth rate for the region which currently outpaces the national average (1.5% annual growth rate per year) (www.census.gov;usapopulation.org/tampa-population/). There are five major airports surrounding the region, a number of military bases, and wastewater treatment (mostly secondary) outfalls throughout the region producing ~ 242 thousand m3/day of effluent (www.tampa.gov/wastewater/info/advanced-wastewater-treatment-plant/facts-of-interest). Other potential sources of PFASs to the bay include fire-fighting training facilities, manufacturing urbanization with Hillsborough and Old Tampa Bay being the most urbanized, and the southeast portion of the Bay being more rural.
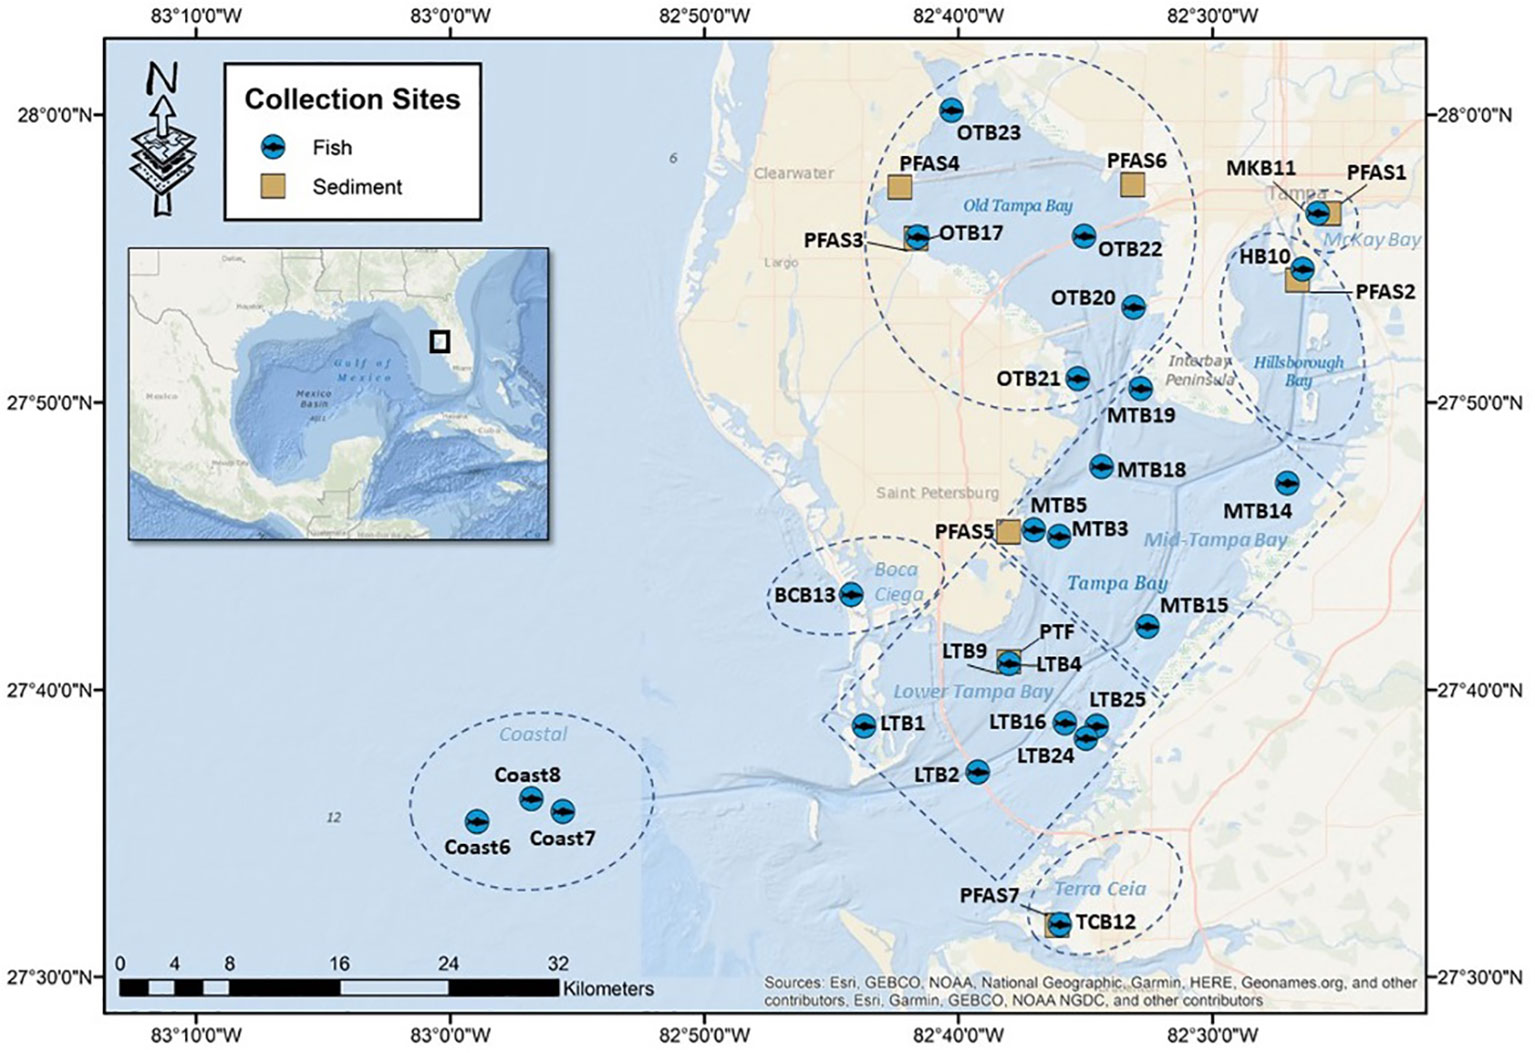
Figure 1 Sampling station numbers and locations for fish (●) and sediment (■) collections in Tampa Bay, FL, USA (2020-2021). Map was created using Esri ArcMap 10.8.1 with the base from Esri 2020 and its licensors.
2.2 Standards and reagents
Acetonitrile (ACN, Optima LC/MS grade), methanol (MeOH, Optima LC/MS grade), acetic acid (Optima LC/MS grade), formic acid 99% purity (Optima LC/MS grade) and ammonium hydroxide (ACS grade) were purchased from Fisher Scientific (Waltham, MA, USA). Water was purified through a Millipore water purification system (Bedford, MA, USA) with a 0.22 µm membrane filter and a specific resistance of 18 µΩ. Individual native compounds (chemical purities of > 98%), and mass-labelled internal and surrogate standards (chemical purities of > 98% and isotopic purities of ≥ 99%) were purchased through Wellington Laboratories (Guelf, ON, Canada).
2.3 Sediment collection, composition and extraction methodology
2.3.1 Sample collection
In 2020, sediments were collected from six segments of the Bay and focused on areas adjacent to airports and wastewater treatment plants (WWTP) throughout Tampa Bay. Specific site selections followed the Tampa Bay Benthic Monitoring Program which employs a stratified-random sampling strategy adopted from the EPA’s Environmental Monitoring and Assessment Program – Estuaries (EMAP-E) design (Karlen et al., 2015). Sediment samples were collected from seven sites in duplicate and one site in triplicate for a total of 17 sediment samples (Figure 1). Sediments were collected at each site using a Young-Modified Van Veen grab sampler aboard an aluminum cabin boat operated by the Environmental Protection Commission of Hillsborough County. The grab sampler and all sampling utensils were field cleaned with Alconox detergent, rinsed with ambient seawater and decontaminated with isopropyl alcohol prior to collections at each site. The grab sample was taken from a sediment depth of 15 cm, covering an area of 0.04 m2. Wearing gloves, the top layer (~2 cm) of sediment was removed from each grab using a stainless-steel spoon, placed in a stainless-steel beaker and homogenized by stirring. The homogenized surface sediments were then transferred to certified I-Chem high density polyethylene (HDPE) jars (Fisher Scientific, Waltham, MA, USA), immediately placed in a cooler on bagged ice for transport back to the laboratory for storage at -20°C until further analysis.
2.3.2 Sediment composition
Sediment composition was determined following the high-temperature combustion method (Standard Methods Committee of the American Public Health Association) and EPA 620/R-95/008 (Strobel et al., 1995) outlined in the Field and Laboratory Methods Manual for Tampa Bay National Estuary Program (Versar, 1993). Briefly, sand and clay particles were separated by wet-sieving through a 63 µm stainless steel sieve and weighed using standard procedures (Plumb, 1981). Approximately 45-50 g wet weight for predominantly sandy sediments or 20-25 g for predominantly silty sediments were used for the percent silt and clay composition analysis. The sediments were combined with 20ml of the dispersant solution (100 mg of hexametaphosphate) and 30 ml distilled water and stirred for 1-5 minutes using a small spatula to disperse sediment aggregates. The homogenized sample was wet sieved through a 63 µm sieve using the minimal amount of distilled water as possible. The retained fraction (>63 µm) was transferred to a pre-weighed glass beaker and dried at 100°C for 24 hrs. and then weighed. The<0.63 µm filtrate was transferred to a 1000 ml graduated cylinder and the volume was filled to the next highest 50 ml mark with distilled water and homogenized by stirring. A 40 ml subsample was transferred to a pre-weighed glass beaker with a volumetric pipette and dried at 100°C for 24 hrs., then weighed. Weighed samples were dried for an additional 24 hrs. and then reweighed as a check on the stability of the original measurement. Unused sediments from each sample were stored at 4°C for future QA/QC analysis. Total organic carbon was analyzed using a Shimadzu TOC-L Series SSM. Samples were filtered and dried overnight at 100°C then ground and dried again at 100°C and reground. A total of 600 mg of ground sediment was weighed (300 mg for both Total Carbon and Inorganic Carbon measurements). The total carbon fraction was combusted at 900°C for 10-15 minutes, and the inorganic carbon fraction was combusted at 250°C for 8-10 minutes.
2.3.3 Sediment extractions
Freeze dried sediment samples were extracted following the American Society for Testing and Materials (ASTM) 7968 method (ASTM, 2017). Briefly, two grams of freeze-dried sediments were added to a 15 mL polypropylene (PP) test tube (Fisher Scientific, Waltham, MA, USA) followed by 10 mL of 1:1 Millipore water:MeOH and adjusted to a pH of 9 – 10 using ammonium hydroxide. Samples were then vortexed, placed on a mechanical shaker at 400 rpm for one hour and centrifuged at 1,900 rpm for 10 minutes. The entire supernatant was then filtered into a clean 15 mL PP test tube using disposable polypropylene syringe with a 0.2 µm polypropylene filter with a regenerated cellulose membrane (Captiva, Agilent Technologies, Santa Clara, CA, USA). Following filtration, the extract pH was adjusted to 3.5 – 4.0 using acetic acid. An aliquot of each sample was transferred to a PP autosampler vial and sealed with a PP cap (Agilent Technologies, Santa Clara, CA, USA). Internal standards were added to the final extracts (1 mL) prior to injection.
2.4 Fish collections and extraction methodology
Twenty-four species of fish (Table 1) were collected onboard either chartered (2020) or Florida Fish and Wildlife Research Institute vessels (2021) using hook and line, baited traps, nets or 183 m center bag haul seines at 25 locations from seven segments of Tampa Bay near potential sources, such as airports, wastewater treatment plants and military installations (Figure 1). Biometrics of each fish were recorded in the field (Table S1), the animals then placed in polypropylene bags (ULINE, Pleasant Prairie, WI, USA) and stored in coolers on bagged ice for transport back to the laboratory. A total of 140 individual fish (n = 140) from 24 species were collected in Tampa Bay and analyzed for 25 target PFASs.
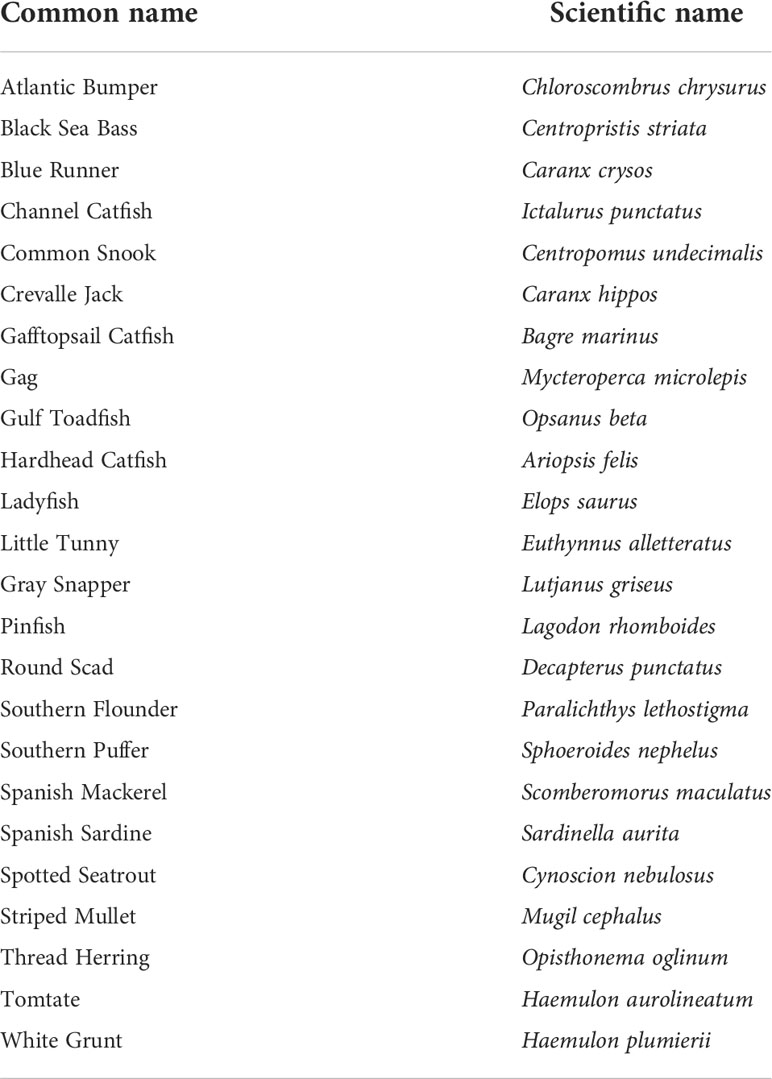
Table 1 Common and scientific names for the fish collected in Tampa Bay (2020-2021).
The extraction of fish tissue followed Pulster and Giardina (2022). Briefly, filets of muscle tissues from individual fish were excised using solvent rinsed knives, placed in amber jars and homogenized by finely mincing using solvent rinsed dissection scissors. Two grams of homogenized tissue was then placed in a 50 mL polypropylene test tube; surrogate standards were added and allowed to sit at room temperature for 15 minutes (Pulster and Giardina, 2022). A ceramic homogenizer and 2 mL of water with 1% formic acid was then added and homogenized for 2 min at 1500 rpm (1600 Mini G, SPEX SamplePrep), followed by 8 mL of cold ACN containing 2% formic acid and homogenized for an additional 5 min (1500 rpm) and then centrifuged for 5 minutes at 5,000 rpm. An aliquot of 2.4 mL of the extract supernatant was then transferred to a 3 mL Captiva EMR Lipid cartridge (Agilent Technologies, Santa Clara, CA, USA) and allowed to elute via gravity. Once the extract was no longer visible, 600 uL of 80:20 Acetonitrile (ACN):Millipore water was added and eluted by gravity until dry then vacuum was applied until completely dry. The extract was mixed, and then 500 µL of the clean extract was transferred to a polypropylene autosampler vial; internal standards were added, and 300 µL of water was added for a final extract volume of 800 µL.
2.5 Targeted PFAS analysis
Prior to analysis, the liquid chromatography tandem mass spectrometer (LC/MS/MS, Agilent 1290 Infinity II LC – 6470 MS/MS) was configured to reduce system background contamination (i.e., peek tubing and pump seals, inline filter and delay column) following industry recommendations (Anumol et al., 2017). The concentrations of 25 targeted PFAS (Table S2) were confirmed and quantified using liquid chromatography tandem mass spectrometry (LC/MS/MS) with a negative electrospray ionization (ESI) source (Agilent Jet Stream) and operating under the dynamic multiple reaction monitoring (dMRM) mode. Twenty microliters of sediment and fish extracts were injected at a flow rate of 300 µL min-1 and analyte separation was achieved using a Zorbax Eclipse Plus C18 column (2.1 mm x 100 mm, 1.8 µm, Agilent Technologies) with a gradient mobile phase consisting of 20 mM ammonium acetate in 95: 5 water: ACN (mobile phase A) and 10 mM ammonium acetate in 95: 5 ACN: water (mobile phase B; Table S3). A 14 min post-run time at 100% mobile phase A was incorporated to ensure full column equilibration. The LC/MS/MS instrument conditions and acquisition parameters are further detailed in Tables S4, S5. Four PFASs were not detected in any of the sediment samples and are reported as the total of 21 PFAS (T21PFAS) in dry weight (d.w.). PFEESA was not detected in any of the fish samples, therefore concentrations are reported as the total of 24 PFAS (T24PFAS) in wet weight (w.w.) for the fish muscle samples.
2.6 Human health risk assessment for fish consumption
The concentrations of four select PFAS in the edible muscle tissues of fish (all species combined) were used to estimate chronic and sub-chronic human health risks from seafood consumption in four sections of Tampa Bay: Old Tampa Bay, Hillsborough Bay, Mid-Tampa Bay, and Lower Tampa Bay. Boca Ciega, and Terra Ceia were not included due to the small sample sizes (n< 10). Chronic and sub-chronic human health risks were also assessed for the consumption of Striped Mullet (Mugil cephalus) collected in Old Tampa Bay. The 95% upper confidence limit (UCL, without non-detects) of PFAS concentrations measured in fish collected in Tampa Bay was determined using USEPA ProUCL software (V5.1). The 95% UCL concentrations were used to estimate weekly intake (EWI) and the estimated daily dose (EDD) for sub-chronic (3 meals/week) and chronic (7 meals/week) lifetime exposures from the consumption of PFAS contaminated fishes collected from Tampa Bay. Risks were assessed for various demographic characteristics, including age, gender, race, income, and region/coastal zone (USEPA, 2011b; 2014). Results for the risks by income and region/coastal are not included herein but can be found elsewhere (USF Digital Commons doi: 10.5038/y6w7cf53m9). Health risks were estimated for the four selected PFASs: PFOS, PFOA, PFNA, and PFHxS with detectable levels in edible tissues of fish and have available consumption advisories or thresholds (e.g., minimal risk level [MRL], TWI). The following formulas were used to calculate the estimated daily dose (EDD) and estimated weekly intake (EWI):
where, Cef is the 95% ProUCL concentration (mg g-1) in the edible fish filets of an individual PFAS, ingestion rate for the consumption of estuarine fish (IR, g day-1), exposure frequency (EF, days year-1), exposure duration (ED, years), body weight (BW, kg) and days over a lifetime to assume chronic exposure (LT, days). All exposure factors (IR, EF, ED, BW, LT) provided in Tables S6, S7 are the USEPA recommended values (USEPA, 2011b; 2014).
where, Cef is the 95% ProUCL concentration (ng g-1) in the edible fish filets of an individual PFAS, ingestion rates are the usual fish consumption rate (UFCR) estimates specifically for estuarine finfish (IR, g week-1) and body weight (BW, kg).
2.7 Quality assurance and quality control
A QA/QC program following the ASTM and EPA methodology (USEPA, 2011a; ASTM, 2017; Shoemaker and Tettenhorst, 2018) was implemented to ensure data quality. Surrogate recoveries and 25 target PFAS were quantified using a quadratic regression fit analysis of a five-point external calibration curve (10-fold dilution, 1 – 1000 ng L-1) (R2 = 0.9979 – 1.00; Table S5). Recoveries for the fish (M3PFBA: 101 ± 15%; M2PFOA: 92 ± 12%; M2PFDA: 114 ± 16%; M4PFOS: 113 ± 13%) and sediment (M3PFBA: 95 ± 14%; M2PFOA: 72 ± 9%; M2PFDA: 96 ± 15%; M4PFOS: 102 ± 17%) were within acceptable ranges. The method quantitation limit (MQL) was considered the lowest standard with all compounds resolved.
2.8 Data analysis
All statistical analyses were performed using JMP Pro Version 16.0.0 (SAS Institute Inc, 1989-2021) and MATLAB R2021a (The Mathworks, 1994-2022) with the Fathom Toolbox (Jones, 2017). Differences in mean PFAS concentrations in fish and sediments by Bay segment and species were assessed using a modified permutational multivariate analysis of variance (PERMANOVA) and pair-wise modified PERMANOVA with 1,000 iterations (Anderson et al., 2017). The level of significance was set at α = 0.05 and adjusted using the Bonferonni correction to protect against Type I errors. To evaluate associations between PFAS concentrations and biometric parameters, permutation-based Pearson’s correlations were calculated using biometrics and ∑PFAS or individual PFAS concentrations. The strength of relationships was considered very weak (r< 0.30), weak (r = 0.30 to 0.50), strong (r = 0.50 to 0.70), or very strong (r > 0.70).
3 Results
3.1 PFAS levels and patterns in sediments
The composition of sediment in Tampa Bay ranged from mud to medium grained sand; the TOC ranged from 0.2 to 12% (Table 2). Four of the target PFAS compounds (NaDONA, 3,6-OPFHpA, PFPeS and PFEESA) were not found in any of the sediment samples collected in Tampa Bay. Generally, the T21PFAS concentrations for sediment decreased in the Bay from northeast to southwest and ranged from 36.8 to 2,990 ng kg-1 (d.w.). Mean concentrations of the T21PFAS (Figure 2A) were highest in the sediments collected in Old Tampa Bay (1,000 ± 1,140 ng kg-1 d.w.) followed by Hillsborough Bay (982 ± 681 ng kg-1 d.w.), Mid-Tampa Bay (636 ± 371 ng kg-1 d.w.), Lower Tampa Bay (634 ± 296 ng kg-1 d.w.), McKay Bay (221 ± 8.22 ng kg-1 d.w.) and Terra Ceia Bay (78.7 ± 59.3 ng kg-1 d.w.). Concentrations varied by collection site within each of the Bay segments (Figure S1). The small sample sizes did not allow for statistically significant differences to be detected between segment locations in the Bay. In general, compositional profiles of the sediment (Figure 3) collected in four of the five Bay segments were dominated by PFOS (50 - 72%); however, profiles varied by station. For example, Terra Ceia Bay sediments collected at station PFAS7-2 were dominated by 6:2 FTS (87%). Significant, moderate (r = 0.40 - 0.60) to strong (r > 0.70) positive relationships were detected between some individual and T21PFAS concentrations and moisture content, total organic carbon, total carbon and grain size (Table 3).
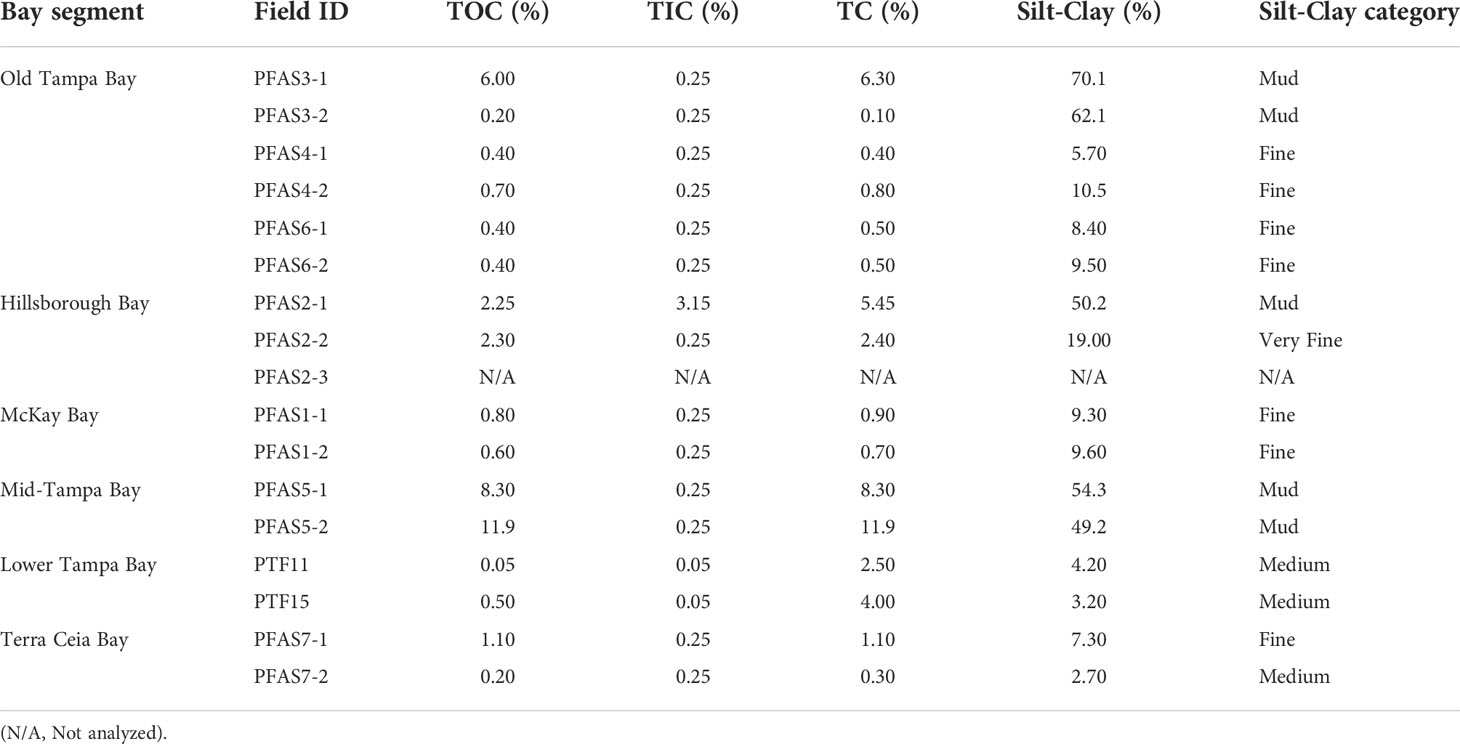
Table 2 The percent (%) composition of total organic carbon (TOC), total inorganic carbon (TIC), total carbon (TC) and silt-clay of sediment collected in various segments of Tampa Bay, 2020.
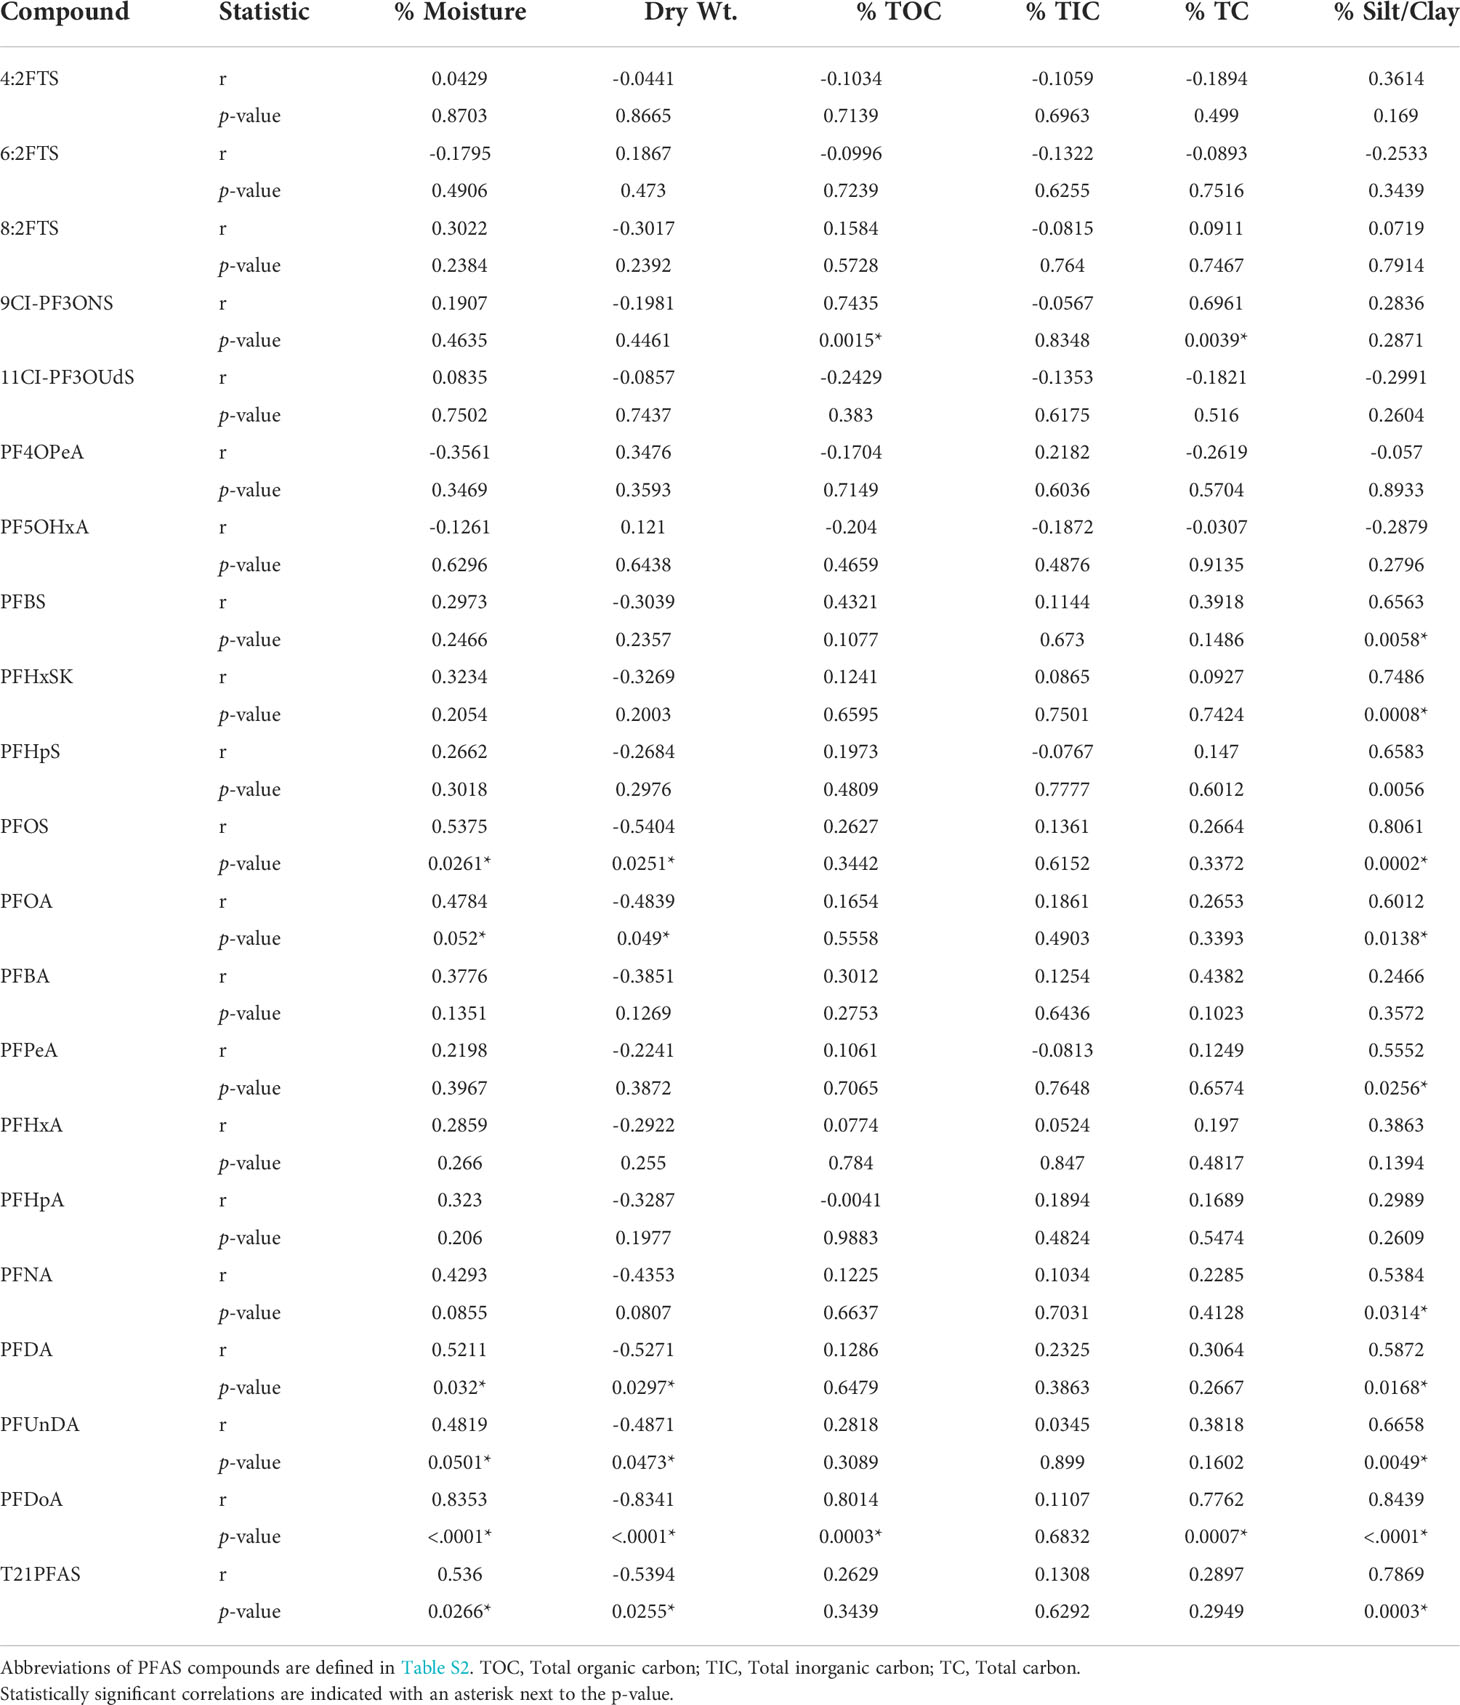
Table 3 Correlation coefficients (r), probability values (p-value) between PFAS and composition of sediments collected in Tampa Bay, FL, USA (2020).
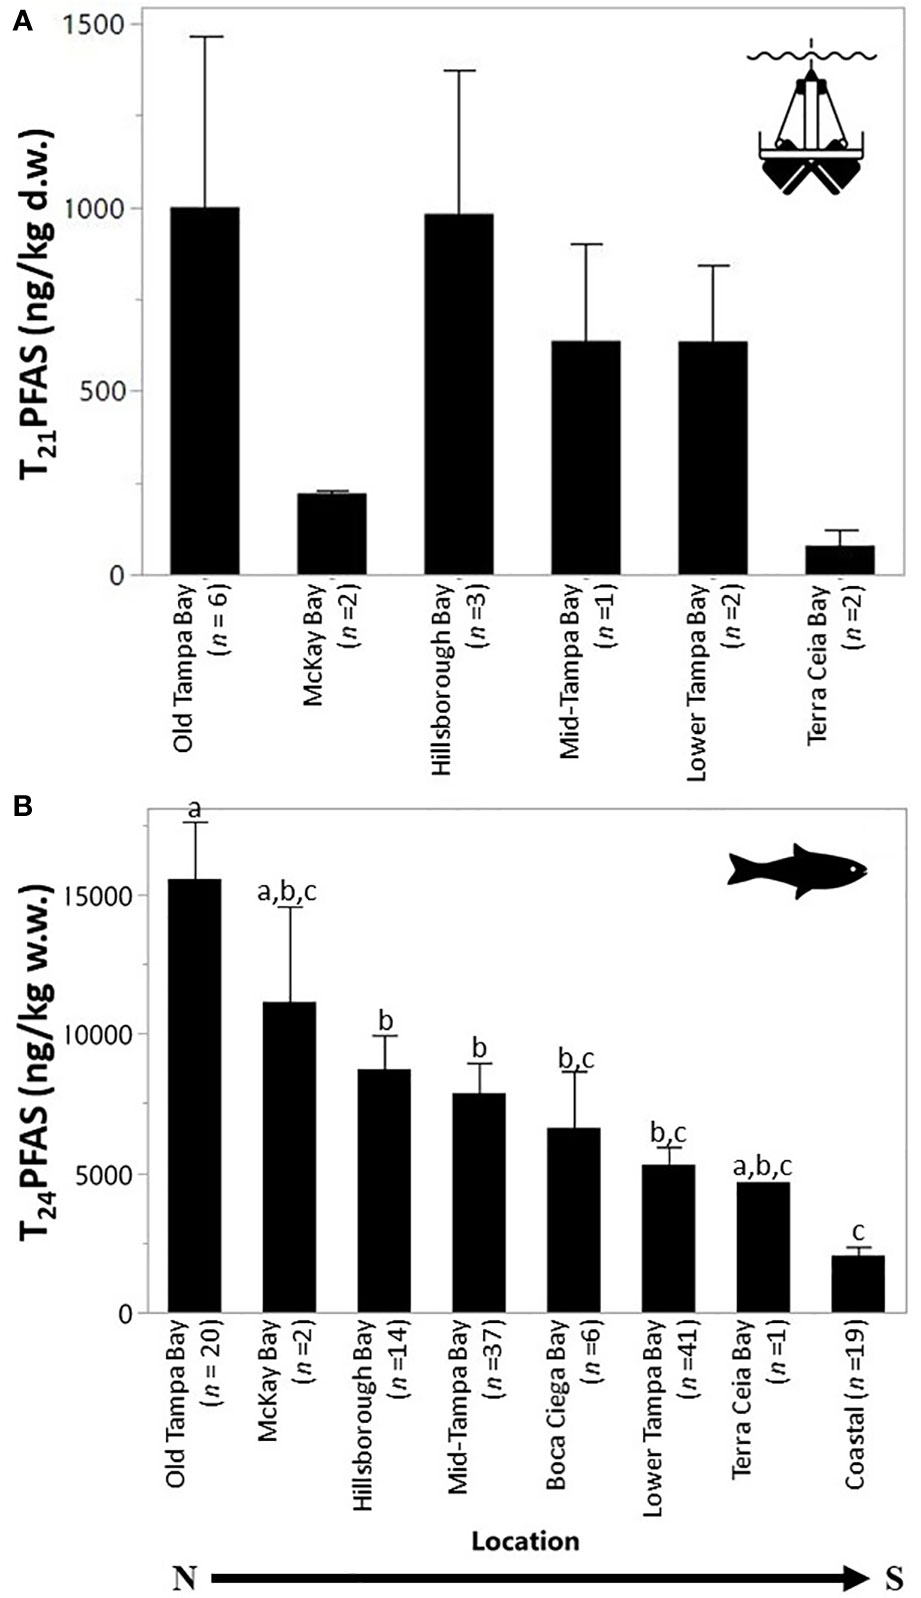
Figure 2 Total mean PFAS concentrations in sediment (A) and fish (B) collected by segments within Tampa Bay, FL, USA. Segments are ordered from north to south. Each error bar was constructed using 1 standard error from the mean. There were no significant differences between sediment concentrations throughout the Bay. Fish concentrations by segments not connected by the same letter are significantly different.
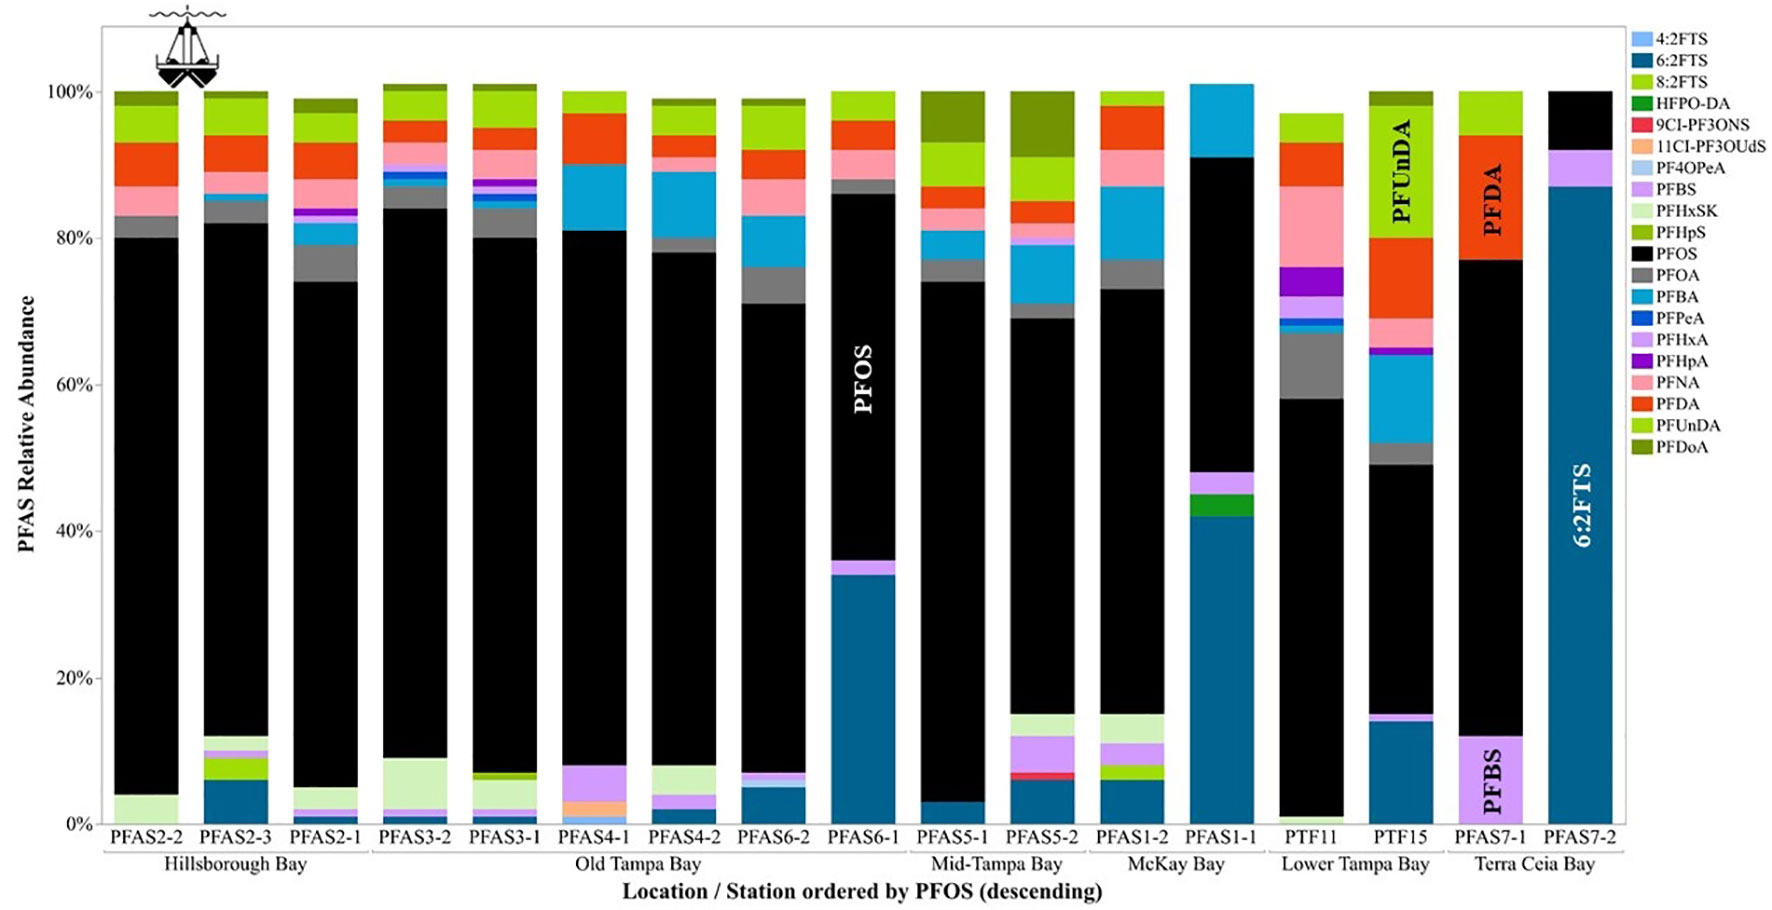
Figure 3 Profiles of PFAS in sediments collected at each site in Tampa Bay, FL, USA (2020). Abbreviations of PFAS compounds are defined in Table S2.
3.2 PFAS levels and patterns in edible muscle tissue of fish
Fish were collected from 24 locations throughout Tampa Bay during 2020 and early 2021. Muscle tissue from 140 individual fish from 24 species were analyzed for 25 target PFASs. Fish ranged from 13 to 69 cm in length and 0.03 to 3.7 kg in weight (Table S1). The T24PFAS in muscle tissue of fish collected in Tampa Bay ranged from 307 to 33,600 ng kg-1 (w.w.). Mean concentrations of T24PFAS (Figure 2B) were highest in edible muscle tissues collected in Old Tampa Bay (15,600 ± 9,240 ng kg-1 w.w.), followed by McKay Bay (11,100 ± 4,860 ng kg-1 w.w.), Hillsborough Bay (8,720 ± 4,570 ng kg-1 w.w.), Mid Tampa Bay (7,870 ± 6,600 ng kg-1 w.w.), Boca Ciega (6,620 ± 4,980 ng kg-1 w.w.), Lower Tampa Bay (5,300 ± 4,100 ng kg-1 w.w.), Terra Ceia Bay (4,670 ng kg-1 w.w.), and coastal areas (2,030 ± 1,390 ng kg-1 w.w.). These comparisons use all species combined due to limited samples sizes and the lack of similar species collected from all locations. This precluded the comparison of individual species across segments of the Bay, therefore, interpretive caution should be used. Levels of PFAS in fishes also varied by station location (Figure S2A). The highest concentrations of T24PFAS in muscle tissue of fish were found at stations OTB20, OTB17, MTB19, and OTB21. There were also species-specific differences observed in the mean total PFAS concentrations with the highest levels in the bottom dwelling (e.g., catfishes) and upper trophic level species (e.g., Crevalle Jack, Spotted Seatrout) (Figure S2B). Tomtate (655 ± 286 ng kg-1 w.w.) and Pinfish (1,640 ± 1,080 ng kg-1 w.w.) had the lowest mean concentrations PFASs. Like sediments, fish profiles were generally dominated by PFOS (68 ± 17%), with variation by station (Figure 4). Sample sizes and length classes were not sufficient to evaluate relationships for individual species. For all species combined, significant associations were observed between fish length and T24PFAS, PFHxS, PFHpS, PFOS, PFOA, PFNA, PFDA, PFUnDA, and PFDoA (Table S8). Elevated levels of PFOS in the edible tissues of some species require further research to determine effects of fish size and sex and if consumption advisories need to be considered.
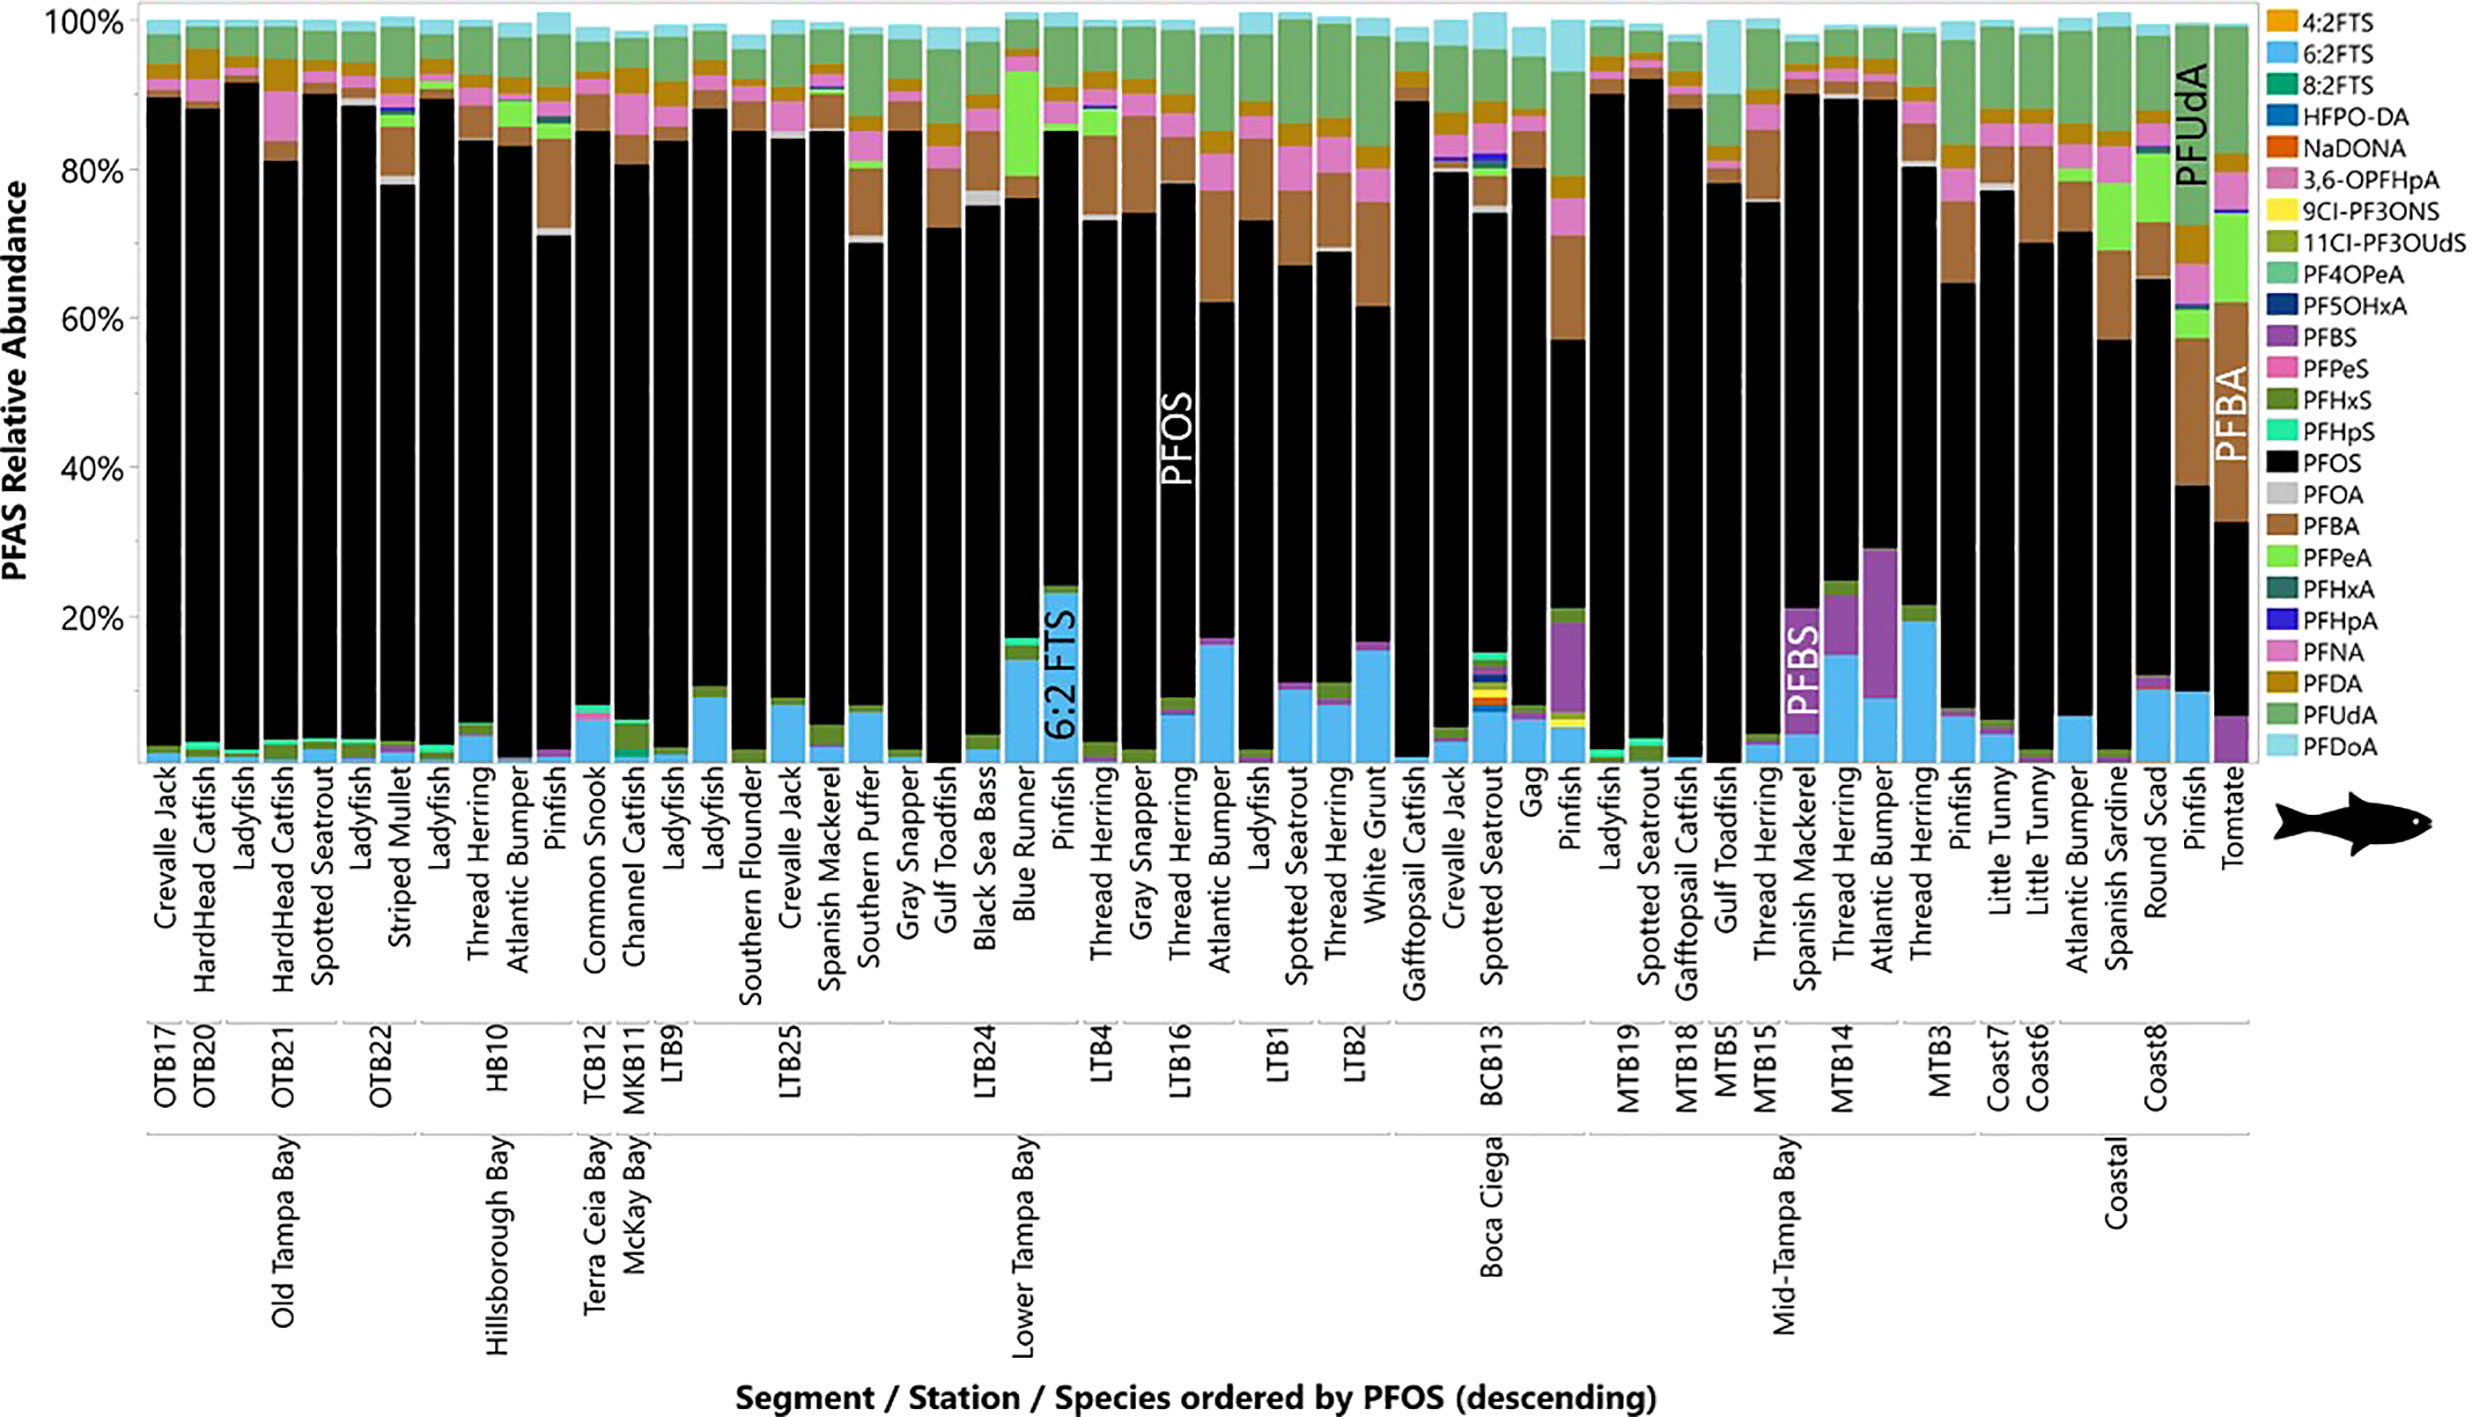
Figure 4 Profiles of PFAS in fish collected at each site in Tampa Bay, FL, USA (2020-2021). Abbreviations of PFAS compounds are defined in Table S1 and the fish scientific names can be found in Table 1.
3.3 Risk assessment
3.3.1 Sub-chronic and chronic exposures: Estimated daily dose
Assuming residents are consuming three meals per week consisting of fish collected from Old Tampa Bay, the EDDs for sub-chronic exposures of PFOS is either equal to or exceeds (by up to 3x) the recommended ATSDR MRL (0.000002 mg kg-1 day-1) (ATSDR, 2015) for all adult age, gender and race classes and exceeded the MRL by up to a factor of two for youth age classes (<11 years old) and race (black and other race; Figures 5, 6). For fish collected in Hillsborough Bay, the calculated sub-chronic EDDs were approaching, equal or exceeded the recommended MRL for adult males and several race and children between one and six years of age (Figures 5, 6). The EDDs for sub-chronic exposures from fish collected in Mid-Tampa Bay all exceeded the MRL for adults of other race (Figure 6). For youth of all age and race, the sub-chronic EDDs for PFOS exposure from fish collected in Lower and Mid-Tampa Bay were all below the recommended MRL (Figures 5, 6). The calculated daily dose for sub-chronic exposures of PFOA, PFNA, and PFHxS from fish collected in all segments of Tampa Bay were below the ATSDR derived MRLs by up to 3 orders of magnitude for youth and adults of all ages and race (Figures S3, S4). Additionally, the calculated daily doses for sub-chronic exposures of PFOS from the consumption of Striped Mullet only collected in Old Tampa Bay were also below the available MRL for PFOS, PFOA, PFNA, and PFHxS exposures for all youth and adult age and race classes (Figures S5, S6).
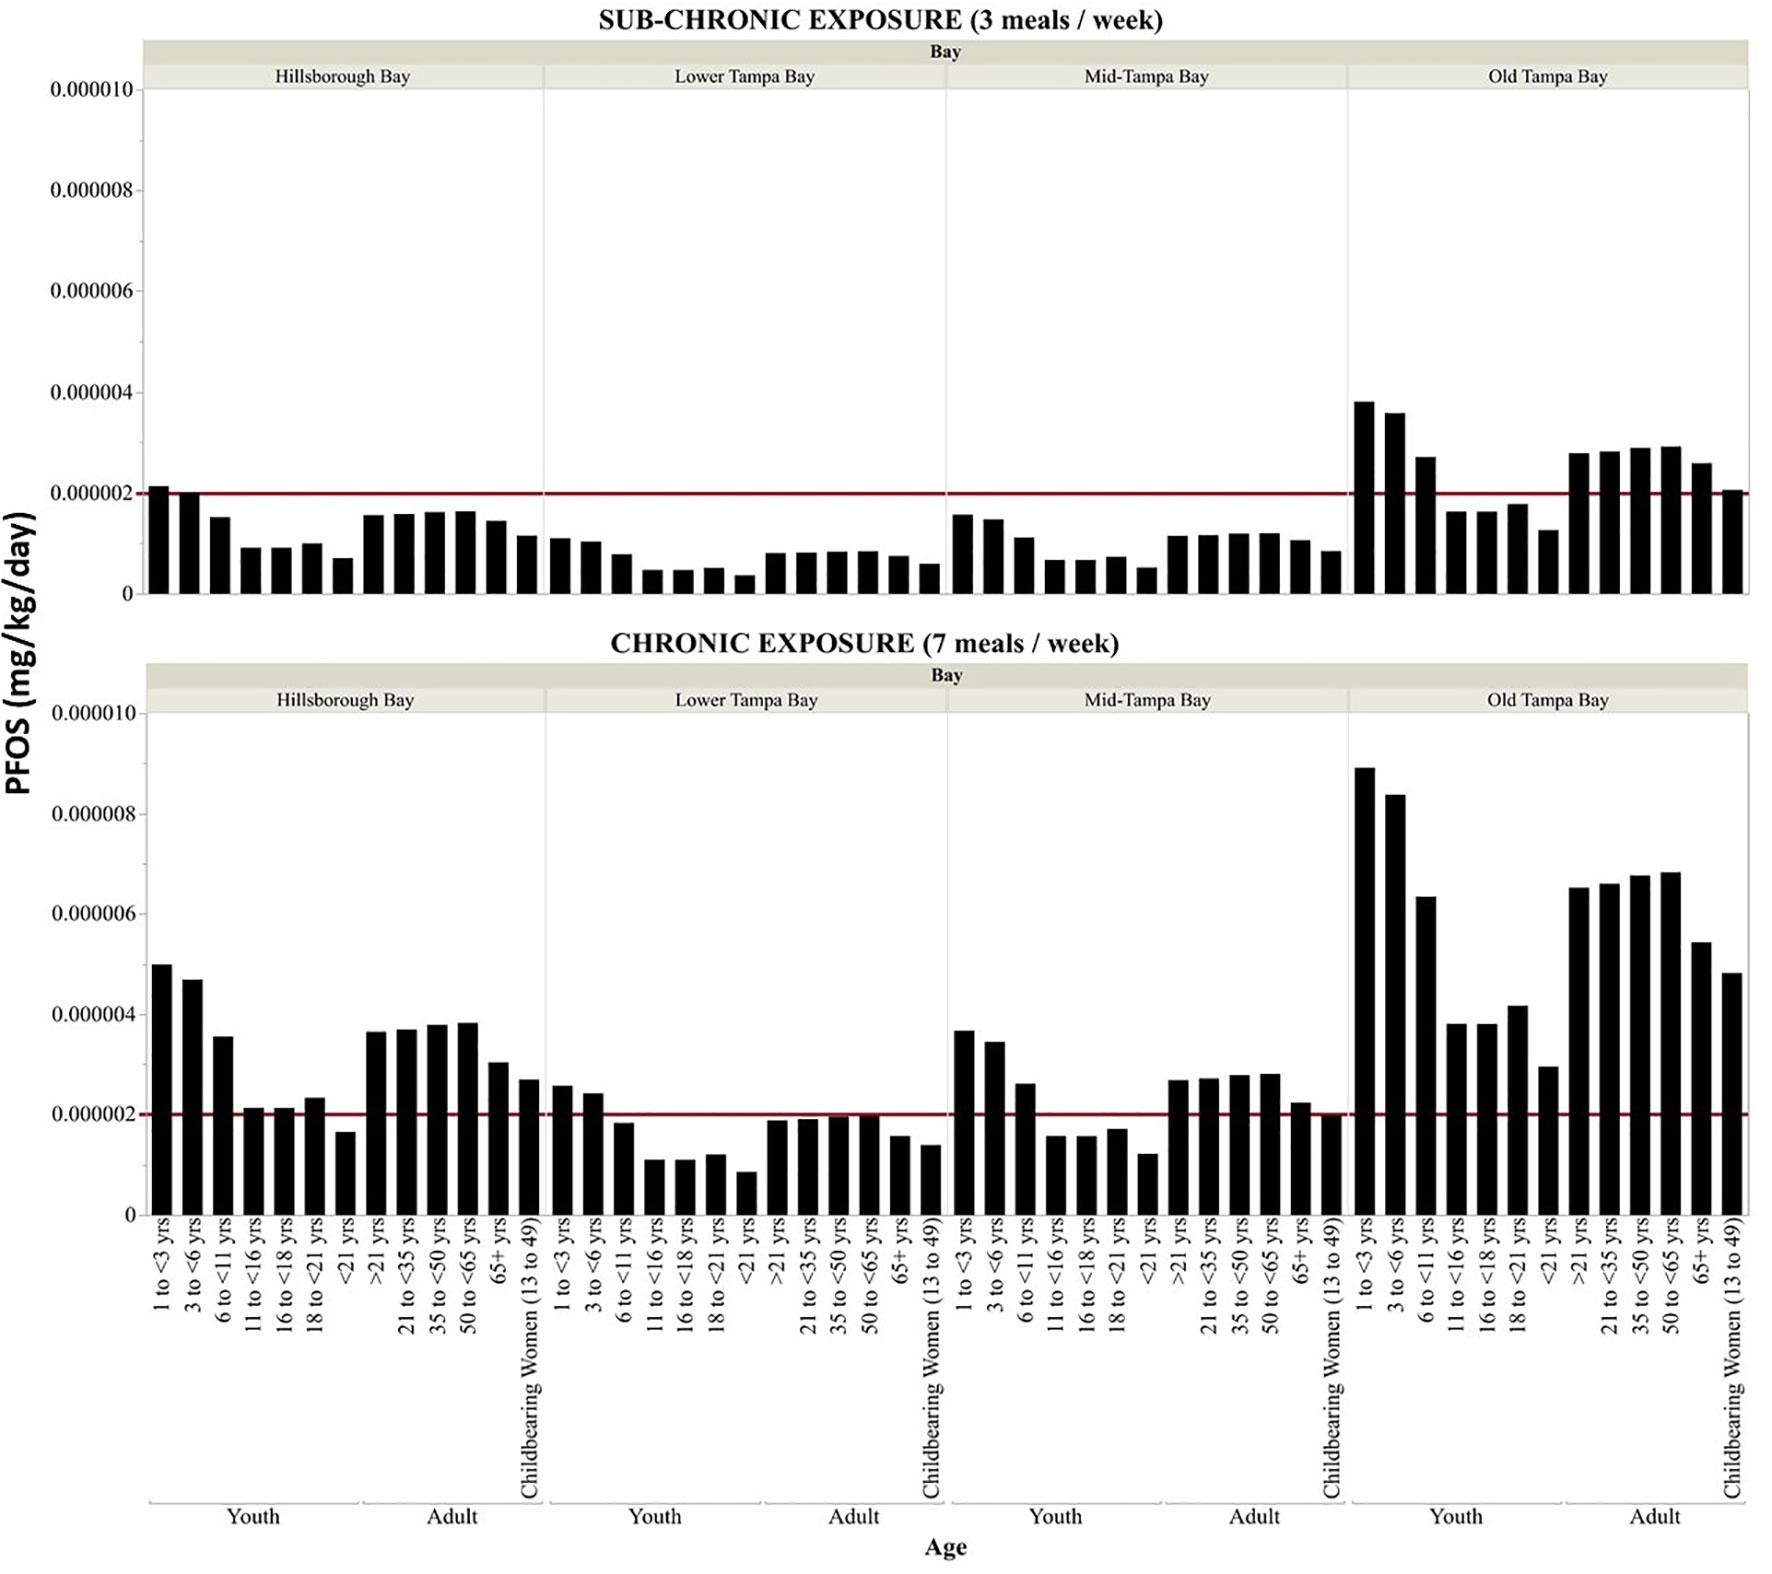
Figure 5 Sub-chronic and chronic estimated daily dose of PFOS (mg kg-1 day-1) by age for the consumption of fish collected from each of the segments of Tampa Bay. The red line is the PFOS MRL (0.000002 mg kg-1 day-1) derived by the ATSDR (2015).
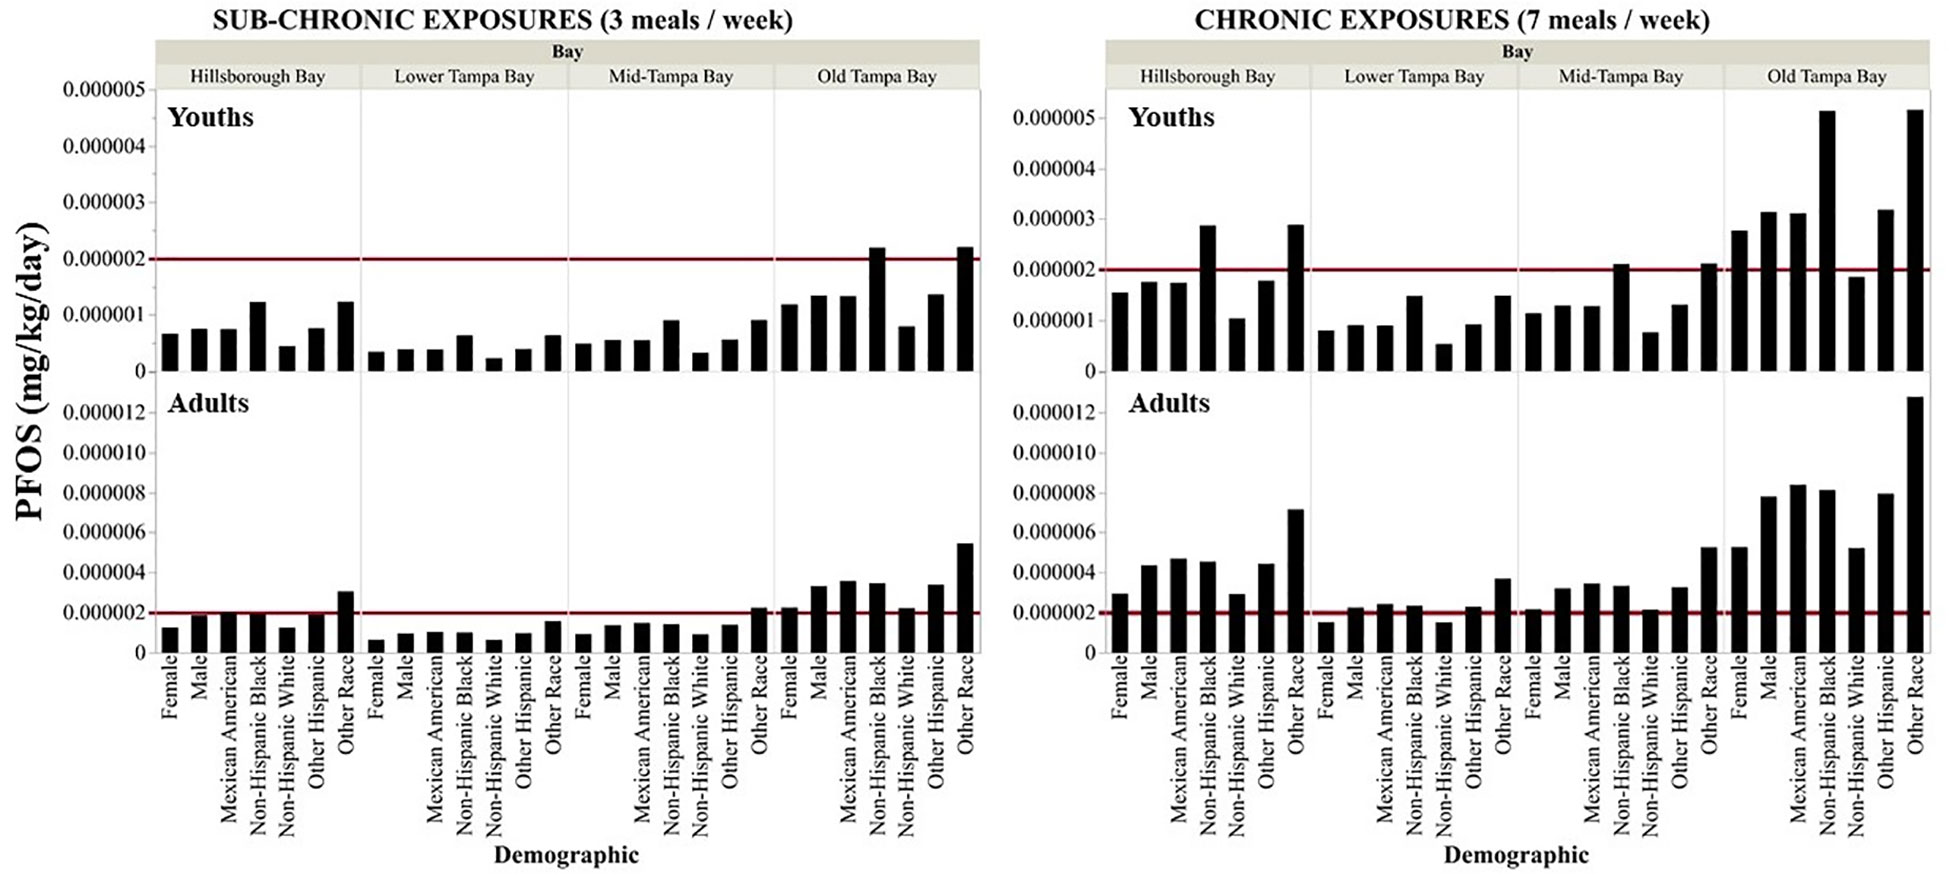
Figure 6 Sub-chronic and chronic estimated daily dose of PFOS (mg kg-1 day-1) by gender and race for youths (top panels) and adults (bottom panels) for consuming fish collected from each of the segments of Tampa Bay. The red line is the PFOS MRL (0.000002 mg kg-1 day-1) derived by the ATSDR (2015).
The EDDs for chronic exposures of PFOS, assuming seven meals per week consisting of fish collected in all four Bay segments evaluated were either approaching or up to six times higher than the derived ATSDR MRL for all adult demographics (age, race, gender, Figures 5, 6). Chronic exposures of PFOS in youth of all ages and race (except non-Hispanic white) from the consumption of fish collected in Old Tampa Bay were three times higher than the recommended MRL (Figures 5, 6). MRLs were also exceeded for youth (all ages, black or other race) consuming fish collected in Hillsborough Bay. In Mid-Tampa Bay, the MRLs were exceeded for chronic PFOS exposures for certain youth age classes (<11 years old) and race (black) whereas the MRLs were only exceeded for youth less than six years of age from fish collected in Lower Tampa Bay. For PFOA, PFNA, and PFHxS the calculated daily dose for chronic exposures from the consumption of fish collected in all segments of Tampa Bay were as much as three orders of magnitude below the ATSDR derived MRLs for all youth and adult demographics (Figures S7, S8). The calculated daily dose for chronic PFOS exposure from consuming just Striped Mullet collected in Old Tampa Bay was approaching the MRL for youths less than six years of age and exceeded the derived MRL for other race adults and was approaching the derived MRL for several other demographic classes of adults (Figures S5, S6). The calculated daily dose for chronic exposures of PFOA, PFNA, and PFHxS from the consumption of Striped Mullet collected in Old Tampa Bay were all below the ATSDR derived MRLs (Figure S5, S6).
3.3.2 Estimated weekly intake
The EWIs for the combined exposures of PFOS, PFOA, PFNA, and PFHxS from the consumption of fish (all species combined) collected in all segments of Tampa Bay exceeded the EFSA TWI derived for food (4.4 ng kg-1 bw) for all demographics of youths and adults (Figure S9). Adults of other race and youth less than three years old had the highest EWIs in all segments of Tampa Bay. For adults of other race, the EWIs were 7.5, 10, 13, and 24 times higher than the EFSA guidelines in Lower Tampa Bay, Mid-Tampa Bay, Hillsborough, and Old Tampa Bay, respectively. For youth less than three years of age, the EWIs were five, seven, nine, and 17 times higher than the recommended TWIs in Lower Tampa Bay, Mid-Tampa Bay, Hillsborough, and Old Tampa Bay, respectively. Additionally, the EWIs for the exposures of PFOS, PFOA, PFNA, and PFHxS from the consumption of Striped Mullet collected only from Old Tampa Bay also exceeded the EFSA derived TWI for all demographics of youths and adults (Figure 7). The EWIs for youths less than three years and adults of other race consuming Striped Mullet from Old Tampa Bay were a factor of seven and 10 times higher, respectively, than the EFSA TWI guidelines.
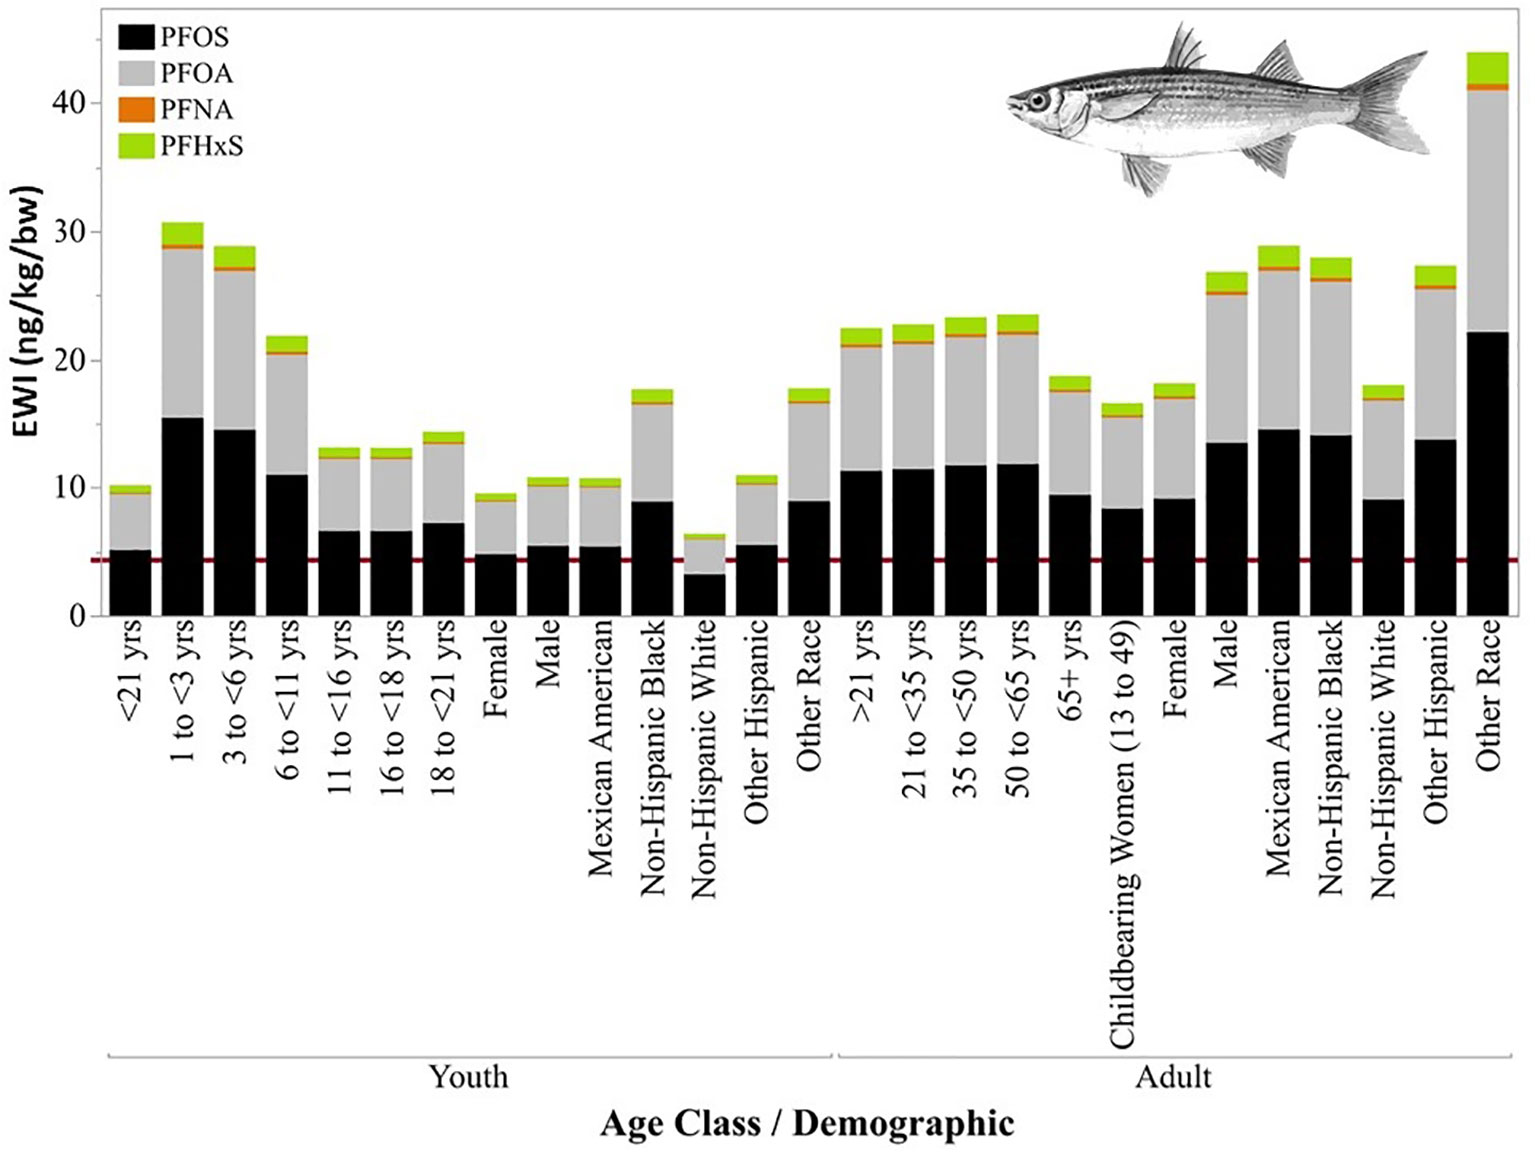
Figure 7 Calculated estimated weekly intake (EWI, ng kg-1bw-1) for youths (A) and adults (B) based on concentrations measured in edible tissues from Striped Mullet (Mugil cephalus) collected in Tampa Bay, 2020-2021. The red line indicates the TWI derived value (4.4 ng kg-1 bw-1) by the European Food Safety Authority (EFSA, 2020).
3.3.3 Consumption advisories
Concentrations of PFOS in edible tissues of fish collected in Tampa Bay ranged from 0.92 to 30.1 ng g-1 (w.w.). These measured concentrations of PFOS were compared to consumption advisories issued in the State of Michigan (Figure 8). Recreationally important species such as Crevalle Jack, Spotted Seatrout, Gray Snapper, and Spanish Mackerel have PFOS levels that may indicate the need to consider fish advisories in Tampa Bay as they are close to or exceed similar advisories elsewhere.
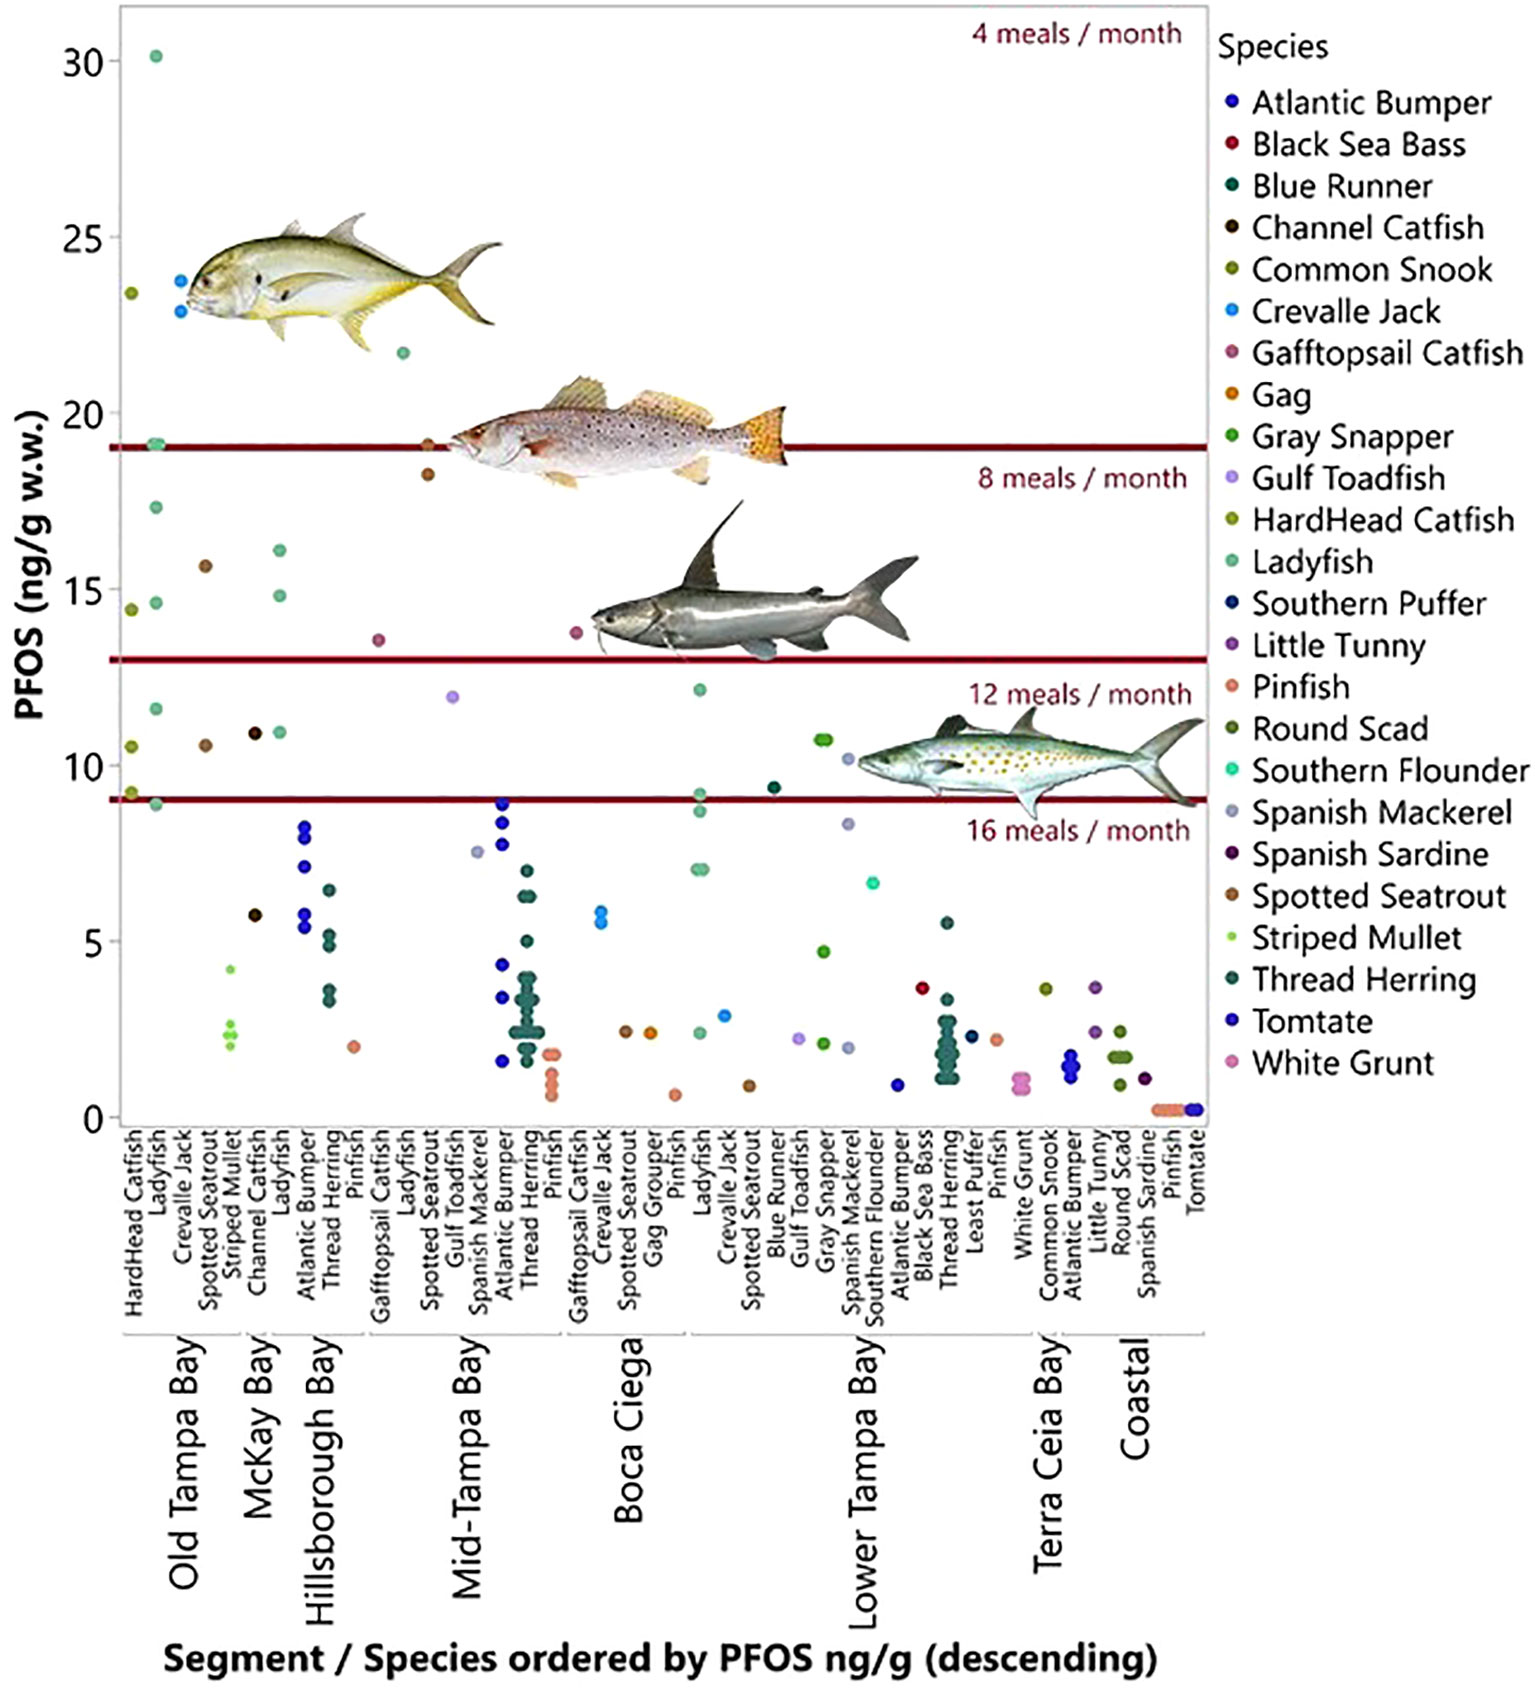
Figure 8 Measured levels of PFOS (ng g-1 w.w.) in the edible muscle tissues of various species of fish collected in Tampa Bay. Red horizontal lines are the consumption advisories issued in the State of Michigan.
4 Discussion
Sediments and fish were collected in the urbanized Tampa Bay estuary system to assess PFAS levels and potential human health risks from consumption of contaminated fishes. In general, PFAS concentrations in both sediment and fish were highest in Old Tampa Bay and Hillsborough Bay and decreased southeastward towards the Gulf of Mexico. Sediment concentrations differed between sites within a segment. For instance, the highest mean concentrations of T21PFAS in sediments collected from Old Tampa Bay were measured at the mouth of the Cross Bayou inlet (PFAS3; 2,360 ± 891 ng kg-1 d.w.). There are a number of industries and military installations located on the peninsula bordering this inlet that may be contributing to these levels, including wastewater treatment plant outfalls, civilian and military airports and other military facilities. The second highest mean sediment concentrations by site were collected near wastewater treatment discharge outfall in Hillsborough Bay (PFAS2; 980 ± 680 ng kg-1 d.w.). However, there are a number of other industries and container loading facilities in the direct vicinity. Sediments collected near wastewater treatment plants (PFAS7-2), airports (PFAS6-1), fire-fighting training facilities and waste incinerators (PFAS1-1) had elevated levels of 6:2FTS, an alternative to PFOS and PFOA that is widely used as a co-formulant in AFFFs and as a chrome mist suppressant in the electroplating industry. Measured PFAS in sediments collected in Tampa Bay (T21PFAS 0.037 – 2.99 ng g-1 d.w.) were similar to sediments collected in the Seine River, France (∑PFAS 0.78 – 6.7 ng g-1 d.w.) (Macorps et al., 2022), and Korean river and lake systems (∑PFAS 0.03 – 1.09 ng g-1 d.w.) (Lam et al., 2014). Furthermore, Tampa Bay sediments were as much as 30 times lower than sediments collected in the Great Lakes (Codling et al., 2018) and 25 times lower than AFFF impacted sediments (0.8 – 76 ng g-1 d.w.) collected in Sweden (Mussabek et al., 2019).
Elevated concentrations of T24PFAS in muscle tissue of fish were located at stations near a major thoroughfare (Gandy Bridge OTB20), the Cross Bayou inlet (OTB17), a military facility (MTB19), and at the mouth of Old Tampa Bay adjacent to Weedon Island Preserve (OTB21). Profiles in the edible tissues of fish were mainly dominated by PFOS however, fish collected adjacent to the TECO Big Bend Power Station (MTB15) had elevated levels of PFBS. PFBS is considered a replacement compound for PFOS-related compounds and can be directly released into the environment as PFBS or can be a final degradation product of perfluorobutane sulfonyl fluoride (PBSF)-based surfactants. Fish collected near a wastewater treatment plant in Boca Ciega Bay (BCB13) had elevated levels of other PFAS replacement compounds such as Gen-X (HFPO-DA), NaDONA, and F53B (9Cl-PF3ONS, 11Cl-PF3OUdS). The range of total PFAS measured in Tampa Bay fish (T24PFAS 0.31 – 33.6 ng g-1 w.w.) were similar to the edible tissues of fish collected in the Seine River (∑PFAS 0.22 – 3.8 ng g-1 w.w.), Great Lakes (0.09 – 90.7 ng g-1 w.w.), Lake Vättern (PFAS<MDL – 23.1 ng g-1 w.w.), and the Baltic Sea (<MDL - 3.34 ng g-1 w.w.) (Berger et al., 2009; Point et al., 2021; Macorps et al., 2022). However, PFOS levels in edible fish tissues collected in the Great Lakes region (2.40 – 206 ng g-1 w.w.) (Point et al., 2021) were up to seven times higher than those reported in Tampa Bay fishes (0.92 – 30.1 ng g-1 w.w.).
Concentration ratios of PFOS to long-chain PFCAs (PFOS/∑LC-PFCA) of > 1 have been used as a proxy for direct water emission sources, while a ratio of< 1 indicate atmospheric PFAS sources (Ali et al., 2021; Valsecchi et al., 2021). In this study, the mean PFOS/∑LC-PFCA ratios in edible tissues of fish (5.7 ± 3.1) and sediments (3.4 ± 1.6) indicate the presence of local contamination sources (e.g., wastewater treatment plant, military installations, airports, etc.) in Tampa Bay.
Potential human health risks of PFAS (PFOS, PFOA, PFNA, and PFHxS) exposures from the consumption of contaminated fish collected in Tampa Bay were estimated. Estimated daily doses of PFOS and estimated weekly intake values exceeded available concentration thresholds (MRLs, TWIs) for adult and youth demographics. Exceedances of thresholds (MRLs and TWIs) were highest in Old Tampa Bay and Hillsborough Bay and decreased southward towards the Gulf of Mexico. Available thresholds were also exceeded for the consumption of Striped Mullet only for adult and youth demographics. PFASs measured in Striped Mullet were lower than other recreationally important species (e.g., Spotted Seatrout, Spanish Mackerel, Crevalle Jack) collected in Tampa Bay, yet the sample sizes for species other than Striped Mullet did not allow for the assessment of dietary risks. Hepatic, immune, and developmental endpoints were the most sensitive targets in laboratory animals exposed to PFOS and PFOA (ATSDR, 2015). The most sensitive targets were hepatic and thyroid endpoints for PFHxS and developmental endpoints for PFNA (ATSDR, 2015). Minimal risk levels (MRLs) are used as an estimate of daily human exposure to a hazardous substance that is likely to be without appreciable risk of adverse non-cancer health effects. These are strictly used as screening levels and do not define action or remediation levels. The EFSA derived TWI is expected to be protective for potential critical endpoints (increase in serum cholesterol, reduced birth weight and high serum levels of ALT). It should also be noted the estimates were based on the assumption that populations are consuming three or seven meals a week of fish collected from Tampa Bay. Although these may not be accurate estimations for the wider population, the risk assessment conducted herein suggests these may be applicable estimations for those populations’ subsistence fishing in Tampa Bay.
Concentrations of PFOS in edible fish tissues of several recreationally important species (e.g., Spotted Seatrout) collected in Tampa Bay also exceeded consumption guidelines issued in Michigan and other states in the Great Lakes Region. A number of other states (AL, CT, IN, MA, ME, MN, NJ, NY, OR) have also issued consumption advisories (1 meal/week) for the general population for fish with PFOS levels ranging from ≤ 3.5 to 200 ng g-1. More restrictive consumption advisories have also been issued sensitive populations in several states (≤ 1.56 to 34 ng PFOS g-1 = one meal/week). Additionally, ‘do not eat’ advisories have been issued for PFOS levels ranging from 17 – 800 ppb. The concentration of PFOS used to issue advisories span three orders of magnitude and incorporate different criteria, making it difficult to assess the need for consumption restrictions from state to state. The concentrations of PFOS measured in edible fillets in this study (range: 0.09 to 30 ng g-1; mean: 5.69 ng g-1) exceed many of the consumption advisories (4 to 16 meals per month) issued by various states. Additionally, the exceedances of the derived ATSDR MRL and EFSA TWI in Tampa Bay may indicate a need for consumption advisories for certain demographics, recreationally important species, and areas of the Bay (e.g.,< three meals per week) (ATSDR, 2015; EFSA, 2020).
This study was initiated as a first-level surveillance survey to understand the scale and extent of PFAS pollution in sediments and across a range of fish species. Because sample sizes of each species sampled were relatively low, caution should be used in interpreting the results from any one species. Furthermore, because not every species was sampled in every Bay segment, and there were species related differences in contamination levels, these factors may confound clear interpretation of species and location-related differences. Nevertheless, our study found significant PFAS-related pollution in Bay sediments and fishes that should stimulate additional more intensive studies to resolve these issues. Expanding the research in Tampa Bay to include larger sample sizes and additional recreationally important species would be beneficial. This information will more accurately estimate exposure risks based on species-specific consumption. Nevertheless, the elevated levels in fish from this study and their exceedances of available MRLs, TWIs, and current consumption advisories issued in other states will help to inform state resource managers of environmental levels of PFAS in Tampa Bay and aid in the consideration of consumption advisories in this region.
Data availability statement
The datasets presented in this study can be found in online repositories. The names of the repository/repositories and accession number(s) can be found at The University of South Florida Libraries Digital Commons (doi: 10.5038/y6w7cf53m9).
Ethics statement
The animal study was reviewed and approved by University of South Florida Institutional Animal Care & Use Committee (Protocol #W IS00008294).
Author contributions
EP performed all analytical and data analysis and generated the original manuscript draft with contributions from all authors. EP, KR, SG, TA, BG, KC, and SAM all assisted with sample collections. SM was responsible for characterizing sediment compositions. SAM and EP conceived and completed the study design. All authors contributed to the article and approved the submitted version.
Funding
Funding was provided by Tampa Bay Environmental Restoration Fund (Grant #12394, Award 2500-1775-00).
Acknowledgments
We thank the staff of Tampa Bay Environmental Research Fund (TBERF) for their support and assistance with site selections. We extend our gratitude to Matthew Giardina at Agilent Technologies for his assistance with method optimization. We thank the captain and crew of the R/V Misty Dawn and the Florida Fish and Wildlife ResearchInstitute for assisting with sample collections. Any use of trade, firm, or product names is for descriptive purposes only and does not imply endorsement by the U.S. Government.
Conflict of interest
The authors declare that the research was conducted in the absence of any commercial or financial relationships that could be construed as a potential conflict of interest.
Publisher’s note
All claims expressed in this article are solely those of the authors and do not necessarily represent those of their affiliated organizations, or those of the publisher, the editors and the reviewers. Any product that may be evaluated in this article, or claim that may be made by its manufacturer, is not guaranteed or endorsed by the publisher.
Supplementary material
The Supplementary Material for this article can be found online at: https://www.frontiersin.org/articles/10.3389/fmars.2022.1046667/full#supplementary-material
References
3M (2021) PFAS history. Available at: https://www.3m.com/3M/en_US/pfas-stewardship-us/pfas-history/ (Accessed 2021).
Ali A. M., Sanden M., Higgins C. P., Hale S. E., Alarif W. M., Al-Lihaibi S. S., et al. (2021). Legacy and emerging per- and polyfluorinated alkyl substances (PFASs) in sediment and edible fish from the Eastern red Sea. Environ. pollut. 280, 116935. doi: 10.1016/j.envpol.2021.116935
Anderson M. J., Walsh D. C. I., Robert Clarke K., Gorley R. N., Guerra-Castro E. (2017). Some solutions to the multivariate behrens–Fisher problem for dissimilarity-based analyses. Aust. New Z. J. Stat 59, 57–79. doi: 10.1111/anzs.12176
Anumol T., Mohsin S. B., Woodman M., Abrahamsson P. (2017). Recommended plumbing configurations for reduction in per/polyfluoroalkyl substance background with agilent 1260/1290 infinity (II) LC systems (USA: Agilent Technologies, Inc).
ASTM (2017). Standard test method for determination of per- and polyfluoroalkyl substances in water, sludge, influent, effluent and wastewater by liquid chromatography tandem mass spectrometry (LC/MS/MS) (D7979-17) (American Society for Testing and Materials).
ATSDR (2015). Draft toxicological profile for perfluoroalkyls (Atlanta, GA: Center for Disease Control and Prevention).
ATSDR (2018). “Toxicological profile for perfluoroalkyls: Draft for public comment,” in Division of toxicology and human health sciences. Ed. E.T.B (Atlanta, GA: Agency for Toxic Substances and Disease Registry).
. “5310 TOTAL ORGANIC CARBON (TOC),” in Standard methods for the examination of water and wastewater. doi: 10.2105/SMWW.2882.104
Berger U., Glynn A., Holmström K. E., Berglund M., Ankarberg E. H., Törnkvist A. (2009). Fish consumption as a source of human exposure to perfluorinated alkyl substances in Sweden – analysis of edible fish from lake vättern and the Baltic Sea. Chemosphere 76, 799–804. doi: 10.1016/j.chemosphere.2009.04.044
Buck R. C., Franklin J., Berger U., Conder J. M., Cousins I. T., Voogt P. D., et al. (2011). Perfluoroalkyl and polyfluoroalkyl substances in the environment: Terminology, classification, and origins. Integr. Environ. Assess. Manage. 7, 513–541. doi: 10.1002/ieam.258
Carnero A. R., Lestido-Cardama A., Loureiro P. V., Barbosa-Pereira L., De Quiros A. R. B., Sendon R. (2021). Presence of perfluoroalkyl and polyfluoroalkyl substances (PFAS) in food contact materials (FCM) and its migration to food. Foods 10(7), 1443. doi: 10.3390/foods10071443
Codling G., Sturchio N. C., Rockne K. J., Li A., Peng H., Tse T. J., et al. (2018). Spatial and temporal trends in poly- and per-fluorinated compounds in the laurentian great lakes Erie, Ontario and st. clair. Environ. pollut. 237, 396–405. doi: 10.1016/j.envpol.2018.02.013
Cordner A., de la Rosa V. Y., Schaider L. A., Rudel R. A., Richter L., Brown P. (2019). Guideline levels for PFOA and PFOS in drinking water: the role of scientific uncertainty, risk assessment decisions, and social factors. J. Expo. Sci. Environ. Epidemiol. 29, 157–171. doi: 10.1038/s41370-018-0099-9
Curtzwiler G. W., Silva P., Hall A., Ivey A., Vorst K. (2021). Significance of perfluoroalkyl substances (PFAS) in food packaging. Integr. Environ. Assess. Manage. 17, 7–12. doi: 10.1002/ieam.4346
EFSA (2020). Risk to human health related to the presence of perfluoroalkyl substances in food. EFSA J. 18, 391. doi: 10.2903/j.efsa.2020.6223
Fiedler H., Sadia M., Baabish A., Sobhanei S. (2022). Perfluoroalkane substances in national samples from global monitoring plan projects, (2017-2019). Chemosphere 307, 136038. doi: 10.1016/j.chemosphere.2022.136038
Great Lakes Consortium for Fish Consumption Advisories (GLCFCA) (2019). “Best practice for perfluorooctane sulfonate (PFOS) guidelines,” in Gulf lakes consortium for fish consumption advisories. Available at: https://www.health.state.mn.us/communities/environment/fish/docs/consortium/bestpracticepfos.pdf.
IARC (2017). “IARC monographs on the evaluation of carcinogenic risks to humans,” in Some chemicals used as solvents and in polymer manufacture. Ed. I.a.F.R.O.C. (IARC) (Lyon, France: World Health Organization).
Jones D. L. (2017). Fathom toolbox for MATLAB: Software for multivariate ecological and oceanographic data analysis (St. Petersburg, FL: University of South Florida, College of Marine Science). Available at: www.marine.usf.edu/research/matlab-resources/.
Karlen D. J., Dix T. L., Goetting B. K., Markham S. E., Campbell K. W., Jernigan J. M. (2015). Twenty-year trends in the benthic community and sediment quality of Tampa bay 1993-2012 (Tampa, FL: Tampa Bay Estuary Program).
Lam N.-H., Cho C.-R., Lee J.-S., Soh H.-Y., Lee B.-C., Lee J.-A., et al. (2014). Perfluorinated alkyl substances in water, sediment, plankton and fish from Korean rivers and lakes: A nationwide survey. Sci. Total Environ. 491-492, 154–162. doi: 10.1016/j.scitotenv.2014.01.045
Macorps N., Le Menach K., Pardon P., Guérin-Rechdaoui S., Rocher V., Budzinski H., et al. (2022). Bioaccumulation of per- and polyfluoroalkyl substance in fish from an urban river: Occurrence, patterns and investigation of potential ecological drivers. Environ. pollut. 303, 119165. doi: 10.1016/j.envpol.2022.119165
Mussabek D., Ahrens L., Persson K. M., Berndtsson R. (2019). Temporal trends and sediment–water partitioning of per- and polyfluoroalkyl substances (PFAS) in lake sediment. Chemosphere 227, 624–629. doi: 10.1016/j.chemosphere.2019.04.074
Nakayama S. F., Yoshikane M., Onoda Y., Nishihama Y., Iwai-Shimada M., Takagi M., et al. (2019). Worldwide trends in tracing poly- and perfluoroalkyl substances (PFAS) in the environment. Trac-Trends Anal. Chem. 121, 115410. doi: 10.1016/j.trac.2019.02.011
Organisation for Economic Co-operation and Development, & United Nations Environment Programme (2013). OECD/UNEP Global PFC Group Synthesis Paper on Per- and Polyfluorinated Chemicals (PFCs). Paris, France. Available at: https://wedocs.unep.org/20.500.11822/32445.
Plumb R. H. (1981). Procedures for handling and chemical analysis of sediment and water samples. Ed. Station U. (Vicksburg, Mississippi: USEPA).
Podder A., Sadmani A., Reinhart D., Chang N. B., Goel R. (2021). Per and poly-fluoroalkyl substances (PFAS) as a contaminant of emerging concern in surface water: A transboundary review of their occurrences and toxicity effects. J. Hazard. Mater. 419, 126361. doi: 10.1016/j.jhazmat.2021.126361
Point A. D., Holsen T. M., Fernando S., Hopke P. K., Crimmins B. S. (2021). Trends, (2005–2016) of perfluoroalkyl acids in top predator fish of the laurentian great lakes. Sci. Total Environ. 778, 146151. doi: 10.1016/j.scitotenv.2021.146151
Pulster E. L., Giardina M. (2022). Analysis of per- and polyfluoroalkyl substances in edible fish tissue using agilent captiva EMR-lipid and LC/MS/MS. Agilent Technologies, Inc., Wilmington, DE, USA. Application Note 5994-5227EN
Shoemaker J., Tettenhorst D. (2018). Method 537.1: Determination of selected per- and polyfluorinated alkyl substances in drinking water by solid phase extraction and liquid chromatography/tandem mass spectrometry (LC/MS/MS) (Washington, D.C: U.S. Environmental Protection Agency (USEPA), Office of Research and Development, National Center for Environmental Assessment).
Sims J. L., Stroski K. M., Kim S., Killeen G., Ehalt R., Simcik M. F., et al. (2022). Global occurrence and probabilistic environmental health hazard assessment of per- and polyfluoroalkyl substances (PFASs) in groundwater and surface waters. Sci. Total Environ. 816, 151535. doi: 10.1016/j.scitotenv.2021.151535
Standard Methods Committee of the American Public Health Association, American Water Works Association, and Water Environment Federation. 5310 total organic carbon in Standard Methods For the Examination of Water and Wastewater1:06 PM 11/7/2022. Lipps WC, Baxter TE, Braun-Howland E, editors (APHA Press, Washington, D.C). doi: 10.2105/SMWW.2882.104
Strobel C. J., Klemm D. J., Lobring L. B., Eichelberger J. W., Alford-Stevens A., Potter B. B., et al. (1995). Environmental monitoring and assessment program (EMAP) laboratory methods manual: Estuaries. Ed. Development O. O. R. A. (Narragansett, RI: USEPA).
Trudel D., Horowitz L., Wormuth M., Scheringer M., Cousins I. T., Hungerbühler K. (2008). Estimating consumer exposure to PFOS and PFOA. Risk Anal. 28, 251–269. doi: 10.1111/j.1539-6924.2008.01017.x
USEPA (2000). “EPA And 3M announce phase out of PFOS,” in United states enviornmental protection agency. Available at: https://archive.epa.gov/epapages/newsroom_archive/newsreleases/33aa946e6cb11f35852568e1005246b4.html.
USEPA (2009) Long-chain perfluorinated chemicals (PFCs) action plan. Available at: https://www.epa.gov/sites/production/files/2016-01/documents/pfcs_action_plan1230_09.pdf.
USEPA (2011a). Draft procedure for analysis of perfluorinated carboxylic acids and sulfonic acids in sewage sludge and biosolids by HPLC/MS/MS (Washington, D.C: United States Environmental Protection Agency (USEPA), Office of Water).
USEPA (2011b). Exposure factors handbook: 2011 edition (Washington. D.C: National Center for Environmental Assessment).
USEPA (2014). Estimated fish consumption rates for the U.S. population and selected subpopulations (NHANES 2003-2010) (United States Environmental Protection Agency, Washington, D.C).
USEPA (2016a). Fact sheet PFOA & PFOS drinking water health advisories (Washington, D.C: United States Environmental Protection Agency).
USEPA (2016b). Health effects support document for perfluorooctane sulfonate (PFOS) (Washington, DC).
USEPA (2017). Technical fact sheet - perfluorooctane sulfonate (PFOS) and perfluorooctanoic acid (PFOA). Ed. Management U. (Washington, DC).
USEPA (2018). Human health toxicity values for hexafluoropropylene oxide (HFPO) dimer acid and its ammonium salt also known as "GenX chemicals". Ed. Division O. (Washington, D.C).
USEPA (2021). Human health toxicity values for perfluorobutane sulfonic acid (CASRN 375-73-5) and related compound potassium perfluorobutane sulfonate (CASRN 29420-49-3). Ed. Assessment O. (Washington, DC).
Valsecchi S., Babut M., Mazzoni M., Pascariello S., Ferrario C., De Felice B., et al. (2021). Per- and polyfluoroalkyl substances (PFAS) in fish from European lakes: Current contamination status, sources, and perspectives for monitoring. Environ. Toxicol. Chem. 40, 658–676. doi: 10.1002/etc.4815
Keywords: tier 1 original research PFAS, sediment, fish, risk assessment, dietary exposure, consumption advisories
Citation: Pulster EL, Rullo K, Gilbert S, Ash TM, Goetting B, Campbell K, Markham S and Murawski SA (2022) Assessing per- and polyfluoroalkyl substances (PFAS) in sediments and fishes in a large, urbanized estuary and the potential human health implications. Front. Mar. Sci. 9:1046667. doi: 10.3389/fmars.2022.1046667
Received: 16 September 2022; Accepted: 27 October 2022;
Published: 15 November 2022.
Edited by:
Sujin Kim, Baylor University, United StatesReviewed by:
Habyeong Kang, Gachon University, South KoreaTomohiko Isobe, National Institute for Environmental Studies (NIES), Japan
Copyright © 2022 Pulster, Rullo, Gilbert, Ash, Goetting, Campbell, Markham and Murawski. This is an open-access article distributed under the terms of the Creative Commons Attribution License (CC BY). The use, distribution or reproduction in other forums is permitted, provided the original author(s) and the copyright owner(s) are credited and that the original publication in this journal is cited, in accordance with accepted academic practice. No use, distribution or reproduction is permitted which does not comply with these terms.
*Correspondence: Erin L. Pulster, ZXB1bHN0ZXJAdXNncy5nb3Y=