 Xiangqian Quan
 Yucong Wei1,2
- 1Institute of Deep-sea Science and Engineering, Chinese Academy of Science, Sanya, China
- 2University of Chinese Academy of Sciences, Beijing, China
Due to the attenuation of light in water, the deep-sea optical imaging system needs an active lighting system to provide the light source. However, because of the nonlinearity of light attenuation in spatial dimension and spectral dimension, the deep-sea lighting differs from terrestrial lighting. In order to quantitatively analyze and design deep-sea lighting system, we proposed a precise deep-sea lighting field simulation model and design method based on spectral transfer function. Firstly, with the analysis of deep-sea lighting-imaging process, the spectral transfer function in lighting field was analyzed and the deep-sea lighting model was built. Then, the platform used to study light attenuation was set up and the attenuation characteristics of light in water were derived. Moreover, the deep-sea lighting field simulation model was built with the computer program. Finally, the experiment platform for testing the underwater lighting field was set up in test pool. The experimental results show that the deep-sea lighting field computational model is accurate. In addition, the optimal deep-sea lighting system design was proposed. This study provides the theoretical basis and experimental data for the design of a deep-sea lighting system which has far-reaching significance for improving the efficiency of deep-sea scientific research.
1. Introduction
As the “eye” of deep-sea working platforms such as human-occupied vehicles, remote-operated vehicles and deep-sea landers, etc., deep-sea optical imaging systems can obtain a large amount of information in deep-sea exploration. There is no doubt that deep-sea optical imaging is an important technology for deep-sea resource exploration, deep-sea mineral development, and deep-sea in situ biological and chemical activities’ observation (Garcia et al., 2013; Jaffe, 2016; Mullen et al., 2016; Giddens et al., 2021; Feng et al., 2022; Zhou et al., 2022). However, because the propagation of light in water is attenuated with an “exponential” form, the illumination of visible light at a 200m depth is usually less 0.01% than that at the sea surface and the deep ocean environment below 1000m depth is dark. Therefore, deep-sea lighting is a prerequisite for deep-sea optical imaging. However, the nonlinearity of light attenuation in the spatial dimension and spectral dimension makes designing a deep-sea lighting system more difficult (Kocak et al., 2008; Garcia et al., 2013; Jaffe, 2015; Mao et al., 2017; Du et al., 2020).
Many experts and scholars have carried out a series of relevant research on a deep-sea lighting system. To acquire clear deep-sea images, Tommy D. Dickey et al. developed a multi-angle scattering and absorption detector to analyze the attenuation characteristics of light in different sea areas with different water qualities. Then, a theoretical model for analyzing and designing deep-sea lighting system was proposed (Dickey et al., 2011). Ron Gray et al. analyzed the advantages and disadvantages of parabolic, ellipsoidal and spherical as light distribution elements in a deep-sea lighting system and the impacts of a smooth surface, ground-glass surface and diffuse reflective surface on illumination uniformity in the deep-sea lighting system. Then, a series of design schemes for light distribution in a deep-sea lighting system were proposed (Gray, 2004). Considering the high color rendering of white light and high transmittance of blue light in water, Mark S. Olsson et al. integrated a white-light light-emitting diode (LED) and blue light LED in one deep-sea lighting lamp, where two types of light distribution structures were equipped accordingly. The blue light LED was suitable for long-distance and small-field-of-view imaging. The white light LED was suitable for short-range and large-field-of-view imaging (Olsson, 2012). Jules S. Jaffe et al. utilized the structured illumination for deep-sea imaging. The contrast and detection range were enhanced (Jaffe, 2010). Peter C. Y. Chang et al. improved the visibility depth of underwater imaging by use of polarization; the results showed an improvement in contrast and visibility depth (Chang et al., 2003). To detect in situ underwater microplastics, Huang H et al. analyzed the light absorption and scattering in the lighting field for signal correction and calibration. This study is essential for hyperspectral images in a water environment (Huang et al., 2021). To acquire high-resolution seabed images at various depths for scientific research, Jevgenij Guls et al. developed a suitable lighting module for still images and video (Guls et al., 2016).
The above research provides a theoretical basis for deep-sea lighting. However, the attenuation of light is not only related to the light path but also related the wavelength of light. The spectral transfer function in deep-sea lighting process should be considered. Therefore, we proposed a precise analysis model and design method for the deep-sea lighting field based on the spectral transfer function. Firstly, by analyzing the spectral transform function in the deep-sea lighting-imaging process, several key factors affecting deep-sea lighting were considered and a universal deep-sea lighting field computational model based on spectral transfer function was built. Then, the research platform used to study light attenuation was built and the attenuation of light characteristics in water was derived. Moreover, we built the deep-sea lighting field analysis model with a computer program. Finally, an experiment platform for testing the underwater lighting field was set up in the test pool. The experiment results confirmed the accuracy of the deep-sea lighting field computational model and put forward an optimal design for a deep-sea lighting system. This study is significant in fields such as deep-sea artificial intelligence recognition, deep-sea real-time image analysis, deep-sea video-image color correction, deep-sea spectral imaging, deep-sea laser imaging, deep-sea optical communication, deep-sea in situ optical detection, etc. It also has far-reaching significance for improving the efficiency of deep-sea scientific research and reducing the cost of deep-sea exploration (Yang and Yang, 2009; O'Byrne et al., 2018; Marques et al., 2019; Han et al., 2019; Tong et al., 2021; Xue et al., 2021).
2. Principle and theory
2.1. The analysis of spectral transfer function in deep-sea lighting-imaging process
The essence of optical imaging is photoelectric conversion. The response function of imaging system EV(λ) is shown in Equation 1:
where λ is the wavelength, tintegration is the integration time. I(λ) is the illumination function of lighting system. f/F is the entrance pupil aperture. F is the F number, f is the focal length, Cpixel is the size of the camera pixel and QE(λ) is the quantum efficiency. The difference between deep-sea lighting and terrestrial lighting is the light energy transmission process. To quantitatively analyze the illumination distribution of the deep-sea lighting system, we expand the illumination function from I(λ) to I(λ)(x,y) on the target surface:
where (x,y) is the coordinate on the target surface, Φ(λ)0 is the luminous function of lamp (the luminous function conforms to Lambert’s principle), α is the emission angle of light from lamp, L is the distance from the lamp surface to target surface, θ is the angle of light in vertical direction and φ is the angle of light in horizontal direction, μ(λ) is the attenuation coefficient of different wavelengths, and S is the illumination range. To analyze and design a deep-sea lighting system, the attenuation characteristics of light in water should be studied first.
2.2. The study of light attenuation in water
To analyze and design the deep-sea lighting system, the light attenuation was studied. The experimental setup for analyzing light attenuation coefficient was built as in Figure 1. The light penetrated through the chopper (which, combined with the lock-in amplifier, aims to improve the measurement accuracy) to the monochromator (which aims to decompose the light into monochromatic light). Then, the light passed through the monochromator to the fiber. The light from fiber was collimated by the collimator lens. By penetrating the sample pool, the light struck to the detector of the photo-multiplier tube (PMT).
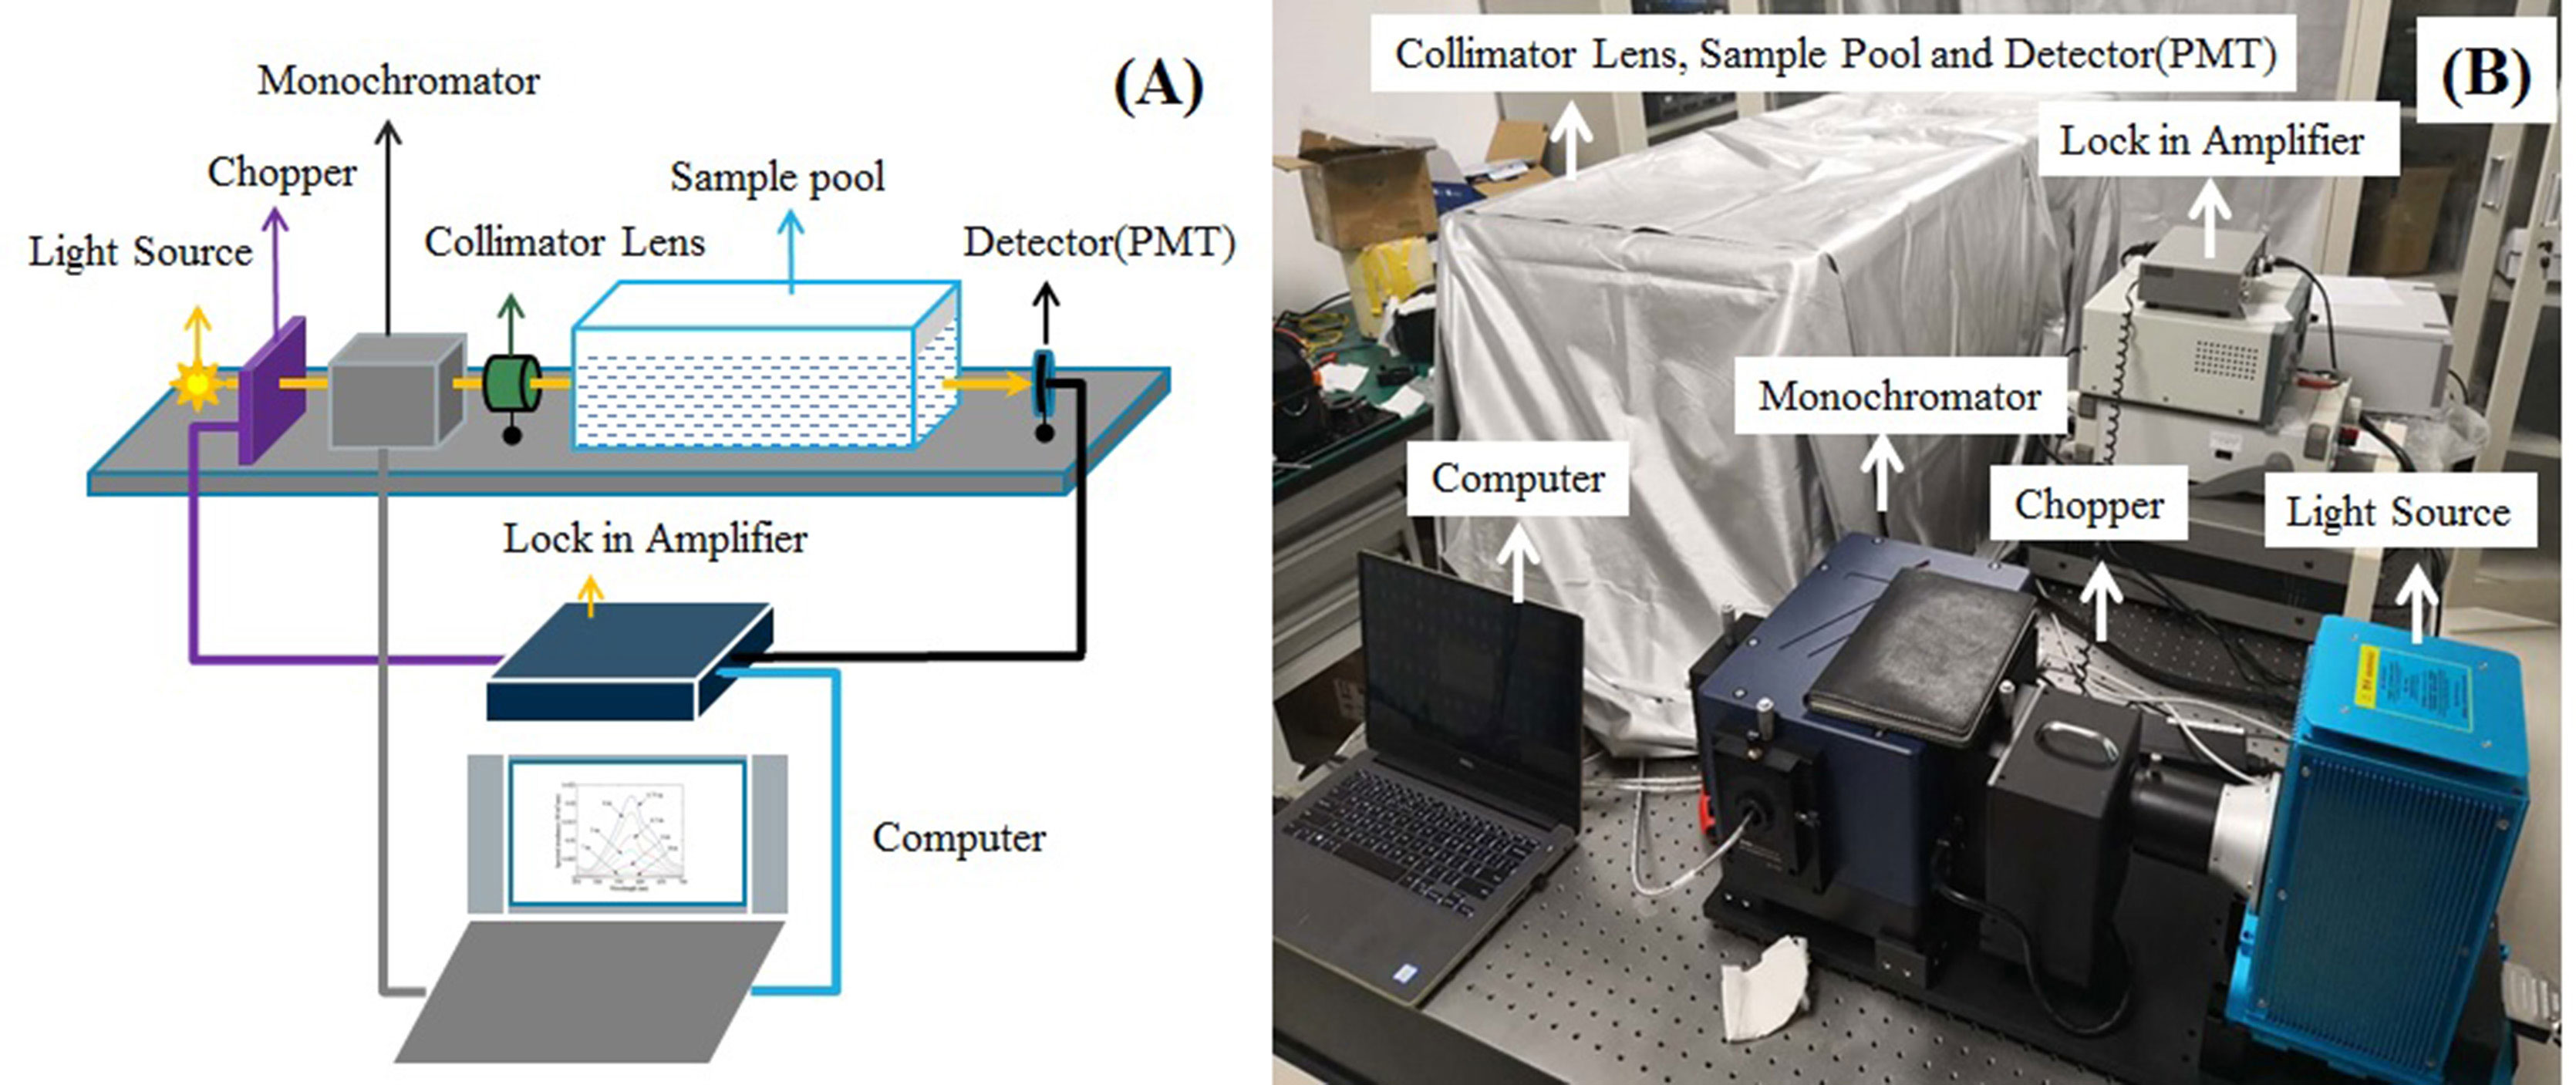
Figure 1 The experimental setup of light attenuation analysis: (A) the schematic diagram of experimental setup; (B) the photo of experimental setup.
Analyzing the experimental data in situations of a vacant tank, tap water pool and seawater pool showed that the relationship between the transmittance and wavelength was as shown in Figure 2A. The relationship between the attenuation coefficient and wavelength is shown in Figure 2B. The experimental results indicate that the attenuation of light changes with wavelength in the form of nonlinearity, and the attenuation of light in the blue and green bands is smaller than that in the violet and red bands. In addition, the attenuation coefficient of light in seawater is higher than that in tap water. The design of deep-sea lighting is related to the attenuation characteristics of light in water. Due to the feasibility of the experimental verification, we carried out the simulation and experiment with the attenuation characteristics of tap water to verify the reliability of the deep-sea lighting field computational model and used the model to predict the results of the deep-sea lighting design with different water constituents.
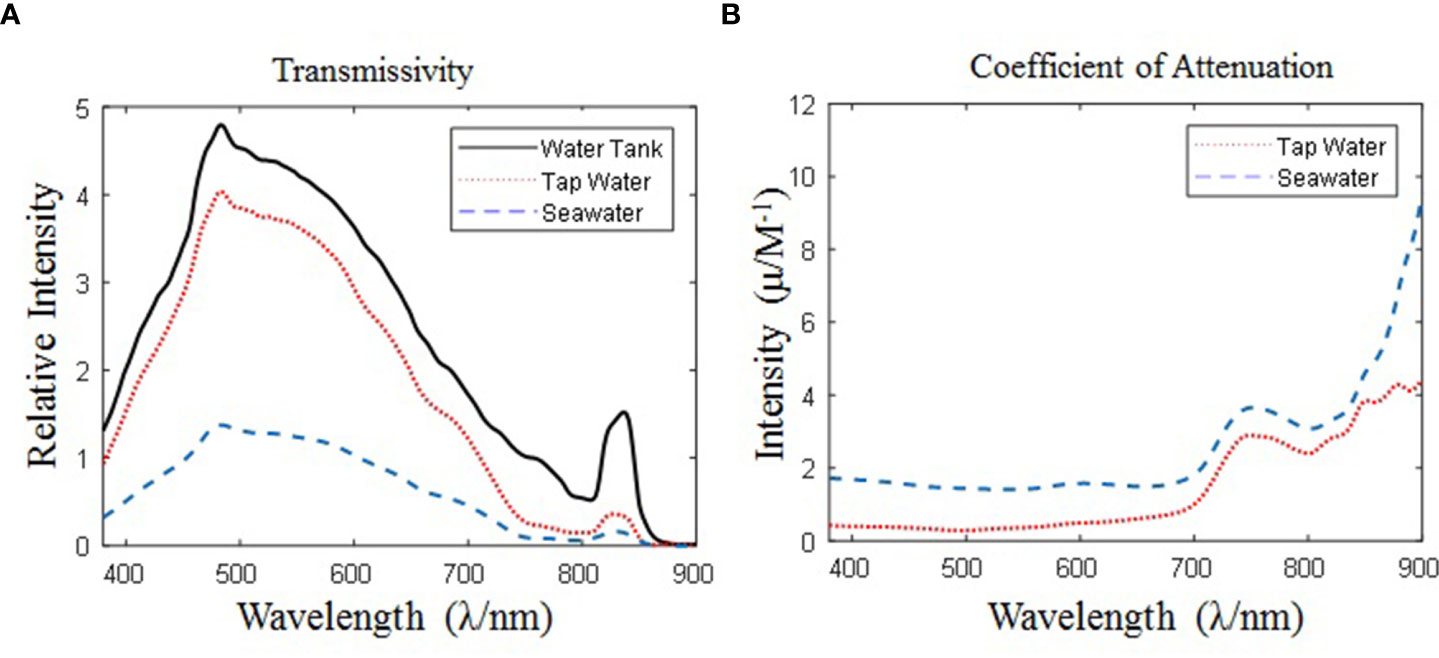
Figure 2 The analysis of light attenuation: (A) the transmittance of light in the vacant tank, tap water, and seawater; (B) the attenuation coefficient of light in tap water and seawater.
3. Simulation
Based on the analysis of light attenuation and deep-sea lighting field computational model, we carried out the simulation design of deep-sea lighting with the computer program. The schematic diagram of deep-sea lighting system design is shown as Figure 3. Three types of lamp, such as warm-light LED, cold-light LED and blue-light LED, were employed in our simulation and experiment. We added the warm-light LED to counteract the heavy attenuation of the red wavelength band. We utilized the cold-light lamp to improve the color rending of deep-sea images combine with the warm-light LED under different distances, and we utilized the blue-light LED to extend the detection range and decrease the energy consumption because of the high transmittance of blue light. The coordinate system was established with the camera as the origin. We installed the lamps separately from the camera to decrease the back-scattering light. If the lamps were installed close to the camera, the imaging quality would deteriorate and affect the results of the experiment. The position coordinates of two warm LED lamps were (20cm, 0) and (-20cm, 0), respectively. The position coordinates of two cold LED lamps were (61cm, 61cm) and (-61cm, 61cm), respectively. The position coordinates of two blue LED lamps were (122cm, 122cm) and (-122cm, 122cm), respectively. The angle of blue light LED lamps was 30° inward in the horizontal direction and vertical direction. The angle of cold light LED lamps was 15° inward in the horizontal direction and vertical direction. Each lamp has a luminous flux of 10000 lm, a beam angle of 75° and a power of 110 W.
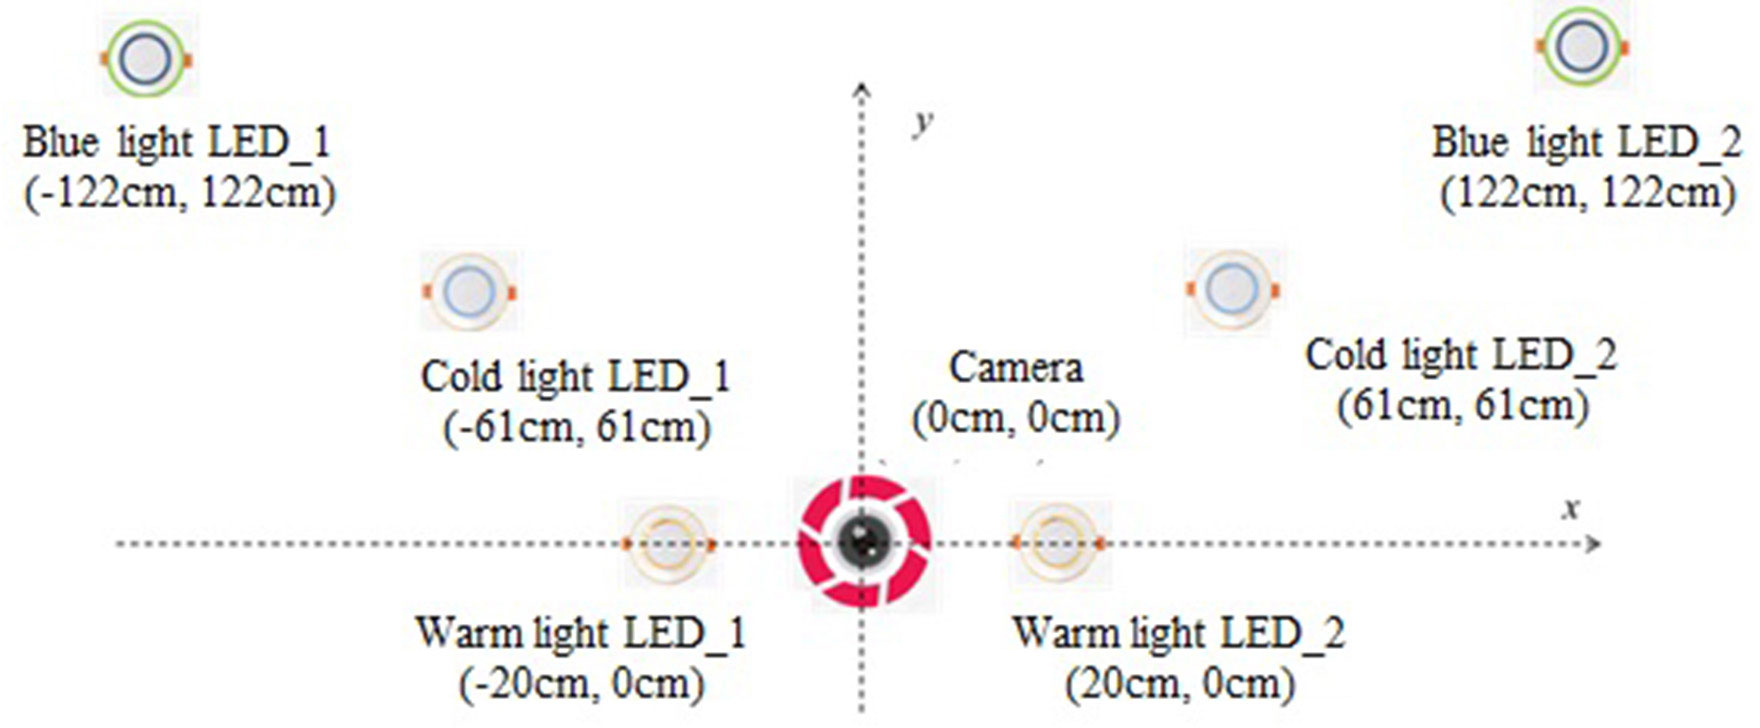
Figure 3 The schematic diagram of deep-sea lighting system design.
According to the deep-sea application scenarios, the lighting distances of the deep-sea lighting system were set to 3m, 6m and 10m. With the lighting distance of 3m, the illumination simulation results of each LED lamps are shown in Figure 4. The illumination mean value of each LED ranged from 43.5 LUX to 124.9 LUX. The illumination uniformities of warm-light LED lamps are better than that of cold-light and blue-light LED lamps.
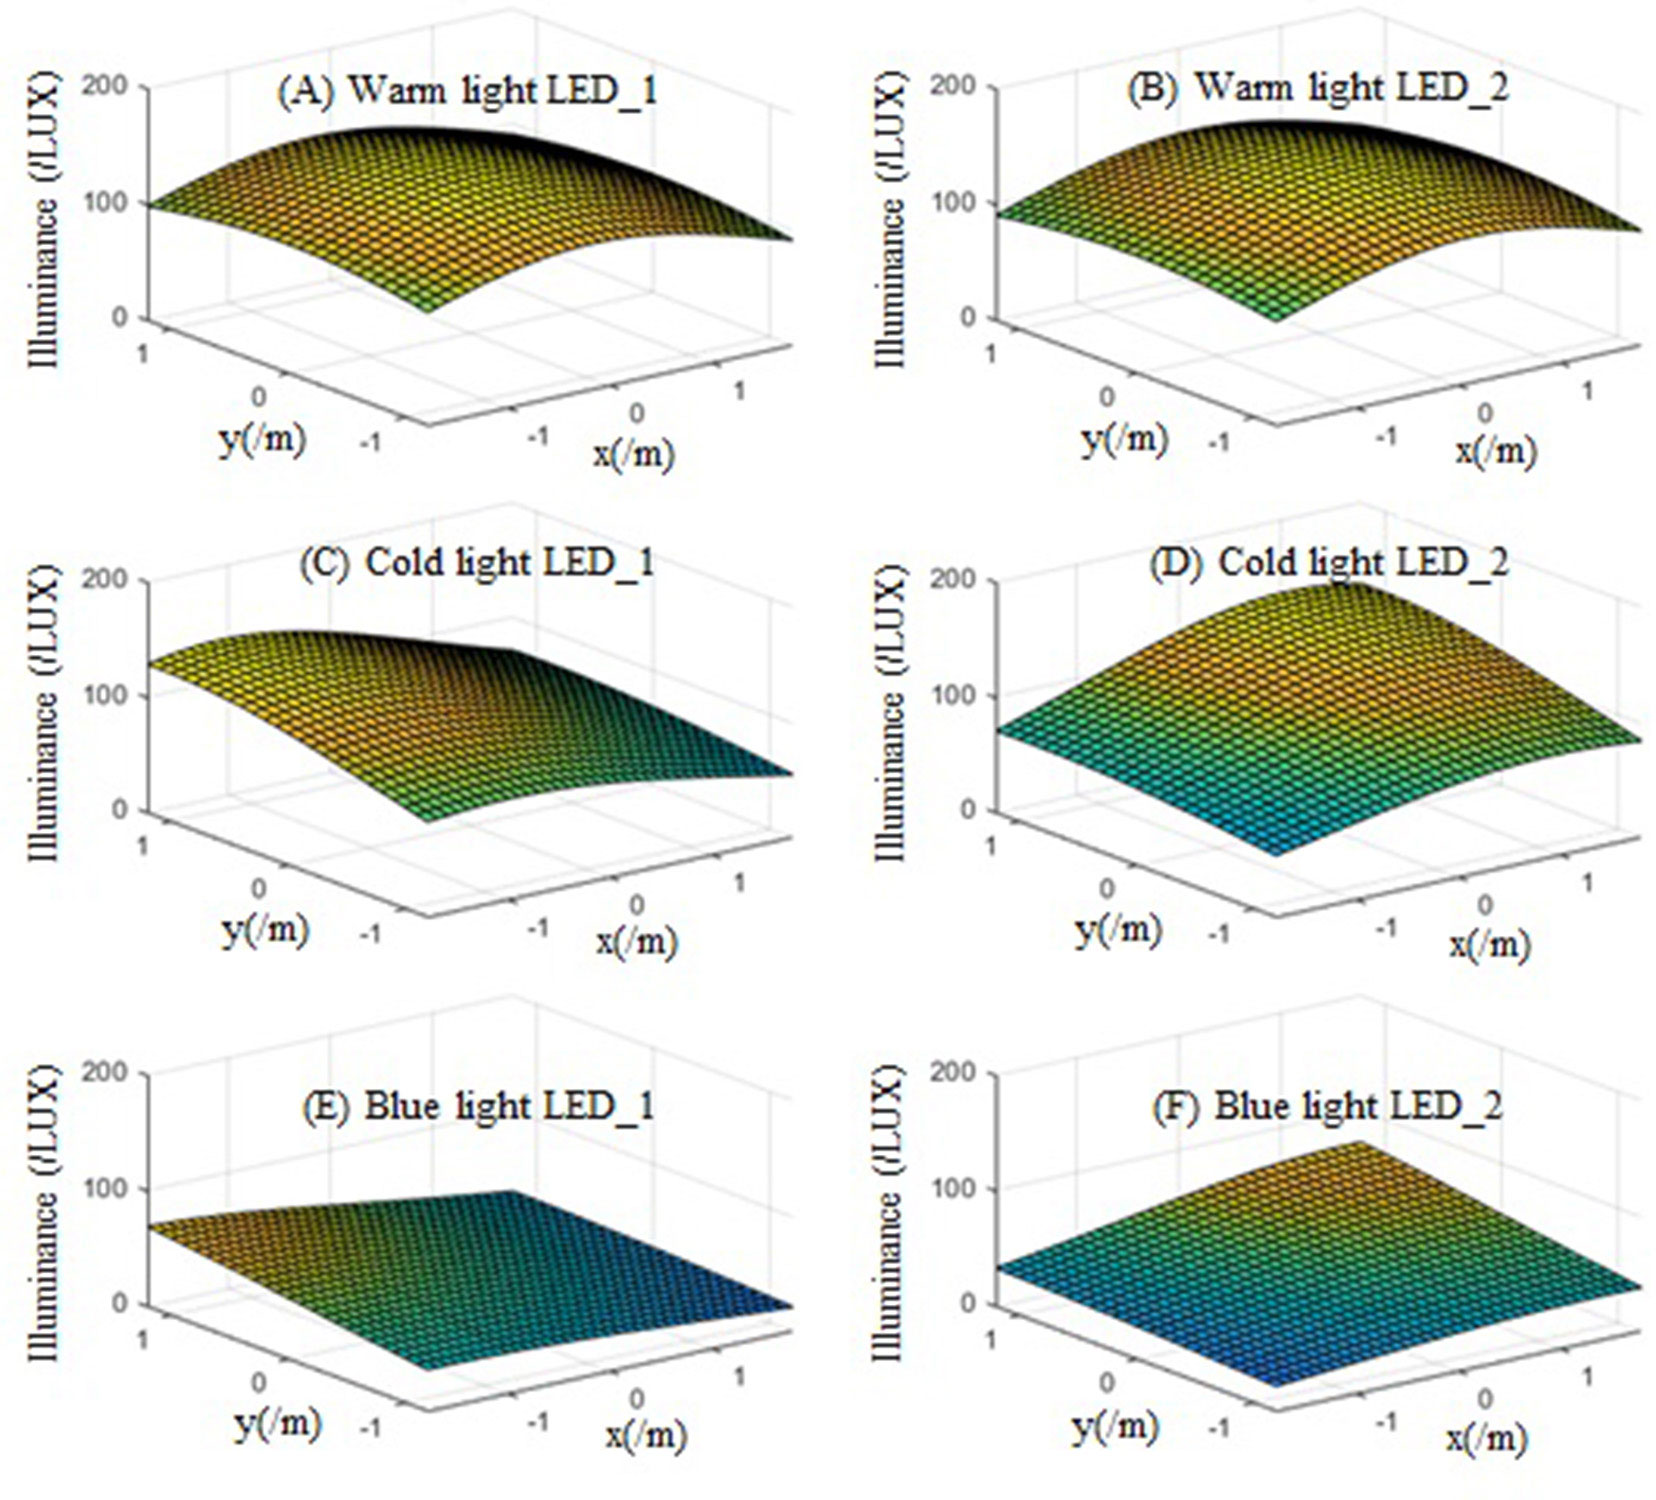
Figure 4 The illumination distributions of each single LED lamp with a distance of 3m: (A) the illumination distribution of warm light LED_1 on target surface; (B) the illumination distribution of warm light LED_2 on target surface; (C) the illumination distribution of cold light LED_1 on target surface; (D) the illumination distribution of cold light LED_2 on target surface; (E) the illumination distribution of blue light LED_1 on target surface; (F) the illumination distribution of blue light LED_2 on target surface.
With a lighting distance of 3m, the illumination distribution of the whole lighting system is shown in Figure 5.
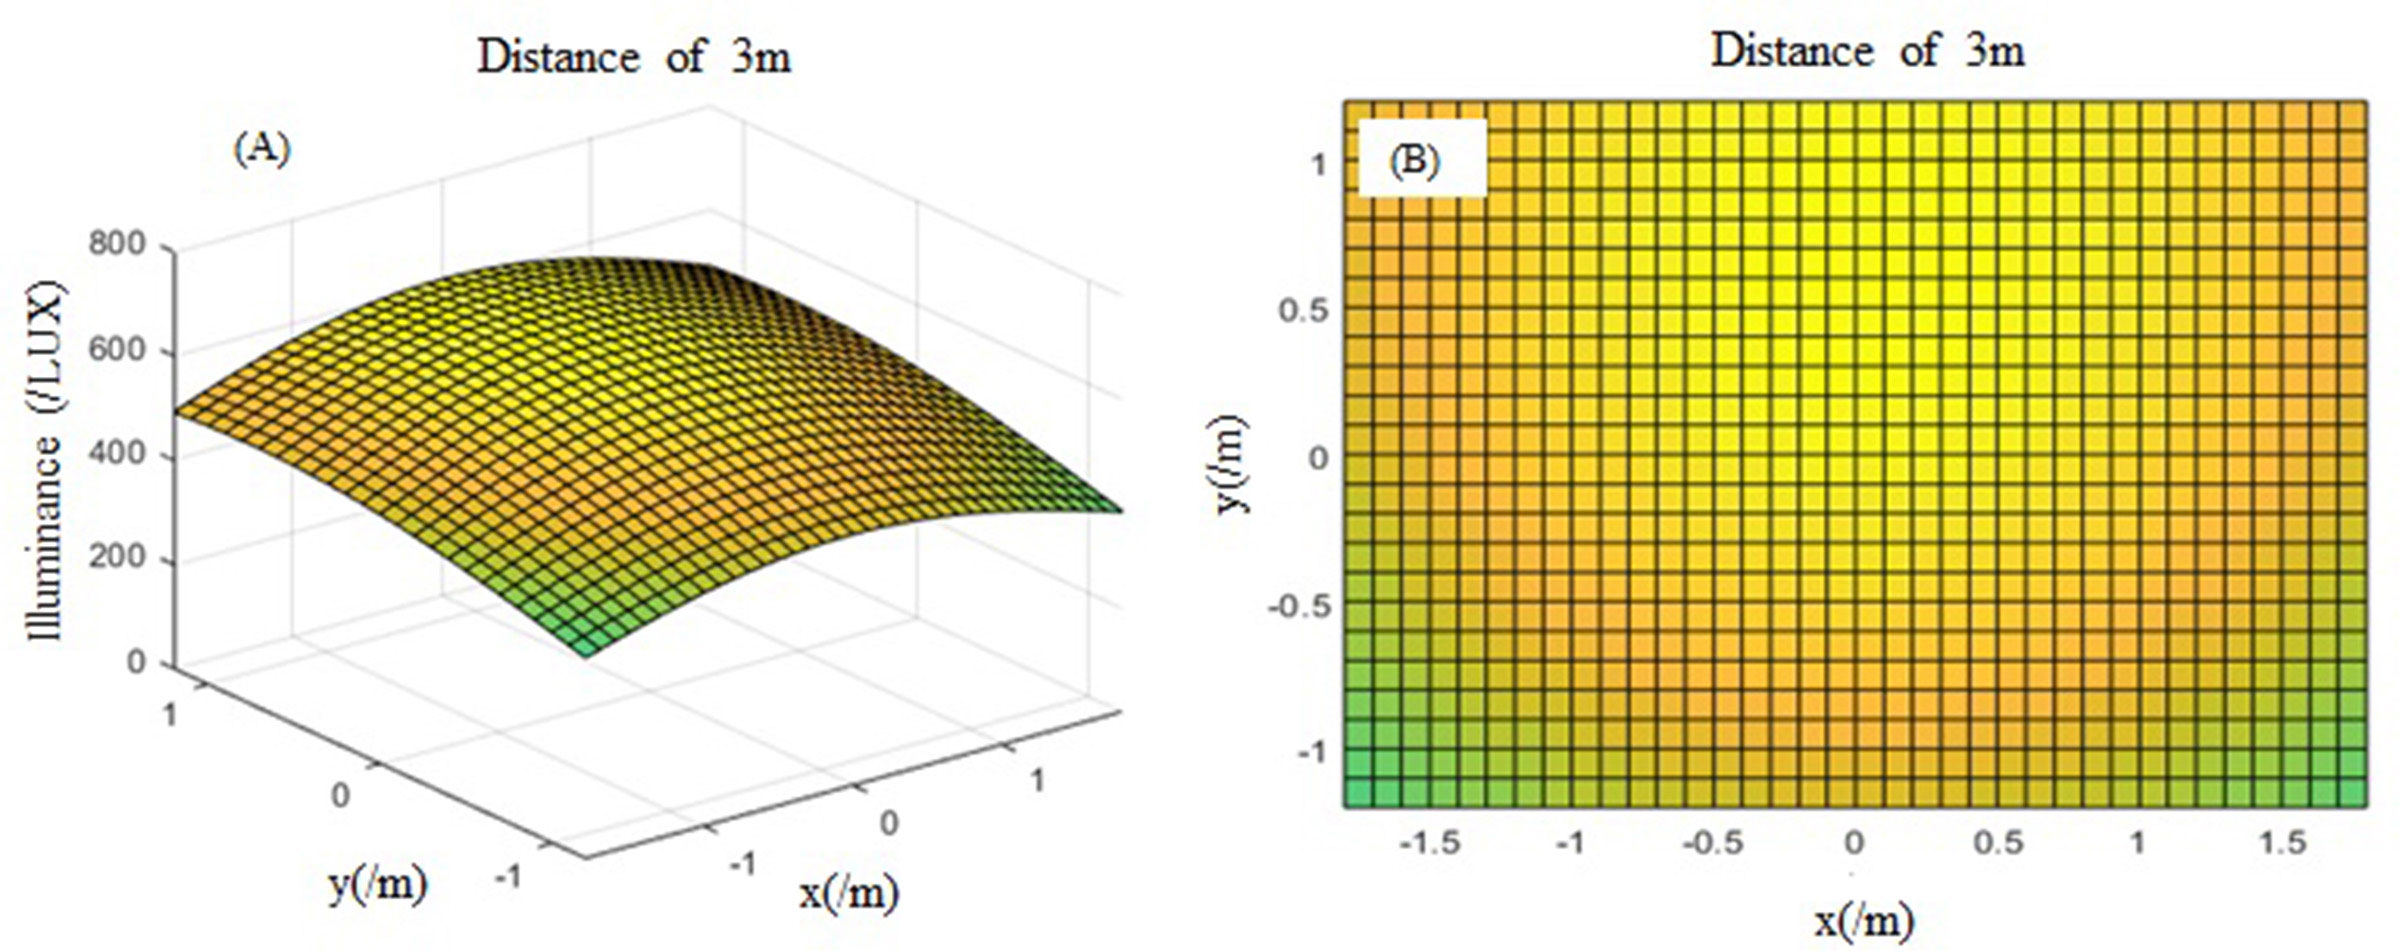
Figure 5 The illumination distribution of whole lighting system with a lighting distance of 3m. (A) the 3D view of illumination distribution; (B) the vertical view of illumination distribution.
The illumination data of the whole lighting system with a distance of 3m are shown in Table 1. The maximum illumination value is 624.7 LUX, the minimum illumination value is 368.4 LUX, and the mean illumination value is 533.7 LUX. The illumination uniformity is 0.69. According to the real scene lighting situation, illumination may cause overexposure.

Table 1 The illumination distribution analysis with a lighting distance of 3m.
The illumination simulation results of each LED lamp with a lighting distance of 6m are shown in Figure 6. The illumination mean value of each LED lamp ranges from 9.7 LUX to 44.4 LUX. The illumination uniformities of warm-light LED lamps are better than those of cold-light and blue-light LED lamps.
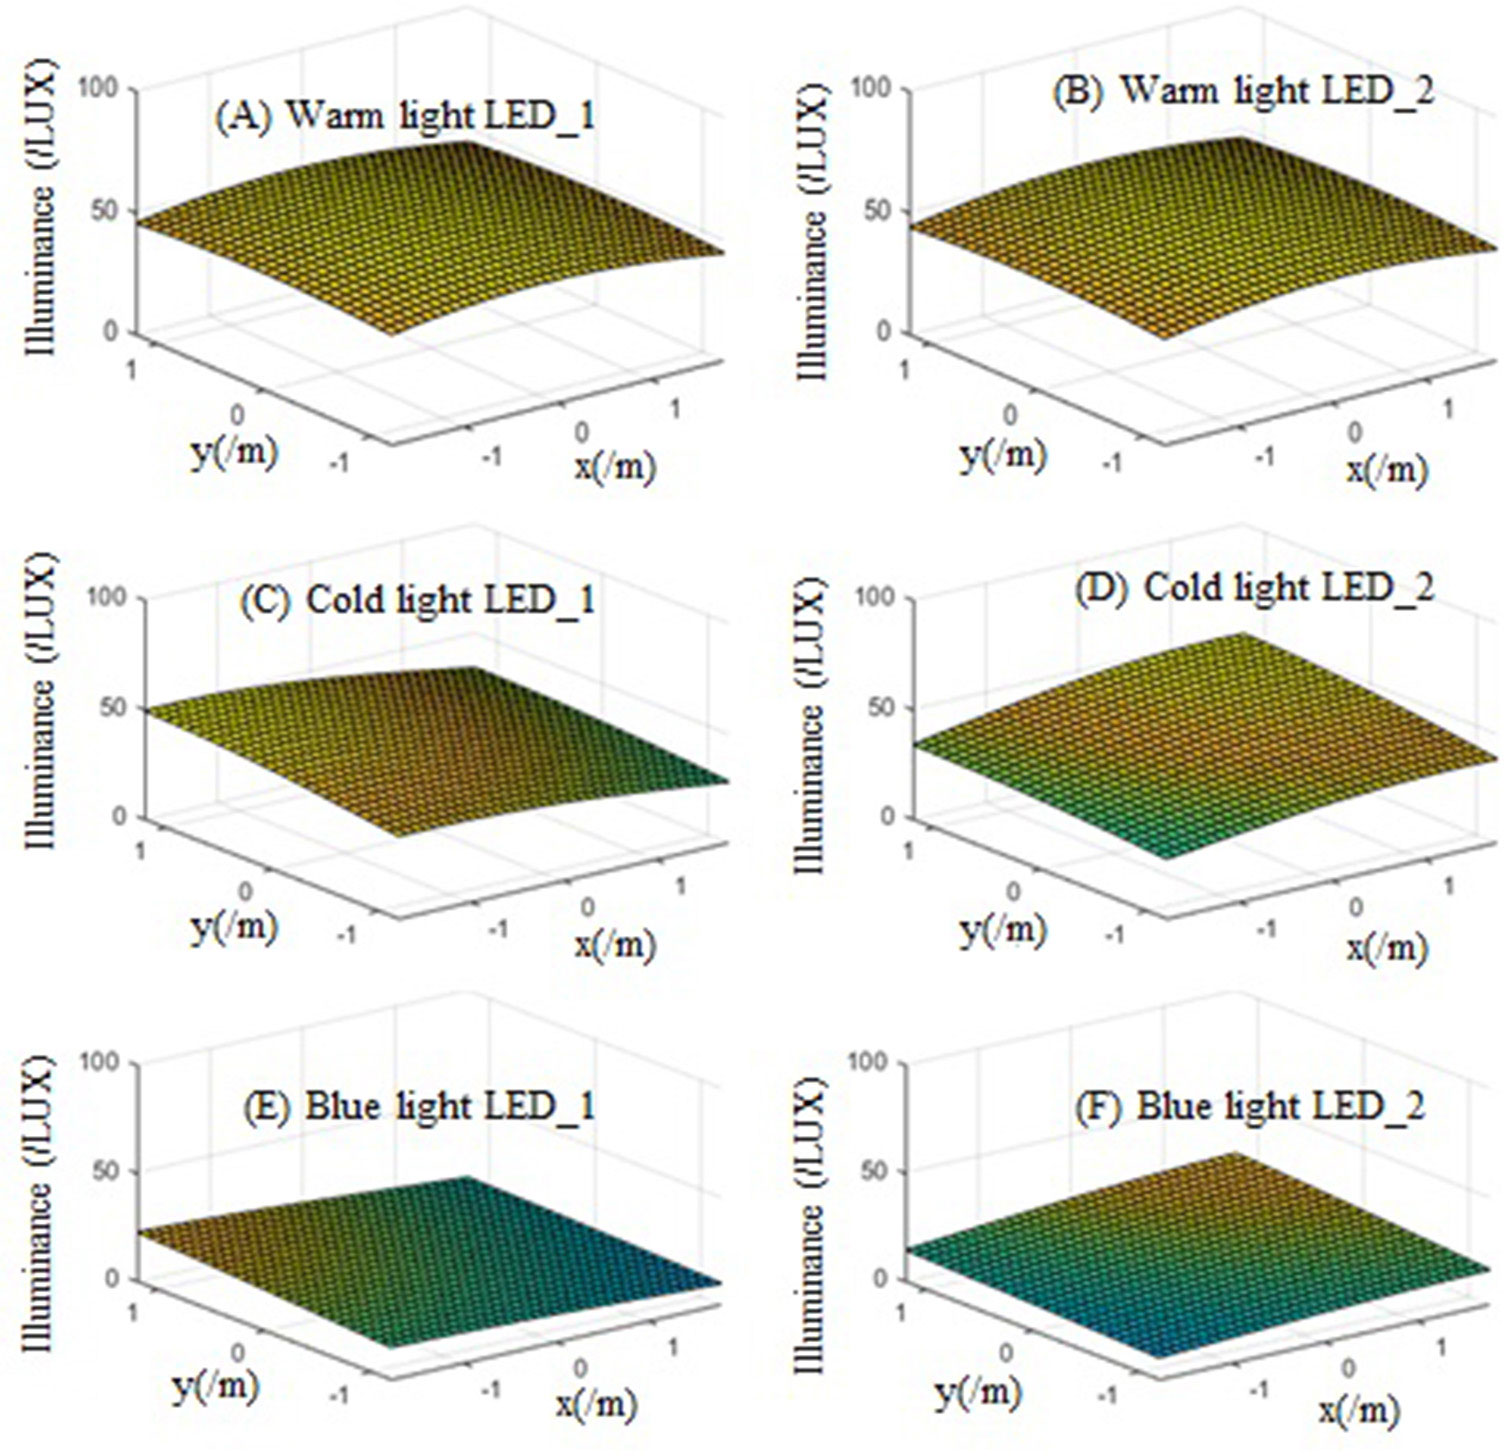
Figure 6 The illumination distribution of each single LED lamp with a distance of 6m: (A) the illumination distribution of warm-light LED_1 on target surface; (B) the illumination distribution of warm-light LED_2 on target surface; (C) the illumination distribution of cold-light LED_1 on target surface; (D) the illumination distribution of cold-light LED_2 on target surface; (E) the illumination distribution of blue-light LED_1 on target surface; (F) the illumination distribution of blue-light LED_2 on target surface.
With a lighting distance of 6m, the illumination distribution of the whole lighting system is shown in Figure 7.
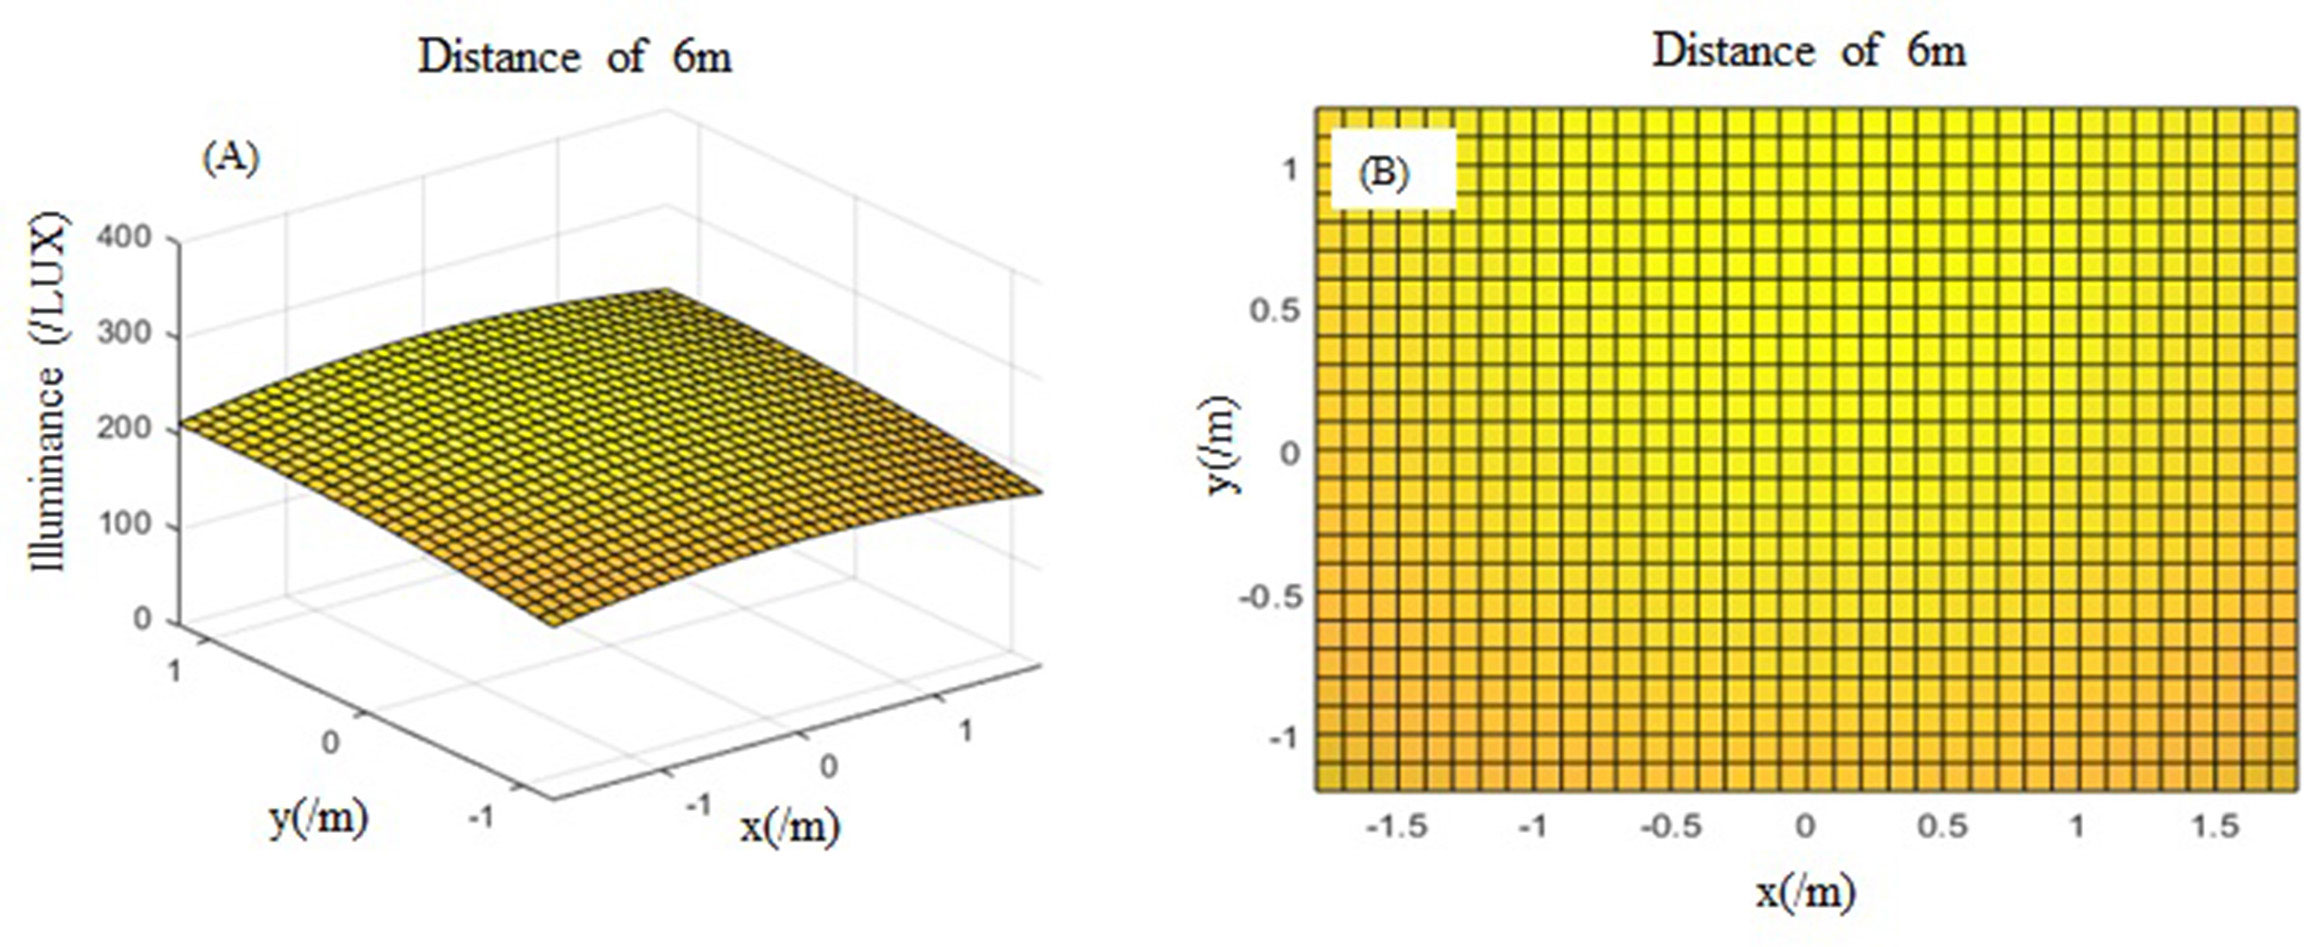
Figure 7 The illumination distribution of whole lighting system with a lighting distance of 6m. (A) the 3D view of illumination distribution; (B) the vertical view of illumination distribution.
The illumination data of the whole lighting system with a distance of 6m are shown in Table 2. The maximum illumination value is 233.6 LUX, the minimum illumination value is 177.2 LUX, and the mean illumination value is 214.4 LUX. The illumination uniformity is 0.83. According to the real situation of scene lighting, the illumination meets the requirements.

Table 2 The illumination distribution analysis with a lighting distance of 6m.
The illumination simulation results of each LED lamp with a lighting distance of 10m are shown in Figure 8. The illumination mean value of each LED lamp ranges from 3.73 LUX to 13.8 LUX. The illumination uniformities of warm-light LED lamps are better than those of cold-light and blue-light LED lamps.
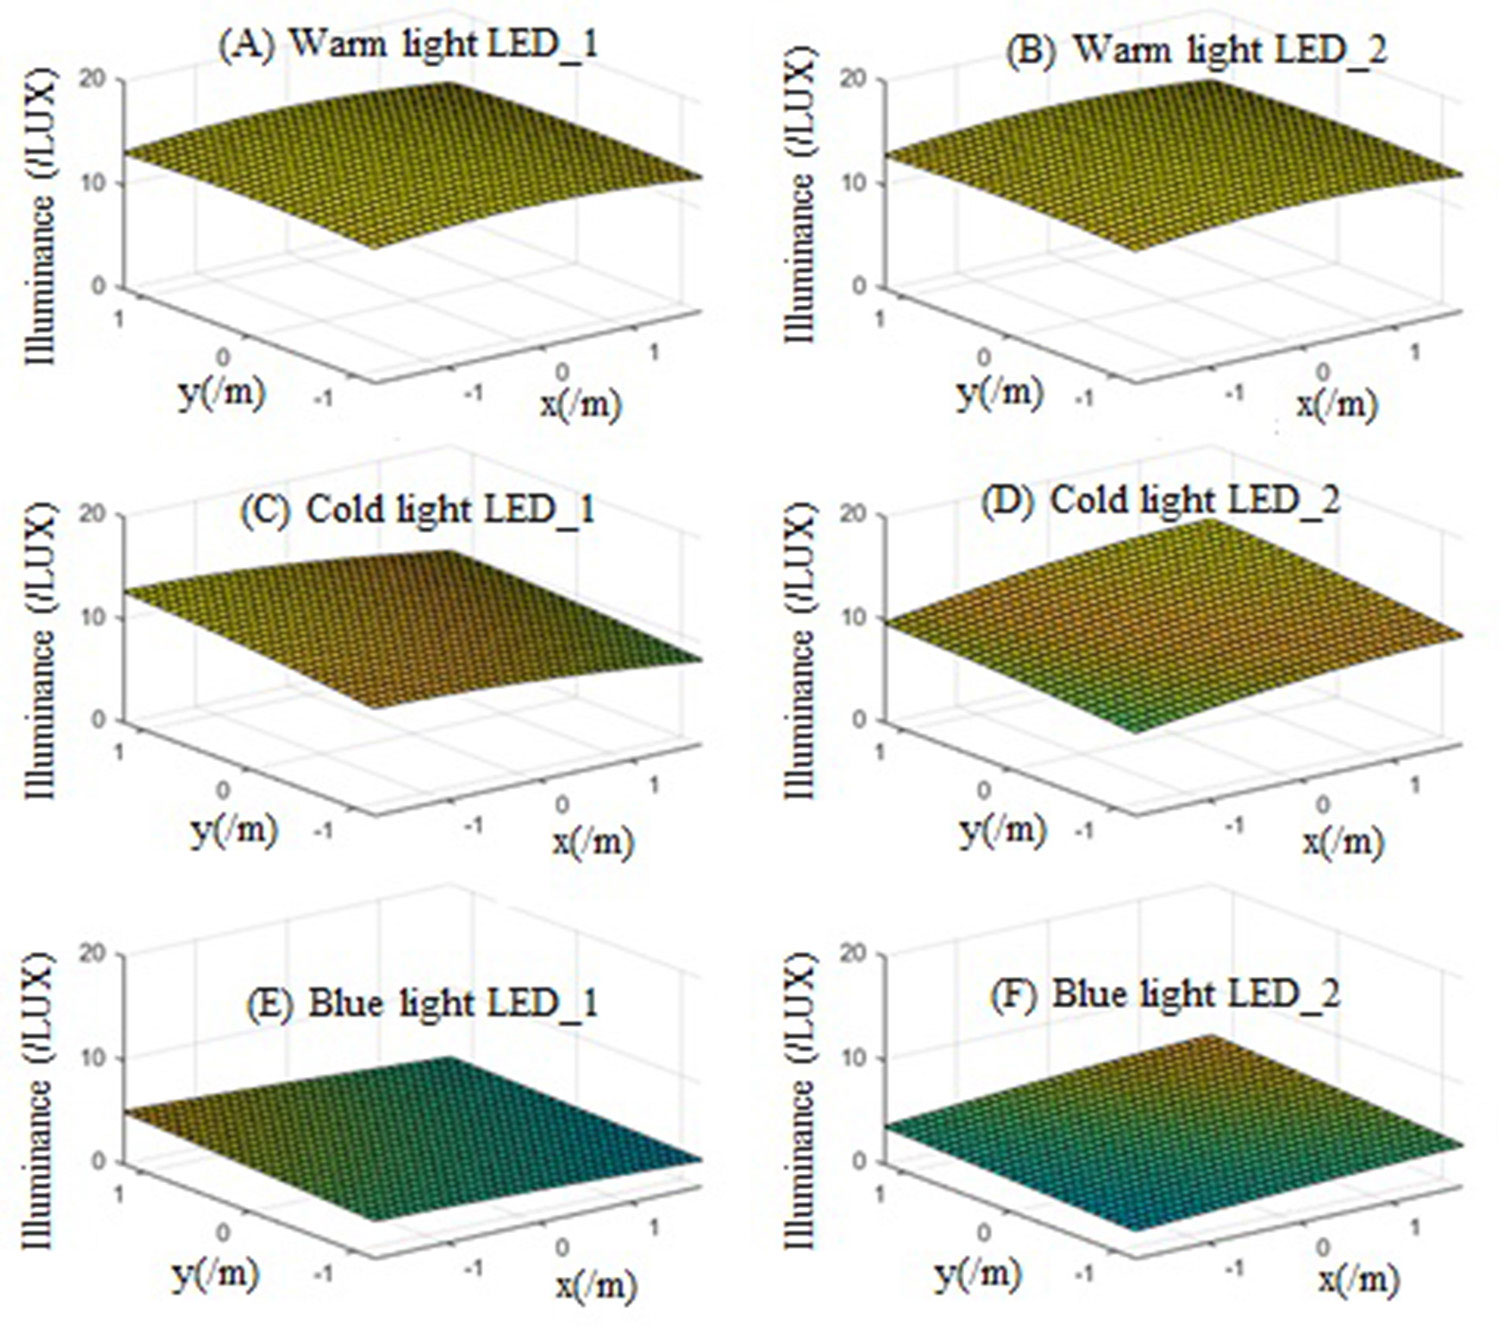
Figure 8 The illumination distribution of each single LED lamp with a distance of 10m: (A) the illumination distribution of warm-light LED_1 on target surface; (B) the illumination distribution of warm-light LED_2 on target surface; (C) the illumination distribution of cold-light LED_1 on target surface; (D) the illumination distribution of cold-light LED_2 on target surface; (E) the illumination distribution of blue-light LED_1 on target surface; (F) the illumination distribution of blue-light LED_2 on target surface.
With a lighting distance of 10m, the illumination distribution of the whole lighting system is shown in Figure 9.
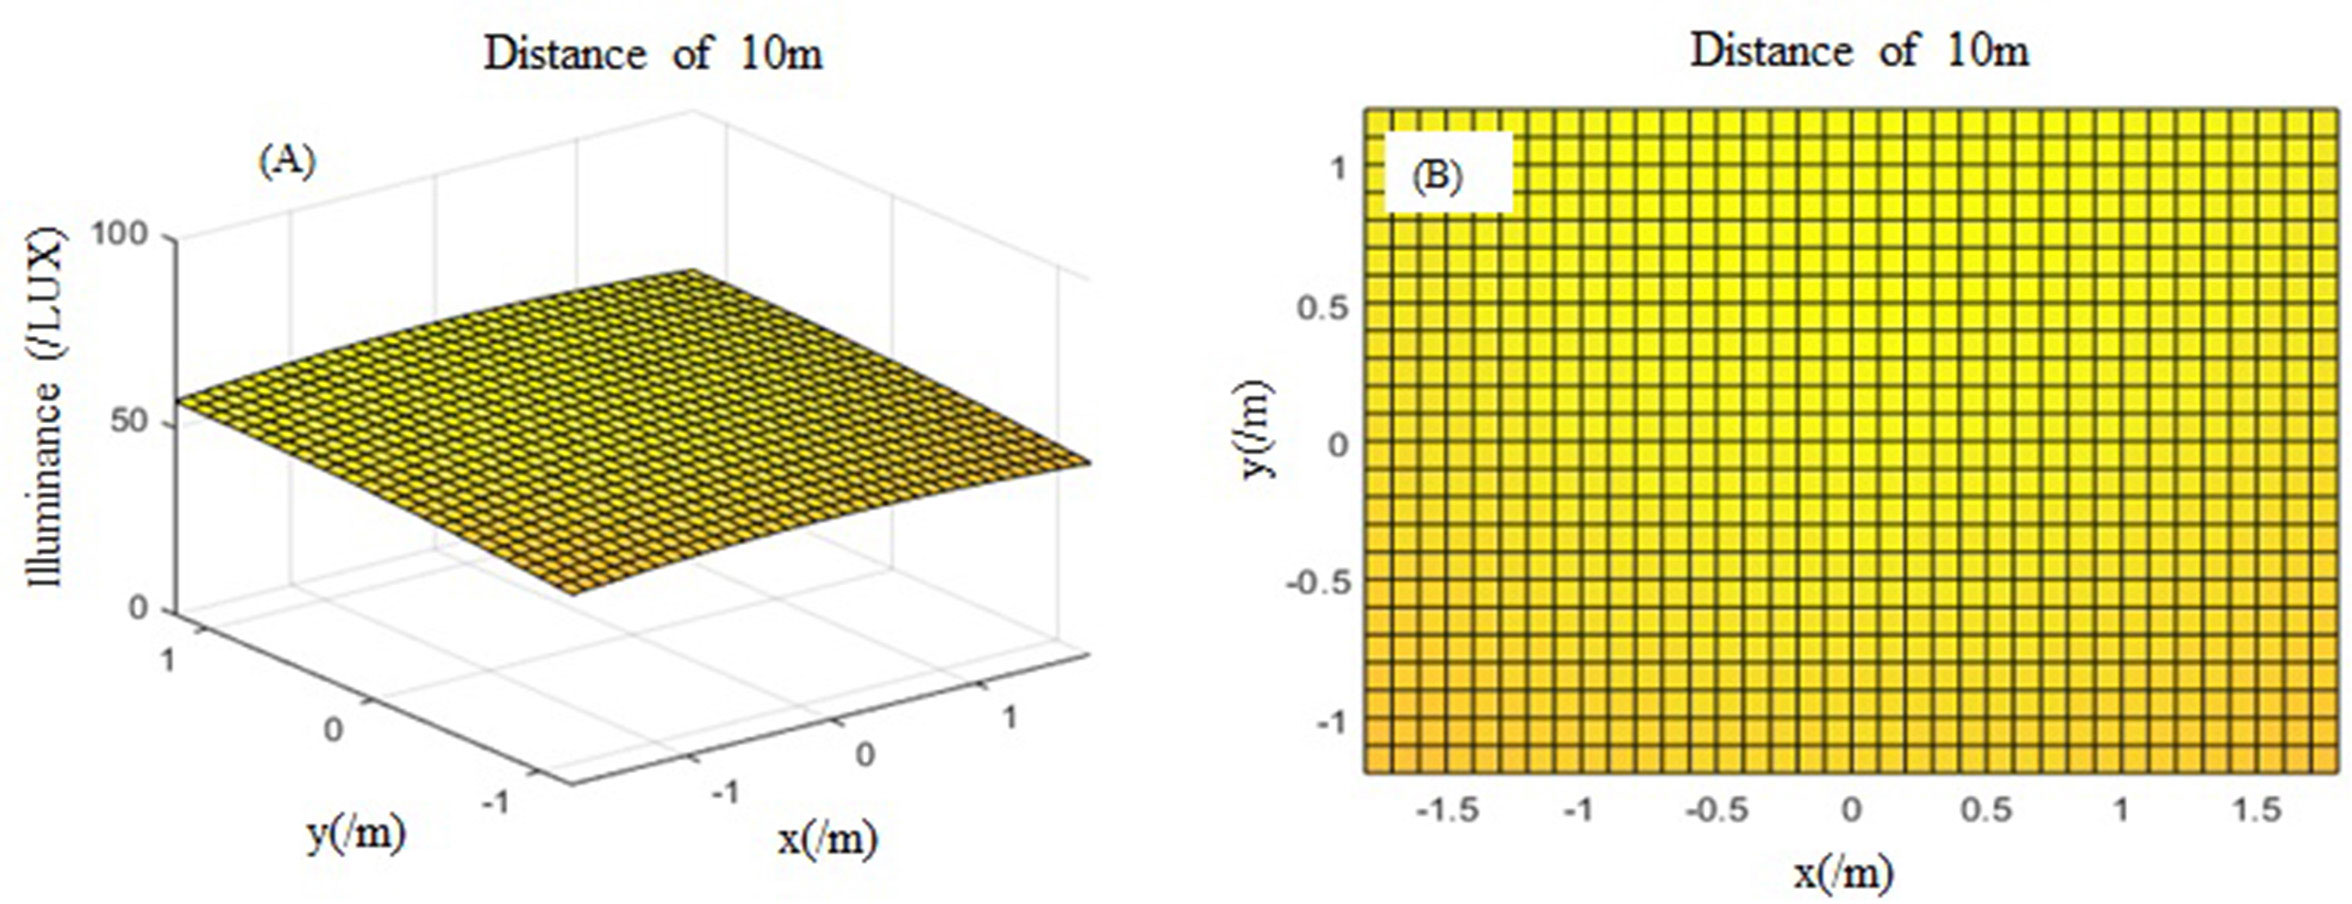
Figure 9 The illumination distribution analysis of whole-lighting system with a lighting distance of 10m. (A) the 3D view of illumination distribution; (B) the vertical view of illumination distribution.
The illumination data of the whole lighting system at a distance of 10m are shown in Table 3. The maximum illumination value is 60.2 LUX, the minimum illumination value is 50.4 LUX, and the mean illumination value is 56.7 LUX. The illumination uniformity is 0.89. According to the real situation of scene lighting, the illumination cannot meet the requirements.

Table 3 The illumination distribution analysis with a lighting distance of 10m.
4. Experiment and result
4.1. The confirmatory experiment
In order to verify the simulation model and design the deep-sea lighting system, an experiment platform was set up in the test pool, as shown in Figure 10. Figure 10A shows the experimental process. Figure 10B shows the diffuse reflective plate with the size of 3.6m ×1.8m, which is located in the experimental pool. Figure 10C shows the deep-sea lighting system platform, which consists of lamps, a power supply, control panel, camera, monitor and storage, etc. Figure 10D shows the captured experiment pictures. Based on the picture data, the deep-sea lighting system can be quantitatively analyzed.
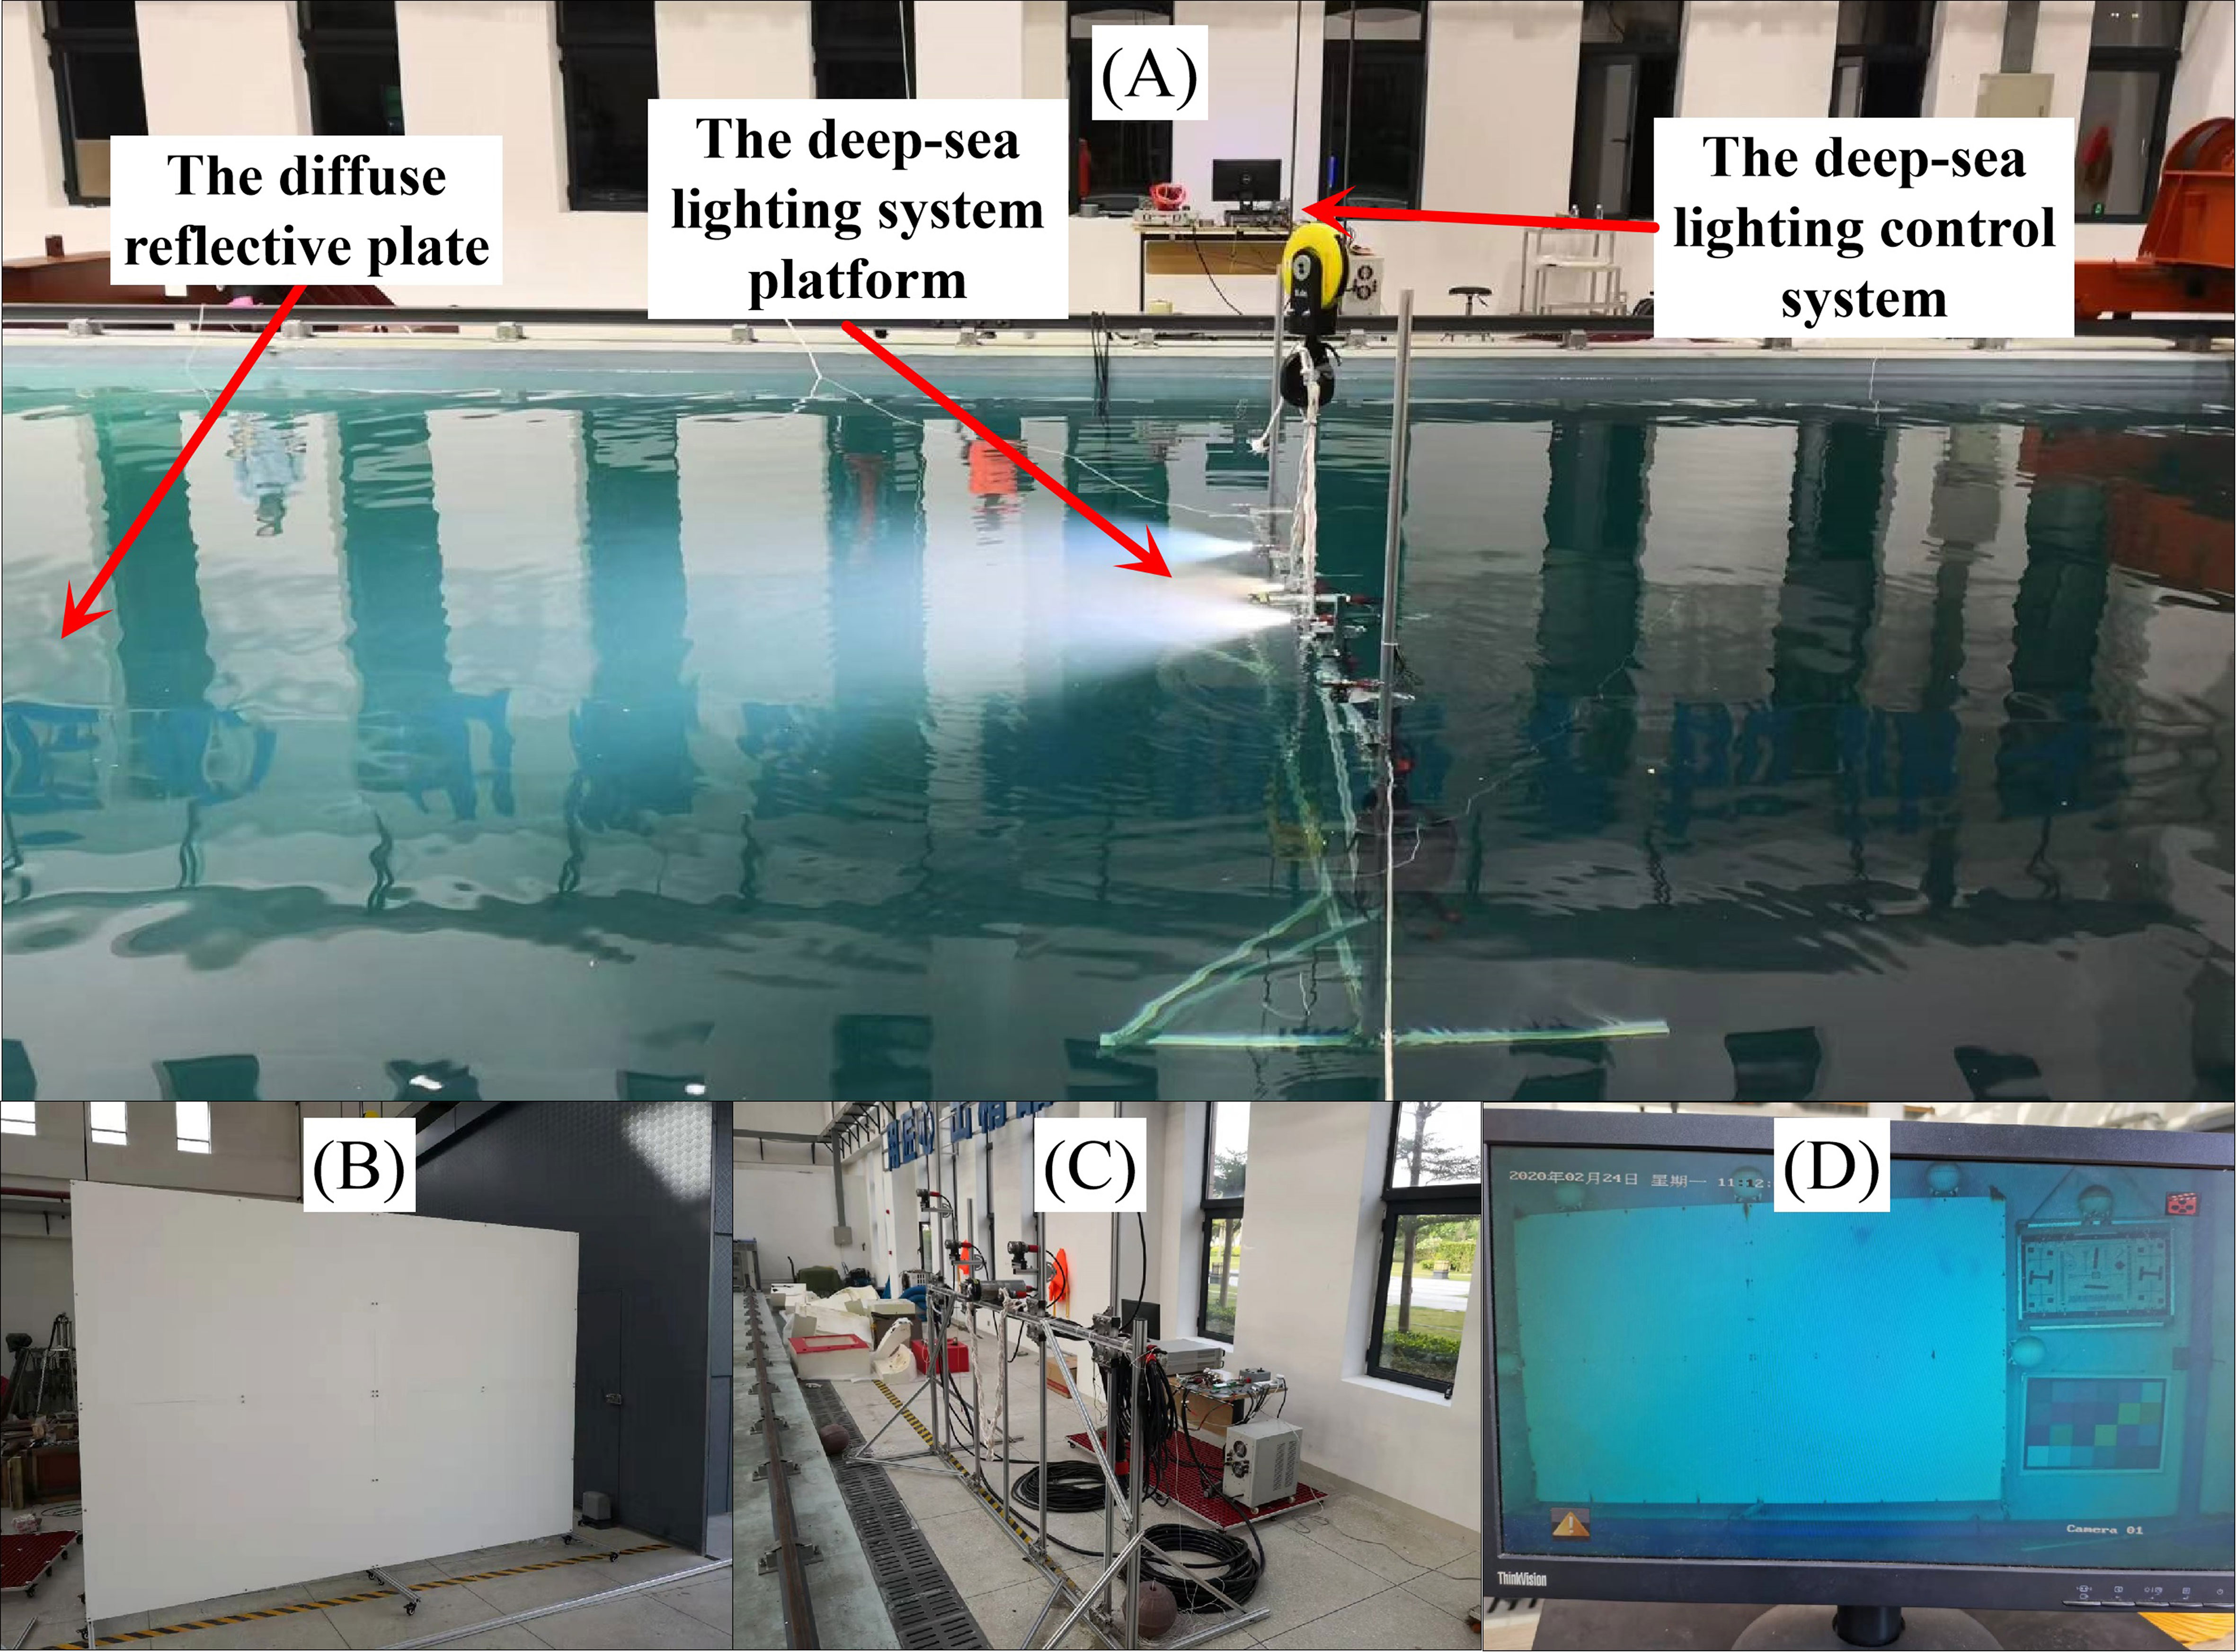
Figure 10 The experiment platform for deep-sea lighting system testing. (A) the experimental process; (B) the diffuse reflective plate with the size of 3.6m ×1.8m; (C) the deep-sea lighting system platform; (D) the captured experiment pictures.
The experiment was carried out in a dark environment. The diffuse reflective plate was placed on the bottom of the testing pool; the deep-sea lighting system platform is hang up with the crane. By controlling the crane, the distance between the diffuse reflective plate and lighting system can be adjusted. The deep-sea lighting control system consisted of the power system, monitor, and control panel. With the electric cable and optical cable, the lighting system platform can be controlled. There were three types of lamp, including two warm-light lamps, two cold-light lamps and two warm-light lamps. Each lamp had a luminous flux of 10000 lm, a beam angle of 75° and a power of 110 W. By adjusting the lighting lamp power and the lighting distance, the illumination data on the target surface could be derived. The experimental results are shown in Figure 11. The lighting distance was set to 3m, 6m and 10m, respectively. The power of the lighting system was set to 20%, 40%, 60%, 80% and 100%, respectively. Figure 11A shows the raw experiment data. Figure 11B shows the illumination distribution in the red wavelength band. Figure 11D shows the illumination distribution in green wavelength band. Figure 11D shows the illumination distribution in blue wavelength band. The experiment shows that 1) the illumination on target surface decreases with an increase in lighting distance; 2) the illumination on the target surface increases with an increase in lighting LED power; 3) the illumination distribution in the middle of target surface is brighter than that at the edge of the target surface; 4) the uniformity of illumination increases with an increase in lighting distance; 5) the bright spots in the picture are caused by the back-scattered light in the water; and 6) the illumination on the target surface with a lighting distance of 3m is oversized and the pictures are overexposed. This overexposure exists in red, blue and green wavebands. The optimal lighting power for red light is 80%, for green light this is 40%, and for blue light it is 60%, respectively. Overall, the optimal power setting is 40%. 7) the illumination on the target surface with a lighting distance of 6m is suitable and the picture is acceptable. Overexposure exists in the green waveband. The optimal lighting power for red light is 100%, for green light is 80%, and for blue light is 100%, respectively. Overall, the optimal power setting is 80%. 8) the illumination on the target surface with a lighting distance of 10m is low and the picture is underexposed. The optimal lighting power for red light, green light and blue light is 100%. However, this setting, with the power setting of 100%, cannot meet the lighting acquirements. Based on the analysis, the experimental results are consistent with the simulation results.
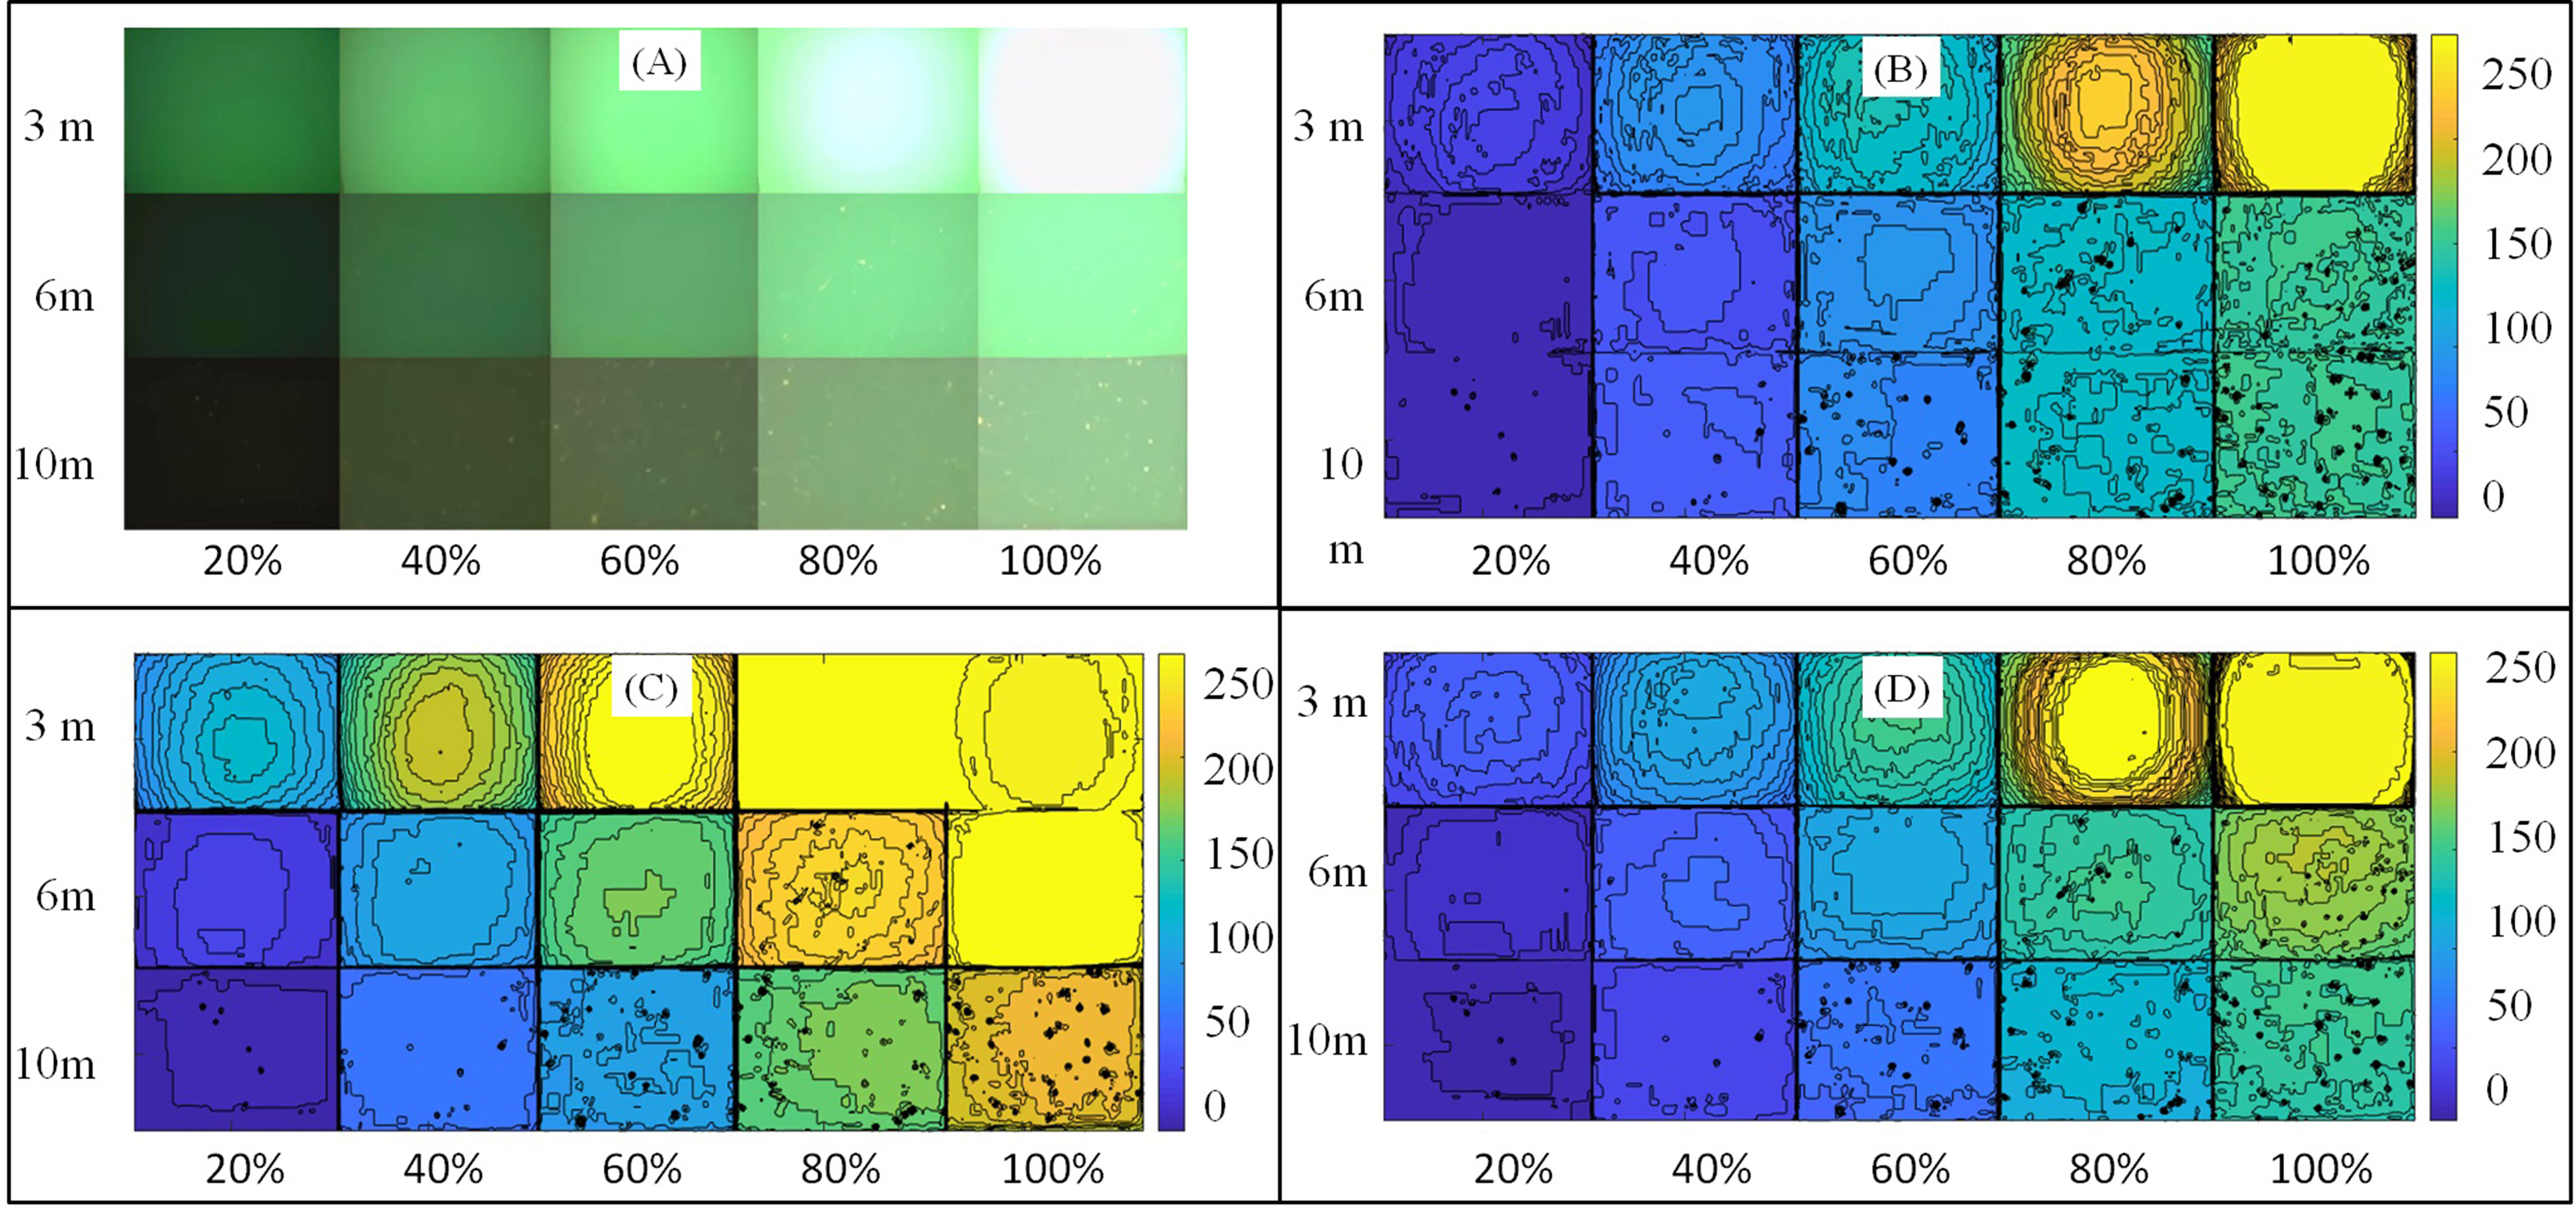
Figure 11 The experimental results of deep-sea lighting design. (A) the raw experiment picture data; (B) the illumination distribution in red wavelength band; (C) the illumination distribution in green wavelength band; (D) the illumination distribution in blue wavelength band.
4.2. The deep-sea lighting field design
After verifying the reliability of the deep-sea lighting field calculation model, we designed the deep-sea lighting based on the attenuation characteristics of light in deep-sea, as in Figure 2. We adopted the same lamp configuration as above. The simulation results are shown in Table 4. This shows that the optimal imaging distance is 3 M. With changes in the imaging distance, the optical power needs to be adjusted accordingly. The optimal luminous flux under different distances is proposed in the last column of Table 4. With the increase in distance, the illuminance value on the target plane decreases and the uniformity of illuminance gradually increases.
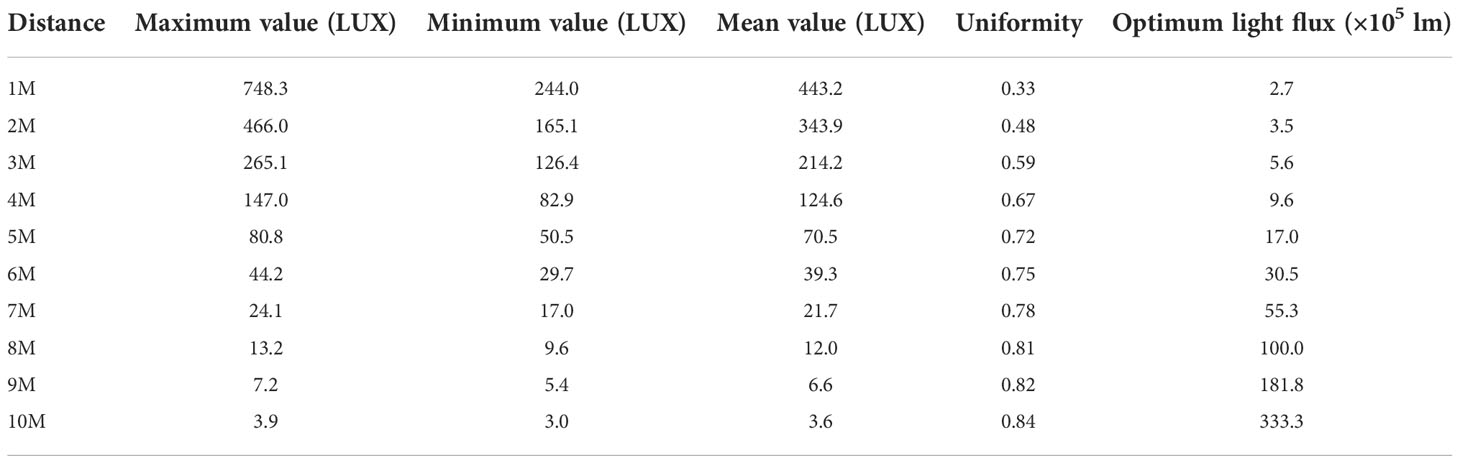
Table 4 The illumination distribution analysis in deep-sea environment.
5. Conclusion
Based on the experiment and simulation results, the following conclusions can be drawn: 1) When designing deep-sea lighting system, the attenuation characteristics of different wavelengths, as well as the spectral characteristics of different light sources, should be considered. 2) The simulation model has higher reliability for deep-sea lighting field simulation models, as that based on the spectral response function can overcome the influence of different wavelength attenuations under different water quality environments. 3) Generally, the red wavelength light decays more than blue light. If high-color-rendering pictures are required, the components of warm light should be increased. If an increased detection range and energy conservation are required, the components of blue light should be increased. 4) Due to the nonlinearity of light attenuation in water, the deep-sea lighting field design is also nonlinear. The deep-sea lighting field design should be carried out according to specific environments.
6. Discussion
Deep-sea lighting is a prerequisite for deep-sea optical imaging. It is also the technical basis for a series of deep-sea optical detection scenes. However, there is a huge difference between deep-sea lighting and terrestrial lighting. This paper proposed a deep-sea lighting field simulation model based on spectral response function and an optimal deep-sea lighting design. Firstly, by analyzing the spectral transfer function in the deep-sea lighting-imaging process, several key factors affecting deep-sea lighting were considered and a universal deep-sea lighting field computational model based on spectral transfer function was built. Then, the platform for studying the light attenuation was set up and the light attenuation characteristics were derived. Moreover, the deep-sea lighting field was quantitatively analyzed with a computer program. Finally, an experimental platform was set up to test the underwater lighting system. The result shows that the deep-sea lighting field computational model is accurate. The model can simulate different situations with different lamps, different angles, different lamp array positions, different water qualities and differen\t imaging distances. This study is significant in fields such as deep-sea artificial intelligence recognition, deep-sea real-time image analysis, deep-sea video image color correction, deep-sea spectral imaging, etc. It also has far-reaching significance for improving the efficiency of deep-sea scientific research and reducing the cost of deep-sea exploration.
Data availability statement
The original contributions presented in the study are included in the article/supplementary material. Further inquiries can be directed to the corresponding author.
Author contributions
Conceptualization, XQ; methodology, XQ and YW; analysis, XQ, KL, BL and YW; manuscript writing, XQ, BL, KL and YW. All authors contributed to the article and approved the submitted version.
Funding
This study was supported by the Hainan Provincial Natural Science Foundation of China (No. 2019RC258), the national key research and development program of China (No. 2018YFC0307903), the Youth Innovation Promotion Association CAS (No. 2020361), and the Scientific Instrument Developing Project of the Chinese Academy of Sciences (No. YJKYYQ20180067).
Acknowledgments
The authors thank Kelin Sun, Jingchuan Yang, Bing Zhang and Chen Li (Institute of Deep-sea Science and Engineering, Chinese Academy of Science) for their assistance during the experiment and test.
Conflict of interest
The authors declare that the research was conducted in the absence of any commercial or financial relationships that could be construed as a potential conflict of interest.
Publisher’s note
All claims expressed in this article are solely those of the authors and do not necessarily represent those of their affiliated organizations, or those of the publisher, the editors and the reviewers. Any product that may be evaluated in this article, or claim that may be made by its manufacturer, is not guaranteed or endorsed by the publisher.
References
Chang P. C. Y., Flitton J. C., Hopcraft K. I., Jakeman E., Jordan D. L., Walker J. G. (2003). Improving visibility depth in passive underwater imaging by use of polarization. Appl. Optics 42 (15), 2794. doi: 10.1364/AO.42.002794
Dickey T. D., Kattawar G. W., Voss K. J. (2011). Shedding new light on light in the ocean. Phys. Today 64 (4), 44–49. doi: 10.1063/1.3580492
Du R., Yang D., Jiang G., Song Y., Yin X. (2020). An approach for In situ rapid detection of deep-Sea aromatic amino acids using laser-induced fluorescence. Sensors 20 (1330), 1–13. doi: 10.3390/s20051330
Feng J.-C., Yan J., Wang Y., Yang Z., Zhang S., Liang S., et al. (2022). Methane mitigation: Learning from the natural marine environment. Innovation. 3 (5), 100297. doi: 10.1016/j.xinn.2022.100297
Garcia R., Nicosevici T., Cufí X. (2002). [IEEE Oceans 2002 Conference and Exhibition. - Biloxi, MI, USA (29-31 Oct. 2002)] Oceans \"02 MTS/IEEE - On the way to solve lighting problems in underwater imaging[J] 2, 1018–1024.
Giddens J., Turchik A., Goodell W., Rodriguez M., Delaney D. (2021). The national geographic society deep-Sea camera system: A low-cost remote video survey instrument to advance biodiversity observation in the deep ocean. Front. Mar. Sci. 7. doi: 10.3389/fmars.2020.601411
Gray R. (2004). Light sources, lamps and luminaires-Ronan Gray (Deepsea power & light) provides a brief introduction to a few important basics of underwater illumination. Sea Technol. 45 (12), 39–44. doi: 10.1016/j.oceaneng.2004.07.003
Guls J., Bjarnason ÓI, Pétursson Ó, Einarsson S. Ö., Foley J. T. (2016). Application of axiomatic design in designing autonomous underwater photography lighting. Proc. CIRP 53, 278–283. doi: 10.1016/j.procir.2016.07.009
Han B., Zhao W., Zheng Y., Meng J., Wang T., Han Y., et al. (2019). Experimental demonstration of quasi-omni-directional transmitter for underwater wireless optical communication based on blue LED array and freeform lens. Optics Commun. 434 (2019), 184–190. doi: 10.1016/j.optcom.2018.10.037
Huang H., Sun Z., Liu S., Di Y., Wu J. (2021). Underwater hyperspectral imaging for in situ underwater microplastic detection. Sci. Total Environ. 776 (3), 145960. doi: 10.1016/j.scitotenv.2021.145960
Jaffe J. S. (2010). Enhanced extended range underwater imaging via structured illumination. Optics Express 18 (12), 12328–12340. doi: 10.1364/OE.18.012328
Jaffe J. S. (2015). Underwater optical imaging: the past, the present, and the prospects. IEEE J. Oceanic Eng. 40 (3), 683–700. doi: 10.1109/JOE.2014.2350751
Jaffe J. (2016). To sea and to see: That is the answer. Methods Oceanography 15-16, 3–20. doi: 10.1016/j.mio.2016.05.003
Kocak D. M., Dalgleish F. R., Caimi F. M., Schechner Y. Y. (2008). A focus on recent developments and trends in underwater imaging. Mar. Technol. Soc. J. 42(1), 52–67. doi: 10.4031/002533208786861209
Mao X., Xu S., Hu X., Xie Y. (2017). Design of a smooth freeform illumination system for a point light source based on polar-type optimal transport mapping. Appl. Optics 56 (22), 6324–6331. doi: 10.1364/AO.56.006324
Marques T. P., Albu A. B., Hoeberechts M. (2019). A contrast-guided approach for the enhancement of low-lighting underwater images. J. Imaging. 5 (10), 79. doi: 10.3390/jimaging5100079
Mullen A. D., Treibitz T., Roberts P. L. D., Kelly E. L. A., Horwitz R., et al. (2016). Underwater microscopy for in situ studies of benthic ecosystems. Nat. Commun. 7 (1), 1–9. doi: 10.1038/ncomms12093
O'Byrne M., Schoefs F, Pakrashi V, Ghosh B. I. (2018). An underwater lighting and turbidity image repository for analysing the performance of image-based non-destructive techniques. Structure Infrastructure Eng. 14 (1), 1–20. doi: 10.1080/15732479.2017.1330890
Tong Z., Yang X., Chen X., Zhang H., Zhang Y., Zou H., et al. (2021). Quasi-omnidirectional transmitter for underwater wireless optical communication systems using a prismatic array of three high-power blue LED modules. Optics Express 29 (13), 20262–20274. doi: 10.1364/OE.429974
Xue Q., Tian Z., Bai Y., Liang J., Li C., Wang F., et al. (2021). Underwater hyperspectral imaging system using a Prism-Grating-Prism structure. Appl. Optics 60 (4), 894–900. doi: 10.1364/AO.415351
Yang D., Yang C. (2009). Detection of seagrass distribution changes from 1991 to 2006 in xincun bay, hainan, with satellite remote sensing. Sensors 9 (2), 830–844. doi: 10.3390/s90200830
Keywords: underwater optics, underwater imaging, underwater lighting, marine observation, object recognition
Citation: Quan X, Wei Y, Liu K and Li B (2022) The analysis and design of deep-sea lighting field based on spectral transfer function. Front. Mar. Sci. 9:1058201. doi: 10.3389/fmars.2022.1058201
Received: 30 September 2022; Accepted: 28 November 2022;
Published: 14 December 2022.
Edited by:
Ran Liao, Tsinghua University, ChinaReviewed by:
Dingtian Yang, South China Sea Institute of Oceanology, Chinese Academy of Sciences (CAS), ChinaQingsheng Xue, Ocean University of China, China
Copyright © 2022 Quan, Wei, Liu and Li. This is an open-access article distributed under the terms of the Creative Commons Attribution License (CC BY). The use, distribution or reproduction in other forums is permitted, provided the original author(s) and the copyright owner(s) are credited and that the original publication in this journal is cited, in accordance with accepted academic practice. No use, distribution or reproduction is permitted which does not comply with these terms.
*Correspondence: Xiangqian Quan, cXVhbnhxQGlkc3NlLmFjLmNu