 Echelle S. Burns
 Darcy Bradley
 Lennon R. Thomas
- 1Marine Science Institute, University of California, Santa Barbara, CA, United States
- 2Bren School of Environmental Science & Management, University of California, Santa Barbara, CA, United States
- 3Environmental Markets Lab, University of California, Santa Barbara, CA, United States
Sharks are susceptible to industrial longline fishing due to their slow life histories and association with targeted tuna stocks. Identifying fished areas with high shark interaction risk is vital to protect threatened species. We harmonize shark catch records from global tuna Regional Fisheries Management Organizations (tRFMOs) from 2012–2020 and use machine learning to identify where sharks are most threatened by longline fishing. We find shark catch risk hotspots in all ocean basins, with notable high-risk areas off Southwest Africa and in the Eastern Tropical Pacific. These patterns are mostly driven by more common species such as blue sharks, though risk areas for less common, Endangered and Critically Endangered species are also identified. Clear spatial patterns of shark fishing risk identified here can be leveraged to develop spatial management strategies for threatened populations. Our results also highlight the need for coordination in data collection and dissemination by tRFMOs for effective shark management.
1. Introduction
Fishing is the primary threat to shark populations globally (Worm et al., 2013; Davidson et al., 2016; Dulvy et al., 2021) and over one third of all chondrichthyans (sharks, rays, and chimaeras) are now threatened with extinction (Dulvy et al., 2021). Sharks are particularly vulnerable to overfishing because of their slow life history characteristics (Dulvy et al., 2008) and their close association with r-selected species, such as tunas, that are targeted by large-scale, high volume, industrial fisheries (Gilman, 2011). Increases in the footprint and intensity of industrial offshore fishing has reduced the abundance of oceanic sharks by more than 70% over the last 50 years (Pacoureau et al., 2021) with the majority of shark mortality from fishing resulting from incidental capture and discards (Worm et al., 2013).
The world’s tuna Regional Fishery Management Organizations (tRFMOs) are tasked with managing the stocks of highly migratory tuna and tuna-like species beyond national jurisdiction through mandates to adopt conservation and management measures (CMMs) using the best science available (Lobach et al., 2020). For shark species, data to make science-based decisions are often lacking due to underreporting (Worm et al., 2013; Ewell et al., 2020; Brown et al., 2021). The majority of longline shark catch is discarded, and discarded catch is often not recorded unless there is an independent observer on board (Worm et al., 2013). Currently, observer coverage for most longline fleets is low (~5%; Ewell et al., 2020). This paucity of data on shark catch means we lack an understanding of where sharks are being caught in high numbers and how to predict and identify these risk hotspots at spatial scales relevant to managers (Lewison et al., 2014). Yet, pelagic longline fisheries have the highest rate of shark bycatch of any industrial fishery (Oliver et al., 2015). This mismatch between sustainable catch levels of high productivity target stocks (e.g., tunas) and unsustainable catch levels of low productivity species subject to incidental capture (e.g., sharks) can be challenging to manage when there is little incentive to substantially reduce take of the target species to allow the “weak stock” to persist (Dulvy et al., 2008; Hastings et al., 2017).
One solution lies in spatial fisheries management strategies. When designed and managed well, these strategies can effectively mitigate incidental catch of pelagic species of conservation concern (Gilman et al., 2019). Marine protected areas that prohibit all commercial fishing, shark sanctuaries that ban commercial fishing of sharks within entire exclusive economic zones, and dynamic fishery closures all have demonstrated promise in theory and practice to effectively reduce fishing mortality of sharks (Boerder et al., 2019; Carlisle et al., 2019; Gilman et al., 2019; Curnick et al., 2020; MacNeil et al., 2020; Pons et al., 2022). Efforts to effectively design spatial management measures often leverage information on the movements and distribution of species based on animal tracking and/or direct observation of threatened species (reviewed in Hays et al., 2019). Locations of high overlap between species occurrence and fishing effort may be deemed “high risk” and identified as areas in need of conservation attention (e.g., Queiroz et al., 2019). However, a complete understanding of susceptibility to fishing also requires knowledge of encounter rate and catchability by fishing gears (Murua et al., 2021), which can be gleaned from fishery logbooks to infer fishing mortality (e.g., Queiroz et al., 2021). For incidentally caught species, a first step toward this goal requires assessing spatial patterns in capture events (e.g., Lewison et al., 2009; Lewison et al., 2014).
Here, we identify current hotspots of oceanic shark interactions with industrial longline fleets at the global scale. We identify general hotspots and examine risk to key species and family groups, with an eye to threatened shark populations. Our approach is to collate and summarize publicly available catch and effort data from global tRFMOs and use Random Forest machine learning models (Breiman, 2001) – which are known to efficiently recognize data patterns to provide robust estimates given small sample sizes and noisy or sparse data without requiring assumptions about data properties or concerns about interactions between predictor variables (Elith et al., 2006; Siroky, 2009; Qi, 2012; Olaya-Marín et al., 2013) – to identify the spatial distribution of catch risk to shark species. We focus on industrial longline fisheries within tRFMOs, because longliners have a near global distribution, representing the majority (84-87%) of hours of fishing effort in the high seas (Crespo et al., 2018), and have a high rate of incidental capture of sharks (Oliver et al., 2015). Our findings can be used to help managers strategically target spatial management strategies to combat shark overfishing and identify areas where more data are needed.
2. Materials and methods
2.1. Shark catch data
Publicly available shark catch data from longlines between 2012 and 2020 were collected from four tRFMOs (Supplementary Material, Table S1): Western and Central Pacific Fisheries Commission (WCPFC), Inter-American Tropical Tuna Commission (IATTC), International Commission for the Conservation of Atlantic Tunas (ICCAT) and Indian Ocean Tuna Commission (IOTC). This time frame was chosen to represent a current snapshot of fishing effort and ensure compatibility among tRFMO datasets and other datasets used in our modeling efforts (see section 2.2 Model parameters). We define “sharks” based on the species present in the tRFMO longline datasets, which includes species or species groups belonging to orders Carcharhiniformes, Lamniformes, and Orectolobiformes, though catches for the latter in longlines are rare (Table 1). We use the term shark “species” generally to refer to all species and species groups reported by tRFMOs (Table 2).
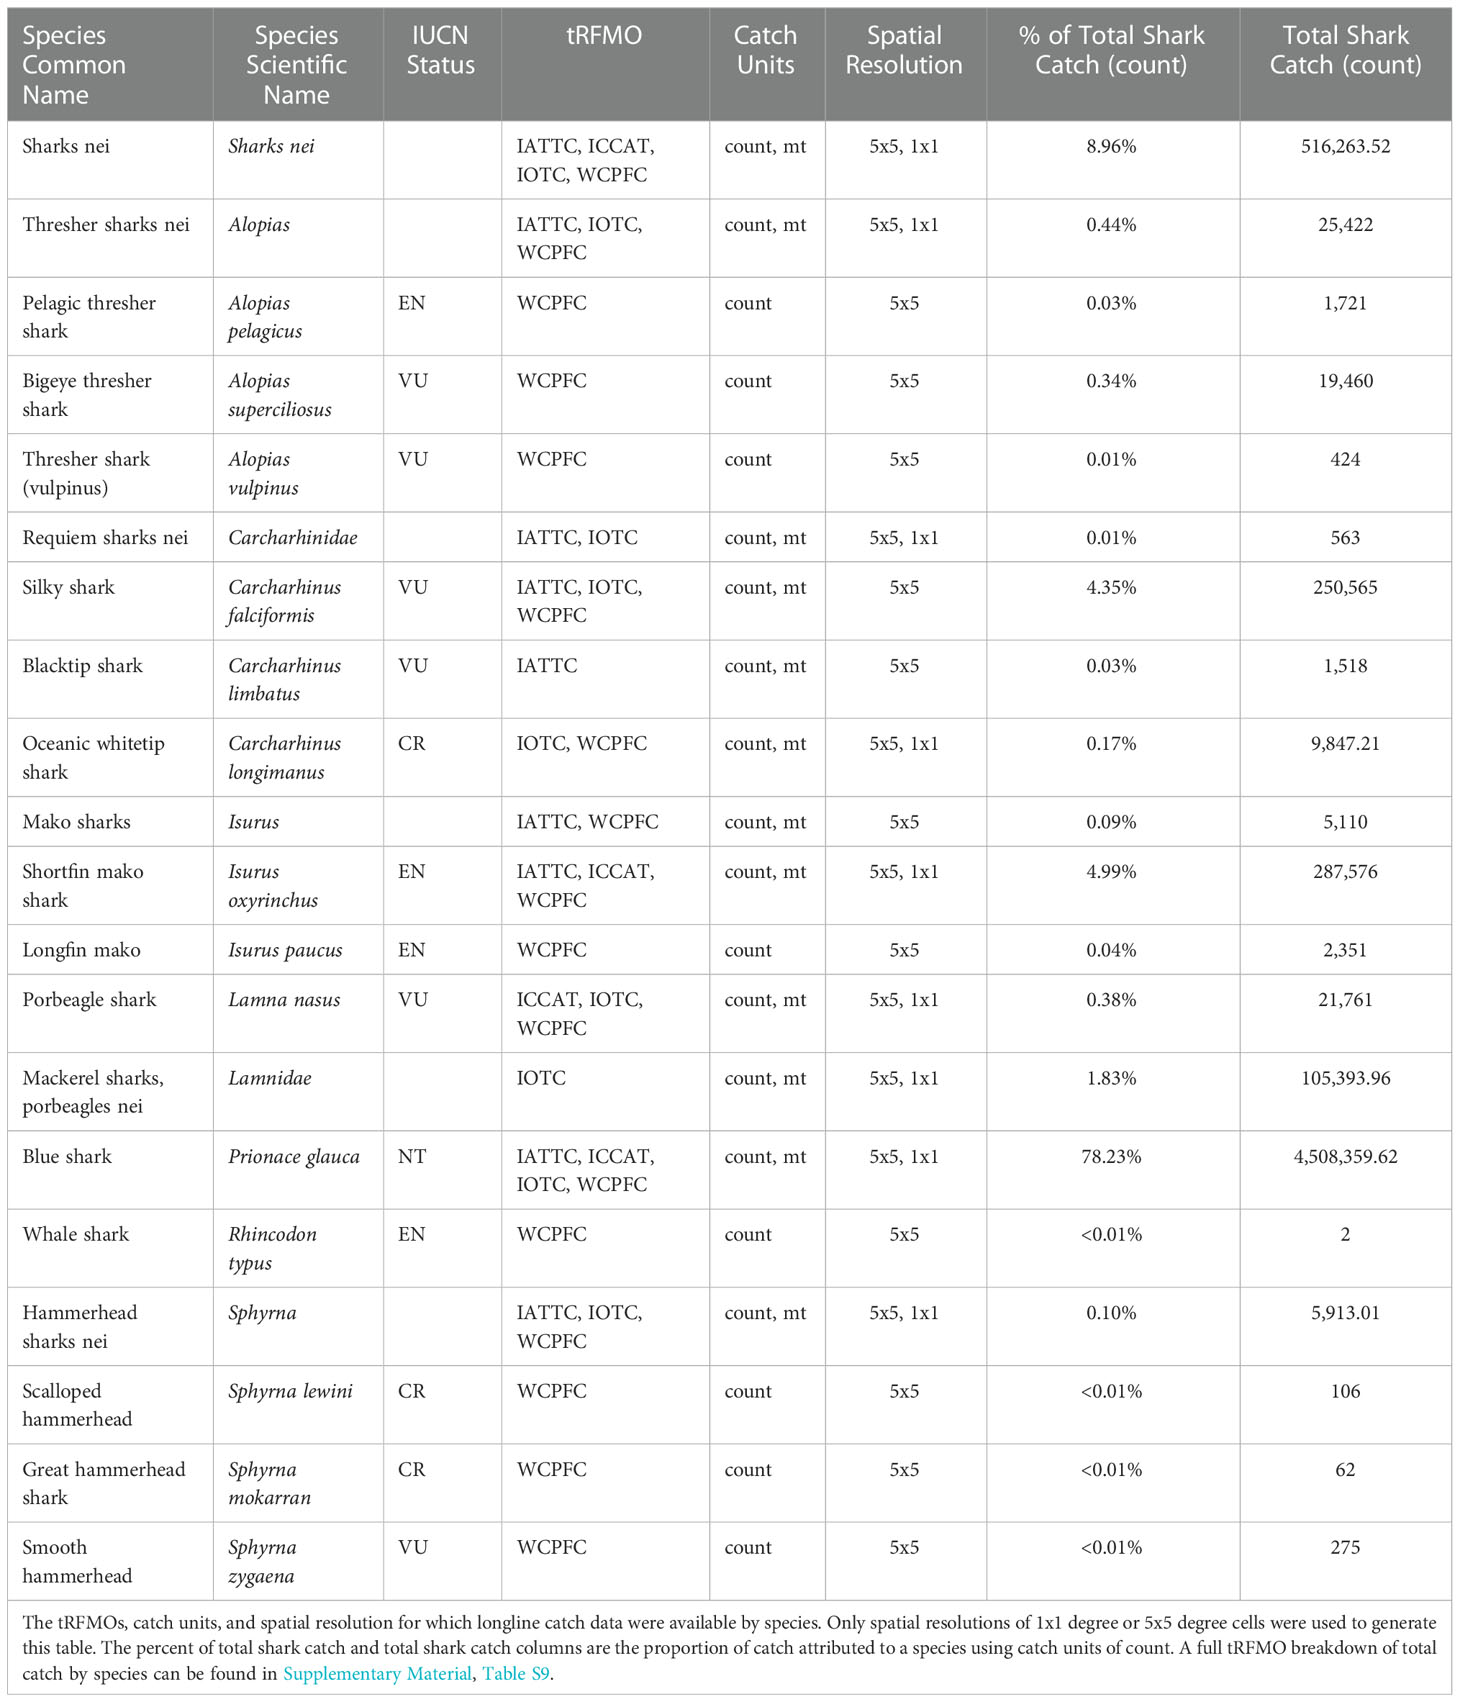
Table 1 Data overview by shark species.
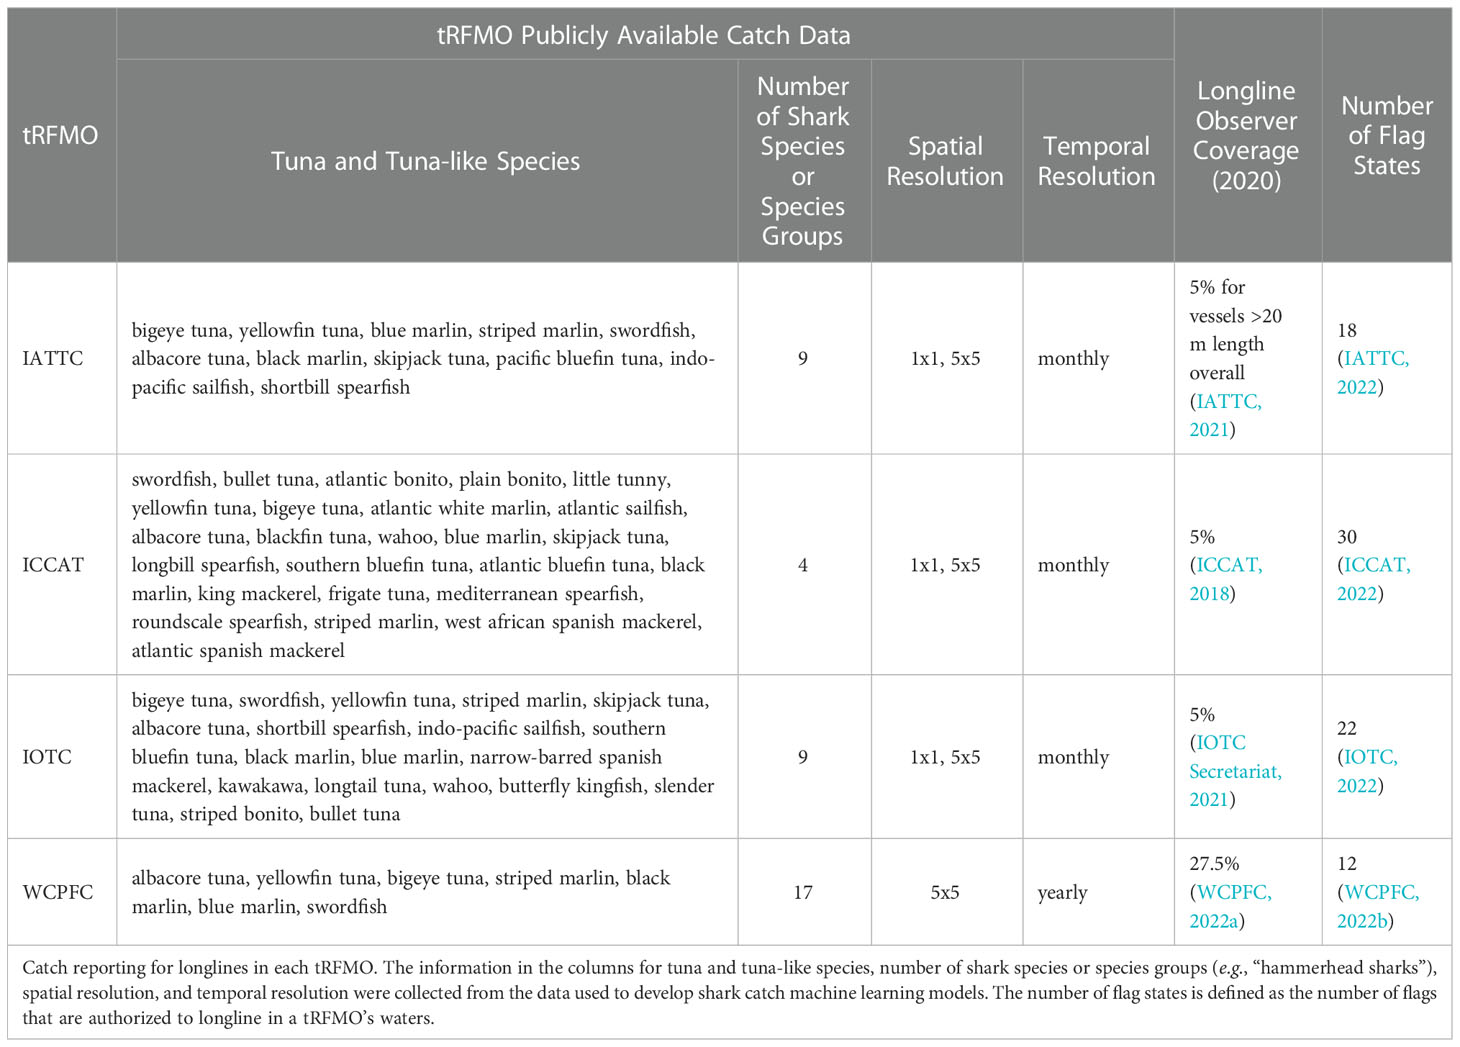
Table 2 Longline catch reporting metrics.
Shark catch data were self-reported by fishers for all tRFMOs except WCPFC, where data were reported by onboard observers. The fisher self-reported and observer catch data only contain non-zero values. We therefore assume that if any shark catch is reported in a cell, sharks that were not reported have a catch value of zero (Supplementary Material, Tables S2, S3). This assumption is founded on the belief that if fishers or observers are reporting catch, they will report all species or species groups that are caught given regulations to do so (Supplementary Material, Table S3), and will not selectively report some species and not others. The spatiotemporal resolution of data varied by tRFMO. Data that were reported at a 1x1 degree resolution or a 5x5 degree resolution were retained. While IATTC, ICCAT, and IOTC data were reported at monthly scales, WCPFC data were reported on an annual scale (Supplementary Material, Table S1). To maintain consistency across tRFMOs and predict shark catch risk at a global scale, data reported at an annual scale were used for this analysis; data that were reported at a monthly scale were summed to an annual scale. The reporting units for catch also varied by tRFMO, with shark catch reported in either counts or metric tonnes and effort reported in number of hooks (Supplementary Material, Table S1).
2.2. Model parameters
Fishing effort is known to have at least some influence on catch. We tested three different fishing effort parameters (Supplementary Material, Table S4). Publicly available fishing effort data associated with target catch (tuna and tuna-like species; “target effort”; Supplementary Material, Figure S1) and shark catch (“shark effort”; Supplementary Material, Figure S2) specifically were collected from WCPFC, IATTC, ICCAT, and IOTC for longline vessels through 2020. All fishing effort data except WCPFC are self-reported by fishers and included vessel flag information; WCPFC fishing effort data are reported by observers and do not include vessel flag information. The procedure used to parse data on a spatiotemporal scale for shark catch was also applied to the fishing effort data. Due to potential spatial or reporting biases in observer and self-reported datasets, respectively, independent effort data were also collected from the Global Fishing Watch (GFW) database (Kroodsma et al., 2018; Supplementary Material, Figure S3). GFW compiles and analyzes automatic identification systems (AIS) data, which are transmitted through a network of terrestrial and satellite receivers, and uses observed changes to vessel movement to infer fishing activity, which they report using various fishing effort metrics (Kroodsma et al., 2018). We downloaded GFW fishing effort reported in kilowatt hours (“GFW effort”), a measure of fishing intensity, at 5x5 and 1x1 degree resolutions from 2012 (the first year data are available) to 2020. All data used to parameterize the shark catch risk model were subsequently subset or queried to represent a current snapshot of shark catch and match the temporal range of the GFW fishing effort dataset (2012–2020).
We assembled key environmental parameters known to influence shark occurrence (Supplementary Material, Table S4). Sea surface temperature (SST; °C; Supplementary Material, Figure S4) and chlorophyll-A (milligram m-3; Supplementary Material, Figure S5) data were compiled from the NOAA Coastwatch ERDDAP data server (dataset IDs: erdHadISST and pmlEsaCCI42OceanColorMonthly, respectively) from 2012–2020. Sea surface height (meters; Supplementary Material, Figure S6) data were available from 2012–2019 (Zlotnicki et al., 2019) and 2020 values were interpolated using values from the three nearest neighbors. All environmental data were aggregated to 5x5 and 1x1 degree resolutions and the mean and coefficient of variation (CV) per cell were calculated.
Sharks cannot be caught where they are not present. We included a measure of species occurrence using species distribution model (SDM) polygons from IUCN for all shark species reported as longline catch by tRFMOs (IUCN, 2022). The original probability categories in the IUCN dataset include: 1 (extant), 2 (probably extant), 3 (possibly extant), 4 (possibly extinct), 5 (extinct), 6 (presence uncertain; excluded from the dataset, IUCN SSC Red List Technical Working Group, 2021). We converted these to values between 0 (extinct) and 1 (extant) to represent probability of occurrence in a cell (Supplementary Material, Figures S7–S21). For shark catch reported to the family or group (e.g., “Species nei”) level, the mean of SDMs for all relevant species was calculated. Data were aggregated to 5x5 and 1x1 degree resolutions.
We assume that shark species with higher monetary value are more likely to be targeted by longline fisheries. Species-specific ex-vessel prices were generated using methods from Melnychuk et al. (2017) for 2012–2020 (Supplementary Material, Tables S5, S6). For species with catch data, but no ex-vessel price information, a median ex-vessel price was calculated by year for all shark species collectively. Values for the year 2020 were inferred by multiplying the 2019 ex-vessel price by the estimated inflation rate for the US in 2020 (1.2%).
2.3. Identifying hotspots of shark interactions with industrial longline fishing
We built Random Forest (RF) machine learning models to estimate spatially explicit shark catch risk. The RF modeling approach consists of a series of “trees” that are trained independently using a combination of predictor variables and rows of data that are randomly resampled from a training dataset (Breiman, 2001). Combining results from all trees within a “forest” allows for an efficient, accurate, and robust prediction of the response variable with low risk of overfitting (Breiman, 2001). A testing dataset is reserved to evaluate the predictive power of the RF model. RF models are increasingly applied to ecological and fisheries data for their proven ability to provide robust predictions and superior performance in the face of common challenges associated with sparse data collection efforts, low sample sizes, and noisy data (Luan et al., 2020). The RF modeling approach does not require assumptions about data properties, which is a constraining feature of traditional parametric regression, and model performance is not impeded by interactions between predictor variables (Qi, 2012). RF modeling is used for both classification and regression problems, and has proven to be particularly useful in marine research to build species distribution models (Luan et al., 2020), estimate small-scale fishing effort (Behivoke et al., 2021), and estimate bycatch risk via echosounder data (Mannocci et al., 2021). Our motivation for using this RF approach to predict shark catch risk is threefold: (1) it does not bind us to parametric or non-parametric approaches like traditional regression analyses, (2) it allows us to leverage our sample to predict over areas in which no catch was originally reported, which is particularly useful for overcoming spatiotemporal observation biases, and (3) it provides a robust prediction that can be easily refined as more data become available (Breiman, 2001; Siroky, 2009).
Individual RF models were created to predict shark catch risk (catch in counts) for each tRFMO using the tidymodels R package (Kuhn and Wickham, 2020). All reported shark catch was retained in the model, though we note that not all caught sharks were landed (e.g., 12.37% landed, 50.88% discarded, and 36.76% unknown fate in WCPFC from 2012–2020). Shark catch risk is therefore an estimate of the likelihood that a shark will be caught, but not necessarily be killed, by a longline vessel in a spatial cell.
For each tRFMO, we tested various spatial resolutions and shark catch units to determine the most appropriate dataset for future model runs, identified by the highest R2 for each tRFMO. Once a resolution and unit were selected for a tRFMO, the same resolution was used in future model runs (Supplementary Material, Table S7). The resolutions of data that were tested include:
1. Catch (count) and effort (target effort, shark effort, and GFW effort) at a 5x5 degree resolution (all tRFMOs);
2. Catch (mt) converted to count using weight to count measurements described in Worm et al. (2013) for small coastal, pelagic, large coastal, and deep-water species and effort (target effort, shark effort, and GFW effort) at a 5x5 degree resolution. Catch data that were converted to count were added to catch data already reported as count (IATTC, ICCAT, IOTC);
3. Catch (count) and effort (target effort, shark effort, and GFW effort) at a 5x5 degree resolution evenly distributed into 25 cells at a 1x1 degree resolution (catch/25, effort/25). Catch data that were converted to a 1x1 degree resolution were added to data already reported at a 1x1 degree resolution (all tRFMOs);
4. Catch and effort (target effort, shark effort, and GFW effort) at a 5x5 degree resolution evenly distributed into 25 cells at a 1x1 degree resolution (catch/25, effort/25). Catch data that were converted to a 1x1 degree resolution were added to data already reported at a 1x1 degree resolution. Catch data reported in mt were converted to count using weight to count measurements described in Worm et al. (2013) for small coastal, pelagic, large coastal, and deep-water species and effort at a 5x5 degree resolution. Catch data that were converted to a 1x1 degree resolution or that were converted to count were added to catch data already reported at a 1x1 degree resolution as count (IATTC, ICCAT, IOTC).
We employed a two-phase approach to conduct a feature selection procedure via the “wrapper” method described by Kuhn and Johnson (2019). The wrapper method uses different combinations of predictor variables to evaluate model performance (Supplementary Material, Table S7). In Phase 1, we tested our three different fishing effort metrics: target effort (number of hooks, by flag when available), shark effort (number of hooks, by flag when available), and GFW effort (kilowatt hours). Other predictors were held constant, including mean SST, mean chlorophyll-A, and species suitability. We used R2 to determine which dataset and effort metric best predicted shark catch risk. In Phase 2, we used the best performing dataset and metric found in Phase 1 to conduct a second wrapper-based feature selection procedure to test the combinations of the following variables: SST (mean or mean and coefficient of variation), chlorophyll-A (mean or mean and coefficient of variation), sea surface height (mean or mean and coefficient of variation), species-specific ex-vessel prices, and group-wide ex-vessel prices.
For each model, we grouped shark catch data into five spatial clusters using spatial dissimilarity matrices and then randomly split catch across combinations of years and spatial clusters into training (75% of all data; n = 19,393 [WCPFC], 254,475 [IATTC], 10,125 [IOTC], 6,444 [ICCAT] rows) and testing datasets (25% of all data; n = 6,464 [WCPFC], 84,825 [IATTC], 3,375 [IOTC], 2,148 [ICCAT] cells) to ensure that model performance was not based purely on spatiotemporal autocorrelation. Shark catch records and reported fishing effort are incomplete due to low observer coverage or partial self-reporting. To accommodate this and not limit our spatial risk estimation to cells with reported shark catch only, we allowed our model to predict shark catch over the entire spatial footprint of longline fishing effort, even if no sharks were reported in a fished cell. For each year, we gathered all cells in which shark catch or fishing effort by longlines was reported. For cells in which effort was reported, but shark catch was not, we recorded catch as 0 for each shark species and species group in our dataset. Similarly, for cells in which shark catch for at least one species was reported, we recorded catch as 0 for all other shark species and species group in our dataset (Supplementary Material, Tables S2, S3).
Due to the large number of 0 catch values within the dataset, we used a hurdle model approach (Mullahy, 1986). First, shark catch within the training dataset was classified as either “present” (catch > 0) or “absent” (catch = 0). To ensure a balanced training dataset, the minority classification (shark catch present) was randomly upsampled until there was an equal number of both classification groups (using the themis R package; Hvitfeldt, 2022). Numerical predictor variables were then centered and scaled and missing numerical data were imputed using data from three nearest neighbors. Missing categorical values were assigned as “unknown” factors and dummy variables were created for each categorical variable. Finally, all predictors that contained only a single value were removed (e.g., if a particular flag only reported effort once throughout the time series, the column for that flag was removed from the model).
The resulting dataset was used to train an RF classification model (Luan et al., 2020) to predict either shark catch presence or absence. We then trained an RF regression model on the “presence” data to predict shark catch in each cell. Due to potential reporting biases in observer or self-reported data, model results are not intended to be viewed as actual catch estimates, but rather hotspots of potential catch risk. The final prediction of shark catch risk was the product of the outcome from the classification model and the regression model. Models were run with 500 trees.
The general formula for each of the models was:
Component 1: Random Forest Classification Model
Component 2: Random Forest Regression Model
Final Prediction:
To avoid overfitting, we generated a new dataset in which fishing effort and environmental variables in each cell were assigned a random value from a normal distribution using the mean and standard deviation of the predictor in the cell across all years (2012–2020). We then used the same hurdle model procedure to identify spatial hotspots of shark interactions with longline fisheries globally.
All code and data required to reproduce this analysis are available on Zenodo (Burns et al., 2022a) and Dryad (Burns et al., 2022b), respectively.
3. Results
3.1. tRFMO shark catch and effort
Collation and harmonization of publicly available tRFMO data provide a geospatial estimate of areas with high reported shark catch (count), effort associated with shark catch (hooks), and shark CPUE (count/hook, Figure 1). Due to differences in reporting requirements across tRFMOs and the general scale of data reported, values were scaled on a tRFMO basis for visualization. Areas in each tRFMO with the highest reported catch, effort, or CPUE for sharks often do not overlap with each other (Supplementary Material, Table S8). WCPFC has the highest degree of overlap among high value cells, with the overlap of high shark catch and shark CPUE (21.1% of cells), and the overlap of high shark catch and effort associated with shark catch (20.7% of cells). The remaining 58.2% of high value cells do not overlap with another metric. Comparatively, IATTC has the lowest degree of overlap, with 87.3% of high value cells having no overlap with other metrics. The low degree of overlap among shark catch, effort associated with shark catch, and shark CPUE indicates the need for a modeling framework that does not assume a simple, linear relationship between these metrics.
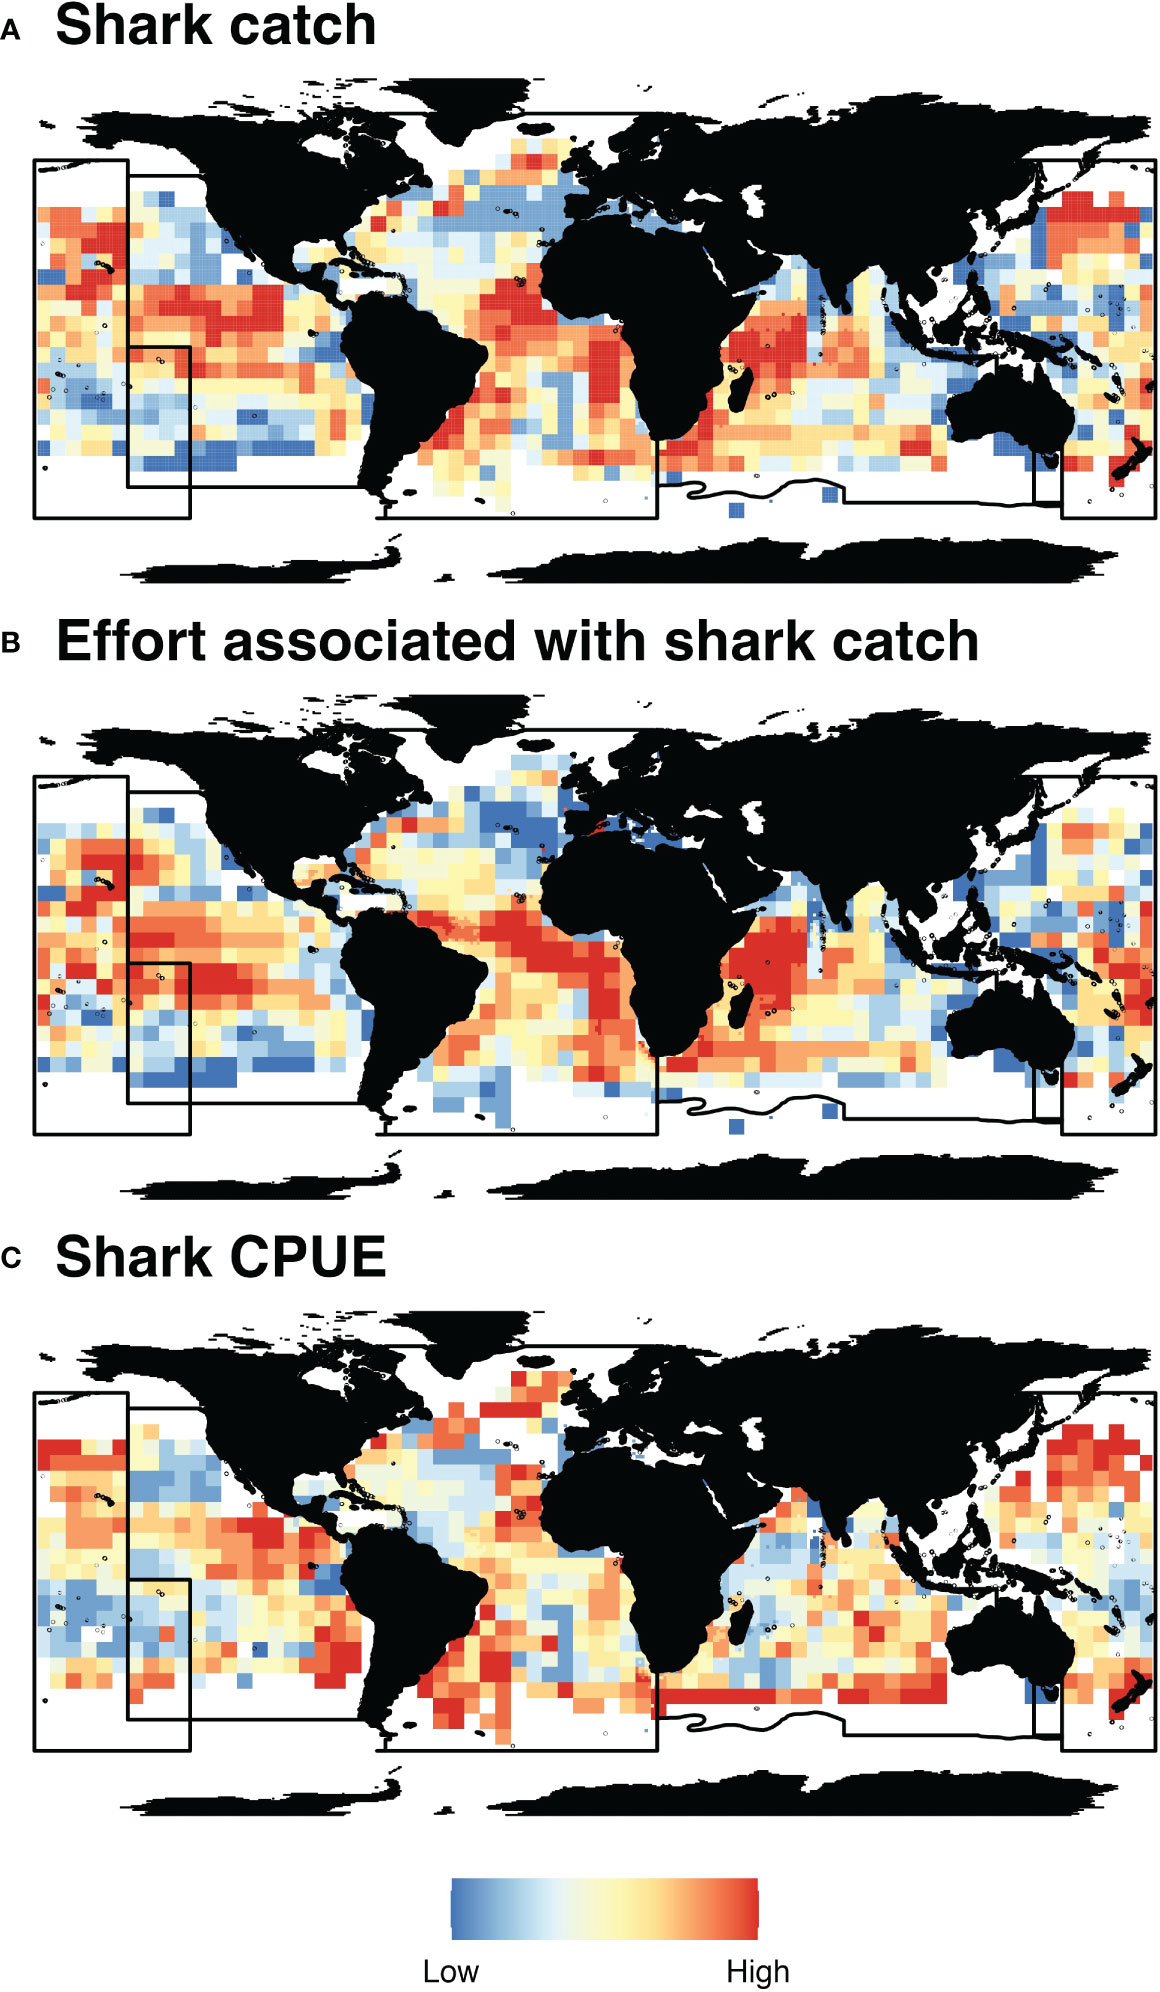
Figure 1 Spatial distribution of tRFMO catch and effort data. tRFMO mean annual shark catch (count, A), effort associated with shark catch (hooks, B) and shark CPUE (count/hook, C) from publicly available longline data between 2012–2020. Data from each tRFMO were scaled independently using quantiles between 0 and 1 at 0.1 increments. Blue colors indicate areas of low shark catch, effort, and CPUE, while red colors indicate areas of high shark catch, effort, and CPUE. Black lines indicate tRFMO boundaries.
Areas with the highest shark CPUE (count/hook) are typically associated with catches of blue shark (Prionace glauca, 78.23% of total reported tRFMO shark catch globally; Supplementary Material, Table S9) or shortfin mako shark (Isurus oxyrinchus, 4.99% of total reported tRFMO shark catch globally; Supplementary Material, Table S9), but species-level CPUE varied spatially. In WCPFC, areas with high CPUE are offshore of western New Zealand, dominated by blue sharks, porbeagle sharks (Lamna nasus), and shortfin mako sharks. Comparatively, areas of high CPUE in IATTC correspond to silky sharks (Carcharhinus falciformis) along the coast of Mexico and blue and shortfin mako sharks off Chile. Areas of high CPUE in ICCAT extend from coastal Brazil to Argentina for blue, shortfin mako, and porbeagle sharks. Areas of high CPUE in IOTC are offshore of South Africa and southwestern Australia for blue sharks. The highest diversity of shark species is reported by the WCPFC (n = 12 true species [i.e., not “sharks nei” or other grouped categories]; compared to n = 4, 4, 3, species in IATTC, IOTC, and ICCAT, respectively), which is more likely a reflection of differences in reporting requirements as opposed to differences in true catch rates of different species.
Areas of high tuna catch in each tRFMO were identified for the three most frequently reported tuna species: bigeye tuna (Thunnus obesus), albacore tuna (T. alalunga), and yellowfin tuna (T. albacares, Figure 2). Bigeye and yellowfin tuna catch is highest in the central oceans whereas albacore tuna catch is distributed across the southern oceans, consistent with each species' habitat preferences (Arrizabalaga et al., 2015). Within areas of high tuna catch, mean CPUE for shark species is consistently low across tRFMOs and years. The summed mean CPUE for all shark species does not exceed 10 individuals per 10,000 hooks and summed mean CPUE for threatened shark species' (IUCN categories of Vulnerable, Endangered, or Critically Endangered) does not exceed 0.05 individuals per 10,000 hooks.
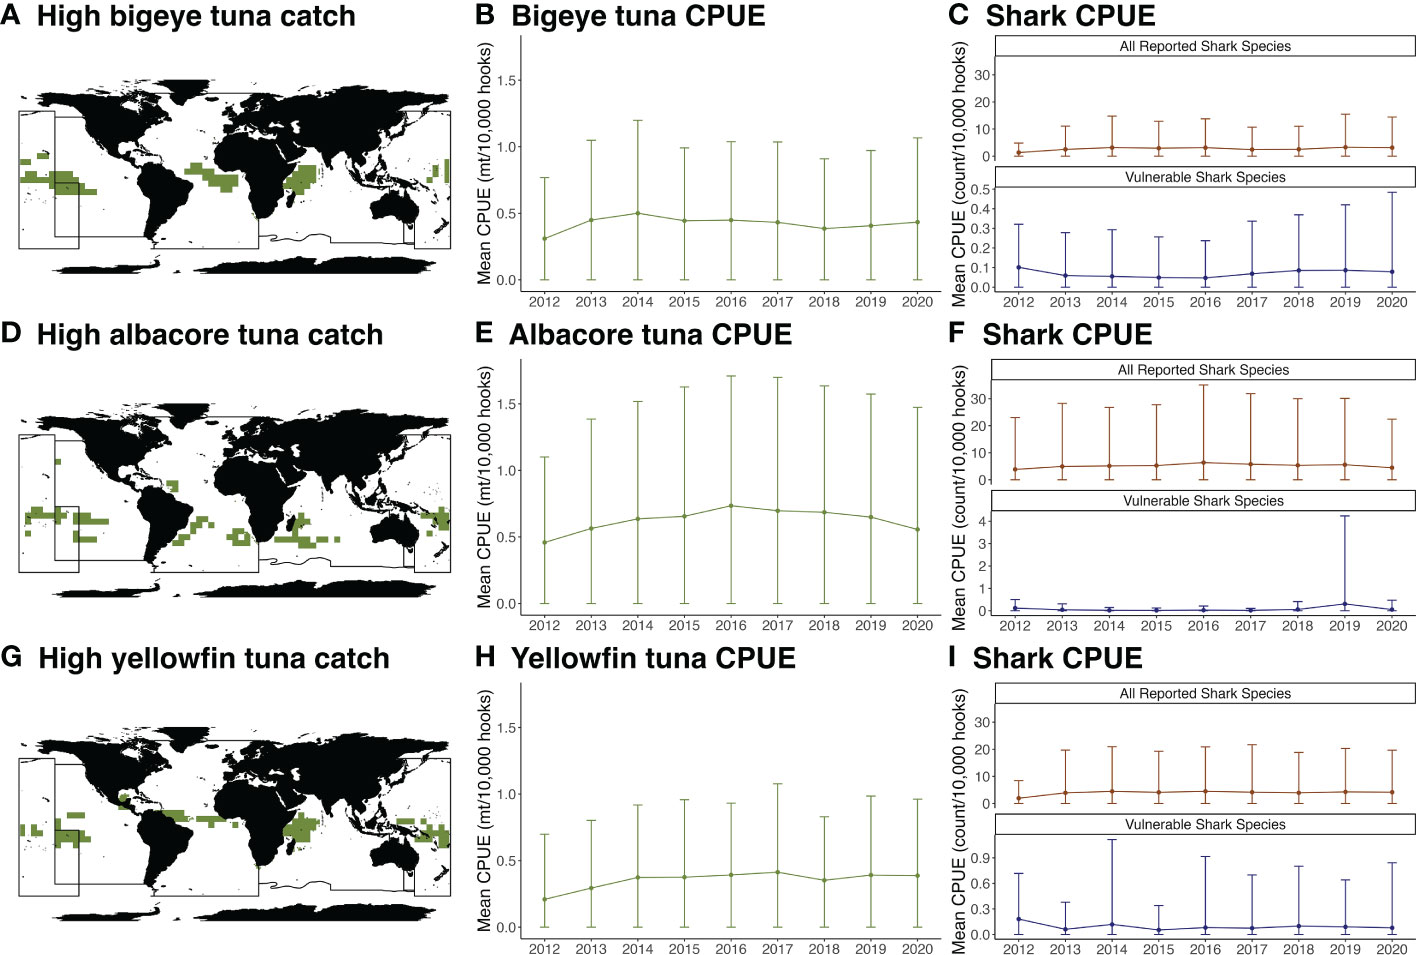
Figure 2 Overlap between areas of high tuna catch and shark catch. Areas in each tRFMO greater than or equal to the 90% quantile for mean annual longline catch of target species: (A) bigeye tuna, Thunnus obesus, (D) albacore tuna, Thunnus alalunga, and (G) yellowfin tuna, Thunnus albacares. The mean (dots) and standard deviation (error bars) of catch per unit effort (mt/10,000 hooks) for target species in those regions for (B) bigeye tuna, (E) albacore tuna, (H) yellowfin tuna. The mean (dots) and standard deviation (error bars) of catch per unit effort (count/10,000 hooks) of all reported shark species and threatened shark species (Critically Endangered, Endangered, and Vulnerable by the IUCN) in those regions (C, F, I). Black lines in panels (A, D, G) represent tRFMO boundaries. Note that WCPFC shark catch data were not reported in 2012.
3.2. Global hotspots of shark catch risk
The best performing RF models vary slightly among tRFMOs and result in a more comprehensive picture of shark catch risk than tRFMO catch reports alone (Supplementary Material, Table S10, Figures S22-S25). Sea surface temperature, chlorophyll-A, species suitability, and species identity serve as important predictors across all tRFMOs (Table 3; Supplementary Material, Figures S26-S29). Sea surface height improved model performance for IATTC only, and ex-vessel prices improved model performance for IOTC and WCPFC. Remotely sensed GFW fishing effort, which was tested in lieu of effort reported with target catch or shark catch, did not improve model performance and, therefore, was not used in any of the final model runs. For all shark species, areas of high catch risk are primarily located within the ICCAT jurisdiction, off the coast of Southwestern Africa and in the Central Atlantic Ocean (Figure 3A; Supplementary Material, Figures S30, S31). Areas of high catch risk for threatened species are concentrated offshore of Central America in the Eastern Tropical Pacific, partially abutting the Costa Rica Thermal Dome (Figure 3B). Overall, areas of high catch risk for sharks appear to correspond to areas of high risk for the three most prominently reported shark species: blue (Near Threatened; Supplementary Material, Figure S32), shortfin mako (Endangered; Supplementary Material, Figure S33), and silky sharks (Vulnerable; Supplementary Material, Figure S34). Shark catch risk areas were consistent across various “risk” thresholds examined, with higher upper bounds and smaller lower bounds serving to spatially constrain identified hotspots but not affect their location (Supplementary Material, Figure S31). Catch risk for all sharks reported at the species level are shown in the Supplementary Material Figures S32–S46.

Table 3 Random Forest model performance.
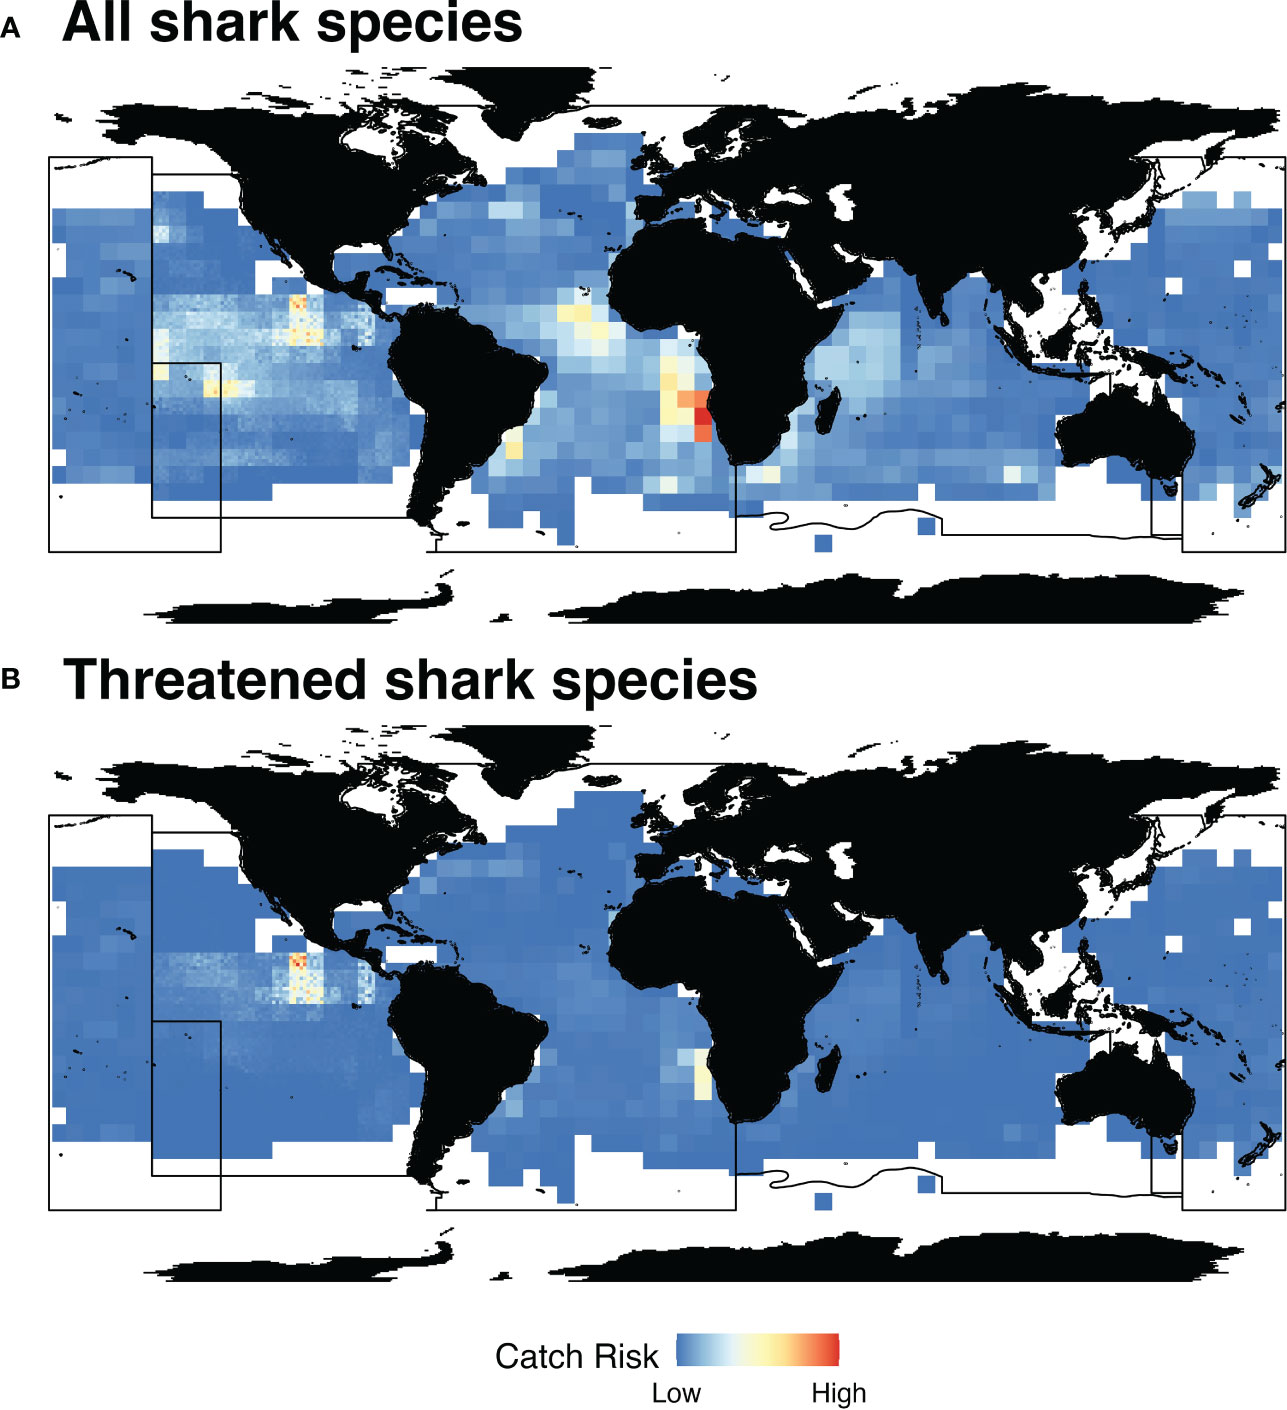
Figure 3 Shark catch risk. Estimated spatial risk for shark catch at a global scale for all tRFMO reported shark species combined (A) and threatened shark species (Critically Endangered, Endangered, and Vulnerable by the IUCN) (B). Areas in blue represent low shark catch risk, while areas in red represent high shark catch risk. Black lines represent tRFMO boundaries.
In addition to blue, shortfin mako, and silky sharks being the most prominently reported shark species, they are also most evenly represented across three or more tRFMOs (Figure 4). We calculated the number of high catch risk cells within each tRFMO independently. The relative percentage of high-risk cells within a particular tRFMO for blue sharks is similar across tRFMOs, while a higher percentage of cells are high-risk for both shortfin mako and silky sharks within WCPFC boundaries. The majority of other species are represented across fewer tRFMOs (e.g., longfin mako shark [Isurus paucus], oceanic whitetip shark [C. longimanus]) or are predicted in small quantities, rarely exceeding the threshold required to be considered high risk (e.g., porbeagle sharks, common thresher sharks [Alopias vulpinus]).
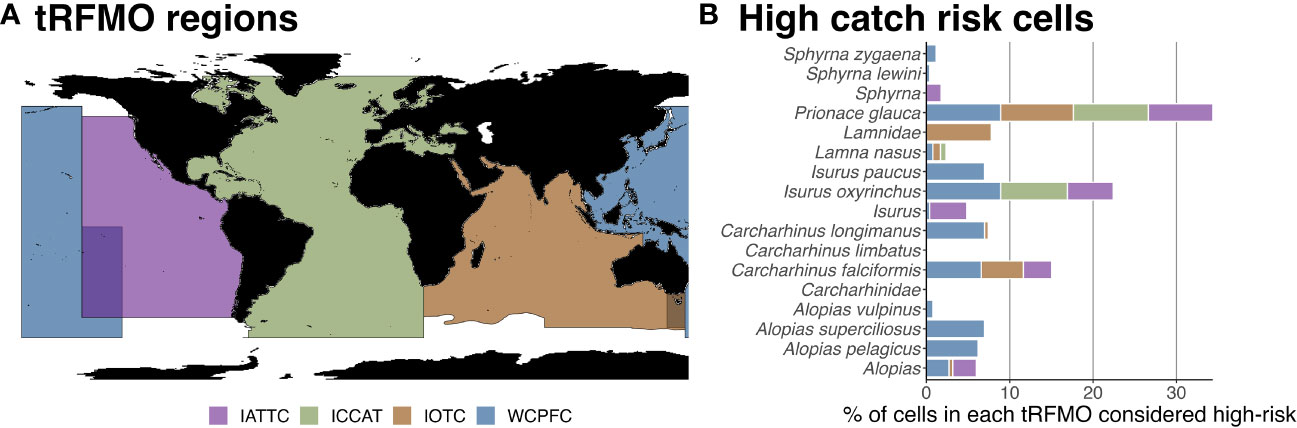
Figure 4 Distribution of high-risk cells across tRFMOs. The percentage of cells within a particular tRFMO (A) that are considered high-risk for shark species (B). High-risk cells are areas in which the mean annual predicted catch of a species in a tRFMO is greater than or equal to the 90% quantile. Quantiles were calculated using non-zero mean annual predicted catch values.
We also investigated the overlap of areas of high catch risk for shark species across different IUCN Red List categories (Figure 5). Several species categorized as Critically Endangered (1 of 5 species reported), Endangered (2 of 3 species reported) and Vulnerable (2 of 5 species reported) were found to have high-risk cells offshore of the Hawaiian Islands (Figure 6). Although great hammerhead (Sphyrna mokarran; Critically Endangered), whale (Rhincodon typus; Endangered), and blacktip sharks (C. limbatus; Vulnerable) appear in catch reports, interactions with these species in longline tRFMOs were reported so rarely that they resulted in a global predicted catch risk of 0. In addition, areas of high-risk for both blue and shortfin mako sharks show moderate overlap. Blue, shortfin mako, and silky sharks are the only species that exhibit high catch risk areas covering large expanses of oceans across at least two tRFMOs, which could be a reflection of relatively high global abundances, a high degree of association with target stocks, and/or greater consistency in reporting standards across tRFMOs for these species.
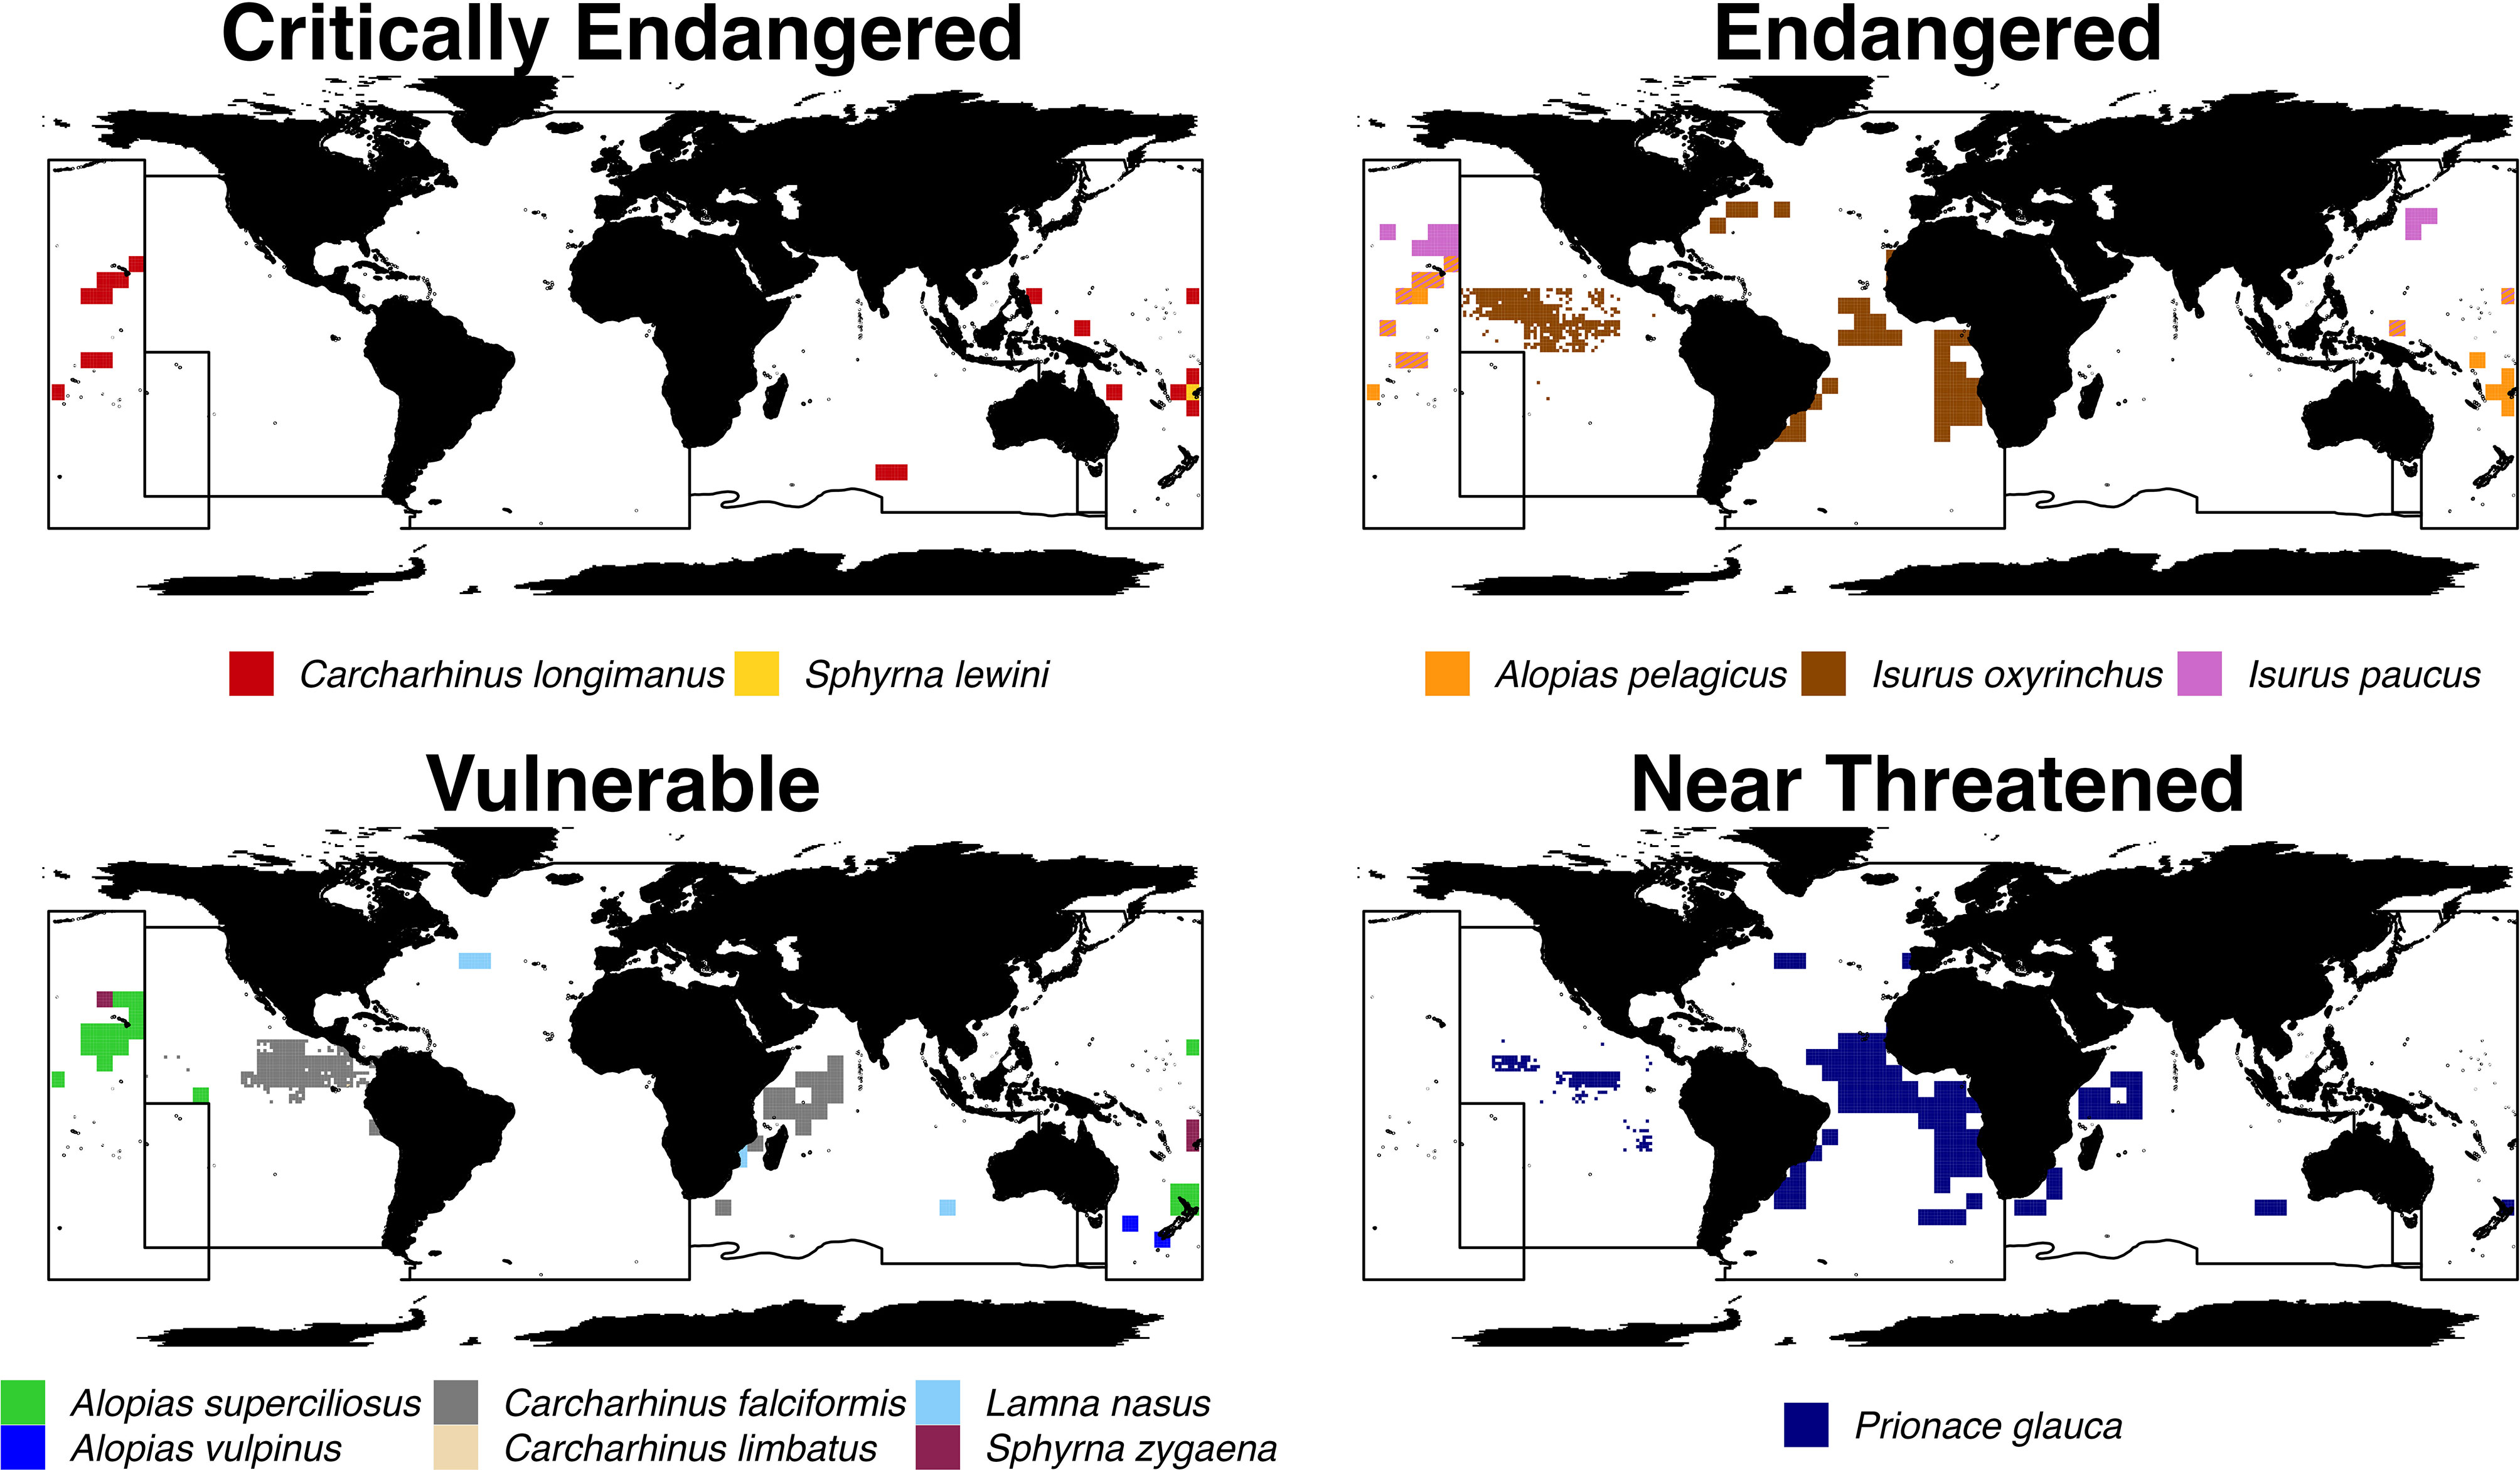
Figure 5 High-risk areas for threatened shark species. Cells that are considered high-risk for shark species that are categorized as Critically Endangered, Endangered, Vulnerable, or Near Threatened by the IUCN. High-risk cells are areas in which the mean annual predicted catch of a species is greater than or equal to the 90% quantile. Quantiles were calculated using non-zero mean annual predicted catch values. Areas with striped patterns indicate the overlap of high-risk shark catch areas for two species.
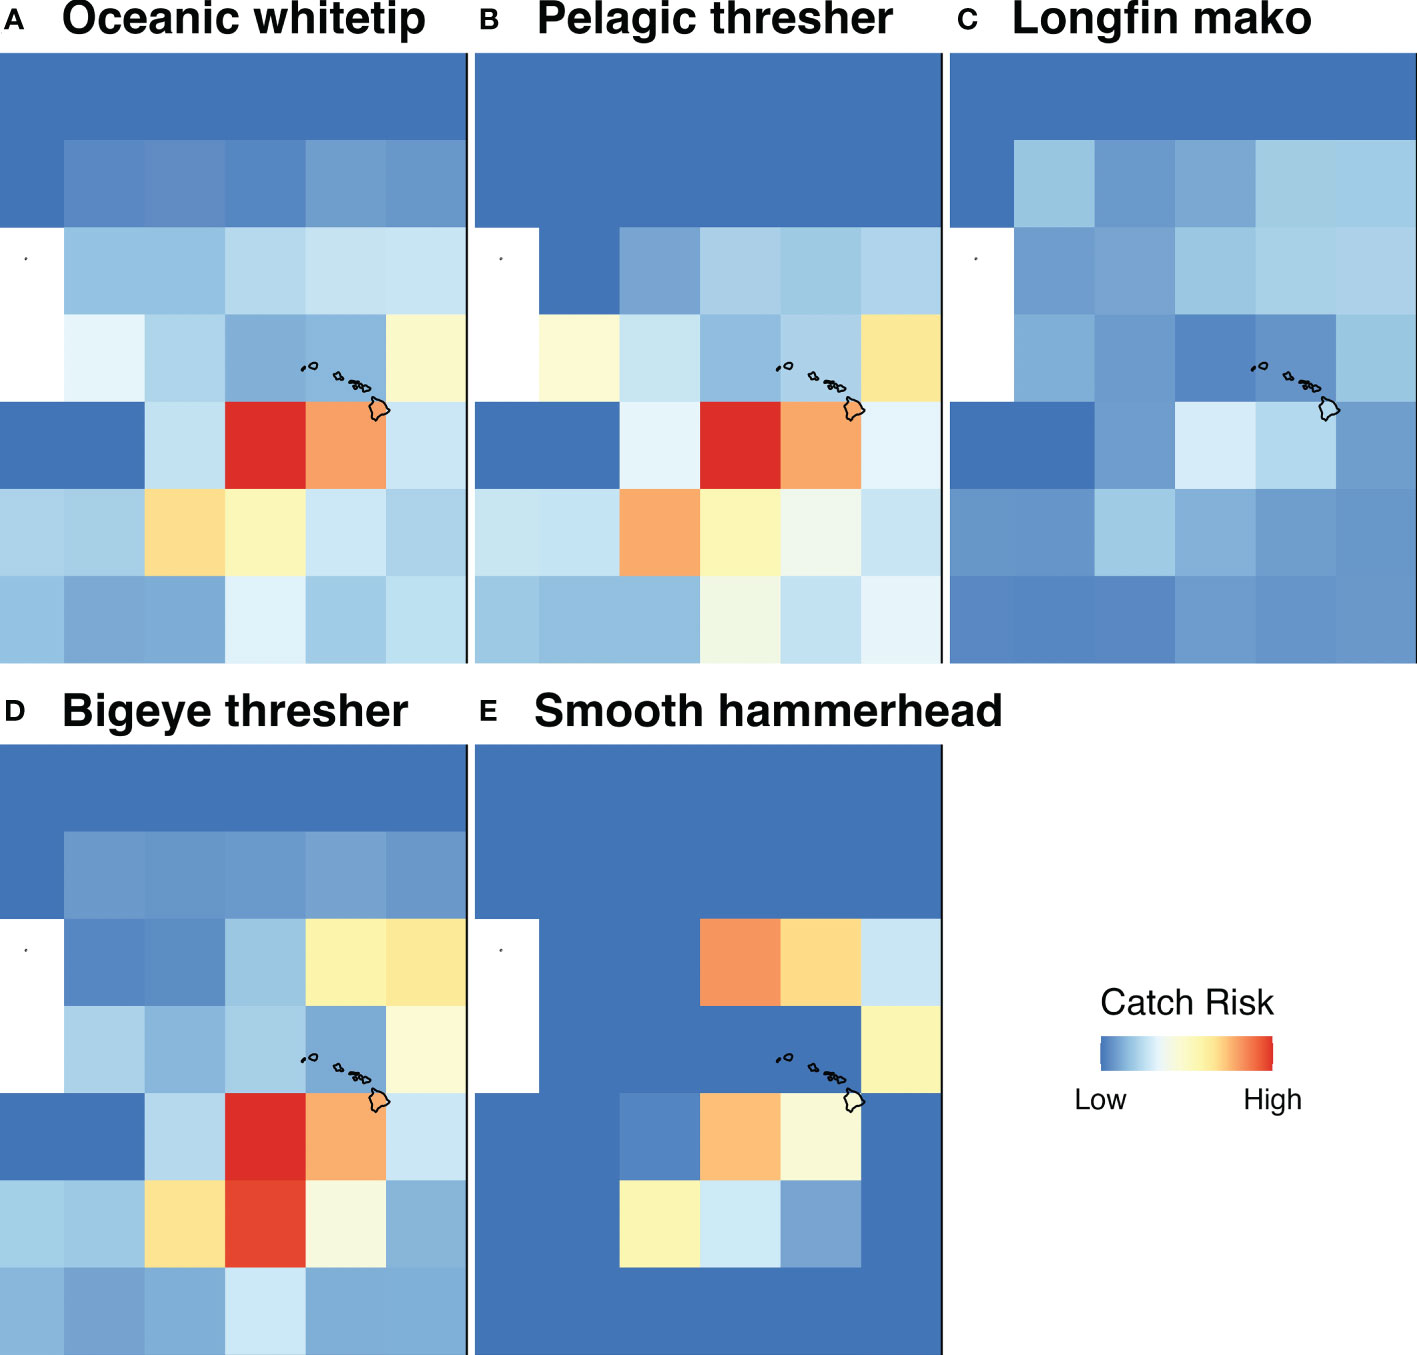
Figure 6 Catch risk hotspots for five shark species near the Hawaiian Islands. A closer look at predicted shark interaction risk hotspots near the Hawaiian Islands for species that are considered Critically Endangered (oceanic whitetip; Carcharhinus longimanus [A]), Endangered (pelagic thresher; Alopias pelagicus [B], longfin mako; Isurus paucus [C]), or Vulnerable (bigeye thresher; Alopias superciliosus [D], smooth hammerhead; Sphyrna zygaena [E]) by the IUCN. The right plot border represents the Eastern WCPFC boundary.
4. Discussion
Commercial longline fishing greatly contributes to unsustainably high levels of shark catch (Worm et al., 2013; Oliver et al., 2015). However, our data synthesis and modeling approach reveals that shark interactions with longline vessels are not concentrated in areas of high fishing effort or areas with high tuna catch per unit effort. Instead, catch risk hotspots are clustered in specific regions which are well predicted by environmental, ecological, and economic factors. Taken together, these findings suggest that targeted spatial management of sharks is possible without closing the most productive tuna fishing grounds.
Trends in shark catch data reported by tRFMOs are consistent with known fishing practices that either target sharks or catch them as bycatch. For example, blue, porbeagle, and mako sharks are managed via Quota Management Systems off western New Zealand, which is also an area that exhibits high areas of high shark CPUE. Therefore, this hotspot in the WCPFC region likely reflects a combination of sharks that were landed as both target catch (Finucci et al., 2019) and bycatch (Griggs et al., 2018). Alternatively, areas of high shark CPUE in the IATTC jurisdiction correspond to high catches of silky sharks off the coast of Mexico, which are likely targeted (Schaefer et al., 2021), and high catches of blue and mako sharks off the coast of Chile, which are likely caught incidentally (Sebastian et al., 2008; Klarian et al., 2018). Areas of high CPUE of blue, shortfin mako, and porbeagle sharks in the ICCAT region (coastal Brazil to Argentina) are also consistent with historical catch reporting in the area (Barreto et al., 2016). Finally, shark catch risk hotspots identified offshore of South Africa and southwestern Australia in the IOTC purview are supported by a fleet and species specific study of mako sharks caught by the Taiwanese tuna longline fleet in the Indian Ocean (Wu et al., 2021). The alignment between our global results and prior species, fleet, and location specific studies serves to support the robustness of our machine learning approach.
Although the shark catch risk hotspots we identify generally support prior species-specific and regionally focused studies, there is one notable exception. Our catch risk hotspots do not directly overlap with areas in which shark populations have substantially declined (e.g., in the north Atlantic ocean; Baum et al., 2003; Pacoureau et al., 2021). Instead, our results show a current snapshot of areas with high shark catch risk, which is more likely to correspond to high shark abundance areas given the extensive global footprint of longline fishing (Kroodsma et al., 2018). A shortcoming of our approach is that we are unable to identify hotspots of shark catch risk in areas where the abundance of a species is low, e.g., because sharks have historically been overfished. In other words, an overfished population with fewer sharks is less likely to be caught by longline fishing compared to a healthy population with many sharks. Therefore, areas with low local abundances of particular species, and thus low probability of being caught, are unlikely to be identified by our machine learning approach and require additional, targeted studies.
The patterns of risk we identify are largely driven by the catch of blue sharks, which represent ~78% of all shark catch reported by tRFMOs globally between 2012–2020 (Supplementary Material, Table S9). These catch risk hotspots can be compared to biologically important areas for blue sharks and other shark species (e.g., Hyde et al., 2022). For example, catch risk hotspots identified off the coast of Southwest Africa occur in a known potential blue shark nursery habitat off the coast of Namibia where a high catch density of immature sharks have been recorded by onboard observers (Coelho et al., 2018). Fishery- independent studies of juvenile blue sharks have also identified foraging habitats in the same area (Druon et al., 2022). Shortfin mako sharks (Endangered) share this risk hotspot with blue sharks in Southwest Africa (ICCAT jurisdiction), confirmed by onboard observer reports from Spanish longliners in the region (Dinkel and Sánchez-Lizaso, 2020). Our results indicate that both species also have a high risk of interacting with tuna longline gear in a concentrated area within Eastern Tropical Pacific (IATTC jurisdiction), potentially the result of shared foraging grounds given the relatively similar diet (73% diet overlap) of mackerel and other teleosts as well as dolphin carcasses (Klarian et al., 2018). This area partially abuts the Costa Rica Thermal Dome, a known biodiversity hotspot for marine megafauna. However, there are other areas of relatively high shark abundance identified in these listed studies that do not overlap with our catch risk hotspots. Discrepancies in hotspot areas may be due to ontogenetic shifts (Coelho et al., 2018) or seasonal migrations (Dinkel and Sánchez-Lizaso, 2020) that result in varying levels of overlap with longline fishing, a spatial mismatch between biologically important areas for sharks and preferred fishing grounds, or simply the result of the global nature of our analysis which forces the loss of regional nuance in favor of a global reference point. Nevertheless, even when poor data reporting stymies efforts to target species-specific management interventions, identified high risk areas for sharks generally can be used to cross-reference critical habitats shared by multiple species, particularly those that are threatened with extinction and therefore most susceptible to overexploitation.
Although our results primarily represent a few commonly reported species, pelagic longlines have the potential to interact with numerous shark species (n = 15 unique species and 5 higher order classifications are included here) with highly variable life histories and movement capacities, which can present challenges for designing effective spatial management to rebuild overexploited populations. Further work is needed to identify where shark catch risk hotspots align with ecologically important areas, such as aggregation sites and migration corridors, to ensure area-based protection and management are effective for intended species (Boerder et al., 2019; Gilman et al., 2019; Hyde et al., 2022). Behavioral considerations, including philopatry and movement capacity, will further determine which shark populations are most likely to respond to spatial management measures (Boerder et al., 2019), and future efforts will need to examine the seasonality and persistence of catch risk hotspots to determine whether static or dynamic management is preferred. Anthropogenic climate change is already impacting the spatial distribution of tuna stocks and other pelagic species (Erauskin-Extramiana et al., 2019; Bell et al., 2021), which may alter the landscape of incidental interactions between tuna fisheries and sharks and require adaptive and dynamic management approaches. Irrespective of the spatial strategy deemed most suitable for addressing unsustainable exploitation of sharks, any spatial measure will likely need to be paired with other fisheries management interventions – such as catch, effort, and/or gear regulations – to rebuild overexploited stocks; this is especially true for highly migratory species (Boerder et al., 2019; Gilman et al., 2019; Pons et al., 2022). For example, fishing gear modifications arising from banning branchline wire leaders were shown to reduce fishing mortality by ~28–36% for silky and oceanic whitetip sharks in the Western and Central Pacific Ocean (Bigelow, 2022).
Using the best available publicly accessible data across several tRFMOs introduces several opportunities for data discrepancies. For all tRFMOs apart from WCPFC, shark catch data were self-reported by fishers; WCPFC shark catch data were reported by onboard observers. Self-reporting is required by each tRFMO, and observer programs are designed to be representative; however, in using these data to build a machine learning model, we implicitly assume that these samples are spatially representative. While self-reported data have the potential to include a larger representation of fishing effort and catch, there is a potential trade off with the accuracy and detail with which data are reported (e.g., in an effort to anonymize self-reported data, ICCAT catch records represent an unspecified level of true catch that lies between the bounds of 5–100%, with no further information provided). Fishers may also hesitate to report catching species that are considered Critically Endangered, Endangered, or Vulnerable by the IUCN, as well as those that are listed by the Convention on International Trade in Endangered Species of Wild Fauna and Flora, leading to an inaccurate representation of the interactions between the most threatened shark species and longline fleets (Mucientes et al., 2022). Alternatively, observer data may only provide information on a small subset of the entire fleet, but may result in detailed and accurate catch information for more species, regardless of how threatened they are with extinction. For example, the WCPFC observer data reported catch for 13 true shark species and 4 shark species groups (Table 1), but contributed to a relatively small proportion of total shark catch compared to other tRFMOs (Supplementary Material, Figure S22). Furthermore, WCPFC observer coverage is only 27.5% of the total longline fleet (Table 2). Comparatively, self-reported catch data from ICCAT included 3 true shark species and “sharks nei” (Table 1) while contributing to the largest proportion of total catch (Supplementary Material, Figure S22). These inherent differences between datasets make it difficult to determine true shark catch from tRFMO reports without making a number of necessary assumptions. Here, we report on shark interaction risk which relies on the simpler, but critical assumption that there is no substantial spatial bias in observer coverage or self-reporting by fishers. Collaborative efforts among tRFMOs to provide public datasets with the same level of detail and fleet coverage are required for improved global estimates of shark interaction risk for individual species. Our model was designed to be replicated for use with datasets of any spatiotemporal and species resolution, offering an opportunity to improve shark catch risk estimates with improved datasets in the future.
A key challenge that merits further attention is reconciling the rarity of highly threatened species with their propensity to interact with fishing gears. For example, oceanic whitetip sharks were once one of the most abundant pelagic sharks, but, due to overfishing, they are now Critically Endangered and rarely encountered (Tremblay-Boyer et al., 2019; Young and Carlson, 2020). Reported reductions in the interaction between fisheries and shark species may therefore be due to overall population declines (e.g., >70% reduction in the abundance of oceanic sharks; Pacoureau et al., 2021) and not an indication of maintaining sustainable catch levels. In other words, for a species with low abundance, relatively low catch can equate to relatively high fishing mortality (Dulvy et al., 2021; Murua et al., 2021). It is therefore particularly notable that we are able to identify a catch risk hotspot for threatened sharks near the Hawaiian Islands (Figure 6). Importantly, the data underlying this predicted hotspot are derived from the shallow set longline fleet targeting swordfish, which boasts detailed catch reporting due to 100% observer coverage (Gilman et al., 2006). This finding suggests that high resolution data can successfully be leveraged to predict shark catch hotspots for the species most in need of conservation attention.
An important next step from this work is to estimate absolute shark catch by tuna longliners operating within tRFMO jurisdictions to understand overall impacts to overexploited shark populations, but this was not the goal here. Instead, we sought to identify high risk interaction areas, which do not equate to shark mortality. Different handling and release practices ultimately determine the fate of captured sharks, and though many captured sharks are indeed landed or discarded dead (resulting in mortality), many are discarded alive. At-vessel and post-release survival from pelagic longline gear is highly variable across species, but can be as high as 100% (e.g., tiger sharks [Galeocerdo cuvier]; Gallagher et al., 2014). Recent shark non-retention and mitigation management measures adopted by tRFMOs have served to increase discard rates for live captures (Poisson et al., 2016), though overall rate of interactions with shark species may remain constant. These nuances cannot be ascertained by our approach, though identifying risk hotspots for all fishing interactions is particularly important for threatened species for which even low levels of fishing can drive populations towards extinction.
Data availability statement
The final datasets presented in this study can be found on Zenodo (https://doi.org/10.5281/zenodo.7140770) and the associated code can be found on Dryad (https://doi.org/10.25349/D9789W).
Author contributions
EB and DB share first authorship. EB was responsible for methodology, formal analysis, data curation, writing - original draft, writing - review & editing, visualization. DB was responsible for conceptualization, methodology, writing - original draft, writing - review & editing, visualization. LT was responsible for data curation, methodology, writing - original draft, writing - review & editing, visualization. All authors contributed to the article and approved the submitted version.
Acknowledgments
This project was funded by the Waitt Foundation. We thank Dr. Daniel Ovando for his contribution to earlier stages of this work.
Conflict of interest
The authors declare that the research was conducted in the absence of any commercial or financial relationships that could be construed as a potential conflict of interest.
Publisher’s note
All claims expressed in this article are solely those of the authors and do not necessarily represent those of their affiliated organizations, or those of the publisher, the editors and the reviewers. Any product that may be evaluated in this article, or claim that may be made by its manufacturer, is not guaranteed or endorsed by the publisher.
Supplementary material
The Supplementary Material for this article can be found online at: https://www.frontiersin.org/articles/10.3389/fmars.2022.1062447/full#supplementary-material
References
Arrizabalaga H., Dufour F., Kell L., Merino G., Ibaibarriaga L., Chust G., et al. (2015). Global habitat preferences of commercially valuable tuna. 113, Deep Sea Res. Part II Top. Stud. Oceanogr., 113. doi: 10.1016/j.dsr2.2014.07.001
Barreto R., Ferretti F., Flemming J. M., Amorim A., Andrade H., Worm B., et al. (2016). Trends in the exploitation of south Atlantic shark populations. Conserv. Biol. 30, 792–804. doi: 10.1111/cobi.12663
Baum J. K., Myers R. A., Kehler D. G., Worm B., Harley S. J., Doherty P. A. (2003). Collapse and conservation of shark populations in the Northwest Atlantic. Science 299 (5605), 389–392. doi: 10.1126/science.1079777
Behivoke F., Etienne M.-P., Guitton J., Randriatsara R. M., Ranaivoson E., Léopold M. (2021). Estimating fishing effort in small-scale fisheries using GPS tracking data and random forests. Ecol. Indic. 123, 107321. doi: 10.1016/j.ecolind.2020.107321
Bell J. D., Senina I., Adams T., Aumont O., Calmettes B., Clark S., et al. (2021). Pathways to sustaining tuna-dependent pacific island economies during climate change. Nat. Sustain. 4, 900–910. doi: 10.1038/s41893-021-00745-z
Bigelow K. (2022). Review of potential mitigation measures to reduce fishing-related mortality on silky and oceanic whitetip sharks (Project 101) Western and Central Pacific Fisheries Commission, Kolona, Micronesia. doi: 10.25923/10GT-AS86
Boerder K., Schiller L., Worm B. (2019). Not all who wander are lost: Improving spatial protection for large pelagic fishes. Mar. Policy 105, 80–90. doi: 10.1016/j.marpol.2019.04.013
Brown C. J., Desbiens A., Campbell M. D., Game E. T., Gilman E., Hamilton R. J., et al. (2021). Electronic monitoring for improved accountability in western pacific tuna longline fisheries. Mar. Pol. 132, 104664. doi: 10.1016/j.marpol.2021.104664
Burns E. S., Bradley D., Thomas L. R. (2022a). Global hotspots of shark interactions with industrial longline fisheries. Zenodo. doi: 10.5281/zenodo.7140770
Burns E. S., Darcy D., Thomas L. R. (2022b). Global hotspots of shark interactions with industrial longline fisheries Dryad. doi: 10.25349/D9789W
Carlisle A. B., Tickler D., Dale J. J., Ferretti F., Curnick D. J., Chapple T. K., et al. (2019). Estimating space use of mobile fishes in a Large marine protected area with methodological considerations in acoustic array design. Front. Mar. Sci. 6. doi: 10.3389/fmars.2019.00256
Coelho R., Mejuto J., Domingo A., Yokawa K., Liu K.-M., Cortés E., et al. (2018). Distribution patterns and population structure of the blue shark (Prionace glauca) in the Atlantic and Indian oceans. Fish Fish. 19, 90–106. doi: 10.1111/faf.12238
Crespo G. O., Dunn D. C., Reygondeau G., Boerder K., Worm B., Cheung W., et al. (2018). The environmental niche of the global high seas pelagic longline fleet. Sci. Adv. 4, eaat3681. doi: 10.1126/sciadv.aat3681
Curnick D. J., Andrzejaczek S., Jacoby D. M. P., Coffey D. M., Carlisle A. B., Chapple T. K., et al. (2020). Behavior and ecology of silky sharks around the chagos archipelago and evidence of Indian ocean wide movement. Front. Mar. Sci. 7. doi: 10.3389/fmars.2020.596619
Davidson L. N. K., Krawchuk M. A., Dulvy N. K. (2016). Why have global shark and ray landings declined: improved management or overfishing? Fish Fish. 17, 438–458. doi: 10.1111/faf.12119
Dinkel T. M., Sánchez-Lizaso J. L. (2020). Involving stakeholders in the evaluation of management strategies for shortfin mako (Isurus oxyrinchus) and blue shark (Prionace glauca) in the Spanish longline fisheries operating in the Atlantic ocean. Mar. Policy 120, 104124. doi: 10.1016/j.marpol.2020.104124
Druon Jean-Noël, Campana S., Vandeperre F., Hazin FábioH.V., Bowlby H., Coelho R., et al. (2022). Global-scale environmental niche and habitat of blue shark (Prionace glauca) by size and sex: A pivotal step to improving stock management. Front. Mar. Sci. 9. doi: 10.3389/fmars.2022.828412
Dulvy N. K., Baum J. K., Clarke S., Compagno L. J. V., Cortés E., Domingo A., et al. (2008). You can swim but you can’t hide: the global status and conservation of oceanic pelagic sharks and rays. Aquat. Conserv. Mar. Freshw. Ecosyst. 18, 459–482. doi: 10.1002/aqc.975
Dulvy N. K., Pacoureau N., Rigby C. L., Pollom R. A., Jabado R. W., Ebert D. A., et al. (2021). Overfishing drives over one-third of all sharks and rays toward a global extinction crisis. Curr. Biol. 31, 4773–4787.e8. doi: 10.1016/j.cub.2021.08.062
Elith J., Graham C. H., P. Anderson R., Dudík M., Ferrier S., Guisan A., et al. (2006). Novel methods improve prediction of species’ distributions from occurrence data. Ecography 29 (2), 129–151. doi: 10.1111/j.2006.0906-7590.04596.x
Erauskin-Extramiana M., Arrizabalaga H., Hobday A. J., Cabré A., Ibaibarriaga L., Arregui I., et al. (2019). Large-Scale distribution of tuna species in a warming ocean. Glob. Change Biol. 25, 2043–2060. doi: 10.1111/gcb.14630
Ewell C., Hocevar J., Mitchell E., Snowden S., Jacquet J. (2020). An evaluation of regional fisheries management organization at-sea compliance monitoring and observer programs. Mar. Policy 115, 103842. doi: 10.1016/j.marpol.2020.103842
Finucci B., Duffy C. A., Francis M. P., Gibson C., Kyne P. M. (2019). The extinction risk of new Zealand chondrichthyans. Aquat. Conserv. Mar. Freshw. Ecosyst. 29, 783–797. doi: 10.1002/aqc.3053
Gallagher A. J., Orbesen E. S., Hammerschlag N., Serafy J. E. (2014). Vulnerability of oceanic sharks as pelagic longline bycatch. Glob. Ecol. Conserv. 1, 50–59. doi: 10.1016/j.gecco.2014.06.003
Gilman E. L. (2011). Bycatch governance and best practice mitigation technology in global tuna fisheries. Mar. Policy 35, 590–609. doi: 10.1016/j.marpol.2011.01.021
Gilman E., Kaiser M. J., Chaloupka M. (2019). Do static and dynamic marine protected areas that restrict pelagic fishing achieve ecological objectives? Ecosphere 10, e02968. doi: 10.1002/ecs2.2968
Gilman E., Kobayashi D., Swenarton T., Dalzell P., Kinan I., Brothers N. (2006) Analyses of observer data for the Hawaii-based longline swordfish fishery. Available at: https://meetings.wcpfc.int/node/6327.
Griggs L., Baird S., Francis M. (2018). Fish bycatch in new Zealand tuna longline fisheries 2010–11 to 2014–15. N. Z. Fish. Assess. Rep. 29, 90.
Hastings A., Gaines S. D., Costello C. (2017). Marine reserves solve an important bycatch problem in fisheries. Proc. Natl. Acad. Sci. 114, 8927–8934. doi: 10.1073/pnas.1705169114
Hays G. C., Bailey H., Bograd S. J., Bowen W. D., Campagna C., Carmichael R. H., et al. (2019). Translating marine animal tracking data into conservation policy and management. Trends Ecol. Evol. 34, 459–473. doi: 10.1016/j.tree.2019.01.009
Hvitfeldt E. (2022) Themis: Extra recipes steps for dealing with unbalanced data_. r package version 1.0.0. Available at: https://CRAN.R-project.org/package=themis.
Hyde C. A., Notarbartolo di Sciara G., Sorrentino L., Boyd C., Finucci B., Fowler S. L., et al. (2022). Putting sharks on the map: A global standard for improving shark area-based conservation. Front. Mar. Sci. 9. doi: 10.3389/fmars.2022.968853
IATTC (2021) Ammendment to resolution c-11-08 on scientific observers for longline vessels. Available at: https://www.iattc.org/GetAttachment/f2ebc745-bc3a-4c05-bf0b-b54535723bd9/IATTC-98a-PROP-A-2_ECU-Observers-on-longliners.pdf.
IATTC (2022) Vessel register. Available at: https://www.iattc.org/en-US/Management/Vessel-register?shortcut=LargeLL (Accessed October 5, 2022).
ICCAT (2018) International commission for the conservation of Atlantic tunas (ICCAT) meeting, November 12-19, 2018. Available at: https://www.iccat.int/com2018/ENG/PLE_115_ENG.pdf.
ICCAT (2022) ICCAT record of vessels. Available at: https://www.iccat.int/en/vesselsrecord.asp (Accessed October 5, 2022).
IOTC (2022) Record of currently authorized vessels. Available at: https://iotc.org/vessels/current (Accessed October 5, 2022).
IOTC Secretariat (2021) Update on the implementation of the IOTC regional observer scheme. Available at: https://iotc.org/WPDCS/17/10.
IUCN (2022) The IUCN red list of threatened species. Available at: https://www.iucnredlist.org.
IUCN SSC Red List Technical Working Group (2021). Mapping standards and data quality for the IUCN red list spatial data (Available at: https://nc.iucnredlist.org/redlist/resources/files/1539098236-Mapping_Standards_Version_1.16_2018.pdf).
Klarian S. A., Canales-Cerro C., Barría P., Zárate P., Concha F., Hernández S., et al. (2018). New insights on the trophic ecology of blue (Prionace glauca) and shortfin mako sharks (Isurus oxyrinchus) from the oceanic eastern south pacific. Mar. Biol. Res. 14, 173–182. doi: 10.1080/17451000.2017.1396344
Kroodsma D. A., Mayorga J., Hochberg T., Miller N. A., Boerder K., Ferretti F., et al. (2018). Tracking the global footprint of fisheries. Science 359, 904–908. doi: 10.1126/science.aao5646
Kuhn M., Johnson K. (2019). Feature selection. feature engineering and selection: A practical approach for predictive models (Boca Raton: Chapman & Hall/CRC Press).
Kuhn M., Wickham H. (2020) Tidymodels: a collection of packages for modeling and machine learning using tidyverse principles. Available at: https://cran.r-project.org/web/packages/tidymodels/citation.html (Accessed October 4, 2022).
Lewison R. L., Crowder L. B., Wallace B. P., Moore J. E., Cox T., Zydelis R., et al. (2014). Global patterns of marine mammal, seabird, and sea turtle bycatch reveal taxa-specific and cumulative megafauna hotspots. Proc. Natl. Acad. Sci. 111, 5271–5276. doi: 10.1073/pnas.1318960111
Lewison R. L., Soykan C. U., Franklin J. (2009). Mapping the bycatch seascape: multispecies and multi-scale spatial patterns of fisheries bycatch. Ecol. Appl. 19, 920–930. doi: 10.1890/08-0623.1
Lobach T., Petersson M., Haberkon E. (2020). Regional fisheries management organizations and advisory bodies (FAO) Rome, Italy. doi: 10.4060/ca7843en
Luan J., Zhang C., Xu B., Xue Y., Ren Y. (2020). The predictive performances of random forest models with limited sample size and different species traits. Fish. Res. 227, 105534. doi: 10.1016/j.fishres.2020.105534
MacNeil M. A., Chapman D. D., Heupel M., Simpfendorfer C. A., Heithaus M., Meekan M., et al. (2020). Global status and conservation potential of reef sharks. Nature 583, 801–806. doi: 10.1038/s41586-020-2519-y
Mannocci L., Baidai Y., Forget F., Tolotti M. T., Dagorn L., Capello M. (2021). Machine learning to detect bycatch risk: Novel application to echosounder buoys data in tuna purse seine fisheries. Biol. Conserv. 255, 109004. doi: 10.1016/j.biocon.2021.109004
Melnychuk M. C., Clavelle T., Owashi B., Strauss K. (2017). Reconstruction of global ex-vessel prices of fished species. ICES J. Mar. Sci. 74, 121–133. doi: 10.1093/icesjms/fsw169
Mucientes G., Vedor M., Sims D. W., Queiroz N. (2022). Unreported discards of internationally protected pelagic sharks in a global fishing hotspot are potentially large. Biol. Conserv. 269, 109534. doi: 10.1016/j.biocon.2022.109534
Mullahy J. (1986). Specification and testing of some modified count data models. J. Econom. 33, 341–365. doi: 10.1016/0304-4076(86)90002-3
Murua H., Griffiths S. P., Hobday A. J., Clarke S. C., Cortés E., Gilman E. L., et al. (2021). Shark mortality cannot be assessed by fishery overlap alone. Nature 595, E4–E7. doi: 10.1038/s41586-021-03396-4
Olaya-Marín E. J., Martínez-Capel F., Vezza P. (2013). A comparison of artificial neural networks and random forests to predict native fish species richness in Mediterranean rivers. Knowl. Managt. Aquat. Ecosyst. 409, 07. doi: 10.1051/kmae/2013052
Oliver S., Braccini M., Newman S. J., Harvey E. S. (2015). Global patterns in the bycatch of sharks and rays. Mar. Policy 54, 86–97. doi: 10.1016/j.marpol.2014.12.017
Pacoureau N., Rigby C. L., Kyne P. M., Sherley R. B., Winker H., Carlson J. K., et al. (2021). Half a century of global decline in oceanic sharks and rays. Nature 589, 567–571. doi: 10.1038/s41586-020-03173-9
Poisson F., Crespo F. A., Ellis J. R., Chavance P., Bach P., Santos M. N., et al. (2016). Technical mitigation measures for sharks and rays in fisheries for tuna and tuna-like species: turning possibility into reality. Aquat. Living Resour. 29, 402. doi: 10.1051/alr/2016030
Pons M., Watson J. T., Ovando D., Andraka S., Brodie S., Domingo A., et al. (2022). Trade-offs between bycatch and target catches in static versus dynamic fishery closures. Proc. Natl. Acad. Sci. 119, e2114508119. doi: 10.1073/pnas.2114508119
Qi Y. (2012). “Random forest for bioinformatics,” in Ensemble machine learning (Boston, MA: Springer). doi: 10.1007/978-1-4419-9326-7_11
Queiroz N., Humphries N. E., Couto A., Vedor M., Costa I., Sequiera A. M. M., et al. (2021). Reply to: shark mortality cannot be assessed my fishery overlap along. Nature 595, E8–E16. doi: 10.1038/s41586-021-03397-3
Queiroz N., Humphries N. E., Couto A., Vedor M., da Costa I., Sequeira A. M. M., et al. (2019). Global spatial risk assessment of sharks under the footprint of fisheries. Nature 572, 461–466. doi: 10.1038/s41586-019-1444-4
Schaefer K., Fuller D., Castillo-Geniz J. L., Godinez-Padilla C. J., Dreyfus M., Aires-da-Silva A. (2021). Post-release survival of silky sharks (Carcharhinus falciformis) following capture by Mexican flag longline fishing vessels in the northeastern pacific ocean. Fish. Res. 234, 105779. doi: 10.1016/j.fishres.2020.105779
Sebastian H., Haye P., Shivji M. S. (2008). Characterization of the pelagic shark-fin trade in north-central Chile by genetic identification and trader surveys. J. Fish Biol. 73, 2293–2304. doi: 10.1111/j.1095-8649.2008.02016.x
Siroky D. S. (2009). Navigating random forests and related advances in algorithmic modeling. Stat. Surv. 3, 147–163. doi: 10.1214/07-SS033
Tremblay-Boyer L., Carvalho F., Neubauer P., Pilling G. (2019) Stock assessment for oceanic whitetip shark in the Western and central pacific ocean | WCPFC. Available at: https://www.wcpfc.int/node/42932.
WCPFC (2022a) Public domain bycatch data. Available at: https://www.wcpfc.int/public-domain-bycatch (Accessed October 5, 2022).
WCPFC (2022b) WCPFC record of fishing vessels. 2022. Available at: https://www.wcpfc.int/record-fishing-vessel-database?flag=All&field_vessel_submitted_by_ccm_value=All&type=Longliner&name=&ircs=&win=&vid=&imo=&auth_tranship_hs=All&fishing_methods=All&page=9 (Accessed October 5, 2022).
Worm B., Davis B., Kettemer L., Ward-Paige C. A., Chapman D., Heithaus M. R., et al. (2013). Global catches, exploitation rates, and rebuilding options for sharks. Mar. Policy 40, 194–204. doi: 10.1016/j.marpol.2012.12.034
Wu X.-H., Liu S. Y. V., Wang S.-P., Tsai W.-P. (2021). Distribution patterns and relative abundance of shortfin mako shark caught by the Taiwanese large-scale longline fishery in the Indian ocean. Regional Stud. Mar. Sci. 44, 101691. doi: 10.1016/j.rsma.2021.101691
Young C. N., Carlson J. K. (2020). The biology and conservation status of the oceanic whitetip shark (Carcharhinus longimanus) and future directions for recovery. Rev. Fish Biol. Fish. 30, 293–312. doi: 10.1007/s11160-020-09601-3
Keywords: shark catch hotspot, industrial longline fishing, machine learning, random forest, tRFMO
Citation: Burns ES, Bradley D and Thomas LR (2023) Global hotspots of shark interactions with industrial longline fisheries. Front. Mar. Sci. 9:1062447. doi: 10.3389/fmars.2022.1062447
Received: 05 October 2022; Accepted: 06 December 2022;
Published: 04 January 2023.
Edited by:
Steven W. Purcell, Southern Cross University, AustraliaReviewed by:
Gorka Merino, Technology Center Expert in Marine and Food Innovation (AZTI), SpainGonzalo Mucientes Sandoval, Institute of Marine Research (CSIC), Spain
Copyright © 2023 Burns, Bradley and Thomas. This is an open-access article distributed under the terms of the Creative Commons Attribution License (CC BY). The use, distribution or reproduction in other forums is permitted, provided the original author(s) and the copyright owner(s) are credited and that the original publication in this journal is cited, in accordance with accepted academic practice. No use, distribution or reproduction is permitted which does not comply with these terms.
*Correspondence: Echelle S. Burns, ZWNoZWxsZV9idXJuc0B1Y3NiLmVkdQ==
†These authors share first authorship