 George Zodiatis1,2*
 Steve Brenner3
 Isaac Gertman4
 Tal Ozer4
 Simona Simoncelli5Marinos Ioannou6Sotiris Savva6
- 1Coastal & Marine Research Lab, Institute of Applied and Computational Mathematics, Foundation for Research and Technology, Heraklion, Crete, Greece
- 2ORION Research, Nicosia, Cyprus
- 3Department of Geography and Environment, Bar Ilan University, Ramat Gan, Israel
- 4Israel Oceanographic and Limnological Research, Haifa, Israel
- 5Istituto Nazionale di Geofisica e Vulcanologia, Bologna, Italy
- 6Department of Fisheries and Marine Research, Nicosia, Cyprus
The in-situ data gathered over two decades since mid-1990s in the South-Eastern Levantine Basin from 34 hydrographic campaigns and from 35 bi-weekly and monthly Voluntary Observing Ships (VOS) transects, after the pioneering POEM cruises, have provided insight on the dominant meso-scale coherent circulation features of this sub-basin. The most pronounced feature, the anticyclonic Cyprus Eddy, migrates over the broad region of the Eratosthenes seamount and exhibits significant seasonal and inter-annual spatial-temporal variability. Another prominent structure of the sub-basin is the anticyclonic Shikmona Eddy generated by instabilities of the strong northward flowing jet along the south-easternmost shelf and slope of the Levantine basin. Its evolution and co-existence with the Cyprus Eddy, cause the periodic re-establishment of the Shikmona Gyre, which was first observed during the POEM cruises in mid-1980s. The offshore, cross basin, eastward flowing Mid-Mediterranean Jet (MMJ) defines the northern and southern flanks of these sub-basin scale anticyclonic eddies and transports the lower salinity Modified Atlantic Water (MAW) in the subsurface layer, through the warmest and most saline waters of the Mediterranean. Periodically, the MMJ bifurcates and/or is diverted northward, along the western coast of Cyprus due to westward and northward spatial fluctuations of the Cyprus Eddy’s western boundaries. The current long term in-situ monitoring of the sub-basin provides an overview of the extent of the main water masses and characterizes their variability throughout the period considered. The analysis of the data indicates an increase of the temperature and salinity of the Levantine Surface Water (LSW) and of the subsurface MAW. The Eastern Mediterranean Transient Water (EMTW) is shown to occupy the deep cavities in the vicinity of the Eratosthenes seamount while its upper boundary was found to be lifted to shallower depths over a period of two decades.
1 Introduction
The Physical Oceanography of the Eastern Mediterranean (POEM) collaborative cruises carried out during mid to end of 1980s are considered as a major breakthrough in the modern investigation of the physical oceanography in the Eastern Mediterranean. For the first time new in-situ, reliable instruments, such as the CTDs were used to gather high vertical resolution (1 m) quasi-synoptic mesoscale data on board several research vessels from Cyprus, Greece, Israel, Italy, and Turkey (Robinson et al., 1992). During the multi-national POEM cruises, a detailed pattern of the mesoscale circulation in the Eastern Mediterranean Levantine Basin was defined, consisting of several alternating cyclonic and anticyclonic eddies and gyres, and an offshore, cross basin jet, named as the Mid Mediterranean Jet (MMJ) which transports Modified Atlantic Water (MAW) eastward. The Rhodes Gyre was found to be flanked to the south by the eastward flowing MMJ, and to the west by the warm, anticyclonic Ierapetra eddy, which is located southeast of Crete (Ozsoy et al., 1991; Robinson et al., 1992). The dominant circulation features in the south-eastern Levantine were two anticyclonic gyres, the Mersa-Matruh gyre located offshore between Libya and Egypt, and a non-permanent, multi-pole Shikmona Gyre, consisting of three anticyclone eddies (Hecht et al., 1988; Robinson et al., 1992) - one eddy offshore Egypt, a secondary eddy offshore Israel-Lebanon and a third eddy closer to the Eratosthenes sea mount (SM). The latter was the most pronounced and named as the Cyprus Eddy by Brenner (1989); Brenner (1993). It was described as a transient or recurrent feature (Robinson et al., 1992; Robinson and Golnaraghi, 1993; Malanotte-Rizzoli et al., 1999), although the generation mechanisms of the Cyprus and Shikmona eddies and the Shikmona Gyre remained unresolved. Later Millot and Taupier-Letage (2005), based only on satellite images of sea surface temperature (SST), claimed that the MMJ was absent and that MAW flowed eastward along the North African shelf and slope as first proposed by Nielsen (1912).
Prior to POEM, Ovchinnikov et al. (1976) provided an extensive description of the basin wide circulation which emphasized the dominant cyclonic Rhodes Gyre in the Eastern Mediterranean Levantine (EML) basin and corroborated the anticlockwise EML circulation described by Nielsen (1912), but no evidence of other prominent circulation features was provided. Following POEM, Pinardi et al. (2015) presented a synthesis of the Mediterranean Sea circulation structure and dynamics from a 23-year long ocean reanalysis from 1987-2007 (Adani et al., 2011) which allowed, for the first time, a comprehensive description of the time-mean surface and intermediate depth circulation including its low frequency components and the main water mass formation processes. They noted that the Eastern Mediterranean circulation depicted by the reanalysis dataset was very close to that described by the early basin-scale circulation studies (Robinson et al., 1992; Malanotte-Rizzoli et al., 2003) except for the subdivision of the Ionian Sea into northern and southern regions by the variable jet referred to as the Atlantic Ionian Stream (AIS). An analysis of the circulation during 1987-2014 was also presented in Section 3.1 of von Schuckmann et al. (2016) based on an expanded reanalysis dataset (Simoncelli et al., 2014), with a main focus on the Ionian circulation and its impact on the salinity distribution. The AIS was shown to influence thermohaline characteristics and water mass formation in the Levantine basin (Simoncelli et al., 2018) depending on the direction of transport of the relatively fresh surface waters of Atlantic origin. Menna et al. (2021) confirmed the influence of the quasi-decadal reversal of the Northern Ionian circulation on the thermohaline properties of the Levantine Surface Water (LSW) and Levantine Intermediate Water (LIW) as well as on the presence of MAW in the Cyprus Eddy during periods of anticyclonic circulation in the Northern Ionian.
The Eastern Mediterranean Levantine thermohaline structure is characterized by high salinity in the upper, near surface and in the intermediate water layers, known respectively as LSW and the LIW, and lower salinity layers just below the surface (MAW) and in the deepest layers comprising Eastern Mediterranean Deep Water (EMDW). The most variable water mass of the Levantine basin is the relatively low salinity MAW, which originates from the Atlantic inflow through the Strait of Gibraltar. While flowing eastward, the salinity of this water increases from 36.3 due to net evaporation. It reaches as far as the Levantine basin where the MAW appears as a well-pronounced subsurface salinity minimum between 40 and 80 m, with salinity ranging from 38.60 to 38.95 (Ovchinnikov et al, 1976; Hecht et al., 1988; Ozsoy et al., 1991).
The main source of LIW is the Rhodes gyre where it is formed during winter by convective mixing processes (Hecht and Gertman, 2001). It spreads in the intermediate layers across the Levantine basin, then westward through the Sicily Channel (Pinardi et al., 2015; Schroeder et al., 2017; Simoncelli et al., 2018), and finally contributes to the Mediterranean Outflow Water (MOW) flowing through the Strait of Gibraltar spreading in the deeper layers of the North Atlantic Ocean (McDowell and Rossby, 1978; Armi and Zenk, 1984; Armi et al., 1988; Karlin et al., 1988; García-Lafuente et al., 2021).
Below the EMDW, at depths deeper than 1500 m, the Eastern Mediterranean Transient Waters (EMTW), later referred to as Cretan Deep Water by Pinardi et al. (2015) and Simoncelli et al. (2018), are found with salinity and temperature values slightly higher (Klein et al., 1999) than the layer above. In contrast to EMDW, which is usually formed in the Adriatic Sea (Lascaratos et al., 1999), the EMTW formation was only observed once during the Eastern Mediterranean Transient (EMT) period (Roether et al., 1996). It started to spill into the Ionian Sea and the Levantine basin from the Cretan Sea through the Cretan Arc straits in 1989 and stopped around 1993 (Theocharis et al., 1999). In order to sink to the sea floor and spread in the bottom layer, the new water mass had to have a potential density anomaly higher than 29.2 kg/m3. Such dense water near the bottom of the Cretan Sea was first observed in October 1987, but this isopycnal surface was raised high enough to spill over the sill of Cretan Arc straits only in 1989, and thus explaining the weak initial signal of EMTW during 1987-1992. This first phase of the EMT was related to the redistribution of salinity in the Eastern Mediterranean due to an anticyclonic basin-wide circulation in Ionian Sea during 1986-1987 (Malanotte-Rizzoli et al., 1999; Section 3.1 of von Schuckmann et al., 2016). The interannual switching between periods of salinification and freshening of the upper layers in the Levantine basin, as well as intensification of dense water formation in the Adriatic Sea or in the Aegean Sea were connected with reversals in the direction of the upper layer circulation in the North Ionian referred to as the Adriatic-Ionian Bimodal Oscillation System (BIOS) by Gačić et al. (2010); Gačić et al. (2011) or as the Northern Ionian Reversal (NIR) by Pinardi et al. (2015). Typical winter cooling in the Aegean after the first stage of the EMT was enough to cause the massive formation of very dense water on the Lesvos–Lemnos Plateau and Cyclades followed by cascading in to the Cretan Sea (Gertman et al., 2006). In the next stage the dense water formation and spilling into the Ionian and Levantine were further intensified by an extraordinary decrease of water temperature (by about 0.35°C) which was forced by a prolonged cold air-temperature anomaly throughout the Middle East during the winters 1992, 1993, and 1994, which is attributed to the massive injection of volcanic aerosols into atmosphere by the eruption of Mount Pinatubo in June 1991 (Genin et al., 1995). The EMTW formation rate in the period from mid-1992 to late 1994 was about 3 Sv, which is 10 times larger than normal rate of EMDW formation in the Adriatic Sea. Simoncelli et al. (2018) demonstrated the capability of the reanalysis dataset to successfully reproduce the main water masses formation events in the Mediterranean Sea, including the formation of the Cretan Deep Water and its density increase from the first to the second phase of the EMT.
Various physical and biogeochemical processes in the Cyprus Eddy were also studied by Hecht et al. (1988); Brenner (1989); Brenner et al. (1991); Krom et al. (1992); Brenner (1993); Zodiatis et al. (1998); Zohary et al. (1998); ; Krom et al. (2005); Groom et al. (2005); Zodiatis et al., 2004; Zodiatis et al. (2005a); Zodiatis et al. (2005b); Zodiatis et al., 2007; Hayes et al. (2011); Christiansen et al. (2012); Menna et al. (2012); Schroeder et al. (2012); Zodiatis et al. (2013); Hayes et al. (2014); Zodiatis et al. (2016); Hayes et al. (2019); Barboni et al. (2021); Menna et al. (2021); Menna et al. (2022) using in-situ data gathered from different observing platforms, such as Surface Velocity Program (SVP) Lagrangian drifters, Argos floats, gliders, research vessels and remote sensing data. Most recently Schroeder and Chiggiato (2022) presented a concise summary of the circulation and water mass properties of the Mediterranean in general, and specifically the Eastern Mediterranean, within the context of the general oceanography of the Mediterranean, past, present, and future.
The present work aims to provide an overview of the dominant mesoscale hydrodynamical features of the Eastern Mediterranean Levantine Basin, addressing among other issues the previous uncertainties regarding the Cyprus Eddy, the Shikmona gyre, the Shikmona Eddy; the path of the offshore cross basin MMJ and the associated transport of MAW; and temporal changes in the characteristics of the water masses, especially MAW and deep-water transients. To address these issues two large datasets gathered in the SE Levantine basin in the post POEM period from 1995-2015 were analyzed: a) more than 2000 high vertical resolution in-situ CTD profiles gathered during the Cyprus Basin Oceanography (CYBO), CYCLOPS, MSM14-1 and Haifa Section (HaiSec) research cruises (Tables 1A, B) more than 500 XBTs profiles gathered during the Mediterranean Forecasting System Pilot Project (MFSPP; Manzella et al., 2003; Pinardi et al., 2003; ) and the Mediterranean Forecasting System Towards Environmental Predictions project (MFSTEP; Manzella et al., 2007; Pinardi and Coppini, 2010) (Table 1B).
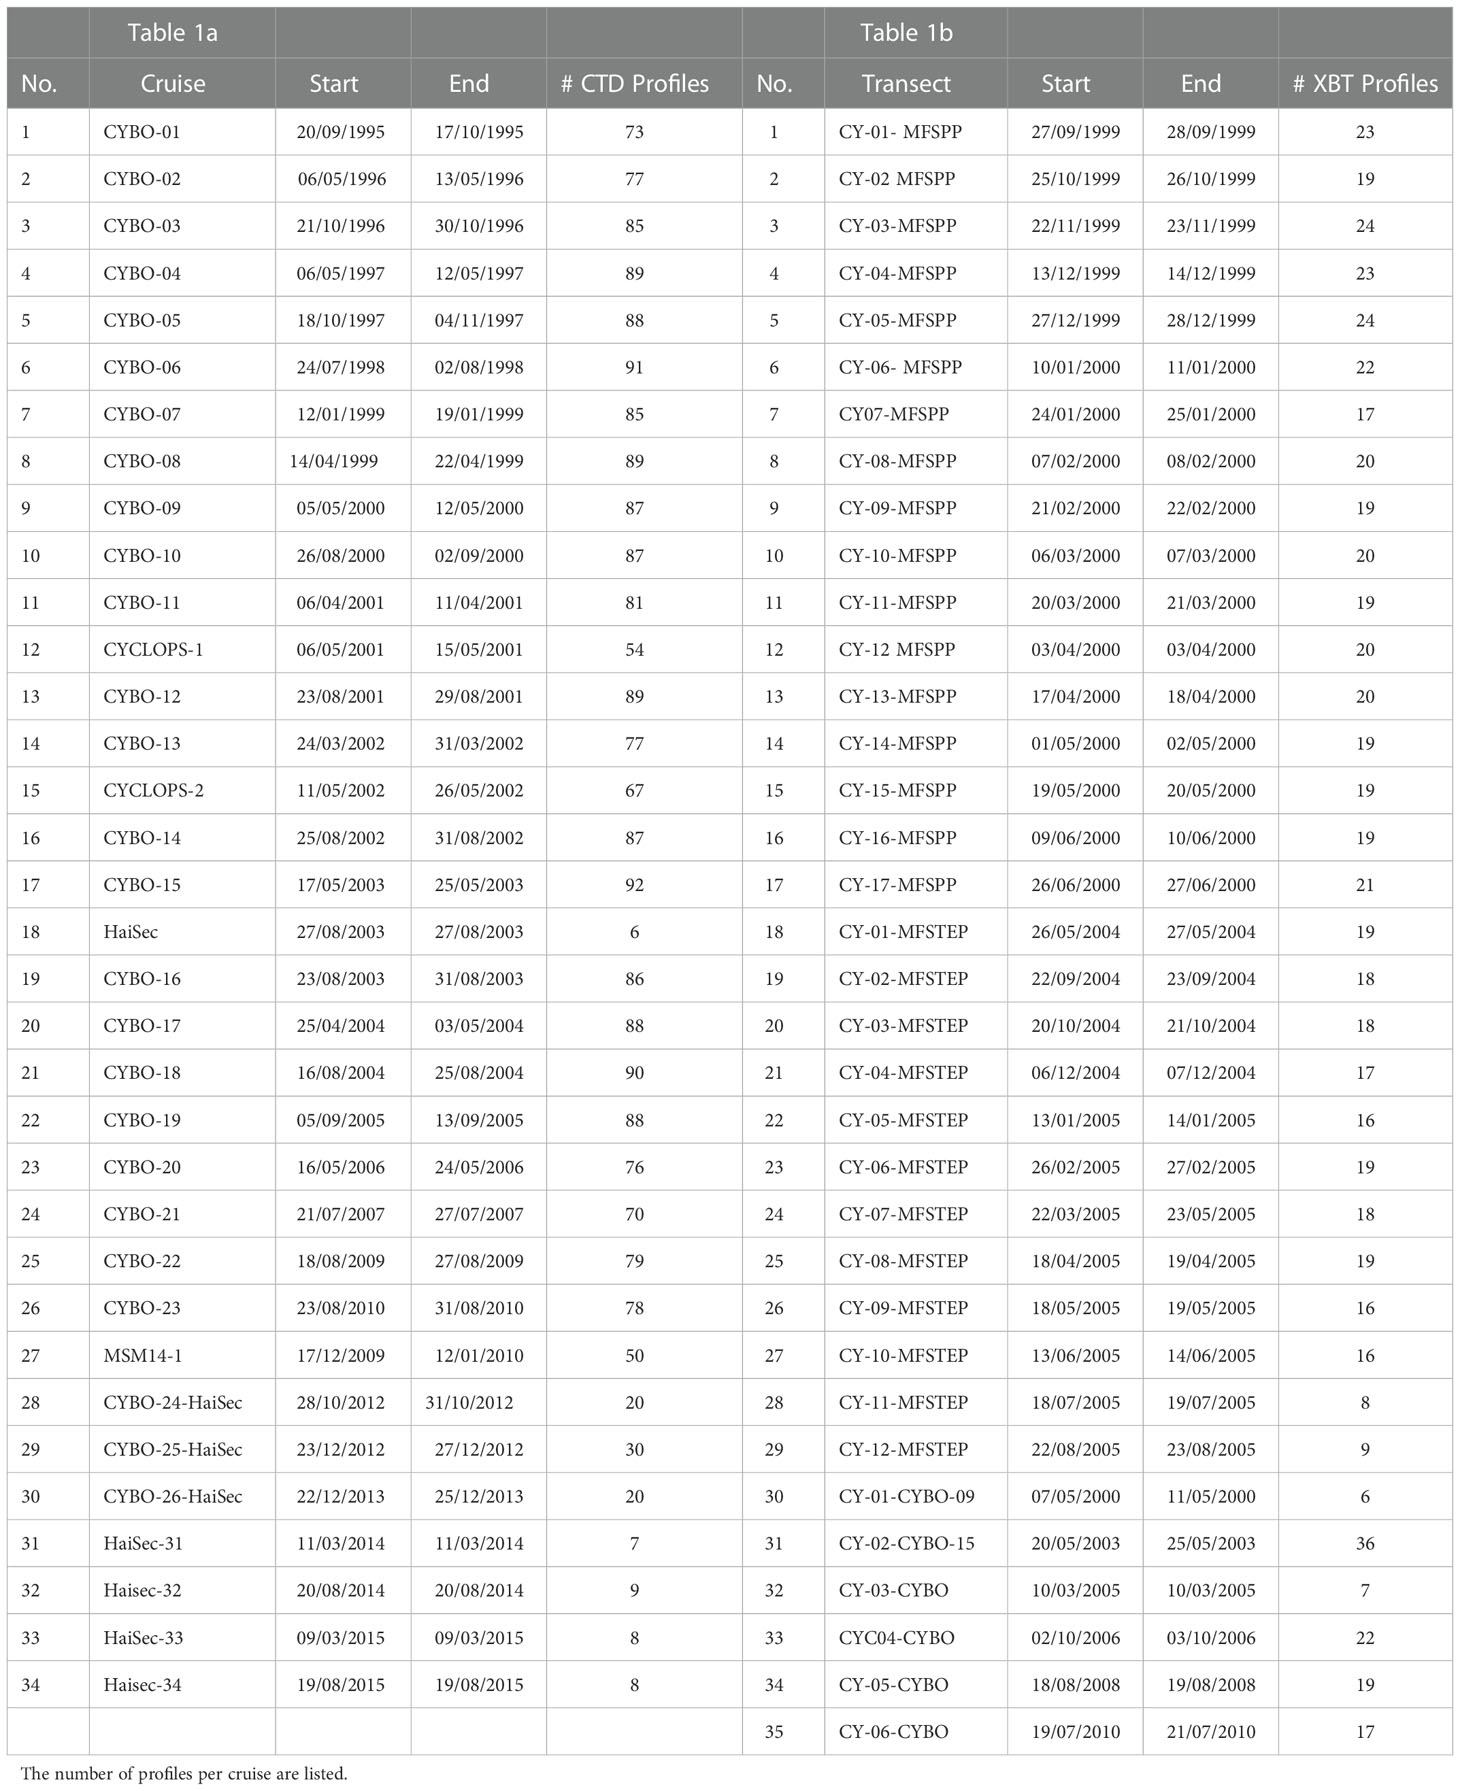
Table 1 The chronology of (a) the CYBO, HaiSec, CYCLOPS, and MSM14-1 cruises, and (b) the XBT transects Limassol (Cyprus) – Port Said (Egypt) and Limassol – Alexandria (Egypt).
The paper is organized as follow: a) in the Methods section the research cruises, the VOS transects, the datasets and their processing are described; b) the Results and Discussions section is sub-divided into two main subsections describing the thermohaline structure and the mesoscale flow features obtained from: 1) the CYBO, HaiSec, CYCLOPS and MSM14-1 cruises, and 2) the MFSPP and MFSTEP Volunteer Observing Ship (VOS) transects; and c) in the Conclusions the overall results addressing the above mentioned hydrodynamic and hydrographic uncertainties in the SE Levantine basin are summarized.
2 Methods
A total of more than 2000 deep CTD casts suitable for hydrographical analyses were gathered in the post POEM period, from 1995-2015 during 31 CYBO and HaiSec cruises (Table 1A). Profiles were obtained using SBE 911plus CTDs on board multi-purposed vessels, such as “Argonaut” and “Flying Enterprise” of the EDT Towage and Salvage/EDT Offshore company, on board the R/V “Aegaeo” of the HCMR-Hellenic Center for Marine Research, and on board of the R/V “Shikmona” of the IOLR-Israel Oceanographic and Limnological Research. Locations of the CTD stations are shown by the red dots in Figure 1. The profilers measured pressure, temperature, conductivity, and oxygen. The sensors were factory calibrated annually, mainly at the facilities of the SBE. The raw CTD data were pre-processed following the recommended procedure for the SBE 911plus, using the SBE Data Processing software. The pre-processing steps include conversion from raw binary data to engineering units in ASCII format, separation of the downcast from the up-cast profiles, low pass filtering of pressure channel to reduce high frequency noise, correction for pressure inversions caused by ship motion, derivation of the corrected salinity (psu) and bin averaging of the downcast profile into 1 dbar pressure intervals.
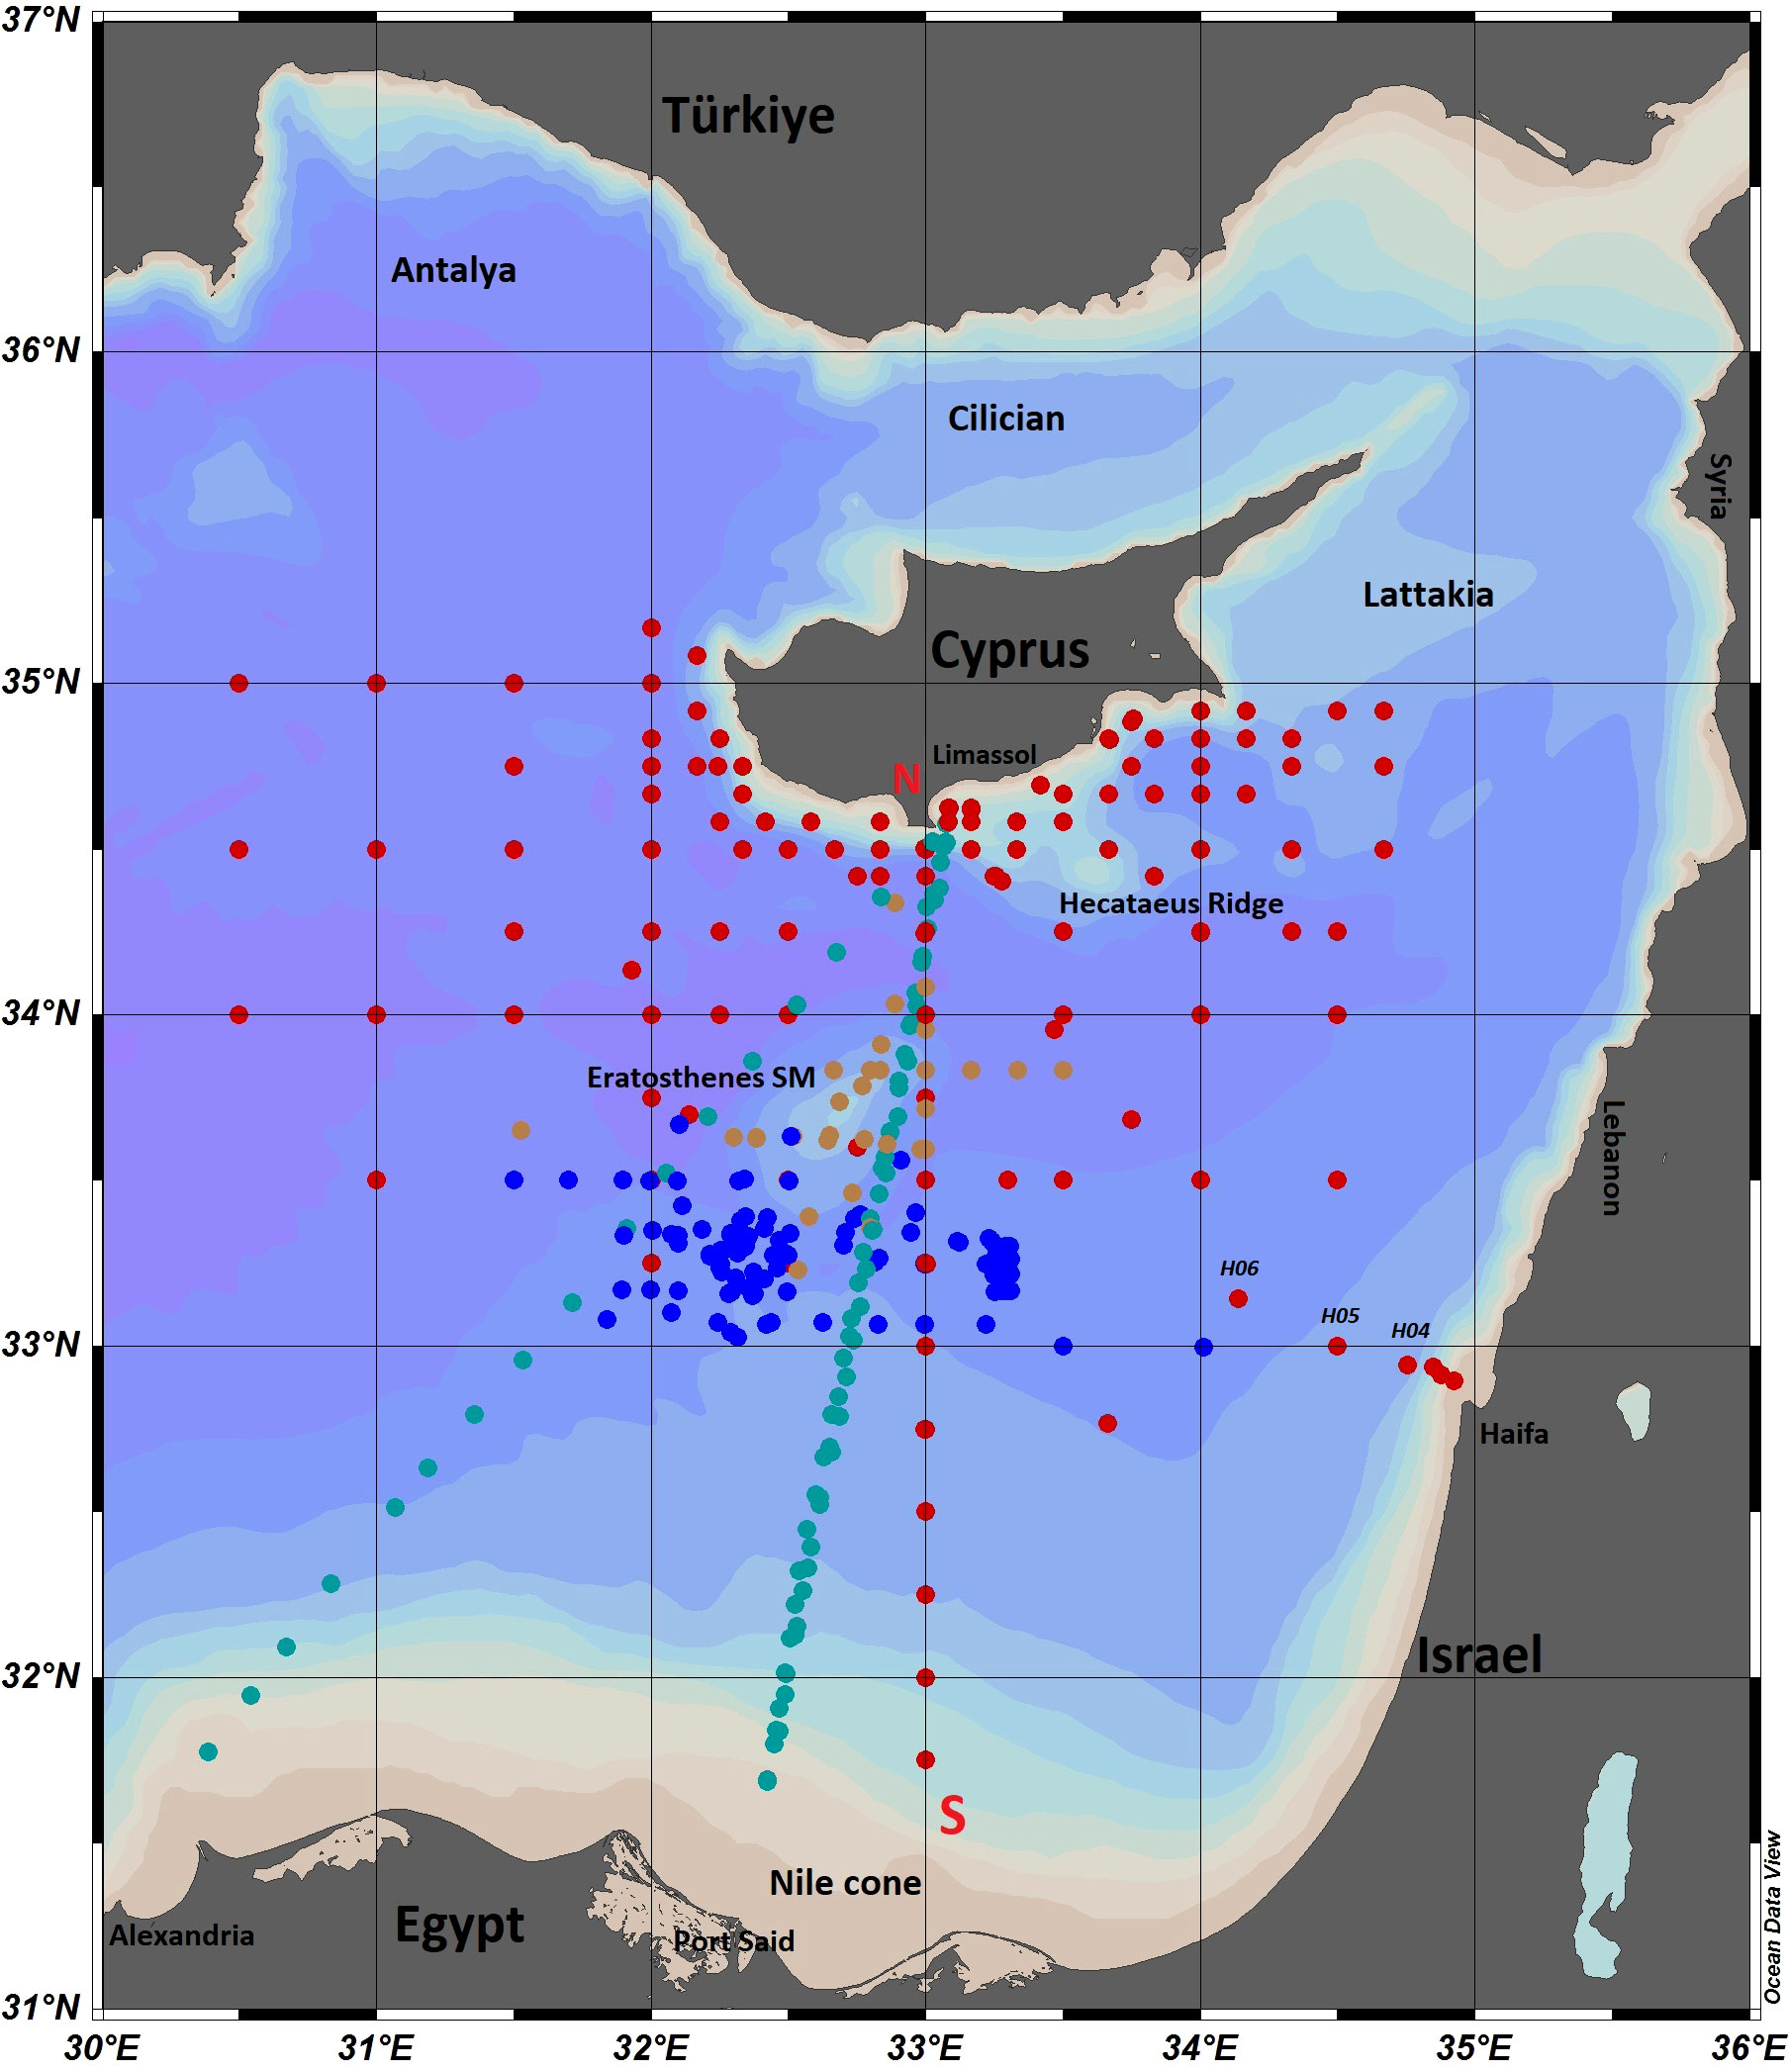
Figure 1 Physiography of the eastern Levantine Basin and locations of the CTD stations in the SE Levantine gathered during the CYBO and HaiSec (red dots), CYCLOPS (blue dots) and MSM14-1 (light brown dots) research cruises, and the XBT stations during the MFSPP-VOS and MFSTEP-VOS (light green) transects along Limassol (Cyprus) - Port Said (Egypt) and Limassol – Alexandria (Egypt). Stations H04-H06 across the Israeli shelf are also labeled.
Moreover, during the two CYCLOPS cruises on board the R/V “Aegaeo” and during the MSM14-1 cruise on board the R/V “Marian S. Merian”, a total of 173 CTD profiles (Table 1A) were collected in the sea area of the Eratosthenes SM. The stations are indicated by the blue and light brown dots in Figure 1. Similarly, the CYCLOPS and MSM14-1 datasets, were processed following the same procedures as applied for the CYBO and HaiSec datasets.
Furthermore, within the framework of the MFSPP and MFSTEP projects a total of 35 XBT transects (Fusco et al., 2003) were carried out bi-weekly between September 1999 and June 2000 and monthly between May 2004 to October 2005, along the transects Limassol (Cyprus) - Port Said (Egypt) and Limassol - Alexandria (Egypt), on board Volunteer Observing Ships (VOS) using cruise liners such as the “Princess Victoria” and “Princess Marissa” of the Louis Cruise Lines. A total of 348 XBT profiles, down to 460 m, were obtained during the MFSPP transects and 209 XBT profiles, down to 900 m, were obtained during the MFSTEP transects (Table 1B). Station locations are shown by the light green dots in Figure 1.
All of the pre-processed datasets gathered from the above CTD research cruises and VOS XBT transects (Tables 1A, B) were converted to SeaDataNet ODV format for data Quality Control (QC) using the Ocean Data View software (ODV) (Schlitzer, 2002; https://odv.awi.de/). The QC criteria follow those recommended in the SeaDataNet Quality Control Procedures version 2.0 (https://www.seadatanet.org/Publications/Technical-documentation) and by Scory et al. (2018) since the datasets were submitted to and disseminated through the SeaDataNet portal (https://cdi.seadatanet.org/search). After the QC of the data, the ODV software was used to plot thematic maps, temperature and salinity cross sections, profiles, and T/S diagrams. The in-situ data were interpolated as necessary using the DIVA method (Troupin et al., 2010 - https://github.com/gher-uliege/DIVA) with automatic scaling length, which is embedded in the ODV software. Then, the maps of the dynamic height and the cross sections with the geostrophic velocities were calculated and plotted with the same software using a reference level of 700 m.
3 Results and discussion
In this section the results are presented in two main subsections following the primary type and source of in situ, cruise data: (1) deep CTD casts, and (2) XBT transects. Each data set provides a broad overview of the spatial and temporal characteristic and variability of the circulation as assessed through the in-situ profiles, TS diagrams, vertical cross sections of temperature, salinity and geostrophic velocities, and horizontal maps of dynamic height.
3.1 Deep CTD cast cruises in the SE Levantine
The post POEM long term, in-situ investigations in the SE Levantine from 1995 to 2015, within the framework of the CYBO and HaiSec cruises elucidated some answer and highlighted the issues regarding: a) the persistence and the seasonal-interannual spatial fluctuation of the anticyclonic Cyprus Eddy, b) the generation and the re-appearance of the anticyclonic Shikmona Eddy and gyre, c) the MMJ as an offshore cross basin flow transferring the MAW, d) the impact of the global warming on the water masses of the SE Levantine, and e) the characteristics of the EMTW in the deep cavities of the SE Levantine. These cruises were supplemented with data from several limited duration and site or process specific cruises - the two CYCLOPS cruises (Krom et al., 2005; Thingstad et al., 2005), which were devoted solely to investigating the biogeochemistry of the core of the Cyprus Eddy (Table 1A; Figure 1), and the MSM14-1 cruise (Christiansen et al., 2012), which focused on physical, biogeochemical and biological sampling at and around the Eratosthenes SM (Table 1A; Figure 1).
3.1.1 Main thermohaline characteristics
The high rates of the summer heating and evaporation transform the upper surface layer of the SE Levantine into the most saline (up to 39.6-39.79) and warmest (28-30.7°C) surface waters in the Mediterranean (LSW), as observed during the summer CYBO and HaiSec cruises from 1995 to 2015.
In general, the T/S diagrams from all the summer CYBO and HaiSec cruises (listed in Table 1A) show the well-known “S” shape of the temperature and salinity relationship characterizing the water mass distribution of the Levantine basin as shown for example in Figure 2A for four summer cruises. The four main water masses are visible - the warm, saline LSW, the less saline subsurface water attributed to the MAW, the maximum salinity in the intermediate water layer attributed to the LIW, and the less saline deep waters below. The superimposed T/S diagrams (Figure 2A) gathered during four summer HaiSec cruises at stations H04-H06 spanning the Israeli slope (Figure 1), which were revisited repeatedly from 2003 to 2006, clearly demonstrates the rapid salinization of the main water masses in the eastern most part of the SE Levantine from the surface down to the intermediate water depths within a period of only 3 years. This is further emphasized in the 12-year evolution of the characteristic salinity extremes of the three water masses LSW, MAW, and LIW, for all CYBO summer cruises shown in Figure 2B where the LSW salinity maximum increased from an average of 39.35-39.45 in summer 1998 to an average of 39.70-39.79 in summer 2010, while the salinity of the subsurface MAW minimum increased from 38.55 in the summer of 1998 to 38.85 in the summer 2008. The salinization of the LIW (150-350 m) was observed to occur more rapidly from the year 2005 (Figure 2B) with an average maximum salinity in August 2010 between 39.30-39.35, while a decade earlier its maximum values varied on average between 39.08-39.1. This is consistent with the salinization of the water masses observed by Ozer et al. (2017) across the broader region of the southeastern quadrant of the Levantine basin.
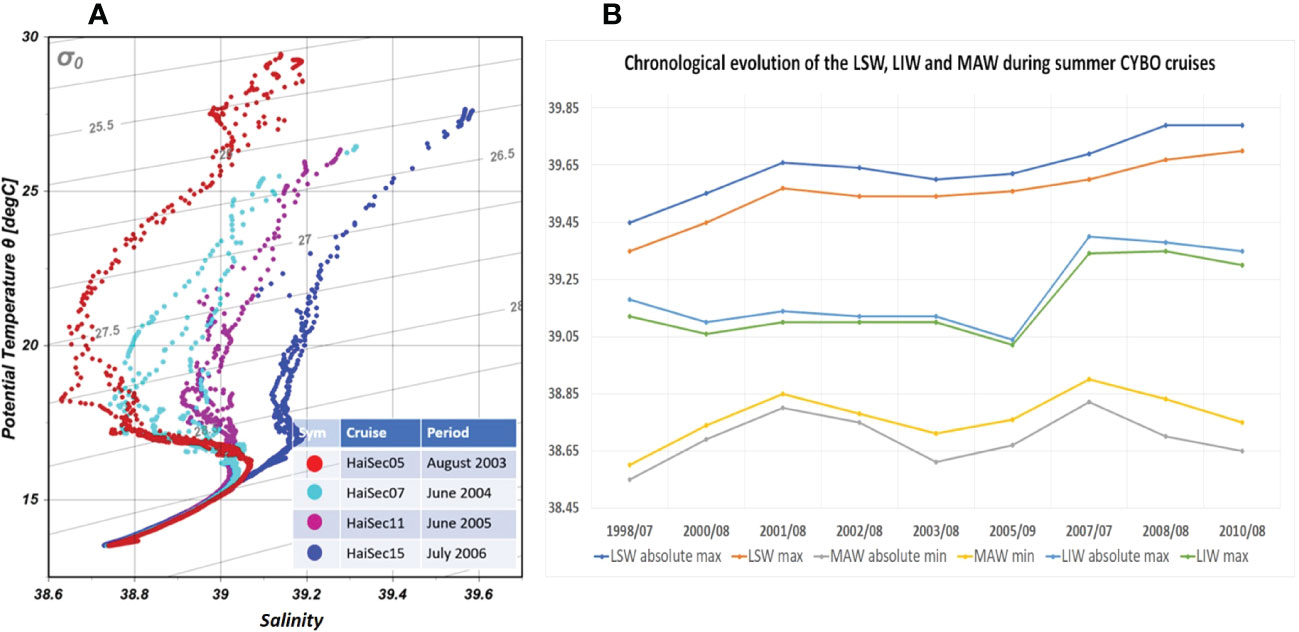
Figure 2 (A) T/S diagram of data from the 4 summer HaiSec cruises carried out from August 2003 to July 2006 at the stations H04-H06; (B) Evolution of the salinity extremes of the LSW (maximum), of the MAW (minimum) and of the LIW (maximum) during the summer CYBO cruises from 1998 to 2010.
MAW originates from the Atlantic water inflow through the upper layer of the Straits of Gibraltar while its salinity gradually increases as it is transported to the east due to net evaporation. MAW should appear near the surface throughout the Mediterranean, however surface heating and strong evaporation in the eastern basins from spring through autumn create the warm saline LSW which caps the MAW. Thus, MAW generally appears as subsurface salinity minimum between the more saline LSW and LIW. Nevertheless, on occasion MAW can be observed in the spring as a single layer extending from the surface down to 100 m depth in the western part of the SE Levantine basin as shown in Figure 3 for the CYBO 9 cruise (May 2000). This can be seen near the center of the N-S section of salinity along 31°E (Figure 3A), located to the west of Cyprus, with salinity values between 38.7-38.95. This is also seen at the western edge of the W-E section along 34°E (Figure 3B) as well as in the points falling in the upper left range of the T/S diagram (Figure 3C). As the MAW is transported eastward by the meandering MMJ (Figure 3D) the core of the MAW deepens and no longer reaches the surface as shown by the subsurface minimum near the center of Figure 3B where salinity values of 38.80-38.95 were observed.
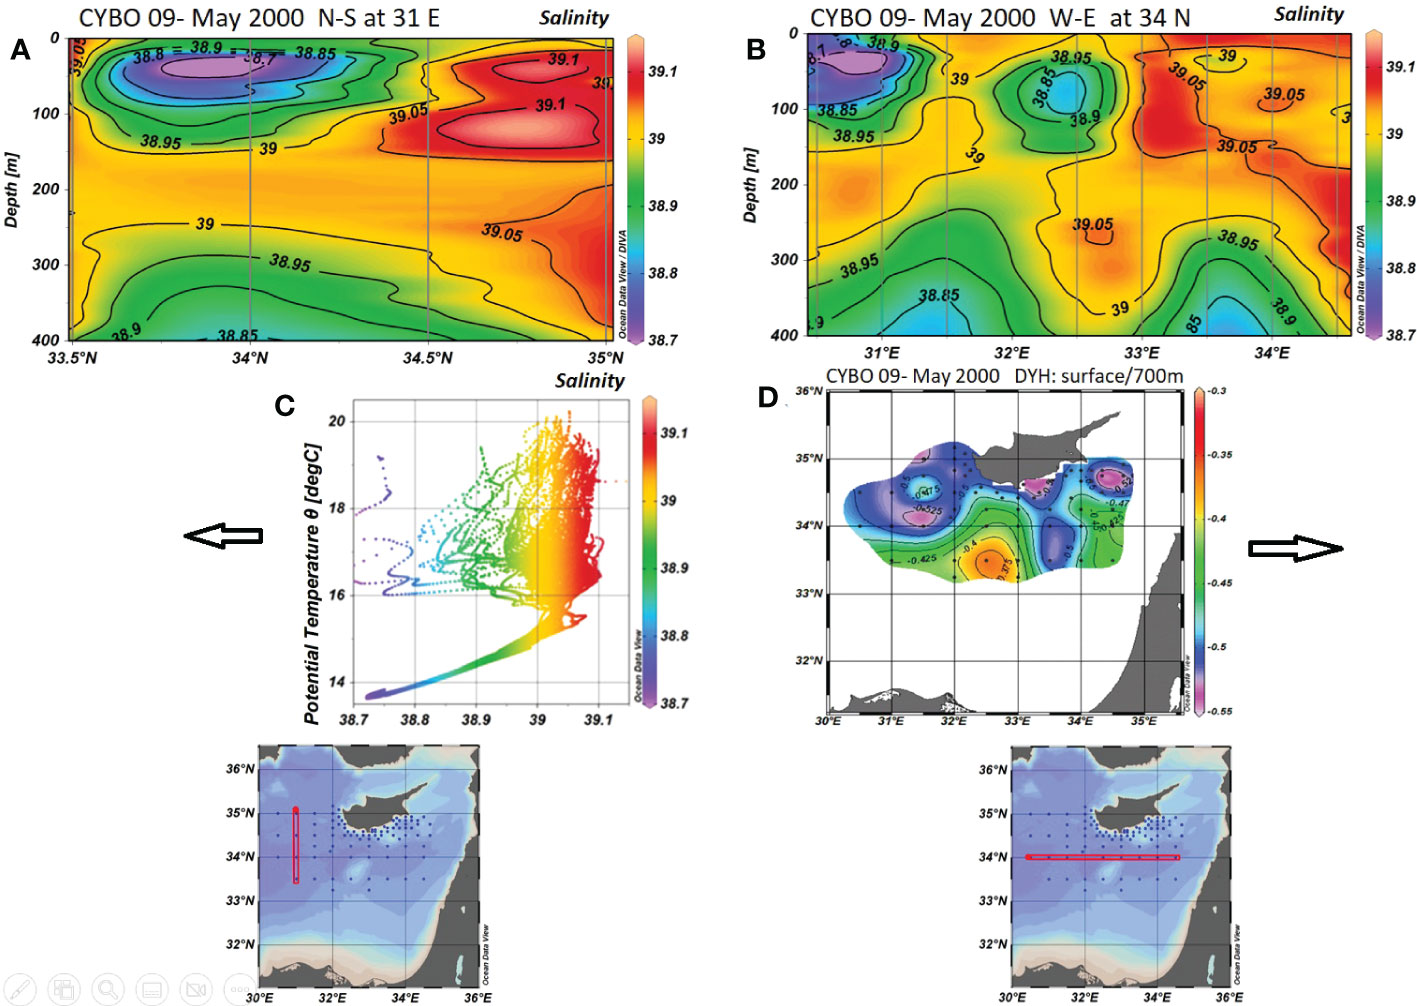
Figure 3 Results from CYBO 09 (May 2000): (A) N-S section along 31°E, (B) W-E section along 34°N, (C) T/S diagram, and (D) dynamic height topography relative to 700 dbar.
During the CYBO cruises 12 (Aug 2001) and 14 (Aug 2002), the EMTW could be clearly identified in Figure 4A at depths below 1400 dbar with salinities of 38.74-38.78 and temperatures of 13.5-13.6°C, both increasing with depth. A decade later, during the CYBO-HaiSec 25 cruise in Dec 2012, the thermohaline characteristics of the EMTW changed noticeably as shown in Figure 4B. The transition depth from EMDW to EMTW (indicated by the turning point on the T/S curve) was lifted by roughly 100 dbar, while the water became warmer and saltier with typical increases of 0.05°C and 0.01 respectively. A similar shift in the characteristics of the deepest waters in the T/S diagrams was observed by Ozer et al. (2020) at station H06 of the HaiSec cruises during the period 2012-2019, thus indicating that the signal of changes in deep water characteristics is a long-term process, lasting for at least two decades. In addition, the T/S diagram in Figure 4B shows a second and deeper transition point, indicating that at depths below the 2000 dbar cooler and slightly less saline deep waters intruded into the deepest layers of the SE Levantine basin. The post EMT intrusion of this cooler, less saline deep water originating from the Adriatic Sea was observed in the eastern Levantine basin as early as 2008 (Gertman et al., 2010b; Gertman et al., 2016).
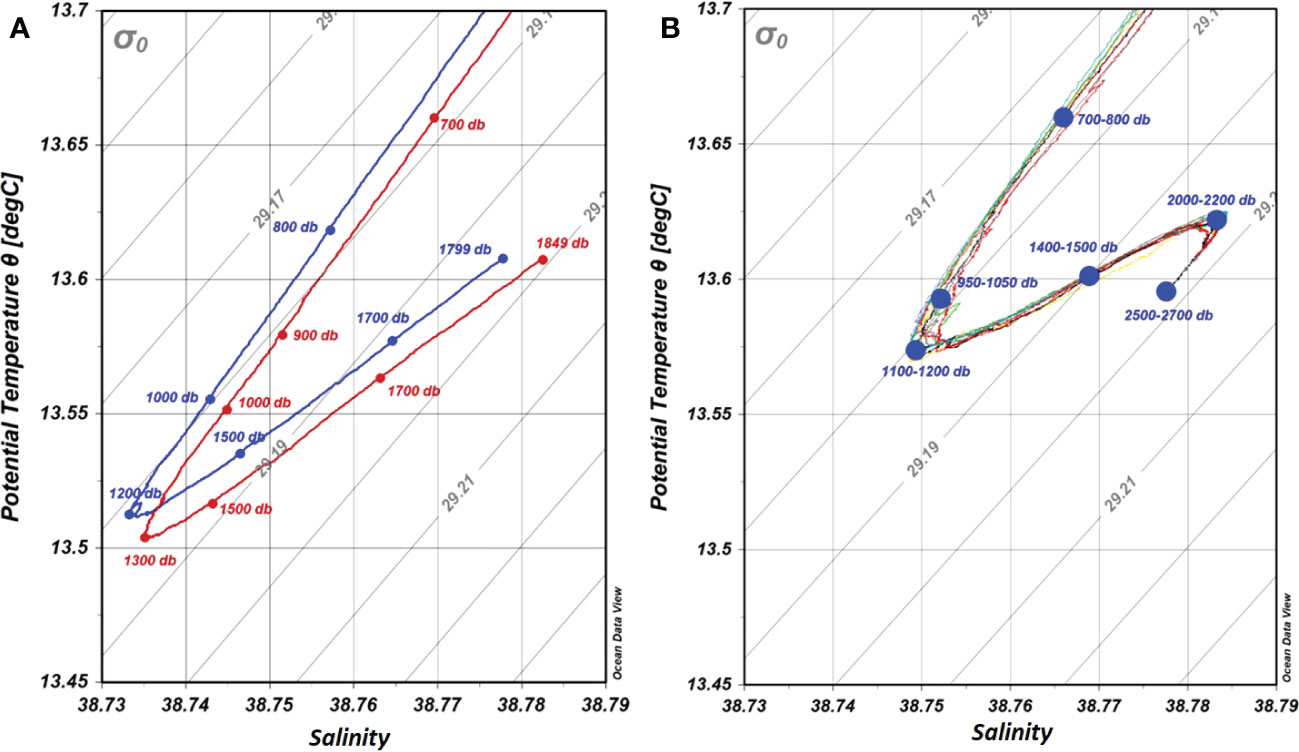
Figure 4 T/S diagrams of the EMTW in the SE Levantine: a) from a deep station south of Cyprus for CYBO 12 (Aug 2001) in blue and for CYBO 14 (Aug 2002) in red and b) from all deep stations (below 2000 dbar) for CYBO-HaiSec 25 (Dec 2012).
3.1.2 Main mesoscale circulation features
The two most prominent mesoscale circulation features in this region are the anticyclonic Cyprus and Shikmona eddies appearing in distinct geographic regions. The Cyprus Eddy appears in the vicinity of the Eratosthenes SM while the Shikmona Eddy appears to the southeast of Cyprus. The location of the center of each eddy in a particular cruise was designated as (1) the point with the deepest depression of the isotherms at the base of the warm, saline thermostad forming the core of the eddy along a vertical cross section, or (2) the highest point in the horizontal map of the dynamic height topography. Criterion (1) was used by Brenner (1993). To be more precise, Gertman et al. (2007) proposed using the depression of the potential density surfaces rather than isotherms, although the differences are expected to be small as indicated by the respective temperature and salinity cross sections in Brenner (1993). The Cyprus Eddy was observed in 29 CTD cruises (CYBO, CYBO-HaiSec, CYCLOPS, MSM 14-1) as well as in 33 XBTs transects presented below in Section 3.2. Its center was located between 32°E to 34°E and fluctuating roughly +/- 50 km north and south around 33.5°N. The Shikmona Eddy was observed to co-exist with the Cyprus Eddy in only 9 of the CTD (CYBO) cruises, with its eddy center located between 34°E to 35°E and fluctuating less than +/- 50 km north and south around 34°N. In earlier studies (POEM and related cruises) these features were described as recurrent or persistent, which is corroborated by this study.
The in-situ dynamic height topography from winter 1996 to summer 1999 is shown in the top row of Figure 5 for four dates selected from the first eight CYBO cruises. These maps demonstrate that the anticyclonic Cyprus Eddy was quite well developed south of Cyprus, slightly east of the Eratosthenes SM, with its eddy center migrating seasonally in the longitudinal direction, between 33° 30’E and 33° 45’ E, but remaining near latitude 33° 30’ N. The geostrophic velocities at its periphery were up to 0.35-0.45 m/s. From spring 2000 to summer 2007 (Figure 5 middle row), the dynamic height topography showed a more complicated flow structure south of Cyprus, with two well developed anticyclonic eddies, the Cyprus Eddy, which was shifted west of the Eratosthenes SM and a secondary anticyclonic eddy located in the eastern part of the surveyed area. The latter is attributed to the secondary eddy mentioned by the POEM group and named as the anticyclonic Shikmona Eddy by A. Hecht as reported in Robinson et al. (1991). During this period the Cyprus Eddy was shifted significantly westward or southwestward by 55-85 km, and in some cases by as much as 110 km. The eddy center migrated seasonally between longitudes 33° 00’E and 31° 45’E but in a very limited latitude range between 33° 15’N and 33° 30’N. The Shikmona Eddy was located east of the Cyprus Eddy, with its center migrating seasonally, between longitudes 34° 15’E to 34° 30’E but remaining close to latitude 34° 00’N. Around the time of the two CYCLOPS cruises in the springs of 2001 and 2002, the corresponding CYBO cruises 12 (Aug 2001) and 14 (Aug 2002) presented in the first and second panels in the middle row of Figure 5 revealed a significant seasonal spatial displacement of the Cyprus Eddy to the west from its initial position (Zodiatis et al., 2005a), leading to a complex flow path of the MMJ. During the CYBO 12 cruise in Aug 2001, three months after the first CYCLOPS cruise, the southward migration of the Cyprus Eddy resulted in the re-establishment of the eastward flowing MMJ, with geostrophic velocities up to 0.45 m s-1, along the northern flank of the eddy (first panel in the middle row Figure 5). Concurrently the fluctuation of the northward current flowing along the shelf and slope of Israel and Lebanon resulted in the formation of the secondary anticyclonic eddy to the east. This prominent two eddy system persisted through the summer of 2004 and gradually weakened though the summer of 2007.
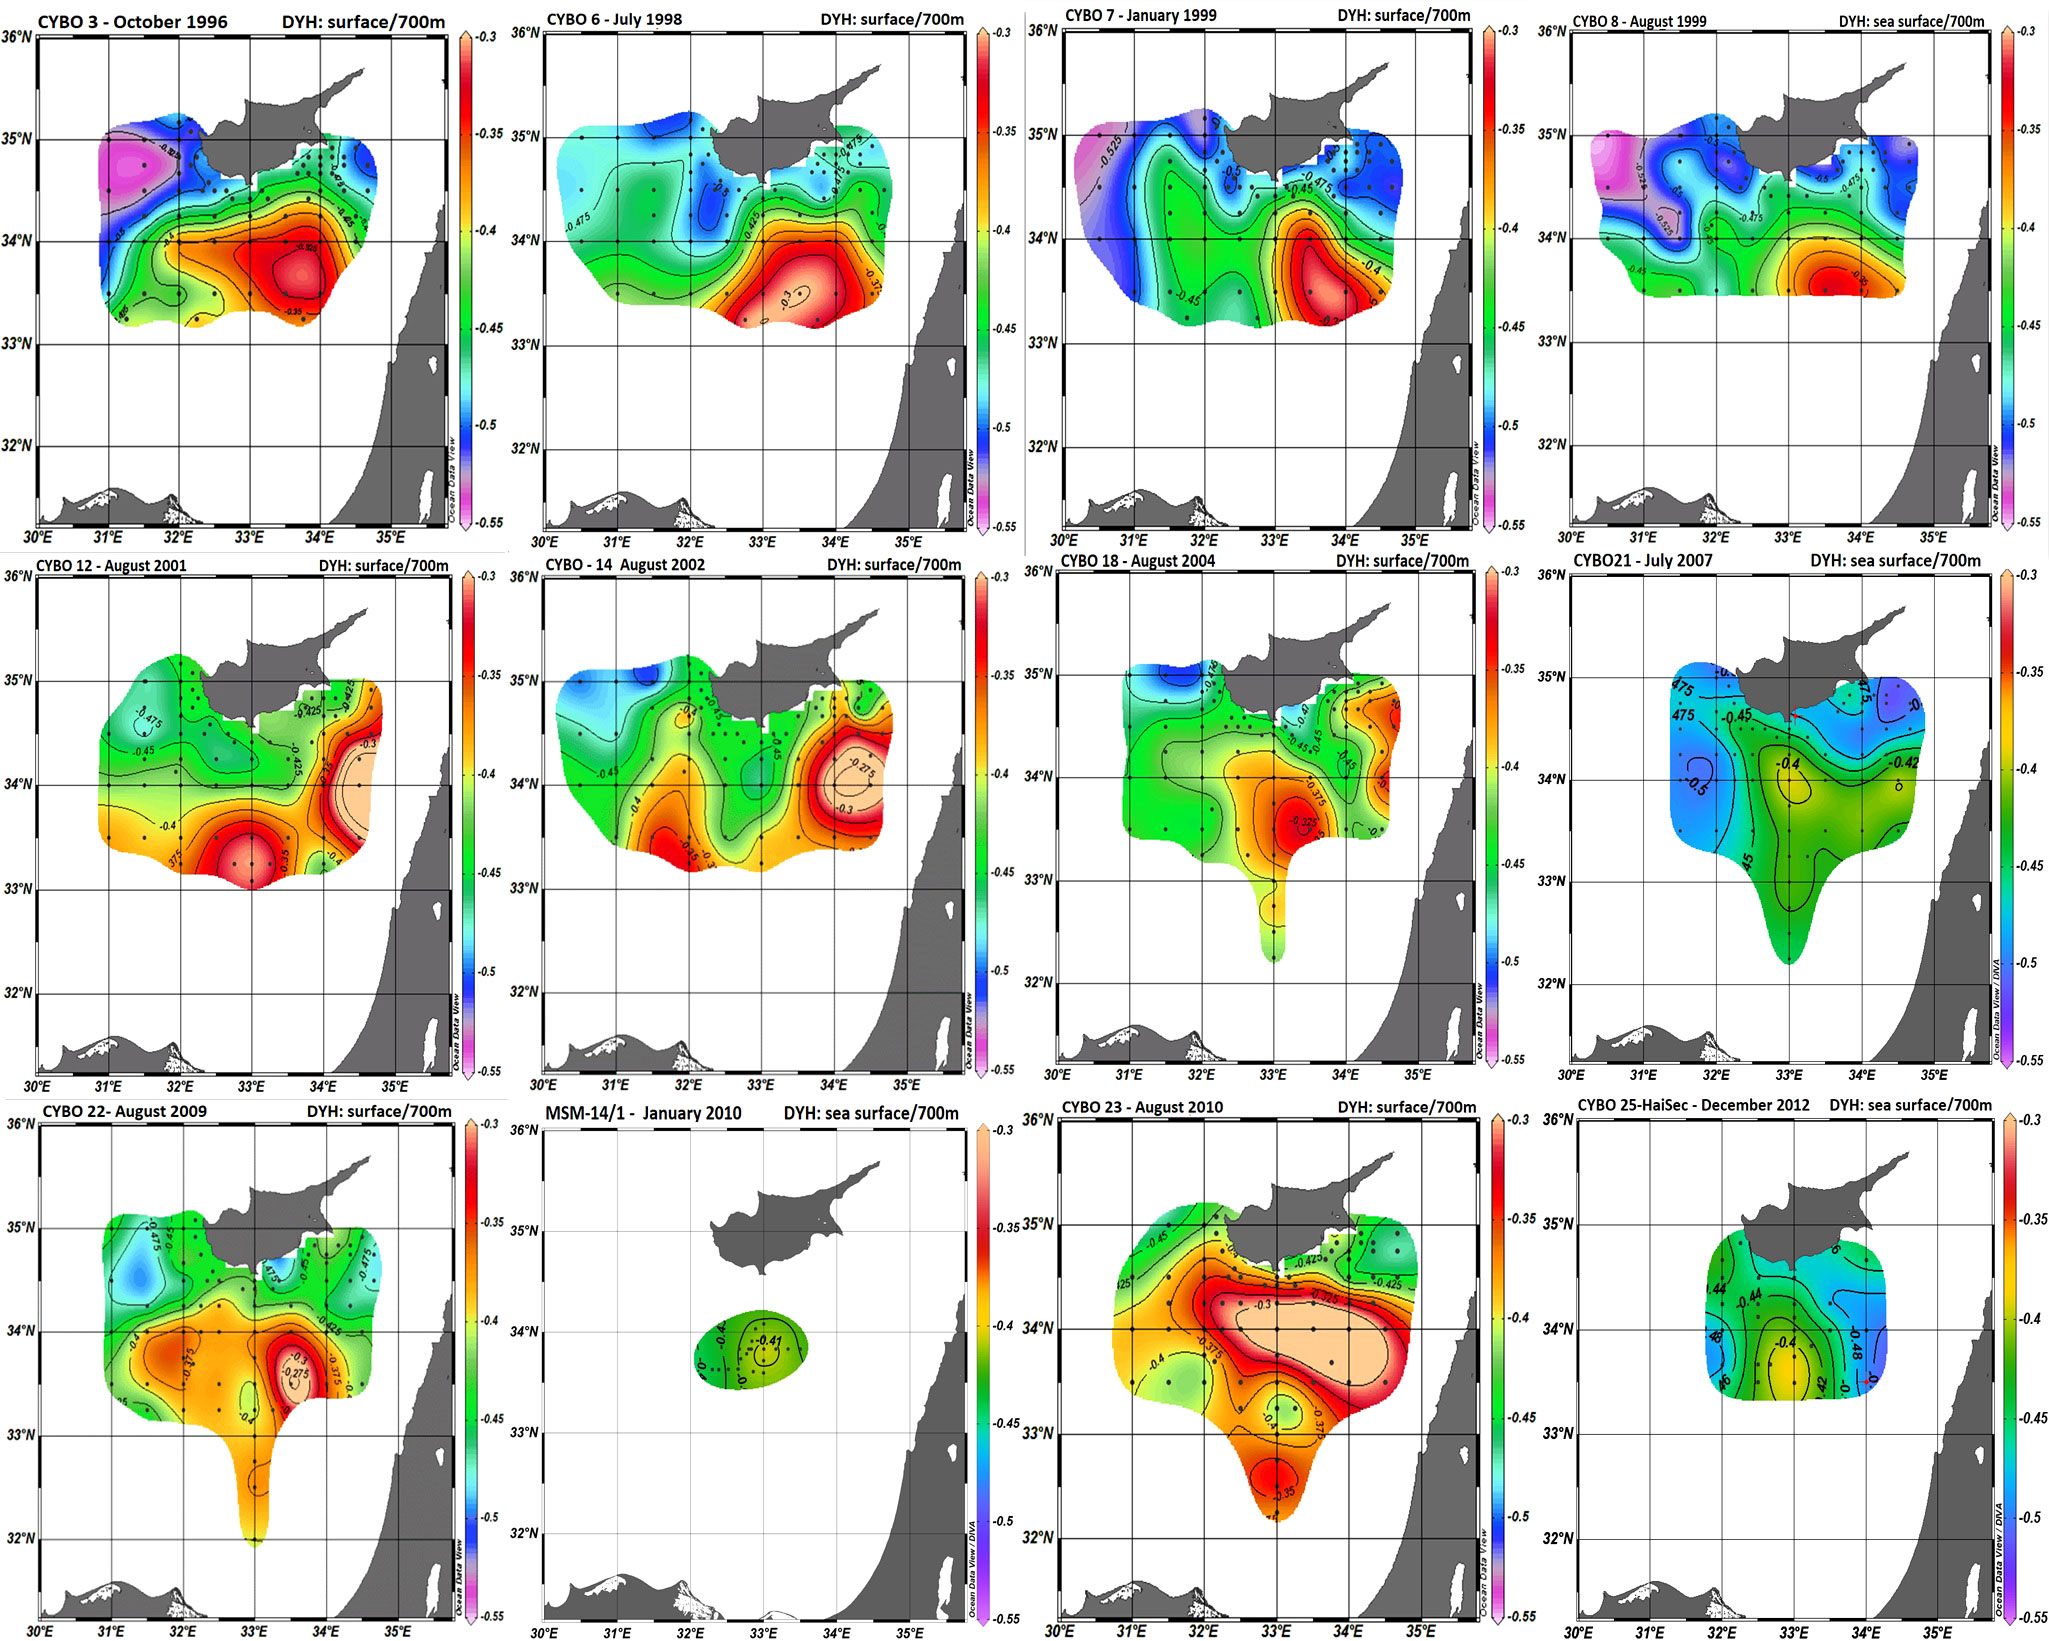
Figure 5 The dynamic height topography relative to 700 dbar during the cruises CYBO 3, 6, 7, 8 (top row); CYBO 12, 14, 18, 21 (middle row); and CYBO 22, MSM 14-1, CYBO 23, CYBO-HaiSec 25 (bottom row) corresponding to three active periods with: top row the dominance of the Cyprus Eddy (1996-1999), middle row the co-existence of the Cyprus and Shikmona eddies (2000-2007) and bottom row the dominance of the Cyprus Eddy (2009-2012).
From summer 2009 to winter 2012 the dynamic height topography (Figure 5 bottom row), shows that the Cyprus Eddy once again became the dominant feature, shifting eastward close to its previous location east of the Eratosthenes SM, with its center at 33° 30’ E, 33° 30’ N. The Shikmona Eddy disappeared. The circulation pattern, in the broader Eratosthenes SM region at the time of the MSM14-1 cruise in Dec2009 – Jan 2010 (second panel from the left in the bottom row of Figure 5) is dominated by a well-developed anticyclone, similar to the eddy observed during the CYBO and CYCLOPS cruises and identified as the Cyprus Eddy. The core of the Cyprus Eddy was located in the same geographical region as during the CYBO cruises (Zodiatis et al., 2005a; Zodiatis et al., 2005b). The Cyprus Eddy, whose influence extends down to depths of roughly 450 m, constitutes one of the most intense (current speeds up to 0.35 m s-1) circulation features in the SE Levantine Basin and undergoes strong temporal and spatial fluctuations as was found during the CYBO and CYCLOPS cruises as well as in historical data. During the MSM 14-1 cruise, shipborne ADCP and glider data were also collected in the same area at the beginning of Jan 2010 (Christiansen et al., 2012) and show good agreement with the pattern depicted in the relevant panel in Figure 5.
The secondary anticyclonic eddy in the southeastern most part of the domain was initially identified by the POEM group and years later it was named the Shikmona Eddy during the CYBO-HaiSec cruises. It appears to be generated at times when the strong northward current flowing along the Israel-Lebanese shelf and slope becomes unstable and detaches thus forming an anticyclonic eddy. During these events the Cyprus Eddy shifts westward or southwestward from the Eratosthenes SM. One example of the Shikmona Eddy formation in Aug 2009 is shown in Figure 6 where SVP drifter trajectories from the NEMED project (Gertman et al., 2010a; Menna et al., 2012) are superimposed on MODIS SST images in the area along the shelf and slope of Israel-Lebanon. The drifter trajectories clearly show that the eddy detached from the northward flowing shelf-slope current (Rosentraub and Brenner, 2007) north of Haifa and drifted northwest to the area where the secondary eddy (the Shikmona Eddy) was observed during CYBO cruises and previously during the POEM cruises (Robinson et al., 1991). This secondary anticyclonic eddy was also observed at this time during the CYBO 22 cruise in late August 2009 (see Figure 5).
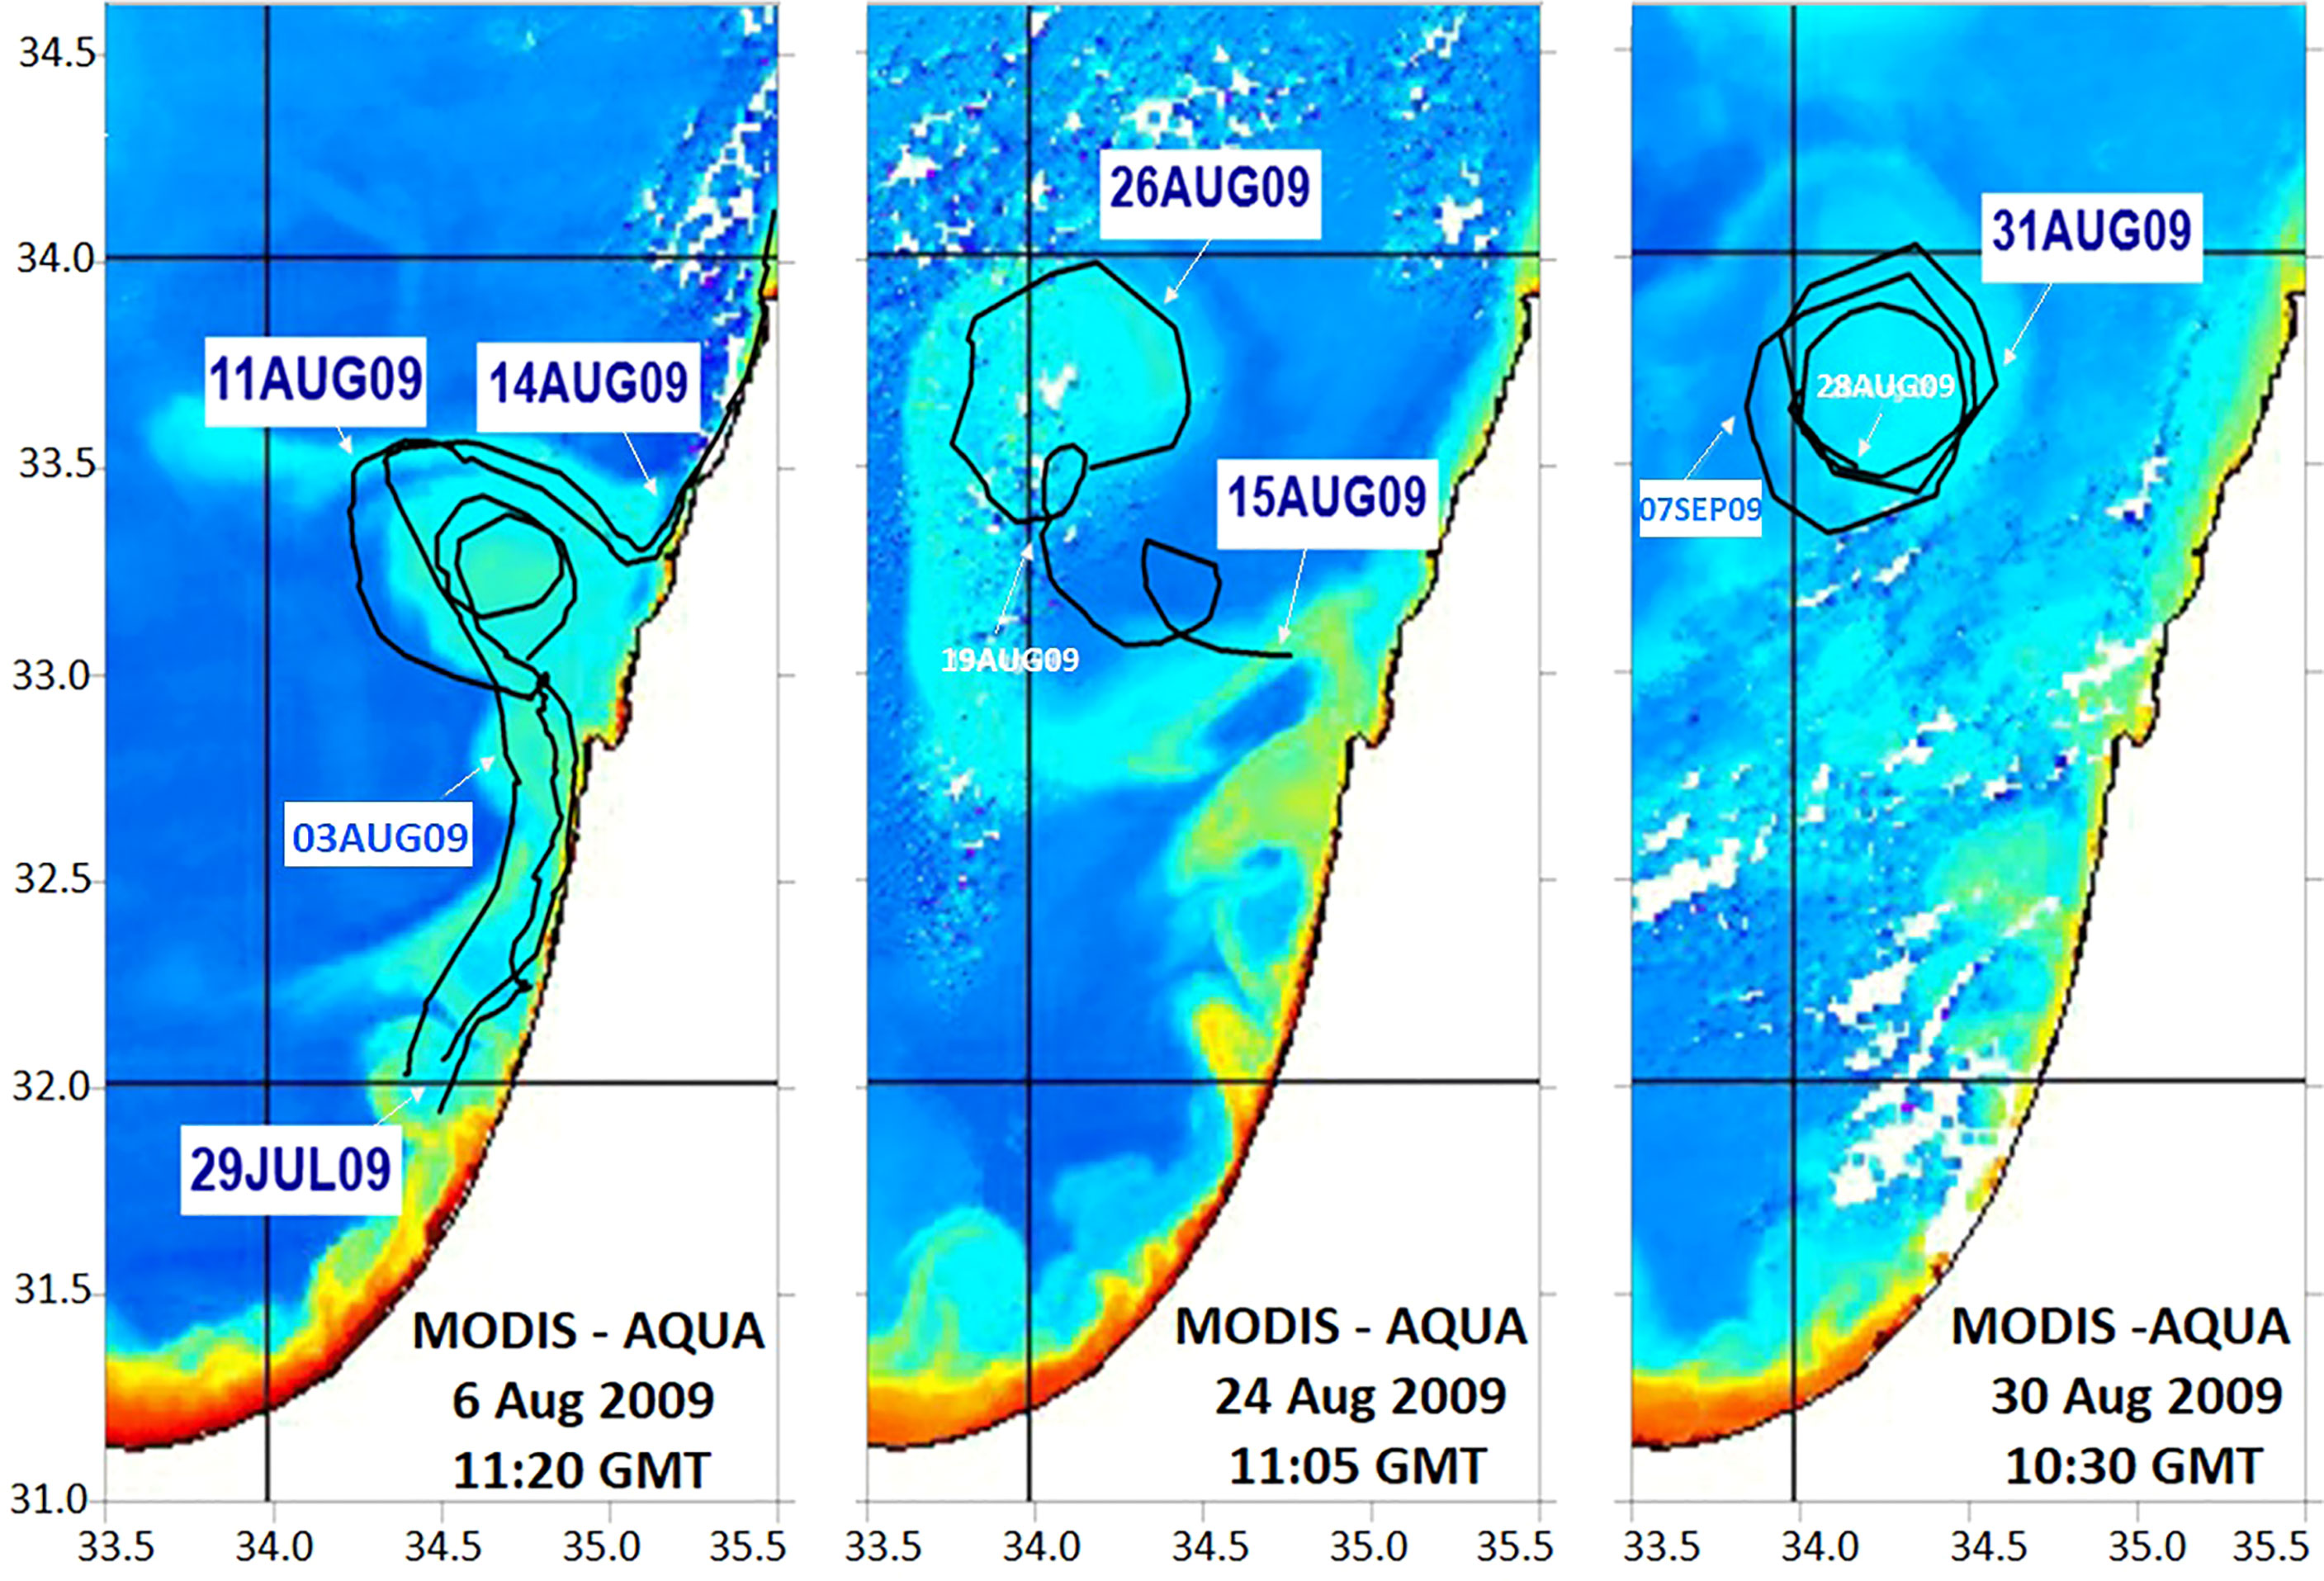
Figure 6 The NEMED SVP drifter trajectories superimposed on MODIS satellite images along the Israel-Lebanon shelf and slope from 29 Jul to 31 Aug 2009, showing the anticyclonic eddy formation starting as a meander in the northward flowing shelf-slope current, detaching from the current as an anticyclonic eddy and drifting out to the open sea towards the northwest. This eddy was simultaneously observed during the summer CYBO 22 cruise in late August 2009.
The analysis of the dynamic height topography during the period 1996-2011 reveals the significant migration of the Cyprus and Shikmona eddies’ centers, as shown in Figure 7. The Cyprus Eddy center migrates eastward and south-eastward from the Eratosthenes SM, while during periods of the appearance of the Shikmona Eddy offshore along the Israel-Lebanon shelf and slope, the Cyprus Eddy is forced to migrate westward or south westward from the Eratosthenes SM. Similar migrations of these eddy centers were observed during the period 1985-1992 by Brenner et al. (1991) and Brenner (1993). In a recent modeling study Egorova et al. (2022) suggested a mechanism for the Cyprus Eddy formation related to the growth of non-axisymmetric perturbations over complex bottom topography in the broader area of the Eratosthenes SM. They demonstrated that by imposing an eastward flow (attributed to the MMJ) at the western boundary of the Eratosthenes SM domain, it is possible to generate a dipolar vortex - an anticyclonic eddy attributed to the Cyprus Eddy, and a cyclonic eddy to the northwest of the Cyprus Eddy. Similar dynamical structures are visible in Figure 5.
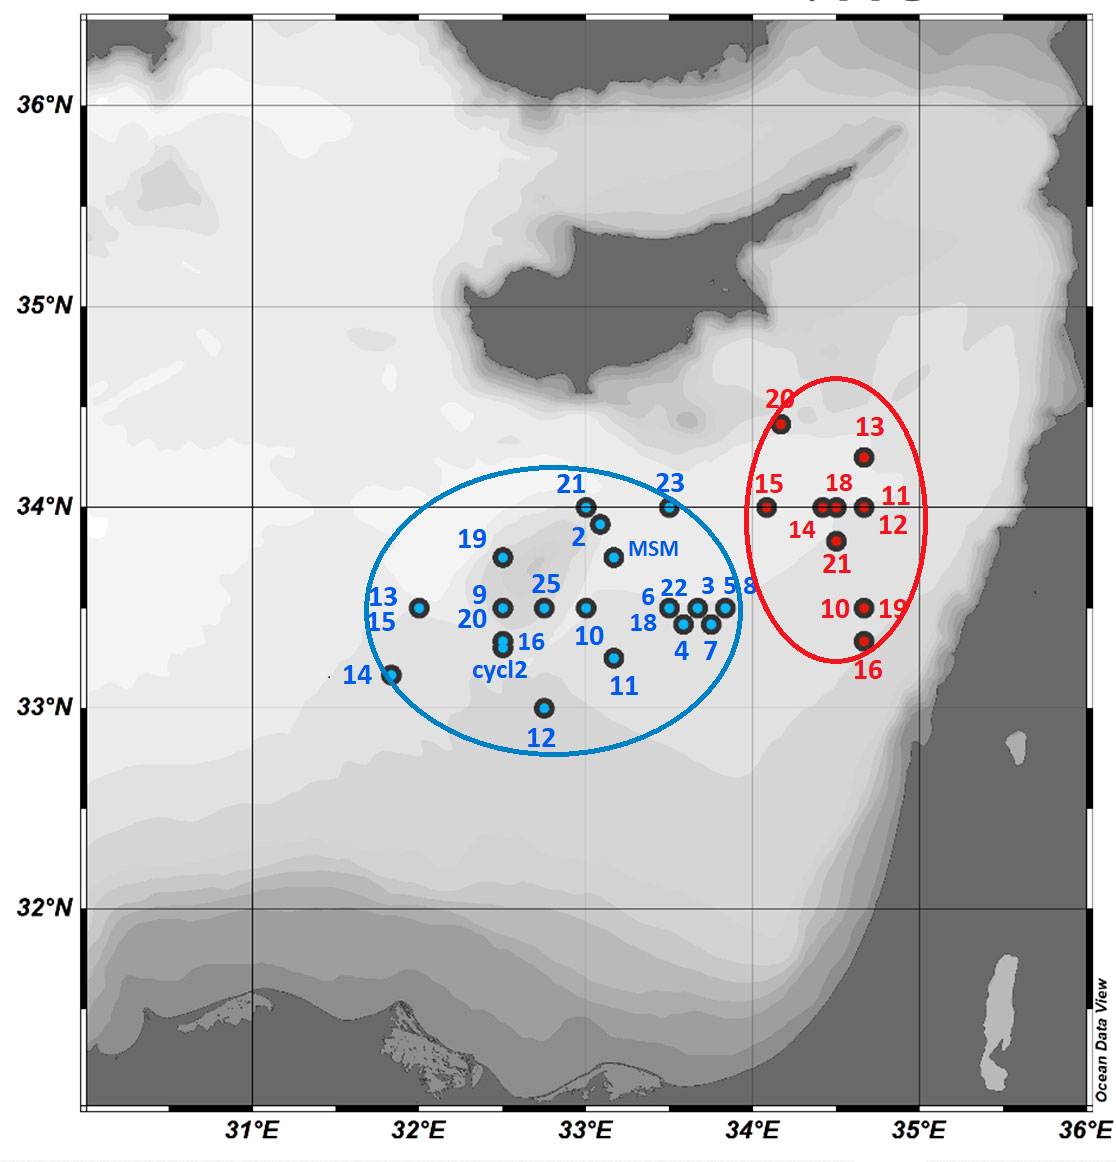
Figure 7 Seasonal and inter-annual migration of the Cyprus Eddy center (in blue) and of the Shikmona Eddy center (in red) from 1996 to 2012. Label next to each location indicates the cruise number listed in Table 1A.
The significant seasonal and inter-annual migration of the Cyprus Eddy can be explained based on the influence of other dynamical structures in the vicinity, such as the appearance of the Shikmona Eddy as noted above, or the significant fluctuations of the eastward flow in the central Mediterranean which transfers the MAW to the Levantine basin. Particularly, the periodic reversals of the North Ionian circulation (Gačić et al., 2010 and Gačić et al., 2011; Pinardi et al., 2015; Simoncelli et al., 2018) affect the eastward transfer of the MAW from the Ionian Sea to the Levantine basin as shown in Section 3.1 of von Schuckmann et al. (2016). However, further investigations are needed to examine if there is a dynamical relationship between the Northern Ionian circulation and the migration of the Cyprus Eddy.
With the development of the Mediterranean Sea reanalysis (MEDREA16, Simoncelli et al., 2014) within the framework of the MyOcean project (Simoncelli et al., 2016) and the Copernicus Marine Service (Section 3.1 in von Schuckmann et al., 2016; Simoncelli et al., 2018), as well as the downscaled, sub-regional, higher resolution CYCOFOS forecasting system (Zodiatis et al., 2018), an improved pattern of the circulation in the Levantine basin was depicted showing the co-existence of the anticlockwise flow along the north African (Egyptian) shelf and slope with the offshore cross basin current attributed to the MMJ. In order to emphasize the recurrence or persistence of the circulation features observed during the CTD cruises, several examples of the decadal mean circulation patterns near the surface and the 300 m depth from the MEDREA16 reanalysis are shown in Figure 8 for comparison. The decadal mean circulation from 1987-1996 shows the reversal of the Northern Ionian Circulation (anti-cyclonic), while the following decade presents a cyclonic mean flow during 1997-2006. According to the analysis from Menna et al. (2021) based on observations, the last decade was characterized by several shorter period reversals of the Northern Ionian circulation, although this is not apparent in the decadal mean maps in Figures 8E, F. The main pathway of the AIS influences the thermohaline properties of the Levantine basin due to the eastward transport of MAW. Even during the last decade the AIS crosses the central Ionian at times and brings MAW to the Levantine basin. The decadal mean circulation in the Levantine clearly shows both a multipole Mersa Matruh Gyre system and the Cyprus Eddy near the surface and at intermediate depth. Furthermore, the MEDREA16 mean circulation during the first decade shows the Cyprus Eddy located east of the Eratosthenes SM, while during the second decade it was located west of the SM while co-existing with the Shikmona Eddy offshore Israel–Lebanon. During the third decade the Cyprus Eddy appears as a single, large eddy. Similarly, the decadal mean MEDREA16 circulation maps show the bifurcation of the MMJ southwest of Cyprus, with its eastward branch flowing along the periphery of the Cyprus Eddy. Despite the temporal differences between the circulation depicted from the CYBO-HaiSec cruises and the MEDREA16 mean circulation, there is a clear agreement between the flow patterns and their spatial distributions.
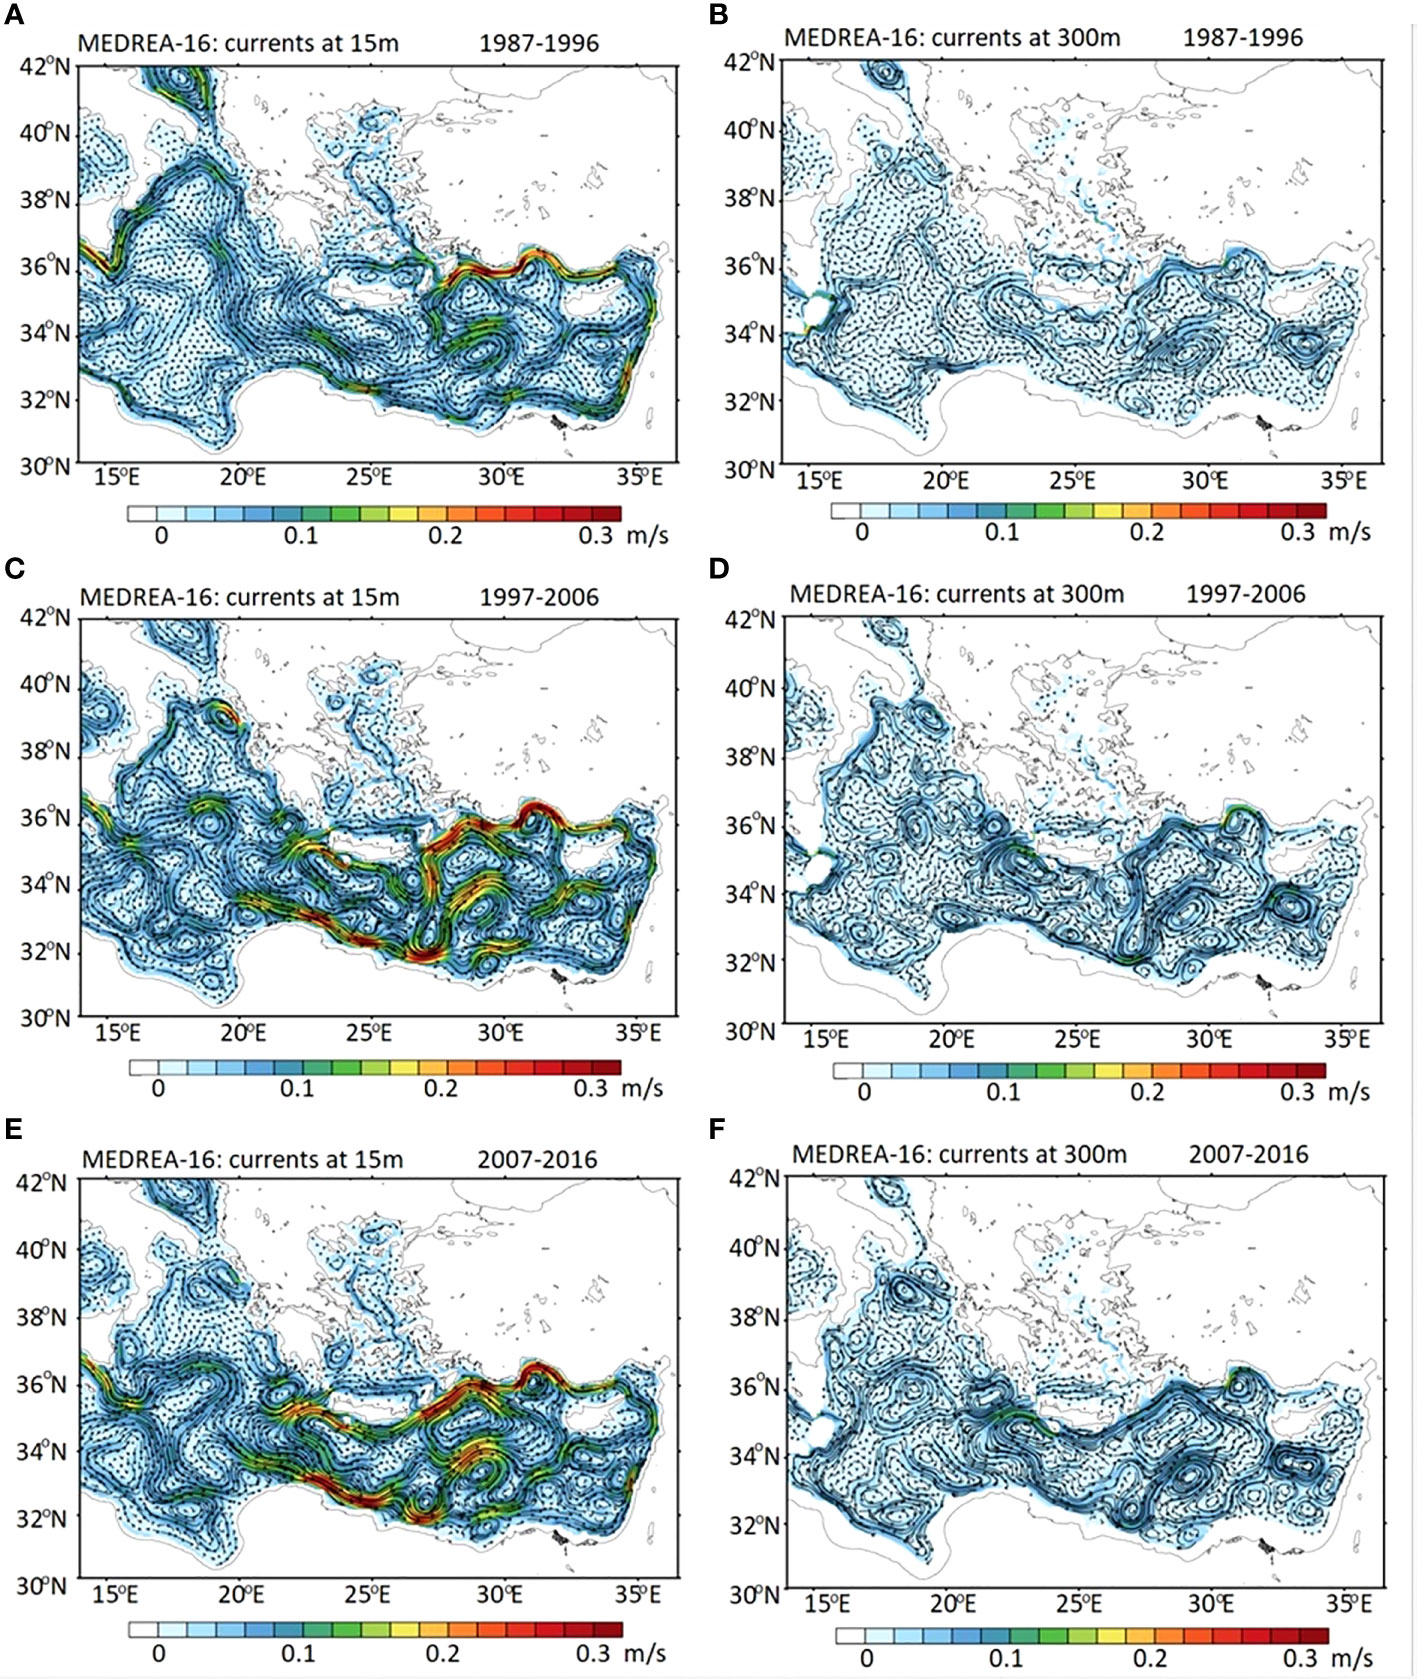
Figure 8 Surface decadal mean circulation in the Eastern Mediterranean from MEDREA16 reanalysis dataset (Simoncelli et al., 2014): (A) 1987-1996; (C) 1997-2006; (E) 2007-2016. Decadal mean circulation at intermediate depth of 300m: (B) 1987-1996; (D) 1997-2006; (F) 2007-2016.
Menna et al. (2012) described this dual pathway eastward flowing current system with the offshore branch attributed to the MMJ, as well as the two anticyclonic features corresponding to the Cyprus and Shikmona eddies based on the analysis of hundreds of surface drifter trajectories. Recent numerical simulations conducted by Estournel et al. (2021) confirm the dominance of the Cyprus Eddy in the Levantine basin along with the periodic establishment of the Shikmona Eddy. Similarly, the results of the downscaled, high resolution CYCOFOS simulations confirm the prominence of the Cyprus Eddy and the reappearance of the Shikmona eddy during the period 2013-2015.
3.1.3 The MAW and the MMJ
The analysis of the datasets obtained during the CYBO and HaiSec campaigns in the SE Levantine basin, particularly the salinity profiles gathered along the 33°E north-south cross sections, from Cyprus to Egypt (Figure 9), clearly reveal that the MAW is transported: a) eastward by a strong current flowing between the southern shelf of Cyprus and northern flank of the Cyprus Eddy, b) westward by a weaker flow along the southern flank of the Cyprus Eddy and c) eastward along the North African (Egyptian) shelf and slope. The CYBO and HaiSec in-situ data analysis regarding the pathway of the MAW confirms the POEM group’s (Robinson et al., 1992) and Pinardi et al. (2015) description of the MMJ as a cross basin offshore current, as well as Nielsen (1912) description of an eastward flow following the North African coast. This contradicts the pattern suggested by Millot and Taupier-Letage (2005) who used only SST satellite imagery to claim that the MMJ was absent and was therefore an artifact of the POEM data analysis methodology. Here satellite SST images were used to complement our understanding of the variability of the general flow dynamics of the Levantine region during the CYBO and HaiSec cruises. While it is possible to define the main near surface flow features through remote sensing IR images, it is not possible to elucidate the true pathways of the MAW without the simultaneous use of in-situ data. The main reason is that the MAW mostly appears as a subsurface salinity minimum in the SE Levantine basin and SSTs especially in summer are quite high and therefore mask the signal of the MMJ at the sea surface.
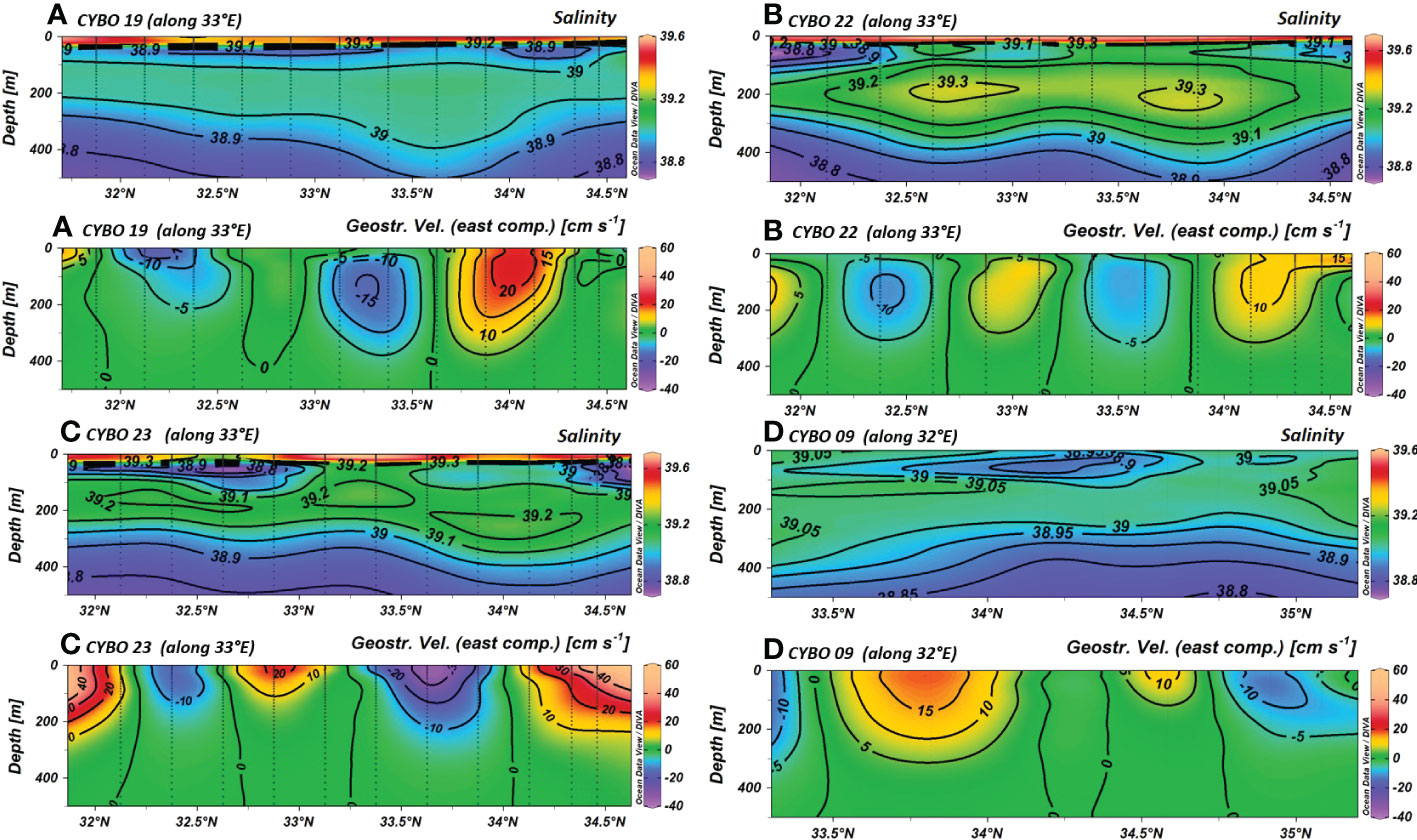
Figure 9 North-south cross sections along the 33°E meridian (see Figure 3) of salinity (top) and the eastward component of the geostrophic velocity (bottom) during: (A) CYBO 19 cruise (Sept 2005); (B) CYBO 22 cruise (Aug 2009); (C) CYBO 23 cruise (Aug 2010); (D) CYBO 9 cruise (May 2000). Positive geostrophic velocities indicate eastward flow, while negative velocities indicatewestward flow.
In the summer of 2001 following the first CYCLOPS cruise, below the surface and MAW layers the Cyprus Eddy contained a well-defined lens of saline LIW below 120 m with a salinity of 39.10-39.14 with the 39 isohaline deflected downward below 400 m (not shown). In contrast to this, the Shikmona Eddy contained a shallower, well-defined lens of lower salinity MAW with salinity of 38.85-38.90 extending down to 200 m. The latter suggests that after being transported eastward along the northern periphery of the Cyprus Eddy the MAW was then picked up by the Shikmona Eddy, which was more intense at the upper layers compared to the Cyprus Eddy. As noted above, the co-existence of these two anticyclones, was also observed during the CYBO 14 cruise in Aug 2002 (second panel in the middle row of Figure 5), after the second CYCLOPS experiment.
In summer 2005 during CYBO 19 cruise, the N-S salinity cross section between Cyprus and offshore Egypt shows the MAW transported eastward by the MMJ flowing close to Cyprus between the depths of 30-100 m (Figure 9A, upper panel) with salinity lower than 38.8. The eastward component of the geostrophic flow along the same section (Figure 9A, lower panel) shows the very pronounced MMJ flowing eastward along the northern flank of the Cyprus Eddy near 34°N, corresponding to the location of the core of MAW. In fact, eastward flow appears in general across most of the cross section except for two noticeable cores of westward flow, one is subsurface along the southern flank of the Cyprus Eddy near 33.3°N while the second is close to the surface offshore from Egypt near 32.2°N. These results confirm that during summer 2005 there was no significant eastward current offshore from Egypt. An additional shallower, thin, elongated patch of MAW was also found further south between 32.3°N and 33.5°N. The LIW occupies the depths between 100 to 250 m with salinity greater than 39.0, while in the core of the Cyprus eddy the higher salinity LIW appears as a salinity lens extending downward to 400 m. Comparison of these two sections indicates that some LIW is transported westward along the southern flank of the Cyprus Eddy although the lens of the highest salinity (S > 39.04) appears to be trapped in the core of the Cyprus Eddy. This is consistent with the results from Brenner (1993).
In the summers of 2009 and 2010, during the CYBO 22 (Figure 9B) and 23 (Figure 9C) cruises, the N-S cross sections between Cyprus and offshore Egypt show a similar salinity distribution of the MAW as observed during the summer of 2005 (Figure 9A) with two main patches of low salinity one in the north and one in the south. Furthermore, Figure 9B (summer 2009) demonstrates the classic concept that the main pathway of eastward flowing MAW follows the anticlockwise basin wide current along the shelf and slope of Egypt (North Africa). This is shown by the overlap of the most prominent patch of low salinity MAW, located south of 32°N, with the top layer of the eastward flowing jet. The second pathway of MAW appears near the northern end of the cross section where the low salinity lens overlaps with a strong MMJ. Figure 9C (summer 2010) also shows two main patches of MAW in the north and the south. However, the southern lens, centered near 32.7°N which is nearly 100 km north of the Egyptian coast appears to be trapped in the core of an offshore, anticyclonic eddy. In this case the main eastward flow of MAW is accomplished by the MMJ. These sections provide strong in-situ evidence regarding the important contributions of the MMJ and of the along shelf and slope North Africa current to transporting the MAW eastward, as was also found in results from numerical simulations (Pinardi et al., 2015; Section 3.1 in von Schuckmann et al., 2016; Zodiatis et al., 2018). They also show that the LIW layer typically contains several high salinity lenses, with values greater than 39.3 and 39.2 in 2009 (Figure 9B) and 2010 (Figure 9C), respectively. In summer 2009 the geostrophic velocity cross section (Figure 9B) suggests that two lenses of LIW are trapped in the cores of two anticyclonic eddies. The northern salinity lens can be attributed to the Cyprus Eddy while the southern salinity lens depression corresponds to an anticyclonic eddy offshore Egypt. In summer 2010 three lenses of LIW with salinity above 39.2 are present along the north-south cross section (Figure 9C). The northernmost lens, which is also the deepest, once again appears to be trapped in the core of the Cyprus Eddy as suggested by the geostrophic velocity cross section. In early spring 2000, during the CYBO 9 cruise (5-12/5/2000), the N-S transect along longitude 32°E, to the west of Cyprus (Figure 9D) crossed a very pronounced lens of MAW as well as the eastward pathway of the MMJ. The low salinity lens, with salinity between 38.85-38.95, extended from the surface down to a depth of 90 m and has a north to south extent of about 75 km. The MMJ coincided with the southern part of this low salinity lens.
From December 2009 to January 2010 data gathered during the MSM14-1 cruise shown in Figure 10 reveal a surface mixed layer in the vicinity of the Eratosthenes SM extending down to depths of 50-80 m, with temperatures between 19.0-19.2°C and salinity of 39.30-39.4. Below the mixed layer, a thin layer of lower salinity water was found, with salinity values across most of the section slightly less than 39.3. Usually during winter, the sub-surface salinity minimum, which is attributed to the MAW, is eroded by mixing with the higher salinity surface water. However, due to milder winter conditions that prevailed before and during this cruise and because of the higher temperature and salinity of the surface water layer during the summer of 2009 prior to the cruise, the winter mixing could not completely eliminate the MAW but instead left a relatively higher salinity remnant of the combined surface water and MAW. The LIW observed over the Eratosthenes SM appeared as a warm and saline lens centered at a depth of 250-300 m with salinity and temperature values over 39.36 and 17.15°C, respectively. The deepest depression of the isotherms and isohalines below this lens, which extended down to 450 m, appeared at the eastern periphery of the Eratosthenes SM. This structure is remarkably similar to the one found by Brenner (1993) twenty years earlier although in comparison, here the LIW was warmer and more saline by 0.5°C and 0.1, respectively. In fact, the observations presented by Brenner et al. (1991) and Brenner (1993) suggest that the water in the core of the Cyprus Eddy retains its temperature and salinity characteristics for a period of 2.5-3 years and then jumps abruptly to new values.
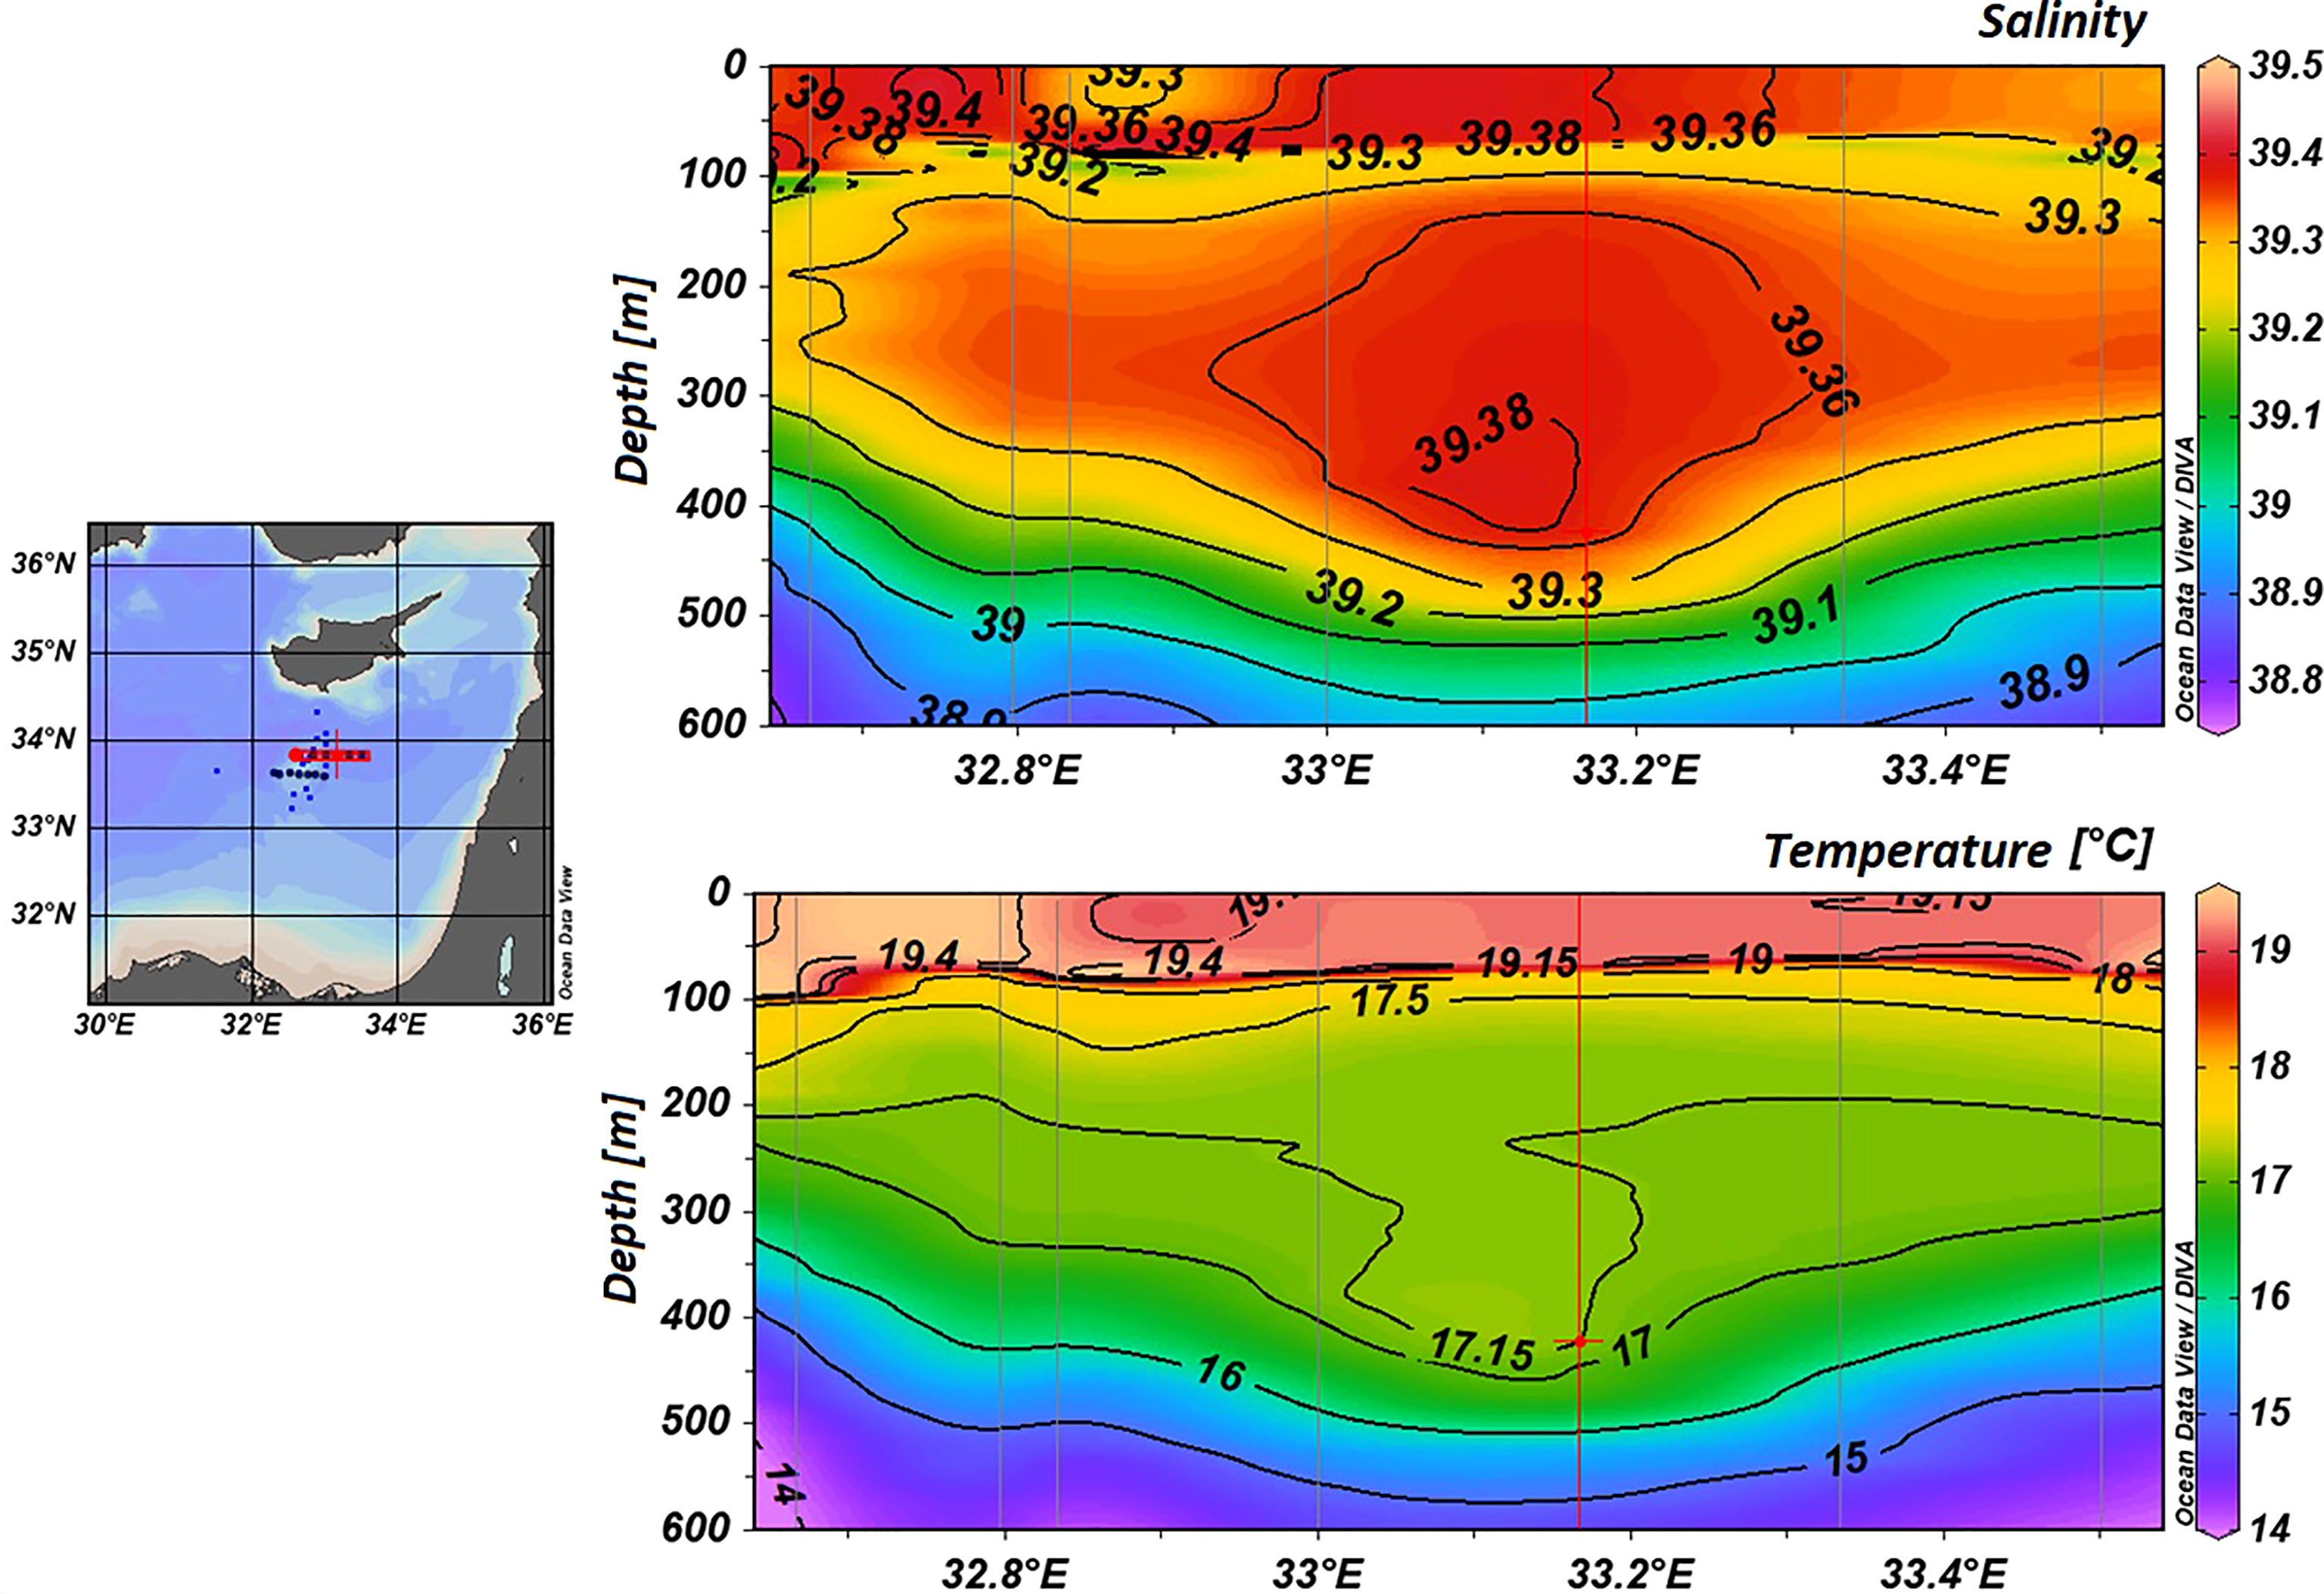
Figure 10 West-East salinity and temperature cross sections during the MSM 14-1 cruise, Dec 2009-Jan 2010, in the vicinity of the Eratosthenes SM.
In the deepest areas along the western boundary of the Eratosthenes SM, a clear signal of EMTW was found with increasing salinity and temperature below ~1100 dbar as shown in the salinity and temperature profiles in the two upper panels in Figure 11. The characteristic “tail” in the T/S curves (bottom right panel in Figure 11) pointing upward to the right from the transition point from EMDW between 1000-1100 m is also noticeable in the T/S diagram. It is similar to the one observed during the CYBO and HaiSec cruises in Figure 4. The temperature and salinity of the EMTW observed during MSM14-1 in early 2010 are consistent with the values observed during the CYBO-HaiSec 23 and 25 cruises which were conducted 8 months (Aug 2010) and two years (Dec 2012) later, respectively. The temperature and salinity values are also comparable to the EMTW observed during CYBO 13 (2001) and 14 (2002), except here the upper boundary of the EMTW was lifted to 1050 dbar on average, as compared to a depth of 1250 dbar on average, a decade earlier (compare to Figure 4).
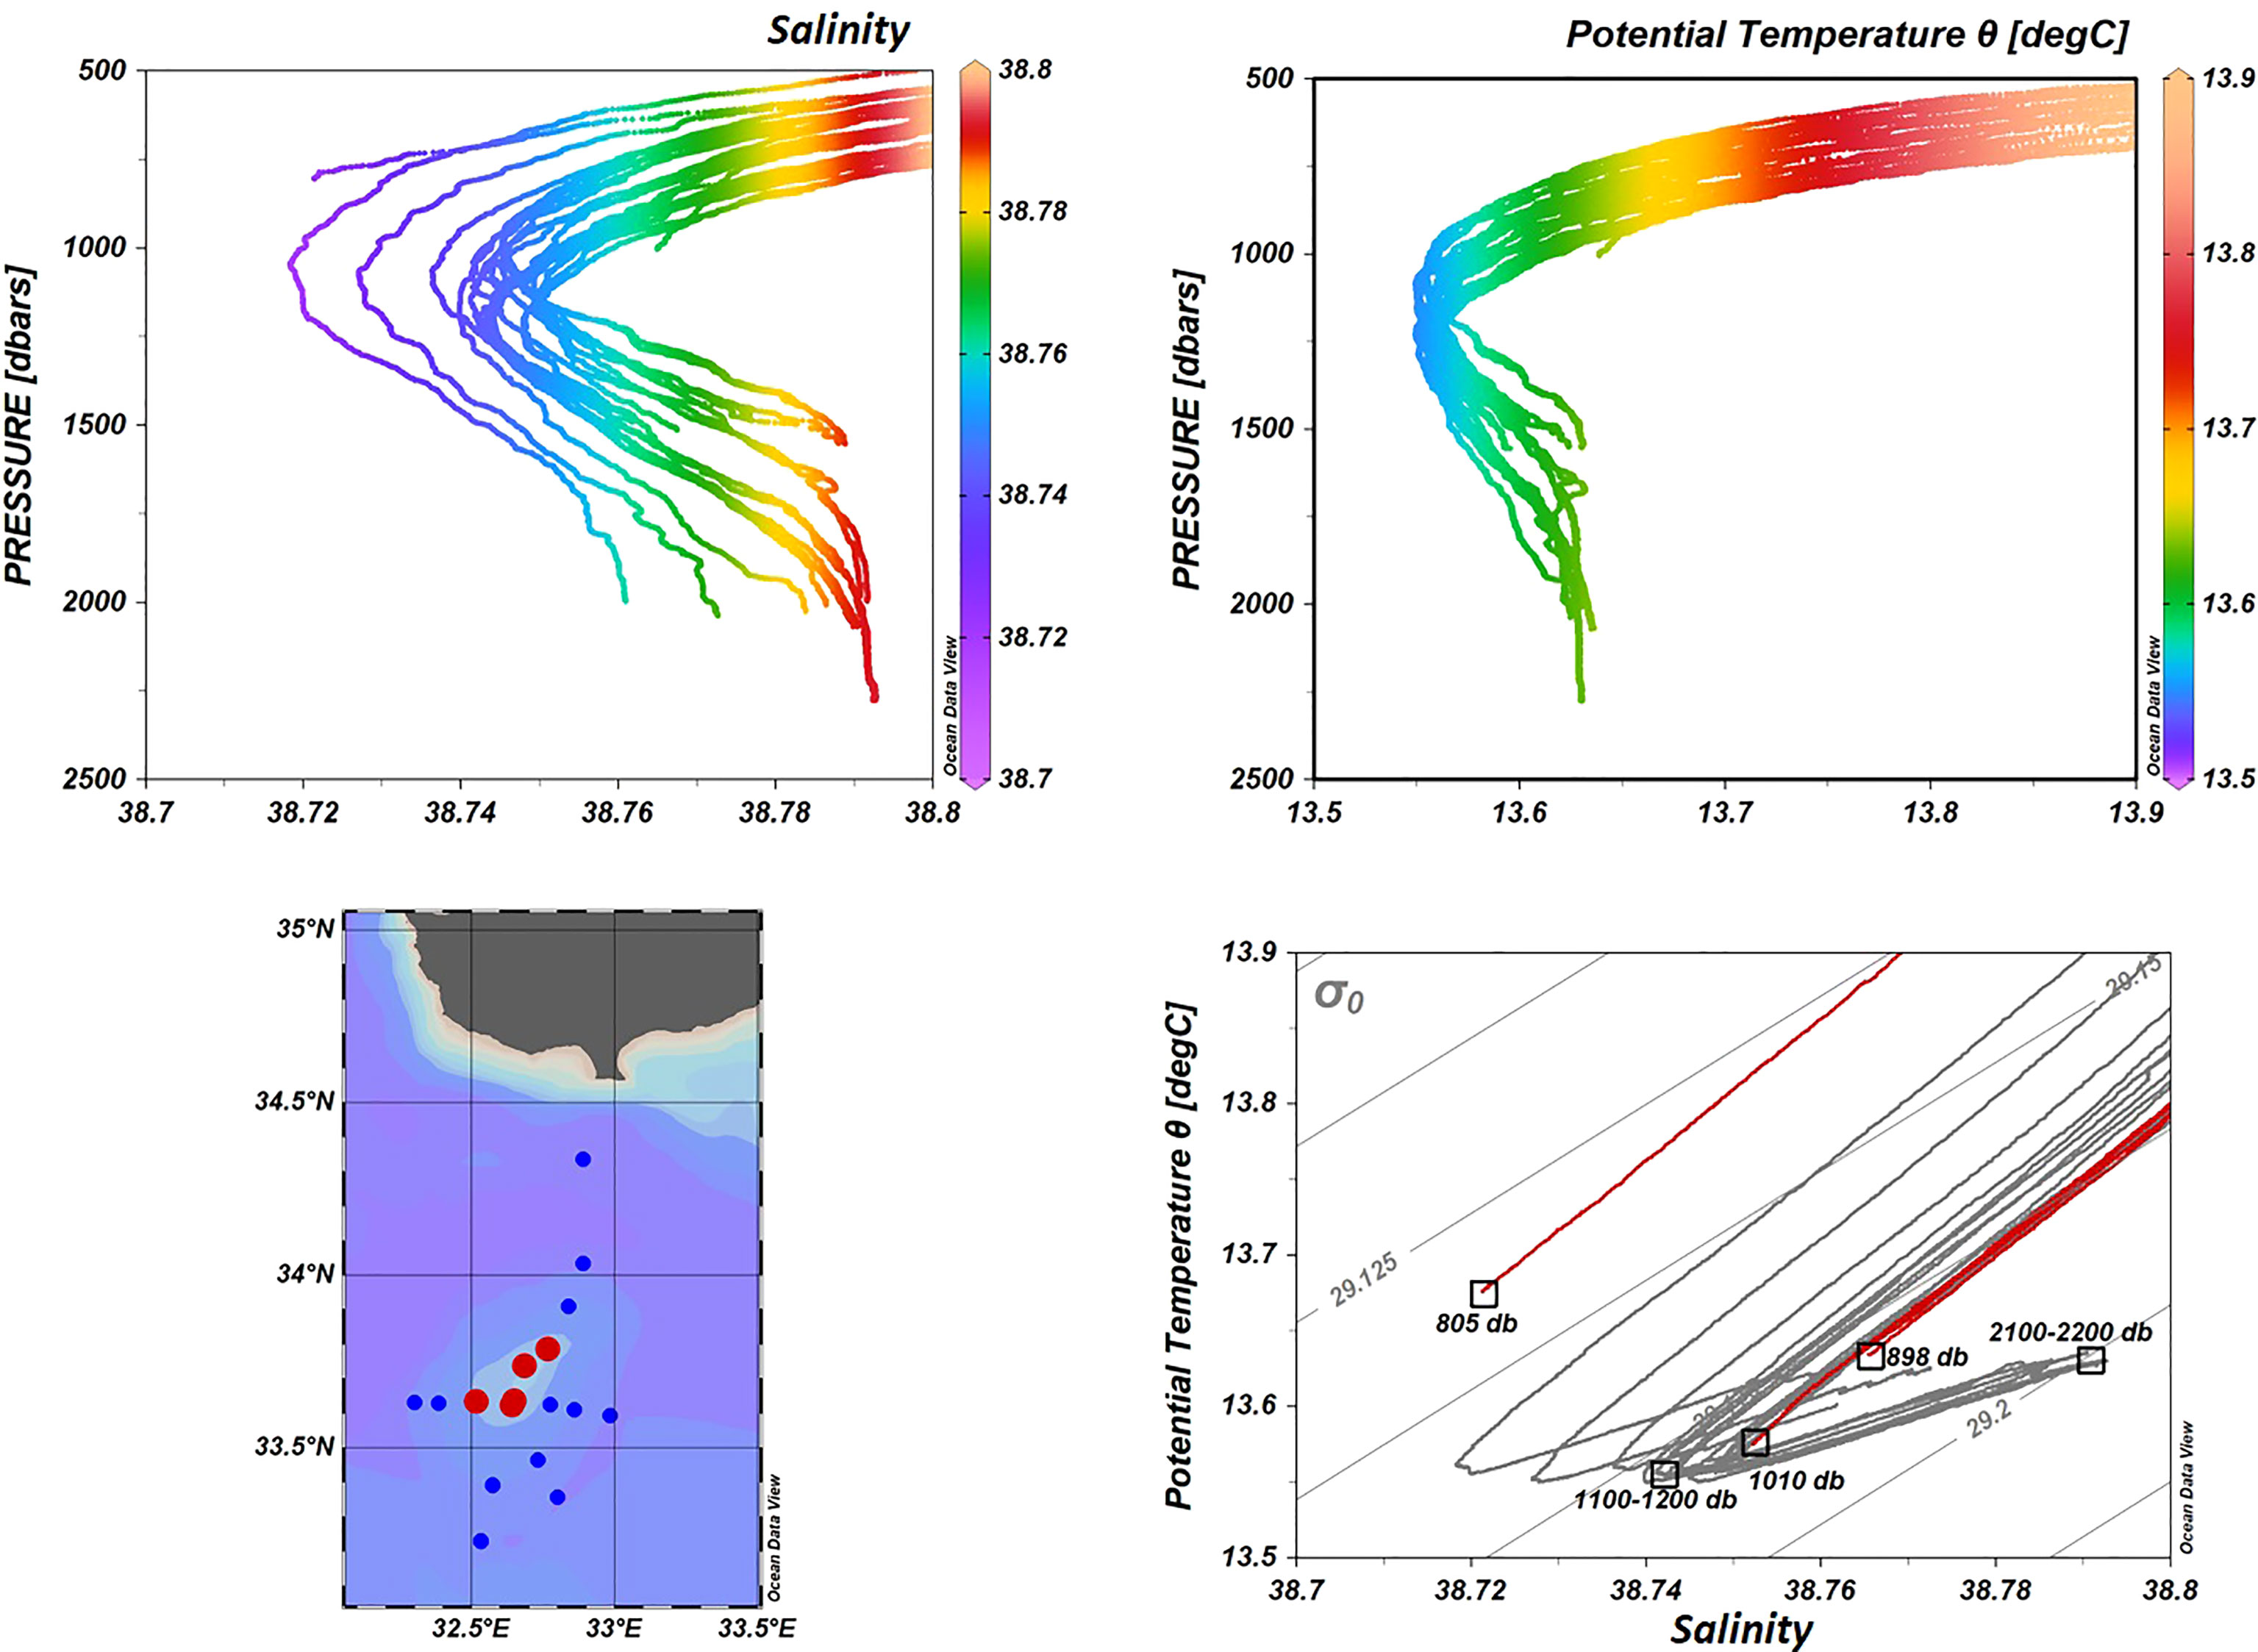
Figure 11 The EMTW salinity (upper left) and temperature (upper right) profiles and the T/S diagram (lower right) during the MSM14-1 cruise, Dec. 2009- Jan. 2010. Profiles and the T/S diagram include only stations sampled deeper than 1000 m where the bottom depth was about 2000 m. Red dots on the map and red lines on the T/S diagram represent the stations over the Eratosthenes SM where the bottom depth is shallower than 1000 m.
3.4 MFSPP bi-weekly and MFSTEP monthly XBT transects in the SE Levantine: Limassol - Port Said and Limassol-Alexandria
The analysis of the bi-weekly and monthly XBT data gathered along the transects from Limassol (Cyprus) to Port Said (Egypt) and Limassol to Alexandria (Egypt), shows a well stratified warm surface layer down to 40-60 m depth during autumn 1999 (Figure 12A) and in early summer 2000 (Figure 12C). The temperature of the surface water layer typically ranged from 27-28°C in September/October 1999 and decreased to 17-18°C in February-March 2000 (Figure 12B). A thermostad with temperature of 17-18°C centered near 33.5°N appears below the upper stratified layer. Below the thermostad the 15-17°C isotherms are noticeably depressed with the 15°C isotherm extending as deep as 400 m.
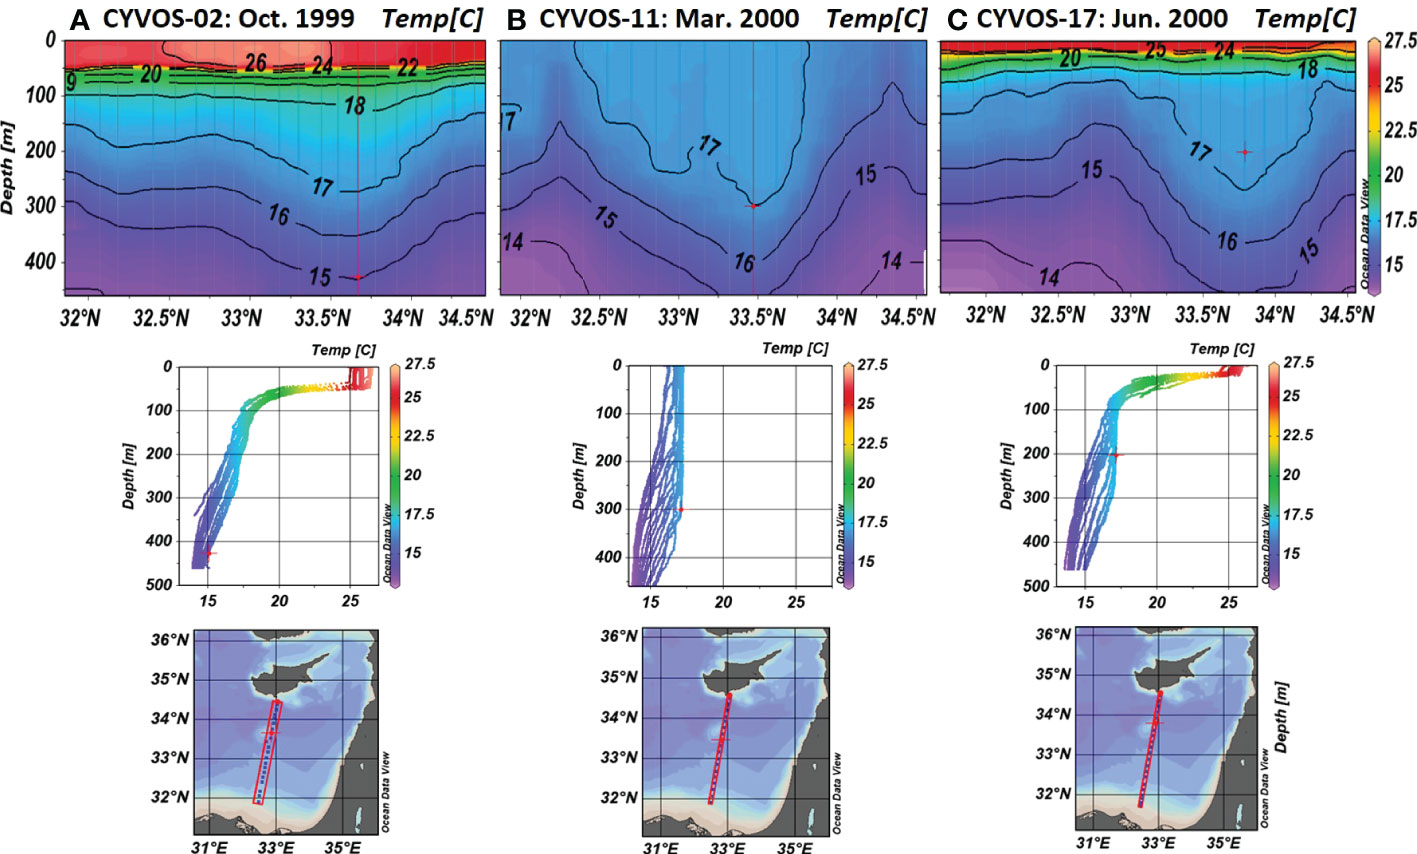
Figure 12 Temperature transects and composite profiles along the VOS transect from Limassol - Port Said: (A) Oct 1999 (CYVOS2); (B) Mar 2000 (CYVOS 11); (C) Jun 2000 (CYVOS17).
The surface cooling and the mixing in the winter of 1999-2000, led to a deepening of the mixed layer from 90 m down to 320 m from Sep 1999 to Mar 2000 (Figure 13A) in the center of the Cyprus Eddy. In Feb and Mar 2000 (Figure 13A) the water column was well mixed from surface down to at least 200 m with temperatures between 17-17.25°C. The deepest mixing, which most likely occurred near the center of the Cyprus Eddy is consistent with the deep mixing observed by Brenner et al. (1991) and Brenner (1993). The spring to early summer surface warming and restratification of the upper water column from Apr to Jun 2000 can be seen in Figure 13B. This deep mixing and restratification was observed at the eastern edge of the Eratosthenes SM. From Apr 2000 until the end of Jun 2000 surface heating led to the gradual re-establishment of the strong stratification of the upper layer, with temperatures as high as 25.5° C (Figure 13B). This led to the capping of the subsurface thermostad seen in Figure 12C.
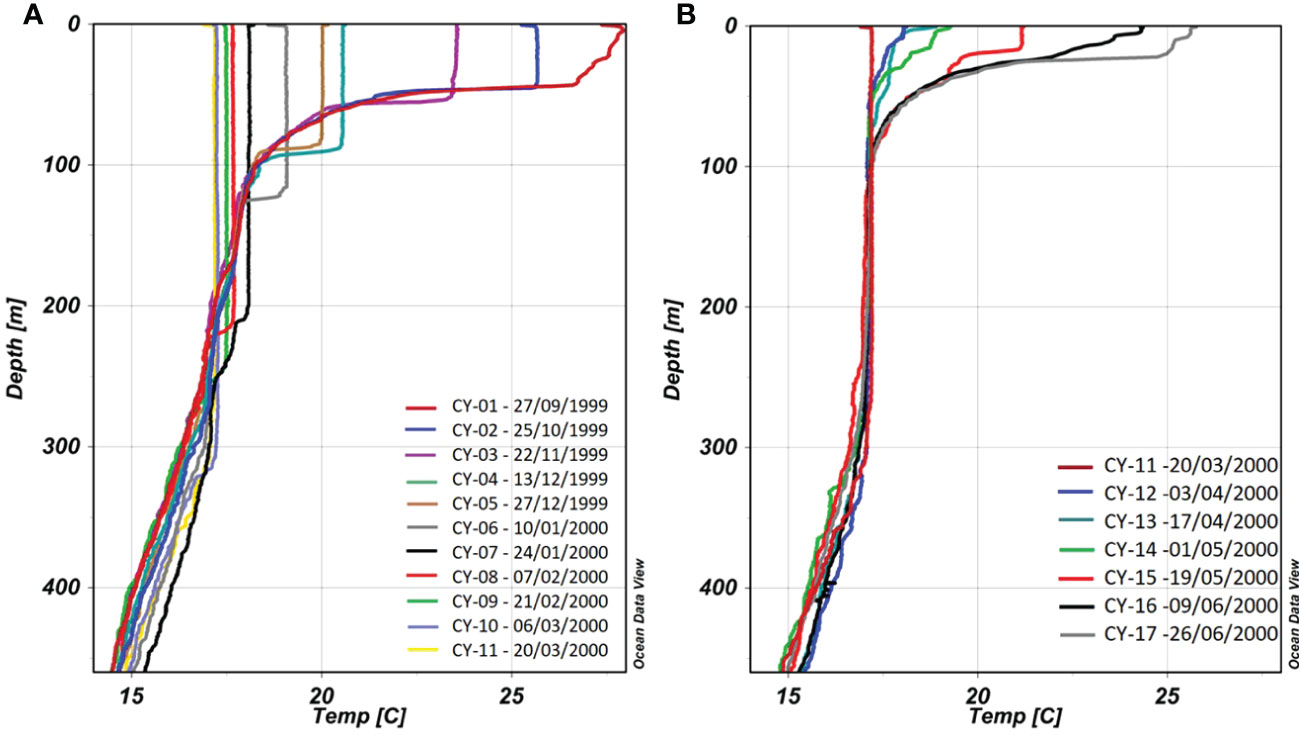
Figure 13 The bi-weekly evolution of the temperature profiles in the core of the Cyprus Eddy during the MFSPP project (Table 1B): (A) surface cooling erosion of the thermocline and deepening of the mixed from surface down to 320 m from Sep 1999 to Mar 2000; and (B) surface warming and restratification of the upper water column from Mar to June 2000.
The thermostad with a core temperature of 17-18°C appeared throughout the entire period of the XBT sampling along the eastern periphery of the Eratosthenes SM and is clearly associated with the core of the Cyprus Eddy. This is in agreement with the results of the CYCLOPS cruises and the CYBO cruises carried during late winter and in summer 2000. It is also consistent with results from the CYCOFOS (Zodiatis et al., 2018) and MFS (Pinardi et al., 2003) which assimilated XBT data from the Limassol-Port Said transect as well as the remotely sensed altimeter data from two satellites tracks in the same area. The CYBO in-situ data in winter and summer 2000 and the MFS (Pinardi et al., 2003) results during the periods of the Limassol-Port Said XBT transects, showed similar flow patterns in the broader area of the Eratosthenes SM. Both the in-situ data and numerical model results showed a well-established anticyclonic eddy with the eddy center coinciding with the subsurface thermostad for the period corresponding to the XBT transects.
The XBTs data provide strong evidence that the Cyprus Eddy as inferred from the isotherms, appears as a warm lens of water with a center that located between 33°- 33°30’N and 30°15’E. The data suggest that the core of the eddy also drifts north-south by about 30 km, although the location of the eddy center cannot be determined precisely from the north-south cross section alone. Moreover, during the MFSPP XBT transects it was found to be located as much as 55 km to the west of its position during the CYBO cruises between 1995-1999 and from the position reported by Brenner (1989); Brenner (1993) in late 1980s and in the early 1990’s.
The MFSTEP XBT transects conducted during May 2004 and between Jun-Oct 2005 (not shown) intersected the core of the Cyprus Eddy while in Sep and Oct 2004, Feb, Apr, and May 2005, the transects intersected the western periphery of the Cyprus Eddy due to an eastward drift of its center. Nevertheless, the temperature distribution clearly shown a relatively deep depression of the 15-17°C isotherms, which is attributed to the Cyprus Eddy. In Dec 2004 and Jan 2005, the XBT transect from Limassol to Alexandria did not cross the eddy, however winter mixing of the surface waters down to about 100 m was observed with temperatures as low as 18.5°C. The overall picture provided by the MFSTEP XBT transects suggests that between Sep 2004-May 2005 the core of the Cyprus Eddy appears to have drifted eastward and then reversed course from Jun-Oct 2005 when it drifted westward back to near its previous position, as observed in May 2004. This is based on the temporal changes in the shape of the thermostad along the two transect tracks.
4 Conclusions
The in-situ data gathered in the SE Levantine Basin from 1995 to 2015 during 34 hydrographic, synoptic campaigns (CYBO, CYCLOPS, MSM14, CYBO-HaiSec, HaiSec cruises) and 35 XBTs transects (MSFPP-VOS, MFSTEP-VOS), along with data provided by the sub-basin, downscaled numerical simulation from CYCOFOS nested in the CMEMS Med MFC (Clementi et al., 2021) for the period from 2013-2015, have all provided new insight on the dominant, coherent mesoscale circulation features of the south-eastern Levantine basin and on the main water mass characteristics, including their bi-weekly, monthly, seasonal and interannual variability.
These data have confirmed and enhanced the POEM group’s description of the mesoscale circulation, particularly regarding the anticyclonic Cyprus Eddy, the Shikmona Gyre and the pathway of the MMJ through this region. As in the historical data, the Cyprus Eddy is a persistent dynamical feature throughout these two decades of in-situ monitoring, located mainly east of the Eratosthenes SM. A recent modeling study has suggested that it is generated by the interaction of the MMJ and the complex topography in the vicinity of the SM. The occasional meandering and instability of the northward current flowing along the shelf and slope of Israel-Lebanon often initiates the growth of a secondary anticyclonic eddy, referred to as the Shikmona Eddy, after it detaches from the current and drifts offshore to the west. The intrusion of the less frequent Shikmona Eddy from the east may force the Cyprus Eddy to migrate westward from the Eratosthenes SM during periods when both eddies coexist. These extensive post POEM in-situ data sets provide incontrovertible evidence that the MMJ is indeed an offshore, cross basin current, which transports the MAW eastward from the Ionian Sea to the southwestern part of the Levantine. It continues its eastward path between the southern shelf and slope of Cyprus and the northern periphery of the Cyprus Eddy.
Occasional expansion of the Cyprus Eddy to the northwest can cause a diversion or bifurcation of the MMJ along the western shelf and slope of Cyprus. Consequently, the westward migration of the Cyprus Eddy affects the eastward transfer of MAW across the sub-basin. Analysis of the in-situ data gathered from numerous north-south transects from Cyprus to Egypt, confirms the co-existence of two eastward pathways for transporting MAW across the Levantine basin: (1) the MMJ flowing between the shelf and slope of Cyprus and the northern periphery of the Cyprus Eddy; and (2) the basin wide, anticlockwise current flowing eastward along the shelf and slope of Egypt, and then turning northward following the coasts of Israel and Lebanon. The periodic co-existence of the Cyprus and Shikmona eddies with a third eddy offshore from the shelf and slope of Egypt, combine to form the Shikmona Gyre, the multi-pole dynamical structure first observed by the POEM group in the late 1980s.
The spatial and temporal variability of the dominant flow features of the SE Levantine during these two decades of monitoring reveal four active periods with distinct patterns as summarized in Figure 14: a) the dominance of the Cyprus Eddy from 1996 to 1999 with the eddy located east of the Eratosthenes SM; b) the co-existence of two anticyclonic eddies from 2001 to 2007 with the Cyprus Eddy west of the Eratosthenes SM and the Shikmona Eddy far east of the seamount; c) the dominance of the Cyprus Eddy from 2009 to 2012, with its center once again located east of the seamount. From 2013-2015 (not shown in Figure 14) the Shikmona Eddy reappeared and so this was also a period of co-existence of both eddies. Figure 14D shows the schematic summary of all of the major circulation features that appeared during the entire twenty-year period from 1995-2015.
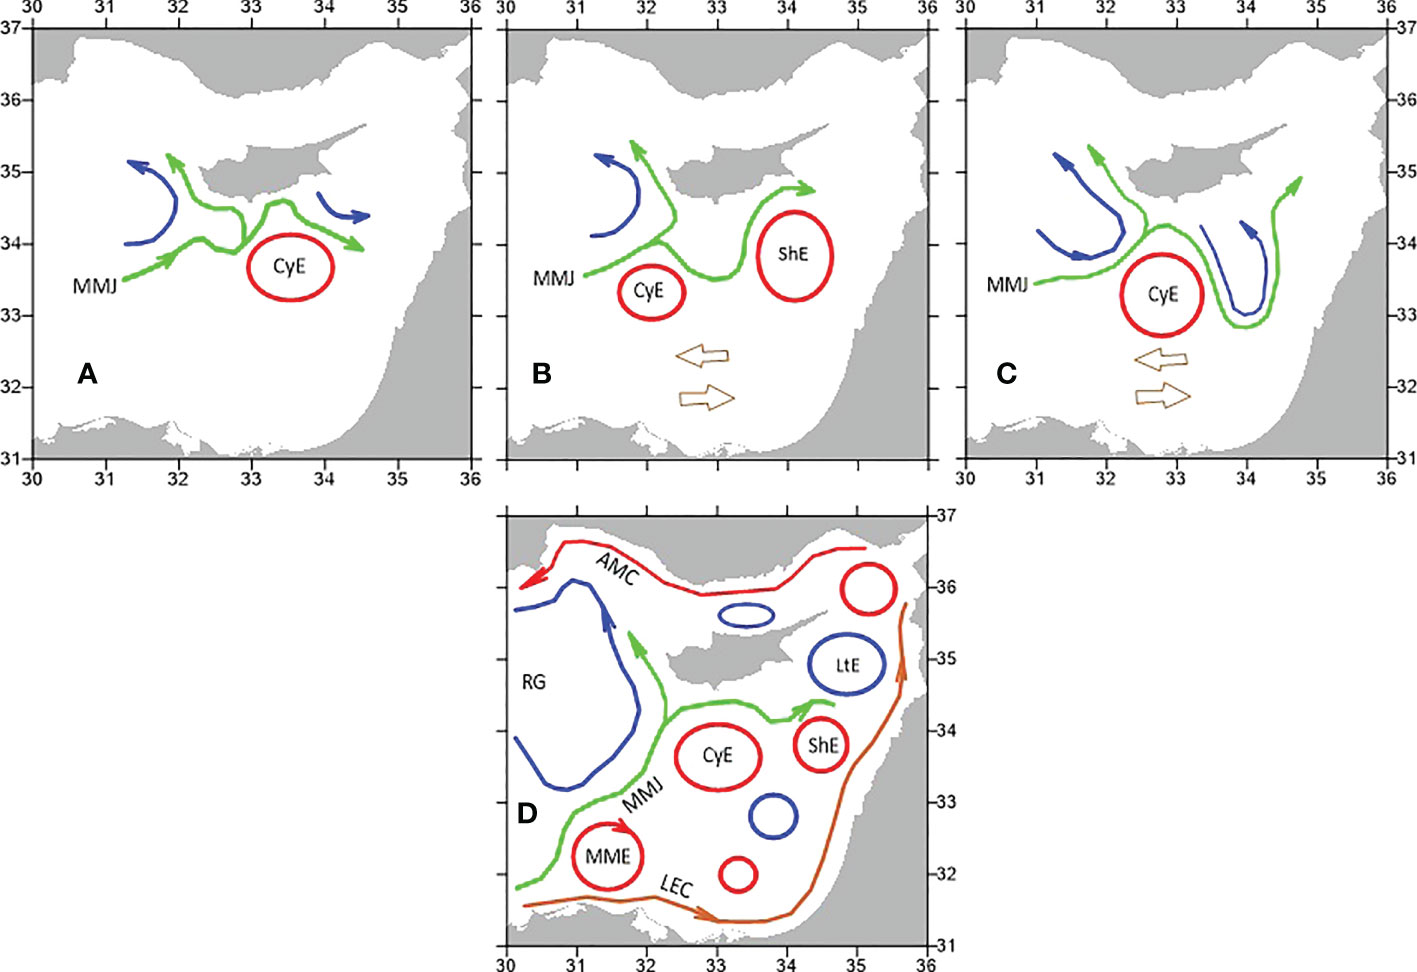
Figure 14 Schematic of the main flow features in the SE Levantine from 1995-2015 and the overall circulation based on in-situ data and downscaling numerical simulations. The three upper panels correspond to the three periods in Figure 5: (A) 1996-1999, (B) 2001-2007, and (C) 2009-2012 and the lower panel shows (D) summary of main features for the entire twenty year period. Anticyclonic eddies are shown in red (CyE, Cyprus Eddy; ShE, Shikmona Eddy; MME, Mersa Matruh Eddy), cyclonic eddies in blue (LtE, Lattakia Eddy; RG, Rhodes gyre), the MMJ in green, and the along the shelf-slope currents: LEC, Libyan-Egyptian Current in brown and AMC, Asia Minor Current in red.
The long-term trends in these datasets indicate summer warming and salinization of the water masses of the SE Levantine from the surface down to the upper boundary of the LIW. The bi-weekly XBTs transects passing through or near the center of the Cyprus Eddy provided a detailed chronological record of winter mixing and homogenization of the eddy center from surface down to 320 m depth. In addition, the deep profiles demonstrate that over time the upper boundary of the EMTW has been lifted on average from 1250 to 1050 m, while at water depths deeper than 2000 m the observed additional increase of the temperature and of the salinity is attributed to newest deep waters which intruded into the deep cavities of the SE Levantine in the vicinity the Eratosthenes SM.
Data availability statement
The datasets presented in this study can be found in online repositories. The names of the repository/repositories and accession number(s) can be found below:XBT data - https://cdi.seadatanet.org/search/welcome.php?query=2410&query_code={53081AD8-722D-4F4F-A8BC-18F0385F5336} CYBOdata - https://cdi.seadatanet.org/search/welcome.php?query=2409&query_code={C4AFECA2-B881-4336-AC17-761F797A09CE} HaiSec data - https://cdi.seadatanet.org/search/welcome.php?query=2408&query_code={30CC581C-1C48-4781-9D0C-DD4AA2315159}.
Author contributions
GZ: data collection, data processing, data management, data analysis, manuscript co-writing, manuscript editing. SB: data analysis, manuscript co-writing, manuscript editing. IG: data collection, data processing, data management, data analysis. TO: data collection, data processing. SSi: data processing, data management, data analysis, manuscript co- writing, manuscript editing. MI: data collection, data processing. SSa: data collection, data processing. All authors contributed to the article and approved the submitted version.
Acknowledgments
This study was carried out within the framework of the CYBO-Cyprus Basin Oceanography cruises, and the HaiSec-Haifa Section cruises conducted as part of Israel national monitoring of the SE Levantine. Data were provided through SeaDataNet Pan-European infrastructure for ocean and marine data management (http://www.seadatanet.org). Additional data were provided through the EU projects CYCLOPS (contract EVK3-CT-1999-00009), MFSPP (contract MAS3-CT98 0171) and MFSTEP (contract EVK3-2001-00174), and the MSM14-1 cruise. We thank the technicians and collaborators from the Department of Fisheries and Marine Research (DFMR), Oceanography Center, University of Cyprus, and from Israel Oceanographic and Limnological Research for their participation in the CYBO, HaiSec cruises and the MFSPP and MFSTEP VOS transects from Limassol to Port Said and from Limassol to Alexandria. We also extend our thanks to the Directors of the DFMR A. Demetropoulos, G. Gabrielides, G. Georgiou, L. Loizides and to the captains and crews of the R/V AEGAEO, R/V SHIKMONA and of the numerous multipurpose vessels of the EDT Towage and Salvage/EDT Offshore company and its Directors Eas Tsiakos and Darios Melas for their valuable support in carrying-out the CYBO, HaiSec, CYCLOPS cruises. Special thanks to B. Christiansen for leading the MSM14-1 cruise, to Nadia Pinardi for coordinating the MFSPP and MFSTEP projects, to Giuseppe Manzella for leading the Work package of the VOS-XBTs transects within the framework of the MFSPP and MFSTEP projects, to Michael Krom for coordinating the CYCLOPS project, to Dmitry Soloviev for his participation in the CYBO and MSM14-1 cruises and to the EU SeaDataNet, SeaDataCloud and EMODNET Ingestion, EMODNET Chemistry projects collaborators Elena Zhuk, Sissy Iona and Dick M.A. Schaap Alessandra Giorgetti and Michele Fichaut for their advice in implementing the quality control of the data gathered from the above cruises and VOS transects. Support for SB was provided by the Israel Ministry of Science and Technology (grant number 3-15502) and for IG by the Society for the Protection of Nature in Israel (Master plan for marine nature reserves in Israeli economic waters). Finally, we thank the two reviewers for their helpful and encouraging comments which have led to a significantly improved manuscript.
Conflict of interest
The authors declare that the research was conducted in the absence of any commercial or financial relationships that could be construed as a potential conflict of interest.
Publisher’s note
All claims expressed in this article are solely those of the authors and do not necessarily represent those of their affiliated organizations, or those of the publisher, the editors and the reviewers. Any product that may be evaluated in this article, or claim that may be made by its manufacturer, is not guaranteed or endorsed by the publisher.
References
Adani M., Dobricic S., Pinardi N.. (2011). Quality assessment of a 1985-2007 Mediterranean Sea reanalysis. J. Atmos. Ocean. Tech. 28, 569–589. doi: 10.1175/2010JTECHO798.1
Armi L., Hebert D., Oakey N., Price J., Richardson P. L., Rossby T., et al. (1988). The history and decay of a Mediterranean salt lens. Nature 333, 649–651. doi: 10.1038/333649a0
Armi L., Zenk W. (1984). Large Lenses of highly saline Mediterranean water. J. Phys. Oceanogr. 14, 1560–1576. doi: 10.1175/1520-0485(1984)014<1560:LLOHSM>2.0.CO;2
Barboni A., Lazar A., Stegner A., Moschos E. (2021). Lagrangian Eddy tracking reveals the Eratosthenes anticyclonic attractor in the eastern levantine basin. Ocean Sci. 17, 1231–1250. doi: 10.5194/os-17-1231-202
Brenner S. (1989). Structure and evolution of warm core eddies in the Eastern Mediterranean levantine basin. J. Geophys. Res. 94, 12593–12602. doi: 10.1029/JC094iC09p12593
Brenner S. (1993). Long term evolution and dynamics of a persistent warm core eddy in the Eastern Mediterranean Sea. Deep Sea Res. II 40, 1193–1201. doi: 10.1016/0967-0645(93)90067-W
Brenner S., Rozentraub Z., Bishop J., Krom M. (1991). The mixed layer/thermocline cycle of a persistent warm core eddy in the eastern Mediterranean. Dyn. Atmos. Oceans 15, 457–476. doi: 10.1016/0377-0265(91)90028-E
Christiansen B., Brand T., Christiansen H., Christiansen S., Denda A., Fischer A., et al. (2012). Structure and function of pelagic and benthic communities of the eastern Mediterranean in relation to physical drivers and bottom topography, MARIA s. MERIAN cruise No.14, leg 1 (Hamburg: Institut für Meereskunde der Universität Hamburg).
Clementi E., Aydogdu A., Goglio A. C., Pistoia J., Escudier R., Drudi M., et al. (2021). Mediterranean Sea Physical Analysis and Forecast (CMEMS MED-Currents, EAS6 system) (Version 1) [Data set] (Copernicus Monitoring Environment Marine Service (CMEMS)). doi: 10.25423/CMCC/MEDSEA_ANALYSISFORECAST_PHY_006_013_EAS6
Egorova V. M., Zyryanov V. N., Sokolovskiy M. A. (2022). The hydrodynamic theory of the Cyprus eddy. Ocean Dynam. 72, 1–20. doi: 10.1007/s10236-021-01484-7
Estournel C., Marsaleix P., Ulses C. (2021). A new assessment of the circulation of Atlantic and intermediate waters in the Eastern Mediterranean. Prog. Oceanogr. 198, 102673. doi: 10.1016/j.pocean.2021.102673
Fusco G., Manzella G. M. R., Cruzado A., Gaĉic M., Gasparini G. P., Kovaĉevi· V., et al. (2003). Variability of mesoscale features in the Mediterranean Sea fromXBT data analysis. Ann. Geophys. 21, 21–32. doi: 10.5194/angeo-21-21-2003
Gačić M., Borzelli G. L. E., Civitarese G., Cardin V., Yari S. (2010). Can internal processes sustain reversals of the ocean upper circulation? the Ionian Sea example. Geophys. Res. Lett. 37, L09608. doi: 10.1029/2010GL043216
Gačić M., Civitarese G., Eusebi Borzelli G. L., Kovačević V., Poulain P.-M., Theocharis A., et al. (2011). On the relationship between the decadal oscillations of the northern Ionian Sea and the salinity distributions in the Eastern Mediterranean. J. Geophys. Res. 116, C12002. doi: 10.1029/2011JC007280
García-Lafuente J., Sammartino S., Huertas I. E., Flecha S., Sánchez-Leal R. F., Naranjo C., et al. (2021). Hotter and weaker Mediterranean outflow as a response to basin-wide alterations. Front. Mar. Sci. 8. doi: 10.3389/fmars.2021.613444
Genin A., Lazar B., Brenner S. (1995). Vertical mixing and coral death in the red Sea following the eruption of mount pinatubo. Nature 377, 507–510. doi: 10.1038/377507a0
Gertman I., Goldman R., Rosentraub Z., Ozer I., Zodiatis G., Hayes D., et al. (2010a). Generation of shikmona anticyclonic eddy from an alongshore current. Rapp. Commun. Int. Mer Medit. (CIESM Congress Proceedings) 39, 114.
Gertman I., Herut B., Kress N. (2010b). Assessment of post transient changes in levantine basin deep waters. Rapp. Commun. Int. Mer Medit. (CIESM Congress Proceedings) 39, 113.
Gertman I., Pinardi N., Popov Y., Hecht A. (2006). Aegean Sea Water masses during the early stages of the Eastern Mediterranean climatic transient (1988-90). J. Phys. Oceanogr. 36, 1841–1859. doi: 10.1175/JPO2940.1
Gertman I., Zodiatis G., Murashkovsky A., Hayes D., Brenner S. (2007). Determination of the location of southeastern levantine anticyclonic eddies from CTD data. Rapp. Commun. Int. Mer Medit. 38, 151.
Gertman I., Zodiatis G., Ozer T., Goldman R., Herut B. (2016). Renewal of deep water in vicinity of the eastern levantine slope. Rapp. Commun. Int. Mer Medit. (CIESM Congress Proceedings) 41, 124. abstract code 4405C.
Groom S., Herut B., Brenner S., Zodiatis G., Psara S., Kress N., et al. (2005). Satellite-derived spatial and temporal biological variability in the Cyprus eddy. Deep Sea Res. II 52, 2990–3010. doi: 10.1016/j.dsr2.2005.08.019
Hayes D. R., Dobricic S., Gildor H., Matsikaris A. (2019). Operational assimilation of glider temperature and salinity for an improved description of the Cyprus eddy. Deep Sea Res. II 164, 41–53. doi: 10.1016/j.dsr2.2019.05.015
Hayes D. R., Hannides A., Georgiou G., Testor P., Gildor H., Zodiatis G. (2014). Description of the long-lived subsurface mesoscale eddy south of cyprus. 6th EGO meeting and final symposium of the COST action ES0904 (Kiel, Germany: EGO).
Hayes D. R., Zodiatis G., Konnaris G., Hannides A., Solovyov D., Testor P. (2011). Glider transects in the levantine Sea: Characteristics of the warm core Cyprus eddy. Spain: OCEANS 2011 IEEE. 1–9. doi: 10.1109/Oceans-Spain.2011.6003393
Hecht A., Gertman I. (2001). Physical features of the eastern Mediterranean resulting from the integration of POEM data with Russian Mediterranean cruises. Deep-Sea Res. I 48, 1847–1876. doi: 10.1016/S0967-0637(00)00113-8
Hecht A., Robinson A., Pinardi N. (1988). Currents, water masses, eddies, and jets in the Mediterranean levantine basin. J. Phys. Oceanogr. 18, 1320–1353. doi: 10.1175/1520-0485(1988)018<1320:CWMEAJ>2.0.CO;2
Karlin L. N., Kluikov Y. Y., Kutko B. P. (1988). The microscale structure of the hydrophysical fields at the upper layer of the ocean. Gidrometeoizdat: Leningrad, 162. pp
Klein B., Roether W., Manca B. B., Bregant D., Beitzel V., Kovacevic V, et al. (1999). The large deep water transient in the Eastern Mediterranean. Deep Sea Res. I 46, 371–414. doi: 10.1016/S0967-0637(98)00075-2
Krom M. D., Brenner S., Kress N., Neori A., Gordon L. I. (1992). Nutrient dynamics and new production in a warm-core eddy from the Eastern Mediterranean Sea. Deep Sea Res. 39, 467–480. doi: 10.1016/0198-0149(92)90083-6
Krom M. D., Thingstad T. F., Carbo P., Drakopoulos P., Fileman T. W., Flaten G. A. F., et al. (2005). Overview of the CYCLOPS p addition Lagrangian experiment in the Eastern Mediterranean. Deep Sea Res. II 52, 3090–3108. doi: 10.1016/j.dsr2.2005.08.018
Lascaratos A., Roether W., Nittis K., Klein B. (1999). Recent changes in deep water formation and spreading in the Mediterranean Sea: A review. Progr. Oceanogr. 44, 5–36. doi: 10.1016/S0079-6611(99)00019-1
Malanotte-Rizzoli P., Manca B. B., Marullo S., Ribera d’Alcala M., Roether W., Theocharis A., et al. (2003). The Levantine Intermediate Water Experiment (LIWEX) Group: Levantine basin—A laboratory for multiple water mass formation processes. J. Geophys. Res. 108 (C9), 8101–3108. doi: 10.1029/2002JC001643
Malanotte-Rizzoli P., Manca B. B., Riberad’Alcala M., Theocharis A., Brenner S., Budillon G., et al. (1999). The Eastern Mediterranean in the 80s and in the 90s: the big transition in the intermediate and deep circulations. Dyn. Atmos. Oceans 29, 365–395. doi: 10.1016/S0377-0265(99)00011-1
Manzella G. M. R., Reseghetti F., Coppini G., Borghini M., Cruzado A., Galli C., et al. (2007). The improvements of the ships of opportunity program in MFS-TEP. Ocean Sci. 3, 245–258. doi: 10.5194/os-3-245-2007
Manzella G. M. R., Scoccimarro E., Pinardi N., Tonani M. (2003). Improved near real time data management procedures for the Mediterranean ocean forecasting system – voluntary observing ship program”. Ann. Geophys. 21, 49–62. doi: 10.5194/angeo-21-49-2003
McDowell S. E., Rossby H. T. (1978). A mesoscale lens of Mediterranean water off the Bahamas. Science 202, 1085–1087. doi: 10.1126/science.202.4372.1085
Menna M., Gačić M., Martellucci R., Notarstefano G., Fedele G., Mauri E., et al. (2022). Climatic, decadal, and interannual variability in the upper layer of the Mediterranean Sea using remotely sensed and in-situ data. Remote Sens. 14 (6), 1322. doi: 10.3390/rs14061322
Menna M., Gerin R., Notarstefano G., Mauri E., Bussani A., Pacciaroni M., et al. (2021). On the circulation and thermohaline properties of the Eastern Mediterranean Sea. Front. Mar. Sci. 8. doi: 10.3389/fmars.2021.671469
Menna M., Poulain P. M., Zodiatis G., Gertman I. (2012). On the surface circulation of the levantine sub-basin derived from Lagrangian drifters and satellite altimetry data. Deep Sea Res. I 65, 46–58. doi: 10.1016/j.dsr.2012.02.008
Millot C., Taupier-Letage I. (2005). Circulation in the Mediterranean Sea. In: Saliot A. eds. The Mediterranean Sea. Handbook of Environmental Chemistry (Berlin, Heidelberg: Springer) 5K, 29–66. doi: 10.1007/b107143
Nielsen J. N. (1912). Hydrography of the Mediterranean and adjacent water. report of Danish oceanographical expedition 1908-1910. Copenhagen: Andr. Fred. Host & Son, 72–191.
Ovchinnikov I. M., Plakhin A., Moskalenko L. V., Neglyad K. V., Osadchiy A. S., Fedoseyev A. F., et al. (1976). Hydrology of the Mediterranean Sea. Gidrometeoizdat, Leningrad. 375.
Ozer T., Gertman I., Gildor H., Goldman R., Herut B. (2020). Evidence for recent thermohaline variability and processes in the deep water of the southeastern levantine basin, Mediterranean Sea. Deep Sea Res. II 171, 104651. doi: 10.1016/j.dsr2.2019.104651
Ozer T., Gertman I., Kress N., Silverman J., Herut B. (2017). Interannual thermohaline, (1979–2014) and nutrient, (2002–2014) dynamics in the levantine surface and intermediate water masses, SE Mediterranean Sea. Glob. Planet. Change 151, 60–67. doi: 10.1016/j.gloplacha.2016.04.001
Ozsoy E., Hecht A., Unluata U., Brenner S., Oguz T., Bishop J., et al. (1991). A review of the levantine basin circulation and its variability during 1985-1988, dyn. Atmos. Oceans 15, 421–456. doi: 10.1016/0377-0265(91)90027-D
Pinardi N., Allen I., De Mey P., Korres G., Lascaratos A., Le Traon P. Y., et al. (2003). The Mediterranean ocean forecasting system: first phase of implementation, (1998-2001). Ann. Geophys. 21, 3–20. doi: 10.5194/angeo-21-3-2003
Pinardi N., Coppini G. (2010). Preface” operational oceanography in the Mediterranean Sea: the second stage of development”. Ocean Sci. 6 (1), 263–267. doi: 10.5194/os-6-263-2010
Pinardi N., Zavatarelli M., Adani M., Coppini G., Fratianni C., Oddo P., et al. (2015). Mediterranean Sea Large-scale low-frequency ocean variability and water mass formation rates from 1987 to 2007: A retrospective analysis. Progr. Oceanogr. 132, 318–332. doi: 10.1016/j.pocean.2013.11.003
Robinson A. R., Golnaraghi M. (1993). Circulation and dynamics of the Eastern Mediterranean sea; quasi-synoptic data-driven simulations. Deep Sea Res. 40 (6), 1207–1246. doi: 10.1016/0967-0645(93)90068-X
Robinson A. R., Golnaraghi M., Leslie W. G., Artegiani A., Hecht A., Lazzoni E., et al. (1991). The eastern Mediterranean general circulation: features, structure and variability. Dyn. Atmos. Oceans 15, 215–240. doi: 10.1016/0377-0265(91)90021-7
Robinson A. R., Malanotte-Rizzoli P., Hecht A., Michelato A., Roether W., Theocharis A., et al. (1992). General circulation of the Eastern Mediterranean. Earth Sci. Rev. 32, 285–309. doi: 10.1016/0012-8252(92)90002-B
Roether W., Manca B. B., Klein B., Bregant D., Georgopoulos D., Beitzel V., et al. (1996). Recent changes in eastern Mediterranean deep waters. Science 271 (5247), 333–335. doi: 10.1126/science.271.5247.333
Rosentraub Z., Brenner S. (2007). Circulation over the southeastern continental shelf and slope of the Mediterranean Sea: Direct current measurements, winds, and numerical model simulations. J. Geophys. Res. 112, C11001. doi: 10.1029/2006JC003775
Schlitzer R. (2002). Interactive analysis and visualization of geoscience data with ocean data view. Comput. Geosci. 28 (10), 1211e1218. doi: 10.1016/S0098-3004(02)00040-7
Schroeder K., Chiggiato J. (2022). Oceanography of the Mediterranean Sea, An Introductory Guide. 1st Edition (Elsevier), 561.
Schroeder K., Chiggiato J., Josey S. A., Borghini M., Aracri S., Sparnocchia S.. (2017). Rapid response to climate change in a marginal sea. Sci. Rep. 7, 4065. doi: 10.1038/s41598-017-04455-5
Schroeder K., Garcìa-Lafuente J., Josey S. A., Artale V., Nardelli B. B., Carrillo A., et al. (2012). “Circulation of the Mediterranean Sea and its variability,” in Climate of the Mediterranean region. Ed. Lionello P. (Amsterdam: Elsevier), 590, ISBN: ISBN: 978-0-12-416042-2. doi: 10.1016/B978-0-12-416042-2.00003-3
Scory S., Simoncelli S., Coatanoan C., Bäck Ö., Iona S., Myroshnychenko V. (2018). Data quality: why it is so important? the experience of the regional products managers and recommendations. SeaDataCloud training workshop (20-27 June 2018) (Belgium: Ostend). Available at: https://www.seadatanet.org/content/download/3251/file/SDC_WP3_TRaining1%20_Importance_Quality_Control.pdf.
Simoncelli S., Fratianni C., Pinardi N., Grandi A., Drudi M., Oddo P., et al. (2014). Mediterranean Sea physical reanalysis (MEDREA) (Version 1) [Data set] (Copernicus Monitoring Environment Marine Service (CMEMS)). doi: 10.25423/MEDSEA_REANALYSIS_PHYS_006_004.
Simoncelli S., Masina S., Axell L., Liu Y., Salon S., Cossarini G., et al. (2016) MyOcean regional reanalyses: overview of reanalyses sys- tems and main results. Mercator ocean j. 54. special issue on main outcomes of the MyOcean2 and MyOcean follow-on projects. Available at: https://www.mercator-ocean.eu/wp-content/uploads/2017/04/Mercator-Ocean-newsletter-2015_54.pdf.
Simoncelli S., Pinardi P., Fratianni C., Dubois C., Notarstefano G. (2018). Water mass formation processes in the Mediterranean Sea over the past 30 years. in Copernicus marine service ocean state report, issue 2. Ed. von Schuckmann K., et al. doi: 10.1080/1755876X.2018.1489208
Theocharis A., Nittis K., Kontoyiannis H., Papageorgiou E., Balopoulos E. (1999). Climatic changes in the Aegean Sea influence the Eastern Mediterranean thermohaline circulation. Geophys. Res. Lett. 26, 1617–1620. doi: 10.1029/1999GL900320
Thingstad T. F., Krom M. D., Mantoura R. F. C., Flaten G. A. F., Groom S., Herut B., et al. (2005). Nature of phosphorous limitation in the ultra oligotrophic Eastern Mediterranean. Science 309, 1068–1071. doi: 10.1126/science.1112632
Troupin C., Machín F., Ouberdous M., Sirjacobs D., Barth A., Beckers J.-M. (2010). High-resolution climatology of the north-East Atlantic using data-interpolating variational analysis (Diva). J. Geophys. Res. 115, C08005. doi: 10.1029/2009JC005512
von Schuckmann K., La Traon P.-Y., Alvarez-Fanjul E., Axell L., Balmaseda M., Breivik L.-A., et al. (2016). The Copernicus marine environment monitoring service ocean state report. J. Operational Oceanogr. 9, s235–s320. doi: 10.1080/1755876X.2016.1273446
Zodiatis G., Drakopoulos P., Brenner S., Groom S. (2005a). Variability of the Cyprus warm core eddy during the CYCLOPS project. Deep Sea Res. II 52, 2897–2910. doi: 10.1016/j.dsr2.2005.08.020
Zodiatis G., Drakopoulos P., Gertman I. (2004). Modified Atlantic water in the SE levantine basin, (1995-2003). Rapp. Commun. Int. Mer Medit. 37, 156.
Zodiatis G., Drakopoulos P., Gertman I., Brenner S., Hayes D. (2005b). The Atlantic water mesoscale hydrodynamics in the Levantine basin, CIESM, 2005. Strategies for understanding mesoscale processes. Monaco: CIESM Workshop Monographs n°27, 132. Monaco. Available at: https://www.ciesm.org/online/monographs/Villefranche.html.
Zodiatis G., Galanis G., Nikolaidis A., Radhakrishnan H., Emmanouil G., Nikolaidis G., et al. (2018). “Downscaling the Copernicus CMEMS med-MFC in the Eastern Mediterranean: The new CYCOFOS forecasting systems at regional and sub-regional scales, in Operational Oceanography serving Sustainable Marine Development,” in Proceedings of the Eight EuroGOOS International Conference, Bergen, Norway, 3-5 October 2017, Buch E., Fernández V., Eparkhina D., Gorringe P., Nolan G. Eds. Brussels, Belgium: EuroGOOS. 516
Zodiatis G., Gertman I., Hayes D., Brenner S. (2007). The Atlantic water in the levantine basin, (1995-2006). Rapp.Comm. Int. Mer Medit. 38, 215.
Zodiatis G., Gertman I., Poulain P.-M., Menna M., Sofianos S. (2016). Two decades of monitoring and forecasting of the circulation in the levantine, (1995-2016). Rapp. Commun. Int. Mer Medit. 41, 79.
Zodiatis G., Hayes D., Gertman I., Poulain P.-M., Menna M. (2013). The flow features of the SE levantine- long term in-situ monitoring 1995-2012. Rapp. Commun. Int. Mer Medit. 40, 141.
Zodiatis G., Theodorou A., Demetropoulos A. (1998). Hydrography and circulation south of Cyprus in late summer 1995 and in spring 1996. Oceanol. Acta 21 (3), 447–458. doi: 10.1016/S0399-1784(98)80029-7
Keywords: Levantine basin, mesoscale circulation, anticyclonic eddies, mid Mediterranean jet, modified Atlantic water, Eastern Mediterranean Transient Water
Citation: Zodiatis G, Brenner S, Gertman I, Ozer T, Simoncelli S, Ioannou M and Savva S (2023) Twenty years of in-situ monitoring in the south-eastern Mediterranean Levantine basin: Basic elements of the thermohaline structure and of the mesoscale circulation during 1995-2015. Front. Mar. Sci. 9:1074504. doi: 10.3389/fmars.2022.1074504
Received: 19 October 2022; Accepted: 29 December 2022;
Published: 19 January 2023.
Edited by:
Achilleas G. Samaras, Democritus University of Thrace, GreeceReviewed by:
Gianmaria Sannino, Energy and Sustainable Economic Development (ENEA), ItalyUrmas Lips, Tallinn University of Technology, Estonia
Copyright © 2023 Zodiatis, Brenner, Gertman, Ozer, Simoncelli, Ioannou and Savva. This is an open-access article distributed under the terms of the Creative Commons Attribution License (CC BY). The use, distribution or reproduction in other forums is permitted, provided the original author(s) and the copyright owner(s) are credited and that the original publication in this journal is cited, in accordance with accepted academic practice. No use, distribution or reproduction is permitted which does not comply with these terms.
*Correspondence: George Zodiatis, b2NlYW5vc2dlb3NAZ21haWwuY29t