 Wanying He1,2,3†
 Minxiao Wang3,4,5†
 Mengna Li3,4,5
 Zhaoshan Zhong4,5
 Hao Chen4,5
 Shichuan Xi1,2Zhendong Luan1,2,3
 Chaolun Li6*Xin Zhang1,2,3*
- 1Chinese Academy of Sciences Key Laboratory of Marine Geology and Environment and Center of Deep Sea Research, Institute of Oceanology, Chinese Academy of Sciences (CAS), Qingdao, China
- 2Laboratory for Marine Geology, Pilot Laboratory for Marine Science and Technology, Qingdao, China
- 3University of Chinese Academy of Sciences, Beijing, China
- 4Chinese Academy of Sciences (CAS) Key Laboratory of Marine Ecology and Environmental Sciences and Center of Deep Sea Research, Institute of Oceanology, Chinese Academy of Sciences (CAS), Qingdao, China
- 5Laboratory for Marine Ecology and Environmental Science, Qingdao National Laboratory for Marine Science and Technology, Qingdao, China
- 6South China Sea Institute of Oceanology, Chinese Academy of Sciences (CAS), Guangzhou, China
Confocal Raman microscopy (CRM) is a powerful tool for biological research, which can provide information regarding the composition and distribution of biomolecules in an in situ, label-free, non-destructive manner and with high spatial resolution. Sample preservation is often an unavoidable step, especially for symbiotic deep-sea samples. Moreover, protocols for the preservation of samples for CRM have not been established and specific effects of different preservation methods on biomolecules have not been studied for relevant samples. In this study, we used deep-sea mussel Gigantidas platifrons, an ideal model in the study of deep-sea symbiosis and investigated the effect of four common preservation methods on the results of CRM imaging and signals. The methods included snap-freeze (SF), SF followed by rapid fixation in methanol (SF-MeOH), 2.5% glutaraldehyde and 2% paraformaldehyde fixation (SF-GP), and 4% paraformaldehyde and alcohol fixation (PS-PA). The results of this study indicate that SF was the most effective method for the comprehensive analysis of the biomolecular composition although the sectioning success rate was relatively low. Moreover, SF-MeOH was found to be effective when SF is not sufficient in obtaining good morphology in sections, or when the effect of chemical bonding on the composition of biomolecules upon SF-MeOH can be neglected. Finally, SF-GP and PS-PA were found to be the most effective methods considering the overall morphological observation. However, they were less suitable for metabolic studies. We believe our results can provide guidance for further studies of Raman on symbiotic deep-sea biological samples. It is of great importance for the wide application of Raman technique.
Introduction
Raman techniques reflect chemical bond vibrations using inelastic light scattering (Gomes Da Costa et al., 2019). It is a promising analytical technique in biology (Clemens et al., 2014; Kallepitis et al., 2017), chemistry (Wetzel and LeVine, 1999), physics (Moerner and Orrit, 1999), materials (Chen et al., 2012), and geology (Dodd et al., 2017). In biological research, it has been used for the identification and detection of microorganisms (Clemens et al., 2014; Pahlow et al., 2015; Stöcke et al., 2016; Lorenz et al., 2017), metabolites within living cells (Du et al., 2020), and different types of cancer (Clemens et al., 2014). It is particularly important for biological research because it allows rapid, in situ, label-free, and non-destructive acquisition of information related to the composition and distribution of biomolecules. In addition, Raman analysis usually does not require extensive sample preparation or is not hindered by interference from water molecules. Among Raman techniques, confocal Raman microscopy (CRM) has a higher spatial resolution; thus, it can be combined with imaging and quantitative analysis to determine the composition of biomolecules. Moreover, it can be used to study the complex metabolic processes in cells in a spatiotemporal manner (Clemens et al., 2014; Butler et al., 2016; Kallepitis et al., 2017; Lazarevic et al., 2019; Høgset et al., 2020). These advantages have led to a growing interest in exploring CRM’s potential for application in biologically relevant fields (Clemens et al., 2014; Gomes Da Costa et al., 2019; Lazarevic et al., 2019).
Sample preservation is critical for spectroscopy-based analysis. For example, without chemical fixation, exposure of bone tissues to room temperature affects the carbonate-to-phosphate ratio owing to natural degradation (Fiedler et al., 2018). Although Raman spectroscopy can be conducted to directly analyze fresh tissues or cells (Fiedler et al., 2018), preservation is unavoidable in most cases. Some samples need to be transported over long distances and preserved for long periods of time. In order to accurately analyze the structural and biomolecular composition of such samples (e.g., tissues or cells) and to mimic their original state in vivo, sample preservation is critical (Mariani et al., 2009; Butler et al., 2016). Sample preservation includes non-chemical preservation (e.g., direct snap-freezing) and chemical fixation methods (Mariani et al., 2009). In unfixed frozen sections, tissue or cell components can be analyzed closest to their in situ state; however, the sections are fragile and may undergo degradation (Butler et al., 2016). On the other hand, chemical preservation methods make it easier to obtain sections from tissues. However, although various chemical fixation methods are available, contamination from the fixative may lead to the degradation or loss of components of certain cells, preventing the accurate analysis through Raman techniques (Lyng et al., 2011; Galli et al., 2014). Therefore, the selection of the appropriate sample preservation method based on experimental needs is critical to the interpretation of spectroscopic and imaging results (Mariani et al., 2009; Meade et al., 2010; Kuzmin et al., 2014).
The effect of the sample preservation method on the Raman signal has been explored, and it was found that each method has its advantages and disadvantages because of different fixation mechanisms (Mariani et al., 2009; Meade et al., 2010; Kuzmin et al., 2014). At present, some conventional organisms have been extensively researched, because of their easy access and simple composition; also, the samples can be preserved and processed in a more effective way, allowing their direct analysis through CRM (Høgset et al., 2020). However, in several symbiotic deep-sea organisms, wherein the intracellular mechanisms remain unclear, several problems are encountered, such as difficulty in sampling and preservation, presence special structures in tissues or cells, high complexity of tissues, and low light transmission (Wang et al., 2021). Since different preservation methods have different effects on cell morphology and biomolecular content (i.e., nucleic acids, lipids, and proteins (Kuzmin et al., 2014)), the resulting compositional and morphological changes are likely to vary depending on the organism sample or cell type (Mariani et al., 2009; Meade et al., 2010). A systematic comparison of sample processing methods for symbiotic deep-sea organism samples is lacking. To promote research, further exploration of sample preservation methods is necessary before proceeding with CRM to resolve metabolic mechanisms.
To this end, we selected deep-sea mussel Gigantidas platifrons (G. platifrons), the dominant species functioning as secondary producers with a large number of symbionts dwelling inside their gills, as the object of our study (Dubilier et al., 2008; Xu et al., 2019). Since the sharing of the metabolites among the symbionts and hosts extend the ecological niches of both sides greatly (Sun et al., 2017; Wang et al., 2021), it is of great value to study the distribution pattern of the key metabolites. The findings will undoubtedly increase our understanding how deep-sea life thrives in these extreme environments and the cycling of elements such as carbon and sulfur (Childress et al., 1986; Petersen et al., 2011; Laming et al., 2018). However, the gill is fragile with variable morphology, complex metabolic composition, and complex intra- and intercellular interactions that hinder further studies of its cellular function (Wang et al., 2021). This organism requires preservation and sectioning before Raman spectroscopy owing to the soft texture of gills and impossible on-site analysis. Different preservation methods may have different effects on the composition and morphology of the tissues, which in turn may mislead us to make wrong judgments (Clemens et al., 2014; Fiedler et al., 2018). Therefore, we need to evaluate different preservation methods before embarking on the relevant research regarding its composition and the distribution of its biomolecules (Geier et al., 2020), in order to select the appropriate method for the subsequent focus of attention.
Herein, we explored four commonly used preservation methods for CRM: snap freeze, snap freeze followed by rapid fixation in methanol, 2.5% glutaraldehyde and 2% paraformaldehyde fixation, and 4% paraformaldehyde and alcohol fixation. We then analyzed the effect of the Raman assay results on different regions of the gill preserved using different methods after sectioning, to show whether CRM is sensitive enough to detect these changes. The results of this study can facilitate the improvement in the performance of Raman techniques used for relevant samples and the pretreatment of other biological methods.
Materials and methods
Sample collection
The deep-sea mussels (G. platifrons) were collected during the “Kexue” cruise in 2021 from the cold seeps of the South China Sea (119°17′08.297″E; 22°06′55.435″N, temperature: 3.57°C, salinity: 34.65 psu). The samples were brought to the deck using a thermal-preserve sampler carried by a remotely operated vehicle (ROV), and rapidly dissected for further processing.
Preservation treatment of samples
We compared samples obtained by four common preservation methods. For the samples obtained by first method, SF, paper was used to absorb the liquid around the gill block to prevent the formation of ice crystals. A metal beaker was then filled with isopentane and placed in liquid nitrogen. Next, the tissue block was placed in the metal beaker by using forceps to completely submerge the tissue in isopentane until it was completely frozen. This step increases the rate of freezing and restricts ice crystal formation. The snap-frozen gill was then placed in a −80°C freezer for long-term storage. For slicing, the gill was broken into small pieces and placed directly into a pre-chilled optimal cutting temperature compound (OCT) embedding agent for frozen sectioning, with a section thickness of 10 μm (Leica CM1950). The second samples obtained by method, SF-MeOH, follows the same steps as those involved in SF till the sectioning process. For sectioning in SF-MeOH, the sections were fixed in methanol for 10 min, washed three times with 0.01 M phosphate-buffered saline (1 × PBS), and then placed in a pre-chilled OCT embedding agent for frozen sectioning (thickness: 10 μm). For the third samples obtained by method (SF-GP), the dissected gills were directly transferred to a pre-cooled paraformaldehyde-glutaraldehyde (2%/2.5%) fixative, fixed at 4°C for 24 h, and placed in a fresh fixative. The slicing operation was the same as that conducted in SF. For the fourth samples obtained by method (PS-PA), the dissected gills were stored in a 4% paraformaldehyde fixative (PFA) for 24 h, rinsed twice with 1 × PBS, and stored in 75% ethanol at 4°C. The samples were dehydrated in different gradients of ethanol (70%, 80%, 95%, and 100%) for 1 h, and placed in xylene for 2 h. After transparency, the samples were embedded in paraffin wax at 60°C for 3 h. The embedded samples were sectioned using a Leica microtome (Leica RM 2016) to achieve a thickness of 7 μm. The samples were dewaxed with xylene before use and then rehydrated with different gradients of ethanol (100%, 95%, 80%, and 70%) before use.
Spectral acquisition
Parts of the gill were selected for Raman spectral acquisition using a confocal Raman microspectrometer (alpha 300R, WITec, Ulm, Germany) equipped with a laser operating at 532 nm and a 600 grooves/mm grating (UHTS 300). The sample was placed on a calcium fluoride substrate, and the excitation laser was focused onto the sample for spectral acquisition using a ZEISS EC Epiplan (Carl ZEISS, Jena, Germany) with 50×/0.75 objectives. Before use, systematic calibration was performed using the characteristic peak of the silicon wafer at 520 cm-1. The step size, total acquisition time, and laser power of the data set acquired by each method were optimized to obtain the best results. The laser power was 15–20 mW for one point in the X- and Y-axis directions of 310–670 nm.
Processing of Raman spectra
For preprocessing the raw data, baseline correction and cosmic ray removal were performed using WITec Project plus, followed by principal component analysis (PCA) to improve the signal-to-noise ratio in order to retain the necessary signal. The tissue was then partitioned for imaging using clustering analysis to further obtain characteristic spectrum of the tissue. The spectra were fitted with a Gaussian using the GRAMS/AI software, and the model peak positions were chosen based on the values of the relevant material peak positions reported by different authors. A range of positions for each Raman peak was restricted for the fit, and the peak positions were fine-tuned on the basis of the fit. The result with the smallest sum of squared deviations between the curve fitting model and the experimental data was considered to obtain the relevant information such as peak position, peak intensity, peak width, and peak area.
Results and discussion
The pipeline for CRM analysis in gills
We have established a pipeline to show the metabolic distribution feature of key metabolites of the gills of the symbiotic deep-sea mussels. A well-preserved SF sample was selected for the metabolic profile constructions. It has been demonstrated that SF is closest to the in situ state in terms of component composition because it has not been disturbed by immobilizers (Lyng et al., 2011; Butler et al., 2016). We performed classification imaging of the Raman dataset by multivariate analysis and found that the resulting image could be classified into four major categories: the nucleic acid enrichment region, protein enrichment region, phospholipid enrichment region, and the lysosome (Figure 1A). By analyzing the characteristic spectra of each region, the peak for the red nucleic acid region was found at 1,063 cm-1 which can be attributed to DNA (Okotrub et al., 2015), suggesting the existence of the nucleus. The peak at 1,261 cm-1 was the cyan protein enrichment region and is assigned to =C-H bending (protein) (Chan et al., 2006), indicating the presence of the cytoplasm containing symbionts. Moreover, a peak 1,270 cm-1 indicated the blue phospholipid enrichment region, and can be attributed to the presence of typical phospholipids (Malini et al., 2006; Kochan et al., 2013), representing the basal membrane (Figure 1B). Lastly, the characteristic peak of 780 cm-1 for the yellow region is likely ascribed to the presence of phosphatidylinositol (Xu et al., 2020), which can be used as a lipid signaling molecule for the lysosome (Hohman et al., 1982). This imaging distribution is consistent with conventional methods observed in the published literature (Ponnudurai et al., 2017; Sun et al., 2017; Wang et al., 2021). Therefore, we chose SF samples as standards to analyze the effects of different preservation methods on subsequent Raman studies and biological studies.
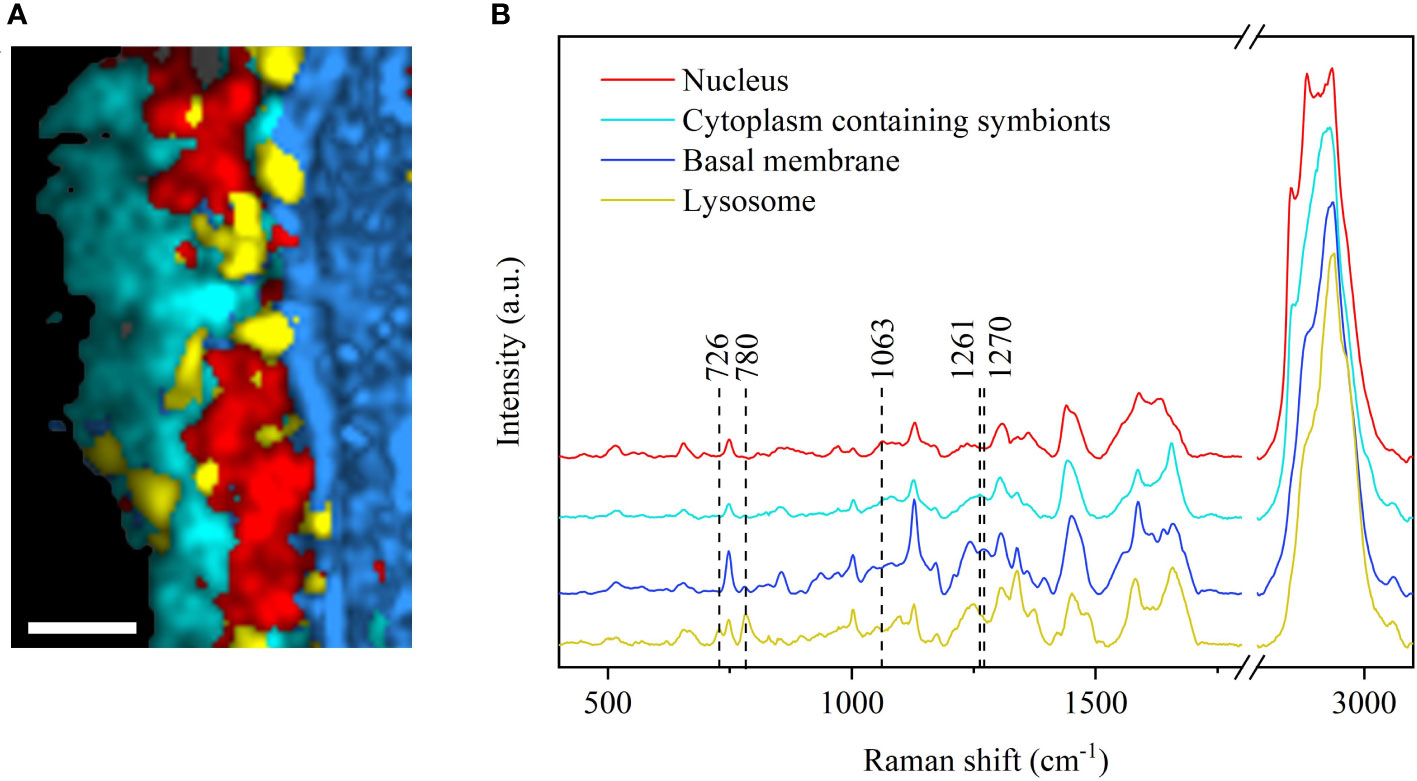
Figure 1 CRM imaging analysis of G. platifrons gills following the CS preservation method. (A) Raman imaging of gills showing the distribution of cellular components, including the nucleus (red), cytoplasm containing symbionts (cyan), basal membrane (blue), and lysosome (yellow). Scale bars: 8 µm. The bright field corresponding to Raman imaging images were shown in Supplementary Figure S1. (B) Average Raman spectrum of the nucleus, cytoplasm containing symbionts, basal membrane, and lysosome.
Effects of different methods on the morphology and biomolecular distribution of gills
Using the same spectral processing method, we found that the spectral datasets obtained by all four methods could allow the visualization of the three major classes of the nucleus, cytoplasm containing symbionts, and basal membrane after imaging analysis (Figures 1A and 2). However, cells at SF during sectioning are very prone to extensive fragmentation, leaving only the basal membrane, or adhering together indistinguishably, requiring many sections for local selection detection (Supplementary Figure S2). The basal membrane detected upon SF was found to be significantly thicker than that through other methods via CRM imaging (Figure 1A); this thickness is probably due to being unfixed, resulting in scraping during sectioning, which may have an impact on the biomolecular distribution of the biomolecules. The overall morphology acquired upon SF-MeOH is more prominent than that upon SF, allowing the clearer distinction of the boundary of the gill cells and facilitating significantly less fragmentation (Supplementary Figure S2). Slight internal breakage was found after imaging of the selected areas (Figure 2), probably due to the rapid fixation of methanol, which maintained the overall morphology of the gill cells but did not provide good maintenance of the cell interior. SF-GP and PS-PA allowed the efficient maintenance of the overall morphology of the gill cells after sectioning due to prolonged fixation, and the degree of fragmentation was very low (Figure 2). However, prolonged immobilization upon SF-GP and PS-PA changed the intensity of the Raman signals of some substances, such as that of phosphatidylinositol (780 cm-1), restricting the Raman imaging of some important organelles such as lysosomes (Figure 2). Moreover, prolonged immobilization resulted in poor preservation of the organelle structures.
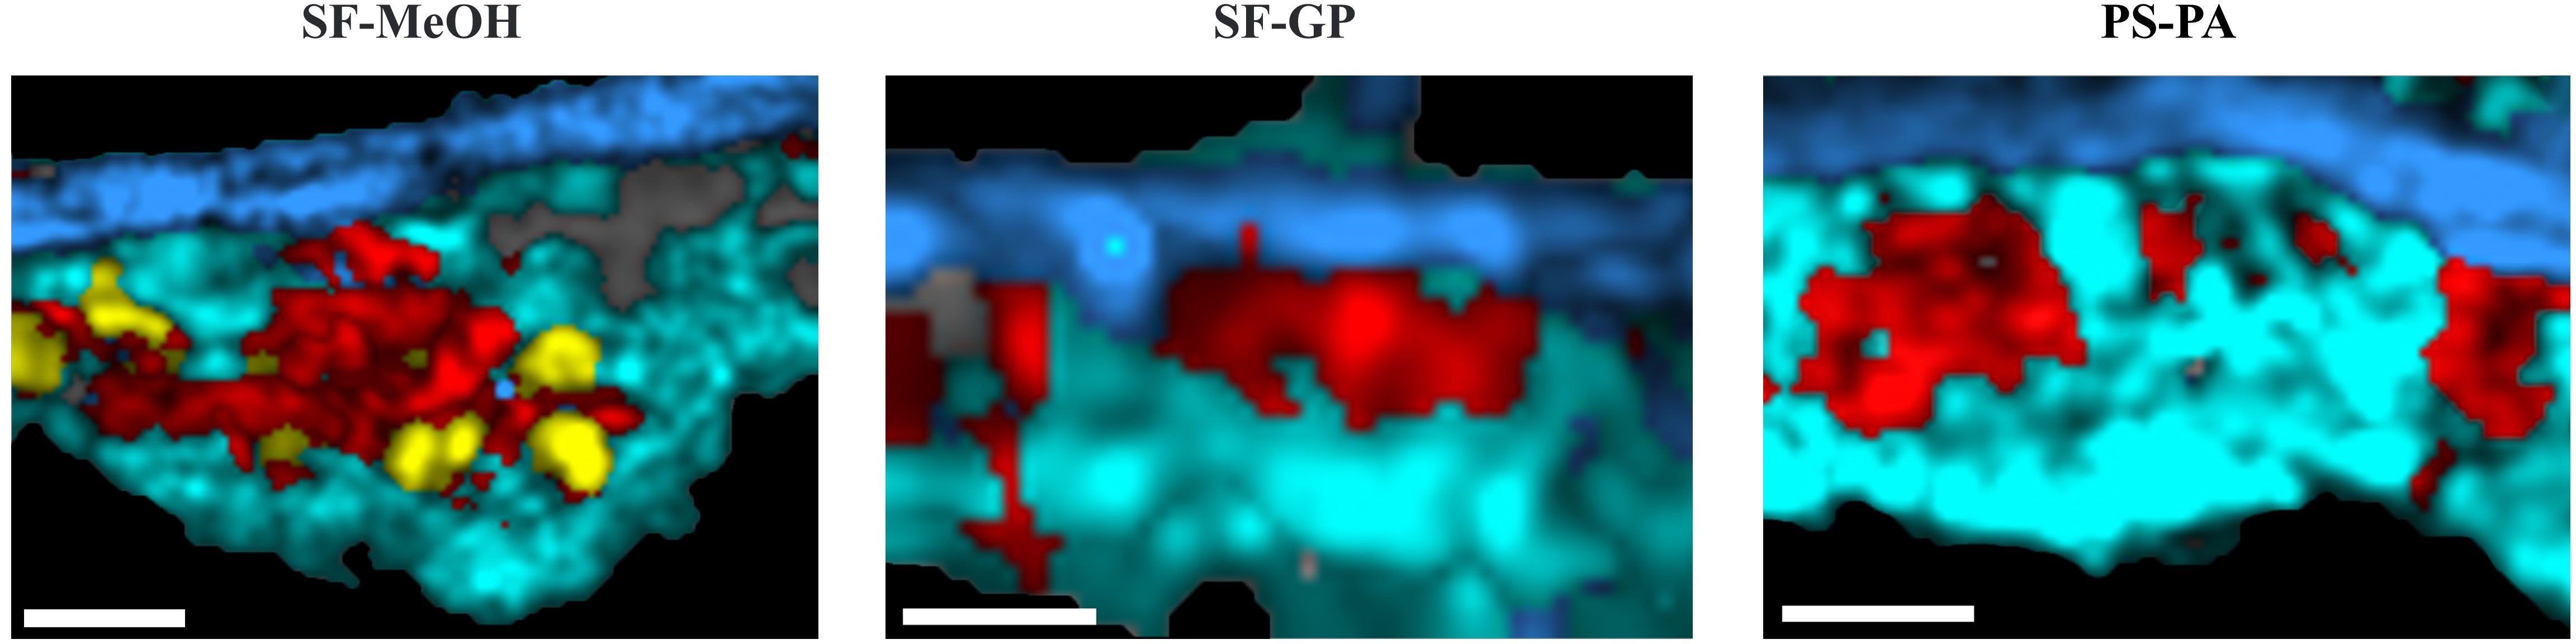
Figure 2 Comparative analysis of Raman imaging maps of the gills preserved using different methods. Raman imaging of the gills showing the distribution of cellular components, including the nucleus (red), cytoplasm containing symbionts (cyan), basal membrane (blue) and lysosome (yellow). The gray part is composed of feature spectrum of the slides, which is caused by the slight breakage of the tissue. Scale bars: 8 µm. The bright field corresponding to Raman imaging images were shown in Supplementary Figure S1.
Lysosomes are important for the study of symbiotic regulation and have been demonstrated in symbiotic systems of multiple taxa (Hohman et al., 1982; Nishikori et al., 2009; Castillo et al., 2015). Lysosomes are involved in regulating the homeostasis of symbiotic bacteria and determining the fate of the symbiont (Trench, 1971). In symbiotic deep-sea mussels, lysosomes play an important role in the intracellular digestion of the pasture. Here, SF-GP and PS-PA resulted in failure of imaging of the lysosomes; the spectra of the as-preserved samples did not show the characteristic peak for the lysosomes at 726 cm-1, which is typically attributed to DNA (Talari et al., 2015) (Figure 1B)—an important evidence of the host’s consumption of symbionts through lysosomes. Although the presence of lysosomes can also be verified via electron microscopy, the Raman signal of phosphatidylinositol is disrupted, leading to an inability to discriminate by Raman imaging. The absence of the peak corresponding to phosphatidylinositol, a membrane-forming molecule, indicates the loss of membrane integrity, which can lead to drastic changes in the distribution of some substances inside and outside the lysosome and affect the further study of substance distribution.
In summary, SF-GP and PS-PA are more effective toward the maintenance of the overall morphology; however, SF and SF-MeOH have a weaker effect on the distribution of substances due to the weak influence upon fixation, which is more favorable for some detailed imaging studies.
Effects of the different methods on the biomolecular composition
First, we took the total average spectra of the tissues after area scans of the gill sections obtained from the four different preservation methods (Figure 3). Significant variability in the peak positions and intensities in the regions within the spectra were observed; however, most of the molecular contributions could be identified (Table 1). The spectra were normalized to improve clarity (Faoláin, 2005). Considering that the signal of the Raman peaks may be influenced by the laser focusing, we discussed the differences in peak intensities together with the spectra before and after normalization for comparative analysis.
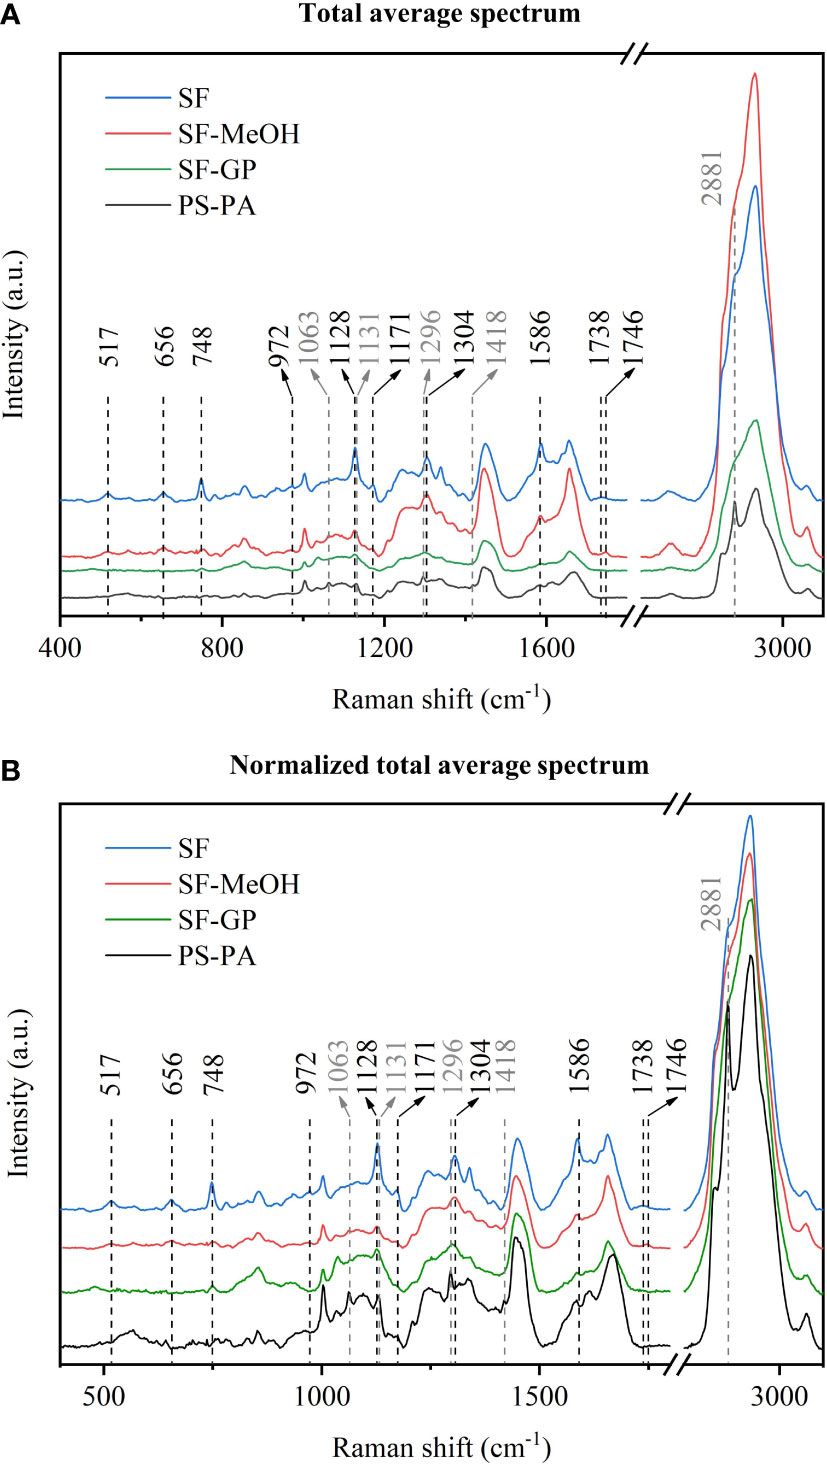
Figure 3 Comparative analysis of the spectra by the four different methods. (A) Average spectra. (B) Normalized average spectra.
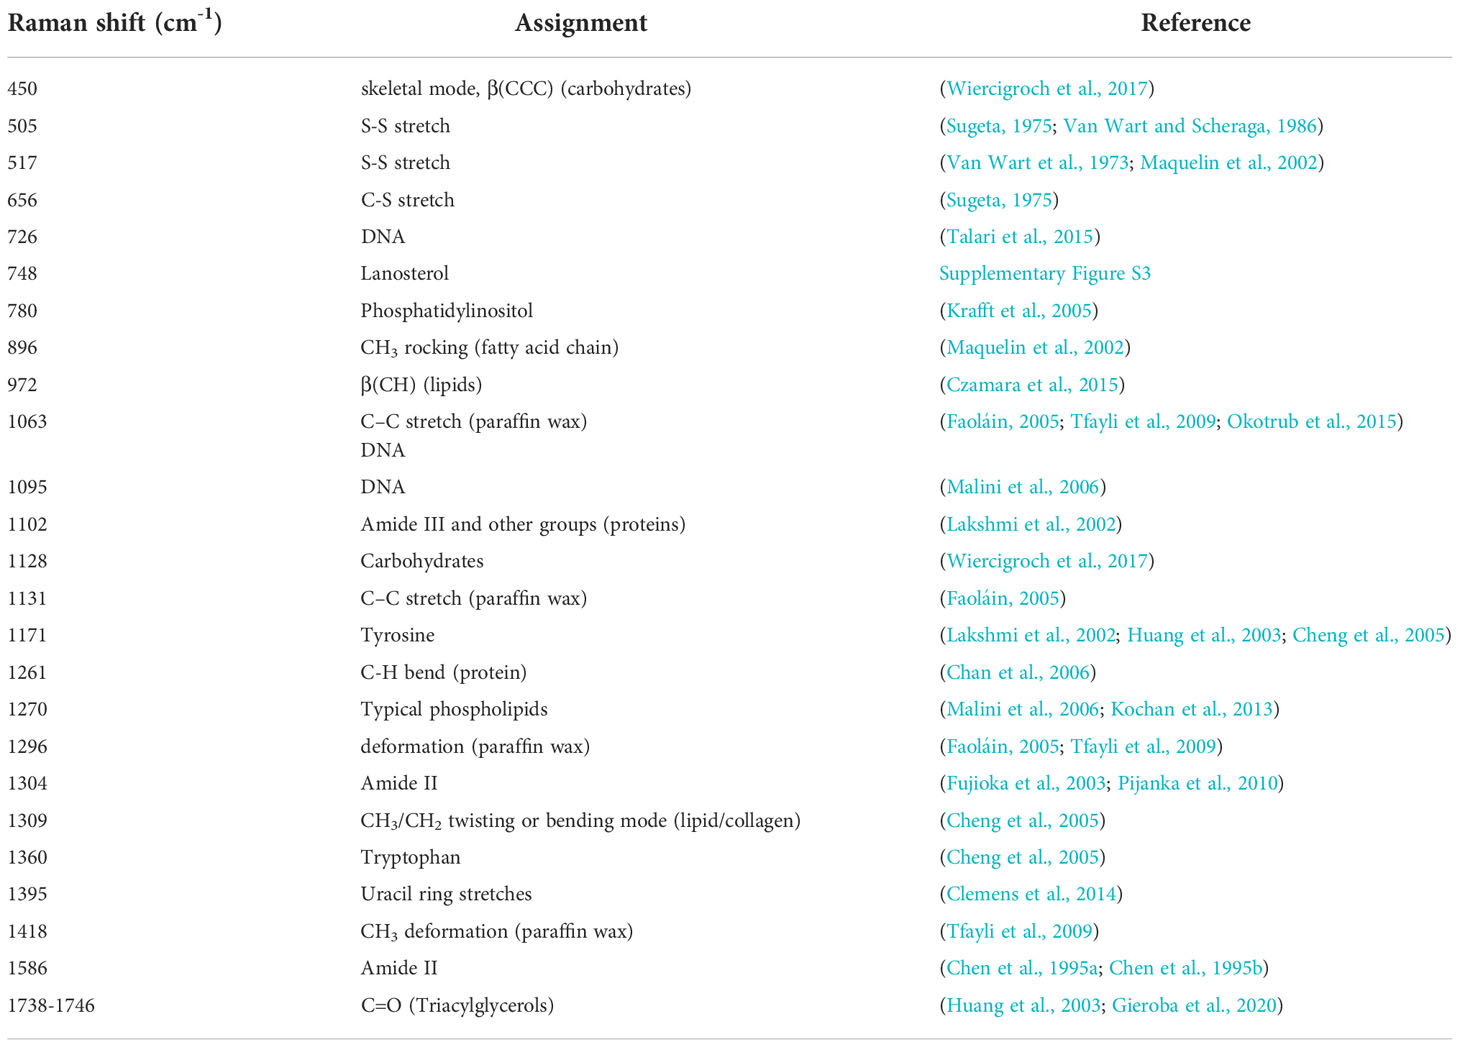
Table 1 Raman band assignment observed in the spectra of the gills.
Following dewaxing, the peak in the spectra of the PS-PA samples were clearly different from those prepared by other methods at 2,881 cm-1. Further analysis revealed that this peak was consistent with the Raman peak of paraffin wax. Further comparison with other paraffin wax main peaks indicated that paraffin wax likely has a stronger signal in this section. Other characteristic peaks of paraffin wax, e.g., those near 1,063 cm-1 (C-C stretch), 1,131 cm-1 (C-C stretch), 1,296 cm-1 (CH2 deformation), and 1,418 cm-1 (CH3 deformation), could be observed in the spectra (Faoláin, 2005; Tfayli et al., 2009). The combination of the average spectra obtained by the other treatments revealed that the peaks of the samples overlapped significantly with those of the biological tissues (Tfayli et al., 2009). It was difficult to distinguish their contribution and to determine whether the peak was due to the distortion of the biological components caused by extensive treatment. For example, in sections other than those preserved via PS-PA, the peak at 1,063 cm-1 can be judged as the characteristic peak for DNA; however, in the PS-PA-preserved samples, it may also be the characteristic peak of paraffin. Although it does not affect the H&E staining observation, incomplete dewaxing can interfere with the acquisition of Raman data and analysis. However, it is possible to study spectral regions of interest that do not overlap with the paraffin signal; also, for the study of overlapping regions, further optimization of the proposed method is needed to verify that paraffin is removed completely for more effective Raman analysis.
The Raman peak at 517 cm-1 corresponding to the S-S stretching (Van Wart et al., 1973; Maquelin et al., 2002) and at 656 cm-1 ascribed to the C-S stretching were present in the SF and SF-MeOH samples, indicating the ability of these methods to preserve some spatial structures and chemical bonds that are not preserved via SF-GP and PS-PA. The Raman peak at 748 cm-1 is derived from lanosterol (Supplementary Figure S3) and that at 1,304 cm-1 represents the amide II band (Fujioka et al., 2003; Pijanka et al., 2010), which are absent in the PS-PA-preserved samples, indicating that the PS-PA method alters the amino acid composition and disrupts the spatial structure of proteins. The 972 cm-1 peak is specific to the SF and SF-MeOH samples and can be assigned to lipids (Czamara et al., 2015). This indicates that fixatives can destroy lipids and should be used with caution during the interpretation of lipid changes. The samples preserved via SF have a unique Raman peak at 1,738 cm-1, and while those via SF-MeOH have a unique Raman peak at 1,746 cm-1—both of which can be attributed to the C=O stretching (lipids) (Lakshmi et al., 2002; Silveira et al., 2002; Huang et al., 2003; Stone et al., 2004; Krafft et al., 2005; Dukor, 2006; Huang et al., 2011; Czamara et al., 2015; Gieroba et al., 2020); these results indicate that SF and SF-MeOH are effective for the preservation of triacylglycerols (Czamara et al., 2015). The disappearance of the C=O band in the spectra of the samples preserved by the other two methods may be due to the fixation of aldehydes and the xylene treatment, resulting in the massive removal of cellular lipids from the tissues (Lyng et al., 2011).
In addition, we found that the Raman spectra for the SF samples were significantly stronger (with several peaks at around 517, 656, 748, 972, 1,128, 1,171, and 1,586 cm-1, which may represent the S-S stretching (Van Wart et al., 1973; Maquelin et al., 2002), C-S stretching (Sugeta, 1975), lanosterol (Supplementary Figure S3), lipid (Czamara et al., 2015), carbohydrate (Wiercigroch et al., 2017), lanosterol, and amide II bands (Chen et al., 1995a; Chen et al., 1995b), respectively) than those for the other samples, suggesting that the concentration of these substances is higher when they are not contaminated with chemical fixatives. Therefore, the method associated with fixation will reduce the concentration of these substances.
Differences in the overall composition of the Raman spectra are expected; unfortunately, the spectra may cause some weaker peaks to be missed in the averaging process. Therefore, to further investigate the effects of different preservation methods on different biomolecules, we compared the enriched regions of nucleic acids, proteins, and lipids separately (Figure 4). In the nucleic acid enriched region (nucleus), the peaks in the Raman spectra of the SF and SF-MeOH samples at 1,095 cm-1 can be attributed to DNA (Malini et al., 2006), indicating that SF-MeOH is a good fixative for preserving nucleic acids. The Raman peak at 1,102 cm-1 is present in the SF-GP and PS-PA samples and belongs to amide III (Lakshmi et al., 2002). This indicates that SF and SF-MeOH may disrupt the secondary structures of proteins and that different methods have different effects on the spatial structure of proteins. In the region of protein enrichment (cytoplasm containing symbionts), the SF-GP sample possessed unique Raman peaks near 505 cm-1 representing S-S stretching (Sugeta, 1975; Van Wart and Scheraga, 1986), indicating that aldehyde fixation may well preserve the tertiary structure of proteins, while other methods would likely lead to tertiary denaturation. Alcohols denature proteins by disrupting their tertiary structures (Shao et al., 2012). The SF method may have led to conformational changes in the proteins (Lyng et al., 2011). In the phospholipid enrichment region (basal membrane), the spectra of the SF sample contained a peak at 896 cm-1 corresponding to the CH3 rocking band, which can be attributed to the presence of the fatty acid chain (Maquelin et al., 2002). In addition, the spectra of the SF sample contained a peak at 1,309 cm-1, which is ascribed to the CH3/CH2 twisting or bending mode of lipid/collagen (Cheng et al., 2005), and one at 1,360 cm-1, corresponding to the tryptophan bands (Huang et al., 2003; Cheng et al., 2005). The band at 450 cm-1 in the spectra of the SF and SF-MeOH samples is due to the skeletal mode of carbohydrates (Wiercigroch et al., 2017). Only the SF-GP samples did not undergo the uracil ring stretching, whose peak is located at 1,395 cm-1 (Clemens et al., 2014). These results suggest that SF-MeOH, SF-GP, and PS-PA disrupt the fatty acid chains, SF and SF-MeOH are more effective for the observation of the Raman peaks ascribed to carbohydrates, and SF-GP leads to protein destruction.
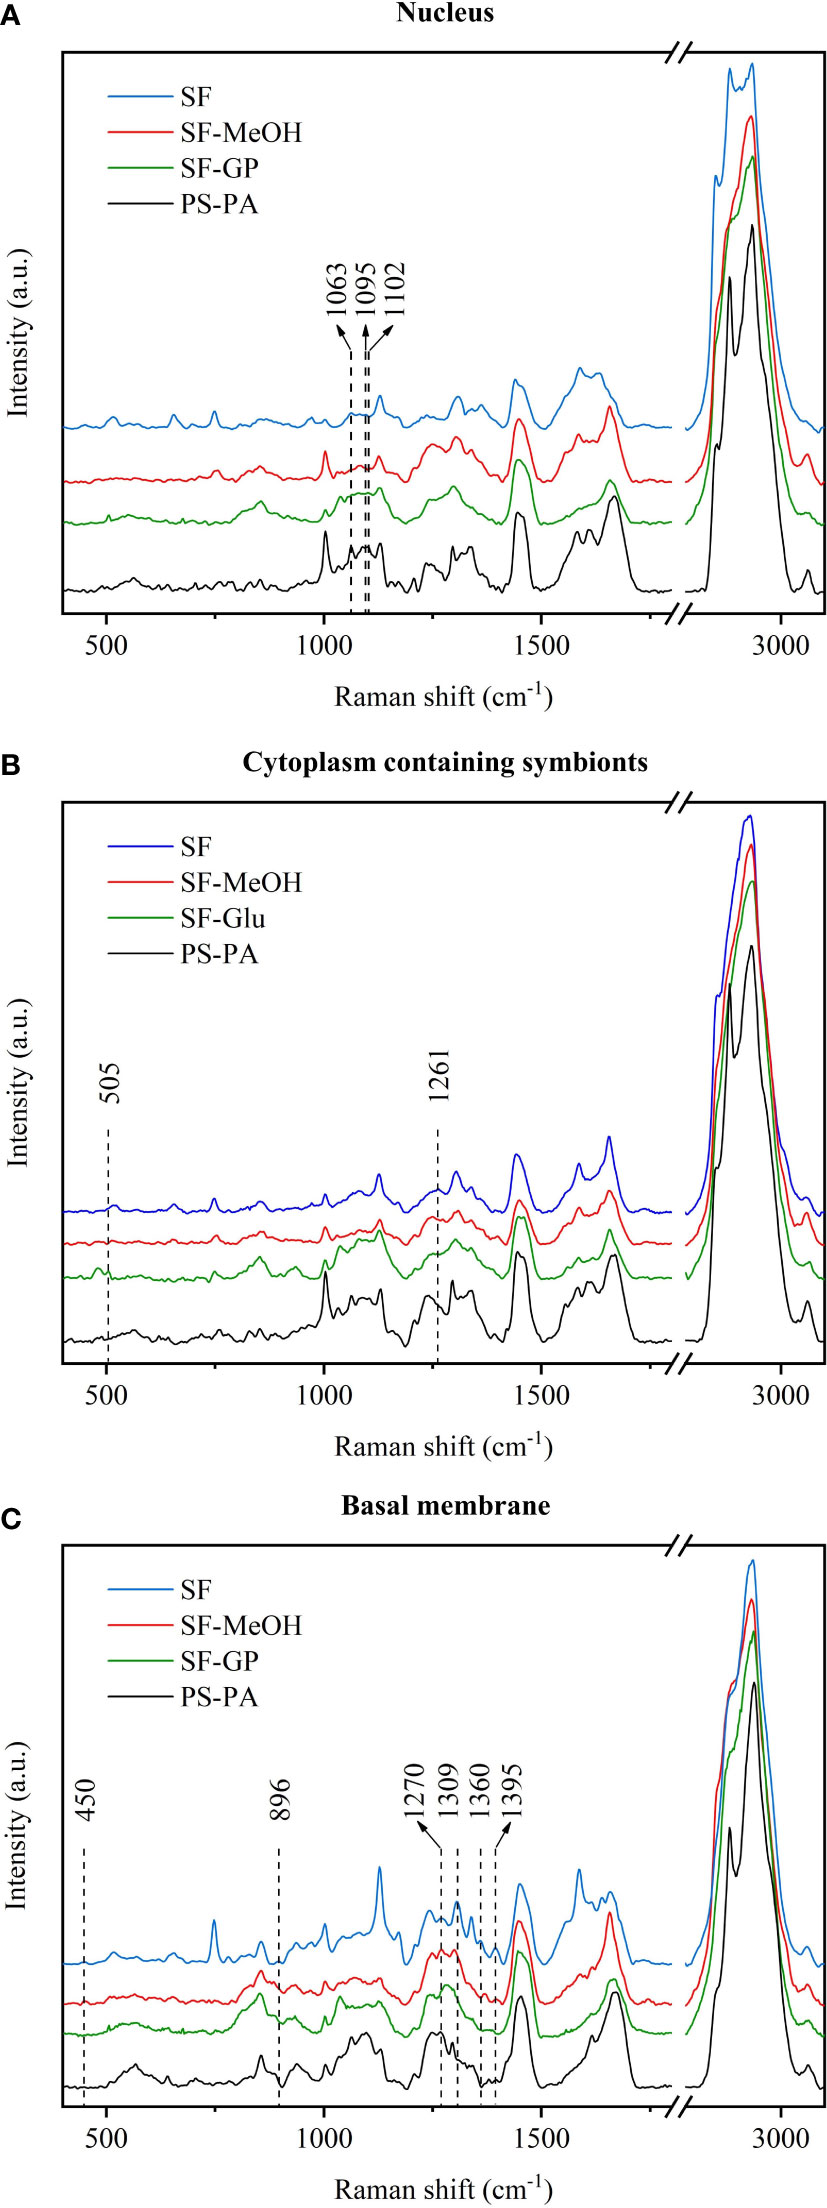
Figure 4 Comparative analysis of the characteristic spectra of different regions of the samples subjected to the four different preservation methods. (A) Nucleus. (B) Cytoplasm containing symbionts. (C) Basal membrane.
In addition to the direct analysis of the different peak positions, we can further identify the overlapping biomolecules by fitting the profiles via deconvolution analysis in order to obtain more information. We can observe the spectra of the samples obtained by the different methods to show significantly different profiles in terms of peak position, intensity, and width in the range of 1,500–1,700 cm-1. The deconvolution analysis results (Figure 5 and Table 2) confirmed the existence of vibrational modes such as β-sheet, α-helix, unordered, turn, and aromatic amino acid ring modes, and side chains of the amide band (Goormaghtigh et al., 1994; Chen et al., 1995a; Chen et al., 1995b; Pelton and McLean, 2000; Barth and Zscherp, 2002; Faoláin et al., 2005; Chan et al., 2006; Lefèvre et al., 2007; Kochan et al., 2013; Yang et al., 2015; Rivas-Arancibia et al., 2017; Gieroba et al., 2020; Kowalska et al., 2020; Talaikis et al., 2020). Among them, a peak corresponding to a mixture of lipid and protein may exist at around 1,664 cm-1 (Kochan et al., 2013). The peak width range of 1,570-1,579 cm-1 was fitted in the total average spectra of the nucleus and cytoplasm containing symbionts for both the SF and SF-MeOH samples; these peaks can be attributed to DNA (Chan et al., 2006; Gieroba et al., 2020) (Supplementary Figure S4 and Table 2). This result reconfirmed that methanol can better preserve nucleic acids in cell nuclei, and has a stronger preservation effect for DNA in the cytoplasm containing symbionts. In terms of the protein structure, the SF-GP and PS-PA samples possessed unique turn structures, and the α-helix structure was completely disrupted in PS-PA.
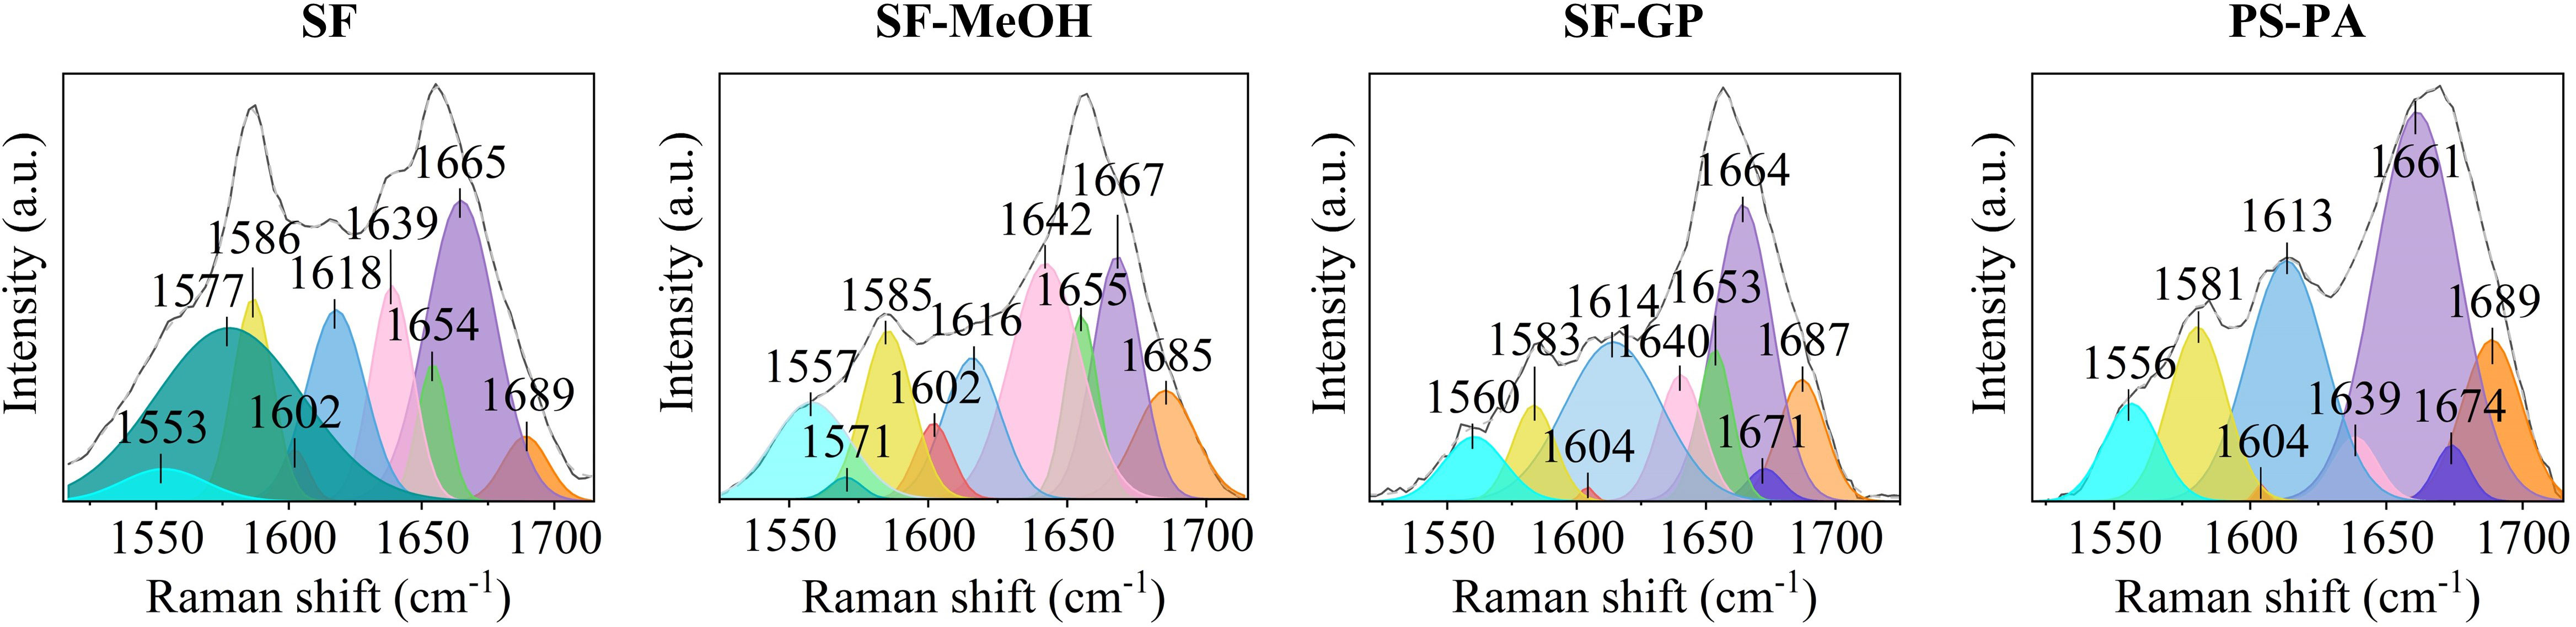
Figure 5 Fitting of the Raman spectra with peaks at 1,550-1,700 cm-1 obtained for different regions in the samples subjected to the four different preservation methods.
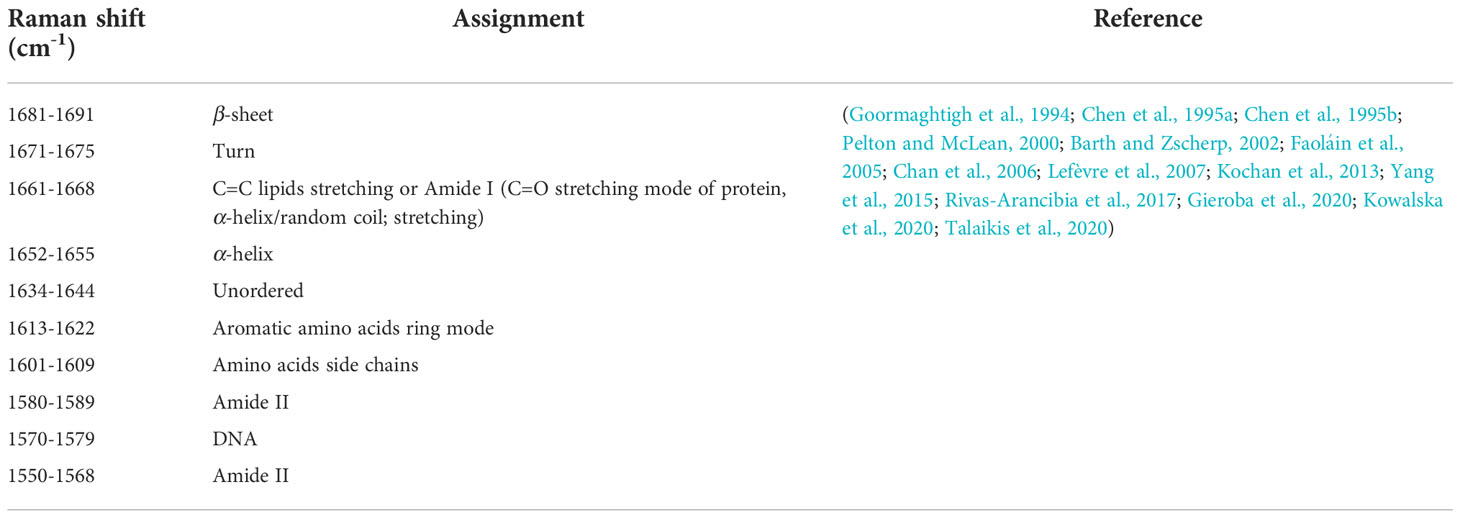
Table 2 Location of the Raman bands in the range of 1,550-1,700 cm-1, and their assignments for the gills.
To further investigate specific changes induced by the different preservation methods, we performed semi-quantitative analyses. Because the area of each peak corresponds to their conformational contribution (Kozicki et al., 2015), the area of each fraction was divided by the sum of the areas of all amide I band fractions to determine their relative contents. Table 3 summarizes the total average spectra of the different treatments and specific information on the subpeaks obtained after fitting the different sites for each method. From the results of the total average spectra fitting, the spectra of the SF and SF-MeOH samples contain the same vibrational modes, with differences in content; however, both were dominated by unordered structures, probably due to the depolymerization of proteins in the frozen sections during direct snap freezing (Lyng et al., 2011).
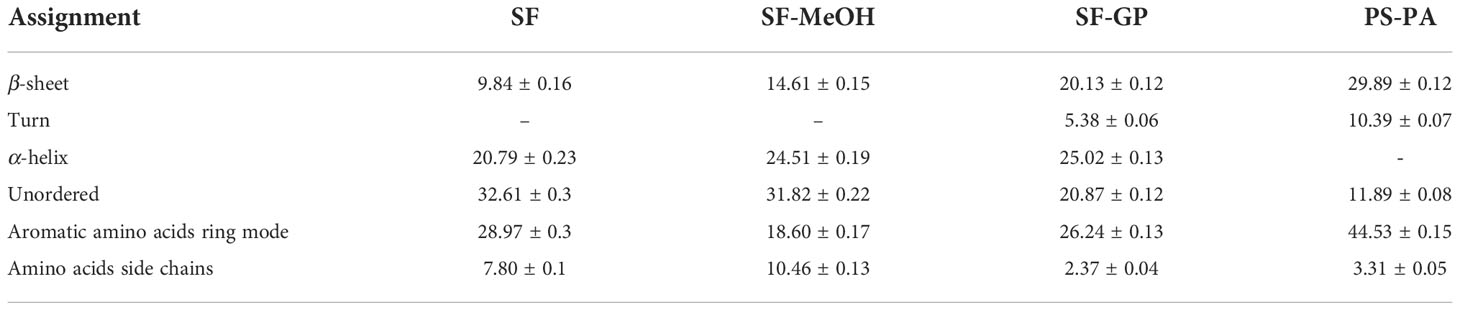
Table 3 Quantitative estimation related to protein spatial structure in different preservation methods located at 1,600-1,700 cm-1.
The turn structure accounts for the greater proportion of the cytoplasm containing symbionts region in the SF-GP samples, and the nucleus region in the PS-PA samples (Supplementary Figure S4 and Supplementary Table S1). The β-sheet structures of the SF-GP and PS-PA samples were redundant with SF and SF-MeOH. The differences here indicate a significant change in the protein structure. The increased β-sheet amount indicates increased stiffness, easier tissue sectioning, and less fragmentation of the cells (Herrero et al., 2014). The SF-GP and PS-PA samples had a higher content of aromatic amino acids ring mode than the others, and the amino acids side chain structure accounted for the least. The lowest percentage of aromatic amino acids ring mode was found in the SF-MeOH sample. It may be because aldehyde fixation can cause cross-linking between functional groups in the side chains of amino acids, including cross-linking between adjacent amino acid chains and different positions of the same amino acid chain (Hobro and Smith, 2017). This process causes the protein to become insoluble. Concurrently, chemical changes occur, although it is usually more mechanically stable and suitable for subsequent processing, such as paraffin and resin embedding for sectioning.
In the basal membrane region, the content of β-sheet structures were high for all four methods in the three regions. Compared with SF, the immobilized samples showed lower contents of aromatic amino acid ring modes and amino acid side chain structures. The content of amino acid side chain structures in SF-GP was below the detection limit (Supplementary Figure S4 and Supplementary Table S1). It has been suggested that the basal membrane is the most morphologically stable region in the cell and can maintain its integrity without fixation during sectioning. It is speculated that the fixation of this region is less effective for the preservation of amino acids. This result is in good agreement with the conclusion that we found a strong link between the ease of obtaining integrity sections and fixation during our experiments.
Conclusion
Choosing an appropriate preservation method that causes minimal changes in the composition, distribution, and morphological integrity of biomolecules is important for the study of scientific problems (Mariani et al., 2009; Lyng et al., 2011). To the best of our knowledge, this is the first study that analyzing the effect of different preservation methods on the Raman signal of symbiotic deep-sea biological tissues. We analyzed the effects of four common preservation methods on Raman analysis by using the deep-sea mussel as a model (Table 4). To summarize, there are differences in the effect of preservation of different biomolecules in different areas of the tissue, probably due to differences in biomolecular composition. Our results highlight the strength of CRM in complex biomolecular composition recovery at the cellular scale and provide a guideline for other symbiotic deep-sea species with fragile tissues and complex metabolite compositions. The CRM can be extended to other species after the sample preservation and preparation refinement.
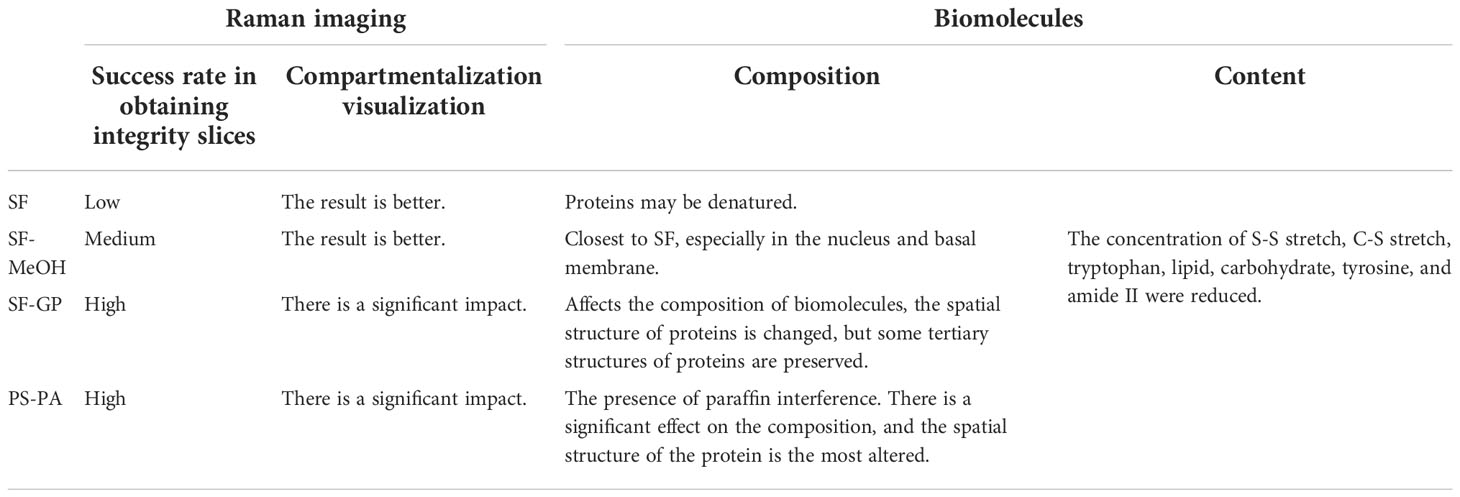
Table 4 Comprehensive evaluation summary of different preservation methods.
For this study model, the best preservation method needs to be selected on the basis of further experimental requirements. For spectroscopic analysis and other biological methods, SF is the best method to comprehensively analyze the composition of biological macromolecules in biological tissues if the focus is on metabolites. However, the sections can be damaged and sample degradation must be controlled. Fixatives can improve sectioning success but affect intracellular biomolecules to varying degrees and have different sensitivities for tracking different biochemical components. The SF-MeOH method is an acceptable choice when SF is not sufficient in obtaining good morphology in sections, and if the user is not concerned with the fact that SF-MeOH affects the composition of biomolecules. If the user is more concerned with overall morphological observations, SF-GP and PS-PA are the best choices. However, they are not well suited for metabolic studies.
Data availability statement
The original contributions presented in the study are included in the article/Supplementary Material. Further inquiries can be directed to the corresponding authors.
Author contributions
WH conceived and designed the experiments, performed research, analyzed data, and wrote the manuscript. MW and XZ conceived and designed the experiments, analyzed data, wrote the manuscript, project administration, and funding acquisition. ML, ZZ, HC, and SX performed research. CL and ZL, project administration, and funding acquisition. All authors contributed to the article and approved the submitted version.
Funding
This research was supported by the following grants: the Strategic Priority Research Program of Chinese Academy of Sciences (XDA22050102, XDA19060402), Key project of Ocean Research Center, Chinese Academy of Sciences (COMS2020J03), the National Natural Science Foundation of China (41822604, 42076091), the Young Taishan Scholars Program (tsqn201909158).
Acknowledgments
We thank all the crews onboard the R/V Kexue for their assistance in sample collection and all the laboratory staff for continuous technical advice and helpful discussions.
Conflict of interest
The authors declare that the research was conducted in the absence of any commercial or financial relationships that could be construed as a potential conflict of interest.
Publisher’s note
All claims expressed in this article are solely those of the authors and do not necessarily represent those of their affiliated organizations, or those of the publisher, the editors and the reviewers. Any product that may be evaluated in this article, or claim that may be made by its manufacturer, is not guaranteed or endorsed by the publisher.
Supplementary material
The Supplementary Material for this article can be found online at: https://www.frontiersin.org/articles/10.3389/fmars.2022.1077595/full#supplementary-material
References
Barth A., Zscherp C. (2002). What vibrations tell about proteins. Quart. Rev. Biophys. 35 (4), 369–430. doi: 10.1017/S0033583502003815
Butler H. J., Ashton L., Bird B., Cinque G., Curtis K., Dorney J., et al. (2016). Using raman spectroscopy to characterize biological materials. Nat. Protoc. 11 (4), 664–687. doi: 10.1038/nprot.2016.036
Castillo M. G., Salazar K. A., Joffe N. R. (2015). The immune response of cephalopods from head to foot. Fish Shellfish Immunol. 46 (1), 145–160. doi: 10.1016/j.fsi.2015.05.029
Chan J. W., Taylor D. S., Zwerdling T., Lane S. M., Ihara K., Huser T. (2006). Micro-raman spectroscopy detects individual neoplastic and normal hematopoietic cells. Biophys. J. 90 (2), 648–656. doi: 10.1529/biophysj.105.066761
Chen X. G., Asher S. A., Schweitzer-Stenner R., Mirkin N. G., Krimm S., de Mul F. F. M. (1995a). UV Raman determination of the ππ* excited state geometry of N-methylacetamide: Vibrational enhancement pattern. J. Am. Chem. Soc 117, 2884–2895. doi: 10.1021/ja00115a021
Cheng W., Liu M., Liu H., Lin S. (2005). Micro-raman spectroscopy used to identify and grade human skin pilomatrixoma. Microsc. Res. Tech. 68 (2), 75–79. doi: 10.1002/jemt.20229
Chen X. G., Schweitzer-Stenner R., Asher S. A., Mirkin N. G., Krimm S. (1995b). Vibrational assignments of trans-N-methylacetamide and some of its deuterated isotopomers from band decomposition of IR, visible, and resonance raman spectra. J. Phys. Chem. 99, 3074–3083. doi: 10.1021/j100010a017
Chen S., Wu Q., Mishra C., Kang J., Zhang H., Cho K., et al. (2012). Thermal conductivity of isotopically modified graphene. Nat. Mater. 11 (3), 203–207. doi: 10.1038/NMAT3207
Childress J. J., Fisher C. R., Brooks J. M., Kennicutt M. N., Bidigare R., Anderson A. E. (1986). A methanotrophic marine molluscan (bivalvia, mytilidae) symbiosis: Mussels fueled by gas. Science 233 (4770), 1306–1308. doi: 10.1126/science.233.4770.1306
Clemens G., Hands J. R., Dorling K. M., Baker M. J. (2014). Vibrational spectroscopic methods for cytology and cellular research. Analyst 139 (18), 4411–4444. doi: 10.1039/c4an00636d
Czamara K., Majzner K., Pacia M. Z., Kochan K., Kaczor A., Baranska M. (2015). Raman spectroscopy of lipids: A review. J. Raman Spectrosc. 46 (1), 4–20. doi: 10.1002/jrs.4607
Dodd M. S., Papineau D., Grenne T., Slack J. F., Rittner M., Pirajno F., et al. (2017). Evidence for early life in earth’s oldest hydrothermal vent precipitates. Nature 543 (7643), 60. doi: 10.1038/nature21377
Dubilier N., Bergin C., Lott C. (2008). Symbiotic diversity in marine animals: the art of harnessing chemosynthesis. Nat. Rev. Microbiol. 6 (10), 725–740. doi: 10.1038/nrmicro1992
Dukor R. K. (2006). Vibrational spectroscopy in the detection of cancer. Handb. Vibrational Spectrosc. 5, 3335–3361. doi: 10.1002/9780470027325.s8107
Du J., Su Y., Qian C., Yuan D., Miao K., Lee D., et al. (2020). Raman-guided subcellular pharmaco-metabolomics for metastatic melanoma cells. Nat. Commun. 11 (1), 4830. doi: 10.1038/s41467-020-18376-x
Faoláin E. O. (2005). Raman spectroscopic evaluation of efficacy of current paraffin wax section dewaxing agents. J. Histochem. Cytochem 53 (1), 121–129. doi: 10.1369/jhc.4A6536.2005
Faoláin E. O., Hunter M. B., Byrne J. M., Kelehan P., McNamara M., Byrne H. J., et al. (2005). A study examining the effects of tissue processing on human tissue sections using vibrational spectroscopy. Vibrational Spectrosc. 38 (1-2), 121–127. doi: 10.1016/j.vibspec.2005.02.013
Fiedler I. A. K., Casanova M., Keplinger T., Busse B. (2018). Effect of short-term formaldehyde fixation on raman spectral parameters of bone quality. J. Biomed. Opt. 23 (11), 1. doi: 10.1117/1.JBO.23.11.116504
Fujioka N., Morimoto Y., Takeuchi K., Yoshioka M., Kikuchi M. (2003). Difference in infrared spectra from cultured cells dependent on cell harvesting method. Appl. Spectrosc. 57 (2), 241–243. doi: 10.1366/000370203321535187
Galli R., Uckermann O., Koch E., Schackert G., Kirsch M., Steiner G. (2014). Effects of tissue fixation on coherent anti-stokes raman scattering images of brain. J. Biomed. Opt. 19 (7), 071402. doi: 10.1117/1.JBO.19.7.071402
Geier B., Sogin E. M., Michellod D., Janda M., Kompauer M., Spengler B., et al. (2020). Spatial metabolomics of in situ host–microbe interactions at the micrometre scale. Nat. Microbiol. 5 (3), 498–510. doi: 10.1038/s41564-019-0664-6
Gieroba B., Krysa M., Wojtowicz K., Wiater A., Pleszczyńska M., Tomczyk M., et al. (2020). The FT-IR and raman spectroscopies as tools for biofilm characterization created by cariogenic streptococci. Int. J. Mol. Sci. 21 (11), 3811. doi: 10.3390/ijms21113811
Gomes Da Costa S., Richter A., Schmidt U., Breuninger S., Hollricher O. (2019). Confocal raman microscopy in life sciences. Morphologie 103 (341), 11–16. doi: 10.1016/j.morpho.2018.12.003
Goormaghtigh E., Cabiaux V., Ruysschaert J. (1994). Determination of soluble and membrane protein structure by fourier transform infrared spectroscopy. Subcell Biochem. 23, 329–362. doi: 10.1007/978-1-4615-1863-1_9
Høgset H., Horgan C. C., Armstrong J. P. K., Bergholt M. S., Torraca V., Chen Q., et al. (2020). In vivo biomolecular imaging of zebrafish embryos using confocal raman spectroscopy. Nat. Commun. 11 (1), 6172. doi: 10.1038/s41467-020-19827-1
Herrero A. M., Ruiz-Capillas C., Jiménez-Colmenero F., Carmona P. (2014). Raman spectroscopic study of structural changes upon chilling storage of frankfurters containing olive oil bulking agents as fat replacers. J. Agric. Food Chem. 62 (25), 5963–5971. doi: 10.1021/jf501231k
Hobro A. J., Smith N. I. (2017). An evaluation of fixation methods: Spatial and compositional cellular changes observed by raman imaging. Vibrational Spectrosc. 91, 31–45. doi: 10.1016/j.vibspec.2016.10.012
Hohman T. C., McNeil P. L., Muscatine L. (1982). Phagosome-lysosome fusion inhibited by algal symbionts of hydra viridis. J. Cell Biol. 94 (1), 56–63. doi: 10.1083/jcb.94.1.56
Huang Z., McWilliams A., Lui H., McLean D. I., Lam S., Zeng H. (2003). Near-infrared raman spectroscopy for optical diagnosis of lung cancer. Int. J. Cancer 107 (6), 1047–1052. doi: 10.1002/ijc.11500
Huang N., Short M., Zhao J., Wang H., Lui H., Korbelik M., et al. (2011). Full range characterization of the raman spectra of organs in a murine model. Opt. Express 19 (23), 22892–22909. doi: 10.1364/OE.19.022892
Kallepitis C., Bergholt M. S., Mazo M. M., Leonardo V., Skaalure S. C., Maynard S. A., et al. (2017). Quantitative volumetric raman imaging of three dimensional cell cultures. Nat. Commun. 8 (1), 14843. doi: 10.1038/ncomms14843
Kochan K., Marzec K. M., Chruszcz-Lipska K., Jasztal A., Maslak E., Musiolik H., et al. (2013). Pathological changes in the biochemical profile of the liver in atherosclerosis and diabetes assessed by raman spectroscopy. Analyst 138 (14), 3885–3890. doi: 10.1039/c3an00216k
Kowalska A. A., Berus S., Szleszkowski L., Kaminska A., Kmiecik A., Ratajczak-Wielgomas K., et al. (2020). Brain tumour homogenates analysed by surface-enhanced raman spectroscopy: Discrimination among healthy and cancer cells. Spectrochim Acta A Mol. Biomol. Spectrosc. 231, 117769. doi: 10.1016/j.saa.2019.117769
Kozicki M., Czepiel J., Biesiada G., Nowak P., Garlicki A., Weselucha-Birczynska A. (2015). The ring-stage of plasmodium falciparum observed in RBCs of hospitalized malaria patients. Analyst 140 (23), 8007–8016. doi: 10.1039/c5an01598g
Krafft C., Neudert L., Simat T., Salzer R. (2005). Near infrared raman spectra of human brain lipids. Spectrochim Acta A Mol. Biomol. Spectrosc. 61 (7), 1529–1535. doi: 10.1016/j.saa.2004.11.017
Kuzmin A. N., Pliss A., Prasad P. N. (2014). Changes in biomolecular profile in a single nucleolus during cell fixation. Anal. Chem. 86 (21), 10909–10916. doi: 10.1021/ac503172b
Lakshmi R. J., Kartha V. B., Krishna C. M., J. G. R. S., Ullas G., Devi P. U. (2002). Tissue raman spectroscopy for the study of radiation damage: Brain irradiation of mice. Radiat. Res. 157 (2), 175–182. doi: 10.1667/0033-7587(2002)157[0175:TRSFTS]2.0.CO;2
Laming S. R., Gaudron S. M., Duperron S. (2018). Lifecycle ecology of deep-Sea chemosymbiotic mussels: A review. Front. Mar. Sci. 5 (282). doi: 10.3389/fmars.2018.00282
Lazarevic J. J., Ralevic U., Kukolj T., Bugarski D., Lazarevic N., Bugarski B., et al. (2019). Influence of chemical fixation process on primary mesenchymal stem cells evidenced by raman spectroscopy. Spectrochim Acta A Mol. Biomol. Spectrosc. 216, 173–178. doi: 10.1016/j.saa.2019.03.012
Lefèvre T., Rousseau M., Pézolet M. (2007). Protein secondary structure and orientation in silk as revealed by raman spectromicroscopy. Biophys. J. 92 (8), 2885–2895. doi: 10.1529/biophysj.106.100339
Lorenz B., Wichmann C., Stöckel S., Rösch P., Popp J. (2017). Cultivation-free raman spectroscopic investigations of bacteria. Trends Microbiol. 25 (5), 413–424. doi: 10.1016/j.tim.2017.01.002
Lyng F., Gazi E., Gardner P. (2011). “Preparation of tissues and cells for infrared and raman spectroscopy and imaging,” in RSC Analytical spectroscopy monographs. Ed. Moss D. (Cambs, England: Royal Society of Chemistry), 147–185.
Malini R., Venkatakrishna K., Kurien J., M. Pai K., Rao L., Kartha V. B., et al. (2006). Discrimination of normal, inflammatory, premalignant, and malignant oral tissue: A raman spectroscopy study. Biopolymers 81 (3), 179–193. doi: 10.1002/bip.20398
Maquelin K., Kirschner C., Choo-Smith L. P., van den Braak N., Endtz H. P., Naumann D., et al. (2002). Identification of medically relevant microorganisms by vibrational spectroscopy. J. Microbiol. Methods 51 (3), 255–271. doi: 10.1016/s0167-7012(02)00127-6
Mariani M. M., Lampen P., Popp J., Wood B. R., Deckert V. (2009). Impact of fixation on in vitro cell culture lines monitored with raman spectroscopy. Analyst 134 (6), 1154. doi: 10.1039/b822408k
Meade A. D., Clarke C., Draux F., Sockalingum G. D., Manfait M., Lyng F. M., et al. (2010). Studies of chemical fixation effects in human cell lines using raman microspectroscopy. Anal. Bioanal. Chem. 396 (5), 1781–1791. doi: 10.1007/s00216-009-3411-7
Moerner W. E., Orrit M. (1999). Illuminating single molecules in condensed matter. Science 283 (5408), 1670. doi: 10.1126/science.283.5408.1670
Nishikori K., Morioka K., Kubo T., Morioka M. (2009). Age- and morph-dependent activation of the lysosomal system and Buchnera degradation in aphid endosymbiosis. J. Insect Physiol. 55 (4), 351–357. doi: 10.1016/j.jinsphys.2009.01.001
Okotrub K. A., Surovtsev N. V., Semeshin V. F., Omelyanchuk L. V. (2015). Raman spectroscopy for DNA quantification in cell nucleus. Cytometry A. 87 (1), 68–73. doi: 10.1002/cyto.a.22585
Pahlow S., Meisel S., Cialla-May D., Weber K., Rösch P., Popp J. (2015). Isolation and identification of bacteria by means of raman spectroscopy. Adv. Drug Deliv. Rev. 89, 105–120. doi: 10.1016/j.addr.2015.04.006
Pelton J. T., McLean L. R. (2000). Spectroscopic methods for analysis of protein secondary structure. Anal. Biochem. 277 (2), 167–176. doi: 10.1006/abio.1999.4320
Petersen J. M., Zielinski F. U., Pape T., Seifert R., Moraru C., Amann R., et al. (2011). Hydrogen is an energy source for hydrothermal vent symbioses. Nature 476 (7359), 176–180. doi: 10.1038/nature10325
Pijanka J., Sockalingum G. D., Kohler A., Yang Y., Draux F., Parkes G., et al. (2010). Synchrotron-based FTIR spectra of stained single cells. Towards a clinical application in pathology. Lab. Invest. 90 (5), 797–807. doi: 10.1038/labinvest.2010.8
Ponnudurai R., Kleiner M., Sayavedra L., Petersen J. M., Moche M., Otto A., et al. (2017). Metabolic and physiological interdependencies in the Bathymodiolus azoricus symbiosis. ISME J. 11 (2), 463–477. doi: 10.1038/ismej.2016.124
Rivas-Arancibia S., Rodríguez-Martínez E., Badillo-Ramírez I., López-González U., Saniger J. M. (2017). Structural changes of amyloid beta in hippocampus of rats exposed to ozone: A raman spectroscopy study. Front. Mol. Neurosci. 10. doi: 10.3389/fnmol.2017.00137
Shao Q., Fan Y., Yang L., Qin Gao Y. (2012). From protein denaturant to protectant: Comparative molecular dynamics study of alcohol/protein interactions. J. Chem. Phys. 136 (11), 115101. doi: 10.1063/1.3692801
Silveira L., Sathaiah S., Zângaro R. A., Pacheco M. T. T., Chavantes M. C., Pasqualucci C. A. G. (2002). Correlation between near-infrared raman spectroscopy and the histopathological analysis of atherosclerosis in human coronary arteries. Lasers Surg. Med. 30 (4), 290–297. doi: 10.1002/lsm.10053
Stöcke S., Kirchhoff J., Neugebauer U., Rösch P., Popp J. (2016). The application of raman spectroscopy for the detection and identification of microorganisms. J. Raman Spectrosc. 47, 89–109. doi: 10.1002/jrs.4844
Stone N., Kendall C., Smith J., Crow P., Barr H. (2004). Raman spectroscopy for identification of epithelial cancers. Faraday Disc. 126, 141. doi: 10.1039/b304992b
Sugeta H. (1975). Normal vibrations and molecular conformations of dialkyl disulfides. Spectrochimica Acta Part A: Mol. Spectrosc. 31 (11), 1729–1737. doi: 10.1016/0584-8539(75)80116-4
Sun Y., Wang M., Li L., Zhou L., Wang X., Zheng P., et al. (2017). Molecular identification of methane monooxygenase and quantitative analysis of methanotrophic endosymbionts under laboratory maintenance in Bathymodiolus platifrons from the south China Sea. PeerJ 5, e3565. doi: 10.7717/peerj.3565
Sun J., Zhang Y., Xu T., Zhang Y., Mu H., Zhang Y., et al. (2017). Adaptation to deep-sea chemosynthetic environments as revealed by mussel genomes. Nat. Ecol. Evol. 1 (5), 121. doi: 10.1038/s41559-017-0121
Talaikis M., Strazdaitė S., Žiaunys M., Niaura G. (2020). Far-off resonance: Multiwavelength raman spectroscopy probing amide bands of amyloid-β-(37–42) peptide. Molecules 25 (15), 3556. doi: 10.3390/molecules25153556
Talari A. C. S., Movasaghi Z., Rehman S., Rehman I. U. (2015). Raman spectroscopy of biological tissues. Appl. Spectrosc. Rev. 50 (1), 46–111. doi: 10.1080/05704928.2014.923902
Tfayli A., Gobinet C., Vrabie V., Huez R., Manfait M., Piot O. (2009). Digital dewaxing of raman signals: discrimination between nevi and melanoma spectra obtained from paraffin-embedded skin biopsies. Appl. Spectrosc. 63 (5), 564–570. doi: 10.1366/000370209788347048
Trench R. K. (1971). The physiology and biochemistry of zooxanthellae symbiotic with marine coelenterates. i. the assimilation of photosynthetic products of zooxanthellae by two marine coelenterates. Proc. R. Soc B 177 (1047), 225–235. doi: 10.1098/rspb.1971.0024
Van Wart H. E., Lewis A., Scheraga H. A., Saeva F. D. (1973). Disulfide bond dihedral angles from raman spectroscopy. Proc. Natl. Acad. Sci. 70 (9), 2619–2623. doi: 10.1073/pnas.70.9.2619
Van Wart H. E., Scheraga H. A. (1986). Agreement with the disulfide stretching frequency-conformation correlation of sugeta, go, and miyazawa. Proc. Natl. Acad. Sci. 83 (10), 3064–3067. doi: 10.1073/pnas.83.10.3064
Wang H., Zhang H., Zhong Z., Sun Y., Wang M., Chen H., et al. (2021). Molecular analyses of the gill symbiosis of the bathymodiolin mussel Gigantidas platifrons. iScience 24 (1), 101894. doi: 10.1016/j.isci.2020.101894
Wetzel D. L., LeVine S. M. (1999). Microspectroscopy - imaging molecular chemistry with infrared microscopy. Science 285 (5431), 1224–1225. doi: 10.1126/science.285.5431.1224
Wiercigroch E., Szafraniec E., Czamara K., Pacia M. Z., Majzner K., Kochan K., et al. (2017). Raman and infrared spectroscopy of carbohydrates: A review. Spectrochim. Acta A Mol. Biomol. Spectrosc. 185, 317–335. doi: 10.1016/j.saa.2017.05.045
Xu T., Feng D., Tao J., Qiu J. (2019). A new species of deep-sea mussel (Bivalvia: Mytilidae: Gigantidas) from the south China Sea: Morphology, phylogenetic position, and gill-associated microbes. Deep-Sea Res. Part I Oceanogr. Res. Pap. 146, 79–90. doi: 10.1016/j.dsr.2019.03.001
Xu T., Gan Q., Wu B., Yin M., Xu J., Shu X., et al. (2020). Molecular basis for PI(3,5)P2 recognition by SNX11, a protein involved in lysosomal degradation and endosome homeostasis regulation. J. Mol. Biol. 432 (16), 4750–4761. doi: 10.1016/j.jmb.2020.06.010
Keywords: confocal Raman microscopy, symbiotic deep-sea mussel, preservation methods, Raman imaging, Raman signals
Citation: He W, Wang M, Li M, Zhong Z, Chen H, Xi S, Luan Z, Li C and Zhang X (2022) Confocal Raman microscopy for assessing effects of preservation methods on symbiotic deep-sea mussel gills. Front. Mar. Sci. 9:1077595. doi: 10.3389/fmars.2022.1077595
Received: 23 October 2022; Accepted: 22 November 2022;
Published: 05 December 2022.
Edited by:
Yunyun Zhuang, Ocean University of China, ChinaReviewed by:
Lingxin Chen, Yantai Institute of Coastal Zone Research (CAS), ChinaTingting Yin, Nanyang Technological University, Singapore
Yi Xin, Hainan University, China
Copyright © 2022 He, Wang, Li, Zhong, Chen, Xi, Luan, Li and Zhang. This is an open-access article distributed under the terms of the Creative Commons Attribution License (CC BY). The use, distribution or reproduction in other forums is permitted, provided the original author(s) and the copyright owner(s) are credited and that the original publication in this journal is cited, in accordance with accepted academic practice. No use, distribution or reproduction is permitted which does not comply with these terms.
*Correspondence: Xin Zhang, eHpoYW5nQHFkaW8uYWMuY24=; Chaolun Li, bGNsQHFkaW8uYWMuY24=
†These authors have contributed equally to this work and share first authorship