 Xiaoxiao Yu
 Baichuan Duan1
 Jingyao Zhao
 Dongqi Gu
- 1First Institute of Oceanography, Ministry of Natural Resources, Qingdao, China
- 2Institute of Global Environmental Change, Xi’an Jiaotong University, Xi’an, China
Although Last Glacial Maximum (LGM) sea levels have been the focus of much attention in climate and marine sciences, the timing, duration, and magnitude need further research. Here we present observations and analyses of the deepest speleothems (-116 m) collected from the deepest known blue hole on a global scale, the Sansha Yongle Blue Hole, Xisha Islands, South China Sea. The field investigations illustrate that submerged speleothems are irregular cauliflower-like coatings on the downward cave ceiling from water depths of ~90 to 120 m. The downward growth direction and negative stable carbon and oxygen stable isotopes of submerged speleothems suggest that they may deposit in an air-filled condition through gravity drip, indicating the maximum LGM sea level. The deep submerged speleothems were dated, indicating two U–Th ages of 29.16 ± 0.17 and 26.04 ± 0.18 ka BP and one radiocarbon age of 18.64 ± 0.12 ka BP, respectively. The investigated deep submerged speleothems therefore clearly determine the minimum onset and maximum termination times for LGM terms of sea level. The results show that LGM began at ~29 ka BP and ended at ~18.5 ka BP. This study therefore provides initial evidence for the use of deep speleothems to determine LGM sea levels and emphasizes the importance of deep submerged speleothems in the reconstruction of Pleistocene low sea levels.
Introduction
When global sea levels declined during past glacial epochs, speleothems might have deposited in air-filled coastal karst caves that were probably flooded by subsequent transgressions (e.g., Richards et al., 1994; Melim et al., 2001; Bard et al., 2002; Dorale et al., 2010; Moseley et al., 2015; De Waele et al., 2018; Dumitru et al., 2021; Steidle et al., 2021). Because elevations and absolute ages of speleothems can be accurately determined, they have significant potential for the determination of past maximum sea levels (Gascoyne et al., 1979; Richards et al., 1994; Bard et al., 2002; Dumitru et al., 2019). Though previous studies over four decades have thoroughly illustrated variable maximum sea levels using U–Th and U–Pb dating of speleothems in coastal caves (Harmon et al., 1978; Gascoyne et al., 1979; Bard et al., 2002; Dorale et al., 2010; Moseley et al., 2015; Dumitru et al., 2019), the deepest speleothems collected so far were from -54.9 m of a blue hole in South Andros Island (Richards et al., 1994). These speleothems are therefore unable to determine Pleistocene low sea levels, which were often over 100 m lower than they are at present (Richards et al., 1994; Lambeck and Chappell, 2001; Spratt and Lisiecki, 2016; Huybers et al., 2022). Therefore, deep submerged speleothems (-116 m) collected from the Sansha Yongle Blue Hole (SYBH) with reliable ages are useful for determining Last Glacial Maximum (LGM) low sea levels.
One of the most highlighted features of the LGM is its low sea level, which was ~120–130 m lower than it is today (Hanebuth et al., 2000; Yokoyama et al., 2001; Clark and Mix, 2002; Clark et al., 2009; Hanebuth et al., 2009; Lambeck et al., 2014; Yokoyama et al., 2018). The onset and termination of the LGM is of particular importance but poorly identified by field data. Mix et al. (2001) considered the LGM spanned 24–18 ka BP, whereas a slightly earlier epoch from 26 to 21 ka BP, depending on global sea level minima, was proposed as the LGM duration by another study (Peltier and Fairbanks, 2006). A 10-m sea level rise that started around 19.6 ka BP was thought to have terminated the LGM (Hanebuth et al., 2000; Yokoyama et al., 2001; Hanebuth et al., 2009). Clark et al. (2009) compiled 5,704 reliable global ice-sheet extent data and demonstrated that the LGM extended from 26.5 to 19.0 ka BP. Recently, however, two studies concluded that the LGM ended around 19.0 ka BP and began around 31–29 ka BP with a rapid ~40-m sea level falling over 2,000 years (Lambeck et al., 2014; Yokoyama et al., 2018). These discrepancies about LGM onset and termination suggest that it is imperative to find more evidence, especially from remote areas such as the South China Sea (SCS). In addition to the discrepancies, previous LGM low sea level proxies, such as corals and tidal flat sediments, usually exhibit large errors of up to 5–10 m, which could cause large uncertainties of LGM low sea levels (Dumitru et al., 2021). Speleothems and their phreatic overgrowths, deposited under air-filled conditions indicating maximum sea level, potentially provide more accurate sea level determination (van Hengstum et al., 2019).
In this study, we reported timing results from the deepest submerged speleothems so far collected from the Sansha Yongle Blue Hole (SYBH), Xisha Islands, SCS (Figure 1). SCS is far removed from the glacial isostatic effect (Peltier, 2004), and the Xisha Islands have been a tectonic stable marginal setting since the Last Interglacial (Ma et al., 2021; Yu et al., 2022); hence, this area is suitable for determining past sea levels. Our speleothems were dated using radiocarbon and 230Th–234U–238U methods. Based on the obtained ages, we determined the onset and termination of the LGM. This novel evidence suggests that deep submerged speleothems may be a promising fingerprint for Pleistocene low sea levels.
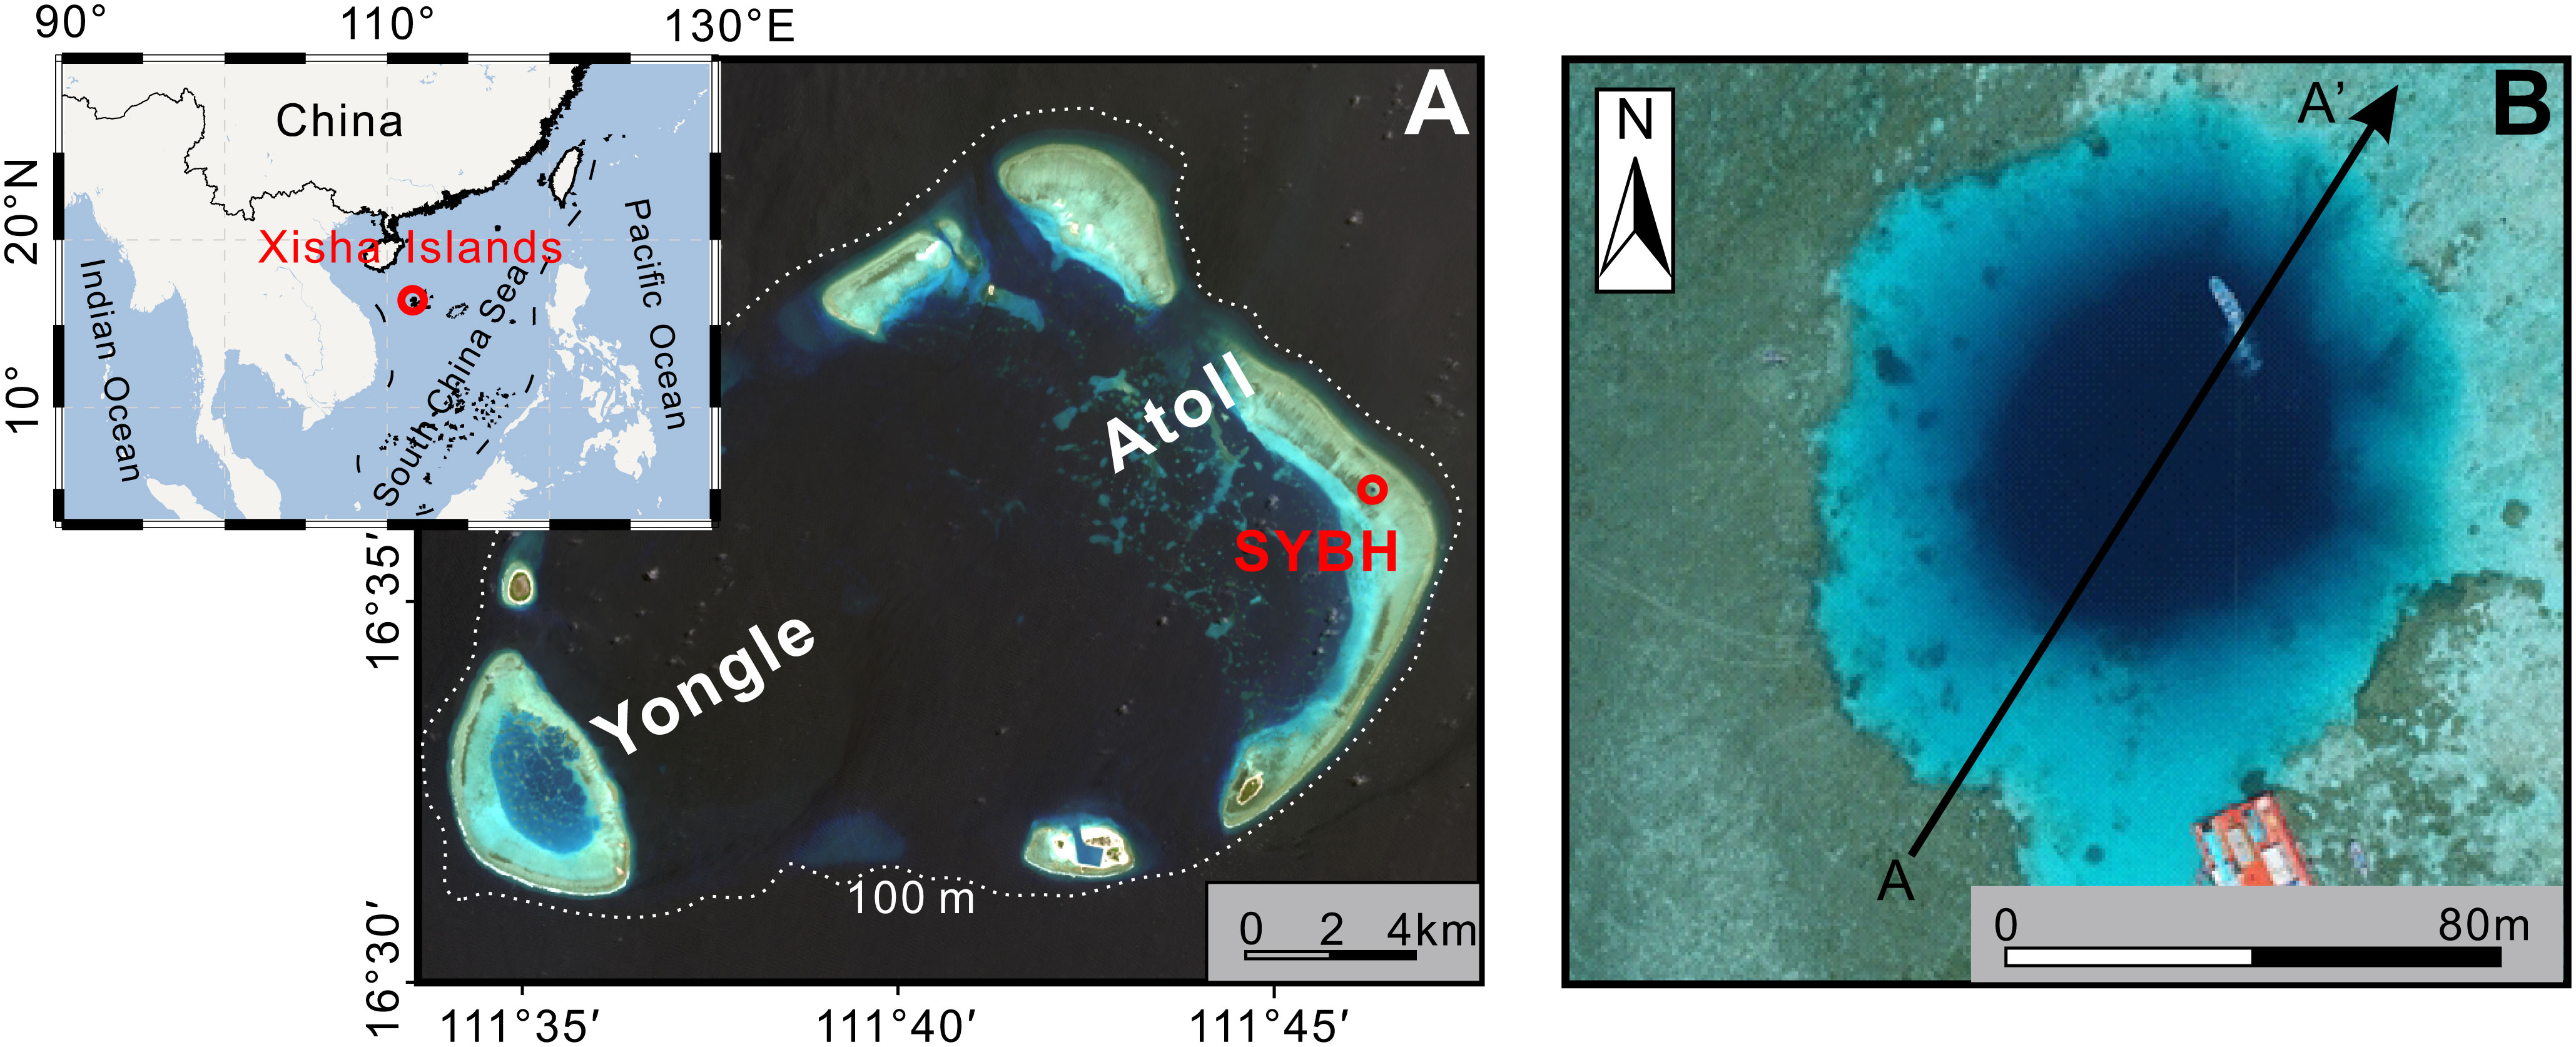
Figure 1 Location map (A) and aerial photography of Sansha Yongle Blue Hole (B) in Yongle Atoll, Xisha Islands, South China Sea. The A–A′ cross-section line in the right panel represents vertical profiles of Figure 2.
Regional setting
SYBH (latitude: 16°31′29″ N; longitude: 111°46′04″ E) is the deepest (-301.19 m) known coastal carbonate cave globally. This ocean blue hole is located in the eastern end of the Yongle Atoll (Figure 1A), which consists of highly porous carbonate corals and coralline algae bindstones that initially developed in the early Miocene (19.6 Ma) with a volcanic base belonging to the Xisha uplift (Jiang et al., 2019). Based on a lithological study of a CK-2 borehole from nearby Chenhang Island, the bottom of SYBH approximately matches with an interface of ~4.0 Ma (Fan et al., 2019). SYBH has a planform at the surface which is shaped like a comma, with a maximum width of 162.3 m (Figure 1B).
As shown in Figure 2, SYBH displays a fracture-guide hole pattern which is differentiated from other complex karst caves with branch-work caves (Mylroie et al., 1995; Li et al., 2018). SYBH exhibits four distinct and successive sections from top to bottom as caves I to IV, respectively (Figure 2B; Yu et al., 2022). Corals grow at the uppermost entrance of SYBH, whereas massive sediments and fallen rocks cover the lower hole (Figure 2A). For our study, fortunately, a ceiling (cave III) was observed at water depths between ~90 and 160 m on the northeastern inner wall. Irregular and popcorn-like cave coatings extensively cover the seaward ceiling between water depths of ~90 and 120 m (Figure 2A).
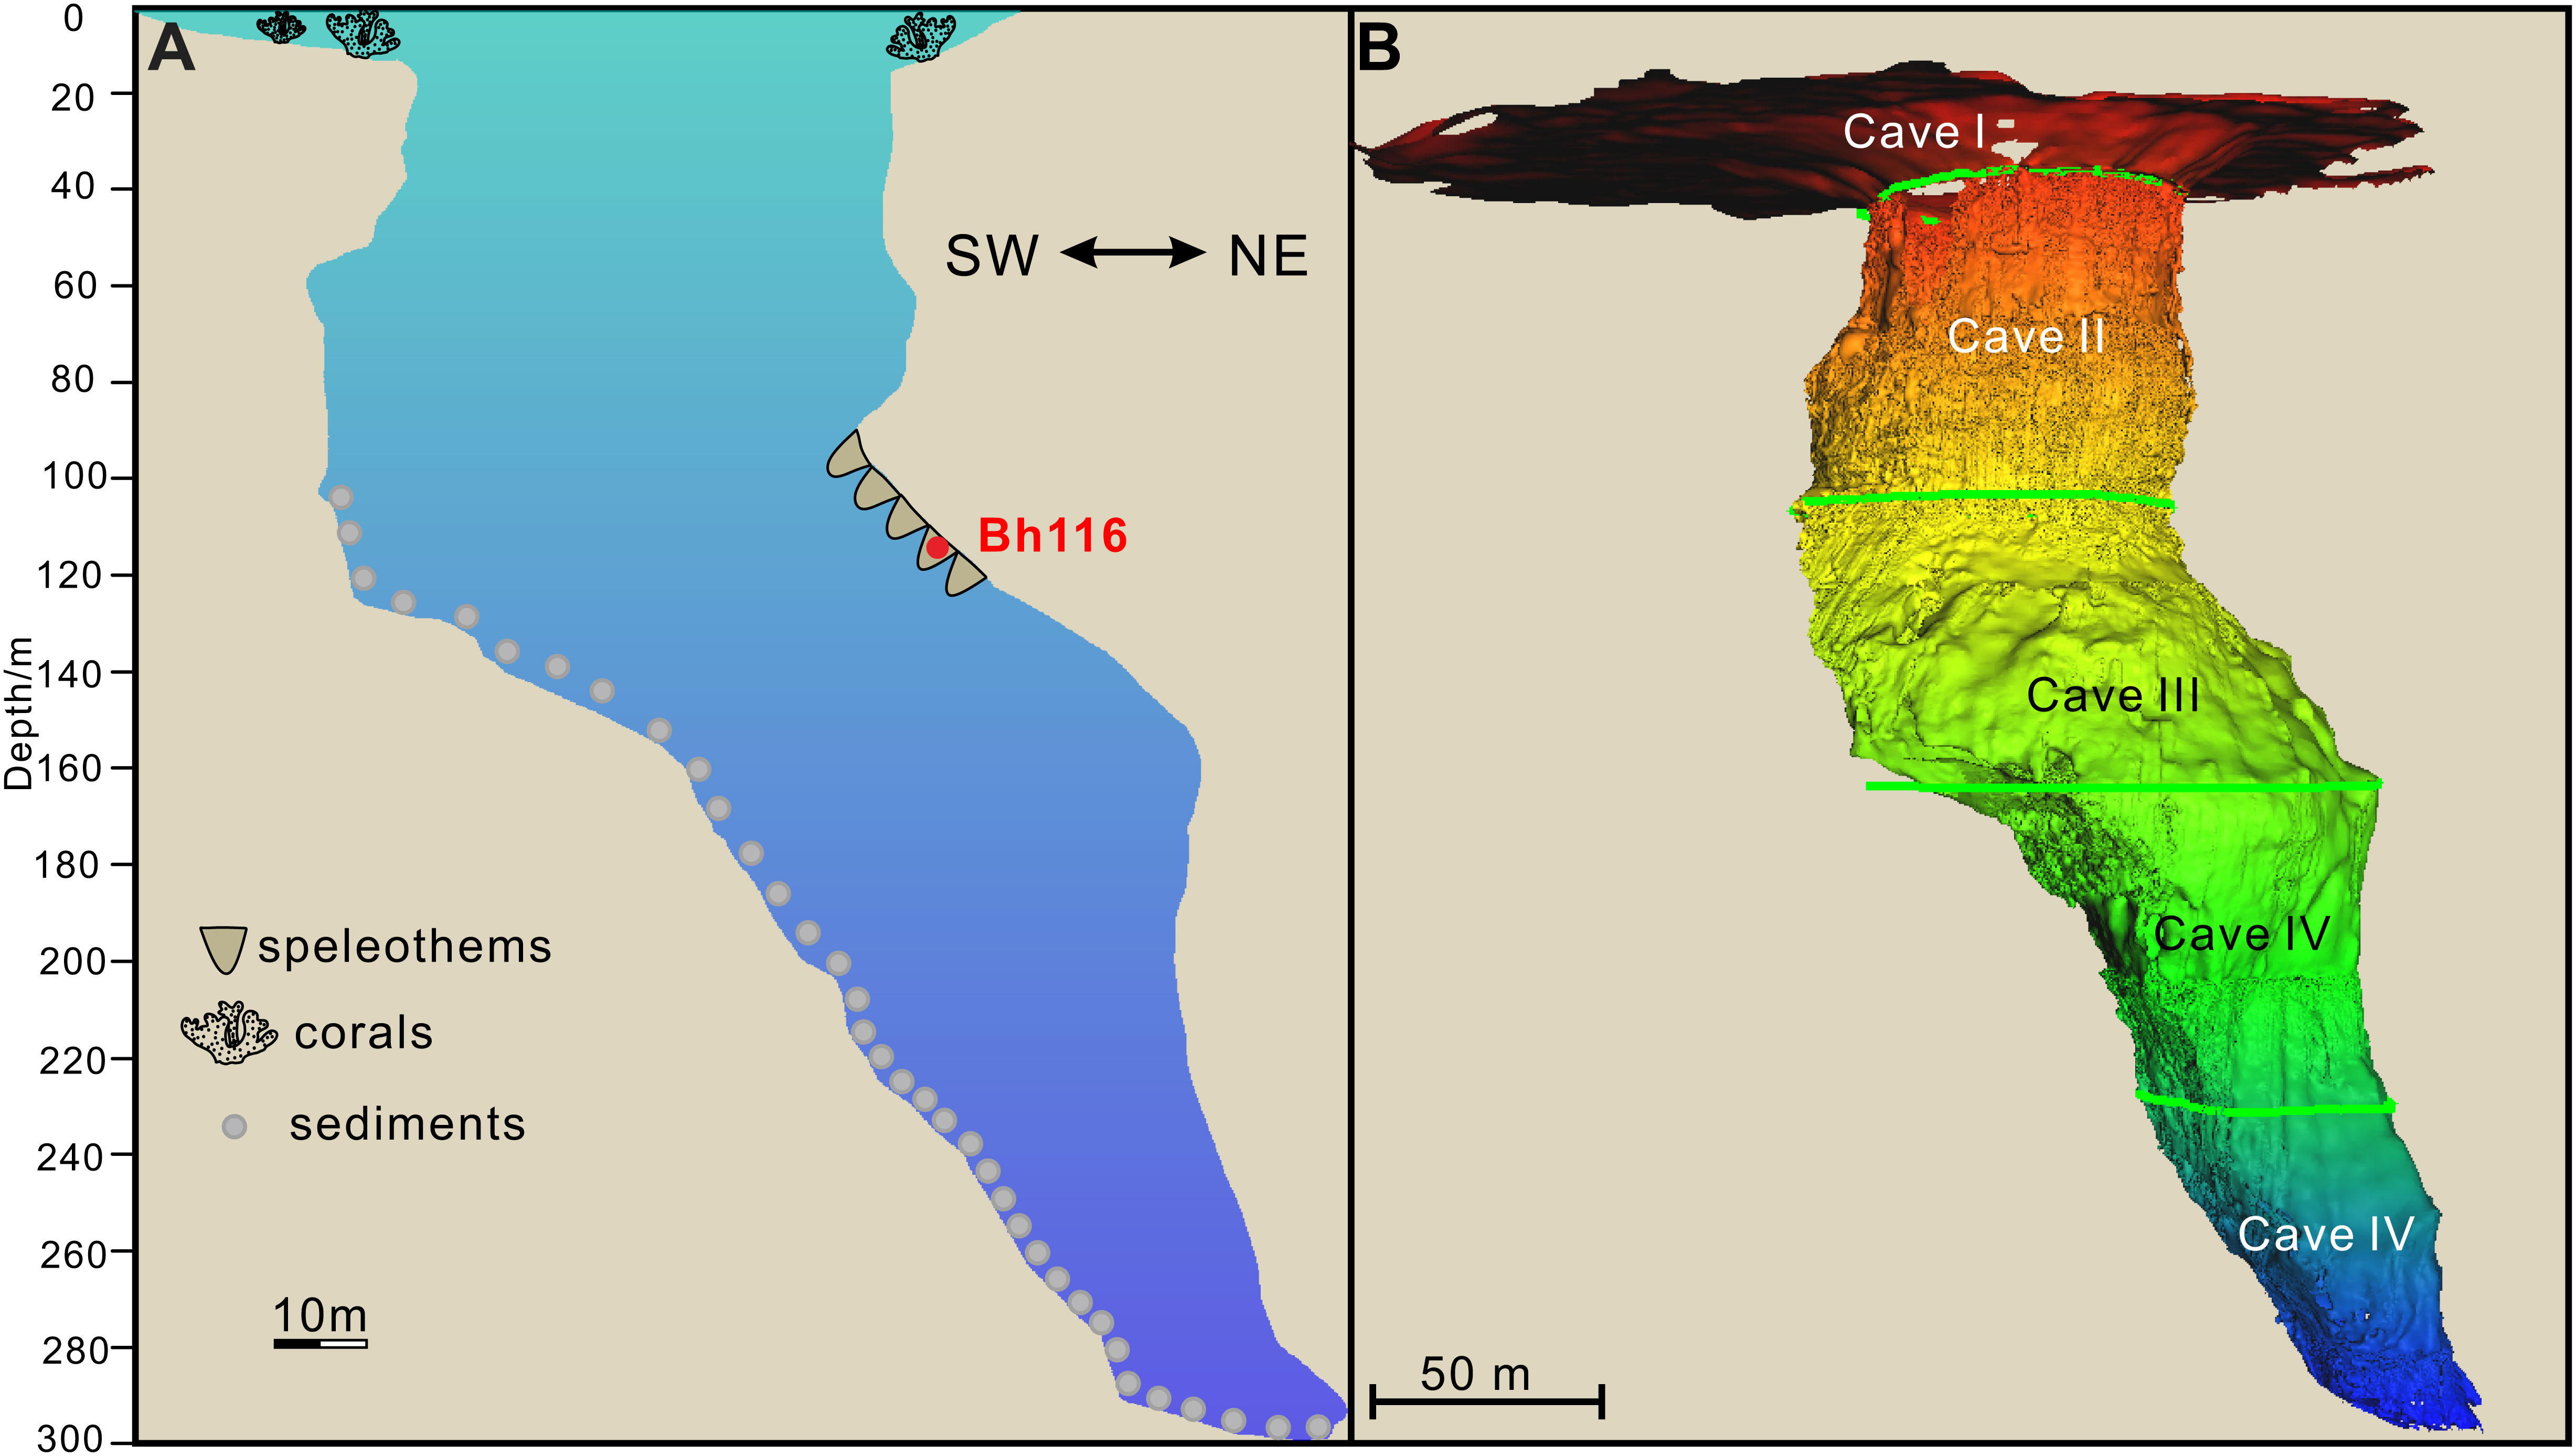
Figure 2 Cross-section (A) and 3-D topography (B) of Sansha Yongle Blue Hole.
Materials and methods
Sampling and site description
In total, 13 short rock cores (5 cm in diameter) with length < 30 cm were drilled from the SYBH during May and June 2017 using a miniature underwater drilling rig carried by the FCV2000D remotely operated vehicle (ROV; Yu et al., 2022). Three-dimensional morphology was reconstructed using an unmanned sea-robot ship equipped with a multibeam system above 15 m and a professional-grade ROV equipped with a multibeam system below 15 m (Li et al., 2018). In addition to morphology, a high-resolution underwater camera was carried by the ROV to gather more detailed knowledge. This study focuses on a short core (length: 26 cm; latitude: 16.52°; longitude: 111.77°) consisting of speleothems and substrates from the depth of 116-m (Bh116; Figure 3). In Bh116, the speleothems broke into small pieces during the drilling processes due to their weak cements. Therefore, the relative positions for these broken pieces could not be accurately reconstructed though we carefully protected them during the collection, transportation, and rinsing.
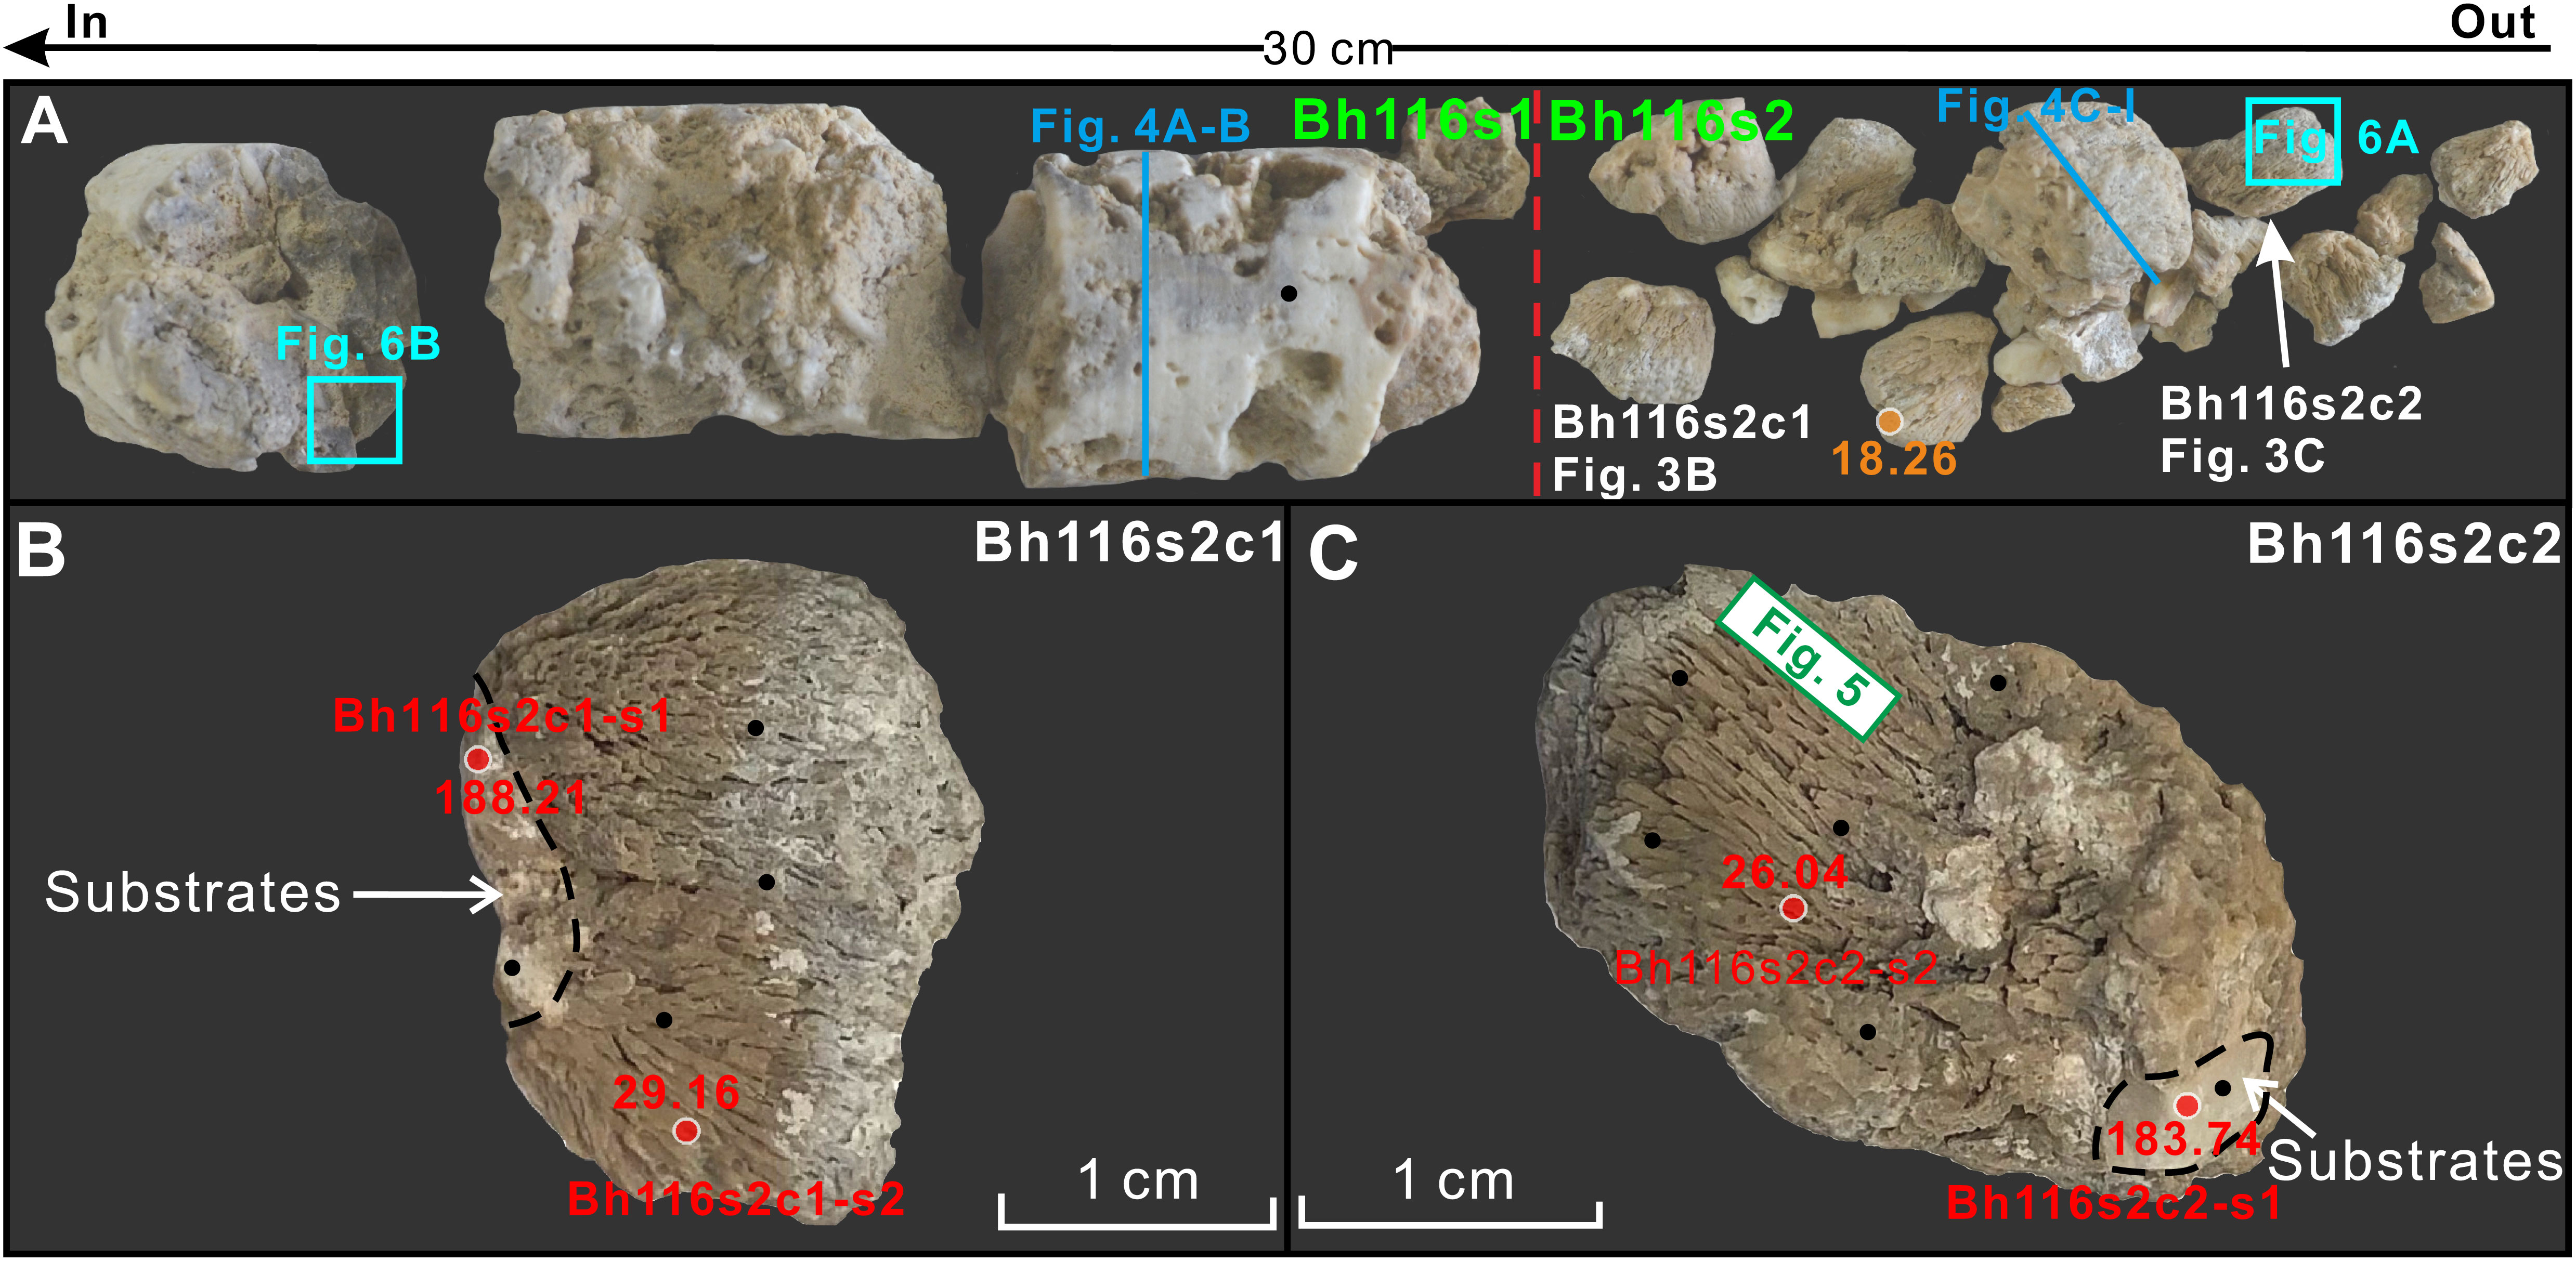
Figure 3 Photographs of sample Bh116 (A) and two subsamples (B, C) showing locations for thin section (blue lines;Figure 4), scanning electron microscopy (green rectangles; Figure 5), XRD (cyan rectangles; Figure 6), carbon and oxygen isotopes (black circles; Figure 7), U–Th dating (red circles; Table 1), and radiocarbon dating (orange circles; Table 1). The dotted red lines in (A) divide the core samples into substrates and speleothems, i.e., Bh116s1 and Bh116s2.
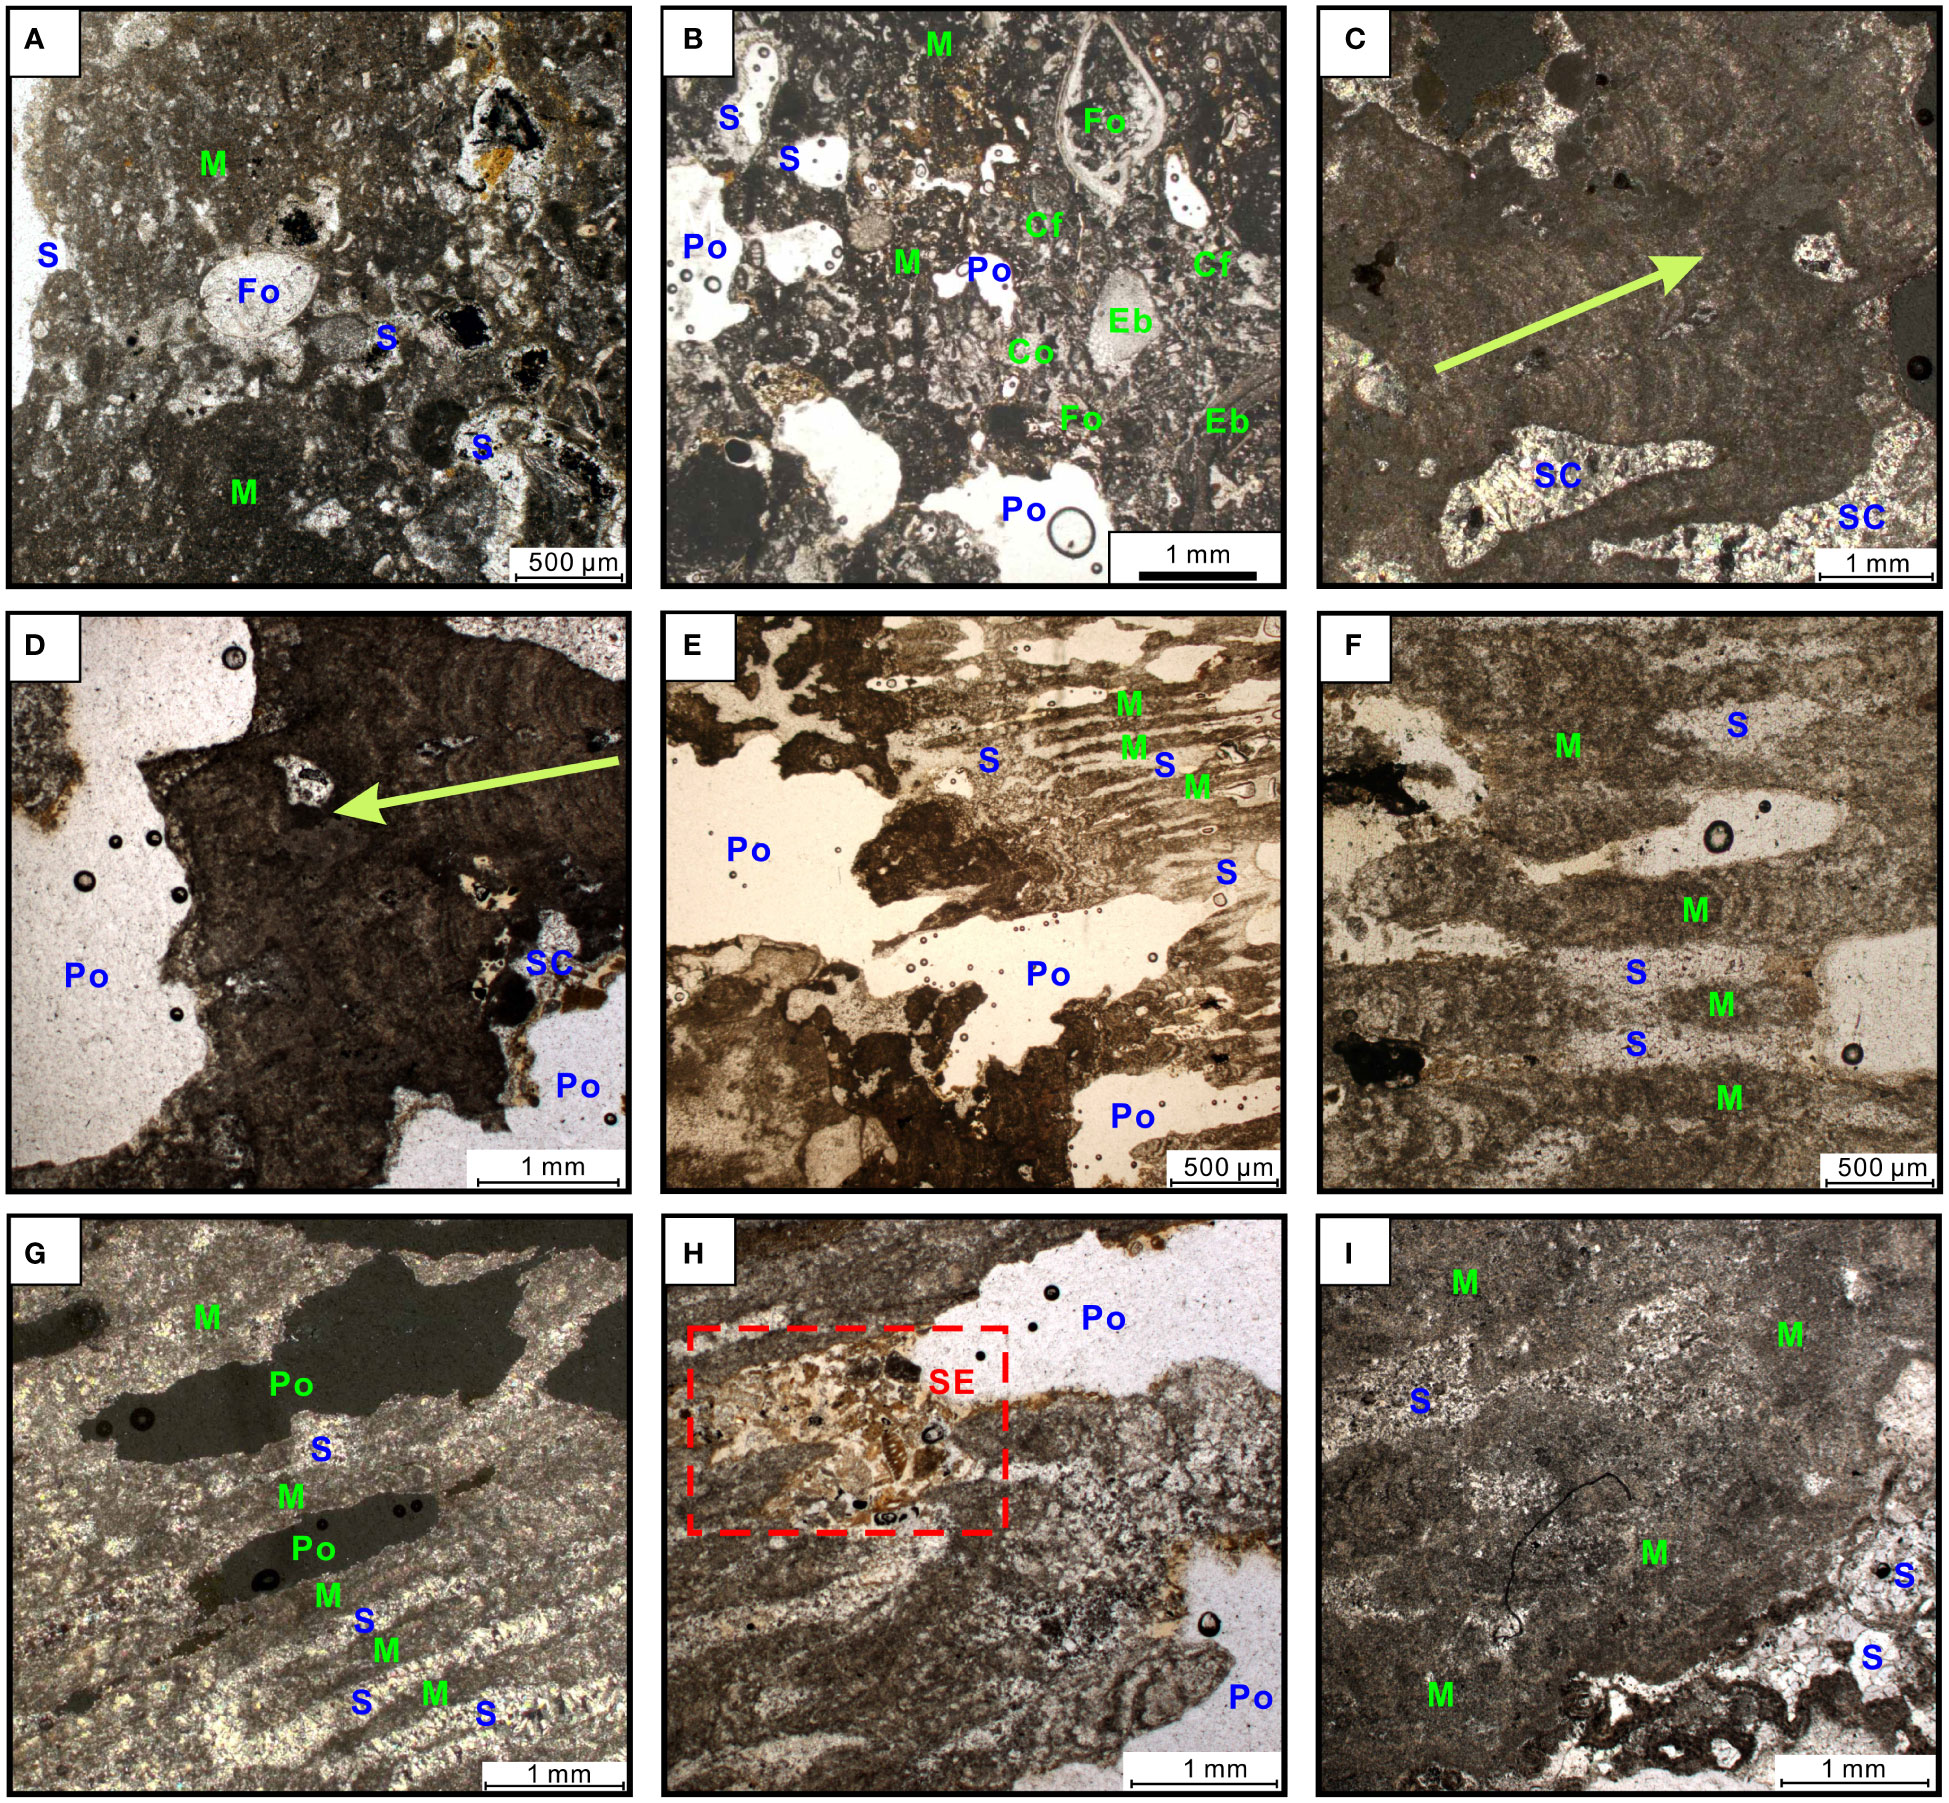
Figure 4 Thin-section micrographs of sample Bh116. (A, B) Micritic areas with sparite, foraminifera, echinoderm brachiopods, coral fragments, and pore structure in Bh116s1. (C, D) Laminated microcrystalline fabric structure with secondary cement and pores. The arrows show the growth direction. (E–G) Microcrystalline and sparite crystals alternating with fabric microporous calcite. (H, I) Sediments and sparite in the margin of the pores (see Figure 3 for the locations of the thin sections).
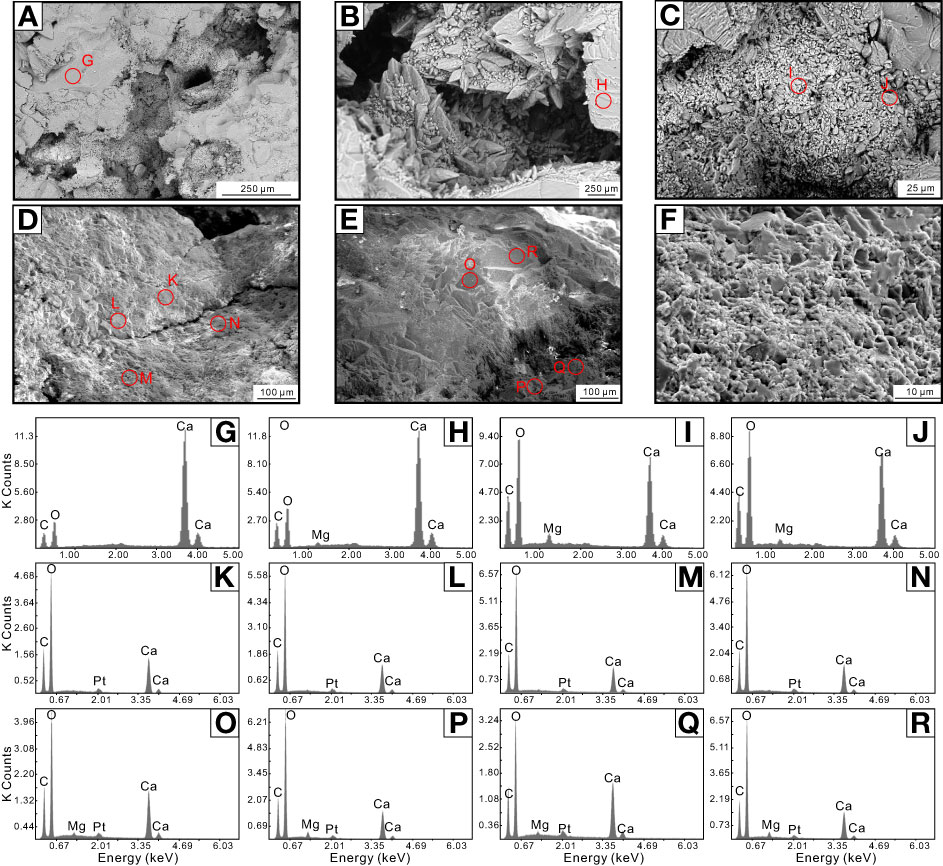
Figure 5 SEM images of calcareous speleothem samples (A–F) and geochemical composition (G–R). (A–C) Secondary cemented pores. (D, E) Calcite crystals are dissolved.
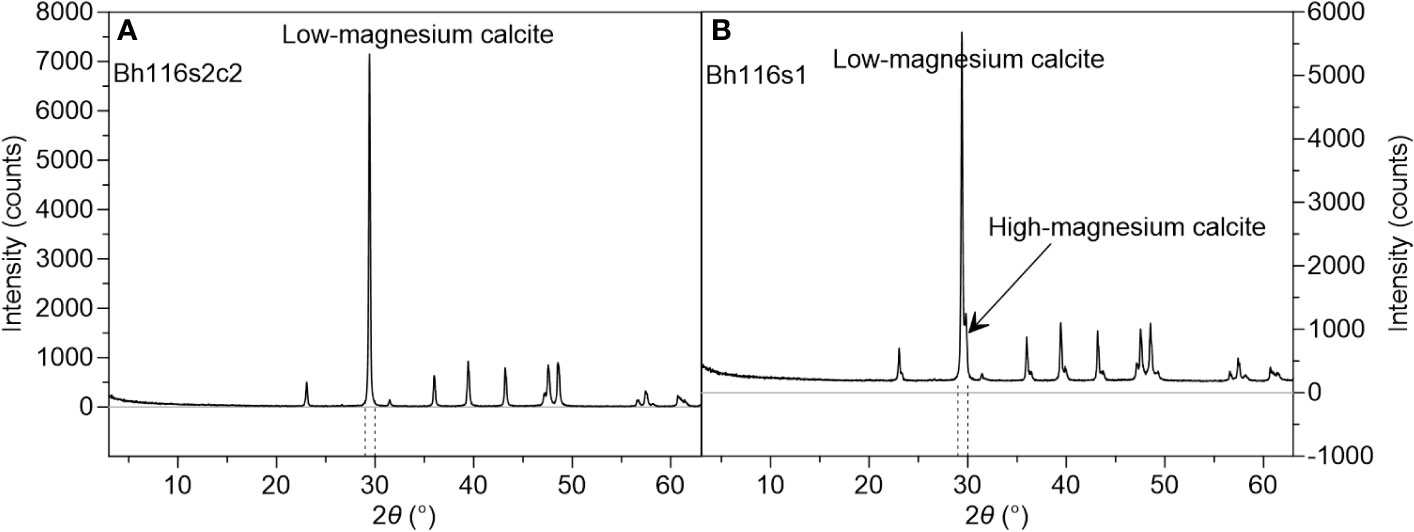
Figure 6 Characteristic spectrum of minerals low-Mg calcite (A) and high-Mg calcite (B) in Bh116.
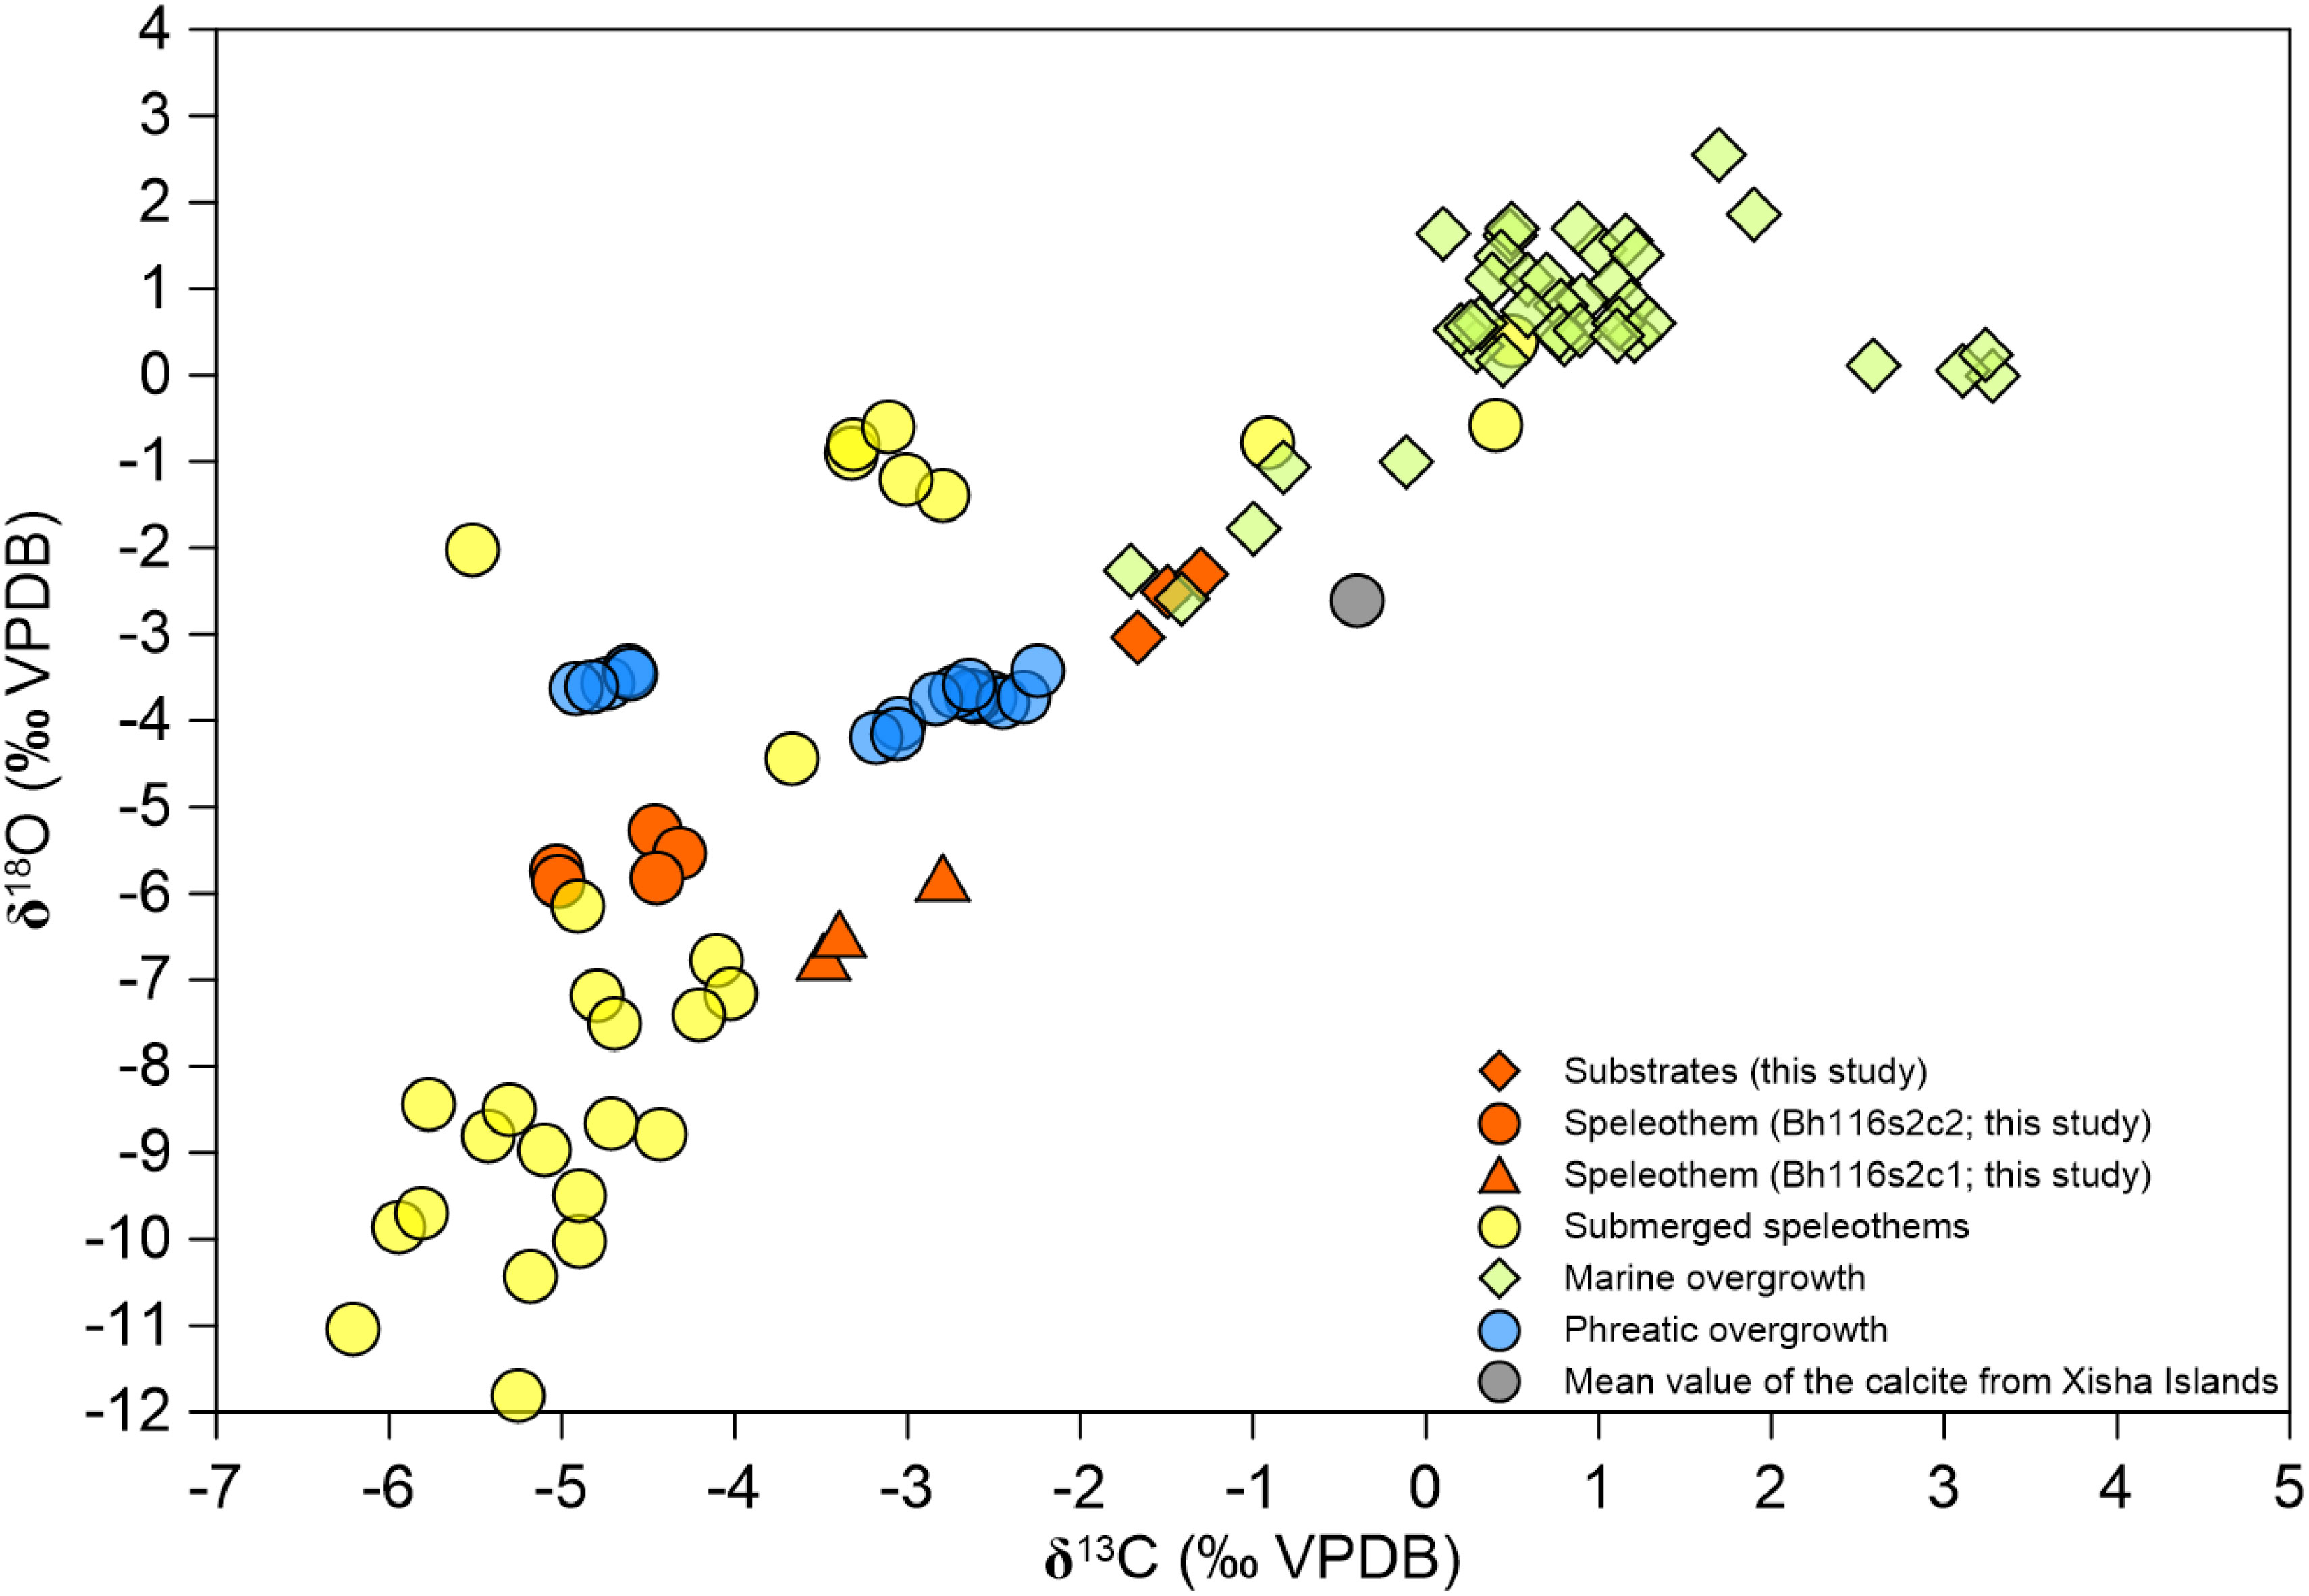
Figure 7 Stable carbon and oxygen isotopic composition of subsamples from coastal caves. Data of submerged speleothems, marine overgrowth, and phreatic overgrowth are from coastal caves of Belize, Eastern Adriatic Coast, and Mallorca (Surić et al., 2005; Tuccimei et al., 2010; Gischler et al., 2017). The mean values of the calcite from Xisha Islands are adopted from Bi et al. (2018).
Petrography
We rinsed the subsamples one by one to remove covered slurries contaminated during the drilling process and put them back to their original positions. Substrates and the largest speleothem subsample (Figure 3A) were sliced for petrographic investigation under polarization microscopy. Unfortunately, the largest speleothem subsample of Bh116 was broken and lost after thin section grinding. In order to remove possible contaminants, we rinsed the subsamples by ultrasonic cleaning in deionized water for 12 hours and repeated three times before subsequent geochemical analyses. Generally, no debris was observed after the third rinsing. For the high-resolution surface structure analysis of calcite, samples of freshly broken pieces were studied with Hitachi-SU8010 (Japan) at Guangzhou Institute of Geochemistry, Chinese Academy of Sciences (Guangzhou, China). Calcium, carbon, oxygen, and magnesium concentrations of microporous calcite were determined by SAPPHIRE EDAX detector and Apollo X-SDD detector, respectively.
Mineralogy and elemental analyses
The carbonate mineralogy was determined by X-ray diffraction measurements. Two subsamples (~2 g) were milled from cleaned carbonates (Figure 3A) using a stage-mounted dental drill fitted with silicon carbide dental blade and measured using a Rigaku D/max-rB Theta-theta X-ray powder diffractometer at the First Institute of Oceanology, Ministry of Natural Resources. Copper Kα radiation (40 kV, 100 mA) was used as an X-ray source. Samples were packed into a rectangle cavity in an aluminum holder and scanned in a step-scan mode (0.02°/step) over the angular range of 3° to 70° (2θ). The mineralogical compositions of samples were constructed using the 104 reflection of calcite with 2θ from 29.25° to 29.80°, the 111 reflection of aragonite with 2θ between 25.5° and 26.5°, and the 104 reflection of dolomite with 2θ from 30.58° to 31.28°. Usually, the calcite 104 reflection branches into two asymmetric peaks, of which both high-magnesium calcite and low-magnesium calcite co-exist (Kontoyannis and Vagenas, 2000; Csoma et al., 2006; Zhai et al., 2015).
For elemental analyses, four samples (~50 mg) were milled after having been repeatedly rinsed with carbonates using a stage-mounted dental drill fitted with tungsten carbide dental burs (Figure 3). Major elements, including Ca and Mg, were analyzed using an inductively coupled plasma optical emission spectrometer (ICP-OES), and minor elements were performed by inductively coupled plasma mass spectrometry (ICP-MS) at the First Institute of Oceanology, Ministry of Natural Resources. First, 50.00 mg carbonate powder was dissolved in 1.50 ml high-purity HNO3 and 1.50 ml high-purity HF in a digestion bottle with Teflon liner at 190°C for 48 h. Solutions in the Teflon liners were evaporated to dryness on a heating plate. Next, the samples were added with 3 ml of 7 N HNO3 and 0.5 ml Rh internal standard solution and heated at 150°C for 8 h. Finally, the samples were diluted to 50.00 g to be measured by ICP-OES (Icap6300, Thermo Fisher, USA). Exactly 10.00 g solutions were extracted from the 50.00 g solutions and diluted to 20.00 g to analyze by ICP-MS (X Series II, Thermo Fisher, USA). These four carbonate samples were measured together with 34 further carbonate samples from the SYBH. Up to three standard solutions and a laboratory blank were used to calculate the calibration curves for each element.
Stable carbon and oxygen isotopes
Stable carbon and oxygen isotopes were analyzed to discriminate the origins of deep submerged speleothems between seawater and air-filled conditions. Approximately ~10 mg carbonate powder was collected from 11 positions (Figure 3) and measured on a Thermo Scientific MAT-253 Plus mass spectrometer coupled with an online carbonate preparation device (Kiel-IV) in the Isotope Laboratory of the Xi’an Jiaotong University. Carbonates were reacted with anhydrous phosphoric acid at 75°C. Results are reported relative to the Vienna Pee Dee Belemnite standard. The analytical errors (1 σ) are ±0.06‰ and ±0.03‰ for δ18O and δ13C (Zhao et al., 2021), respectively.
U–Th and radiocarbon dating
As relative positions for speleothems could not be accurately determined, we chose three subsamples with substrates to determine the possible onset and termination time of speleothems (Figure 3). Approximately 100 mg of carbonate powder was collected from the speleothems (Figures 3B, C) using a stage-mounted dental drill fitted with tungsten carbide dental bur. The U and Th isotopes of these samples were determined by a plasma-sourced multi-collector mass spectrometer (MC-ICP-MS; Neptune-plus, Thermo-Finnigan) at the Isotope Laboratory of the Xi’an Jiaotong University. Chemistry procedures to separate U and Th followed Edwards et al. (1987). 229Th–233U–236U isotope dilution method was applied to correct for instrumental fractionation and to determine Th/U isotopic ratios and concentrations. U and Th isotopes were measured on a Mas-Com multiplier behind the retarding potential quadrupole in a peak-jumping mode. The instrumentation, standardization, and 230Th–234U half-lives were reported in Cheng et al. (2000); Cheng et al. (2013). Uncertainties in U/Th isotopic data, including corrections for blanks, multiplier dark noise, abundance sensitivity, and contents of the same nuclides in spike solution, were calculated offline at 2σ level (Cheng et al., 2013).
In addition to U–Th ages, one radiocarbon dating (Figure 3A) was determined by accelerator mass spectrometry at Beta Analytic, Inc. (Miami, USA) to provide additional geochronological identification. This radiocarbon date (Table 1) was subsequently calibrated to the calendar age using the recently published IntCal20 curve (Reimer et al., 2020).
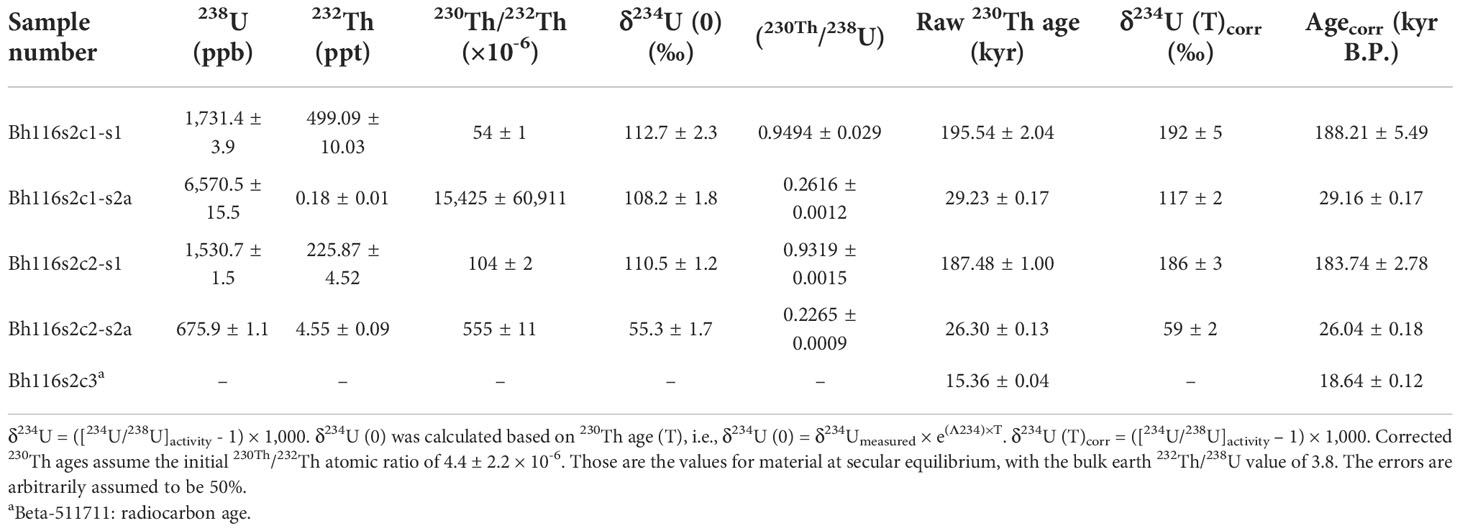
Table 1 U-series and radiocarbon ages of sample Bh116 from Sansha Yongle Blue Hole.
Results
Morphology and distribution of speleothems in SYBH
The morphologic features of SYBH, interpreted from 3-D topography data (Figure 2B) and underwater photographs (Figure 8), provide meso-to-micro scale surface evidence to trace the deep submerged speleothems. The 3-D topography reveals a downward ceiling from -90 to -160 m along seaside walls (Figure 2). Irregular and popcorn-like cave coatings extensively cover the ceiling between -90 and -120 m (Figure 8). These coating-like speleothems presented in SYBH are small with centimeter dimensions. They prefer to cluster as a cauliflower-like shapes with downward growth direction from their substrates (Figures 8B, C). Most coatings, if not all, display a gravity-fed downward direction (Figure 8), which probably suggests that these speleothems were formed through slow water dripping in air-filled conditions (Bian et al., 2019).
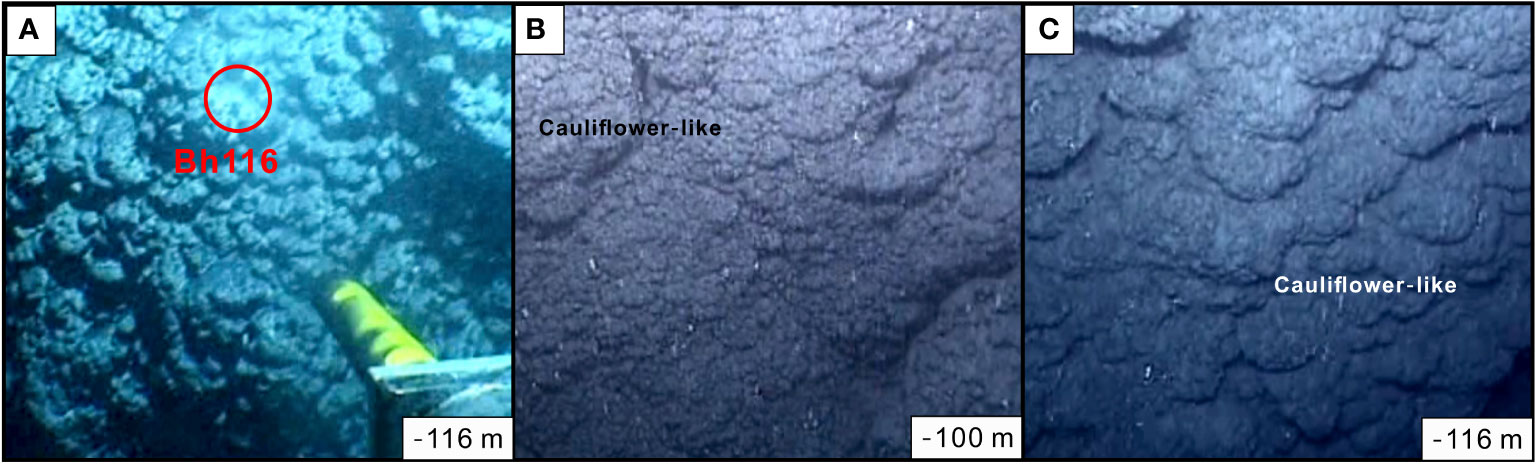
Figure 8 Underwater photographs of deep submerged speleothems from Sansha Yongle Blue Hole with water depths of ~116 (A), ~100 (B), and ~116 m (C). The red circle in the left panel indicates the location of Bh116. Speleothems cluster as cauliflower-like coatings (B, C).
Petrology and geochemistry
Petrographic investigations show the textures and fabrics of Bh116 including substrates and speleothems (Figures 3, 4). The inside substrates and outside speleothems can be identified by the naked eye depending on their distinct structures (Figure 3A). The obtained substrates (Bh116s1) are composed of gray and gray-white broken limestone characterized by loose, yellow, fine sediments. The speleothems (Bh116s2), however, consist of popcorn-like precipitates characterized by column fibers (Figures 3B, C). A thin section of the substrates shows that Bh116s1 consists of lagoonal sand with biologic debris consisting of coral fragments, foraminifers, echinoderms, and brachiopods (Figures 4A, B), reflecting a lagoon slope depositional environment, which corresponds to that found by Fan et al. (2019). While the speleothems are characterized by more complex textures (Figures 4C–I), they contain two recognizable fabrics: laminated microcrystalline fabric (Figures 4B–D) and microcrystalline and sparite crystals alternating with fabric microporous calcite (Figures 4E–H). Both of these two structures are highly porous, some of which have been cemented by sparite crystal precipitates (Figure 4C). Moreover, the laminated microcrystalline fabric calcites are surrounded by sparite crystal precipitates with dark terminations (Figures 4C, D) (Csoma et al., 2006; Bontognali et al., 2016; De Waele et al., 2018). In addition, brownish fine sediments and broken marine shells are observed at the margin of pores (Figure 4H). The SEM images show secondary calcite crystals (Figures 5A–C), dissolution points, and edges of calcites (Figures 5D–F). The secondary calcite crystals show an inner-core growth direction (Figures 5B, C), probably indicating the cements re-precipitated from the surrounding dissolved calcites (Tuccimei et al., 2010; Bontognali et al., 2016; De Waele et al., 2018). The geochemical compositions of surrounding calcites and cements are relatively homogeneous, in which MgCO3 varied between 5% and 20% (Figures 5G–R). The presence of Mg in the deep submerged speleothems is also confirmed by the existence of high-magnesium calcite from bulk sample analysis (Figure 6). Based on XRD, the substrates of Bh116 consist entirely of low-magnesium calcite (Figure 6A), while ~85% low-magnesium calcite and ~15% high-magnesium calcite constitute the speleothems in Bh116 (Figure 6B).
Both carbon and oxygen isotope values of speleothems and substrates are negative in the Bh116 (Figure 7). The speleothems exhibit isotopically depleted values with respect to the substrates in both 18O and 13C. In addition, the oxygen and carbon isotope ratios of the speleothems from different subsamples are variable, and the outer one (Bh116s2c2) is more depleted in 13C and slightly enriched in 18O with respect to those of the internal subsample (Bh116s2c1).
Dating
The 232Th concentrations of substrates in two subsamples are 499.09 and 225.87 ppt (Table 1). In contrast, the 232Th concentrations of speleothems are 0.18 and 4.55 ppt, which are much lower than the substrates. The 238U concentrations of speleothems are variable with concentrations of 6570.5 and 675.9 ppb. The U–Th ages of substrates are 188.21 ± 5.49 and 183.74 ± 2.78 ka BP, suggesting that they may have experienced deposition and secondary alterations and are not suitable for U–Th dating. The substrates are expected to have been deposited at about 1.4 Ma based on the depth of nearby borehole CK-2 (Fan et al., 2019). The U–Th ages of the speleothems, Bh116s2c1 and Bh116s2c2, are 29.16 ± 0.17 and 26.04 ± 0.18 ka BP, respectively (Figure 3 and Table 1). The radiocarbon age of a subsample of speleothems (Bh116s2c3) is 18.64 ± 0.12 ka BP.
Discussion
Aerial growth of speleothems
It is evident that deep submerged calcite coatings in SYBH are speleothems that precipitated under air-filled conditions during sea level lowstands. Substances of marine origin, including marine overgrowth on speleothems and marine substrates, are excluded for their negative carbon and oxygen isotopes with values as low as -6.7‰ to -5.3‰ and -5.0‰ to -2.8‰ (Figure 7), respectively. These isotopic features differ from the marine overgrowth on speleothem, marine corals, and substrates but are close to subaerial speleothems collected from other coastal caves (Surić et al., 2005; Tuccimei et al., 2010; Gischler et al., 2017). This suggests that the deep submerged calcite coatings developed in SYBH grew under aerial conditions and can be used to determine maximum sea levels (Richards et al., 1994). The calcareous coatings resemble mushroom-shaped speleothems and phreatic overgrowths on speleothems and are porous (Tuccimei et al., 2010; Bontognali et al., 2016; De Waele et al., 2018), probably suggesting that they exhibit the same aerial origin.
Determination of LGM low sea levels
As our deep submerged speleothems initially grew at ~29 ka under the air-filled vadose environment through calcite precipitation in coastal karst cave (Fairchild et al., 2006; Tuccimei et al., 2010; De Waele et al., 2018), the maximum sea level at ~29 ka BP should be lower than -116 m relative to the present. Our results agree well with previous data (Figure 9A) from Barbados (Bard et al., 1990; Peltier and Fairbanks, 2006) and Bonaparte (Yokoyama et al., 2000), as well as the reconstructed global ice volume equivalent (Figure 9B) and mean sea levels (Figure 9C) (Lambeck et al., 2014; Yokoyama et al., 2018). Lambeck et al. (2014) documented a ~40-m sea level falling around ~31–29 ka BP according to compiled data. Our results confirm that this rapid fall in sea level reached as low as -116 m at ~29 ka BP, and LGM was initiated at ~29 ka BP. It is noted that the sea level data from Bonaparte, indicating the onset of LGM (Yokoyama et al., 2000), have large uncertainties of up to 7.8 m. Our data also refined large sea level errors.
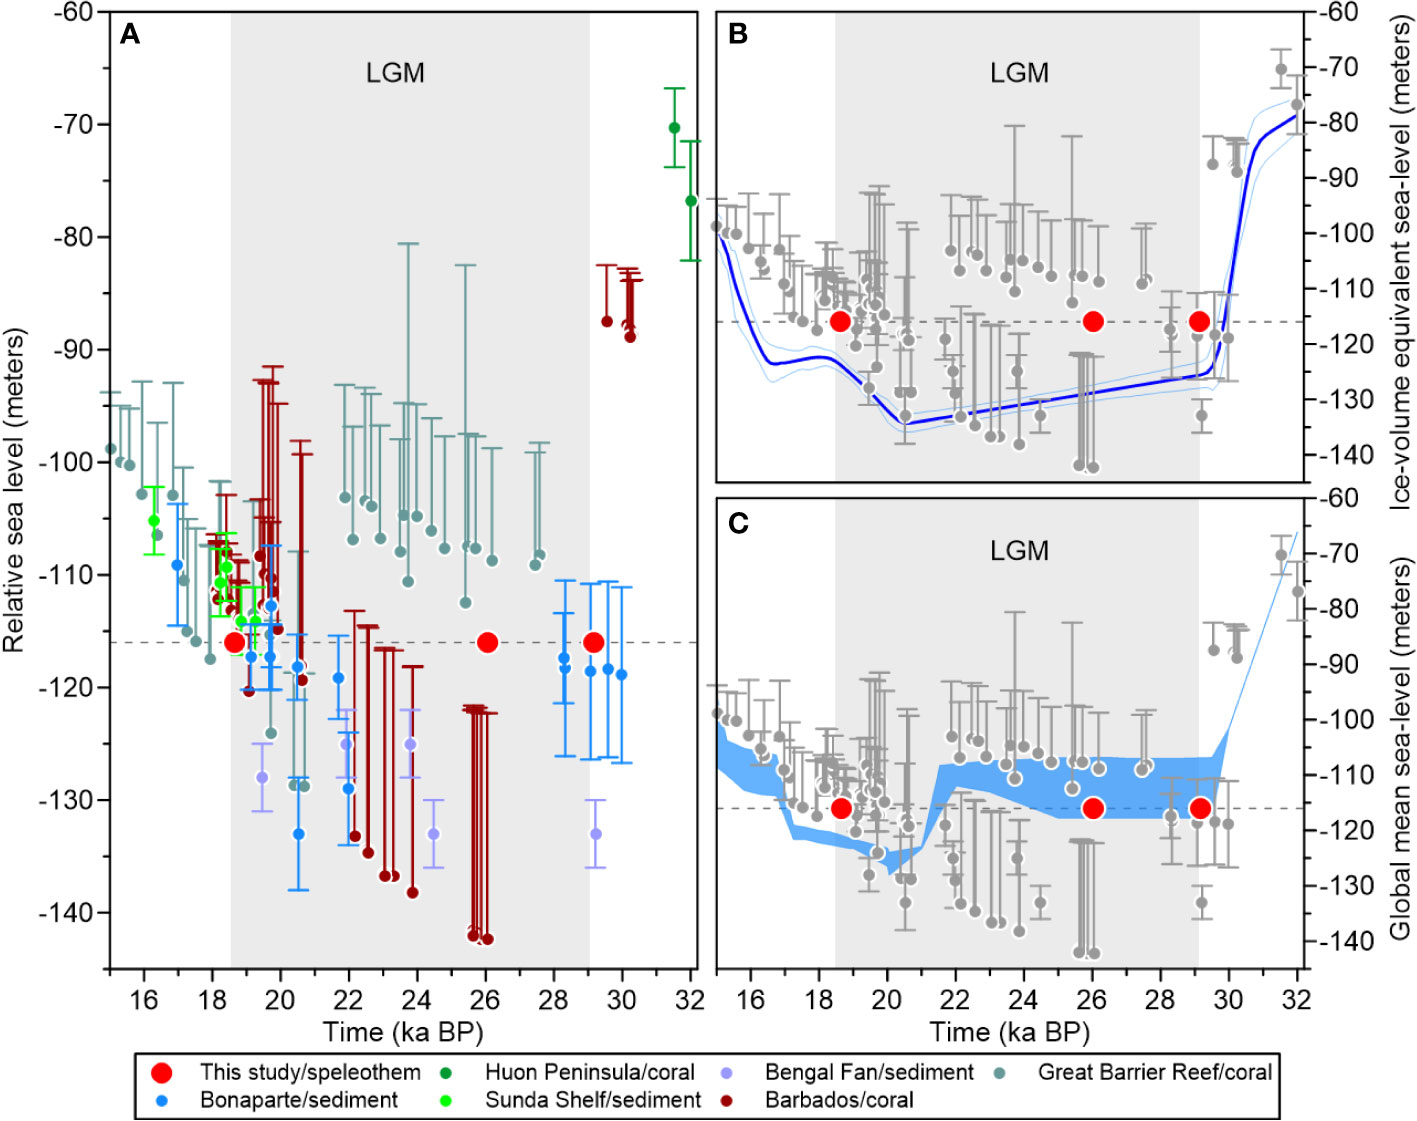
Figure 9 Last Glacial Maximum (LGM) sea levels with observational data and ice volume equivalent and global mean sea levels. (A) Previously documented LGM sea level data from Bonaparte Gulf (Yokoyama et al., 2000; De Deckker and Yokoyama, 2009), Huon Peninsula (Yokoyama et al., 2001), Sunda Shelf (Hanebuth et al., 2000; Hanebuth et al., 2009), Bengal Fan (Wiedicke et al., 1999), Barbados (Bard et al., 1990; Peltier and Fairbanks, 2006), and Great Barrier Reef (Yokoyama et al., 2018). (B, C) Previously constructed ice volume equivalent (Lambeck et al., 2014) and global mean sea levels (Yokoyama et al., 2018).
The LGM was thought to have been terminated by a rise in sea level (Hanebuth et al., 2000; Yokoyama et al., 2000). It began at ~19 ka BP, and the sea level rose 10–15 m within 500 years based on the interpretation of mangrove muds from the Sunda Shelf and Bonaparte Gulf in which tectonics are stable (Figure 9A). Recently, however, both Lambeck et al. (2014) and Yokoyama et al. (2018) demonstrated that this 10–15-m sea level rise was slower and lasted for ~3,000 years from 21 to 18 ka BP (Figures 9B, C). The possible termination of the speleothems from the SYBH with a radiocarbon age of 18.64 ± 0.12 ka BP suggests that the sea level was lower than -116 m at ~18.5 ka BP. Our results agree well with those sea levels reconstructed from Sunda Shelf and Bonaparte Gulf within errors and suggest that the termination of LGM is slightly later than the previous estimation (Figure 9A). However, our obtained results are inconsistent with the data reported from Barbados and the Great Barrier Reef, which experienced a rapid tectonic uplift of up to 0.34 mm/year (Fairbanks, 1989). The divergence in the conclusions regarding the termination of the LGM based on by sea level data from the SYBH, Bonaparte Gulf (Yokoyama et al., 2000; De Deckker and Yokoyama, 2009), and Sunda Shelf (Hanebuth et al., 2000; Hanebuth et al., 2009), as well as those determined from Barbados (Bard et al., 1990; Peltier and Fairbanks, 2006) and the Great Barrier Reef (Yokoyama et al., 2018), could be due to diverse and aged carbon, local carbon reservoir effects, and contaminated cement (Nakada et al., 2016), as they were determined from different materials (Hanebuth et al., 2000; Yokoyama et al., 2000). In addition, we confirm that the presence of old carbon was not significant in our samples and would not affect our results. Conversely, subsequent cement observed in thin sections from our obtained submerged speleothems may cause the measured radiocarbon age to be less than its actual value. In addition, our results coincide with the constructed ice volume equivalent and global mean sea level, suggesting that the deep submerged speleothems may be a promising way to determine Pleistocene low sea levels.
Conclusions
This study used U–Th and radiocarbon ages of deep submerged speleothems (-116 m) from SYBH to determine low LGM sea levels. Our results show that the deep speleothems grew at 29.16 ± 0.17 ka BP and were submerged at <18.64 ± 0.12 ka BP under air-filled conditions above sea level. The initial age of the speleothems indicates onset of the LGM at ~29 ka BP, and the obtained radiocarbon age indicates the termination of LGM at ~18.5 ka BP. As elevations and ages can be accurately identified, deep submerged speleothems may be a promising way to determine Pleistocene low sea levels.
Data availability statement
The datasets presented in this study can be found in online repositories. The names of the repository/repositories and accession number(s) can be found below: https://doi.org/10.6084/m9.figshare.13379504.v1.
Author contributions
TL conceived this study. TL, AF, YL, and DG designed this study. XY, BD, and JZ carried out the laboratory measurements. XY wrote the original manuscript. TL, BD, and JZ reviewed and edited the manuscript. All authors contributed to the article and approved the submitted version.
Funding
This study was funded jointly by the National Natural Science Foundation of China (grant nos. T2192951 and U1906211) and the Taishan Scholars Project Funding (grant no. ts20190963).
Acknowledgments
We would like to thank Prof. David Richards from the University of Bristol for his constructive comments to improve this manuscript.
Conflict of interest
The authors declare that the research was conducted in the absence of any commercial or financial relationships that could be construed as a potential conflict of interest.
Publisher’s note
All claims expressed in this article are solely those of the authors and do not necessarily represent those of their affiliated organizations, or those of the publisher, the editors and the reviewers. Any product that may be evaluated in this article, or claim that may be made by its manufacturer, is not guaranteed or endorsed by the publisher.
References
Bard E., Antonioli F., Silenzi S. (2002). Sea-Level during the penultimate interglacial period based on a submerged stalagmite from argentarola cave (Italy). Earth Planet. Sci. Lett. 196, 135–146. doi: 10.1016/S0012-821X(01)00600-8
Bard E., Hamelin B., Fairbanks R. (1990). U-Th Ages obtained by mass spectrometry in corals from Barbados: Sea level during the past 130,000 years. Nature 346, 456–458. doi: 10.1038/346456a0
Bian F., Coleborn K., Flemons I., Baker A., Treble P. C., Hughes C. E., et al. (2019). Hydrological and geochemical responses of fire in a shallow cave system. Sci. Total Environ. 662, 180–191. doi: 10.1016/j.scitotenv.2019.01.102
Bi D., Zhai S., Zhang D., Liu X., Liu X., Jiang L., et al. (2018). Constraints of Fluid Inclusions and CO Isotopic compositions on the origin of the dolomites in the Xisha Islands, south China Sea. Chem. Geol. 493, 504–517. doi: 10.1016/j.chemgeo.2018.07.005
Bontognali T. R. R., D'angeli I. M., Tisato N., Vasconcelos C., Bernasconi S. M., Gonzales E. R. G., et al. (2016). Mushroom speleothems: Stromatolites that formed in the absence of phototrophs. Front. Earth Sci. 4 (49), 1–8. doi: 10.3389/feart.2016.00049
Cheng H., Edwards R. L., Hoff J., Gallup C. D., Richards D. A., Asmerom Y. (2000). The half-lives of uranium-234 and thorium-230. Chem. Geol. 169, 17–33. doi: 10.1016/S0009-2541(99)00157-6
Cheng H., Edwards R. L., Shen C. C., Polyak V. J., Asmerom Y., Woodhead J., et al. (2013). Improvements in 230Th dating, 230Th and 234U half-life values, and U–Th isotopic measurements by multi-collector inductively coupled plasma mass spectrometry. Earth Planet. Sci. Lett. 371-372, 82–91. doi: 10.1016/j.epsl.2013.04.006
Clark P. U., Dyke A. S., Shakun J. D., Carlson A. E., Clark J., Wohlfarth B., et al. (2009). The last glacial maximum. Science 325, 710–714. doi: 10.1126/science.1172873
Clark P. U., Mix A. C. (2002). Ice sheets and Sea level of the last glacial maximum. Quat. Sci. Rev. 21, 1–7. doi: 10.1016/S0277-3791(01)00118-4
Csoma A. E., Goldstein R. H., Pomar L. (2006). Pleistocene speleothems of mallorca: Implications for palaeoclimate and carbonate diagenesis in mixing zones. Sedimentology 53, 213–236. doi: 10.1111/j.1365-3091.2005.00759.x
De Deckker P., Yokoyama Y. (2009). Micropalaeontological evidence for late quaternary Sea-level changes in Bonaparte gulf, Australia. Glob. Planet Change 66, 85–92. doi: 10.1016/j.gloplacha.2008.03.012
De Waele J., D'angeli I. M., Bontognali T., Tuccimei P., Scholz D., Jochum K. P., et al. (2018). Speleothems in a north Cuban cave register Sea-level changes and pleistocene uplift rates. Earth Surf Proc. Land 43, 2313–2326. doi: 10.1002/esp.4393
Dorale J. A., Onac B. P., Fornós J. J., Ginés J., Ginés A., Tuccimei P., et al. (2010). Sea-Level highstand 81,000 years ago in mallorca. Science 327, 860. doi: 10.1126/science.1181725
Dumitru O. A., Austermann J., Polyak V. J., Fornós J. J., Asmerom Y., Ginés J., et al. (2019). Constraints on global mean Sea level during pliocene warmth. Nature 574, 233–236. doi: 10.1038/s41586-019-1543-2
Dumitru O. A., Polyak V. J., Asmerom Y., Onac B. P. (2021). Last interglacial Sea-level history from speleothems: A global standardized database. Earth Syst. Sci. Data 13, 2077–2094. doi: 10.5194/essd-13-2077-2021
Edwards R. L., Chen J. H., Wasserburg G. J. (1987). 238U-234U-230Th-232Th systematics and the precise measurement of time over the past 500,000 years. Earth Planet. Sci. Lett. 81, 175–192. doi: 10.1016/0012-821X(87)90154-3
Fairbanks R. G. (1989). A 17,000-year glacio-eustatic Sea level record: Influence of glacial melting rates on the younger dryas event and deep-ocean circulation. Nature 324, 637–642. doi: 10.1038/342637a0
Fairchild I. J., Smith C. L., Baker A., Fuller L., Spötl C., Mattey D., et al. (2006). Modification and preservation of environmental signals in speleothems. Earth Sci. Rev. 75, 105–153. doi: 10.1016/j.earscirev.2005.08.003
Fan T., Yu K., Zhao J., Jiang W., Xu S., Zhang Y., et al. (2019). Strontium isotope stratigraphy and paleomagnetic age constraints on the evolution history of coral reef islands, northern south China Sea. Geol. Soc Am. Bull. 132 (3-4), 803–816. doi: 10.1130/B35088.1
Gascoyne M., Benjamin G., Schwarcz H., Ford D. (1979). Sea-Level lowering during the illinoian glaciation: Evidence from a bahama" blue hole". Science 205, 806–808. doi: 10.1126/science.205.4408.806
Gischler E., Birgel D., Brunner B., Eisenhauer A., Meyer G., Buhre S., et al. (2017). A giant underwater, encrusted stalactite from the blue hole, lighthouse reef, Belize, revisited: A complex history of biologically induced carbonate accretion under changing meteoric and marine conditions. J. Sediment. Res. 87, 1260–1284. doi: 10.2110/jsr.2017.72
Hanebuth T. J. J., Stattegger K., Bojanowski A. (2009). Termination of the last glacial maximum Sea-level lowstand: The sunda-shelf data revisited. Global Planet. Change 66, 76–84. doi: 10.1016/j.gloplacha.2008.03.011
Hanebuth T., Stattegger K., Grootes P. M. (2000). Rapid flooding of the sunda shelf: a late-glacial sea-level record. Science 288, 1033–1035. doi: 10.1126/science.288.5468.1033
Harmon R. S., Schwarcz H. P., Ford D. C. (1978). Late pleistocene Sea level history of Bermuda. Quat. Res. 9, 205–218. doi: 10.1016/0033-5894(78)90068-6
Huybers P., Liautaud P., Proistosescu C., Boulahanis B., Carbotte S. M., Katz R. F., et al. (2022). Influence of late pleistocene Sea-level variations on midocean ridge spacing in faulting simulations and a global analysis of bathymetry. Proc. Nati. Acad.Sci. 119, e2204761119. doi: 10.1073/pnas.2204761119
Jiang W., Yu K., Fan T., Xu S., Wang R., Zhang Y., et al. (2019). Coral reef carbonate record of the pliocene-pleistocene climate transition from an atoll in the south China Sea. Mar. Geol. 411, 88–97. doi: 10.1016/j.margeo.2019.02.006
Kontoyannis C. G., Vagenas N. V. (2000). Calcium carbonate phase analysis using XRD and FT-raman spectroscopy. Analyst 125, 251–255. doi: 10.1039/a908609i
Lambeck K., Chappell J. (2001). Sea Level change through the last glacial cycle. Science 292, 679–686. doi: 10.1126/science.1059549
Lambeck K., Rouby H., Purcell A., Sun Y., Sambridge M. (2014). Sea Level and global ice volumes from the last glacial maximum to the Holocene. Proc. Nati. Acad.Sci. 111, 15296–15303. doi: 10.1073/pnas.1411762111
Li T., Feng A., Liu Y., Li Z., Guo K., Jiang W., et al. (2018). Three-dimensional (3D) morphology of sansha yongle blue hole in the south China Sea revealed by underwater remotely operated vehicle. Sci. Rep. 8, 17122. doi: 10.1038/s41598-018-35220-x
Ma Y., Qin Y., Yu K., Li Y., Long Y., Wang R., et al. (2021). Holocene Coral reef development in chenhang island, northern south China Sea, and its record of Sea level changes. Mar. Geol. 440, 106593. doi: 10.1016/j.margeo.2021.106593
Melim A., Shinglman M., Boston J., Northup E., Spilde N., Queen J. M. (2001). Evidence for microbial involvement in pool finger precipitation, hidden cave, new Mexico. Geomicrobiol. J. 18, 311–329. doi: 10.1080/01490450152467813
Mix A. C., Bard E., Schneider R. (2001). Environmental processes of the ice age: Land, oceans, glaciers (EPILOG). Quat. Sci. Rev. 20, 627–657. doi: 10.1016/S0277-3791(00)00145-1
Moseley G. E., Richards D. A., Smart P. L., Standish C. D., Hoffmann D. L., Ten Hove H., et al. (2015). Early–middle Holocene relative Sea-level oscillation events recorded in a submerged speleothem from the Yucatán Peninsula, Mexico. Holocene 25, 1511–1521. doi: 10.1177/0959683615585832
Mylroie J. E., Carew J. L., Moore A. I. (1995). Bahamian Blue holes: Description and definition. Carbonate Evaporite 10, 225–233. doi: 10.1007/BF03175407
Nakada M., Okuno J. I., Yokoyama Y. (2016). Total meltwater volume since the last glacial maximum and viscosity structure of earth's mantle inferred from relative Sea level changes at Barbados and Bonaparte gulf and GIA-induced J̇2. Geophys. J. Int. 204, 1237–1253. doi: 10.1093/gji/ggv520
Peltier W. R. (2004). Global glacial isostasy and the surface of the ice-age earth: the ICE-5G (VM2) model and grace. Annu. Rev. Earth Planet. Sci. 32, 111–149. doi: 10.1146/annurev.earth.32.082503.144359
Peltier W. R., Fairbanks R. G. (2006). Global glacial ice volume and last glacial maximum duration from an extended Barbados Sea level record. Quat. Sci. Rev. 25, 3322–3337. doi: 10.1016/j.quascirev.2006.04.010
Reimer P. J., Austin W. E. N., Bard E., Bayliss A., Blackwell P. G., Bronk Ramsey C., et al. (2020). The IntCal20 northern hemisphere radiocarbon age calibration curve (0–55 cal kBP). Radiocarbon 62, 725–757. doi: 10.1017/RDC.2020.41
Richards D. A., Smart P. L., Lawrence E. R. (1994). Maximum Sea levels for the last glacial period from U-series ages of submerged speleothems. Nature 367, 357–360. doi: 10.1038/367357a0
Spratt R. M., Lisiecki L. (2016). A late pleistocene Sea level stack. Clim. Past 12, 1079–1092. doi: 10.5194/cp-12-1079-2016
Steidle S. D., Warken S. F., Schorndorf N., Förstel J., Schröder-Ritzrau A., Moseley G. E., et al. (2021). Reconstruction of middle to late quaternary Sea level using submerged speleothems from the northeastern yucatán peninsula. J. Quat. Sci. 36, 1190–1200. doi: 10.1002/jqs.3365
Surić M., Juračić M., Horvatinčić N., Krajcar Bronić I. (2005). Late pleistocene–Holocene Sea-level rise and the pattern of coastal karst inundation: Records from submerged speleothems along the Eastern Adriatic coast (Croatia). Mar. Geol. 214, 163–175. doi: 10.1016/j.margeo.2004.10.030
Tuccimei P., Soligo M., Ginés J., Ginés A., Fornós J., Kramers J., et al. (2010). Constraining Holocene Sea levels using U-Th ages of phreatic overgrowths on speleothems from coastal caves in mallorca (Western Mediterranean). Earth Surf. Proc. Land. 35, 782–790. doi: 10.1002/esp.1955
van Hengstum P. J., Cresswell J. N., Milne G. A., Lliffe T. M. (2019). Development of anchialine cave habitats and karst subterranean estuaries since the last ice age. Sci. Rep. 9, 1–10. doi: 10.1038/s41598-019-48058-8
Wiedicke M., Kudrass H.-R., Hübscher C. (1999). Oolitic beach barriers of the last glacial Sea-level lowstand at the outer Bengal shelf. Mar. Geol. 157, 7–18. doi: 10.1016/S0025-3227(98)00162-5
Yokoyama Y., Esat T. M., Lambeck K. (2001). Coupled climate and Sea-level changes deduced from huon peninsula coral terraces of the last ice age. Earth Planet Sci. Lett. 193, 579–587. doi: 10.1016/S0012-821X(01)00515-5
Yokoyama Y., Esat T. M., Thompson W. G., Thomas A. L., Webster J. M., Miyairi Y., et al. (2018). Rapid glaciation and a two-step Sea level plunge into the last glacial maximum. Nature 559, 603–607. doi: 10.1038/s41586-018-0335-4
Yokoyama Y., Lambeck K., De Deckker P., Johnston P., Fifield L. K. (2000). Timing of the last glacial maximum from observed Sea-level minima. Nature 406, 713–716. doi: 10.1038/35021035
Yu X., Duan B., Guo K., Li T., Feng A., Du J., et al. (2022). Mapping and U-Th dating of the world's deepest blue hole (South China sea): Implications for its timing, possible volcanogenic origin, and pleistocene eolianites in the xisha islands. Mar. Geol. 447, 106776. doi: 10.1016/j.margeo.2022.106776
Zhai S., Mi L., Shen X., Liu X., Xiu C., Sun Z., et al. (2015). Mineral compositions and their environmental implications in reef of shidao island, xisha. Earth Sci. J. China Univ. Geosci. 40, 597–605. doi: 10.3799/dqkx.2015.047
Keywords: sea level, U–Th dating, 14C dating, speleothem, LGM, coastal cave
Citation: Yu X, Duan B, Zhao J, Gu D, Feng A, Liu Y and Li T (2022) Deep submerged speleothems in the Sansha Yongle Blue Hole (South China Sea) as determination of low sea levels during the Last Glacial Maximum. Front. Mar. Sci. 9:1079301. doi: 10.3389/fmars.2022.1079301
Received: 25 October 2022; Accepted: 28 November 2022;
Published: 20 December 2022.
Edited by:
Fajin Chen, Guangdong Ocean University, ChinaReviewed by:
Rui Wang, Guangxi University, ChinaZhongping Lai, Shantou University, China
Jiantao Cao, Tongji University, China
Copyright © 2022 Yu, Duan, Zhao, Gu, Feng, Liu and Li. This is an open-access article distributed under the terms of the Creative Commons Attribution License (CC BY). The use, distribution or reproduction in other forums is permitted, provided the original author(s) and the copyright owner(s) are credited and that the original publication in this journal is cited, in accordance with accepted academic practice. No use, distribution or reproduction is permitted which does not comply with these terms.
*Correspondence: Jingyao Zhao, emp5MTIzMEB4anR1LmVkdS5jbg==; Tiegang Li, dGdsaUBmaW8ub3JnLmNu
†Present address: Xiaoxiao Yu, State Key Laboratory of Isotope Geochemistry and CAS Center for Excellence in Deep Earth Science, Guangzhou Institute of Geochemistry, Chinese Academy of Sciences, Guangzhou, China