 Guorong Zhong1,2,3,4
 Xuegang Li1,2,3,4*
 Jinming Song1,2,3,4*
 Baoxiao Qu1,3,4
 Fan Wang1,2,3,4
 Yanjun Wang1,4Bin Zhang1,4Detong Tian1,2,3,4
 Jun Ma1,3,4
 Huamao Yuan1,2,3,4
 Liqin Duan1,2,3,4Ning Li1,2,3,4Qidong Wang1,3,4Jianwei Xing1,3,4
- 1Institute of Oceanology, Chinese Academy of Sciences, Qingdao, China
- 2University of Chinese Academy of Sciences, Beijing, China
- 3Pilot National Laboratory for Marine Science and Technology, Qingdao, China
- 4Center for Ocean Mega-Science, Chinese Academy of Sciences, Qingdao, China
The Pacific Ocean is one of the important carbon sink regions, and there is a significant west-east difference in sea-air CO2 flux. However, the influence of the long-standing greater CO2 uptakes in the western Pacific than in the east and the dynamic change of this west-east difference remain unclear. In this paper, using the gridded surface ocean pCO2 product constructed by the stepwise FFNN algorithm, we reported an increasing west-east CO2 flux difference from 0.41 PgC yr-1 in 1992 to 0.73 PgC yr-1 in 2020. This increase was mainly attributed to the strengthening western Pacific carbon sink and relatively stable eastern Pacific carbon source. During El Nino events, the west-east CO2 flux difference decreased significantly in a few years, and it then rose back rapidly when El Nino events ended. In addition, the increasing west-east difference in CO2 uptakes during the last three decades did not lead to a higher acidification speed in the western surface temperate Pacific than the east. The greater CO2 absorbed in the west was mainly transported to the deeper waters and caused a more significant carbon inventory change at 200-600 m than the eastern Pacific.
Introduction
The atmospheric CO2 concentration has been continuously rising since the beginning of the industrial revolution, due to the increasing release of anthropogenic CO2. The global oceans absorbed about one-third of the released anthropogenic CO2, which slowed down the rising atmospheric CO2 (Sabine et al., 2004; Friedlingstein et al., 2019). The sea-air CO2 flux was widely used to quantitative the global ocean CO2 uptakes, which was mainly calculated based on the difference of partial pressure of carbon dioxide (pCO2) between the sea and air. Oceans with negative CO2 flux values suggest a lower surface ocean pCO2 than the atmosphere, referred to as carbon sinks. On the opposite, oceans with positive CO2 flux values are referred to as carbon sources, where the CO2 is released from oceans to the atmosphere. During the last three decades, the global ocean carbon sink weakened in the 1990s and then restrengthened since 2001 (Landschützer et al., 2016; Watson et al., 2020). As the largest ocean, the Pacific Ocean carbon sink played an important role in the global ocean CO2 uptakes, and its intensity was largely influenced by the variation of equatorial carbon sources following the ENSO events (Feely et al., 2006). Although with the most intense carbon source in the equatorial area, the Pacific Ocean has absorbed the most CO2 among the major oceans, with a total of 10.04 ± 4.3 PgC from the atmosphere during 1994-2007 (Watson et al., 2020). In the same period, the Pacific Ocean carbon inventory has increased by 13.2 ± 1.3 PgC (Gruber et al., 2019). The temperate Pacific contributed most to the CO2 uptake, with a stronger carbon sink in the north Pacific than the south, especially in the 30-40°N areas (Takahashi et al., 2009; Ishii et al., 2014; DeVries et al., 2017). However, differences in CO2 uptakes also existed between the western Pacific and the east, with less concern than the latitude differences (Takahashi et al., 2009; Landschützer et al., 2016; Denvil-Sommer et al., 2019; Chau et al., 2022). The western part contributed most to the Pacific CO2 uptakes, while the eastern Pacific released more CO2 than absorbed (Landschützer et al., 2014). Research related to the differences between the western Pacific and the east focused more on the importance of the eastern equatorial Pacific carbon source than the CO2 uptake difference between the west and the east (Feely et al., 1997). The eastern equatorial Pacific carbon source ranged from +0.30 to +0.43 PgC yr-1, significantly larger than the western equatorial source near +0.04 PgC yr-1 (Gruber et al., 2009; Takahashi et al., 2009; Landschützer et al., 2014). While in the temperate Pacific Ocean, the west-east difference of the carbon sink also existed for a long time (Takahashi et al., 2009), with still unclear influences and dynamic changes. Thus, based on the drivers selected by the Stepwise FFNN algorithm (Zhong et al., 2022), we reestimated the Pacific Ocean carbon sink in the last three decades and then explored the mechanism and long-term influence of the carbon sink differences between the western Pacific and the east.
Materials and methods
The Stepwise FFNN algorithm designed by Zhong et al. (2022) was used to reconstruct the gridded surface ocean pCO2 data on different biogeochemical provinces divided based on the self-organizing neural network (SOM). Based on the measurements from the Surface Ocean CO2 Atlas dataset version 2022 (Bakker et al., 2016; Bakker et al., 2022), we extended the previous 1°×1° monthly pCO2 product to the period January 1992 through December 2020 (Zhong, 2021). The reconstruction of pCO2 data includes three steps. Firstly, the Pacific Ocean was divided into 5 biogeochemical provinces based on the SOM, using the climatological mean sea surface temperature, salinity, and mixed layer depth from ECCO2 cube92 product (Menemenlis et al., 2008), nitrate, phosphate, silicate, and dissolved oxygen from the World Ocean Atlas 2018 (Boyer et al., 2018), and pCO2 climatology from Landschützer et al. (2020). All 12 months of the climatology products were input into one SOM network to include the seasonal variability in the biogeochemical province dividing. Secondly, the pCO2 predictors were selected by the Stepwise FFNN algorithm from total alkalinity (Broullon et al., 2019), dissolved inorganic carbon (Broullon et al., 2020), and the pCO2 drivers used in previous work (Zhong et al., 2022). Based on the same group of SOCAT samples, the predictors corresponding to the lowest pCO2 predicting error calculated by the k-fold cross validation method were selected as the optimal pCO2 predictors. Finally, based on the FFNN, the relationship between selected optimal pCO2 predictors and surface ocean pCO2 was fitted, and then the 1°×1° monthly gridded pCO2 product during 1992-2020 was constructed using the relationship and pCO2 predictors. Compared with the original version (Zhong et al., 2022), we used multiple FFNNs with different initializations (controlled by the random seed mechanism of MATLAB) to calculate the average of the results for each error and the pCO2 predicting value in the new version, to eliminate the unexpected influence of FFNN initial state and SOCAT sample sort order on the results. The selected pCO2 predictors in different biogeochemical provinces of the Pacific suggested the most important pCO2 drivers (Figure 1).
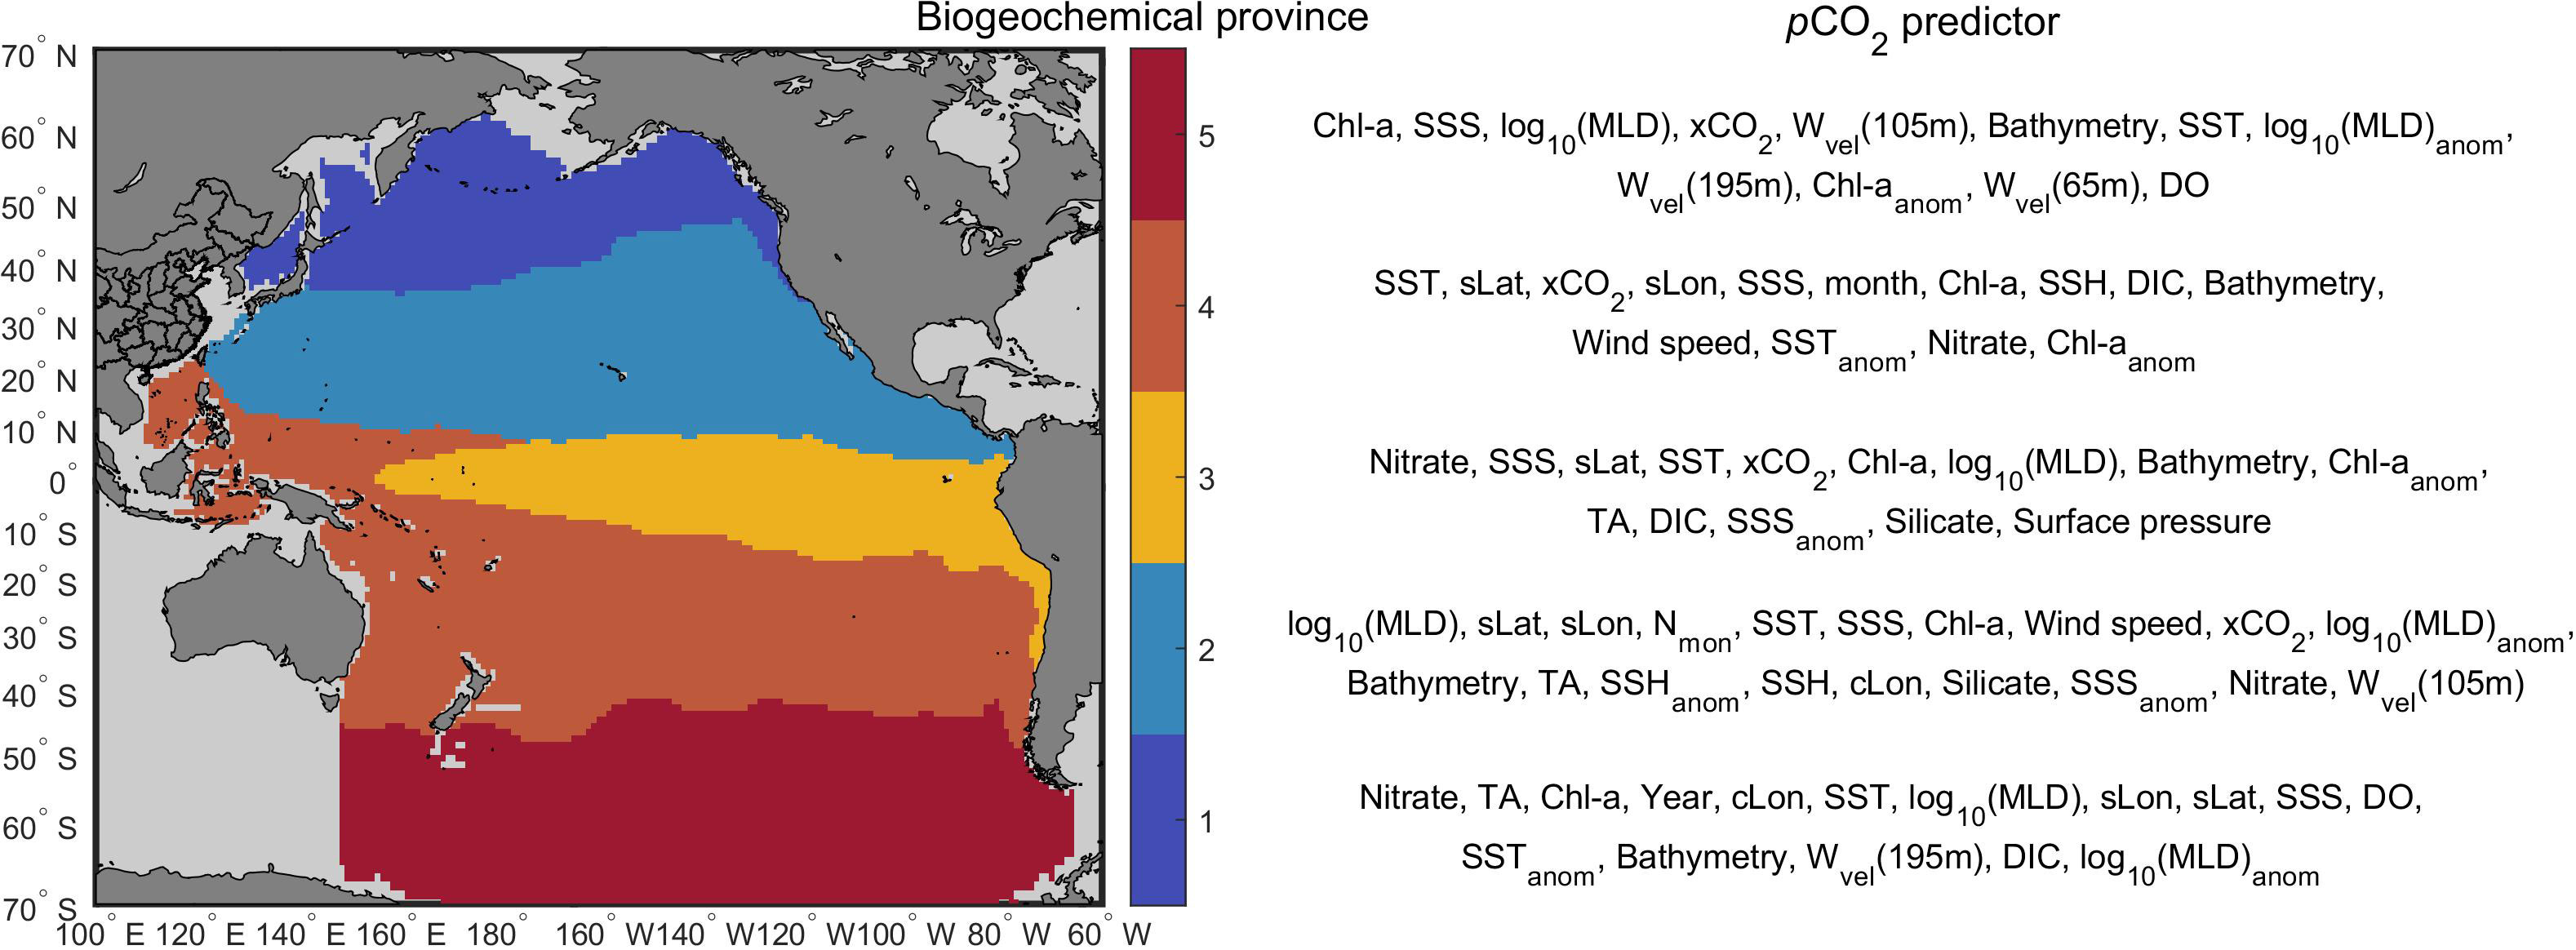
Figure 1 Biogeochemical province and corresponding pCO2 predictors. Chl-a, chlorophyll-a concentration; MLD, mixed layer depth; Wvel, w velocity of ocean currents at given depth; DO, dissolved oxygen; sLat, sine of latitude; sLon, sine of longitude; cLon, cosine of longitude; xCO2, dry air mixing ratio of atmospheric CO2; SSH, sea surface height; DIC, dissolved inorganic carbon; TA, total alkalinity; Nmon, number of months since January 1992; anom, monthly anomaly.
The sea-air CO2 flux was estimated by the difference of pCO2 across the interface (Watson et al., 2020):
where F is the sea-air CO2 flux (mol m-2 yr-1). The pCO2w is the surface ocean pCO2 (µatm), and pCO2atm is the atmospheric pCO2 (µatm) calculated from the xCO2 product (GLOBALVIEW-CO2, 2011). The asubskin and askin are the solubility of CO2 in the molecular boundary layer and cool skin (Donlon et al., 2007; Woolf et al., 2016), calculated from temperature and salinity (Weiss, 1974). The salinity product is from ECCO2 cube92 (Menemenlis et al., 2008), with a difference of 0.1 between the skin and subskin salinity (Woolf et al., 2016). The NOAA/OAR/ESRL PSD, Optimum Interpolation SST V2 product is used for the skin temperature (Banzon et al., 2016), with a difference of -0.17K between the skin and subskin temperature (Donlon et al., 2002). The subskin correction for the cool skin was carried out in the sea-air CO2 flux estimate as the foundation (1) (Watson et al., 2020). The parameter k is the transfer velocity of CO2, related to the wind speed (Wanninkhof, 1992):
where Sc is the Schmidt number of CO2 in the given temperature. The parameter U is the average wind speed, using the high-resolution Cross-Calibrated Multi-Platform (CCMP) product (Atlas et al., 2011). Γ is a scale factor according to the wind product used, here we used 0.254 from the previous research based on the CCMP product (Landschützer et al., 2014).
In this work, the spatial coverage of the Pacific was defined as 85°S-70°N, and the analysis was based on the RECCAP areas, including the north subpolar Pacific (north of 44°N), northern temperate Pacific (18-44°N), equatorial Pacific (18°S-18°N) and southern temperate Pacific (18-44°S), and the Pacific sector of the Southern Ocean (south of 44°S). The boundary between the western Pacific and the east was defined as 174°W in the north of 18°N, 158°W in the 18°S-18°N, and 139°W in the south of 18°S, to make the surface areas nearly equal between the west and the east. The areas shallower than 500m were considered coastal areas and removed.
The uncertainty of sea-air CO2 flux estimate includes mainly three parts: the uncertainty of transfer velocity k, the cool skin impact, and the uncertainty in the surface ocean pCO2 reconstruction. The uncertainty of transfer velocity k was related to the wind product and considered about 5-30% (Takahashi et al., 2009; Ho et al., 2011; Woolf et al., 2019), and here we used 10%. Recent research suggested an underestimate of 0.35 PgC yr-1 in the global ocean carbon sink caused by the cool skin impact (Woolf et al., 2019). The uncertainty caused by the temperature and salinity gradient was considered 3% and 1.7% after the subskin correction, respectively (Woolf et al., 2016; Watson et al., 2020b). The last uncertainty term came from the reconstruction of gridded surface ocean pCO2 data, including the pCO2 measurement uncertainty, the uncertainty of averaging to 1°×1° grids, and the pCO2 interpolation uncertainty. Thus, the total uncertainty in the pCO2 reconstruction was calculated on average (Wang et al., 2014):
where the measurement uncertainty σ(meas) was about 2-5 μatm (Pfeil et al., 2013; Wanninkhof et al., 2013b), which was lower than the others and can be neglected (Landschützer et al., 2014). The uncertainty of averaging to 1°×1° grids, σ(grid), used 5 μatm from the previous research (Sabine et al., 2013). For the pCO2 interpolation uncertainty σ(map), we used the predicting error of 7-25 μatm in each biogeochemical province (Zhong et al., 2022). The uncertainty in each province was calculated following (Landschützer et al., 2014):
The σ(<pCO2>) calculated from the pCO2 interpolation uncertainty ranges from 2 to 7 μatm in each province. Based on the average CO2 transfer velocity of 0.06 mol C m-2 yr-1 in the Pacific Ocean, the uncertainty σ(pCO2) caused by the pCO2 interpolation error in different provinces ranges from ±0.03 to ±0.13 PgC yr-1. The total uncertainty of pCO2 interpolation estimated by the sum of squares of σ(pCO2) in each province was ±0.16 PgC yr-1, corresponding to roughly 22% of the average Pacific Ocean carbon sink estimated below. Thus, combining the uncertainties stemming from transfer velocity, cool skin influences, and pCO2 interpolation, the final uncertainty was ±24.4% (), using the square root of the sum squares propagation, corresponds to ± 0.17 PgC yr-1 (1σ).
The paired-sample t-test was conducted to examine whether the difference in CO2 flux between the western and eastern Pacific is statistically significant at a 1% significance level. The p-value was calculated from the total CO2 flux of the western and eastern Pacific in each month. When the p-value is lower than 0.01, the west-east CO2 flux difference is statistically significant.
Climatological mean west-east difference in sea-air CO2 flux
The average Pacific Ocean carbon sink during 1992-2020 was -0.73 ± 0.17 PgC yr-1, with large seasonal variability. The seasonal variability of CO2 flux is basically dominated by the variation of surface ocean pCO2 (Figure 2). The climatological mean sea-air CO2 flux of the Pacific was -0.80 ± 0.18 PgC yr-1 in January and -0.37 ± 0.16 PgC yr-1 in July. Despite the significant seasonal change in the total carbon sink of the Pacific Ocean, great CO2 flux differences were found between the western and eastern Pacific in all seasons. In January, the western Pacific was a stronger carbon sink than the east, with a difference of 0.80 PgC yr-1 (n=29, p<0.01, paired-sample t-tests). This west-east difference became 0.71 PgC yr-1 when the western carbon sink weakened and the eastern Pacific became a carbon source in July (n=29, p<0.01, paired-sample t-tests).
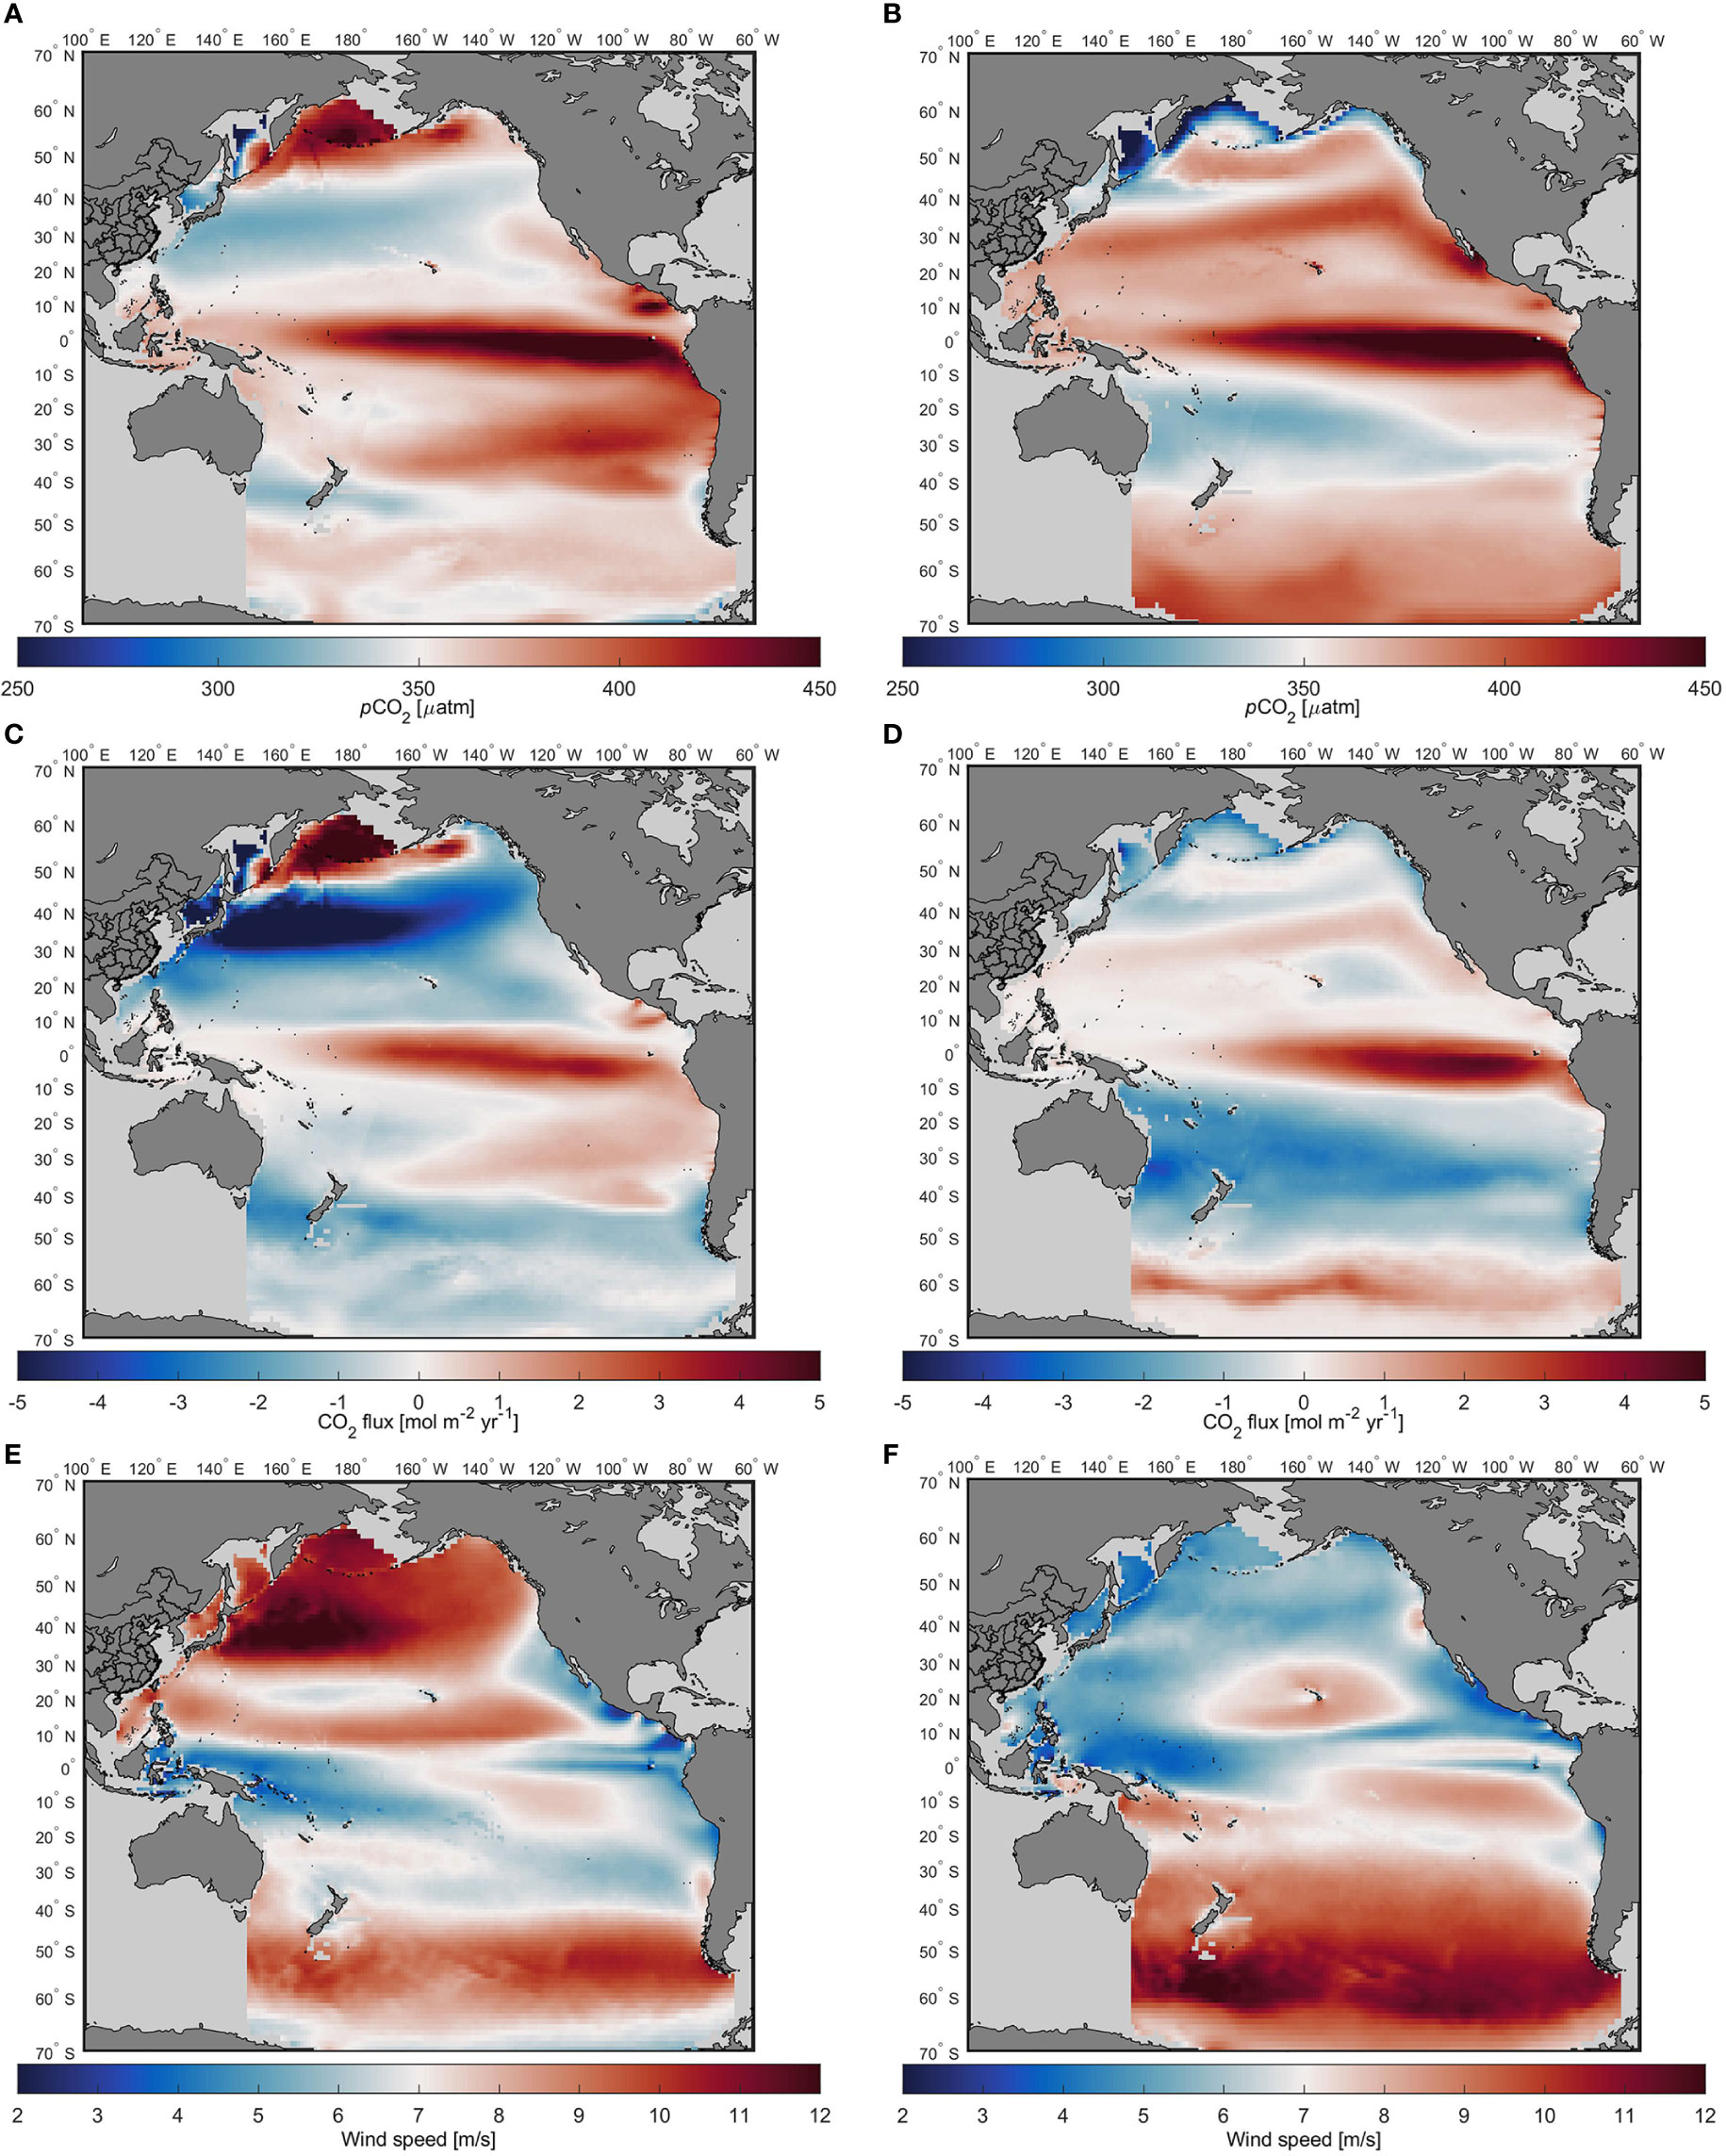
Figure 2 Seasonal variability of surface ocean pCO2 and CO2 flux. (A) and (B): climatological mean surface ocean pCO2 in January and July; (C) and (D): climatological mean sea-air CO2 flux in January and July; (E) and (F): climatological mean wind speed in January and July from CCMP product (Wentz et al., 2015).
On the regional scale, the west-east CO2 flux difference was most significant in the equatorial Pacific, then the temperate oceans and subpolar oceans in January. While the west-east CO2 flux differences in the north temperate oceans and subpolar oceans largely reduced in July. In the north subpolar Pacific, the surface ocean pCO2 and CO2 flux showed large seasonal variability, consistent with previous climatology research (Takahashi et al., 2009; Landschützer et al., 2020). The carbon source in the west of the north subpolar Pacific was more intense than in the east in January, with a difference of 0.11 PgC yr-1 (n=29, p<0.01, paired-sample t-tests). The carbon source in the subpolar Pacific was caused by the transport of deep waters with high DIC toward the surface in winter (DeVries et al., 2017), and turned into a weak carbon sink due to the biological consumption of CO2 in strongly stratified shallow mixed layers in summer (Takahashi et al., 2009). The pCO2 predictors selected by the Stepwise FFNN algorithm suggested that nitrate, alkalinity, and chlorophyll concentration were the most important pCO2 drivers in the north subpolar Pacific, supporting the dominance of biological activities on the pCO2 variation. The west-east difference in CO2 flux decreased to 0.02 PgC yr-1 in July (n=29, p<0.01, paired-sample t-tests), with a stronger carbon sink in the west than in the east. The more significant CO2 flux west-east difference in winter than in summer was caused by the difference in the gas transfer velocity related to the wind speed, which was significantly higher in winter (Figures 2E, F).
The strong seasonal variation of pCO2 in the northern temperate Pacific is mainly caused by the seasonal variation of sea surface temperature, which leads to a strong carbon sink close to about -5 mol m-2 yr-1 in winter and a weak carbon source near 1 mol m-2 yr-1 in summer appeared alternately. Similarly, the west-east CO2 flux difference was also more significant in winter, reaching 0.27 PgC yr-1 in January (n=29, p<0.01, paired-sample t-tests), with a stronger carbon sink in the western Pacific than the east. This is far greater than the west-east difference of 0.03 PgC yr-1 in July (n=29, p<0.01, paired-sample t-tests), where the different wind speed in each season was also partly responsible. Because the average wind speed during winter of the western temperate Pacific in the 30-45°N region was much higher than that in the eastern temperate Pacific, the west-east CO2 flux difference was more significant than in summer. However, in the 10-30°N, there was a relatively stronger carbon sink in the eastern Pacific, while the 10-30°N area was overall a weak sink in winter. In summer, this carbon sink area in the eastern Pacific did not turn into a carbon source with the rising temperature like the surrounding areas but sustained with weak intensity, reducing the west-east CO2 flux difference in the north temperate Pacific during summer. The formation of this weak sink area may be due to the lower SST in the eastern Pacific. The ECCO2 Cube92 SST product shows that the average SST in the Eastern Pacific was 1.9°C lower than that in the western Pacific in winter and about 1.3°C lower in summer in the 10-30°N region. Except for this weak sink area, the seasonal variability pattern was the same between the western Pacific and the east in most parts of the northern temperate oceans. Similar to the northern temperate oceans, in summer, the carbon source in the western Pacific was significantly weaker than that of the eastern Pacific in the southern temperate Pacific 18-44°S. However, in winter, the western Pacific Ocean is overall a strong carbon sink, while the eastern Pacific Ocean has a weak carbon sink and a carbon source area. This is mainly caused by the mixing of high pCO2 water from the equatorial oceans and low pCO2 water from the Southern Ocean in the South Pacific.
In the eastern equatorial Pacific 18S-18N, the upwelling transported deep waters with high DIC toward the surface layer, leading to the strongest carbon source region and basically stable intensity in different seasons (Landschützer et al., 2014). The surface seawater with high pCO2 is transported westward under the influence of the westward-flowing South Equatorial Current (Feely et al., 1999), with carbon dioxide constantly releasing from seawater to the atmosphere. A westward decreasing pCO2 gradient was found in the equatorial Pacific, resulting in a more intense carbon source in the east than the west (Figure 2). The west-east difference was smaller in spring and autumn and the most significant in summer, ranging from 0.28 to 0.46 PgC yr-1 in different seasons.
For the long-term average total CO2 flux during 1992-2020, the average total flux between the western and eastern Pacific was also significant, especially in the equatorial and temperate oceans. (Figure 3). In the northern temperate Pacific (18-44°N), the strong carbon sink was found in both the west and the eastern Pacific, with a difference of 0.13 PgC yr-1 in the average flux (n=348, p<0.01, paired-sample t-tests). The west-east difference of 0.37 PgC yr-1 in the equatorial Pacific was the most significant (n=348, p<0.01, paired-sample t-tests), caused by the strong carbon sources in the eastern Pacific. The average carbon source in the equatorial Pacific east of 158°W was +0.38 ± 0.10 PgC yr-1, extremely stronger than the +0.01 ± 0.10 PgC yr-1 in the west. The strongest carbon source in the eastern equatorial Pacific Ocean also affected the distribution pattern of carbon sinks in the southern temperate Pacific. The high pCO2 seawater from the eastern tropical region was mixed with the low pCO2 seawater from the Southern Ocean in the southern temperate Pacific, resulting in a significantly higher carbon sink intensity in the western Pacific than in the eastern Pacific and a west-east flux difference of 0.22 PgC yr-1 (n=348, p<0.01, paired-sample t-tests). Overall, the average total flux was -0.72 ± 0.17 PgC yr-1 in the whole western Pacific and -0.01 ± 0.16 PgC yr-1 in the eastern Pacific, showing a significant difference. This great west-east CO2 flux difference was caused by the stronger carbon sink in the western temperate Pacific and the stronger carbon source in the eastern equatorial Pacific.
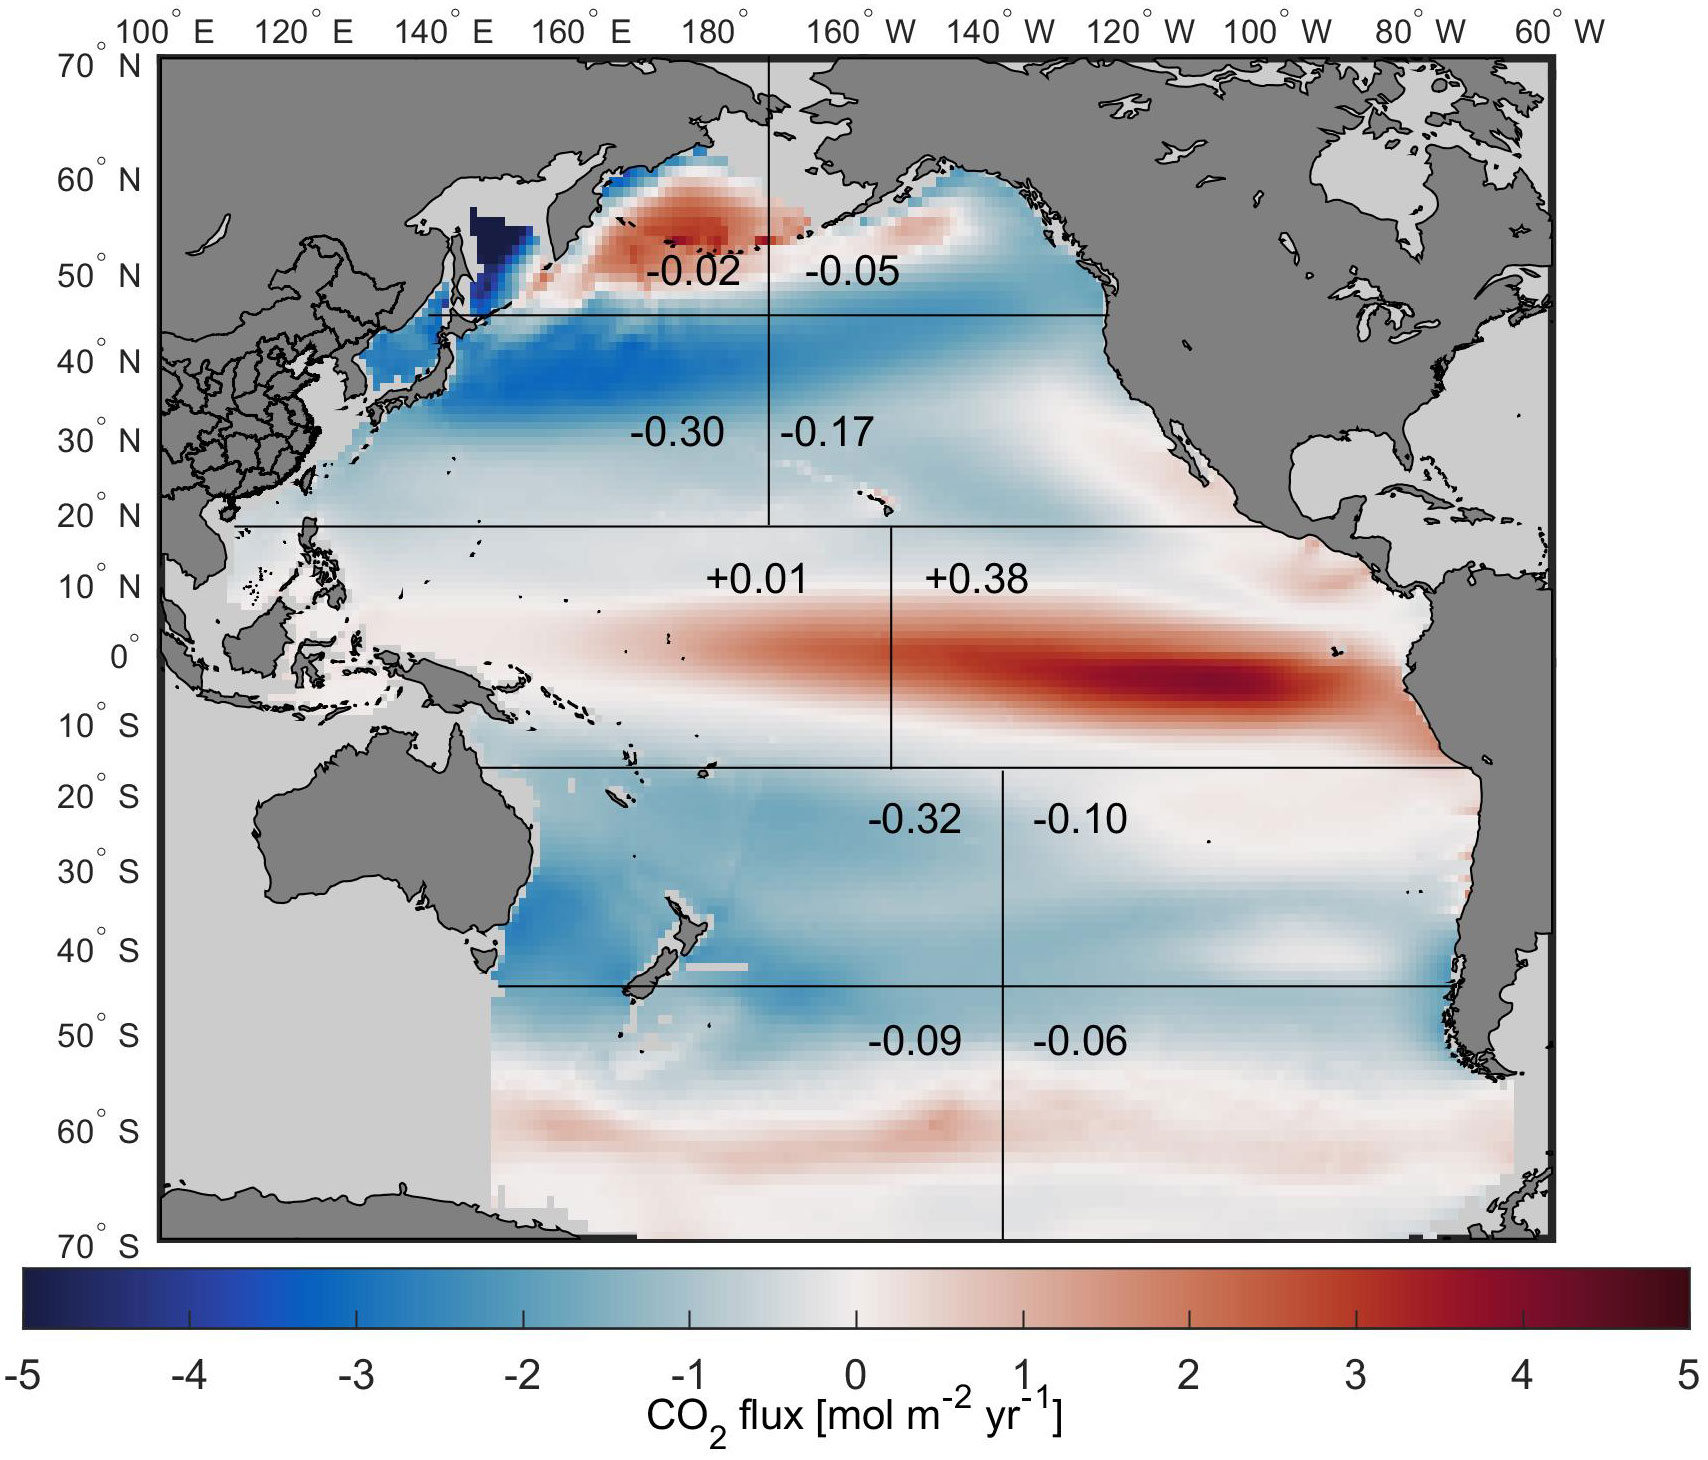
Figure 3 Distribution of the average sea-air CO2 flux during 1992-2020. Numbers in each region are the average total CO2 flux (in PgC yr-1), separated by the 174°W, 158°W, and 139°W longitude boundaries. The latitude boundaries are 44°N, 18°N, 18°S, and 44°S.
Interannual variability of the Pacific sea-air CO2 flux and the west-east flux differences
Over the past three decades, the total Pacific carbon sink fluctuated significantly during the two important El Nino events of 1997-1998 and 2015-2016 (Figure 4A). This fluctuation was mainly caused by the weakening of the eastern equatorial Pacific carbon source driven by the El Nino events (Feely et al., 1999). The weakening eastern equatorial Pacific carbon source led to the strengthening Pacific carbon sink during the El Nino events. In contrast, during the La Nina events such as 2011, the western sink weakened and the eastern source strengthened. Despite the large short-term variability, the Pacific Ocean carbon sink showed a weak strengthening trend during the last three decades. The western Pacific carbon sink steadily strengthened from -0.56 ± 0.17 PgC yr-1 in 1992 to -0.78 ± 0.18 PgC yr-1 in 2020 and the eastern Pacific carbon source weakened slightly. Since 2008, the global ocean carbon sink has strengthened rapidly, while the Pacific Ocean carbon sink did not contribute much to this trend. Due to the strengthening Pacific Ocean carbon sink and the weakening of the Southern Ocean carbon sink in the 1990s, the contribution of the Pacific Ocean on the global ocean CO2 uptakes increased to about 50% in 2001 from 35% in 1992. Since 2001, the restrengthening Southern Ocean carbon sink has been more rapid than the strengthening of the Pacific carbon sink, resulting in a decreasing contribution of the Pacific carbon sink to 36% until 2020. The contribution of the total Pacific sink was nearly the same as the contribution of the western Pacific carbon sink on the global ocean CO2 uptakes because the eastern Pacific was a carbon source in most years. Although the Pacific Ocean carbon sink was continuously strengthening during the last three decades, the decreasing proportion of the Pacific carbon sink suggested the main contribution of other basins to the strengthening of the global ocean carbon sink, such as the Southern Ocean and the Atlantic Ocean.
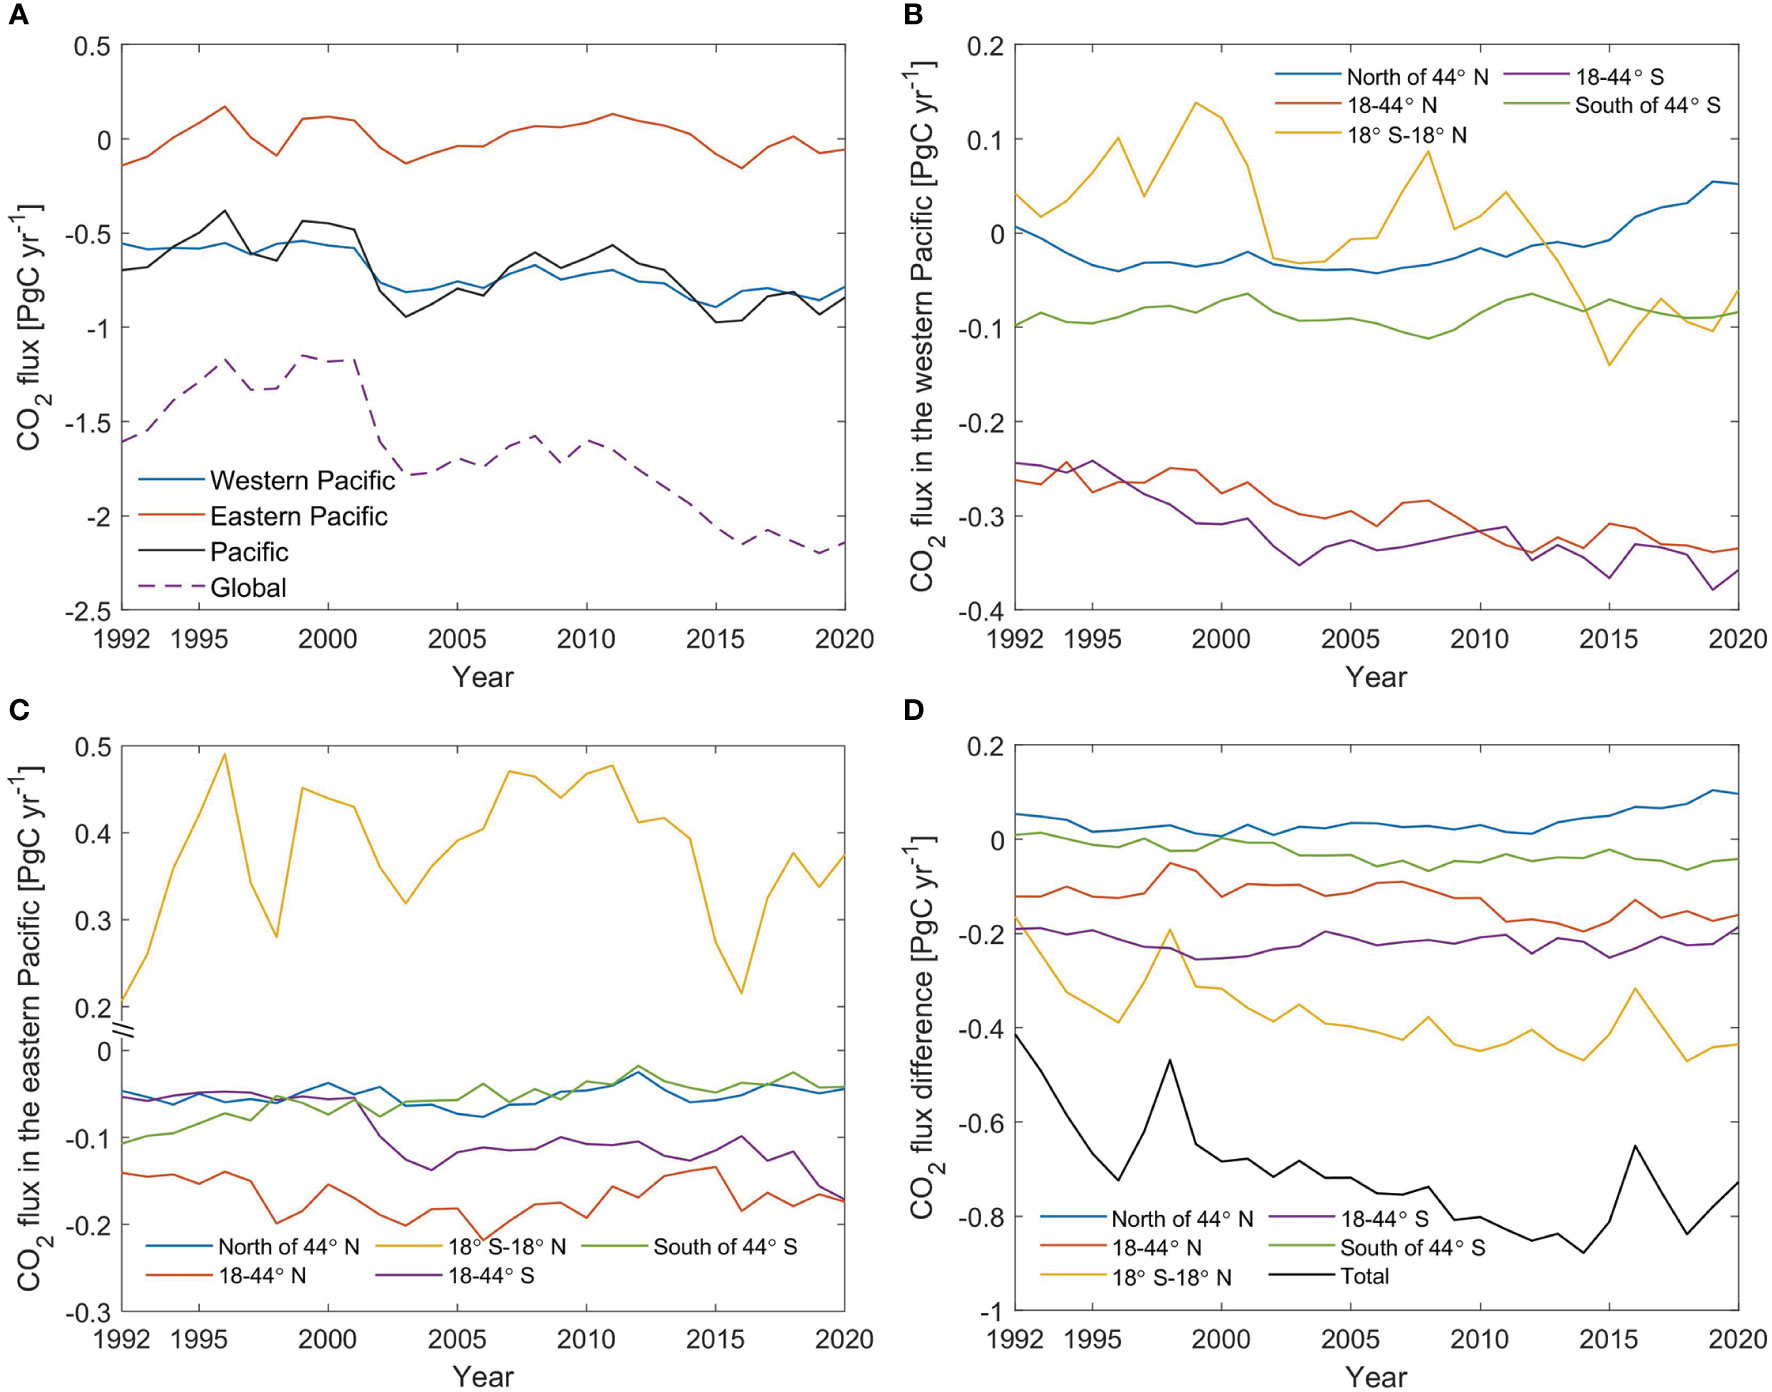
Figure 4 Interannual variability of sea-air CO2 flux and the west-east difference in the Pacific. (A): total CO2 flux of the western and eastern Pacific; (B): total CO2 flux in different latitudes of the western Pacific; (C) total CO2 flux in different latitudes of the eastern Pacific; (D): the west-east difference of CO2 flux in different latitudes (fluxwest-fluxeast).
Previous studies suggested that 72% of the variation in equatorial Pacific flux is related to ENSO signals (Landschützer et al., 2014). Comparing the CO2 flux in the western and eastern Pacific Ocean, it can be found that not only the intensity of the eastern equatorial Pacific carbon source, the interannual variability of the western equatorial Pacific weak source was also highly related to the El Nino events (Figures 4B, C). During the El Nino events in 1997-1998 and 2015-2016, the western equatorial Pacific source also weakened, with smaller fluctuation than the eastern equatorial Pacific source. The eastern equatorial Pacific carbon source has not been continuously strengthening or weakening, with significant short-term fluctuation instead. At the same time, the long-term weakening trend of the western equatorial Pacific carbon source was more evident. Since 2013, the weakening western equatorial Pacific carbon source has become a weak carbon sink.
The north subpolar Pacific Ocean (north of 44°N) was overall a weak carbon sink, with the intensity fluctuating around -0.07 ± 0.10 PgC yr-1. The western temperate Pacific was a strong carbon sink and showed an evident strengthening trend. The northern temperate carbon sink of the western Pacific strengthened from -0.26 ± 0.04 PgC yr-1 in 1992 to -0.33 ± 0.05 PgC yr-1 in 2020, while the southern temperate carbon sink strengthened more rapidly and reached -0.36 ± 0.05 PgC yr-1 in 2020. While in the eastern temperate Pacific Ocean, the northern temperate ocean was a stronger carbon sink than the south but sustained relatively stable, unlike the continuously strengthening southern temperate carbon sink. The northern temperate carbon sink of the eastern Pacific strengthened by only 0.03 PgC in the last three decades, even lower than the short-term variability during ENSO events. The southern temperate carbon sink of the eastern Pacific strengthened by 0.12 PgC during the last three decades, close to the speed in the western Pacific 18-44°S.
Figure 4D shows the west-east difference of CO2 flux at different latitudes of the Pacific Ocean (western Pacific flux minus Eastern Pacific flux) and its interannual variability. The west-east difference was the most significant in the equatorial Pacific region, reaching 0.44 PgC yr-1 in 2020. Due to the rapidly weakening eastern equatorial Pacific carbon source during ENSO events, the west-east difference of CO2 flux in the equatorial Pacific also decreased. Especially during the 1997-1998 and 2015-2016 ENSO events, the west-east difference decreased by nearly 0.15 PgC yr-1. However, the influence of La Nina events on the west-east difference of CO2 flux in the equatorial Pacific was far less than the El Nino events. The west-east difference of CO2 flux in the equatorial Pacific rose again immediately after the El Nino events ended, and no such evident variation was found during the La Nina event in 2011. In addition, the weakening western equatorial Pacific carbon source and relatively stable eastern intense source caused an increase west-east difference of CO2 flux in the equatorial Pacific during the last three decades (p<0.001).
The increasing west-east difference of CO2 flux was also found in the northern temperate Pacific during the last three decades (p<0.001), with a relatively slower speed due to the small difference between the strengthening speed of the western and the eastern carbon sink. Although there is no significant difference in pCO2 growth between the western Pacific and Eastern Pacific in 18-44°N, the higher wind speed in the western Pacific causes a faster increase of CO2 flux in the western Pacific. While in the southern temperate Pacific, the west-east difference of CO2 flux increased slightly in the 1990s (p<0.001), with a not significant trend during the last two decades (p=0.41). On the opposite, the west-east difference of CO2 flux in the north subpolar Pacific slightly decreased in the 1990s (p=0.003), and then continuously increased since 2013 (p<0.001), with a stronger sink in the eastern Pacific. The west-east difference of CO2 flux in the Pacific sector of the Southern Ocean was near zero in 1992, and then increased to 0.04 PgC yr-1 in 2020 (p<0.001).
Due to the increasing west-east difference of CO2 flux in the equatorial and northern temperate Pacific, the total west-east difference in the Pacific increased from 0.41 PgC yr-1 in 1992 to 0.88 PgC yr-1 in 2014 (p<0.001). It then fluctuated and reached 0.73 PgC yr-1 until 2020 under the influence of decreasing difference in the southern temperate Pacific and the increasing inverted difference in the north subpolar Pacific. Despite the limited influence on the long-term trend of the west-east difference, the El Nino events during 1997-1998 and 2015-2016 caused a decrease of nearly 0.25 PgC yr-1 in the entire west-east difference of Pacific CO2 flux in short years.
Discussion
With the remarkable differences in CO2 flux between the eastern and western Pacific, the eastern Pacific released more CO2 than the west in the equatorial oceans, while the western Pacific uptakes more CO2 than the east in the temperate oceans. The long-standing difference in the carbon budget between the western and the eastern Pacific may cause differences in the seawater acidification rate. The pH in the western Pacific may decrease more rapidly due to greater CO2 uptakes. However, the pH measurements from the GLODAP dataset suggested a different conclusion in the surface ocean of the Pacific (Figure 5). In the western temperate Pacific 18-44°N, the average pH at 0-30m decreased by 0.0013 units per year, slightly slower than the average speed of -0.0016 units per year in the eastern temperate Pacific at 0-30 m (Lauvset et al., 2021). Previous research suggested a global average pH decreasing speed of 0.0016 units per year (Chau et al., 2020), higher than the GLODAP suggested in the surface ocean of the western temperate Pacific. However, the average pH decreasing speed calculated from discrete measurements may be influenced by the number and location of samples. Gridded pH product from the Japan Meteorological Agency (JMA) and the Global ocean biogeochemistry hindcast suggested an average acidification speed of 0.0017-0.0020 per year in the western temperate Pacific 18-44°N, compared to the 0.0018-0.0019 per year in the east (Perruche, 2018; Iida et al., 2021). The differences in the average pH decreasing speed between the western and eastern Pacific seems insignificant. Comparing the average growth rate between the western and eastern temperate Pacific 18-44°N, the west-east difference was not significant in both JMA (p=0.64, paired-sample t-tests) and GOB (p=0.54, paired-sample t-tests) products. Also, the decadal trend of the west-east difference in the average pH growth rate was not statically significant (Figure 5D), although the west-east difference in CO2 flux was increasing during the last three decades. It can be concluded that the west-east difference in the CO2 flux did not cause a difference in the surface ocean acidification speed in the last three decades.
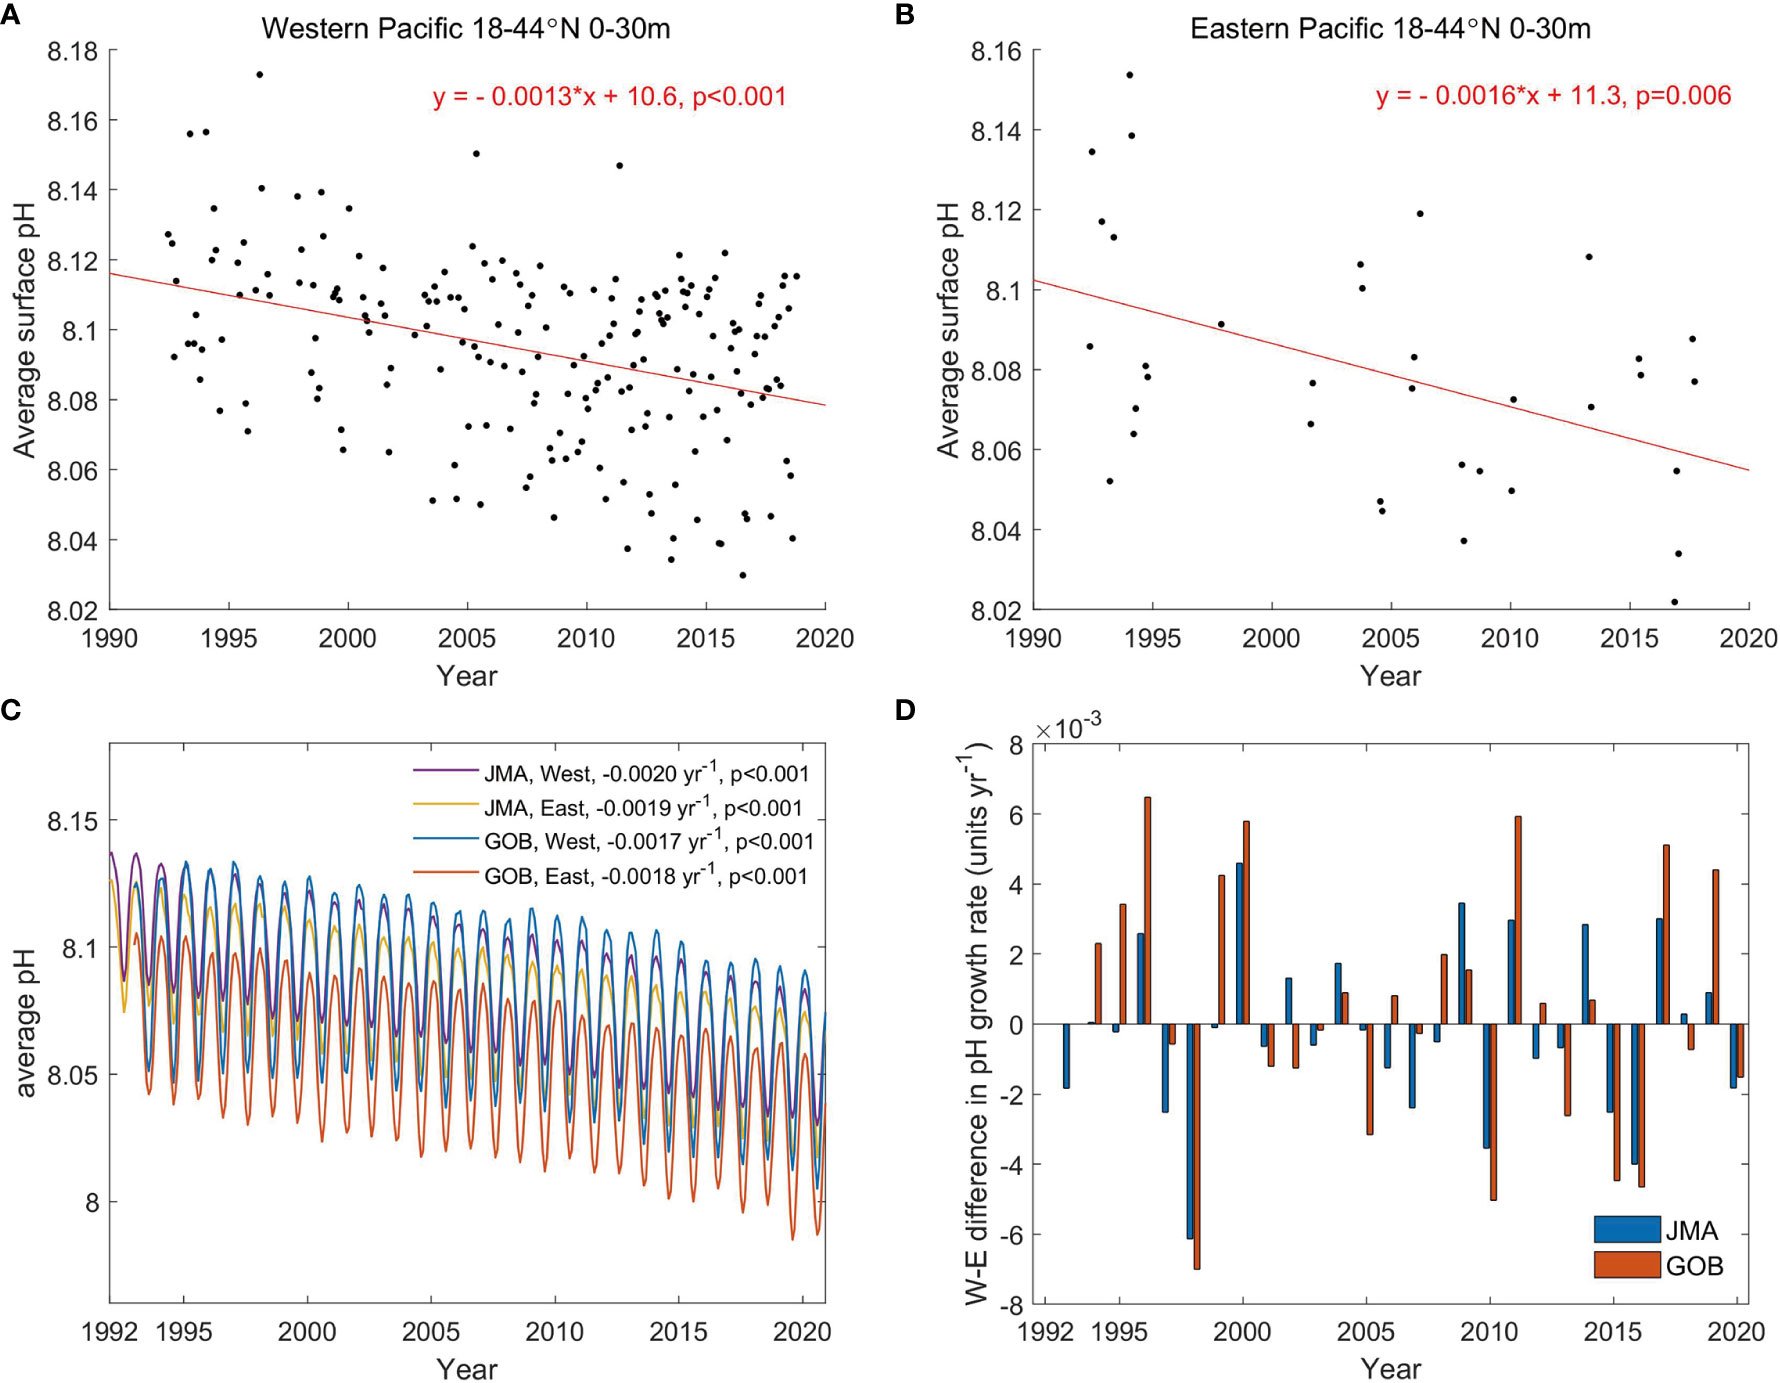
Figure 5 Average pH in the northern temperate Pacific (18-44° N) from GLODAP and gridded pH product during 1992-2020. (A): average pH in the western Pacific 18-44° N at 0-30m; (B): average pH in the eastern Pacific 18-44° N at 0-30m; (C): average surface ocean pH in the western and eastern temperate Pacific 18-44° N from the Japan Meteorological Agency (JMA) product and the Global ocean biogeochemistry hindcast product (Perruche, 2018; Iida et al., 2021); (D): west-east difference in the average pH growth rate of different pH products (trendwest-trendeast), the positive values suggest that the pH in the eastern Pacific decreases faster. The symbol “*” represents a multiplication sign.
The inconsistent west-east difference in the CO2 flux and pH decreasing speed was because the CO2 absorbed in the western temperate Pacific did not only stay in the surface oceans, but was mainly transferred to the particulate organic carbon (POC) by the phytoplankton on the surface. The POC then transported toward deeper waters, with remineralization releasing CO2 and causing the pH to decrease. The remote sensing monitor data suggested a higher surface POC concentration in the western Pacific Ocean (Stramski et al., 2008). In the western Pacific 30-44° N, where the carbon sink was significantly strong, the surface POC concentration was higher than 50 mg m-3 (Figure 6A). While in the same latitude of the eastern Pacific, the POC concentration was lower. The higher POC in the surface ocean further resulted in a higher POC flux at 0-600m in the western Pacific than in the east (Figure 6B). However, the POC is continuously degraded as it sinks downward, with part of the carbon left in the waters. So the vertical transport of CO2 absorbed in the surface toward deeper waters through the biological pump counteracted the effect of increasing west-east difference of CO2 uptakes in the temperate Pacific.
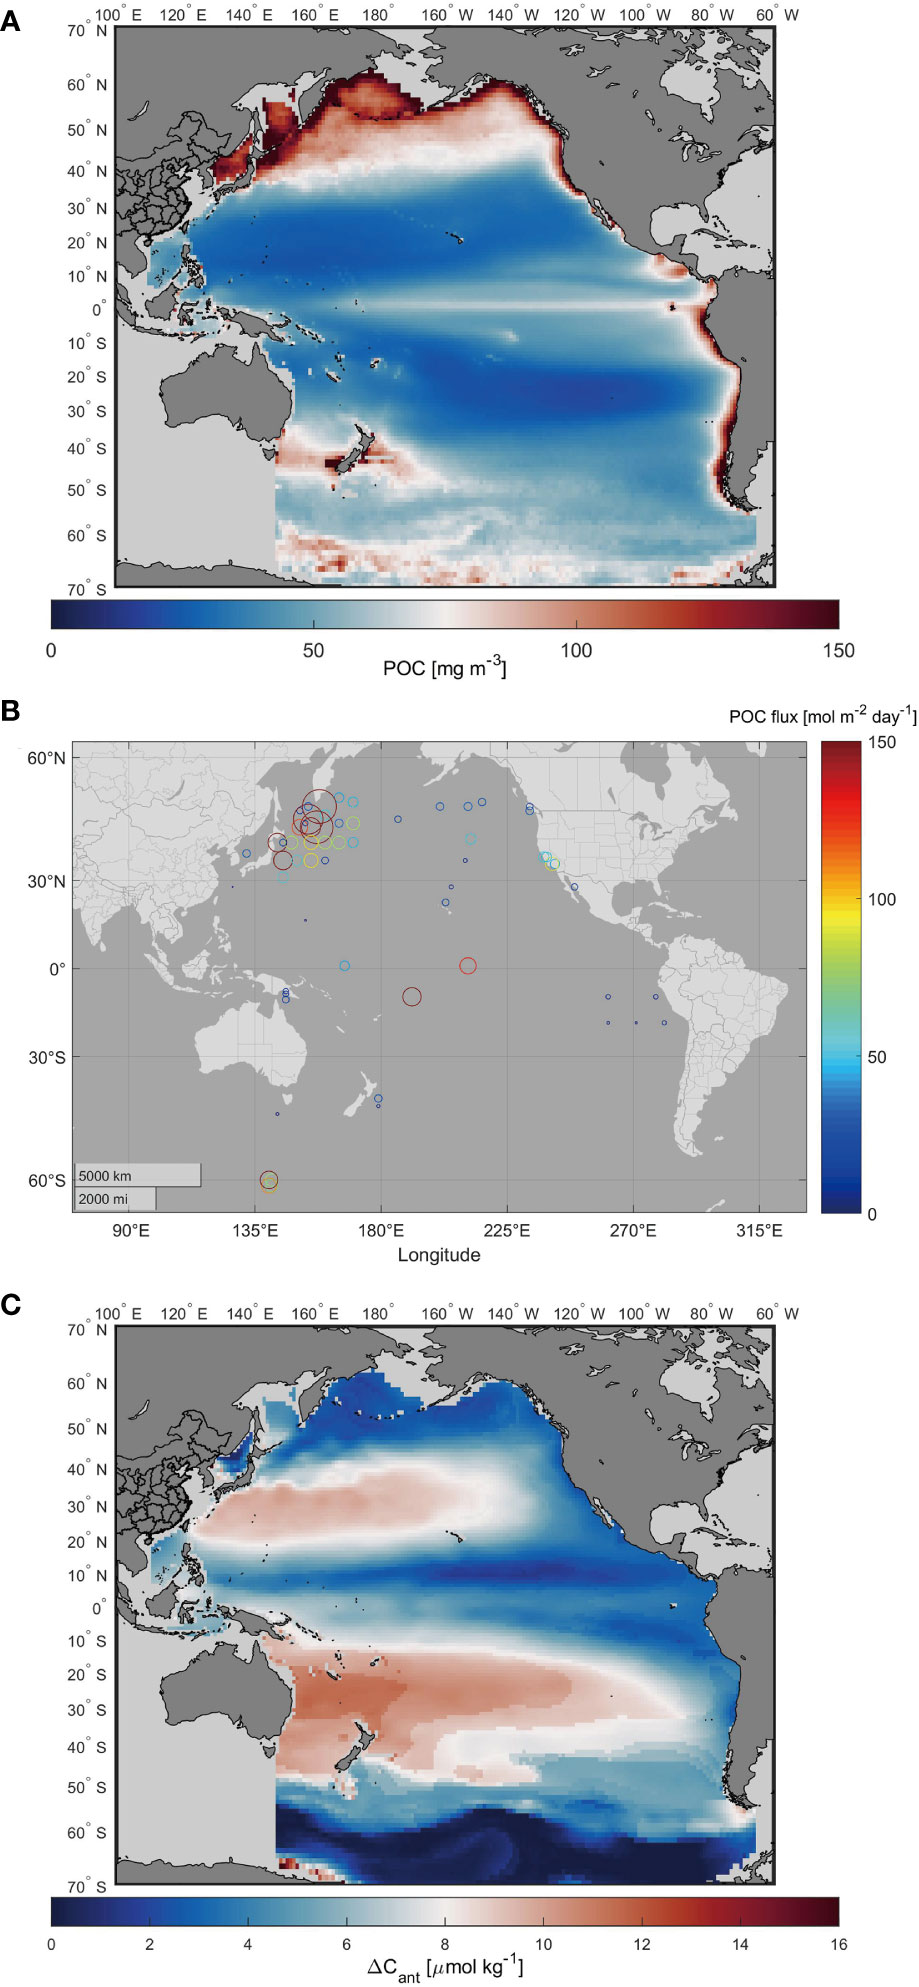
Figure 6 Long-term average distribution of (A) surface POC concentration during 2002-2020 (Stramski et al., 2008), (B) POC flux at 30-600m during 1988-2019 (the POC flux data were collected from references listed in supplement), and (C) change of anthropogenic CO2 in the Pacific at 200-600m during 1994-2007 (Gruber et al., 2019).
On the other hand, the significant west-east difference in the carbon sink intensity resulted in a great west-east difference in the change of carbon inventory according to the estimate of anthropogenic carbon change (ΔCant) during 1994-2007 at 200-600m (Gruber et al., 2019). The ΔCant in the western Pacific at 200-600m is much higher than that in the eastern Pacific (Figure 6C). However, most of the particulate organic carbon was degraded in the water above 600m, with only a fraction of POC continuing to move downward, which resulted in a smaller west-east difference in ΔCant in the deeper water bodies. While at 0-200m, the abundant carbon was delivered downward in organic form through sedimentation and inorganic form through vertical mixing, leading to a significant increase in the carbon inventory of both the western and eastern temperate Pacific. As a result, the Δcant during 1994-2007 at 0-200m in the temperate Pacific was higher than 14 µmol kg-1 (Gruber et al., 2019). At the same time, the west-east difference of ΔCant was small and less evident in the spatial distribution due to the high values of ΔCant in the temperate Pacific. Overall, the west-east difference of carbon sinks in the northern temperate Pacific Ocean did not cause a higher acidification speed in the western Pacific than the east at the surface ocean. In addition, more carbon absorbed in the western Pacific led to a larger ΔCant below 200m. However, the same difference was found in the southern temperate Pacific. It may also attribute to the west-east difference of POC delivered downward driven by the difference of sea-air CO2 flux, despite the limited POC flux measurements supporting.
Conclusions
We reestimated the sea-air CO2 flux in the Pacific Ocean during 1992-2020 using the gridded surface ocean pCO2 data constructed by the Stepwise-FFNN algorithm. Comparing the CO2 flux in the western and eastern Pacific, we found that the west-east CO2 flux difference existed in all seasons, with the most significant seasonal change in the north temperate Pacific driven by wind speed changes. In the last three decades, the average total carbon sink was -0.72 ± 0.18 PgC yr-1 in the western Pacific and -0.01 ± 0.16 PgC yr-1 in the eastern Pacific, showing a increasing difference between the east and west. The west-east difference in the equatorial Pacific decreased significantly during El Nino events due to the weakening eastern equatorial carbon source but rose back quickly after El Nino events ended. The west-east difference in the 18-44°N region was also affected by El Nino events, but the scale was lower than that in the equatorial region. On the decadal scale, although the western Pacific has uptake more CO2 than the east for decades, the west-east CO2 flux difference was still increasing in the north temperate and equatorial Pacific. In contrast, the differences in other regions were relatively stable. With the strengthening western Pacific carbon sink and the relatively stable eastern Pacific carbon source, the west-east difference of CO2 flux in the entire Pacific increased from 0.41 PgC yr-1 in 1992 to 0.88 PgC yr-1 in 2014, but then decreased to 0.73 PgC yr-1 until 2020 due to the decreasing difference in the southern temperate Pacific and the increasing inverted difference in the north subpolar Pacific. However, the increasing west-east difference in CO2 uptakes during the last three decades did not cause a difference in the surface ocean acidification speed between the west and east of the temperate Pacific. The greater CO2 absorbed in the western Pacific was transferred to the particulate organic carbon by the phytoplankton at surface water and transported toward deeper waters. In addition, the stronger carbon sink in the western Pacific caused a higher POC flux at 30-600m. With more POC delivered downward, the anthropogenic carbon in the western Pacific increased more rapidly than in the east. Because most parts of the POC degraded above 600m and the inorganic carbon was transported downward by vertical mixing at 0-200m, the west-east difference of increased anthropogenic carbon was more significant at 200-600 m.
Data availability statement
The original contributions presented in the study are included in the article/Supplementary Material. Further inquiries can be directed to the corresponding authors.
Author contributions
GZ, JM, and XL analyzed the data, and GZ wrote this paper. JS, HY, LD, and FW improved this paper. BQ, YW, BZ, and NL contributed to the public share and maintenance of CO2 flux data used in the paper. QW, JX, and DT collected and consolidated the POC flux data. All authors contributed to the article and approved the submitted version.
Funding
This research has been supported by the National Natural Science Foundation of China (grant nos. 91958103), the Marine S&T Fund of Shandong Province for the Pilot National Laboratory for Marine Science and Technology (Qingdao) (No. 2022QNLM040003), the National Key Research and Development Program of China (No.2017YFA0603204), Shandong Province and Yantai City Talent Programs, the Wenhai Program of QNLM (No. 2021WHZZB0900), the National Natural Science Foundation of China (grant nos. 42176200, and 41906035), and the Natural Science Foundation of Shandong Province (grant no. ZR2020YQ28, and ZR2019BD068).
Acknowledgments
We thank the data support of Marine Science Data Center and Public Technical Service Center, institute of Oceanology, Chinese Academy of Sciences. We thank SOCAT for sharing the pCO2 observation data. The Surface Ocean CO2 Atlas (SOCAT) is an international effort, endorsed by the International Ocean Carbon Coordination Project (IOCCP), the Surface Ocean Lower Atmosphere Study (SOLAS) and the Integrated Marine Biosphere Research (IMBeR) program, to deliver a uniformly quality-controlled surface ocean CO2 database. The many researchers and funding agencies responsible for the collection of data and quality control are thanked for their contributions to SOCAT.
Conflict of interest
The authors declare that the research was conducted in the absence of any commercial or financial relationships that could be construed as a potential conflict of interest.
Publisher’s note
All claims expressed in this article are solely those of the authors and do not necessarily represent those of their affiliated organizations, or those of the publisher, the editors and the reviewers. Any product that may be evaluated in this article, or claim that may be made by its manufacturer, is not guaranteed or endorsed by the publisher.
Supplementary material
The Supplementary Material for this article can be found online at: https://www.frontiersin.org/articles/10.3389/fmars.2022.1088181/full#supplementary-material
References
Atlas R., Hoffman R. N., Ardizzone J., Leidner S. M., Jusem J. C., Smith D. K., et al. (2011). A cross-calibrated, multiplatform ocean surface wind velocity product for meteorological and oceanographic applications. Bulletin of the American Meteorological Society 92 (2), 157–174. doi: 10.1175/2010BAMS2946.1
Bakker D. C.E., Alin Simone R., Becker M., et al. (2022)Surface ocean CO2 atlas database version 2022 (SOCATv2022) (NCEI accession 0253659). [fCO2]. (Accessed [2022/04/01]).
Bakker D. C. E., Pfeil B., Landa C. S., Metzl N., O’Brien K. M., Olsen A., et al. (2016). A multi-decade record of high-quality fCO2 data in version 3 of the surface ocean CO2 atlas (SOCAT), earth system science data. Earth Syst. Sci. Data 8, 383–413. doi: 10.5194/essd-8-383-2016
Banzon V., Smith T. M., Chin T. M., Liu C., Hankins W. (2016). A long-term record of blended satellite and in situ sea-surface temperature for climate monitoring, modeling and environmental studies. Earth Syst. Sci. Data 8 (1), 165–176. doi: 10.5194/essd-8-165-2016
Boyer T. P., Garcia H. E., Locarnini R. A., Zweng M. M., Mishonov A. V., Reagan J. R., et al. (2018) World ocean atlas 2018 [Dissolved inorganic nutrients and dissolved oxygen], NOAA national centers for environmental information [data set]. Available at: https://accession.nodc.noaa.gov/NCEI-WOA18 (Accessed 4 August 2020).
Broullón D., Pérez F. F., Velo A., Hoppema M., Olsen A., Takahashi T., et al. (2019). A global monthly climatology of total alkalinity: a neural network approach. Earth Syst. Sci. Data 11 (3), 1109–1127. doi: 10.5194/essd-11-1109-2019
Broullón D., Pérez F. F., Velo A., Hoppema M., Olsen A., Takahashi T., et al. (2020). A global monthly climatology of oceanic total dissolved inorganic carbon: A neural network approach. Earth Syst. Sci. Data 12 (3), 1725–1743. doi: 10.5194/essd-12-1725-2020
Chau T. T. T., Gehlen M., Chevallier F. (2020). Quality information document for global ocean surface carbon product MULTIOBS_GLO_BIO_CARBON_SURFACE_REP_015_008, doctoral dissertation. Le Lab. Des. Sci. du Climat l’Environ. doi: 10.48670/moi-00224
Chau T. T. T., Gehlen M., Chevallier F. (2022). A seamless ensemble-based reconstruction of surface ocean pCO2 and air–sea CO2 fluxes over the global coastal and open oceans. Biogeosciences 19 (4), 1087–1109. doi: 10.5194/bg-19-1087-2022
Denvil-Sommer A., Gehlen M., Vrac M., Mejia C. (2019). LSCE-FFNN-v1: A two-step neural network model for the reconstruction of surface ocean pCO2 over the global ocean. Geosci. Model. Dev. 12 (5), 2091–2105. doi: 10.5194/gmd-12-2091-2019
DeVries T., Holzer M., Primeau F. (2017). Recent increase in oceanic carbon uptake driven by weaker upper-ocean overturning. Nature 542 (7640), 215–218. doi: 10.1038/nature21068
Donlon C. J., Minnett P. J., Gentemann C., Nightingale T. J., Barton I. J., Ward B., et al. (2002). Toward improved validation of satellite sea surface skin temperature measurements for climate research. J. Climate 15 (4), 353–369. doi: 10.1175/1520-0442(2002)015<0353:TIVOSS>2.0.CO;2
Donlon C., Robinson I., Casey K. S., Vazquez-Cuervo J., Armstrong E., Arino O., et al. (2007). The global ocean data assimilation experiment high-resolution sea surface temperature pilot project. Bull. Am. Meteorol. Soc. 88 (8), 1197–1214. doi: 10.1175/BAMS-88-8-1197
Feely R. A., Takahashi T., Wanninkhof R., McPhaden M. J., Cosca C. E., Sutherland S. C., et al. (2006). Decadal variability of the air-sea CO2 fluxes in the equatorial pacific ocean. J. Geophys. Res.: Oceans. 111(C8). doi: 10.1029/2005jc003129
Feely R. A., Wanninkhof R., Goyet C., Archer D. E., Takahashi T. (1997). Variability of CO2 distributions and sea-air fluxes in the central and eastern equatorial pacific during the 1991–1994 El nino. Deep Sea Res. Part II: Topical Stud. Oceanogr. 44 (9-10), 1851–1867. doi: 10.1016/s0967-0645(97)00061-1
Feely R. A., Wanninkhof R., Takahashi T., Tans P. (1999). Influence of El niño on the equatorial pacific contribution to atmospheric CO2 accumulation. Nature 398 (6728), 597–601. doi: 10.1038/19273
Friedlingstein P., Jones M. W., O’Sullivan M., Andrew R. M., Hauck J., Peters G. P., et al. (2019). Global carbon budget 2019, earth syst. Sci. Data 11, 1783–1838. doi: 10.5194/essd-11-1783-2019
GLOBALVIEW-CO2 (2011) Cooperative atmospheric data integration project – carbon dioxide CD-ROM, NOAA ESRL (Boulder, Colorado) (Accessed 25 February 2022).
Gruber N., Clement D., Carter B. R., Feely R. A., Van Heuven S., Hoppema M., et al. (2019). The oceanic sink for anthropogenic CO2 from 1994 to 2007. Science 363 (6432), 1193–1199. doi: 10.1126/science.aau5153
Gruber N., Gloor M., Mikaloff Fletcher S. E., Doney S. C., Dutkiewicz S., Follows M. J., et al. (2009). Oceanic sources, sinks, and transport of atmospheric CO2. Global biogeochem. cycles 23 (1). doi: 10.1029/2008GB003349
Ho D. T., Wanninkhof R., Schlosser P., Ullman D. S., Hebert D., Sullivan K. F. (2011). Toward a universal relationship between wind speed and gas exchange: Gas transfer velocities measured with 3He/SF6 during the Southern Ocean Gas Exchange Experiment. J. Geophys. Res. Oceans 116(C4). doi: 10.1029/2010jc006854
Iida Y., Takatani Y., Kojima A., Ishii. M. (2021). Global trends of ocean CO2 sink and ocean acidification: An obsevation-based reconstruction of surface ocean inorganic carbon variables. J. Oceanogr. 77 (2), 323–358. doi: 10.1007/s10872-020-00571-5
Ishii M., Feely R. A., Rodgers K. B., Park G. H., Wanninkhof R., Sasano D., et al. (2014). Air–sea CO2 flux in the pacific ocean for the period 1990–2009. Biogeosciences 11 (3), 709–734. doi: 10.5194/bg-11-709-2014
Landschützer P., Gruber N., Bakker D. C. (2016). Decadal variations and trends of the global ocean carbon sink. Global Biogeochem. Cycles 30 (10), 1396–1417. doi: 10.1002/2015GB005359
Landschützer P., Gruber N., Bakker D. C., Schuster U. (2014). Recent variability of the global ocean carbon sink. Global Biogeochem. Cycles 28 (9), 927–949. doi: 10.1002/2014GB004853
Landschützer P., Laruelle G. G., Roobaert A., Regnier P. (2020). A uniform pCO2 climatology combining open and coastal oceans. Earth Syst. Sci. Data 12 (4), 2537–2553. doi: 10.5194/essd-12-2537-2020
Lauvset S. K., Lange N., Tanhua T., Bittig H. C., Olsen A., Kozyr A., et al. (2021). An updated version of the global interior ocean biogeochemical data product, GLODAPv2. 2021 Earth Syst. Sci. Data 13 (12), 5565–5589. doi: 10.5194/essd-13-5565-2021
Menemenlis D., Campin J. M., Heimbach P., Hill C., Lee T., Nguyen A., et al. (2008). ECCO2: High resolution global ocean and sea ice data synthesis. Mercator Ocean Q. Newslett. 31, 13–21.
Perruche C. (2018). Product user manual for the Global Ocean Biogeochemistry Hindcast GLOBAL_REANALYSIS_BIO_001_029. Version 1. Copernicus Marine Environmental Monitoring Service 17. doi: 10.25607/OBP-490
Pfeil B., Olsen A., Bakker D. C., Hankin S., Koyuk H., Kozyr A., et al. (2013). A uniform, quality controlled Surface Ocean CO2 Atlas (SOCAT). Earth Syst. Sci. Data 5 (1), 125–143. doi: 10.5194/essd-5-125-2013.
Sabine C. L., Feely R. A., Gruber N., Key R. M., Lee K., Bullister J. L., et al. (2004). The oceanic sink for anthropogenic CO2. science 305 (5682), 367–371. doi: 10.1126/science.1097403
Sabine C. L., Hankin S., Koyuk H., Bakker D. C., Pfeil B., Olsen A., et al. (2013). Surface Ocean CO2 Atlas (SOCAT) gridded data products. Earth Syst. Sci. Data 5(1), 145–153. doi: 10.5194/essd-5-145-2013.
Stramski D., Reynolds R. A., Babin M., Kaczmarek S., Lewis M. R., Röttgers R., et al. (2008). Relationships between the surface concentration of particulate organic carbon and optical properties in the eastern south pacific and eastern Atlantic oceans. Biogeosciences 5 (1), 171–201. doi: 10.5194/bg-5-171-2008
Takahashi T., Sutherland S. C., Wanninkhof R., Sweeney C., Feely R. A., Chipman D. W., et al. (2009). Climatological mean and decadal change in surface ocean pCO2, and net sea–air CO2 flux over the global oceans. Deep Sea Res. Part II: Topical Stud. Oceanogr. 56 (8-10), 554–577. doi: 10.1016/j.dsr2.2008.12.009
Wang G., Dai M., Shen S. S.P., Bai Y., Xu Y. (2014). Quantifying uncertainty sources in the gridded data of sea surface CO2 partial pressure. J. Geophys. Res. Oceans 119, 1–9. doi: 10.1002/2013JC009577
Wanninkhof R. (1992). Relationship between wind speed and gas exchange over the ocean. J. Geophys. Res.: Oceans 97 (C5), 7373–7382. doi: 10.1029/92JC00188
Wanninkhof R., Park G. H., Takahashi T., Sweeney C., Feely R., Nojiri Y., et al. (2013). Global ocean carbon uptake: magnitude, variability and trends. Biogeosciences 10 (3), 1983–2000. doi: 10.5194/bg-10-1983-2013
Watson A. J., Schuster U., Shutler J. D., Holding T., Ashton I. G., Landschützer P., et al. (2020). Revised estimates of ocean-atmosphere CO2 flux are consistent with ocean carbon inventory. Nat. Commun. 11 (1), 1–6. doi: 10.1038/s41467-020-18203-3
Weiss R. (1974). Carbon dioxide in water and seawater: the solubility of a non-ideal gas. Mar. Chem. 2 (3), 203–215. doi: 10.1016/0304-4203(74)90015-2
Wentz F. J., Scott J., Hoffman R., Leidner M., Atlas R., Ardizzone J. (2015) Remote sensing systems cross-calibrated multi-platform (CCMP) 6-hourly ocean vector wind analysis product on 0.25 deg grid, version 2.0. remote sensing systems (Santa Rosa, CA). Available at: www.remss.com/measurements/ccmp (Accessed 01 Apr 2022).
Woolf D. K., Land P. E., Shutler J. D., Goddijn-Murphy L. M., Donlon C. J. (2016). On the calculation of air-sea fluxes of CO2 in the presence of temperature and salinity gradients. J. Geophys. Res.: Oceans 121 (2), 1229–1248. doi: 10.1002/2015JC011427
Woolf D. K., Shutler J. D., Goddijn-Murphy L., Watson A. J., Chapron B., Nightingale P. D., et al. (2019). Key uncertainties in the recent air-sea flux of CO2. Global Biogeochem. Cycles 33 (12), 1548–1563. doi: 10.1029/2018GB006041
Zhong G. (2021). Global surface ocean pCO2 product based on a stepwise FFNN algorithm. Chin. Acad. Sci. Mar. Sci. Data Center [data set code]. doi: 10.12157/iocas.2021.0022
Keywords: carbon sink/source, difference, acidification, western/eastern Pacific, Pacific Ocean
Citation: Zhong G, Li X, Song J, Qu B, Wang F, Wang Y, Zhang B, Tian D, Ma J, Yuan H, Duan L, Li N, Wang Q and Xing J (2022) The increasing big gap of carbon sink between the western and eastern Pacific in the last three decades. Front. Mar. Sci. 9:1088181. doi: 10.3389/fmars.2022.1088181
Received: 03 November 2022; Accepted: 21 November 2022;
Published: 02 December 2022.
Edited by:
Peng Jin, University of Guangzhou, ChinaReviewed by:
Xueqiang Lu, Nankai University, ChinaXiaoxia Lv, China University of Geosciences Wuhan, China
Copyright © 2022 Zhong, Li, Song, Qu, Wang, Wang, Zhang, Tian, Ma, Yuan, Duan, Li, Wang and Xing. This is an open-access article distributed under the terms of the Creative Commons Attribution License (CC BY). The use, distribution or reproduction in other forums is permitted, provided the original author(s) and the copyright owner(s) are credited and that the original publication in this journal is cited, in accordance with accepted academic practice. No use, distribution or reproduction is permitted which does not comply with these terms.
*Correspondence: Xuegang Li, bGl4dWVnYW5nQHFkaW8uYWMuY24=; Jinming Song, am1zb25nQHFkaW8uYWMuY24=