 Yaoran Fan1,2†Xiao Wu1,2†Feiyue Ling1,2Zefei Wang1,2Keyi Ma1,2Nan Xie3Juanying Li2,4
 Jianbin Feng1,2*
 Jiale Li1,2*
- 1Key Laboratory of Freshwater Aquatic Genetic Resources, Ministry of Agriculture and Rural Affairs, Shanghai Ocean University, Shanghai, China
- 2National Demonstration Center for Experimental Fisheries Science Education, Shanghai Ocean University, Shanghai, China
- 3College of Marine Ecology and Environment, Shanghai Ocean University, Shanghai, China
- 4Fishery Research Institute, Hangzhou Academy of Agriculture Sciences in Zhejiang Province, Hangzhou, Zhejiang, China
Salinity is an ecological factor affecting the physiology, survival, and distribution of crustaceans. Additionally, salinity fluctuation detrimentally affects the composition and biological process of crustaceans. As a significant commercial aquaculture species in China, Japan, and Southeast Asian countries, the oriental river prawn, Macrobrachium nipponense, can tolerate a wide range of salinity. The transcriptome, proteome, histology, and physiology analysis were utilized to explore the physiological responses and molecular mechanisms of salinity tolerance in M. nipponense. Through the three-month culture, the statistic of growth trait illustrated the relatively excellent performance of M. nipponense in low salinity, and the higher salinity exposure significantly affected the growth of M. nipponense. In terms of the histological analysis, the gills and hepatopancreas of M. nipponense suffered varying degrees of damage. Besides, the activities of the digestive, immune-related, and metabolic enzymes were calculated. These results indicated that salinity significantly influenced trypsin and amylase in hepatopancreas, especially in 14 ppt. The immune-related enzymes were activated in high salinity. Notably, the activity of metabolic enzymes was significantly low in 7 and 14 ppt, which testified that the 7 ppt to 14 ppt were near the isotonic point of M. nipponense. In gills, hepatopancreas, and muscle, high-throughput mRNA sequencing revealed 11356, 2227, and 1819 differentially expressed genes (DEGs) by comparing the 7, 14, and 21 ppt groups with the 0ppt group, respectively. The TMT-labeling proteome identified 439 and 230 differentially expressed proteins (DEPs) in gills and hepatopancreas through the comparison of the 7, 14, and 21 ppt groups to the 0 ppt group, respectively. Additionally, through the integration of transcriptome and proteome, several pathways related to salinity adaptation were enriched, including protein export, cGMP-PKG signaling pathway, Amino sugar and nucleotide sugar metabolism, and Glycine, serine and threonine metabolism. Besides, 16 up and down-regulated proteins and related DEGs were detected through KEGG enrichment analysis, including ETHE1, BIP, chitinase (E3.2.1.14), and SARDH. Notably, no significantly regulated proteins and related DEGs were recorded by the correlation of transcriptome and proteome of 0 ppt and 7 ppt in hepatopancreas. Thus, the optimum survival salinity of M. nipponense may range from 0 ppt to 7 ppt. Overall, these results may provide valuable insights into the mechanisms underlying the culture of M. nipponense in different salinity.
1 Introduction
In aquaculture, salinity is one of the most critical environmental factors affecting the establishment, development, and growth of aquatic organisms, as well as their distribution and physiological functions (Fan et al., 2022a; Fan et al., 2022b). Crustacea are sensitive to salinity, adversely affecting their metabolism, osmoregulation, and growth traits. This impacts moulting, oogenesis, embryogenesis, and larval development. (Jiang et al., 2000; Giménez and Anger, 2001). The osmoregulation mechanism of aquatic organisms allows them to maintain homeostasis in non-isotonic water salinity (Huang et al., 2019). Even though some crustaceans can tolerate extensive salinity ranges (Huni and Aravindan, 1985; Jiang et al., 2000; Ye et al., 2009), drastic changes in salinity can damage or even kill certain species. Additionally, the optimal salinity for growth may vary depending on the aquatic species. Currently, aquaculture has developed a trend of using freshwater species to acclimate to seawater, and seawater species to desalinate (Nikapitiya et al., 2014).
The oriental river prawn, Macrobrachium nipponense, is one of the most critical commercial aquaculture species in Europe, China, Japan, and Southeast Asia (Fan et al., 2022a; Fan et al., 2022b). M. nipponense commonly occurs in estuaries and freshwater habitats with low salinity (Ma et al., 2011; Ma et al., 2012; Kumar Chourasia et al., 2018). A few studies have reported that M. nipponense is capable of surviving ranges of salinity between 7 and 20 ppt (Huang et al., 2019; Wang et al., 2002). Besides, there is evidence to suggest that a salinity of 7 ppt can promote the growth of M. nipponense (Huang et al., 2019). Consequently, the ability to tolerate salinity provided this species with more potential for cultivation. Furthermore, the results of previous studies have demonstrated that crustaceans may regulate mechanisms such as metabolism, immunity response, and osmoregulation in order to adapt to the alterations in their environment resulting from exposure to salinity stress (Fan et al., 2022b; Xue et al., 2022). Since crustaceans channel energy into osmotic adjustment, their growth is significantly reduced due to increased salinity acclimation (Xue et al., 2022a). Furthermore, the nutrition performance (Ding et al., 2017), germplasm regulation (Ma et al., 2012), and immune resource (Tang et al., 2017) of M. nipponense were also essentially deliberative processes. Even though there has been considerable progress in crustacean research over the last few decades, only a few studies have explicitly focused on salinity adaptations (Fan et al., 2022a). However, it is remarkable how differently M. nipponense responds to long-term salinity gradients at the transcriptomic and proteomic levels. Therefore, it is essential to understand the mechanisms underlying salinity adaptation in M. nipponese, transcriptome and proteome were conducted. A wide variety of applications have been made possible by transcriptomes to reveal molecular resources for non-model organisms with biological and economic importance at the gene level (Dai et al., 2021; Fan et al., 2022a; Xue et al., 2022). By contrast, the proteomic analysis reveals how signal transduction impacts the biochemical process (Jin et al., 2018; Chang et al., 2020).
Overall, the transcriptome and proteome changes in long-term different salinity gradients were determined to investigate the related gene and protein responsible for the molecular involvements to M. nipponense after long-term salinity exposure. Integrating transcriptome, proteome, histology, and biochemistry might emerge a new paradigmatic approach to understanding how M. nipponense responds to long-term different salinity gradients.
2 Materials and methods
2.1 Ethics approval
M. nipponense is neither an endangered species in China nor elsewhere. As part of this study, all experiments involving prawns were conducted in accordance with the Institutional Animal Care and Use Committee of Shanghai Ocean University, Shanghai, China.
2.2 Sample collection and preparation
300 Juvenile prawns (M. nipponense) of similar size with an average body length of 2.51 ± 0.24 cm and weight of 0.34 ± 0.09 g were obtained from Wuyi county (Zhejiang province, China). This experiment was performed in July 2021. Juvenile prawns were cultivated at the Hangzhou Aquaculture Research Institution (Hangzhou, China). The juvenile prawns were randomly distributed and acclimated to the laboratory conditions (temperature, 27 ± 1°C; pH, 7.6 ± 0.5; dissolved oxygen, 6.2 ± 0.6 mg) in five separate aquariums with recirculating aerated water for 14 days. Prior to the commencement of treatment, the commercial pelleted feed was provided to M. nipponense twice a day at a ratio of 6%-8% of their body weight. After adaptation to the cultivated environment, the prawns were randomly selected and divided into a recirculating system composed of four salinity groups (0 ppt, 7 ppt, 14 ppt, 21 ppt) and twelve circulating cylinders. After three-month of treatments, prawns from each circulating cylinder were sampled for histological measurements. Besides, Liquid nitrogen was utilized to freeze samples immediately for proteomic experiments, transcriptomic analysis, and biochemical treatments. The body length and body weight of M. nipponense were determined using electronic Vernier callipers (0.01 mm accuracy) and an electronic balance (0.1 g accuracy) at the beginning of the experiment (as the control group) and after three-months of culturing.
2.3 Histological analysis of M. nipponense under different salinity exposure
The hepatopancreas and gills of M. nipponense were fixed in 4% paraformaldehyde solution for 24 hours and then transferred to 70% ethanol for histological analysis. The samples were then embedded in paraffin after being dehydrated in a graded ethanol series. Eventually, using a manual rotary microtome, each piece was cut into six 4-5 mm thick sections (Ding et al., 2019). After staining with H&E, sections were viewed under a light microscope (Leica, DM3000).
2.4 Measurement of biochemical indices of M. nipponense under different salinity exposure
In order to investigate the effects of salinity on the digestibility of M. nipponense, the digestive enzyme levels (trypsin, lipase, amylase), immune-related enzymes (superoxide dismutase, SOD; acid phosphatase, ACP; alkaline phosphatase, AKP; Glutathione Peroxidase, GPX; Reduced glutathione, GSH; Malondialdehyde, MDA), and metabolic enzymes (hexokinase, HK; glycogen, GLU; and triglyceride; TG) were determined using commercially available kits (Jiancheng Bioengineering Institute, Nanjing, China), according to the manufacturer’s protocols. The measurements were performed using a Microplate reader (BIOTEK, Synergy H1). All experiments were conducted in three biological replicates and three technical replicates.
2.5 Transcriptomic analysis of M. nipponense under different salinity exposure
The gills, hepatopancreas and muscle of 30 M. nipponense were used for total RNA extraction from the control (0 ppt) and other (7, 14, and 21 ppt) groups using TRIzol reagent (Invitrigen, CA, USA) as per manufacturer instruction. RNA purity and quantity from each group were determined with a NanoDrop 2000 (Thermo Fisher Scientific Inc, USA) spectrophotometer. In all cases, the OD260/OD280 values were between 1.9 and 2.0. RNA integrity was assessed by 1% agarose gel electrophoresis, Agilent 2100 Bioanalyzer (Agilent Technologies, CA, USA). Following that, libraries were prepared for each group with the TruSeq Stranded mRNA LT Sample Prep Kit (Illumina, CA, USA). Transcriptomic sequencing and analysis were conducted by OE Biotech Co., Ltd. (Shanghai, China). Sequencing was performed on an Illumina HiSeq X Ten platform, generating 150 bp paired-end reads. Using Trimmomatic 0.39, low-quality and poly-N reads were trimmed to obtain clean data. (Bolger et al., 2014). For subsequent analyses, clean data were retained for each sample. The M. nipponense genome (cngb_100843) was utilized to map to the clean data (Jin et al., 2021) by the approach of HISAT2 (Kim et al., 2015). Bowtie2 (Langmead and Salzberg, 2012) was applied to calculate the FPKM of each gene (Roberts et al., 2011). Besides, eXpress (Roberts and Pachter, 2013) was used to determine the read counts of each gene. An analysis of differential expression was conducted using the R package DESeq2 (Love et al., 2014). The Blast2GO program and the Kaas (http://www.genome.jp/kaas-bin/kass-man) online program (KEGG Automatic Annotation Server) were used for annotating GO terms and KEGG pathways, respectively.
2.6 Proteomic analysis of M. nipponense under different salinity exposure
2.6.1 Protein extraction, TMT labeling, reversed-phase liquid chromatography, and liquid chromatography-mass spectrometry analysis
For the control group, three biological replicates of gills and hepatopancreas were conducted (n = 3; 0 ppt; gills and hepatopancreas). Proteome sequencing was performed on the remaining three groups (n = 3; 7, 14, and 21 ppt; gills and hepatopancreas). Protein was extracted using lysis buffer (1 mM PMSF). The bicinchoninic acid (BCA) was used to measure the protein concentration, and SDS-PAGE was used to assess the quality of the protein (Figure S1). Prior to tandem mass tag (TMT) labeling, 100 mg of protein was alkylated and zymolytically digested. Finally, the labelling peptides solutions were lyophilized and stored at -80°C.
In reverse-phase separation (RP), an Agilent Zorbax Extend RP column was used on an Agilent 1100 HPLC System (Agilent) (5 μm, 150 mm × 2.1 mm). Mobile phases A (2% acetonitrile in HPLC water) and B (98% acetonitrile in HPLC water) was used for the RP gradient. In order to perform mass spectrometry, the separated peptides were lyophilized. An Agilent 1100 HPLC purifier system (Agilent Technologies Inc., CA, USA) was used for liquid chromatography-mass spectrometry (LC-MS) analysis according to the method with slight modification (Cao et al., 2016).
2.6.2 Protein identification, quantification, and bioinformatics
To thoroughly search all raw fusion data against the sample protein database, Proteome Discoverer v2.4 (Thermo Scientific, Bremen, Germany) was applied. A significance threshold of p < 0.05 (with 95% confidence) was applied to the results of the analysis, along with an expected cut-off score or Ion score of 0.05 (with 95% confidence). TMT 10 was selected for protein quantification with a false discovery rate of 0.01, and at least two peptides were required for each protein group. The protein ratios were calculated for protein quantification as the median of only the unique peptides. The ratios of all peptides were normalized using the median protein ratio. The cut-off values used to identify up-regulated, and down-regulated proteins were 1.20- and 0.83-fold, respectively.
A UniProt database search was conducted to describe the proteins. The mapping function of BLAST2GO was used to extract GO function entries for all aligned protein sequences (version 3.0). Further analysis of the DEPs was conducted using KEGG to determine the active biological pathways. In order to evaluate the functional category protein enrichment, a chi-square test with a cut-off of 0.01 was performed. To control for false positives, the significance threshold was set at 0.05. To analyze the protein-protein interaction (PPI) networks among these DEPs, the STRING database (version 9.1) was used. The Cytoscape (Version 3.9.1) was used to calculate the betweenness of DEPs.
2.7 Verification transcriptome using quantitative real-time PCR (qPCR)
To observe the expression trend of the DEGs, four cDNA from gills, hepatopancreas and muscle were performed for qPCR. To meet the strict requirements outlined in the entire treatment, the 12 DEGs with high expression levels from transcriptome were randomly selected (Table S1). A comparison of the relative expression levels of the 12 candidate DEGs in the four treatment groups was performed (Figure S2). In accordance with the manufacturer’s instructions, cDNA was synthesized using a PrimeScript RT reagent kit with gDNA Eraser (TaKaRa). Following the manufacturer’s instructions, qRT-PCR was performed using a CFX96 Real-time PCR Detection System (BioRad, CA, USA) and SYBR Green Master Mix (TaKaRa, Shanghai, China). Gene expression levels were normalized in relation to the reference gene (β-actin) (Xue et al., 2022). A 20 μL reaction system, which consisted of 10 μl of SYBR Green Master Mix, 1.6 μl of cDNA, 0.8 μl (each) of forward and reversed primers, and 6.8 μl of RNase-free water, was applied. In this study, the relative gene expression was calculated using the 2−ΔΔCt method (Li et al., 2021). A one-way analysis of variance was used to analyze all data (p < 0.05).
3 Results
3.1 Statistic of growth traits of M. nipponense under long-term salinity stress
The results of the body weight and length performance of M. nipponense exposed to different salinity gradients were summarised (Figures 1, 2). The results illustrated that long-term salinity stress 14 ppt (0.436 ± 0.356 g) and 21 ppt (0.307 ± 0.124 g) inhibited weight development, compared with the control group (0.259 ± 0.081) and 0 ppt group (0.676 ± 0.499) (p < 0.05). Besides, the length of M. nipponense in 7 ppt (2.890 ± 0.514 cm) was significantly higher than in 21 ppt (2.485 ± 0.389 cm) (p < 0.05). However, there was no significant difference between the 0 ppt (2.921 ± 0.576 cm) and 7 ppt groups (p > 0.05). Similarly, the salinity stress significantly affected the length of M. nipponense in the 14 ppt and 21 ppt (p > 0.05). Additionally, the body length of M. nipponense in the 7ppt was not significantly different from 0 ppt (p > 0.05).
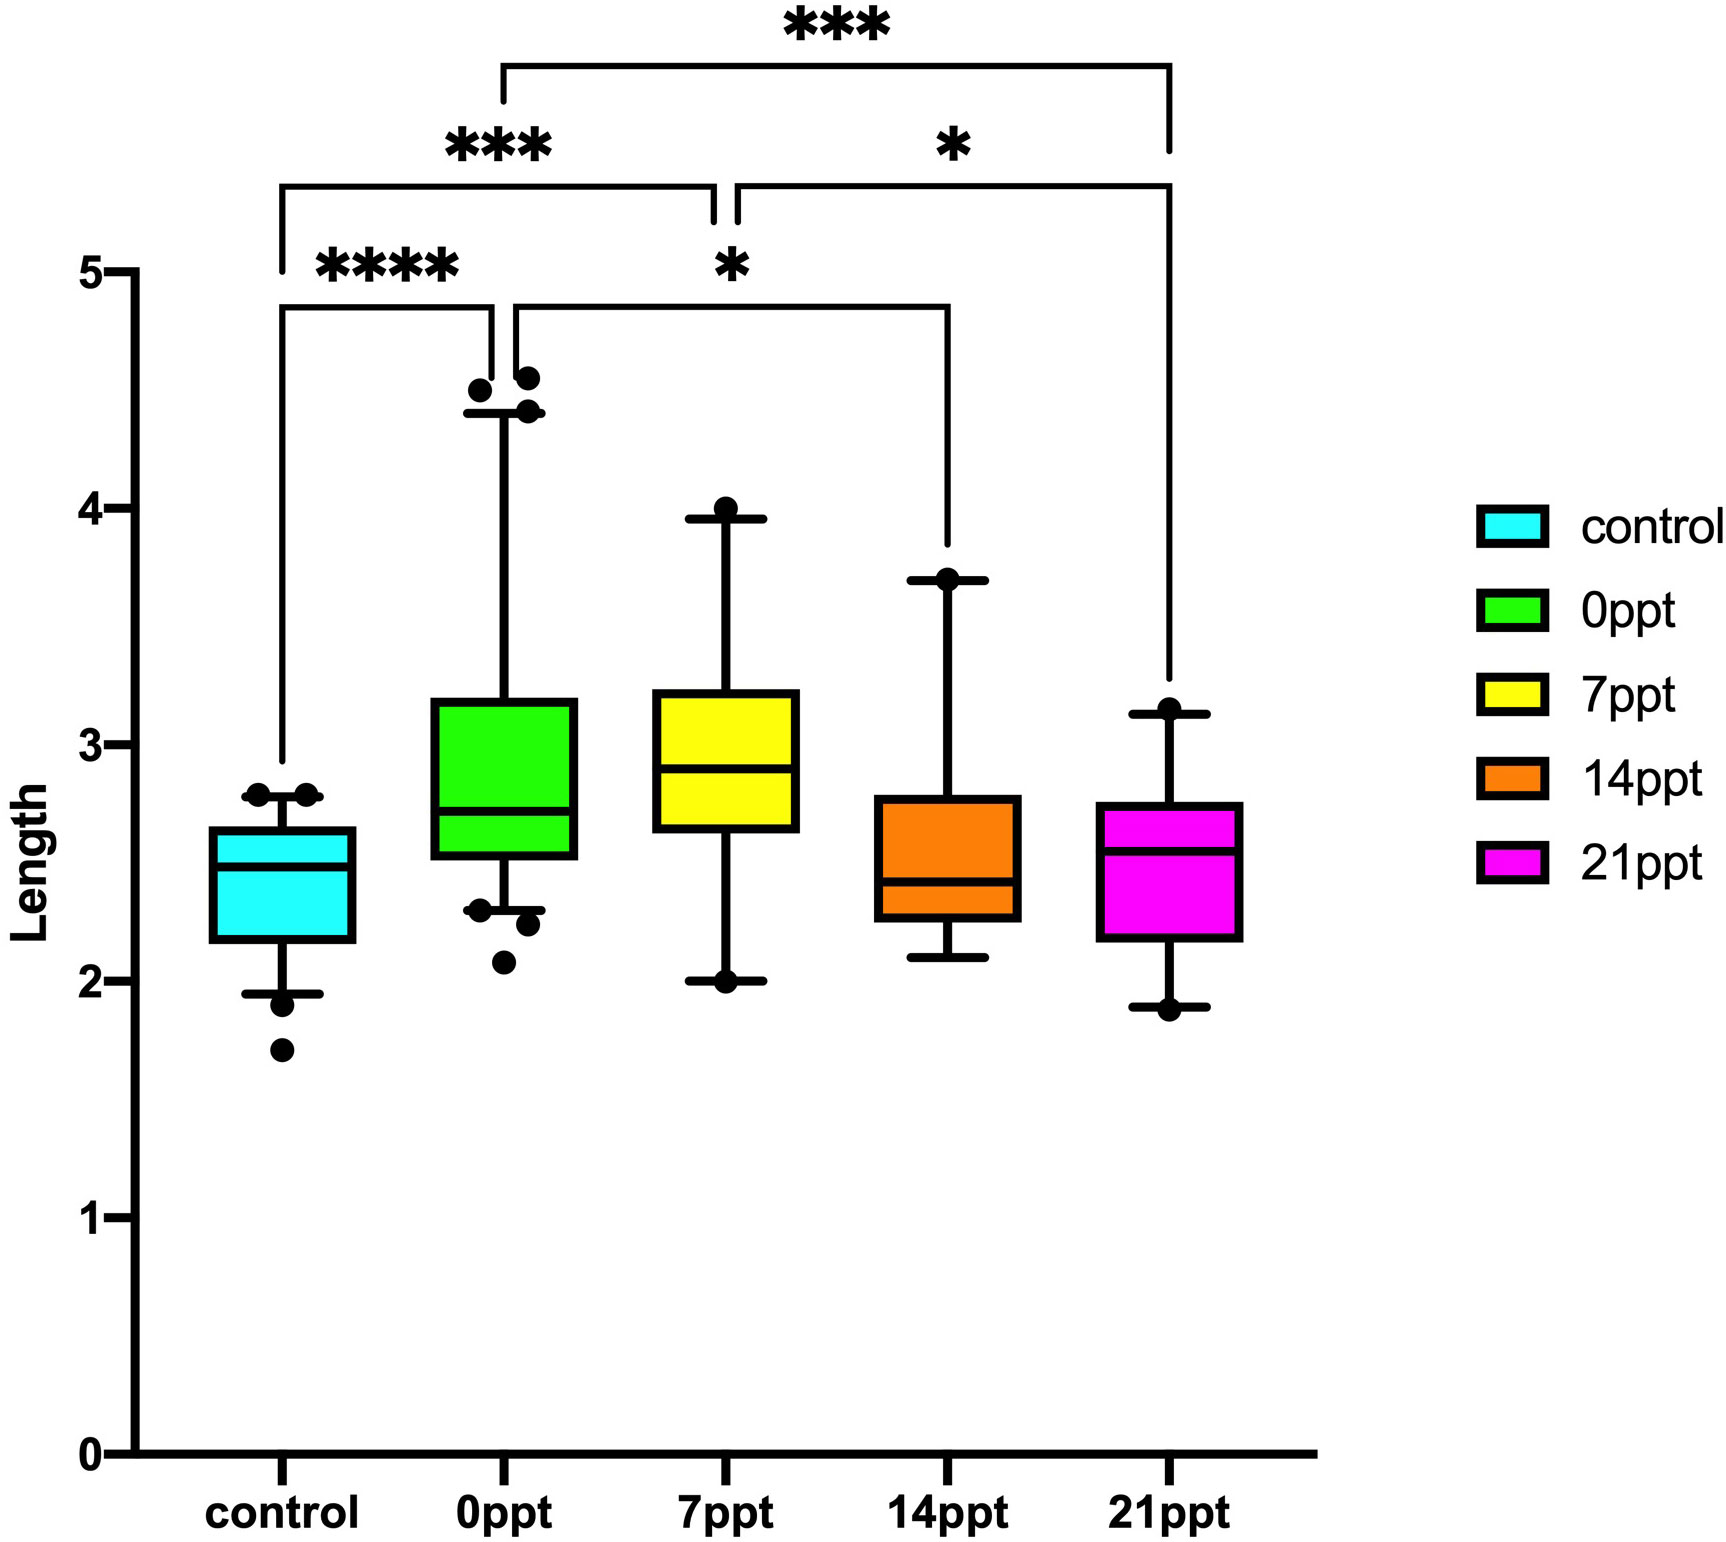
Figure 1 Body weight performance of the M. nipponense exposed to different salinity gradients. * indicates the extent of significant difference (*: p < 0.05, **: p < 0.01, ***: p < 0.001, ****: p < 0.0001).
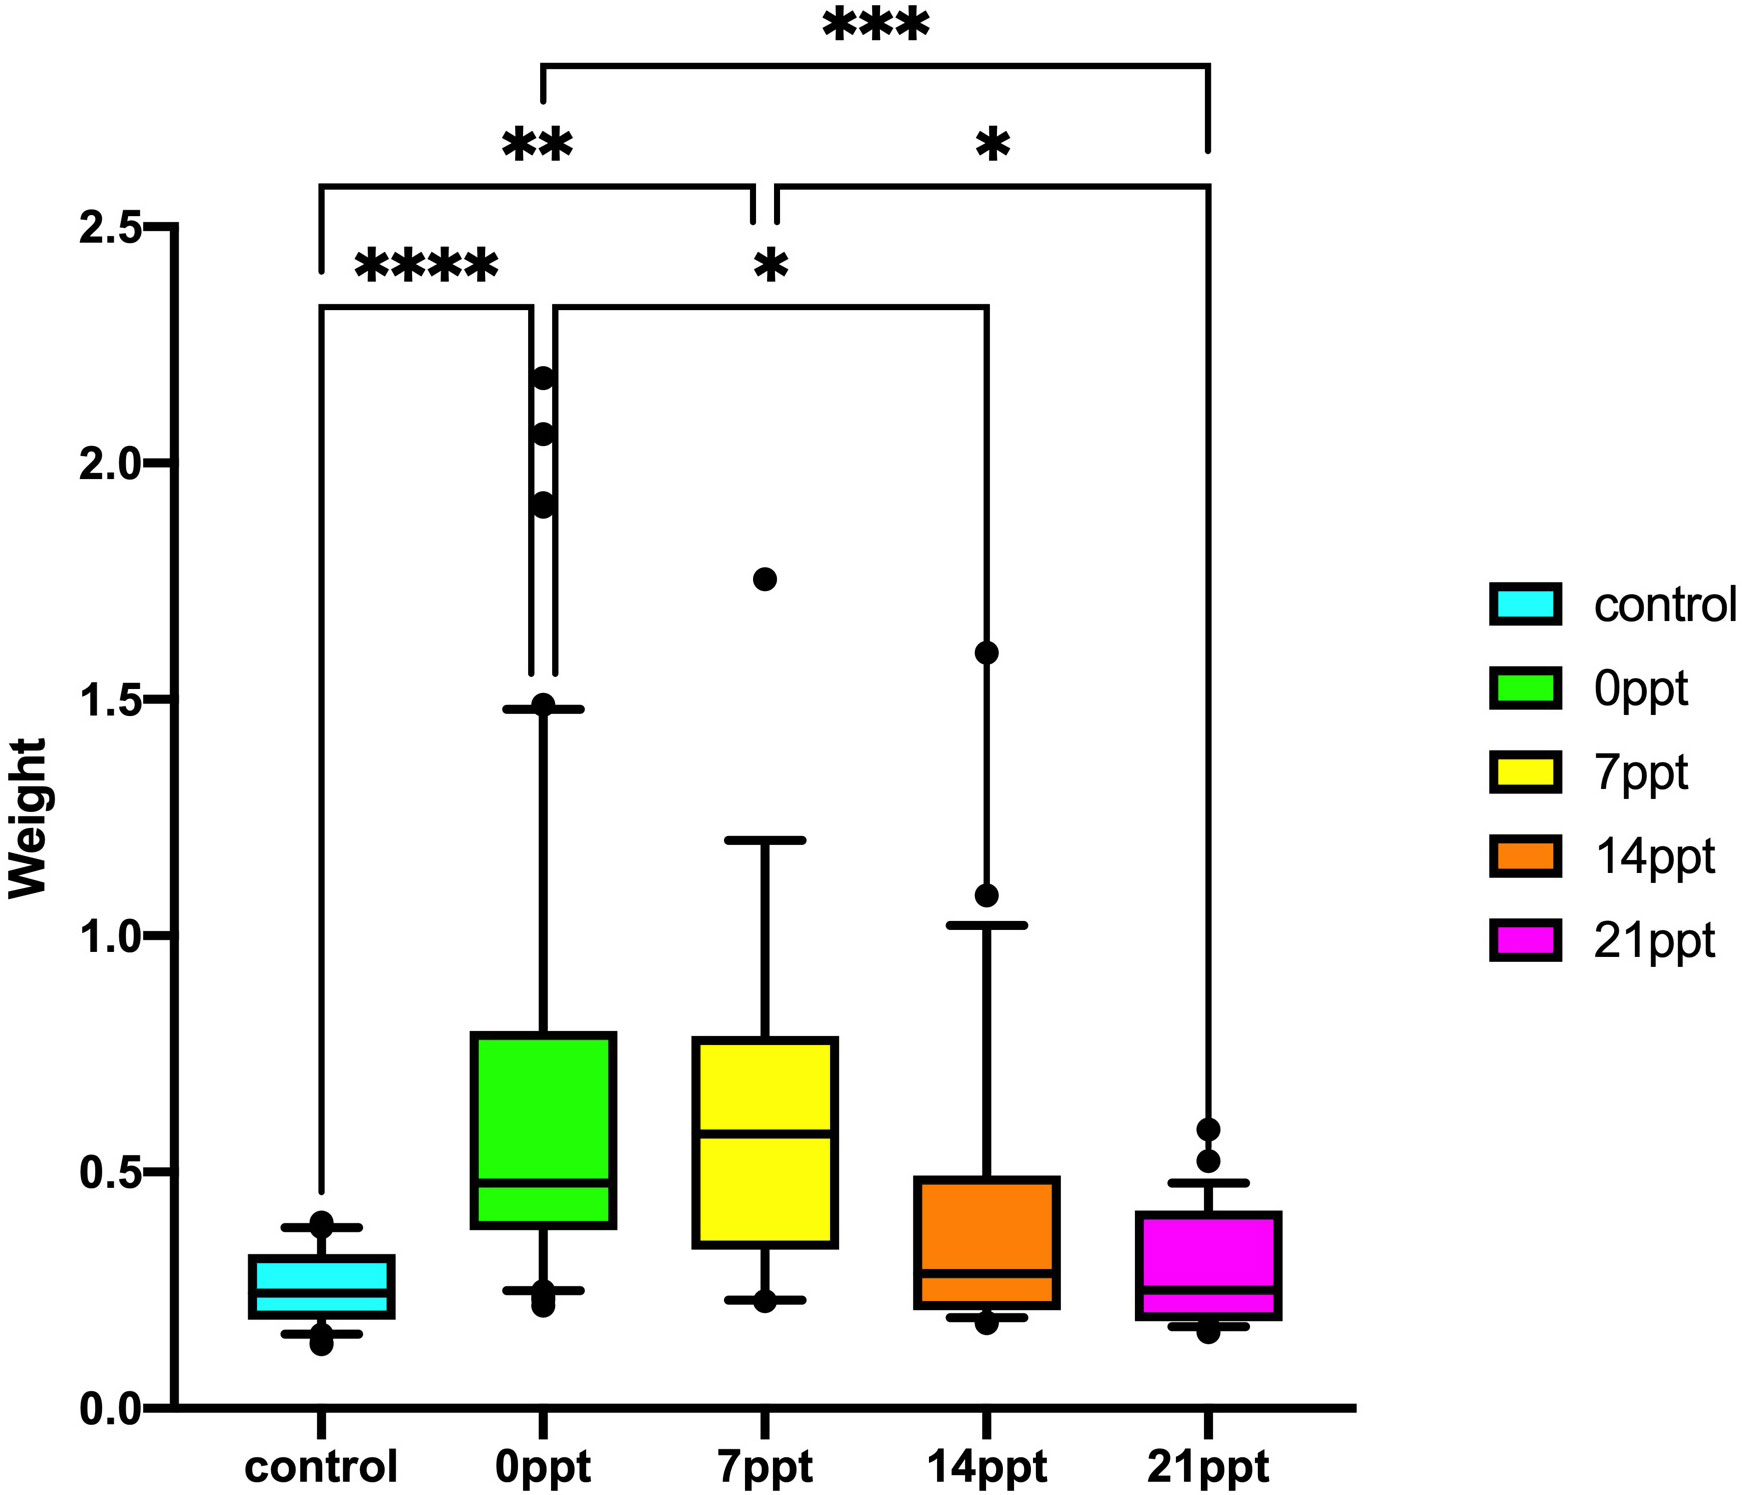
Figure 2 Body length performance of the M. nipponense exposed to different salinity gradients. * indicates the extent of significant difference (*: p < 0.05, **: p < 0.01, ***: p < 0.001, ****: p < 0.0001).
3.2 Histology analysis of M. nipponense under long-term salinity stress
Morphological differences of the gills and hepatopancreas of M. nipponense in 4 salinity gradients (0 ppt, 7 ppt, 14 ppt, and 21 ppt) were identified by histological analysis (Figure 4). The gill filaments of healthy prawns were orderly arranged. No physiological alterations could be observed (Figure 3A). With the increase of salinity, the gill filaments showed varying degrees of swelling and gradually disordered arrangement (Figures 3B-D). Apparently, the 21 ppt groups exposed severe necrosis and massive infiltration (Figure 3D). In the hepatopancreas, the 0 ppt group illustrated the typical structure, and the cells were arranged relatively stable (Figure 3E). Besides, as the salinity rose, the space between cells was increased. The resulting destruction of the hepatopancreas was probably associated with an inflammatory reaction (Figures 3F-H).
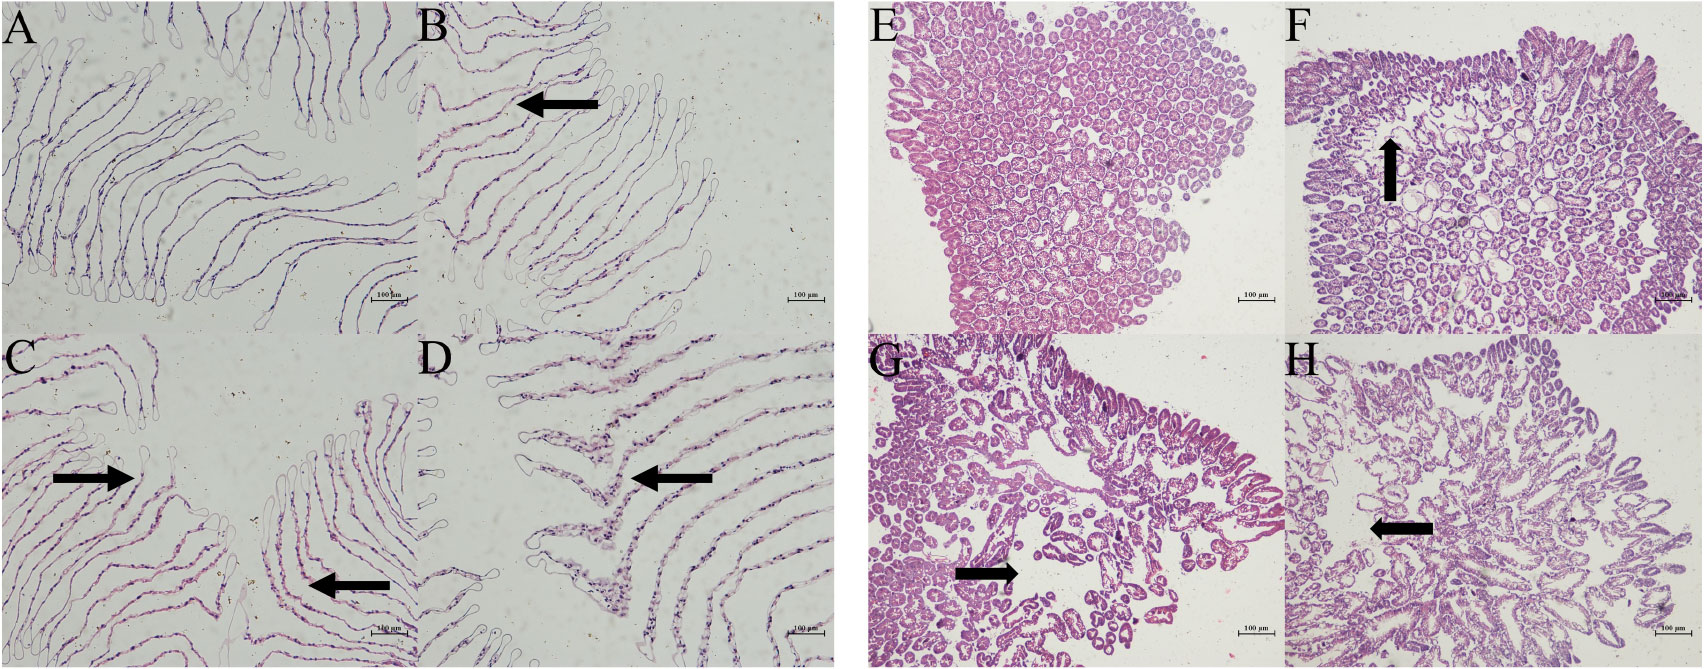
Figure 3 Histological observation of the gills (A: 0 ppt, B: 7 ppt, C: 14 ppt, and D: 21 ppt) and hepatopancreas (E: 0 ppt, F: 7 ppt, G: 14 ppt, and H: 21 ppt) by H&E staining in M. nipponense. The histological differences were tagged (by thin arrows and arrowheads).
3.3 Biochemical response of M. nipponense under long-term salinity stress
3.3.1 Digestive enzymes activities
To elucidate the activities of digestive enzymes under salinity fluctuation, trypsin, lipase, and amylase were applied in this study. The activity of trypsin was significantly increased in the hepatopancreas of 14 ppt, then decreased (p < 0.05) (Figure 4A). It was obvious that there were significantly different changes in amylase activity in hepatopancreas (p < 0.05) (Figure 5B). The amylase was firstly increased with the rise of salinity and then significantly decreased at 21 ppt (p< 0.05) (Figure 4B). However, the lipase activity in hepatopancreas showed no significant changes during salinity fluctuation (Figure 4C).
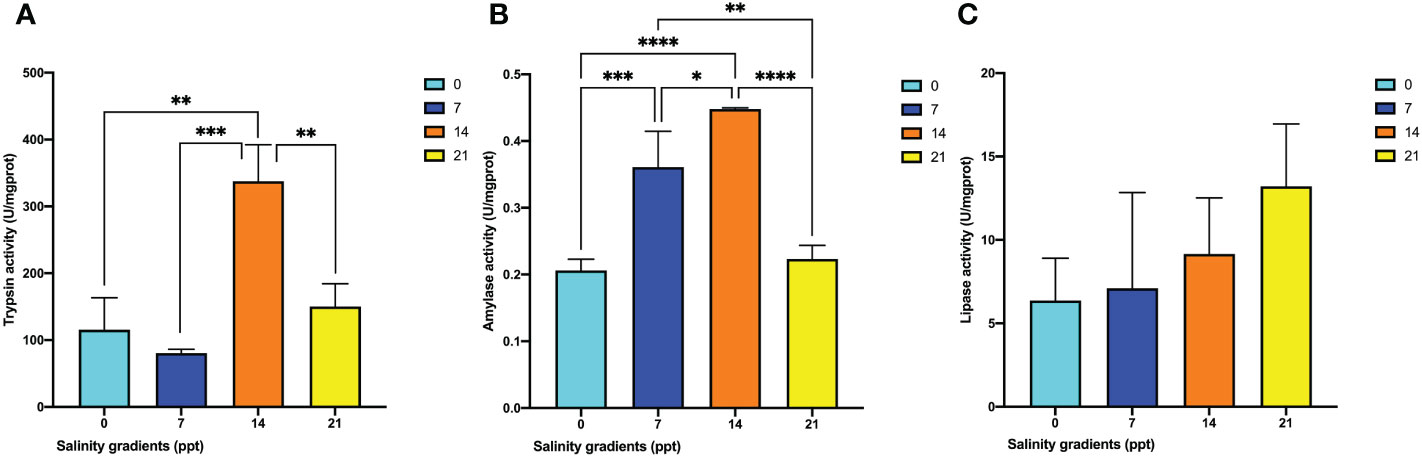
Figure 4 The changes of three digestive enzyme activities in the hepatopancreas of M. nipponense exposed to four salinity gradients. (A) Trypsin activities; (B) Amylase activities; (C) Lipase activities. * indicates the extent of significant difference (*: p < 0.05, **: p < 0.01, ***: p < 0.001, ****: p < 0.0001).
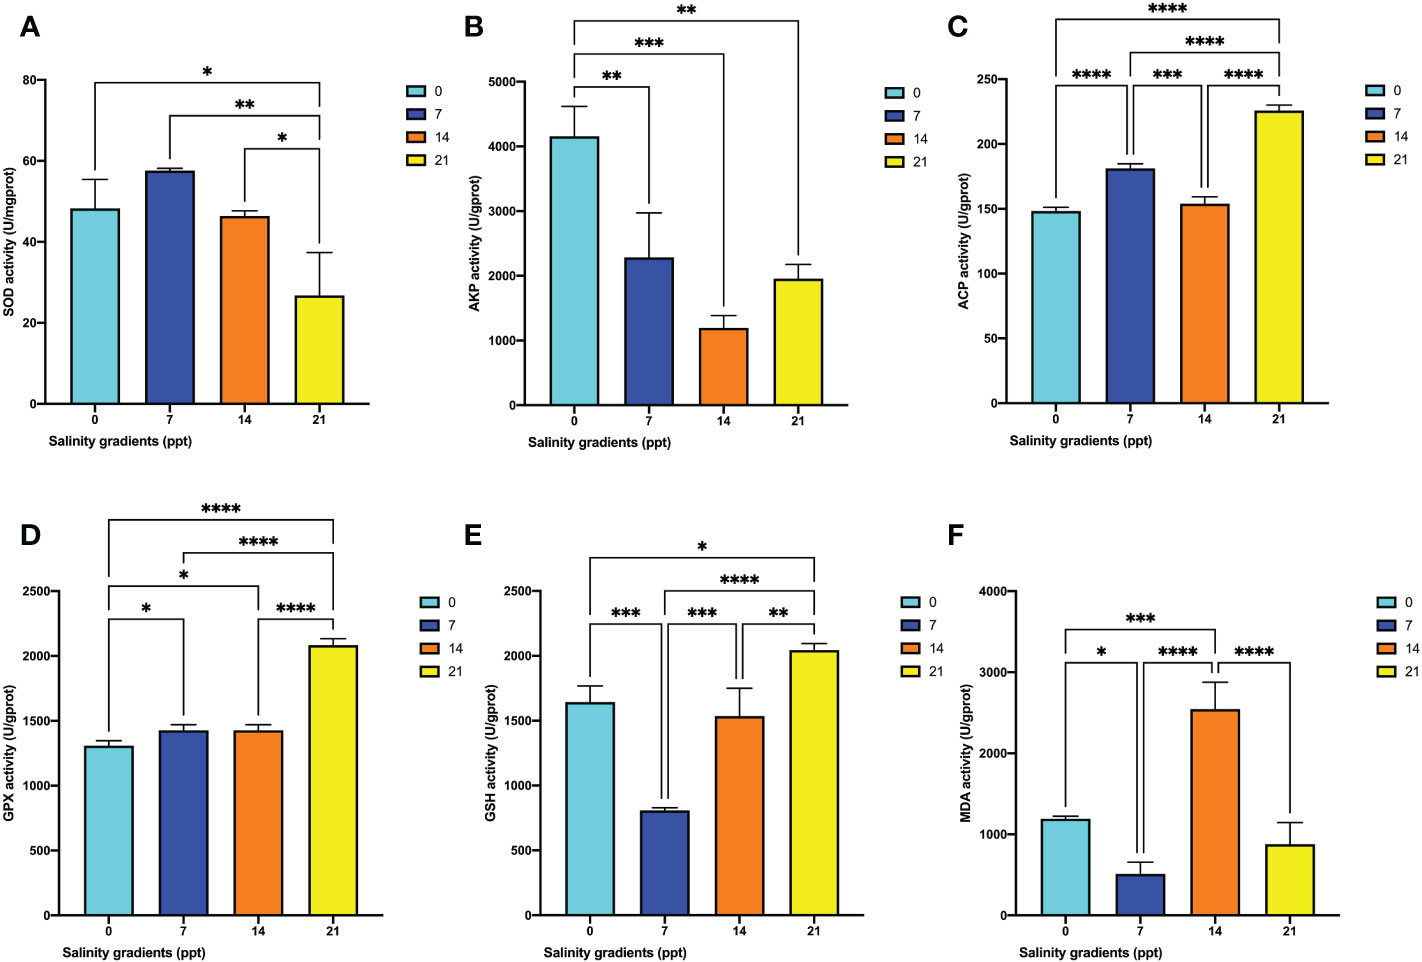
Figure 5 The changes of six antioxidant enzyme activities in the hepatopancreas of M. nipponense exposed to four salinity gradients. (A) SOD; (B) AKP; (C) ACP; (D) GPX; (E) GSH; (F) MDA. * indicates the extent of significant difference (*: p < 0.05, **: p < 0.01, ***: p < 0.001, ****: p < 0.0001).
3.3.2 Immune system alternation after salinity exposure
To determine the antioxidant system alternation, the SOD, ACP, AKP, GPX, GSH, and MDA were calculated. The SOD activity gradually increased and then decreased to the minimum level at 21 ppt (p < 0.05) (Figure 5A). The AKP activity in the hepatopancreas showed that the enzyme activity was decreased, compared with 0 ppt (p < 0.05) (Figure 5B). Besides, corresponding with the 0 ppt and 14 ppt, the ACP activity significantly rose at 7 ppt (p < 0.05). Eventually, the ACP activity reached the highest point at 21 ppt (p < 0.05) (Figure 5C). There was a significant change in GPX activity in the hepatopancreas (Figure 5D). The results illustrated that the activity significantly increased at 7 ppt, 14 ppt, and 21 ppt. The highest activity was obtained at 21 ppt (p < 0.05). Similarly, the GSH activity significantly increased from 7 ppt to 21 ppt (p < 0.05) (Figure 5E) and reached the maximum level at 21 ppt (p < 0.05). Compared with the 0 ppt group, the MDA activity at the 7 ppt and 14 ppt was significantly decreased (Figure 5F). The MDA activity reached the highest point at 21 ppt (p < 0.05).
3.3.3 Metabolism-related enzymes
To determine the antioxidant system alternation, the activities of HK, GLU, and TG were calculated. The HK activity was first decreased at 7 ppt and then continuedly to increase to the maximum level at 21 ppt (p < 0.05) (Figure 6A). Besides, the Glu activity kept decreasing from 0 ppt to 21 ppt (p < 0.05) (Figure 6B). Eventually, the TG activity firstly decreased from 7 ppt to 14 ppt. It then increased at 21 ppt (p < 0.05) (Figure 6C).
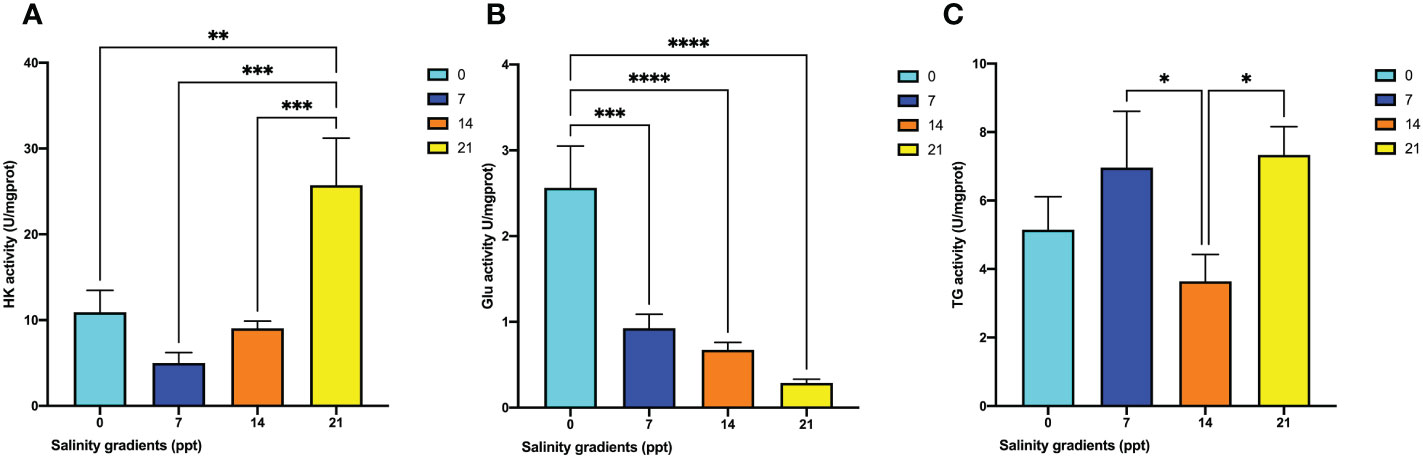
Figure 6 The changes of metabolism enzyme activities in the hepatopancreas of M. nipponense exposed to four salinity gradients. (A) HK; (B) Glu; (C) TG. * indicates the extent of significant difference (*: p < 0.05, **: p < 0.01, ***: p < 0.001, ****: p < 0.0001).
3.4 Transcriptomic analysis of M. nipponense under long-term salinity stress
To detect the salinity gradient-dependent expression of M. nipponense under long-term salinity stress exposure, high-throughput mRNA sequencing was performed on three tissue samples (gills, hepatopancreas, and muscle) from five different salinity gradients (0, 7, 14, and 21 ppt). Consequently, thirty-six experimental cDNA libraries were constructed. Additionally, three biological repetitions were performed on three tissues (hepatopancreas, gills, and muscle) in four different salinity gradients (0, 7, 14, and 21 ppt), respectively. Furthermore, clean reads of a total of 1749.11 Gb were obtained after removing the adaptor and trimming the low-quality reads. As a minimum, Q30 had a base score of over 92.57% (Table S2). 11356, 2227, and 1819 DEGs were identified in gills, hepatopancreas and muscle, respectively. Several differentially expressed genes (DEGs) were compared with the control group in each of the three treatment groups (7, 14, 21 ppt) to determine how gene expression changes under salinity fluctuation (0 ppt). Generally, a total of 722 (588 up- and 134 down-regulated), 70 (28 up- and 42 down-regulated), and 98 (38 up- and 60 down-regulated) DEGs were detected in the gills, hepatopancreas, and muscle, respectively (|log2FC| ≥ 1, p < 0.05) (Figure 7).
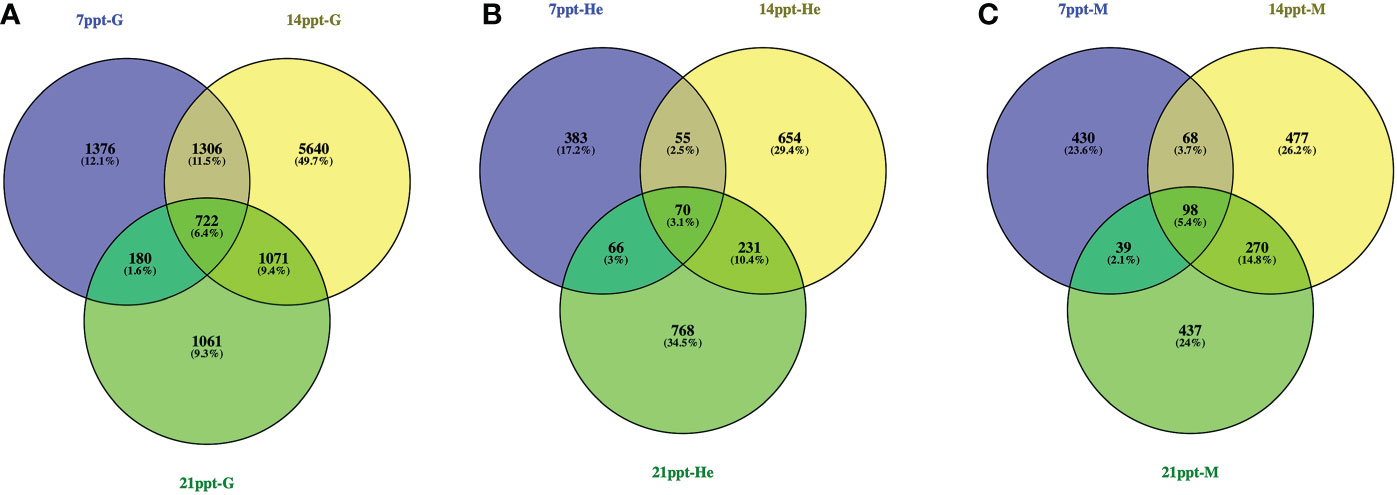
Figure 7 Venn diagram of DEGs of Macrobrachium nipponense in 7, 14 and 21ppt salinity treatment comparisons in the gills (A: 7 ppt-G, 14 ppt-G, 21 ppt-G), hepatopancreas (B: 7 ppt-He, 14 ppt-He, 21 ppt-He), and muscle (C: 7 ppt-M, 14 ppt-M, 21 ppt-M).
To identify the physiological process impacts of M. nipponense under long-term salinity exposure, GO term enrichment analyses were conducted for DEGs. As a result of salinity stress, the primary significant biological processes observed in all three tissues (hepatopancreas, gills, and muscle) were similar. These GO terms involved cellular processes (GO: 0009987), organelle (GO: 0043226), and binding (0005488) (Figure 8).
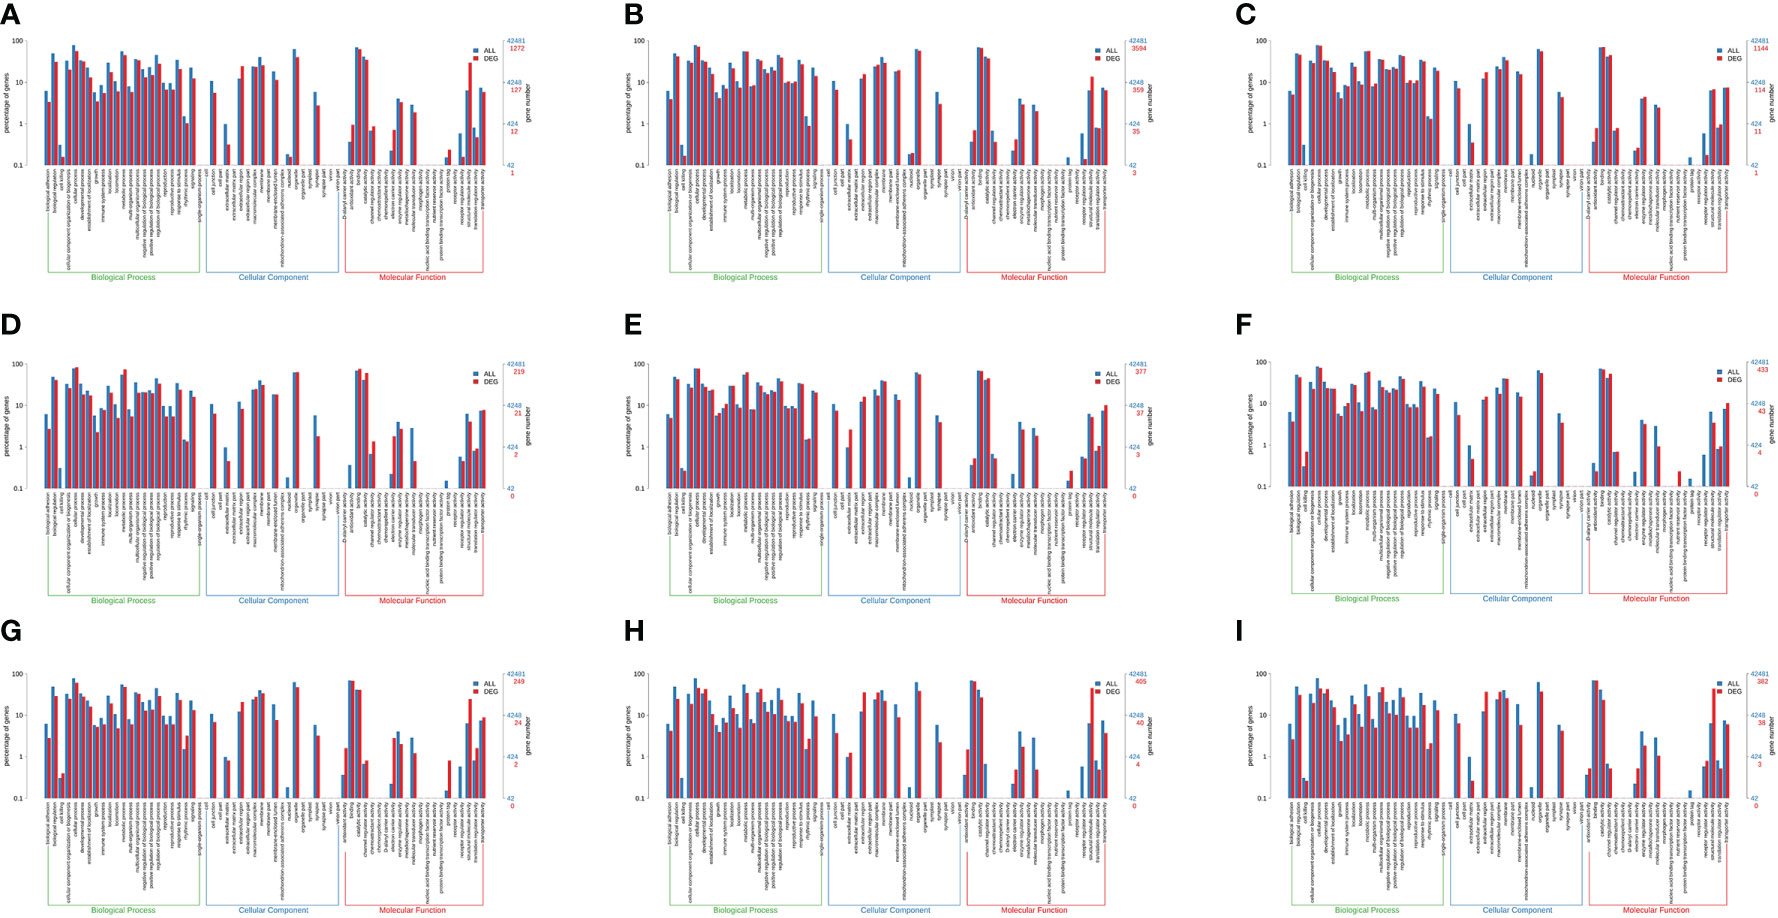
Figure 8 Results of the enrichment analysis of the gene ontology (GO) terms of DEGs in the gills (A, B, C), hepatopancreas (D, E, F), and muscle (G, H, I) of M. nipponense exposed to different salinity gradients, respectively.
Based on comparisons between DEGs and KEGG pathways, molecular interaction networks within cells and variants specific to organisms were derived (Figure 9). In gills, there were significant enrichments in four KEGG pathways across different salinity gradients, including cell cycle (ko04110), cellular senescence (ko04218), vitamin digestion and absorption (ko04977), and progesterone-mediated oocyte maturation (ko04914). In hepatopancreas, insect hormone biosynthesis (ko00981) and vibrio cholerae infection (ko05110) were significantly enriched. Eventually, there were five KEGG pathways enriched considerably in muscle, including the AMPK signaling pathway (ko04152), PPAR signaling pathway (ko03320), cardiac muscle contraction (ko04260), biosynthesis of unsaturated fatty acid (ko01040), and amino sugar ad nucleotide sugar metabolism (ko00520).
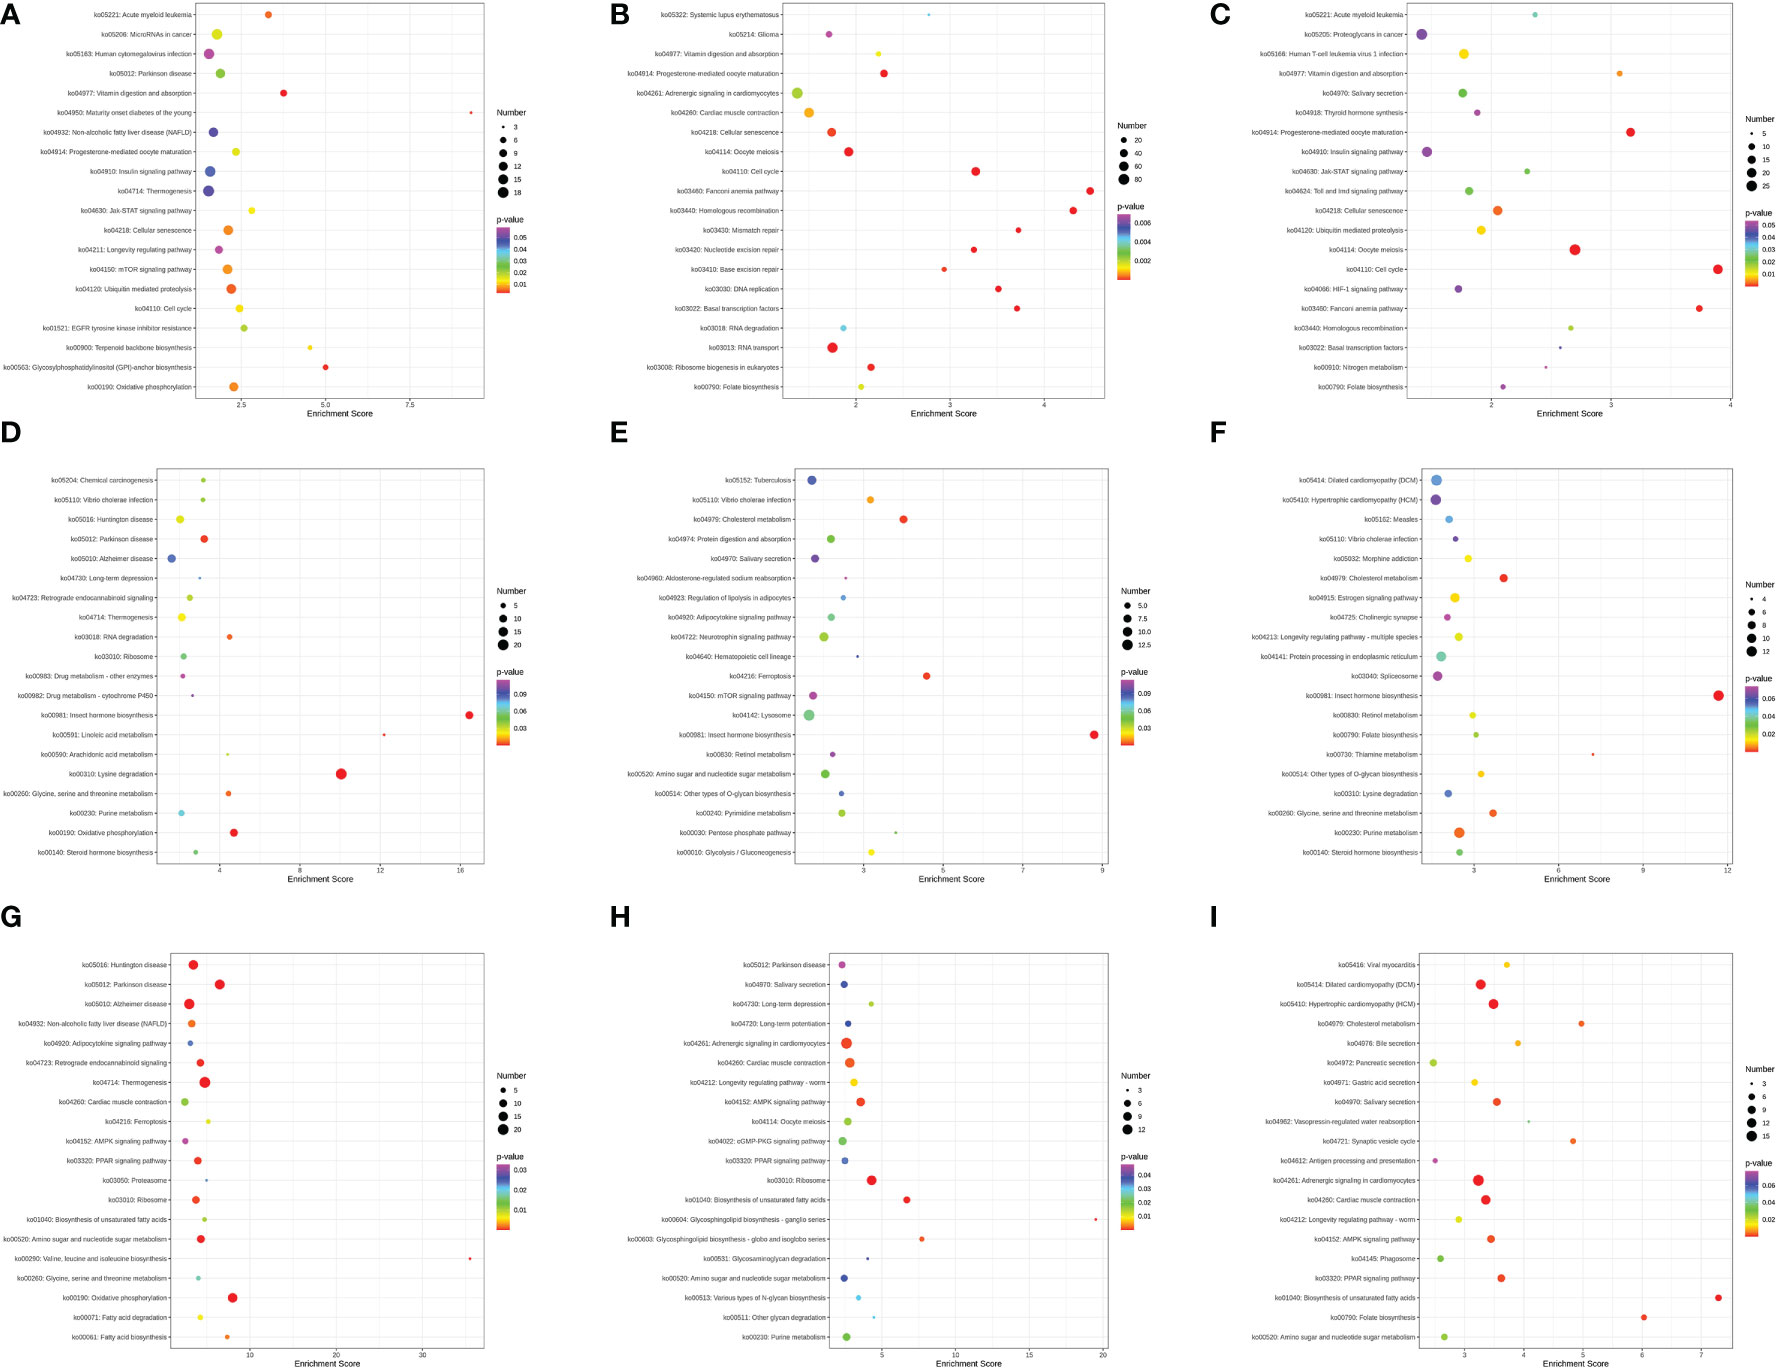
Figure 9 Results of Top 20 KEGG pathways enrichment in the gills (A–C), hepatopancreas (D–F), and muscle (G–I) of M. nipponense exposed to different salinity gradients, respectively.
3.5 Proteomic analysis
To elucidate the proteomic expression pattern under salinity stress, the TMT were utilized to evaluate the molecular changes in M. nipponense. The LC-MS analysis detected 439471 total spectra, 25240 spectra, 9238 peptides, 4760 unique peptides, and 2310 proteins in gills (FDR < 0.01). Besides, there were 437039 total spectra, 10539 spectra, 5129 peptides, 4031 unique peptides, and 1643 proteins classified in the hepatopancreas of M. nipponense. The appropriate 95.76% and 95.62% identified proteins were over 10 kDa in gills and hepatopancreas, respectively (Figure S3).
Compared with the 0 ppt group, a total of 439 and 230 DEPs were identified in gills and hepatopancreas in M. nipponense, respectively (|log2FC| ≥ 1, p < 0.05) (Figure 10). Besides, 203 (104 up- and 99 down-expressed), 112 (83 up- and 29 down-expressed), and 299 (250 up- and 49 down-expressed) DEPs were obtained at the salinity of 7, 14 and 21 ppt in gills, respectively (Figure 10A). Notably, 38 DEPs were kept differentially expressed in 3 treatment gradients in gills (Figure 10C). Additionally, 85 (43 up- and 42 down-expressed), 140 (104 up- and 36 down-expressed), and 103 (72 up- and 31 down-expressed) DEPs were obtained at the salinity of 7, 14 and 21 ppt in hepatopancreas, respectively (Figure 10B). 18 DEPs were kept differentially expressed in 3 treatment gradients in hepatopancreas (Figure 10D).
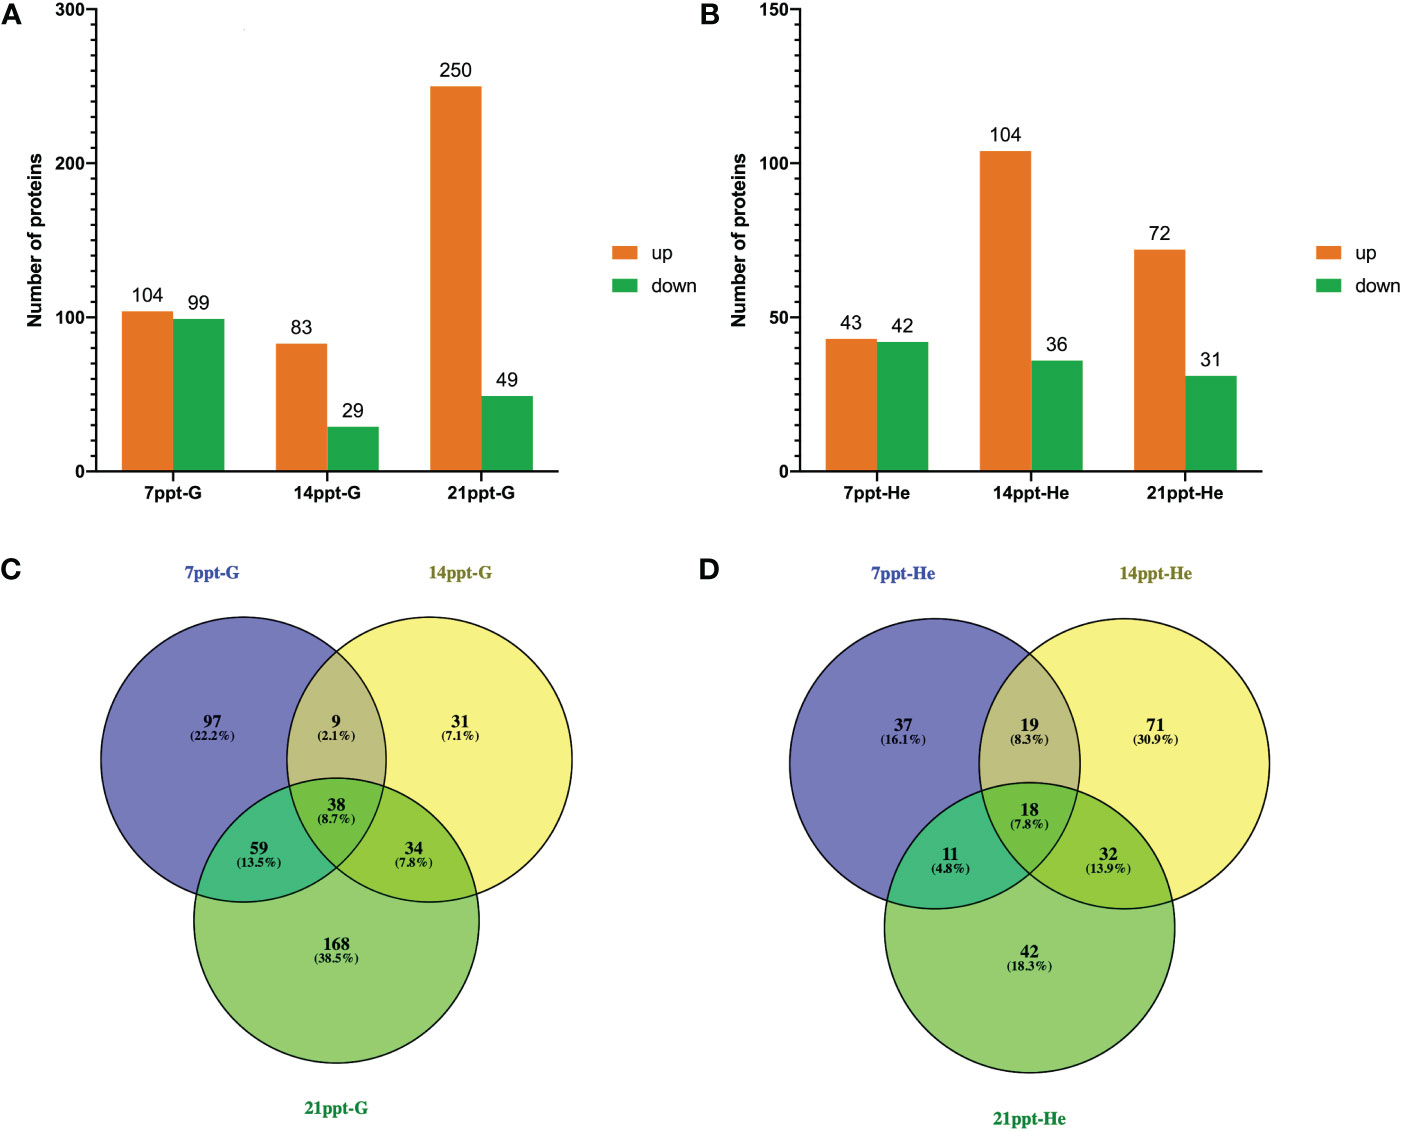
Figure 10 Statistic of DEPs numbers in the gills (A: 7 ppt-G, 14 ppt-G, 21 ppt-G) and hepatopancreas (B: 7 ppt-He, 14 ppt-He, 21 ppt-He). Venn diagram of DEPs of M. nipponense in 7, 14 and 21ppt salinity treatment comparisons in the gills (C: 7 ppt-G, 14 ppt-G, 21 ppt-G) and hepatopancreas (D: 7 ppt-He, 14 ppt-He, 21 ppt-He).
To investigate the salinity impacts of proteins in M. nipponense, a GO term enrichment analysis was conducted (Figure 11). In gills, the results illustrated that the primary significant biological process for DEPs at salinity fluctuation involved translation (GO: 0006412), cytoplasm (GO: 0005737), ATP binding (GO: 0005524), and ribosome (GO: 0005840). In hepatopancreas, carbohydrate metabolism process (GO: 0005975), integral component of membrane (GO: 0016021), and ATP binding (GO: 0005524).
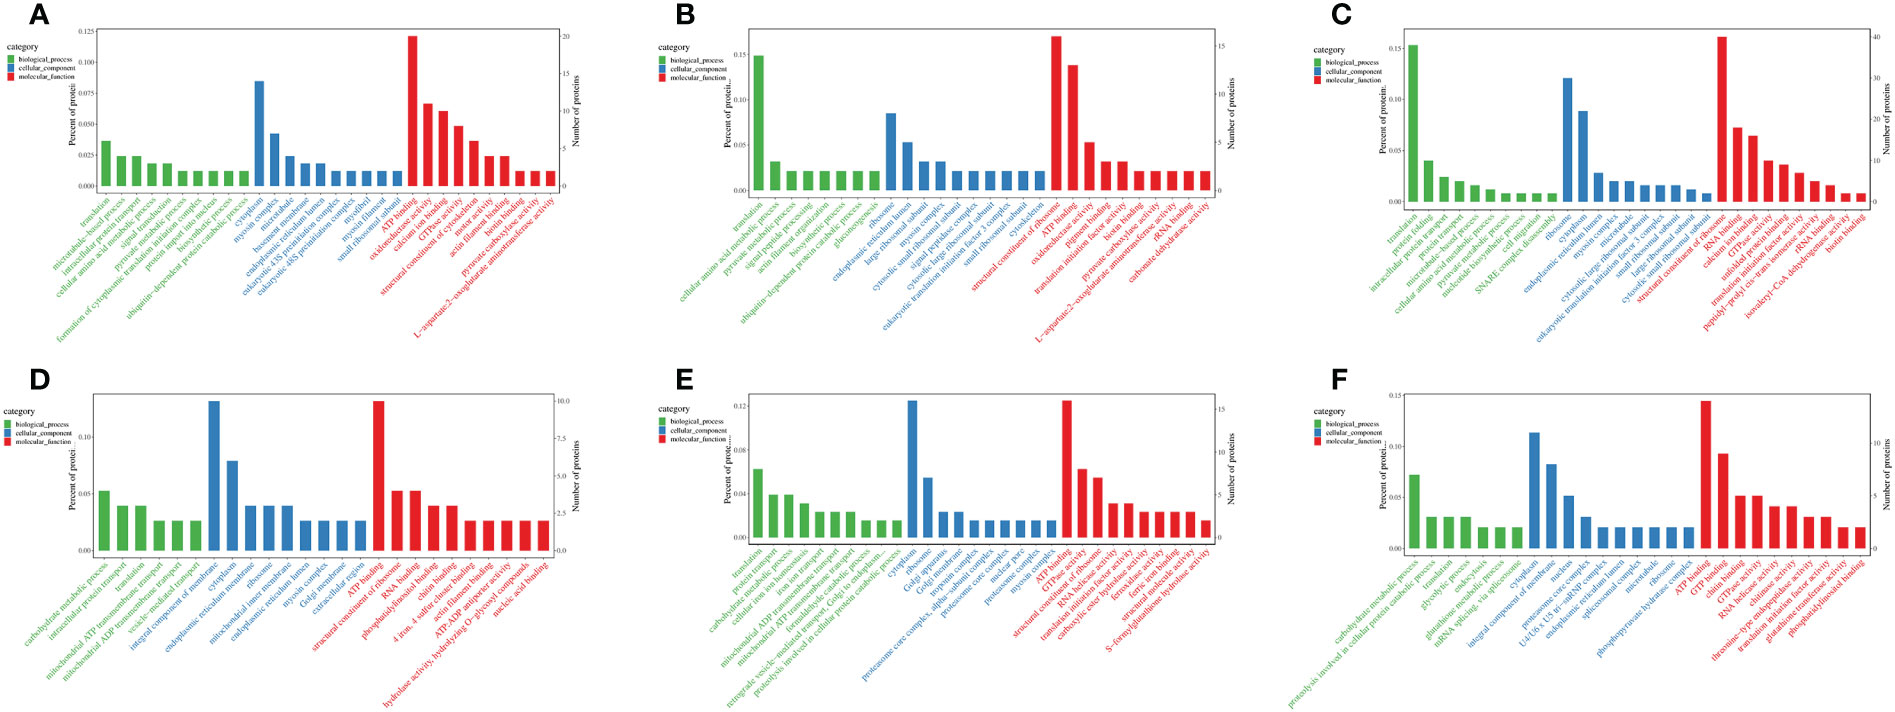
Figure 11 Results of the enrichment analysis of the gene ontology (GO) terms (Top 30) of DEPs of M.nipponense exposed to different salinity gradients in the gills (A–C), and hepatopancreas (D–F) at 7, 14 and 21 ppt comparison treatments, respectively.
To record the network of protein interactions in the cells and variants specific to organisms, the DEPs were compared by the KEGG pathway (Figure 12). In gills, corresponding with the 0 ppt control group, there were six KEGG pathways were commonly enriched, including ribosome, protein processing in endoplasmic reticulum, carbon fixation pathways in prokaryotes, tropane, piperidine and pyridine alkaloid biosynthesis, and alanine, aspartate, and glutamate metabolism. In hepatopancreas, three KEGG pathways were significantly enriched, including amino sugar and nucleotide sugar metabolism, ribosome, and phospholipase D signaling pathway.
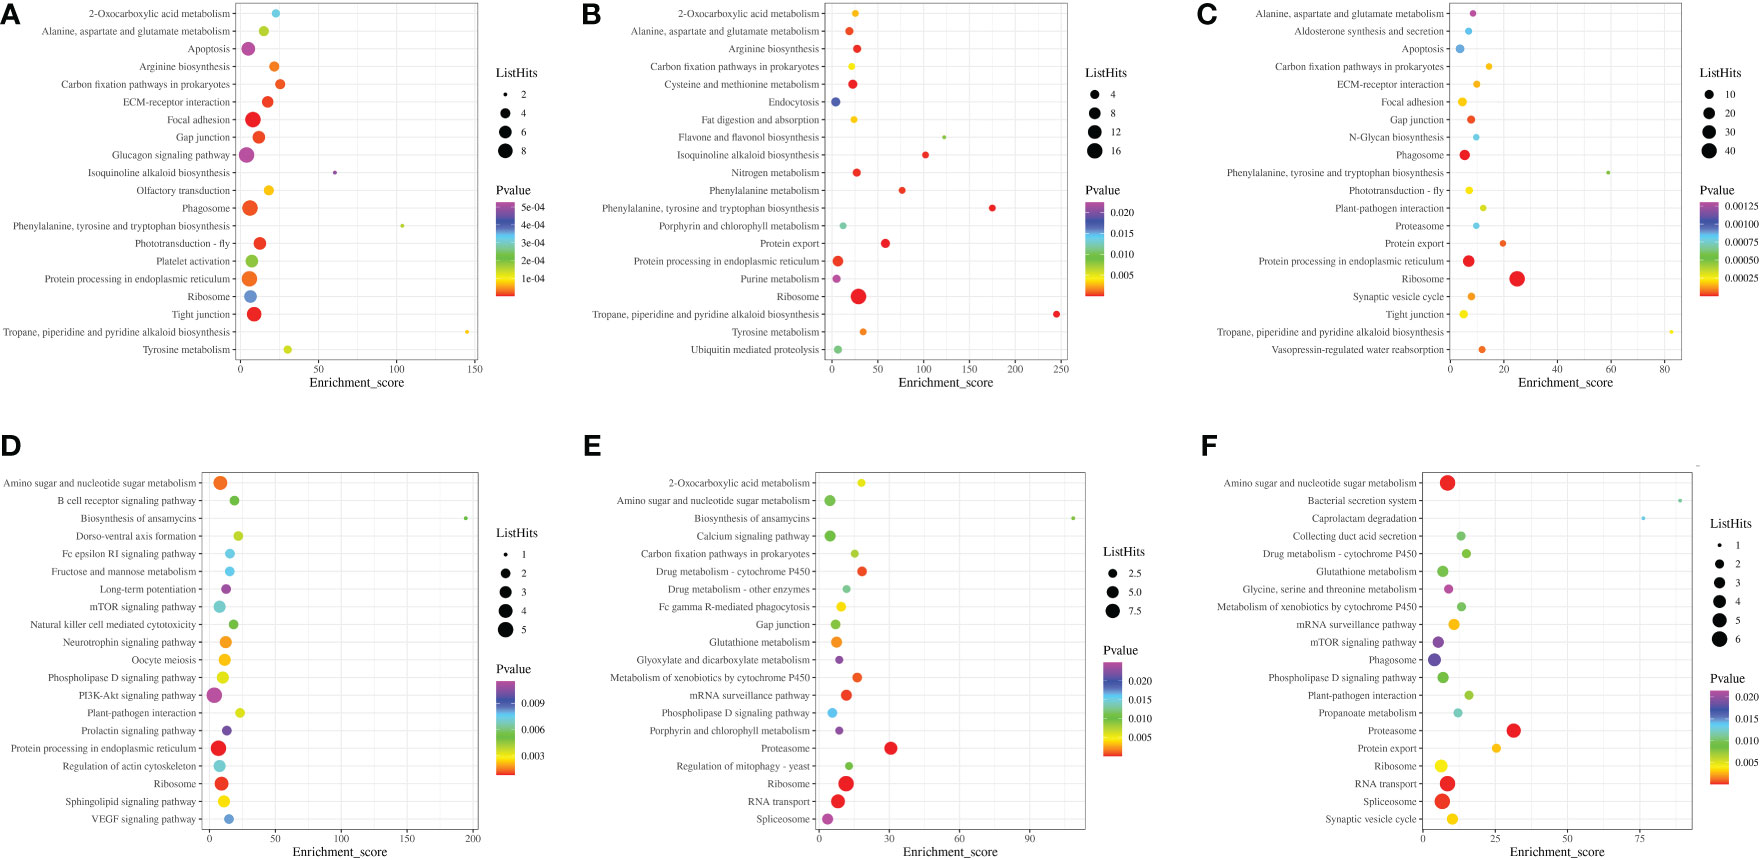
Figure 12 Results of Top 20 KEGG pathways enrichment for Macrobrachium nipponense exposed to different salinity gradients in the gills (A–C), and hepatopancreas (D–F) at 7, 14 and 21 ppt comparison treatments, respectively.
3.6 Protein-Protein Interaction (PPI) analysis
STRING PPI network and betweenness analysis revealed the functional partnership and interaction work. In gills, compared with the 0 ppt group, A0A0P4WGM6 (Aspartate aminotransferase) and A0A6C0T5T1 (PRKX) had major betweenness in 7 ppt groups. Besides, A0A0P4W372 (Transcription factor BTF3) and A0A5J6CZD9 (40S ribosomal protein) were significant in the 14 ppt group. Additionally, A0A193DUV6 (CANX), A0A0P4WDV8 (PSDM14), and A0A1P7YD47 (MGM1) showed strong betweenness in the 21 ppt group. In hepatopancreas, comparing the 0 ppt group, A0A0P4W9M7 (DDOST), A0A0P4WGE7 (TKT-1), and A0A385L4G2 (14-3-3 epsilon-like protein variant 2) illustrated main betweenness in 7ppt group. Notably, K9J9V3 (RNA helicase), A0A0P4VWM0 (MITOs), and A0A0P4VZE1 (COPZ) occupied a dominant position in 14 ppt. Eventually, A0A0P4VTM5 (PSMB1), K4EG01 (RNA helicase), A0A0P4W839 (SRP54), and A0A0P4WH90 (GNMT) were dominated in 21 ppt groups (Figure 13).
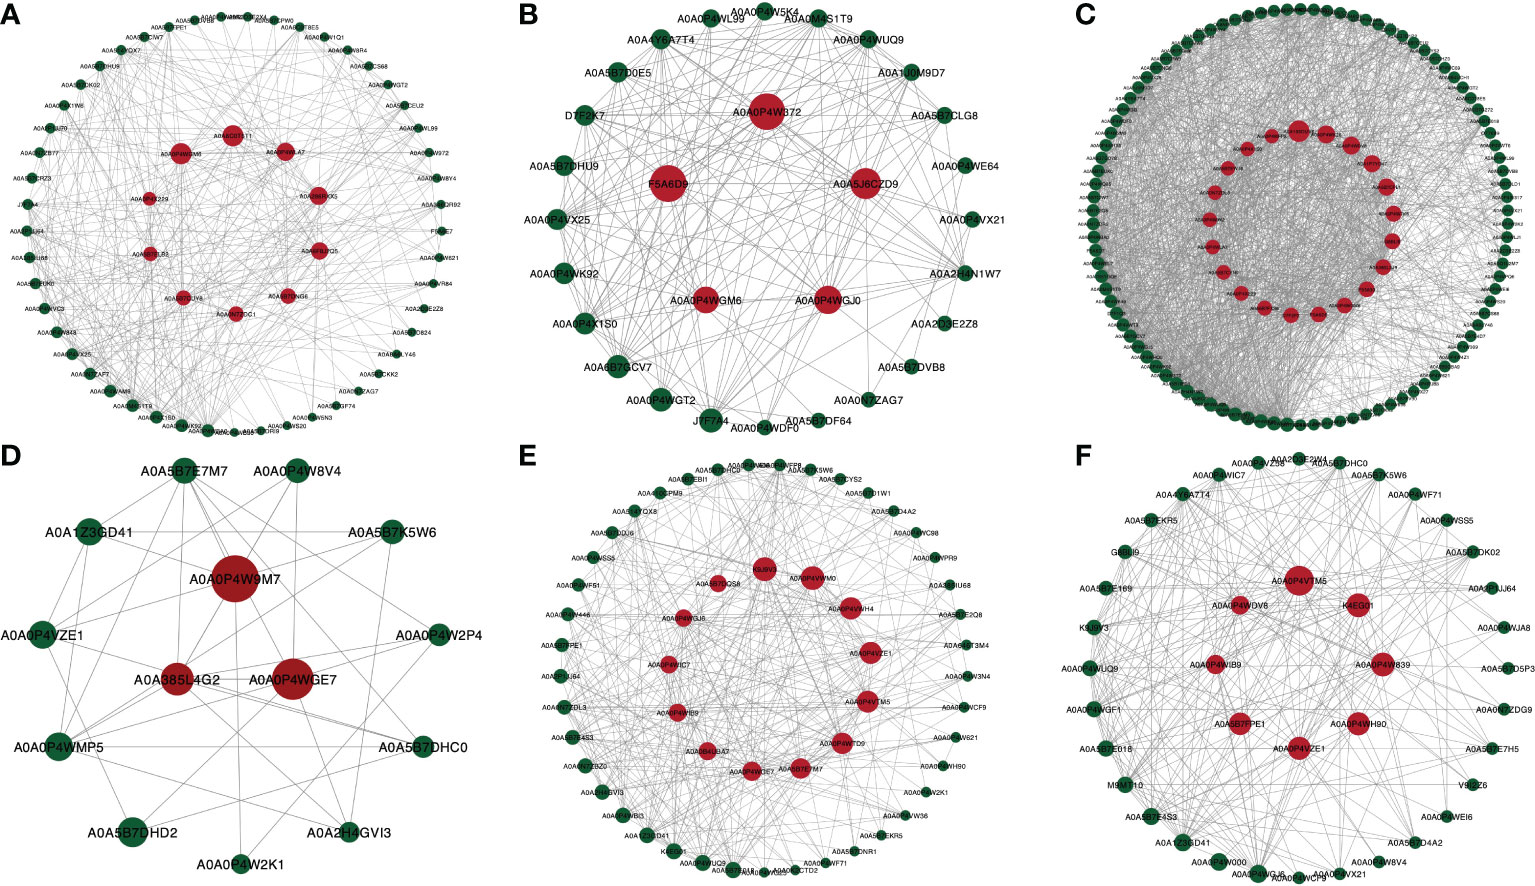
Figure 13 Results of Protein-protein interaction (PPI) network analysis for the betweenness of DEPs for M. nipponense exposed to different salinity gradients in the gills (A–C), and hepatopancreas (D–F) at 7, 14 and 21 ppt comparison treatment, respectively. The red dot indicates the DEPs with high betweenness; the dot size corresponds to the degree of betweenness.
3.7 Integrated analysis of the proteome and transcriptome in gills and hepatopancreas of various salinity gradients
As a result of an integrated analysis of the transcriptome and proteome, 92 pathways were identified in two tissues of M. nipponens. In addition, 16 up and down-regulated proteins and related DEGs were recorded through KEGG enrichment analysis (Table 1). In gills, 14 DEGs and DEPs were detected in 7 ppt, 14 ppt, and 21 ppt groups. In hepatopancreas, 6 DEGs and DEPs were found in the 14 ppt and 21 ppt groups. Obviously, no DEG and DEP were identified in the 7ppt group of hepatopancreas. Additionally, AP3D and ETHE1 a were significantly up-regulated in 7ppt and 21ppt groups, compared with the 0 ppt group in gills.
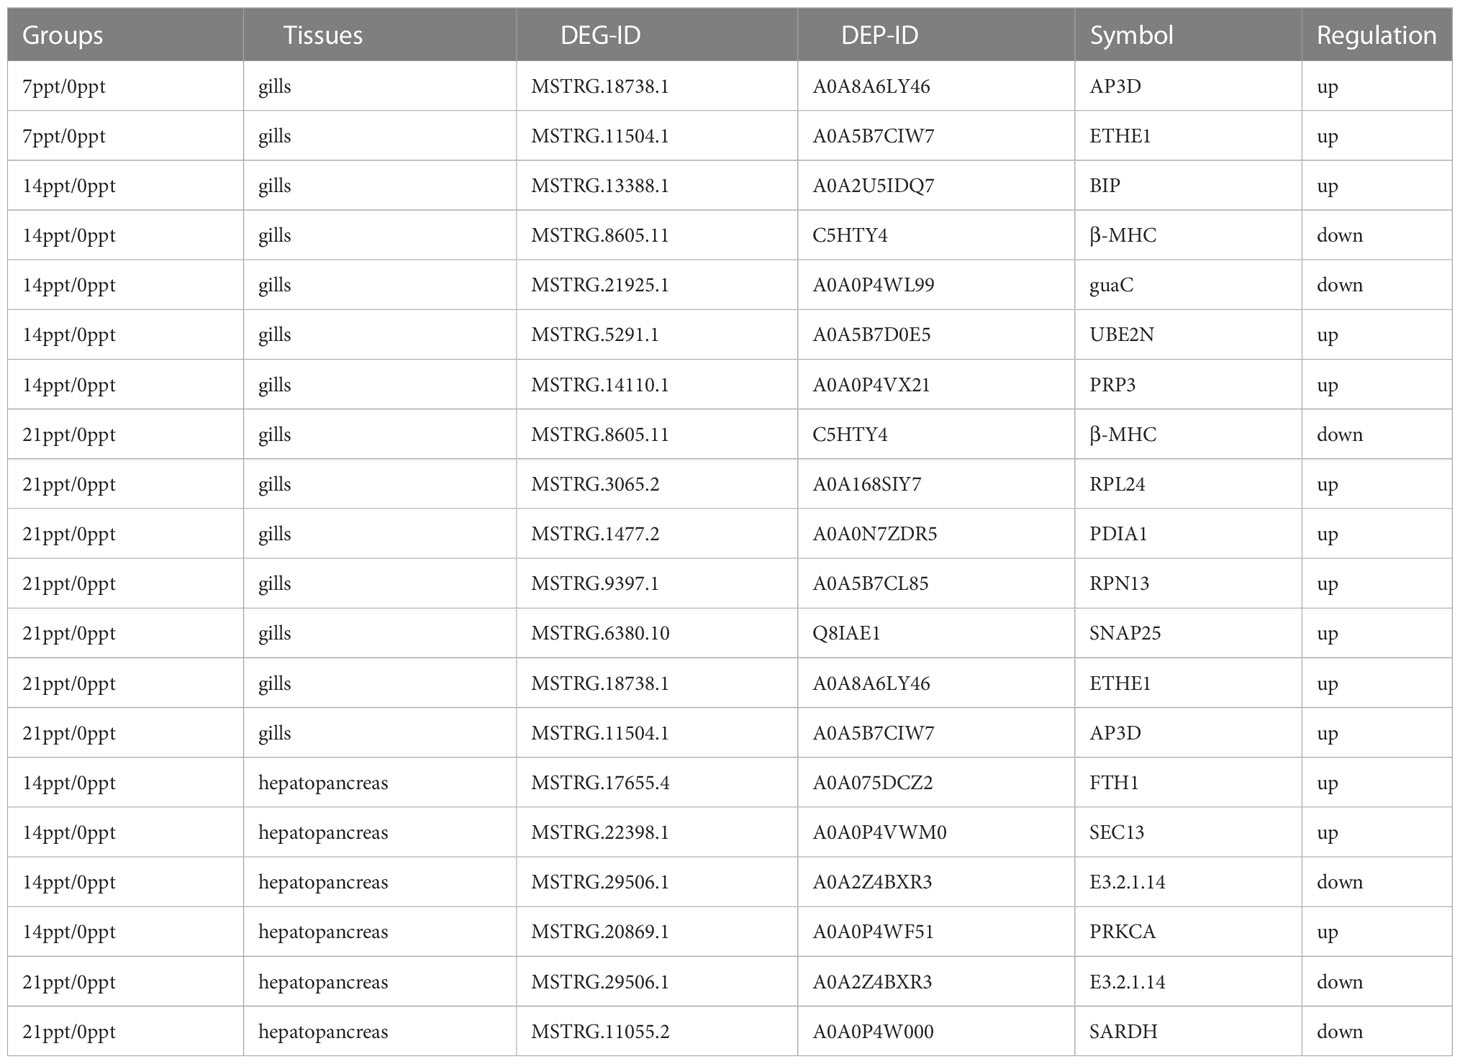
Table 1 DEGs and related DEMs classification through integrated analysis.
4 Discussion
4.1 Effect of different salinity gradients on growth performance of M. nipponense
Salinity is a critical environmental factor influencing the osmotic pressure of aquatic animals. Osmoregulation of crustaceans is complex due to the diverse range of salinities (Chen et al., 2015). Most crustaceans have certain salinity tolerance and can live within a specific salinity range by osmoregulation. A previous study assumed that M. nipponense could tolerate a wide range of salinity fluctuation from 0 to 22 ppt, and the semi-lethal salinity for 96 h are above 25 ppt (Huang et al., 2019). Hence, the salinity gradients 0, 7, 14, and 21 ppt were selected in the present study. In terms of the statistic of the growth trait of M. nipponense (Figures 1, 2), there was no significant difference between the 0 ppt group and the 7 ppt group. Hence, this result might indicate the possibility of cultivating the M. nipponense in a relatively low salinity gradient. Besides, the growth traits of M. nipponense in other higher salinity gradients illustrated a significant difference with the 0 ppt group, which means the higher salinity fluctuation may affect the growth performance of M. nipponense. Those results corresponded to the previous study (Huang et al., 2019).
4.2 Effect of different salinity gradients on enzyme activity of M. nipponense
The activity of digestive enzymes in crustaceans directly reflects the digestive and absorption capabilities. Besides, changes in salinity may lead to changes in digestive enzyme activity, affecting metabolic functions (Huang et al., 2019). In this study, different salinity gradients had various effects on the digestive enzyme activities of M. nipponense. Salinity had a more significant influence on trypsin and amylase in hepatopancreas, especially in 14 ppt (Figure 4). The high activities of trypsin and amylase observed in the 14 ppt group may also elucidate the feasibility of culturing M. nipponense in relatively low salinity of 7-14. Besides, the higher salinity may prevent the growth and development of M. nipponense in 21 ppt and cause histological damage (Figure 3). The immune indices, including the activity of SOD, ACP, AKP, GPX, GSH, and MDA, all showed significant differences (Figure 5). The reduction in the activities of immune enzymes in 7 ppt might be an adaptation to salinity fluctuation. Besides, the improvement of activities in 14 and 21 ppt might illustrate that high salinity contributed to the physical damage to M. nipponense. To maintain regular physiological activity, the crustacean must actively consume more energy to regulate osmotic pressure. There is a general consensus that crustaceans have the lowest metabolism levels at isotonic salinities. This allows the organism to conserve energy that would otherwise be required to regulate osmotic pressure for growth. (Ye et al., 2009). Hence, the activity of Hk and Glu were significantly low in 7 and 14 ppt (Figure 6), which may indicate that the 7 and 14 ppt gradients were near the isotonic point. Besides, the substantially higher activity of TG and Hk also illustrated that M. nipponense required more energy to regulate the osmoregulation in 21ppt.
4.3 Transcriptome and proteome correlation analysis of signal transduction-related gene expression under different salinity gradients
The integrated analysis results recorded 16 up and down-regulated proteins and related DEGs through KEGG enrichment analysis. Unexpectedly, compared with the 0 ppt group, not significantly expressed DEGs or DEPs were correlated in 7ppt of hepatopancreas. Therefore, the 7 ppt might be recommended as an appropriate salinity gradient to cultivate M. nipponense, which corresponds with the statistic of growth trait (Figures 1, 2). Besides, ETHE1 was significantly up-regulated in 7 ppt and 21 ppt. Recent studies have identified ETHE1 as a mitochondrial sulfur dioxygenase. Additionally, energy production is associated with ETHE1, which has a molecular weight of 30 kDa (Hao et al., 2016). Moreover, as a metabolic homeostasis factor in mitochondria, ETHE1 binds to nuclear transcription factors and translocates to the cytoplasm to inhibit p53-induced apoptosis. (Higashitsuji et al., 2007). There has been evidence (Sahebekhtiari et al., 2016) that a defect in the ETHE1 gene can cause mitochondrial disease, causing energy metabolism problems. The results of this study indicate that ETHE1 levels increased after exposure to salinity, suggesting the possibility of reduced cell apoptosis and provision of energy to cells. The upregulation of ETHE1 expression observed in 21 ppt was even more significant than in 7 ppt. These results further indicated that ETHE1 was activated during salinity exposure. Besides, binding protein (BIP) was up-regulated in 14 ppt in gills. BIP is a marker of endoplasmic reticulum (ER) stress and binds typically to the transmembrane PERK, IRE1 and ATF6 (Gentile et al., 2011). The upregulation of BIP usually means disturbing ER homeostasis (Wu and Kaufman, 2006). In the study, the expression level of BIP was only significantly increased in 14 ppt, which indicated that ER stress was most activated in14 ppt under salinity stress.
4.4 Transcriptome and proteome correlation analysis of metabolism-related gene expression under different salinity gradients
The integrated analysis illustrated that the chitinase (E3.2.1.14) and sarcosine dehydrogenase (SARDH) were down-regulated in hepatopancreas. In crustaceans, chitinase plays crucial roles in physiological functions, such as chitinous food digestion, moulting, and stress response. During the premoult stage, chitinase is found to degrade the chitin in the old exoskeleton into soluble forms (Proespraiwong et al., 2010). Furthermore, chitinase is also involved in modifying the peritrophic membrane and resisting environmental stress (Nikapitiya et al., 2015). The chitin metabolic process may engage in osmoregulation or be affected by salinity stress. Nevertheless, in this study, the differential expression patterns of chitinases in the hepatopancreas of M. nipponense concerning osmoregulatory function are due to different salinity gradients. Sarcosine is degraded to glycine either by sarcosine dehydrogenase or sarcosine oxidase. SARDH is essential for maintaining normal blood sarcosine levels in the rat (Harding et al., 1992). Besides, glycine is a significant amino acid and participates in the synthesis of purines, porphyrin, glutathione, creatine, and uric acid, and serves as an advance signal that activates thyroid function coincident with energy and nutrient intake (Lamers et al., 2009). Hence, the down-regulation of SARDH may inhibit glycine synthesis and restrain the development of M. nipponense in 21 ppt.
5 Conclusion
In this study, transcriptome, proteome, histopathology, and physiology analysis were investigated to explore the response mechanism of M. nipponense under long-term exposure to different salinity gradients. Through the three-month cultivating, the statistic of growth trait illustrated the possibility of culturing M. nipponense in low salinity, and the higher salinity fluctuation may affect the growth performance of M. nipponense. In terms of the histopathological analysis, the gills and hepatopancreas of M. nipponense suffered varying degrees of damage. Besides, the activities of digestive, immune-related, and metabolic enzymes were calculated. Those results illustrated that salinity significantly influenced trypsin and amylase in hepatopancreas, especially in 14 ppt. The immune-related enzymes were activated in high salinity gradients. Notably, the activity of metabolic enzymes was significantly low in 7 and 14 ppt, which may indicate that the 7 and 14 ppt gradients were near the isotonic point. Eventually, through the integration of transcriptome and proteome, 16 up and down-regulated proteins and related DEGs were detected through KEGG enrichment analysis, including ETHE1, BIP, chitinase (E3.2.1.14) and SARDH. In addition, no significantly regulated proteins and related DEGs were recorded by the correlation of transcriptome and proteome of 0 ppt and 7 ppt in hepatopancreas. Thus, the optimum survival salinity of M. nipponense may range from 0 ppt to 7 ppt. Consequently, these results may provide insight into mechanisms that govern salinity stress responses and tolerance of M. nipponense.
Data availability statement
The datasets presented in this study can be found in online repositories. The names of the repository/repositories and accession number(s) can be found at: National Center for Biotechnology Information (NCBI) BioProject database under accession number GSE222255. The proteomic data was deposited in iProX (dataset IPX0005610000).
Author contributions
JF and JLL conceived the project and provided funding acquisition and paper revision. YF and XW sampled the species and performed a formal analysis. FL, ZW, XW, and NX collected the specimens and performed the experiments. YF performed bioinformatics work, paper writing, revision, and editing. JF, JYL, and KM critically evaluated and approved the article. All authors contributed to the article and approved the submitted version.
Funding
This work was supported by the Innovation Action Plan Project of the Science and Technology Commission of Shanghai Municipality (19391900900, 21002410500), and the Key R&D Program of Guangdong Province (2020B0202010001).
Conflict of interest
The authors declare that the research was conducted in the absence of any commercial or financial relationships that could be construed as a potential conflict of interest.
Publisher’s note
All claims expressed in this article are solely those of the authors and do not necessarily represent those of their affiliated organizations, or those of the publisher, the editors and the reviewers. Any product that may be evaluated in this article, or claim that may be made by its manufacturer, is not guaranteed or endorsed by the publisher.
Supplementary material
The Supplementary Material for this article can be found online at: https://www.frontiersin.org/articles/10.3389/fmars.2022.1104984/full#supplementary-material
Supplementary Figure 1 | The quality of extracted protein evaluation by SDS-PAGE.
Supplementary Figure 2 | Comparison of gene expression data between RNA sequencing (RNA- Seq) and quantitative real-time reverse transcription PCR (qRT-PCR) of the gills (A-D), hepatopancreas (E-H) and muscle (I-L). Data were presented as mean ± standard deviation (SD) of three replicates. An asterisk on each bar indicates statistically significant differences at p < 0.05.
Supplementary Figure 3 | Distribution of molecular weight (kDa) of the gills (A) and hepatopancreas (B) as determined by ProteomeDiscoverer.
References
Bolger A., Lohse M., Usadel B. (2014). Trimmomatic: A flexible trimmer for illumina sequence data. Bioinformatics 30, 2114–2120. doi: 10.1093/bioinformatics/btu170
Cao J.-Y., Xu Y.-P., Cai X.-Z. (2016). TMT-based quantitative proteomics analyses reveal novel defense mechanisms of brassica napus against the devastating necrotrophic pathogen Sclerotinia sclerotiorum. J. Proteomics 143, 265–277. doi: 10.1016/j.jprot.2016.03.006
Chang Y., Yin C., Peng H., Shi Y. (2020). Differentially proteomic analysis of the hemocytes against aeromonas hydrophila infection in oriental river prawn Macrobrachium nipponense by iTRAQ approach. Fish Shellfish Immunol. 104, 324–336. doi: 10.1016/j.fsi.2020.06.032
Chen K., Li E., Li T., Xu C., Wang X., Lin H., et al. (2015). Transcriptome and molecular pathway analysis of the hepatopancreas in the pacific white shrimp Litopenaeus vannamei under chronic low-salinity stress. PloS One 10, 1–22. doi: 10.1371/journal.pone.0131503
Chourasia T. K., D'Cotta H., Baroiller J. F., Slosman T., Cnaani A. (2015). Effects of the acclimation to high salinity on intestinal ion and peptide transporters in two tilapia species that differ in their salinity tolerance, Comparative Biochemistry and Physiology Part A: Molecular & Integrative Physiology 218, 16–23. doi: 10.1016/j.cbpa.2018.01.004
Dai Y. F., Shen Y., Wang S. T., Zhang J. H., Su Y. H., Bao S. C., et al. (2021). RNA-Seq transcriptome analysis of the liver and brain of the black carp (Mylopharyngodon piceus) during fasting. Mar. Biotechnol. 23, 389–401. doi: 10.1007/s10126-021-10032-9
Ding Z., Yan Y., Wu Y., Xu Y., Meng Q., Jiang G. (2019). Histological analysis of an outbreak of red gill disease in cultured oriental river prawn. Macrobrachium nipponense. Aquaculture 507, 370–376. doi: 10.1016/j.aquaculture.2019.04.050
Ding Z., Zhou J., Kong Y., Zhang Y., Cao F., Luo N., et al. (2017). Dietary arachidonic acid promotes growth, improves immunity, and regulates the expression of immune-related signaling molecules in Macrobrachium nipponense (De haan). Aquaculture 484, 370–76. doi: 10.1016/j.aquaculture.2017.11.010
Fan Y., Feng J., Wang Z., Ling F., Ma K., Hua X., et al. (2022a). Integrated transcriptomic and metabolic analysis response in gills, hepatopancreas, and muscle metabolism in oriental river prawn Macrobrachium nipponense in response to acute high salinity stress. Aquac Rep. 27, 101358. doi: 10.1016/j.aqrep.2022.101358
Fan Y., Feng J., Xie N., Ling F., Wang Z., Ma K., et al (2022b). RNA-Seq provides novel insights into response to acute salinity stress in oriental r\iver prawn. Macrobrachium nipponense. 24, 820–829. doi: 10.1007/s10126-022-10151-x
Gentile C. L., Frye M., Pagliassotti M. J. (2011). Endoplasmic reticulum stress and the unfolded protein response in nonalcoholic fatty liver disease. Antioxid Redox Signal 15, 505–521. doi: 10.1089/ars.2010.3790
Giménez L., Anger K. (2001). Relationships among salinity, egg size, embryonic development, and larval biomass in the estuarine crab chasmagnathus granulata Dana 1851. J. Exp. Mar. Biol. Ecol. 260, 241–257. doi: 10.1016/s0022-0981(01)00258-1
Hao Y., Huang J., Liu C., Li H., Liu J., Zeng Y., et al. (2016). Differential protein expression in metallothionein protection from depleted uranium-induced nephrotoxicity. Sci. Rep. 6, 1–13. doi: 10.1038/srep38942
Harding C. O., Williams P., Pflanzer D. M., Colwell R. E., Lyne P. W., Wolff J. A. (1992). Sar: a genetic mouse model for human sarcosinemia generated by ethylnitrosourea mutagenesis. Proc. Natl. Acad. Sci. 89, 2644–2648. doi: 10.1073/pnas.89.7.2644
Higashitsuji H., Higashitsuji H., Masuda T., Liu Y., Itoh K., Fujita J. (2007). Enhanced deacetylation of p53 by the anti-apoptotic protein HSCO in association with histone deacetylase 1. J. Biol. Chem. 282, 13716–13725. doi: 10.1074/jbc.M609751200
Huang Y-H., Zhang M., Li Y-M. (2019). Effects of salinity acclimation on the growth performance, osmoregulation and energy metabolism of the oriental river prawn, Macrobrachium nipponense (De haan). Aquac Res. 50, 685–693. doi: 10.1111/are.13950
Huni A., Aravindan C. M. (1985). The effect of salinity on the oxygen consumption of two intertidal crustaceans. Comp. Biochem. Physiol. Part A: Physiol. - Comp. Biochem. Physiol. Physiol. 81, 869–871. doi: 10.1016/0300-9629(85)90921-1
Jiang D., Lawrence A. L., Neill W. H., Gong H. (2000). Effects of temperature and salinity on nitrogenous excretion by Litopenaeus vannamei juveniles. J. Exp. Mar. Biol. Ecol. 253, 193–209. doi: 10.1016/s0022-0981(00)00259-8
Jin S., Bian C., Jiang S., Han K., Xiong Y., Zhang W., et al. (2021). A chromosome-level genome assembly of the oriental river prawn, Macrobrachium nipponense. Gigascience 10, 1–9. doi: 10.1093/gigascience/giaa160
Jin S., Fu H., Sun S., Jiang S., Xiong Y., Gong Y., et al. (2018). iTRAQ-based quantitative proteomic analysis of the androgenic glands of the oriental river prawn, Macrobrachium nipponense, during nonreproductive and reproductive seasons. Comp. Biochem. Physiol. Part D Genomics Proteomics 26, 50–57. doi: 10.1016/j.cbd.2018.03.002
Kim D., Langmead B., Salzberg S. L. (2015). HISAT: a fast spliced aligner with low memory requirements. Nat. Methods 12, 357–360. doi: 10.1038/nmeth.3317
Kumar Chourasia T., D’Cotta H., Baroiller J.-F., Slosman T., Cnaani A., et al. (2018). Effects of the acclimation to high salinity on intestinal ion and peptide transporters in two tilapia species that differ in their salinity tolerance. Comp. Biochem. Physiol. A Mol. Integr. Physiol. 218, 16–23. doi: 10.1016/j.cbpa.2018.01.004
Lamers Y., Williamson J., Theriaque D. W., Shuster J. J., Gilbert L. R., Keeling C., et al. (2009). Production of 1-carbon units from glycine is extensive in healthy men and women 1,2. J. Nutr. 139, 666–671. doi: 10.3945/jn.108.103580
Langmead B., Salzberg S. L. (2012). Fast gapped-read alignment with bowtie 2. Nat. Methods 9, 357–359. doi: 10.1038/nmeth.1923
Li Y., Niu D., Wu Y., Dong Z., Li J. (2021). Integrated analysis of transcriptomic and metabolomic data to evaluate responses to hypersalinity stress in the gill of the razor clam (Sinonovacula constricta). Comp. Biochem. Physiol. Part D Genomics Proteomics 38, 100793. doi: 10.1016/j.cbd.2021.100793
Love M. I., Huber W., Anders S. (2014). Moderated estimation of fold change and dispersion for RNA-seq data with DESeq2. Genome Biol. 15, 550. doi: 10.1186/s13059-014-0550-8
Ma K., Feng J., Lin J., Li J. (2011). The complete mitochondrial genome of Macrobrachium nipponense. Gene 487, 160–165. doi: 10.1016/j.gene.2011.07.017
Ma K., Qiu G., Feng J., Li J. (2012). Transcriptome analysis of the oriental river prawn, Macrobrachium nipponense using 454 pyrosequencing for discovery of genes and markers. PloS One 7, e39727. doi: 10.1371/journal.pone.0039727
Nikapitiya C., Kim W. S., Park K., Kim J., Lee M. O., Kwak I. S. (2015). Chitinase gene responses and tissue sensitivity in an intertidal mud crab (Macrophthalmus japonicus) following low or high salinity stress. Cell Stress Chaperones 20, 517–526. doi: 10.1007/s12192-015-0576-1
Nikapitiya C., Kim W.-S., Park K., Kwak I.-S. (2014). Identification of potential markers and sensitive tissues for low or high salinity stress in an intertidal mud crab (Macrophthalmus japonicus). Fish Shellfish Immunol. 41, 407–416. doi: 10.1016/j.fsi.2014.09.018
Proespraiwong P., Tassanakajon A., Rimphanitchayakit V. (2010). Chitinases from the black tiger shrimp Penaeus monodon: Phylogenetics, expression and activities. Comp. Biochem. Physiol. - B Biochem. Mol. Biol. 156, 86–96. doi: 10.1016/j.cbpb.2010.02.007
Roberts A., Pachter L. (2013). Streaming fragment assignment for real-time analysis of sequencing experiments. Nat. Methods 10, 71–73. doi: 10.1038/nmeth.2251
Roberts A., Trapnell C., Donaghey J., Rinn J., Pachter L. (2011). Improving RNA-seq expression estimates by correcting for fragment bias. genome biol 12(3):R22. Genome Biol. 12, R22. doi: 10.1186/gb-2011-12-3-r22
Sahebekhtiari N., Thomsen M. M., Sloth J. J., Stenbroen V., Zeviani M., Gregersen N., et al. (2016). Quantitative proteomics suggests metabolic reprogramming during ETHE1 deficiency. Proteomics 16, 1166–1176. doi: 10.1002/pmic.201500336
Tang T., Ji C., Yang Z., Liu F., Xie S. (2017). Involvement of the Macrobrachium nipponense rhodanese homologue 2, MnRDH2 in innate immunity and antioxidant defense. Fish Shellfish Immunol. 70, 327–334. doi: 10.1016/j.fsi.2017.09.010
Wang W., Sun R., Wang A., Bao L., Wang P. (2002). Effect of different environmental factors on the activities of digestive enzymes and alkaline phosphatase of Macrobrochium nipponense. Ying yong sheng tai xue bao = J. Appl. Ecol. / Zhongguo sheng tai xue xue hui Zhongguo ke xue yuan Shenyang ying yong sheng tai yan jiu suo zhu ban 13, 1153–1156.
Wu J., Kaufman R. J. (2006). From acute ER stress to physiological roles of the unfolded protein response. Cell Death Differ 13, 374–384. doi: 10.1038/sj.cdd.4401840
Xue C., Xu K., Jin Y., Bian C., Sun S. (2022). Transcriptome analysis to study the molecular response in the gill and hepatopancreas tissues of Macrobrachium nipponense to salinity acclimation. Front. Physiol. 13. doi: 10.3389/fphys.2022.926885
Keywords: Macrobrachium nipponense, salinity stress, transcriptome, proteome, histology, biochemistry
Citation: Fan Y, Wu X, Ling F, Wang Z, Ma K, Xie N, Li J, Feng J and Li J (2023) Transcriptome, Proteome, Histology, and Biochemistry Analysis of Oriental River Prawn Macrobrachium nipponense under Long-term Salinity Exposure. Front. Mar. Sci. 9:1104984. doi: 10.3389/fmars.2022.1104984
Received: 22 November 2022; Accepted: 13 December 2022;
Published: 08 February 2023.
Edited by:
Yafei Duan, South China Sea Fisheries Research Institute, ChinaReviewed by:
Zhiguo Dong, Jiangsu Ocean University, ChinaDa Huo, Institute of Oceanology (CAS), China
Haifeng Jiao, Zhejiang Wanli University, China
Copyright © 2023 Fan, Wu, Ling, Wang, Ma, Xie, Li, Feng and Li. This is an open-access article distributed under the terms of the Creative Commons Attribution License (CC BY). The use, distribution or reproduction in other forums is permitted, provided the original author(s) and the copyright owner(s) are credited and that the original publication in this journal is cited, in accordance with accepted academic practice. No use, distribution or reproduction is permitted which does not comply with these terms.
*Correspondence: Jianbin Feng, amJmZW5nQHNob3UuZWR1LmNu; Jiale Li, amxsaTIwMDlAMTI2LmNvbQ==
†These authors have contributed equally to this work