 Yixiao Du
 Zhixin Cheng
 Zaijin You2
- 1College of Environmental Science and Engineering, Dalian Maritime University, Dalian, China
- 2Centre for Ports and Maritime Safety, Dalian Maritime University, Dalian, China
River discharge is a controlling factor in estuarine morphological changes; estuarine topography can be significantly altered even by only one flooding event. However, the mechanism of morphological changes in mountain-stream macro-tidal estuaries during wet seasons is not fully understood. Taking the Yalu River Estuary (YRE), China, as an example, this study aims to explore the effects of extreme flooding events on estuarine morphology. An improved Finite Volume Coastal Ocean Model (FVCOM) was applied in the YRE to reproduce the distribution of bed sediment erosion and deposition during dry years, normal years, and wet years. Sensitivity tests were conducted to assess the responses of the estuarine system to river discharge. The influence of the Yalu River on the magnitude of estuarine bed change was examined. With an increase in river discharge, the bed thickness in the main estuarine channel first increased and then decreased after reaching a threshold of 0.4 × 10⁴m3/s. Simultaneously, density stratification became stronger with the increase in runoff. Subsequently, vertical mixing of water was weakened after a certain threshold, which in turn, enhanced the density stratification and changed the location of the Estuarine Turbidity Maxima (ETM). In addition, river effects contributed to nearly half of the bed erosion under 0.6 × 10⁴m3/s (flooding with 50-year return period). The ETM extended and moved approximately 8 km seaward during flooding events. The West River channel experienced strong siltation, which was more significant during flood events. The results of this study demonstrate that estuarine circulation plays a key role in morphology change. The magnitude of bed thickness erosion can reach 22% of the total initial thickness during one flooding event. This rapid change is a threat to the stability of port infrastructures, and actions should be taken to maintain the safety of coastal construction.
1. Introduction
Estuaries serve as conjunctions between catchment and coastal waters, exchanging materials and energy with the two systems (Barbier et al., 2011; Zhu et al., 2017). Morphological change in estuaries is a key issue in maintaining the balance of this system, which is controlled by a combination effect of climatic conditions, fluvial discharges, tides, and human activities (Luan et al., 2016; Xie et al., 2018; Ralston et al., 2019). In recent years, the occurrence of extreme weather has accelerated the morphological evolution of estuarine regions, with flooding events caused by extreme rainfall severely impacting estuarine landscapes. As a result, bed sediments in estuaries experience rapid changes due to stronger dynamic conditions (Cooper, 2002; Xie et al., 2018). Even just one strong flood can induce dramatic changes in the estuarine landscape (Dittmann et al., 2015; Ward et al., 2018). Therefore, it is of great significance to investigate estuarine morphological changes under extreme weather and to analyze the physical mechanism behind this.
Bed sediments in estuaries can be affected by four factors: (1) upstream river sediment supply, (2) sediment resuspension in estuaries, (3) estuarine circulation, and (4) tidal asymmetry (Dyer, 1997; Burchard and Baumert, 1998; Zhu et al., 2021). First, fluvial sediment supply directly determines the balance of estuarine sediments, which changes regional sediment erosion and deposition patterns (Milliman and Meade, 1983; Meade, 1996; Poulenard et al., 2009; Rickson, 2014). Heavy rainfalls and extreme flood events will substantially increase the river sediment supply, which alters the estuarine sediment transport (Croke et al., 2013; Koiter et al., 2013; Bracken et al., 2015). Resuspension of sediment is influenced by tides, runoff, wind-driven currents, and waves (Vercruysse et al., 2017; Andutta et al., 2019). Irregular runoff during floods affects the sediment resuspension process by changing the bottom shear stress. This mechanism can be complex in a macro-tidal estuary due to non-linear river–tide interactions (Whipple et al., 2018). The third factor, estuarine circulation, is an important process during wet seasons, when freshwater flows in a plume on the estuarine surface toward the sea, while salt water flows landward underneath. Such circulation, controlled by the density gradient and gravity, can dominate the estuarine sediment transport conditions (MacCready and Geyer, 2010; Yang et al., 2021). The last factor, tidal asymmetry, can influence the tidal pumping effects and can affect the estuarine total sediment flux (Dronkers, 1986; Nidzieko, 2010; Becherer et al., 2016). Tidal asymmetry is caused by a nonlinear process due to the estuarine geometry, which can be expressed by the difference between flood and ebb tidal velocities, flood and ebb durations, and leads to the generation of an M4 split tide (Dronkers, 1986; Friedrichs and Aubrey, 1988; Bolle et al., 2010; Hunt et al., 2015).
As for the morphological process in a macro-tidal estuary, river–tide interactions play a crucial role (Guo et al., 2014; Luan et al., 2016). Furthermore, in a mountain stream estuary, the river discharge dramatically changes during different seasons. Limited fluvial sediment supply during dry seasons may lead to a shift from siltation to erosion of the estuarine bed sediments, while large runoff during wet seasons can alter this system again inside just 1 year (Lu et al., 2011; Luan et al., 2017; Dai et al., 2018; Xie et al., 2021). Although a remarkable contribution has been made by previous studies on estuarine morphological research, the morphological change mechanism in a macro-tidal estuary during flooding events has not been fully understood, as most previous studies adopted one- or two-dimensional long-term morphological models without baroclinic effects.
The Yalu River Estuary (YRE), located at the border of China and North Korea, is a typical mountain stream estuary with strong tidal actions. There is a strong seasonal fluctuation in the discharge of the Yalu River, and the catchment has experienced numerous flooding events over the past 60 years (Gao et al., 2012). In addition, with its funnel shape and flared shorelines, the sedimentation process in this area is quite complex. Previous studies concluded that the main factor affecting sediment transport in this area is local sediment resuspension, and changes in the estuarine geometry due to land reclamation have enhanced this resuspension process due to stronger tidal choking effects (Cheng et al., 2020; Yang et al., 2021). However, the effects of river discharge on the sedimentation process in the YRE, especially during flood events, remain unknown.
Therefore, taking the YRE as an example, this study aims to investigate the mechanism of estuarine morphological change during flooding events. The specific research objectives are as follows: (1) to explore the estuarine bed thickness changes in the YRE due to runoff variation using a three-dimensional (3D) hydro-sediment baroclinic coastal model, (2) to understand the response mechanism of the estuarine morphology to different river discharges in the YRE, and (3) to study the impact of an extreme flood event on the estuarine morphology. This study helps to further analyze the physical mechanism of estuarine morphology change in macro-tidal estuaries during extreme weather events. It also provides a theoretical basis for maintaining port engineering and disaster prevention plans in coastal areas.
2. Study area
This study takes the YRE as the study area (Figure 1). The Yalu River is the border river between China and North Korea. The average annual runoff of the Yalu River is 2.32 × 10¹⁰ m3, and the average annual precipitation in the basin is 1,020 mm, with 33% of the annual runoff occurring during the flood season from July to August (Gao et al., 2012). The YRE is a shallow mountain stream estuary with a large tidal range of up to 6.7 m. The sediments here are mostly fine, with a median particle size of 0.2 mm, which can be easily moved by local dynamics. As a turbid estuary, the Estuarine Turbidity Maxima (ETM) in the YRE is strong over most of the year, and the overall morphological stability is relatively weak. The YRE is divided into the west and east channels; the main water channel—called the Middle River—with a submerged sandbar downstream is in the center of the estuary (Cheng et al., 2019; Cheng et al., 2020).
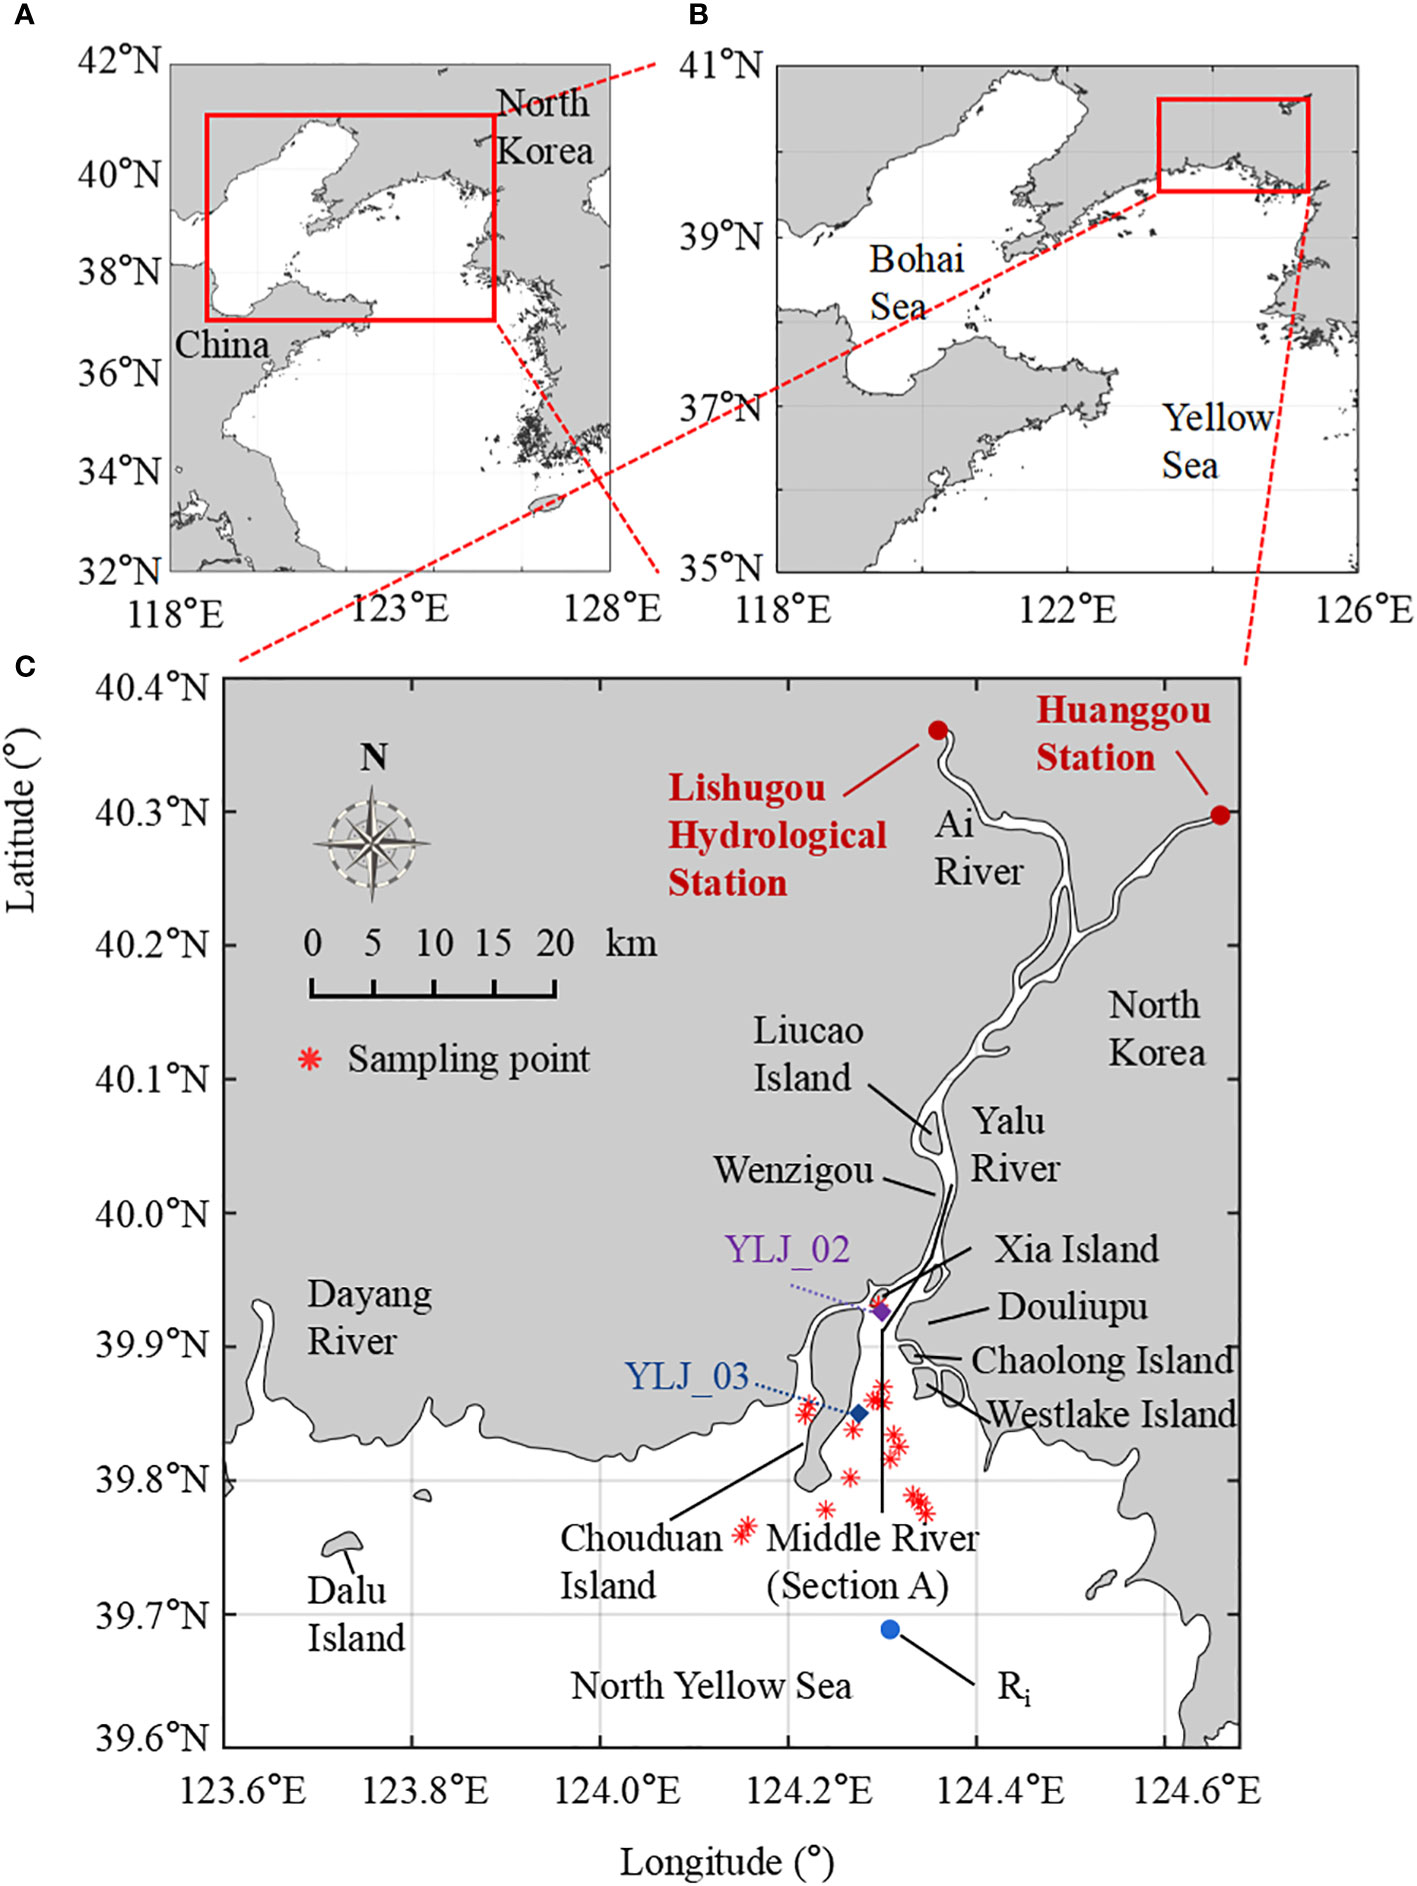
Figure 1 (A, B) Location of the Yalu River basin and the Yalu River Estuary (YRE). (C) Location of data sampling sites in the YRE. The red stars indicate the sites of the collected column sediments, YLJ_02 and YLJ_03 are hydrodynamic observation stations, the red dots are the hydrological stations, and section A is the selected along-channel section.
In August 2010, the Yalu River basin experienced a severe flooding event (recurring every 50 years) caused by subtropical high pressure. Intense rainfall reached the catchment on 19 August 2010, resulting in a peak discharge of 12,800 m3/s at Huanggou hydrological station.
3. Data and methods
3.1. Field measurements and hydrological data
The in situ hydrodynamic observations (including water level, velocity, flow direction, turbidity, and salinity) in the YRE during August 2009 at YLJ-02 (124.3028°E, 39.9203°N) and YLJ-03 (124.278°E, 39.8396°N) were used in this study. Continuous observations were performed at these two sites for 25 h during the spring and neap tide, respectively (Figure 1C). Flow velocity and direction data were obtained using an Acoustic Doppler Current Profiler fixed at 0.1 m from the bottom of the vessel (the acoustic frequency was set at 1,200 kHz and the flow velocity resolution was 0.001 m/s). Suspended sediment concentration (SSC) was obtained from on-site sampling. We used the YSI6600 multi-parameter water quality detector for turbidity measurements and transformed turbidity into SSC according to the relationship between the two (Cheng et al., 2016). Bed sediment column samples were collected from 19 sites around the estuary in 2010 and 2014, and the accumulation rates of the bottom sediments were obtained from the chronological results (Cheng et al., 2019).
This study also analyzed the runoff and sediment discharge data of the Yalu River from 1958 to 2017 (daily data for 2009–2017; annual data for 1958–2008) recorded at the Huanggou and Lishugou hydrological stations (Figure 1C). According to anomalies in the river discharge data, years were classified into three categories: dry years, normal years, and wet years (Figure 2A). The classification method is as follows:
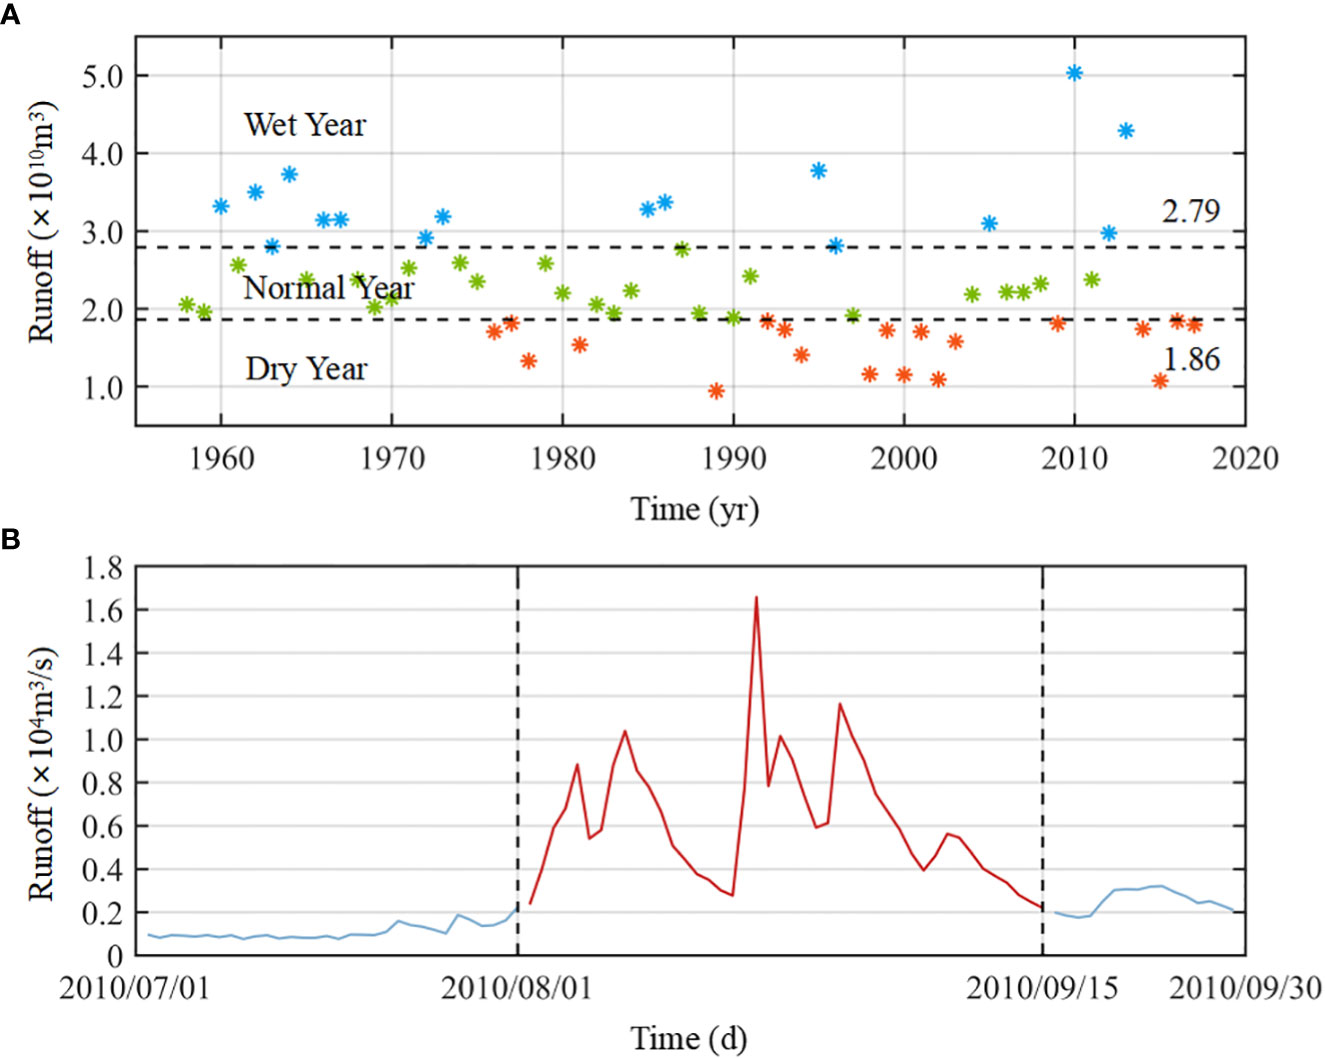
Figure 2 (A) Distribution and classification of total annual runoff (1958–2017). (B) Daily runoff of the Yalu River during extreme flooding events in 2010. *represents the total runoff in each year.
where P is the average anomaly level given in percentage, Fluxn is the total runoff for one year, and Fluxaverage is the multi-year averaged total runoff. When P< −20%, the year is classified as a dry year; when −20%< P< 20%, the year is classified as a normal year; and when 20%< P, the year is classified as a wet year.
We took the average flow rate (1,000 m3/s) during the wet season in 2015 (dry year) as a representative runoff value for dry years, 2,000 m3/s in 2011 (normal year) for normal years, and 4,000 m3/s in 2013 for wet years. Furthermore, a value of 6,000 m3/s was taken as the average runoff rate for a typical flooding event in this area (Table 1). Meanwhile, the hourly hydrological data from July–September 2010 was used to study the sedimentation change during the 50-year flood event (extreme flooding event) in the YRE (Figure 2B).
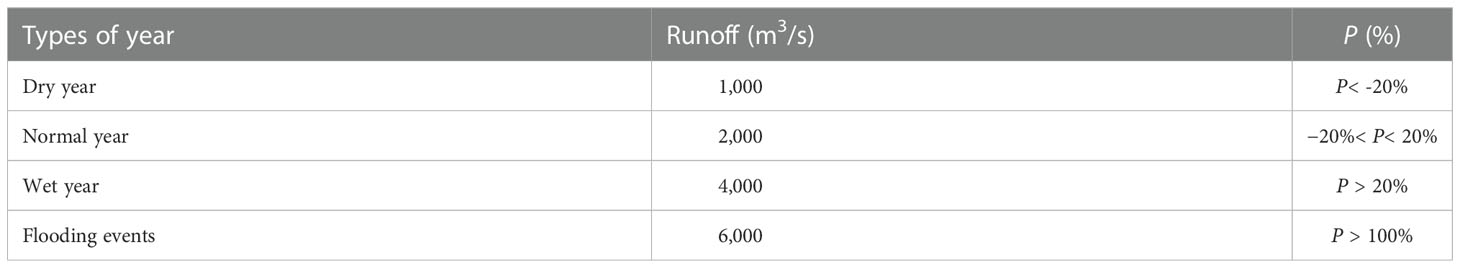
Table 1 List of year classification according to runoff.
3.2. Satellite -derived bathymetry
To improve the accuracy of coastal model results, this study adopted satellite-derived bathymetry (SDB) and coastlines with high resolution. Images and band reflectance from the satellites Landsat 7 ETM+ (Enhanced Thematic Mapper), Landsat 8 OLI (Operational Land Imager), and TIRS (Thermal Infrared Sensor) were used to calculate the estuarine geometry with a resolution of 30 m. In this study, the shoreline of the YRE was extracted using ArcGIS from satellite images taken by Landsat 7 in July 2009, and the bathymetry was obtained from the reflectance of Landsat 8 in August 2013.
The band ratio model, a commonly used SDB method, is adopted in this study. As the depth of shallow water increases (H < 15 m), the ratio of the blue reflectance band to the green reflectance band increases (Philpot, 1989) (Traganos et al., 2018). In this study, the band ratio model (Eq. 2) was used to obtain the water depth of the study area based on the corresponding band reflectance obtained from Landsat 8 (Stumpf et al., 2003). By relating the band ratios to the water depth and deriving the logarithmic relationship between them, an SDB equation for coastal estuaries can be established by means of linear regression. It can be expressed as follows:
where H is the actual water depth, Rrsi is the green band reflectance, Rrsj is the blue band reflectance, n is a positive integer (usually taken as n = 1,000), and m1 and m2 are constants derived from the linear regression fit.
3.3. Numerical simulations
3.3.1. Model description
In this study, a 3D hydro-sediment baroclinic model is established for the YRE using the Finite Volume Coastal Ocean Model (FVCOM). The FVCOM is a coastal model based on unstructured grid, finite volume method, free surface, and 3D primitive equations. The unstructured grid can reproduce the complex topography better, which is suitable for this study (Chen et al., 2011; Ge et al., 2020).
The sediment transport module chosen in this study is the Community Sediment Transport Modeling System developed by the US Geological Survey using the FVCOM. At the bed surface, the sedimentation flux is determined by the amount of deposition versus erosion:
The bed surface erosion rate is calculated using the following equation:
where Qi is the erosion flux, Pb is the degree of bottom-bed laxity, Fbi is the fraction of sediment i deposited in the streambed, τb is the bottom shear stress, and τci is the critical shear stress of material i at the bottom (Ge et al., 2020).
3.3.2. Model configuration
The model domain (Figure 3) in this study covers the entire YRE (longitude: 123.83°E–124.60°E, latitude: 39.50°N–40.00°N). The model grid was created using the surface water modeling system. The maximum grid size is approximately 1,500 m at the open boundary and the minimum grid size is approximately 50 m along the coast (Table 2). The model uses coastline data from Landsat 7 and bathymetry data combined with navigation charts and SDB from Landsat 8. Vertically, the model consists of 20 sigma layers each with the same thickness.
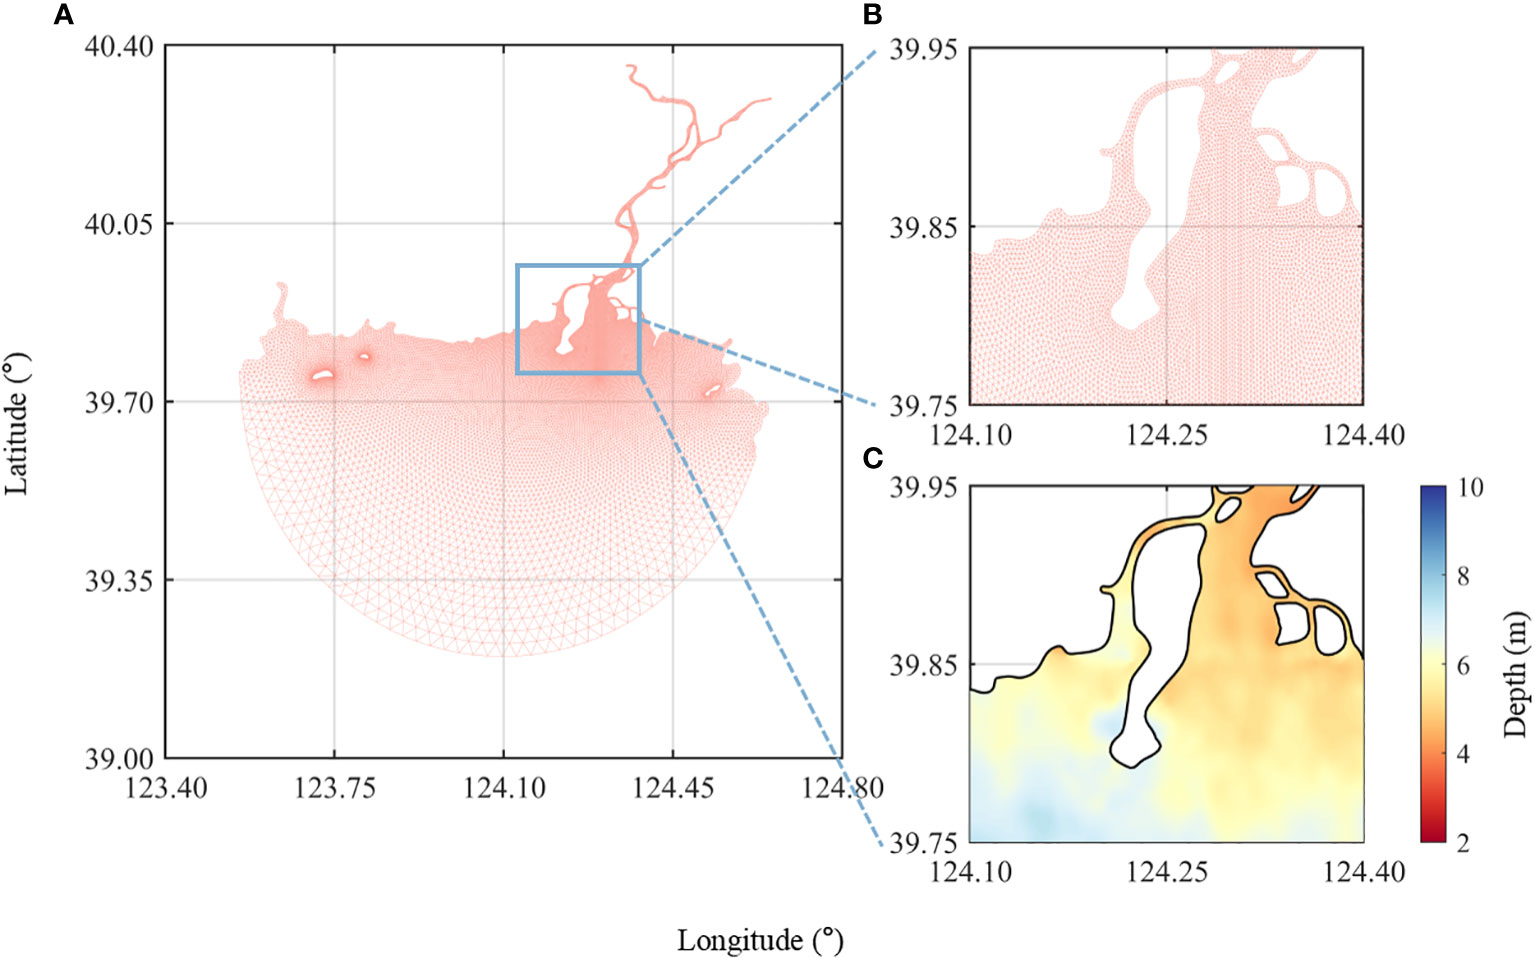
Figure 3 Grids of the model domain for (A) overall, (B) estuary area, and (C) enlarged view of the estuarine bathymetry.
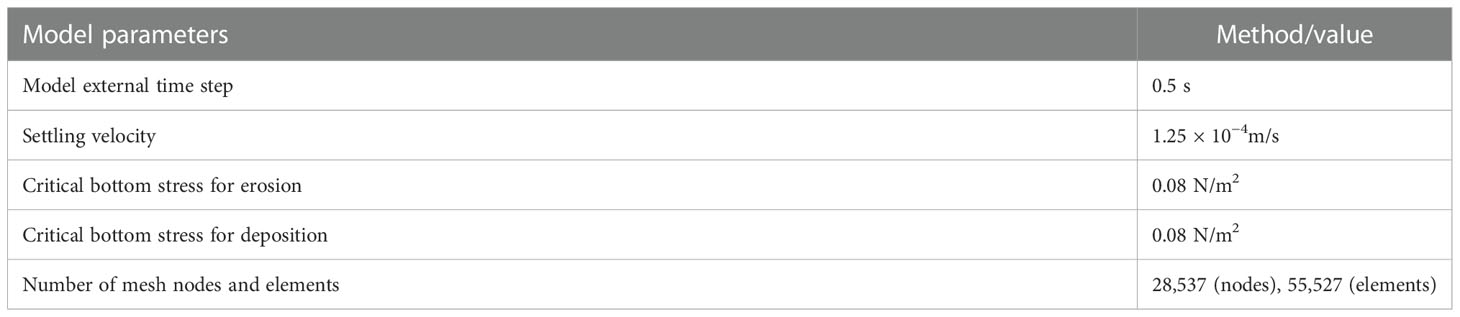
Table 2 Key parameters of the model configuration.
The external forces contained in the model include the following: wind speed and pressure data, obtained from the National Centers for Environmental Prediction Climate Forecast System, version 2; initial temperature and salt field from the hybrid coordinate ocean model; surface atmospheric pressure data, long-wave radiation, short-wave radiation, relative humidity, and surface temperature, provided by the National Center For Atmospheric Research (NCAR). The tidal elevations at the open boundary are derived from global tidal model TPXO7.2, and include four diurnal components (K1, Q1, P1, and O1), four semi-diurnal components (M2, S2, N2, and K2), three shallow water components (M4, MS4, and MN4), and two long-period components (MF and MM). River inputs consist of daily observations made at the Huanggou and Lishugou hydrological stations, including the daily runoff and suspended sediments. The maximum wave height in the YRE rarely exceeds 1 m, with limited effects on the sedimentation process compared with the large runoff and strong tides; therefore, wave action is not included in the model.
In this study, seven experiments were designed according to the classification described in “Section 3.1” (Table 3). Only the river forcing was set to be changed in these experiments. Case 0 was for the observation period in 2009, which was used to verify the model accuracy. Cases 1 to 4 had different runoff rates: 0.1 × 10⁴ m3/s (dry year), 0.2 × 10⁴ m3/s (normal year), 0.4 × 10⁴ m3/s (wet year), and 0.6 × 10⁴ m3/s (extreme flood events). Other settings were the same as for case 0. Case 5 used the real hourly runoff during the extreme flooding event of 2010 as input. For the sediment load, cases 1 to 5 used the same total constant sediment load (10 kg/s) to investigate the effect of water discharge on estuarine morphology, neglecting the influence of increasing sediment load. Case 6 used both real runoff and sediment load during extreme flooding in 2010. All seven experiments were calculated from July 1 2009 to September 30 2009, covering the wet season of the basin for a total of 92 days, and all cases had a 15-day warm-up period. The sediment parameters of the bed sediments were set as listed Table 4, and included two types of cohesive sediments and one type of non-cohesive sediment. The initial bottom bed thickness was 2 m, with a 1-m depth of fine sediments on the top and a 1-m depth of coarse sediments below.
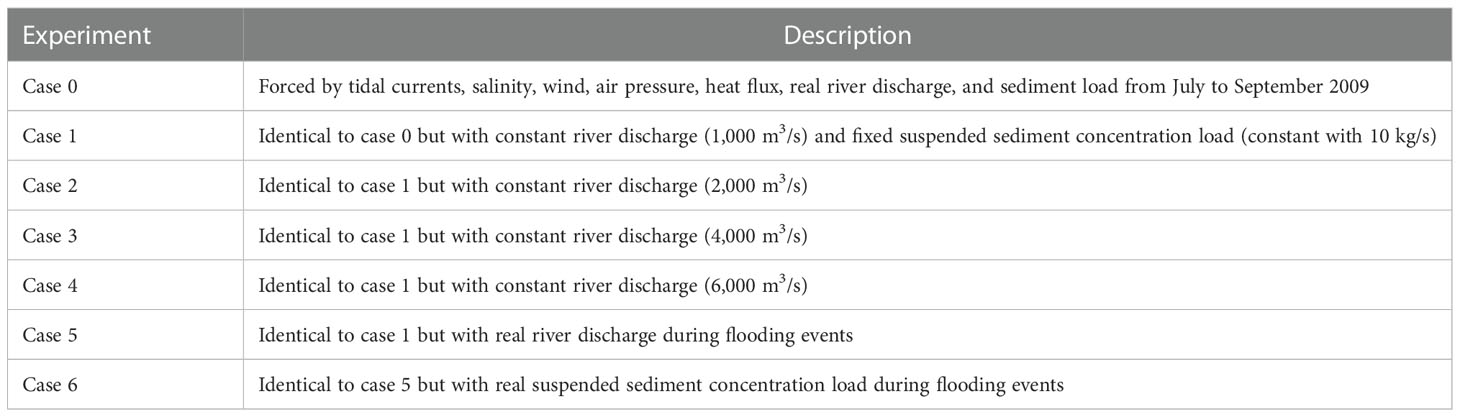
Table 3 Experiment descriptions.
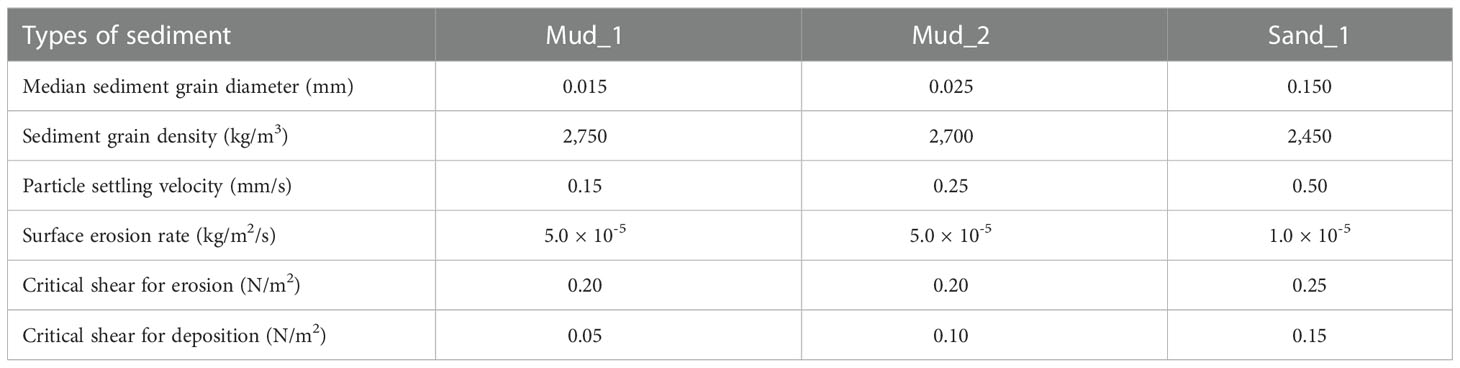
Table 4 Key parameters of the sediment model.
3.4. Mechanism analysis methods
3.4.1. Richardson number
In order to better investigate the vertical mixing variation pattern in the estuary, the Richardson number (Ri), which is a dimensionless number indicating the ratio of the buoyancy term to the flow shear term, was calculated in this study:
When considering flows with small differences in density (Boussinesq approximation), it is common to use the simplified gravity g′ .
where Ri is the Richardson coefficient, g is the acceleration of gravity, ρ is the density of the water, z is the depth, u is the flow velocity, ρΔ is the density gradient, and ρaverage is the average density. When the Richardson number is less than 2.5, the buoyancy term is smaller than the vertical flow shear term, and the fluid presents a mixed state; when the Richardson number is greater than 2.5, the buoyancy term dominates, and the water presents a stratification phenomenon (Grachev et al., 2013). The Richardson number is a criterion for vertical mixing and stratification, which captures the subtle changes in fluids at different times (Galperin et al., 2007).
3.4.2. Tidal skewness
Tidal asymmetry in the estuary mainly originates from the interaction between the M2 component and the M4 component, and the tidal pumping effect caused by tidal asymmetry affects the sediment transport state in the estuary (Brown and Davies, 2010). Therefore, we calculated the tidal skewness to explore its impact on sedimentation in the YRE (Nidzieko, 2010; Song et al., 2011):
where γ1 is the tidal skewness, aD1 is the M2 amplitude, aD2 is the M4 amplitude, ∅D1 is the phase of the M2 component, and ∅D2 is the phase of the M4 component. When γ1< 0, the estuary is dominated by ebb tide (ebb dominance); when γ1 > 0, the estuary is dominated by flood tide (flood dominance).
3.4.3. Decomposition of sediment flux
To investigate the effect of residual flow on sediment transport during flooding events, we decomposed the residual flow as follows:
where uo is the residual flow velocity, u2 and u4 are the amplitudes of M2 and M4, respectively, and Ø is the difference between two times the M2 phase and the M4 phase. Residual transport is mainly composed of four contributing terms. The first term in the equation is the net transport effect of the Eulerian residual flow, here called Eulerian net transport (ENT), and the second and third terms represent the interactions between the Eulerian residual flow and tides, which have the same direction as the Eulerian residual flow, here called Eulerian induced asymmetry (EIA). The fourth term is caused by the interaction between the M2 and M4 tides and reflects the tidally induced asymmetry (TIA), whose direction is determined by the relative phase difference between M2 and M4.
4. Results and discussion
4.1. Model validation
For model validation, we compared the model results of case 0 with the measured data at YLJ-02 and YLJ-03 stations for water elevation, current speed, current direction, salinity, and SSC. The correlation coefficient (R) and the root mean square error (RMSE) between the two datasets were also calculated (Table 5). The validation results showed that the model successfully reproduced the hydrodynamic conditions and sediment transport in the YRE (Figure 4); it is thus reliable to be used to investigate changes in hydrodynamics and bottom sediments during wet seasons.
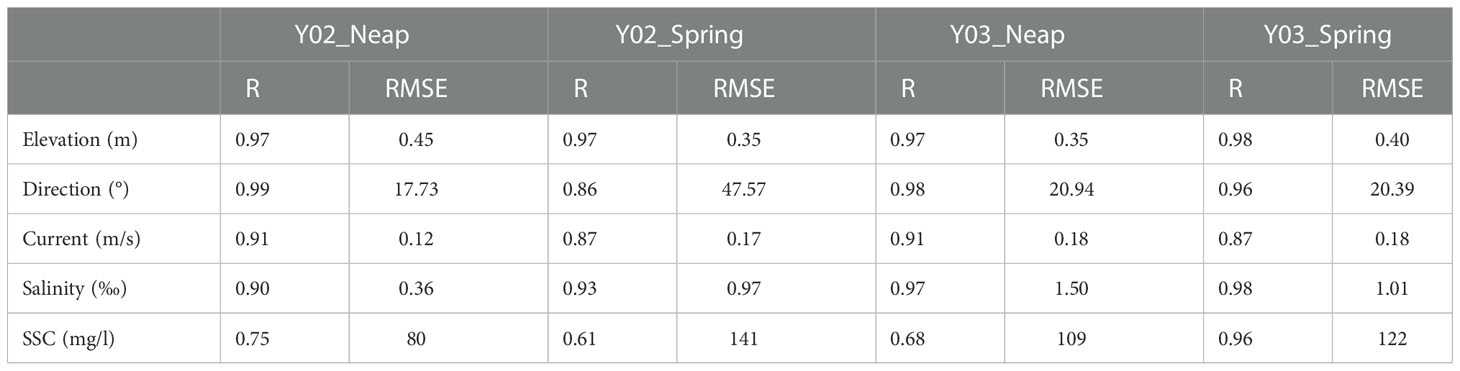
Table 5 Model validation results (R and RMSE).
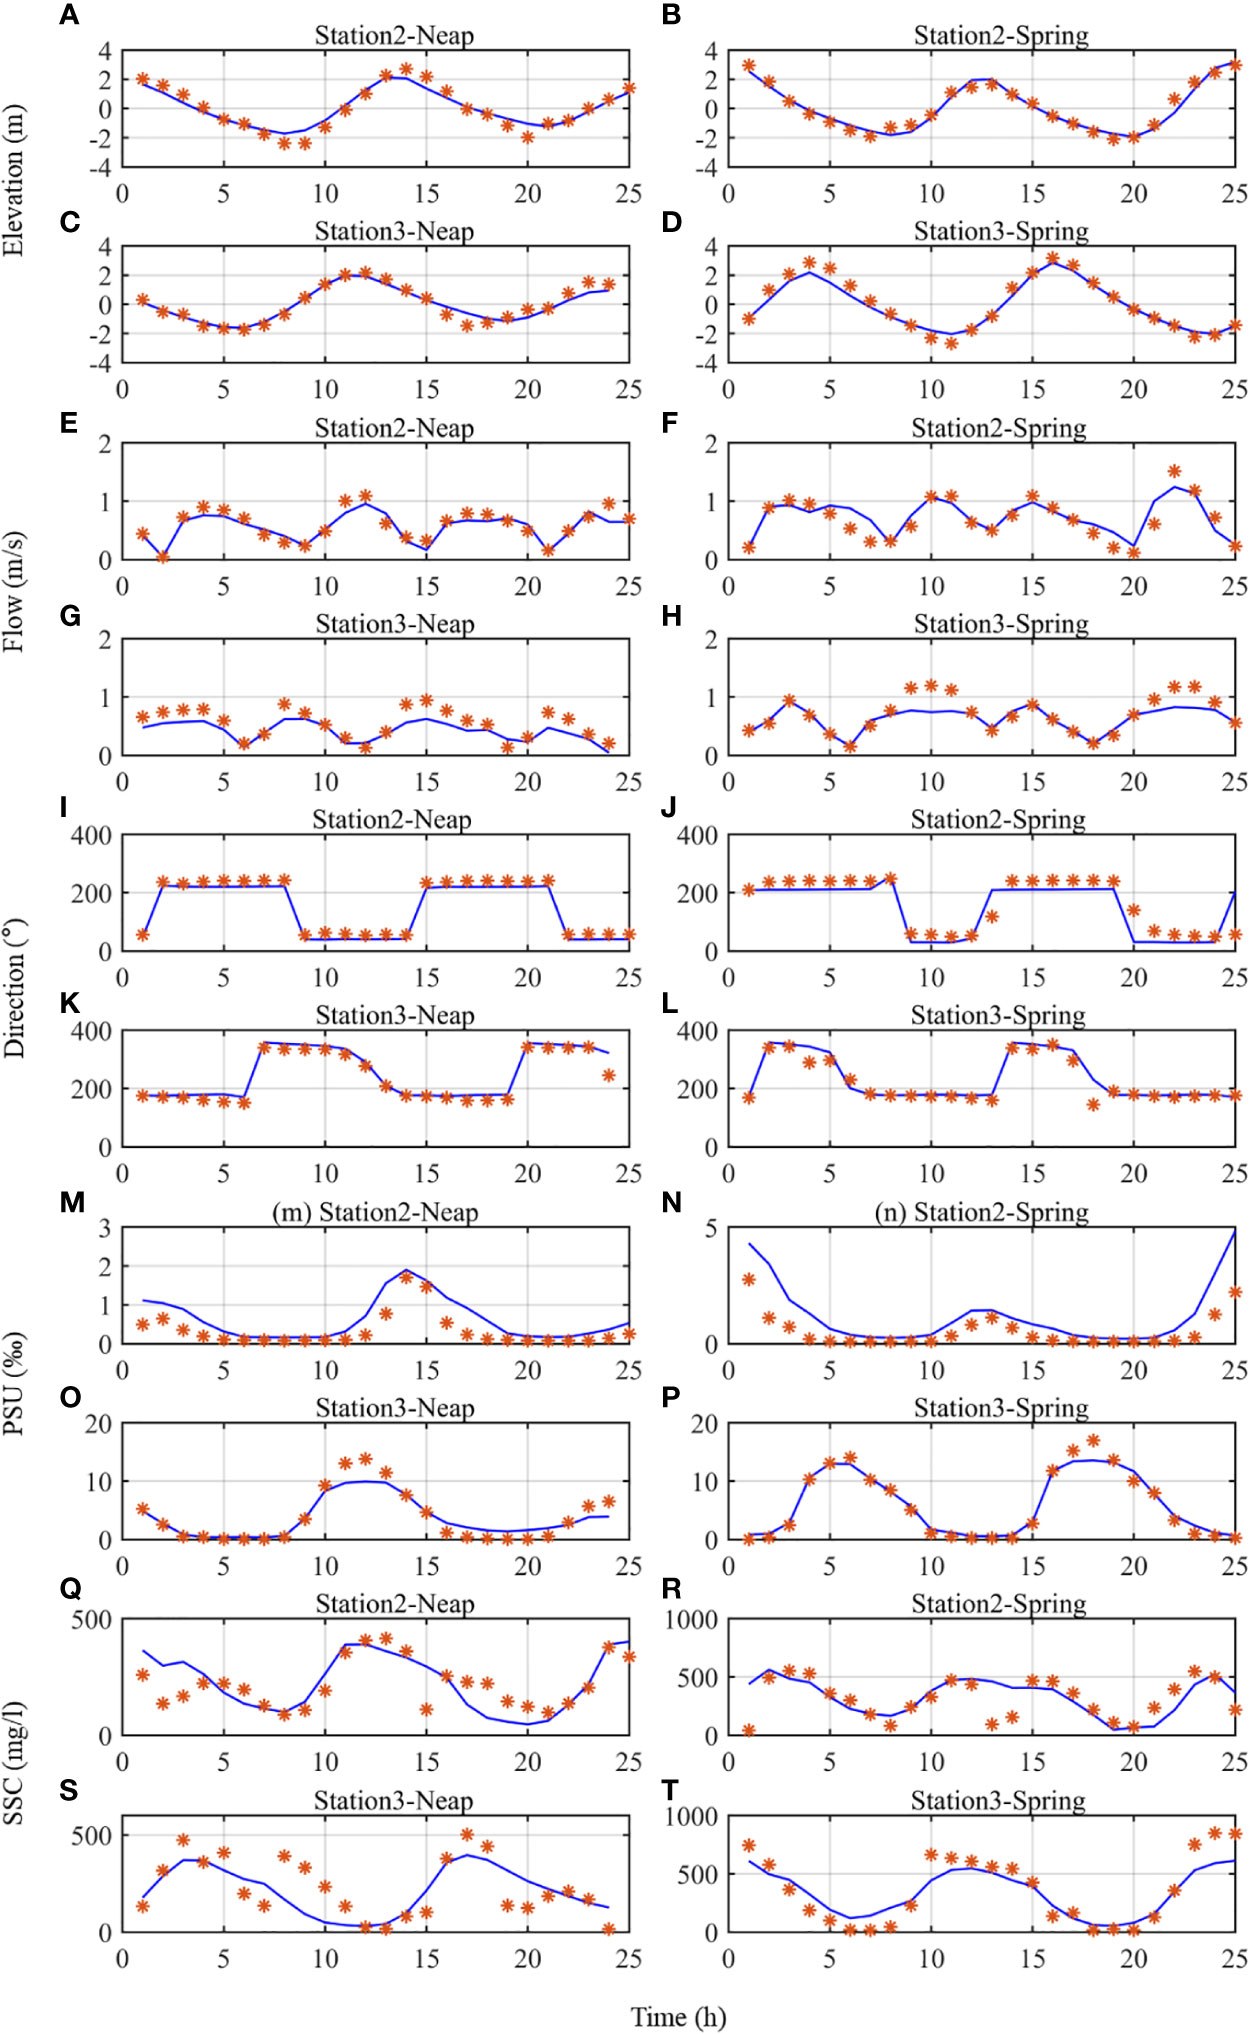
Figure 4 Comparison of depth-averaged (A–D) water elevation, (E–H) along-channel velocity, (I–L) direction, (M–P) salinity, and (Q–T) suspended sediment concentration between the model results and the field observations in August 2009 at stations Y02 and Y03 during spring and neap tides. * represents the measured data.
We obtained the sediment accumulation rate from 19 collected column samples around the estuary (Figure 1C) and plotted the distribution of sedimentation rate in the YRE using Kriging interpolation (Figure 5A). A comparison was made between these results and the modeled bed thickness change over 3 months (Figure 5B). For the distribution pattern, the overall similarity between the model results and the sampled results is 80%, indicating that the model can generally capture the patterns of erosion and siltation of bottom sediments in the YRE. However, large differences are observed in the magnitude between the two two methods, especially near the top of Chouduan Island. This is because fewer sampling sites are present there (Figure 5).
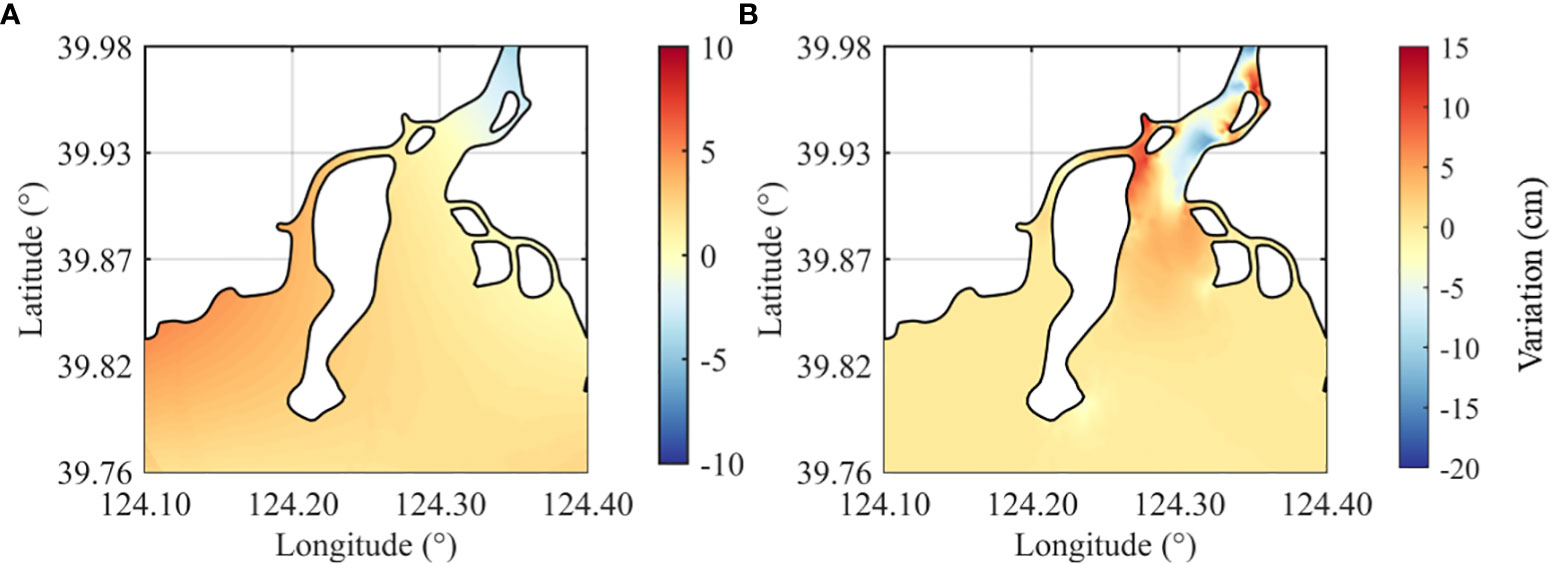
Figure 5 Comparison of (A) Kriging interpolation of the sediment accumulation rate from the collected sediment columns. (B) Modeled bed thickness change.
4.2. Changes in bed thickness and estuarine morphology
Figure 6 shows the response of bed thickness to different runoff conditions in the YRE during the wet season (July to September). The results show that the bottom sediments are strongly eroded in the upper part of the main channel (39.9°N–40.05°N) in dry and normal years. A sand bar is formed between 39.83°N and 39.93°N, which is highly consistent with field observation and previous studies (Gao et al., 2012).
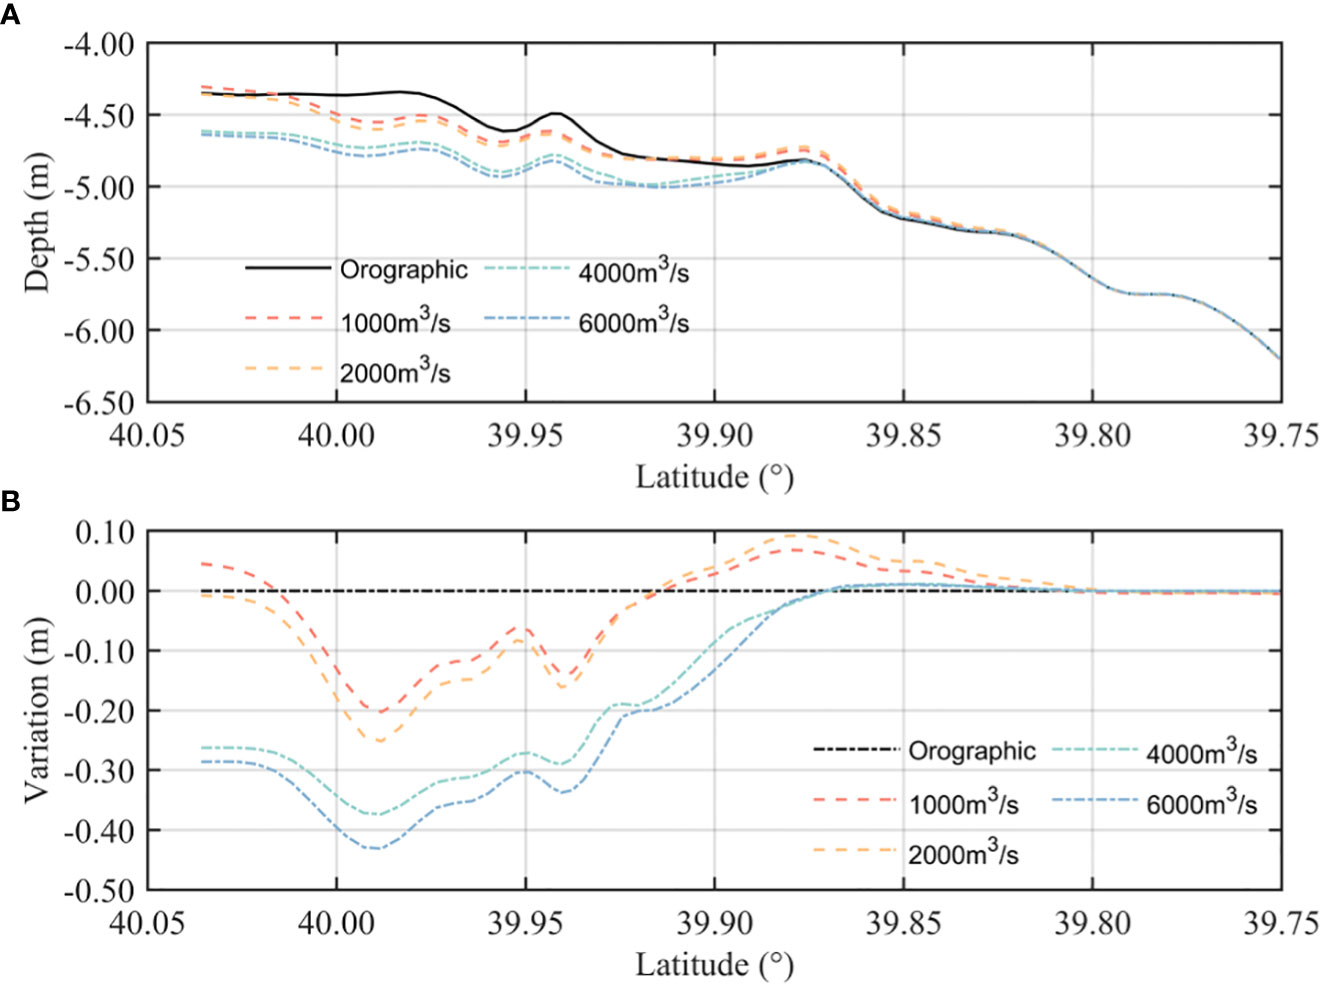
Figure 6 Modeled bed thickness along the main stream section: (A) total depth of the bottom topography and (B) bed thickness variation.
During dry and normal years (runoff< 2,000 m3/s), sediments from the upper estuary are transported seaward with runoff, and those from the lower estuary are transported landward with the tide. The net transport of those two groups of sediments determines the location of the sand bar. The sand bar center moves seaward, with a higher peak when the runoff increases. During wet years (4,000 m3/s), the increased runoff leads to stronger scouring, which hinders the formation of the sand bar and sediments accumulate further south. However, the sand bar does not move further south when the runoff continues to increase. During the flood event (6,000 m3/s), the even larger velocity generates extremely large bottom shear stress, resulting in a stronger resuspension of bottom sediments in the upper estuary, which leaves the location of the sand bar unchanged. The tidal limit in the YRE is generally at Douliupu; the range of runoff influence (see Figure 6B, where the variation is shown to be close to 0) is 12 km south of the tidal limit during dry years, 13 km during normal years, and 14.5 and 17 km during wet years and flood events, respectively.
Figure 7 shows the distribution of the morphological change in the YRE after 3 months under different runoff conditions. During dry and normal years (Figures 7A, B), large amounts of sediment silt in the southwest area, close to Xia Island. During wet years and flood events (Figures 7C, D), high flow rates allow the sediment to be transported further south in the estuary. The southwest area near Xia Island shifts from siltation to erosion after the runoff exceeds 4,000 m3/s. As the tidal direction of the YRE is southwest–northeast, some sediments accumulate on the west side of Chaolong and Westlake Islands for all experiments. However, this patch of accumulated sediments becomes weaker during flood events (Figure 7D), possibly due to the stronger flow velocity that washes large amounts of sediments from this area to the south.
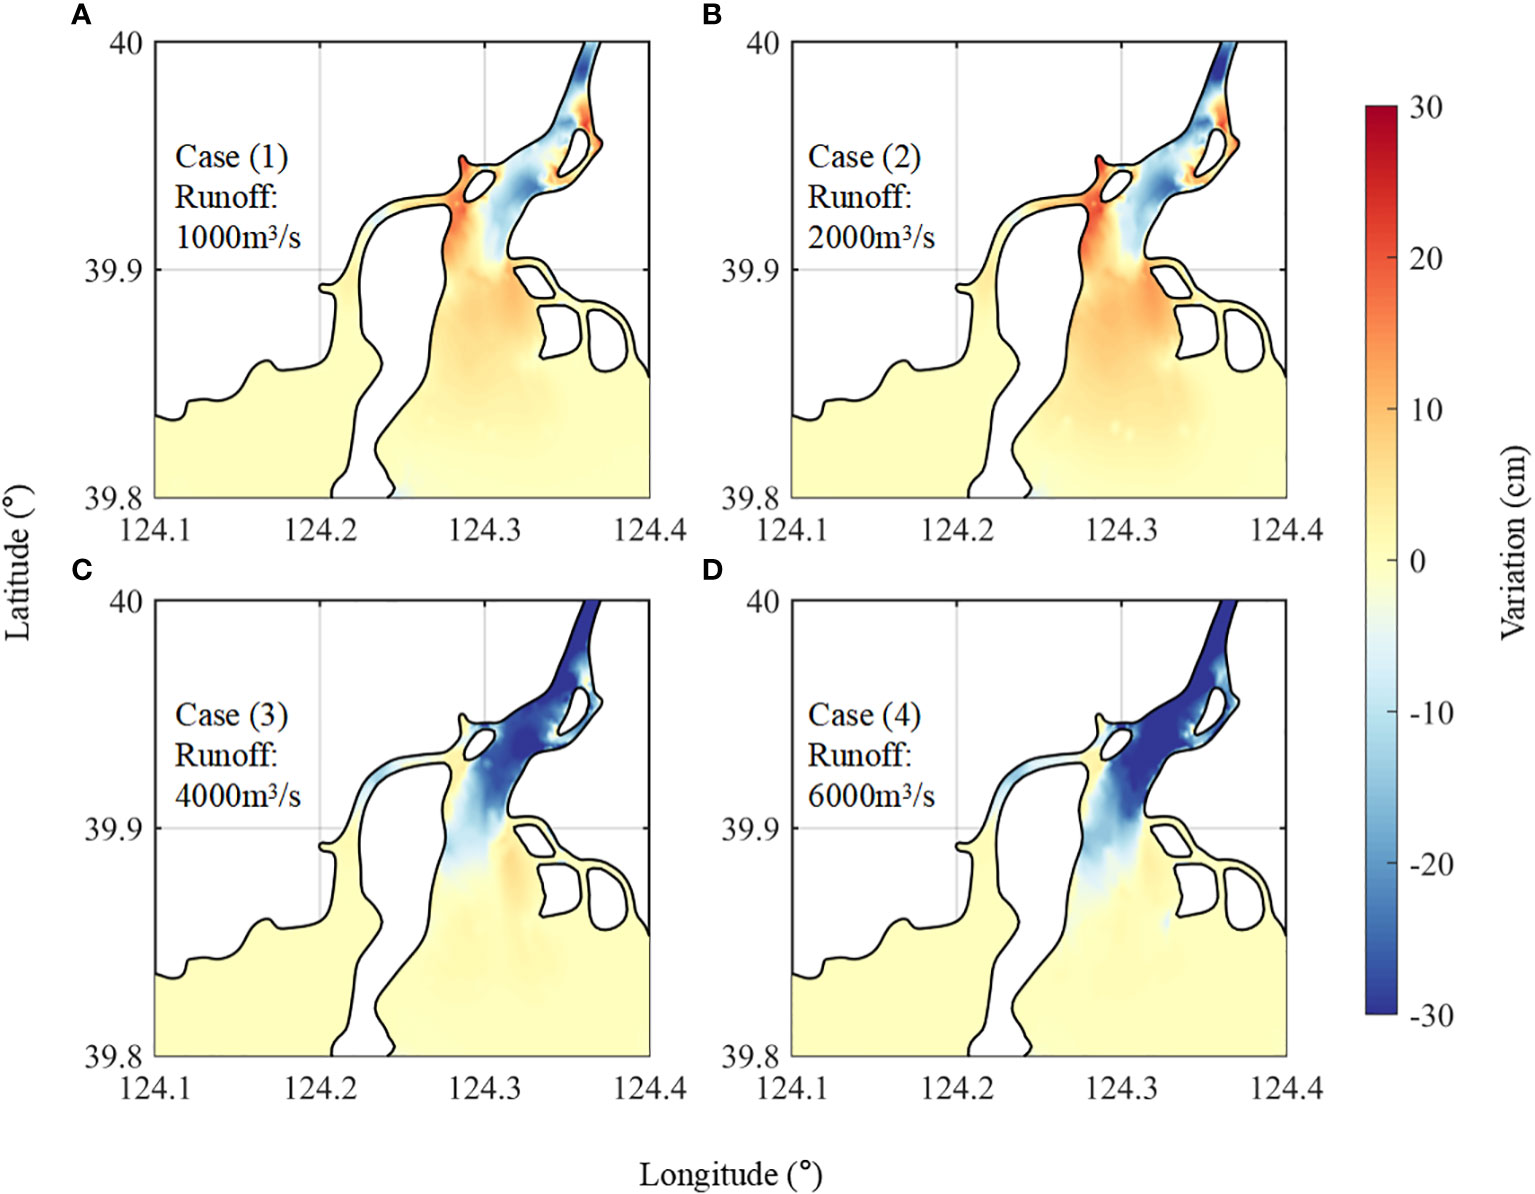
Figure 7 Modeled bed thickness variation: (A) dry year (1,000 m3/s), (B) normal year (2,000 m3/s), (C) wet year (4,000 m3/s), and (D) flooding events (6,000 m3/s).
In general, the bed thickness in the YRE exhibits an erosion pattern during wet years and siltation in dry years. The runoff threshold for this change from siltation to erosion is approximately 4,000 m3/s. After reaching the threshold, the runoff dominates the bottom sediment distribution in the YRE, indicating a delicate balance in the estuarine morphology, which can be easily damaged by flooding events.
4.3. Mechanisms of the estuarine morphological change during wet seasons
The maximum flow velocities in the YRE occur between 39.95°N and 40°N under different runoff conditions. This is mainly due to the rapid convergence of the estuary width at this location, which leads to tidal wave breaking and stronger instability, increasing the local tidal energy and current velocity. The increasing runoff enhances ebb currents, while there is a significant decrease in flood currents during wet years. The ebb tide velocity is on average 1 m/s greater than the flood tide (Figure 8A); however, the degree of this discrepancy is greatly influenced by the runoff condition (Figure 8B).
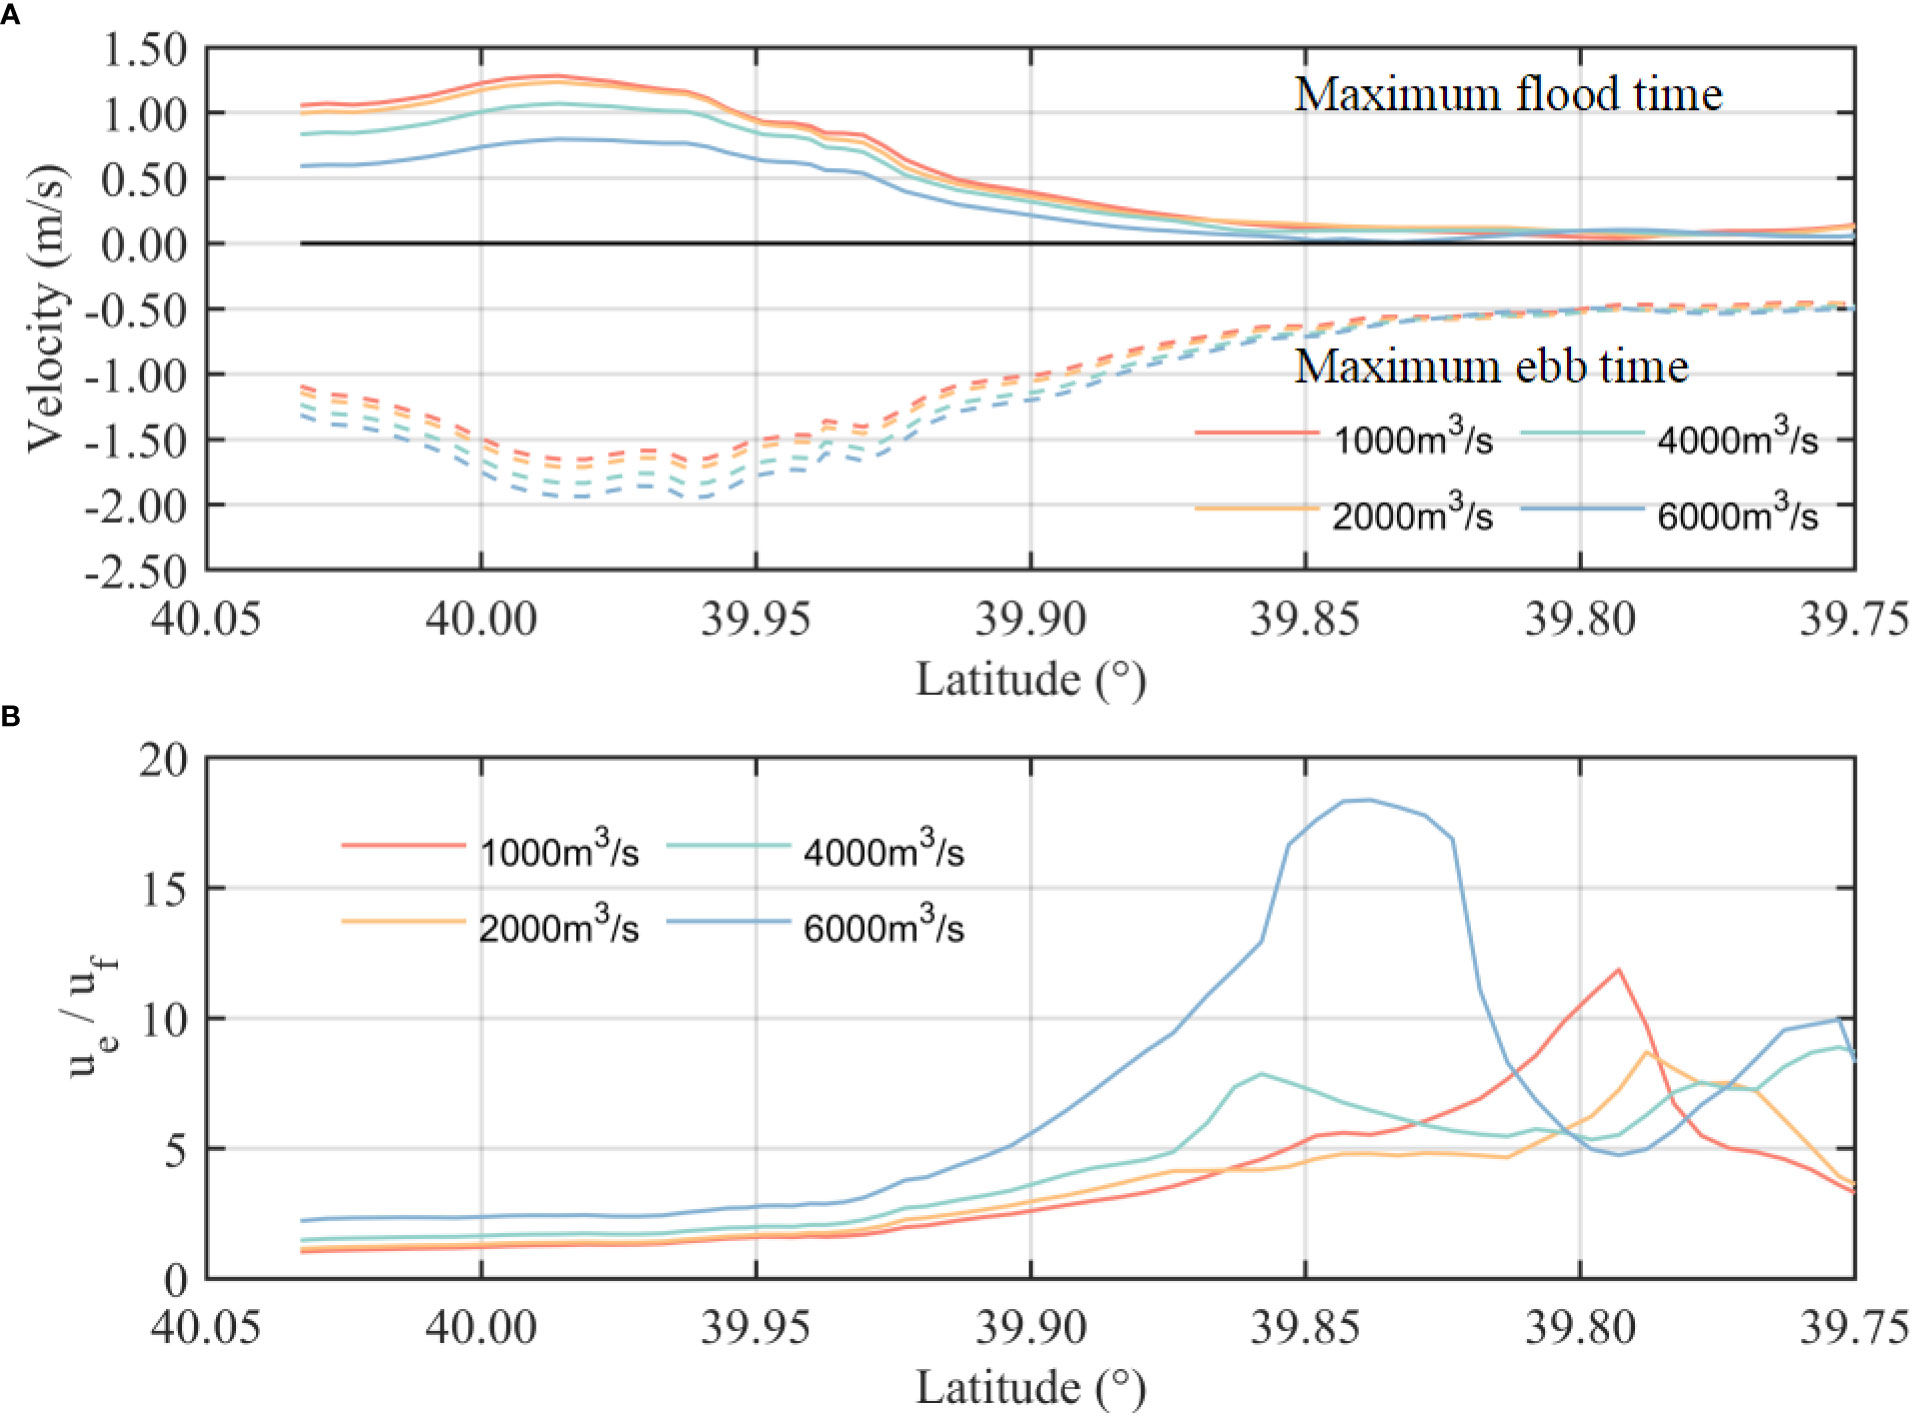
Figure 8 (A) Maximum flood and ebb velocities in cases 1 to 4. (B) Ratios of the maximum flood and ebb velocity in cases 1 to 4.
The bottom shear stress along the main stream section shows the same pattern as the current velocity, with the maximum shear stress located between 39.95°N and 40°N (Figure 9A). However, a stronger ebb current velocity induces a larger bottom shear stress, and the maximum ratio of the ebb/flood shear stress occurs from 38.85°N to 39.90°N (Figure 9B). The river-induced uneven pattern in bottom stress ranges south to 39.8°N, generally corresponding to the location of the entrance sand bar. As the runoff increases, the ratio gradually increases, indicating that the bottom shear stress at ebb is greater than that at flood. This could result in larger amounts of sediments moving southerly from land to sea, while such a transport pattern would be hindered at 39.8°N. This seaward asymmetry becomes significantly stronger during larger runoff (blue line in Figure 9B). This indicates that the shape of the entrance sand bar cannot be maintained during wet years or flood events. The decreased ebb/flood bottom stress ratio after 39.8°N is caused by the sudden decrease in the ebb bottom stress, as the area is out of the range of the river runoff influence. This range can expand south to the sea when the river runoff increases.
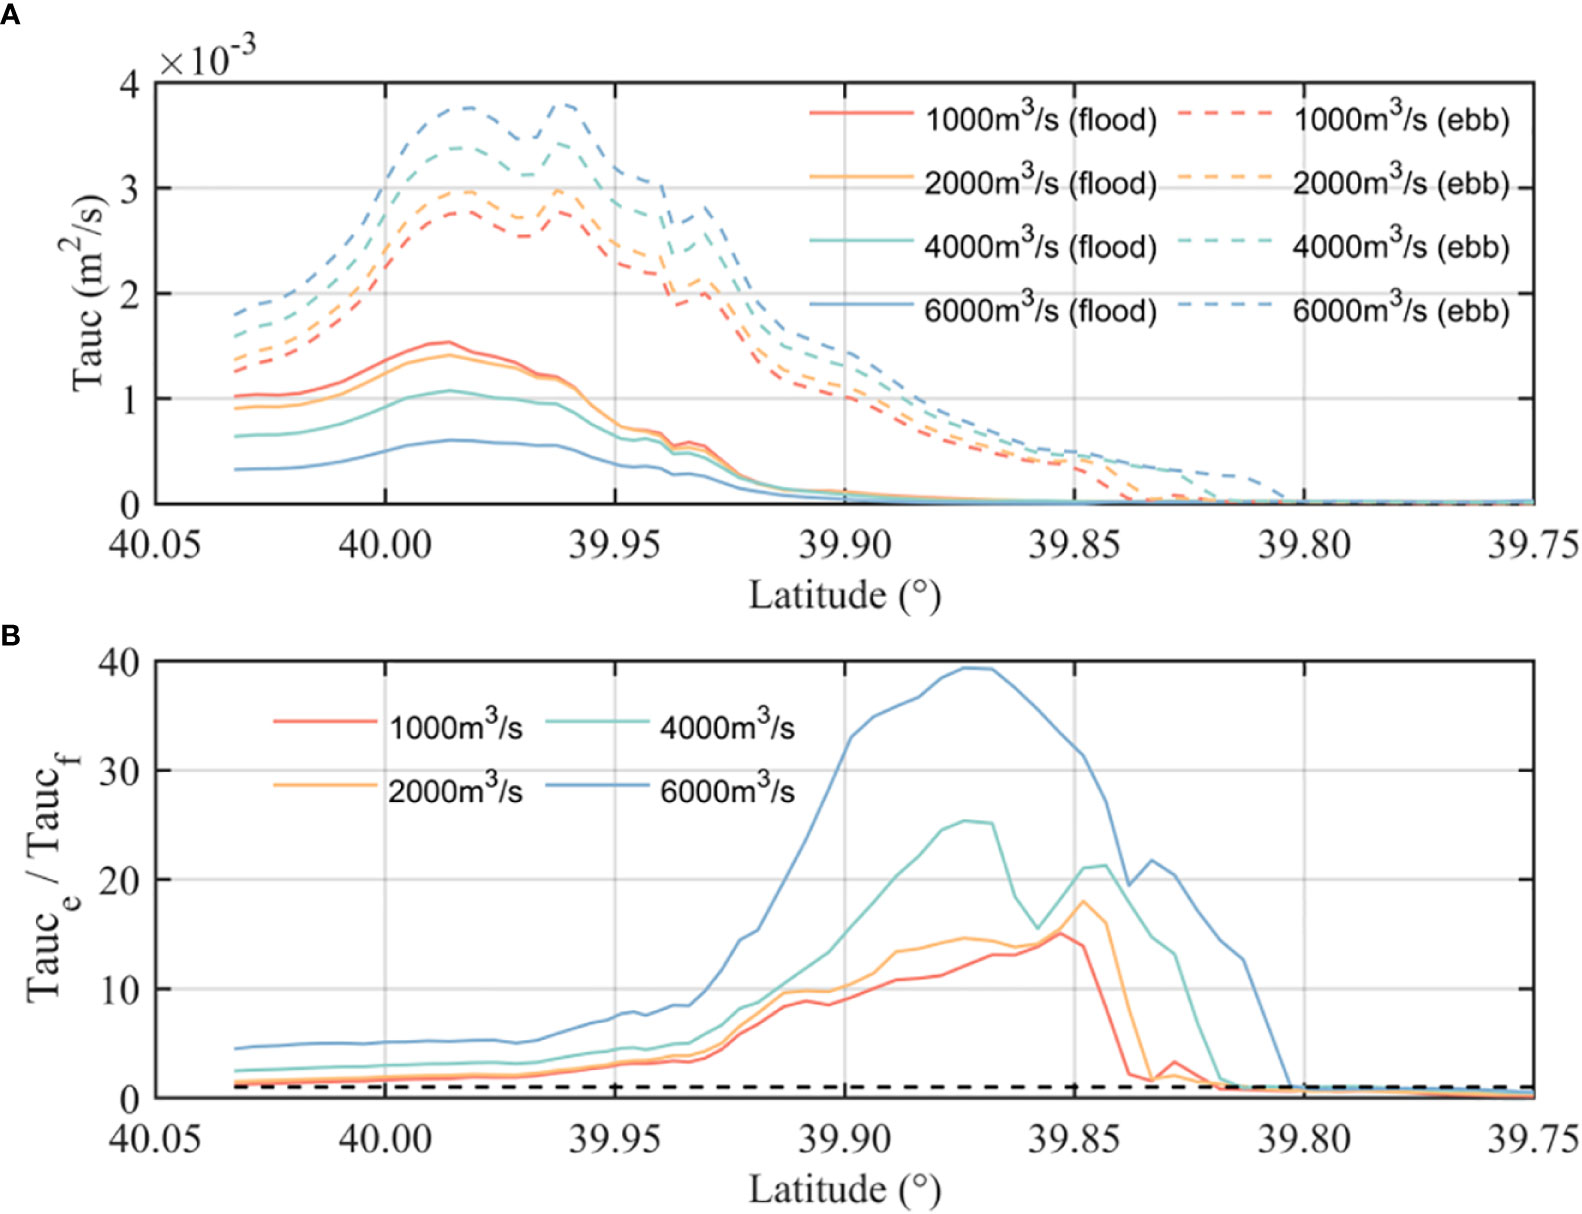
Figure 9 (A) Maximum shear stress at flood (solid lines) and at ebb (dash lines) in cases 1 to 4. (B) Ratio of the maximum shear stress at flood and ebb.
In summary, during wet years and flood events, larger runoff causes stronger erosion in the inner estuary, while landward flow in the outer estuary is weakened, resulting in intensive erosion in the estuary. 4.4 Baroclinic effects on estuarine sedimentation during flooding events
4.4. Baroclinic effects on estuarine sedimentation during flooding events
The model results show that the maximum extent of saltwater intrusion into the YRE is located at approximately 39.9°N during dry and normal years. As runoff increases, the salinity front continues to move seaward (Figures 10A–D). It is noteworthy that vertical stratification becomes significantly stronger when the runoff reaches 6,000 m3/s. This change in vertical structure does not change the location of ETM in the main stream. It is caused by the unique geometry of the YRE; large amounts of sediments are accumulated at the river–estuary junction around Douliupu, providing an almost infinite supply for resuspension here. As a result, vertical stratification has a limited effect on the location of this high SSC patch, but it greatly reduces the magnitude of its peak value (Figures 10E, F). With larger runoff, the sediments accumulate slightly further south–center, while resuspension is hindered (Figures 10G, H). The time series of the Richardson number in the vertical water column at the center of the estuary at 39.7°N shows that the estuary forms a strong mixing at flood tide and stratification at ebb tide. Vertical mixing is more intense during spring tide than during neap tide (Figure 11). With the increase of runoff, this stronger mixing during neap tide significantly weakens. Overall, baroclinic effects in the YRE are not dominant factors during dry and normal years; however, they have a significantly larger impact on vertical mixing during flooding events. Previous studies have shown that the YRE is mostly well-mixed due to its shallow water depth and strong currents. These results indicate that the YRE is not always well-mixed, and that vertical circulation needs to be considered in estuarine morphology research.
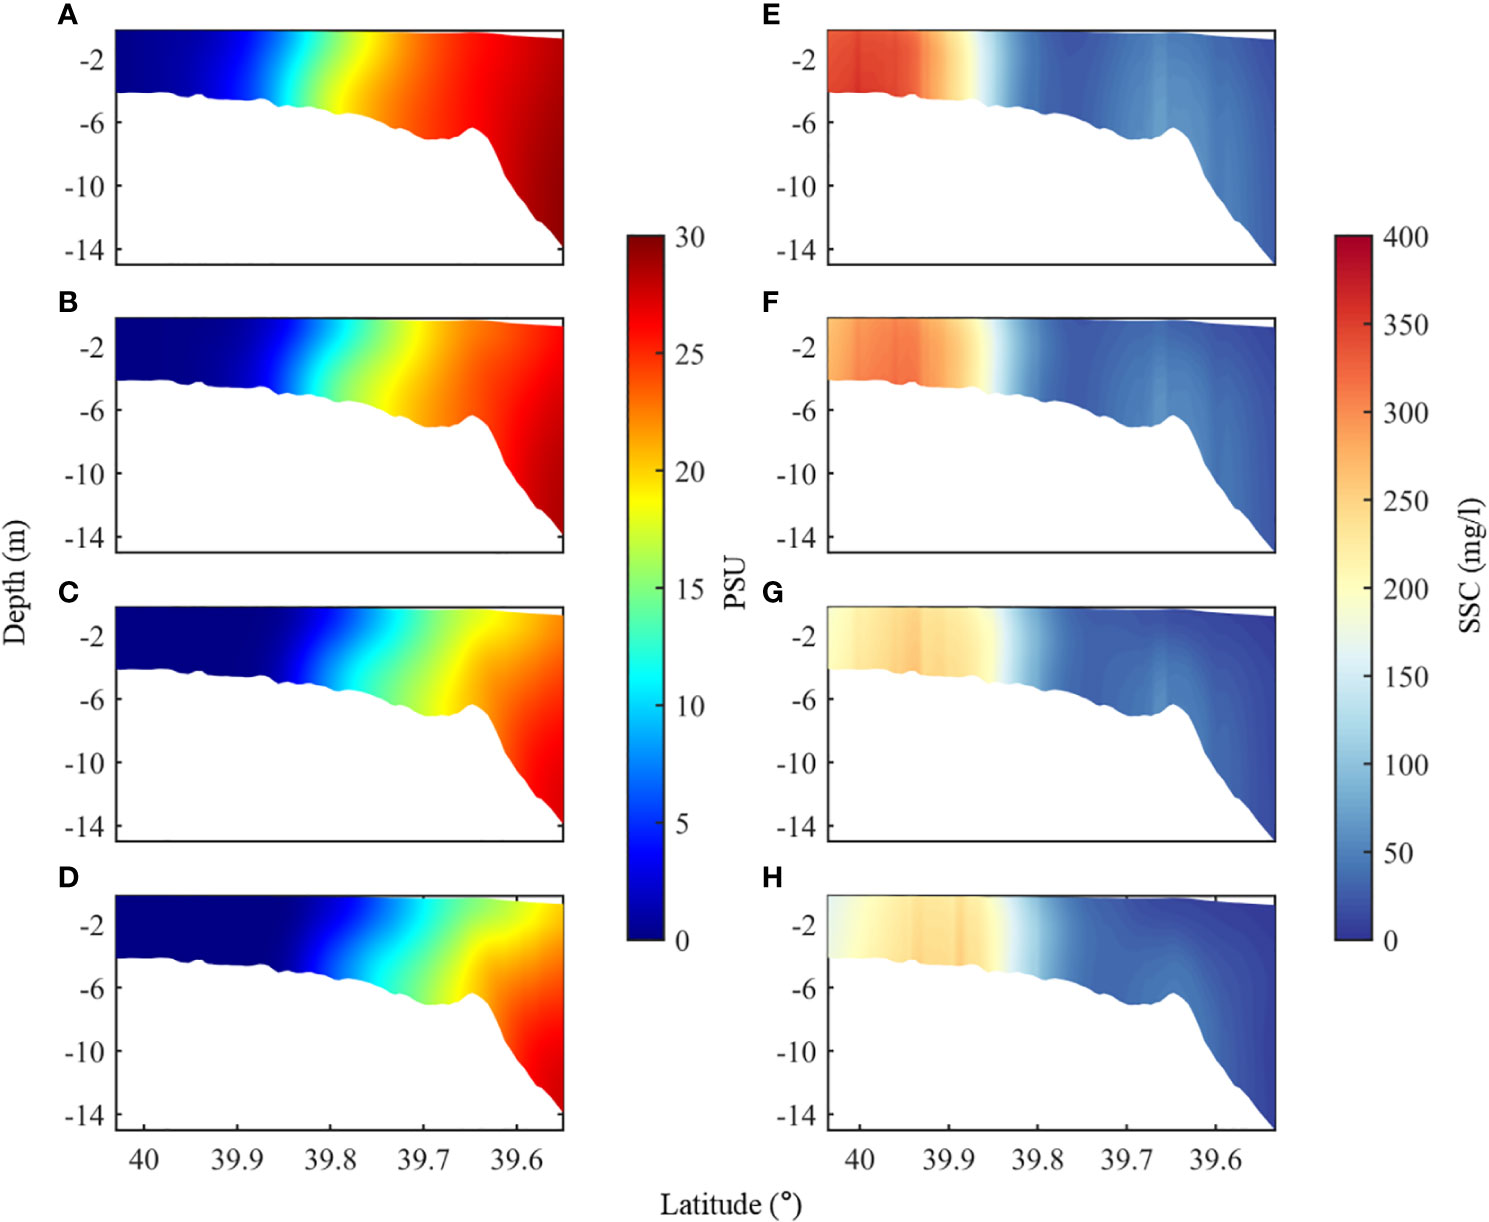
Figure 10 Profiles of the modeled salinity and suspended sediment concentration: (A, E) 1,000 m3/s, (B, F) 2,000 m3/s, (C, G) 4,000 m3/s, and (D, H) 6,000 m3/s.
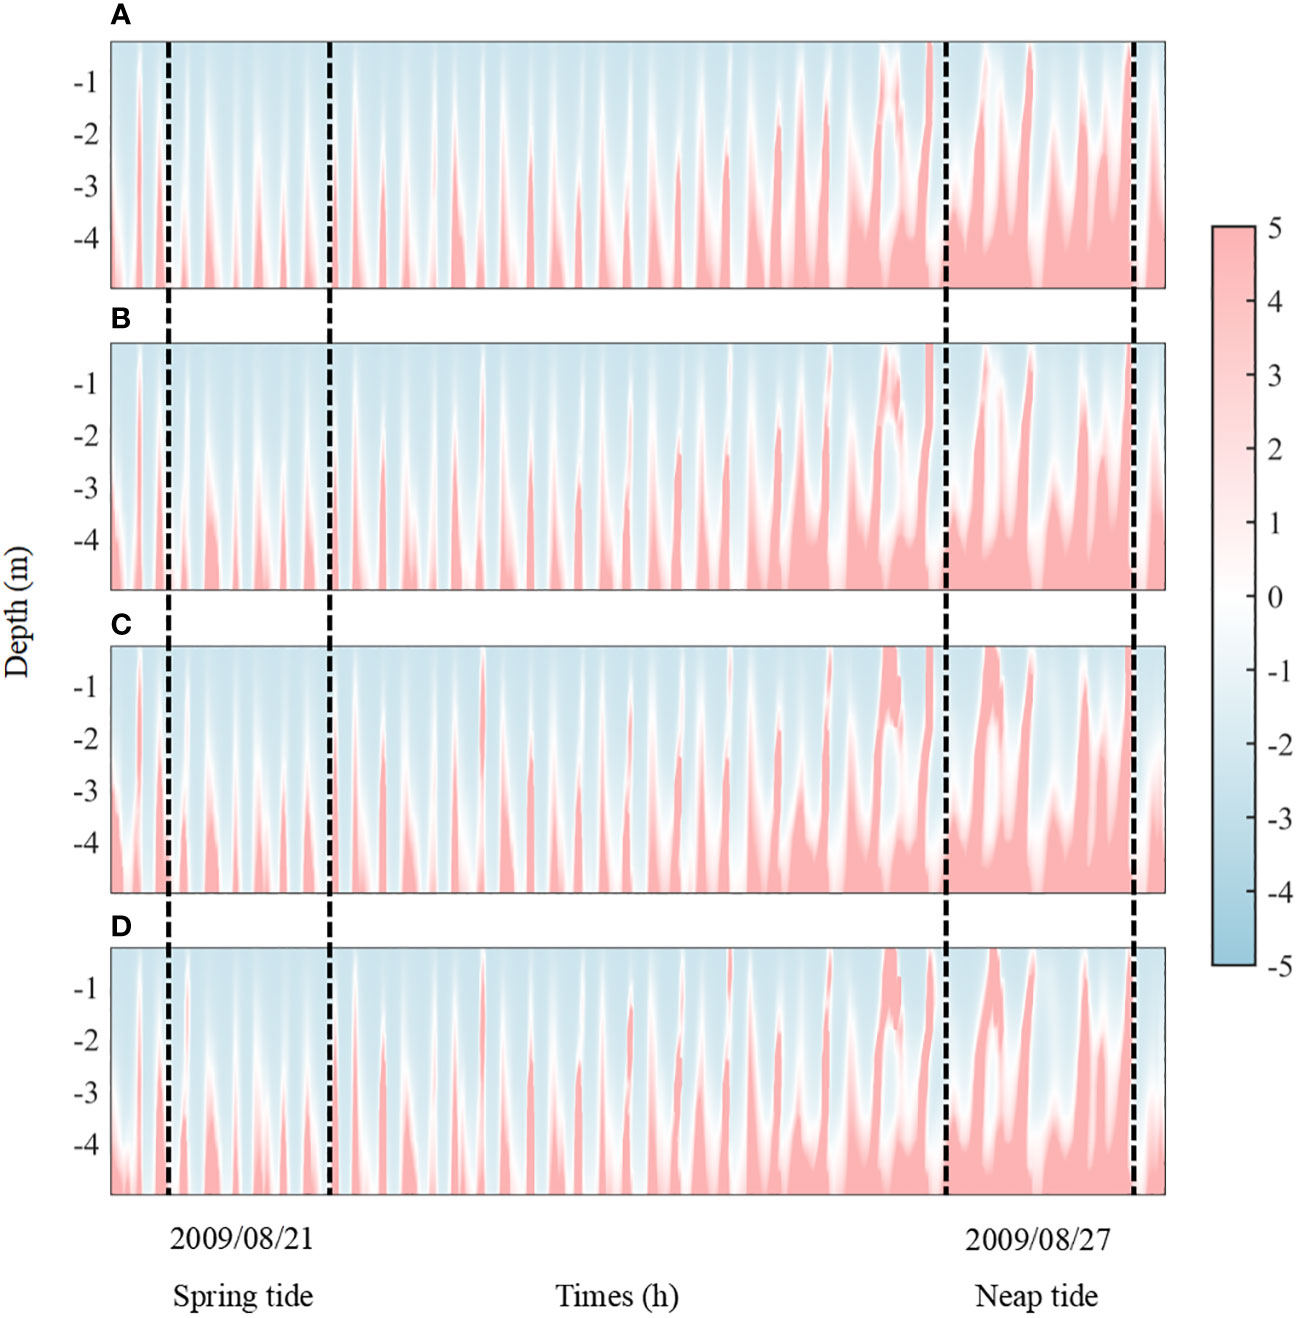
Figure 11 Timeseries of vertical Richardson number (after normalization) in the center of the main stream (located at the blue dot in Figure 1C): (A) 1,000 m3/s, (B) 2,000 m3/s, (C) 4,000 m3/s, and (D) 6,000 m3/s. Positive Ri indicates stratification, while negative Ri indicates mixing.
4.5. Changes in tidal asymmetry and Eulerian residual flow
The tidal skewness at the center of the ETM under different runoff conditions is shown in Figure 12. There is a slight decrease in the amplitude of the M2 and M4 components with increasing runoff. The tidal skewness remains positive, indicating that the tidal asymmetry is still flood dominant.
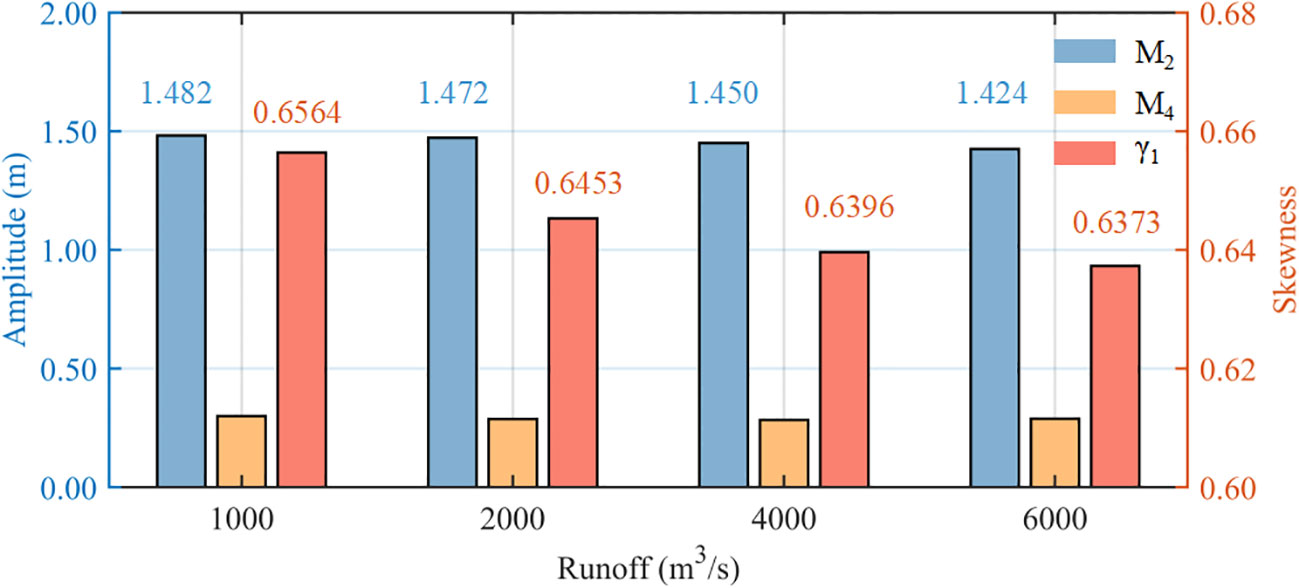
Figure 12 M2 and M4 tidal amplitude and tidal skewness under different runoff conditions.
However, the degree of this flood dominance decreased. Here, flood dominance does not necessarily mean that the net sediment transport is landward, as other factors also contribute to the net sediment transport, such as Stokes drift, Lagrange asymmetry, and Eulerian asymmetry (Brown and Davies, 2010). Stokes drift exists under traveling tidal wave conditions when there is a phase advance/lag between amplitude and current flow. Stokes drift may produce a net seaward sediment flux with a limited magnitude (Stokes, 1847). The Lagrange and Eulerian asymmetries in estuaries can generate a larger net transport flux than Stokes drift. Lagrange asymmetry controls the transport of finer sediments by influencing the settling time and the resuspension process (Friedrichs, 2012), while Eulerian asymmetry controls the variation in bottom shear stress by influencing the current speed at flood and ebb times (Dronkers, 1986; Friedrichs and Aubrey, 1988; Van Maren and Winterwerp, 2013).
To further analyze the impact of runoff on these factors, the Eulerian residual flow from model results is decomposed using Eq. 9. It is decomposed into ENT, EIA, and TIA, as described in “Section 3.4.3” (Figure 13). As total sediment transport is proportional to residual flow, it can be better understood by decomposing the residual flow (Van de Kreeke and Robaczewska, 1993; Dronkers, 2005; Guo et al., 2014). The results show that the ENT has a small effect on sediment transport; it only changes the transport during wet years (4,000 m3/s) and flood events (6,000 m3/s). However, the EIA, which is caused by the interaction between the Eulerian residual flow and tides, appears to have a more significant impact on sediment transport. The EIA term is markedly larger than the TIA term during all experiments. The increase in river flow mainly leads to a gradual increase in the ENT and EIA. When runoff reaches a certain level, the total value of ENT and EIA will exceed TIA. This means that the direction of net sediment transport may shift from landward to seaward during flooding events. This explains why the tidal skewness of the Yalu River estuary is positive (flood dominant), but the net sediment transport is mostly seaward during wet seasons (Figure 13).
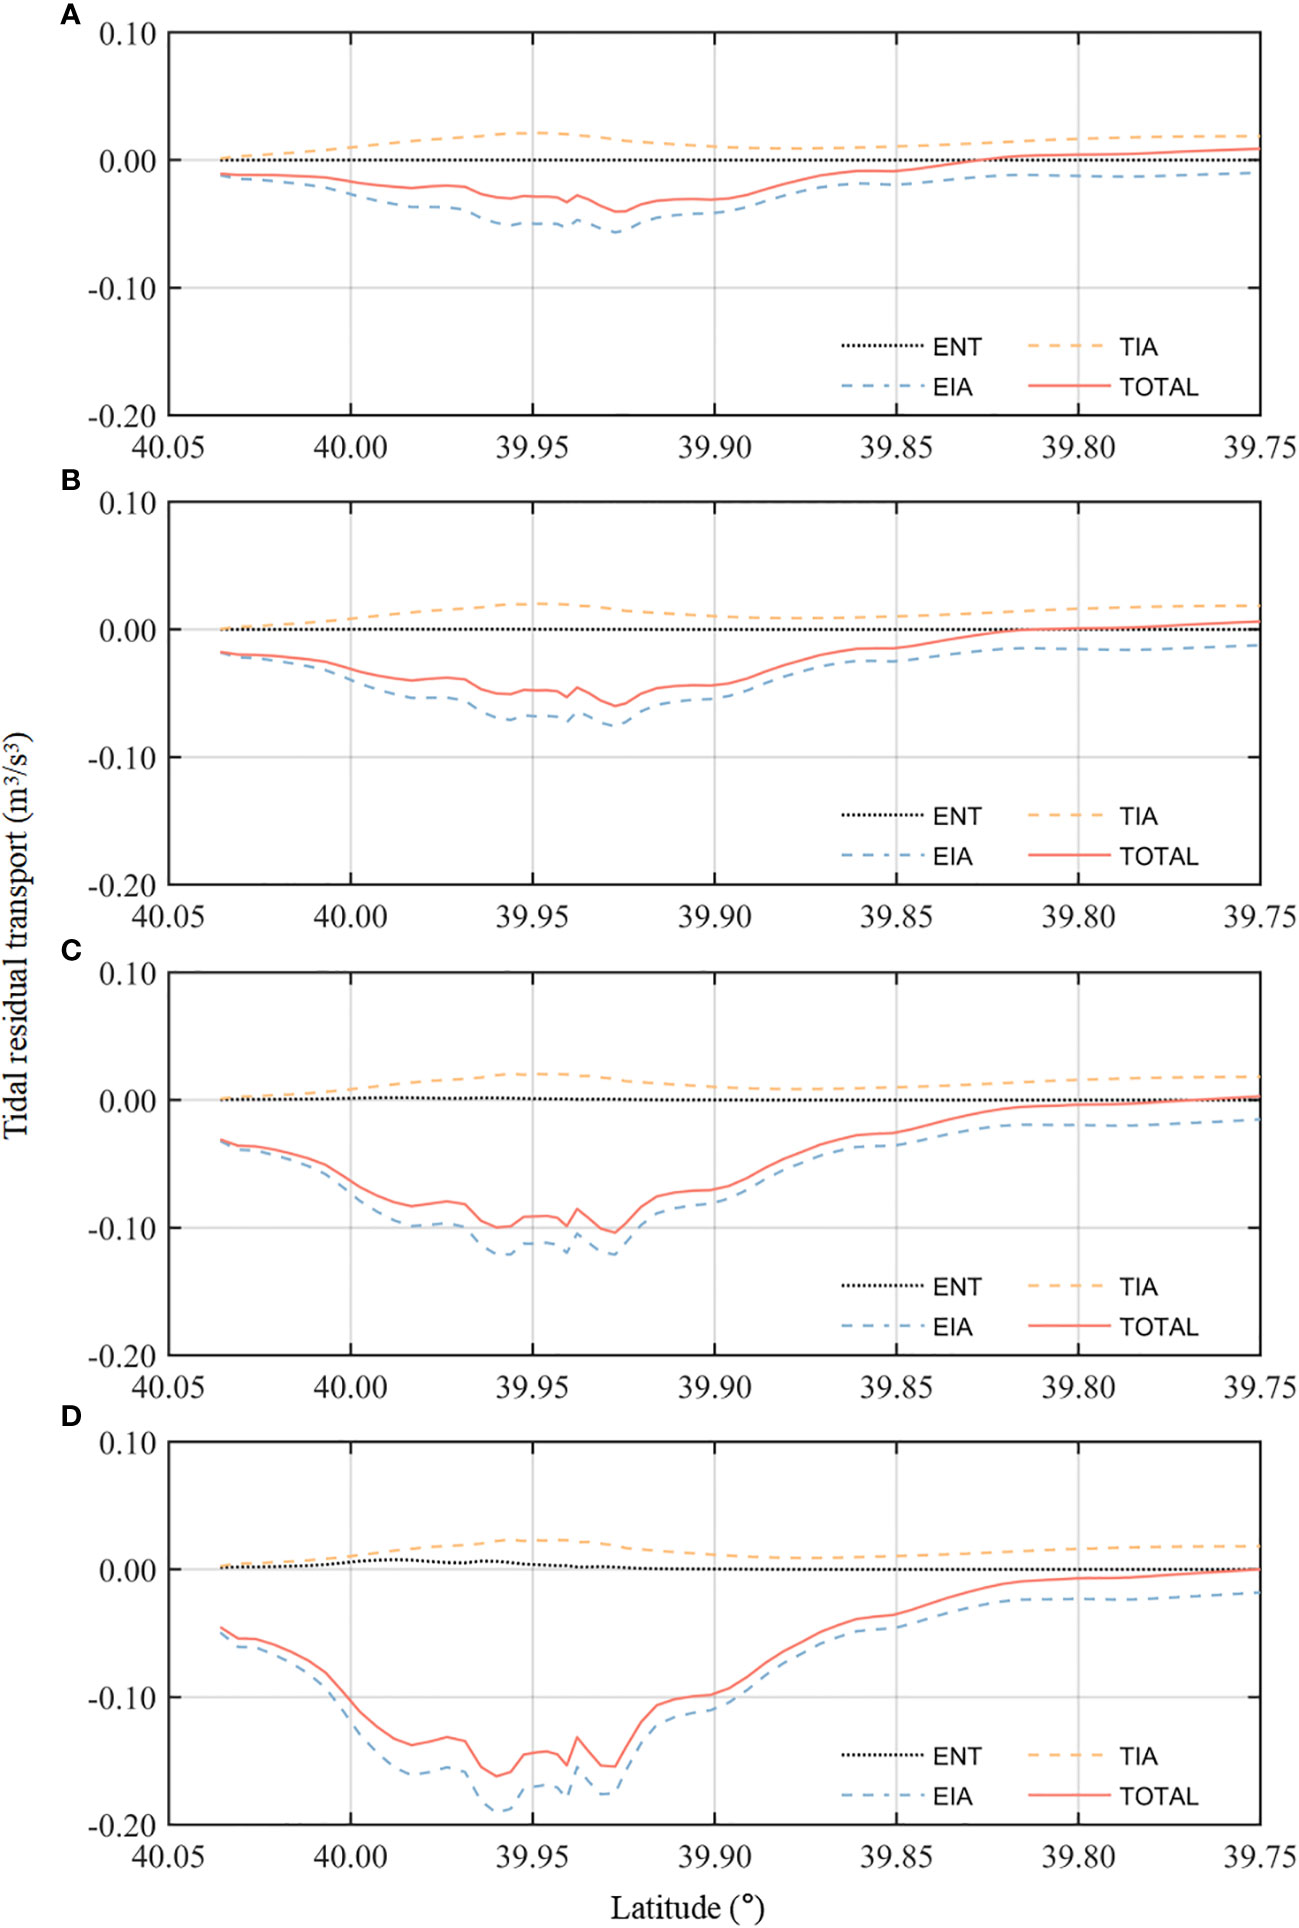
Figure 13 Tidal residual transport decomposition along the main stream section: (A) 1,000 m3/s, (B) 2,000 m3/s, (C) 4,000 m3/s, and (D) 6,000 m3/s.
As runoff continues to increase, the seaward transport peak becomes increasingly stronger. Furthermore, the total transport direction completely shifts at 39.83°N, and this turning point corresponds with the sand bar location as discussed above and shown in Figure 6. This turning point is located in the upper portion of the estuary during dry and normal years and is then pushed to approximately 39.8°N during flooding events, with the sand bar moving seaward and a significantly reduced thickness.
In conclusion, the impact of the EIA term becomes increasingly dominant with the increase of runoff. This can explain the stronger erosion pattern during wet years as described in “Section 4.2” since a larger EIA contributes to a stronger net seaward sediment transport.
4.6. Morphological change under an extreme flooding event
The fixed runoff used in the model can provide a theoretical basis for investigating the mechanism behind the estuarine morphological change, but this is not representative enough for understanding the conditions during extreme flooding events. Therefore, we simulated the impact of an extreme flooding event on estuarine morphology using real runoff data for the Yalu River recorded at the two hydrological stations in 2010 (Figure 2B). Flooding events often exhibit distinct flood peaks; therefore, we studied the results at four moments: the initial morphological pattern (07/01), before the flood event (08/01), after the flood event (09/15), and 15 days after the flood event (09/30) (Figure 14) and systematically analyzed the impact of the flood process on the estuarine morphological change.
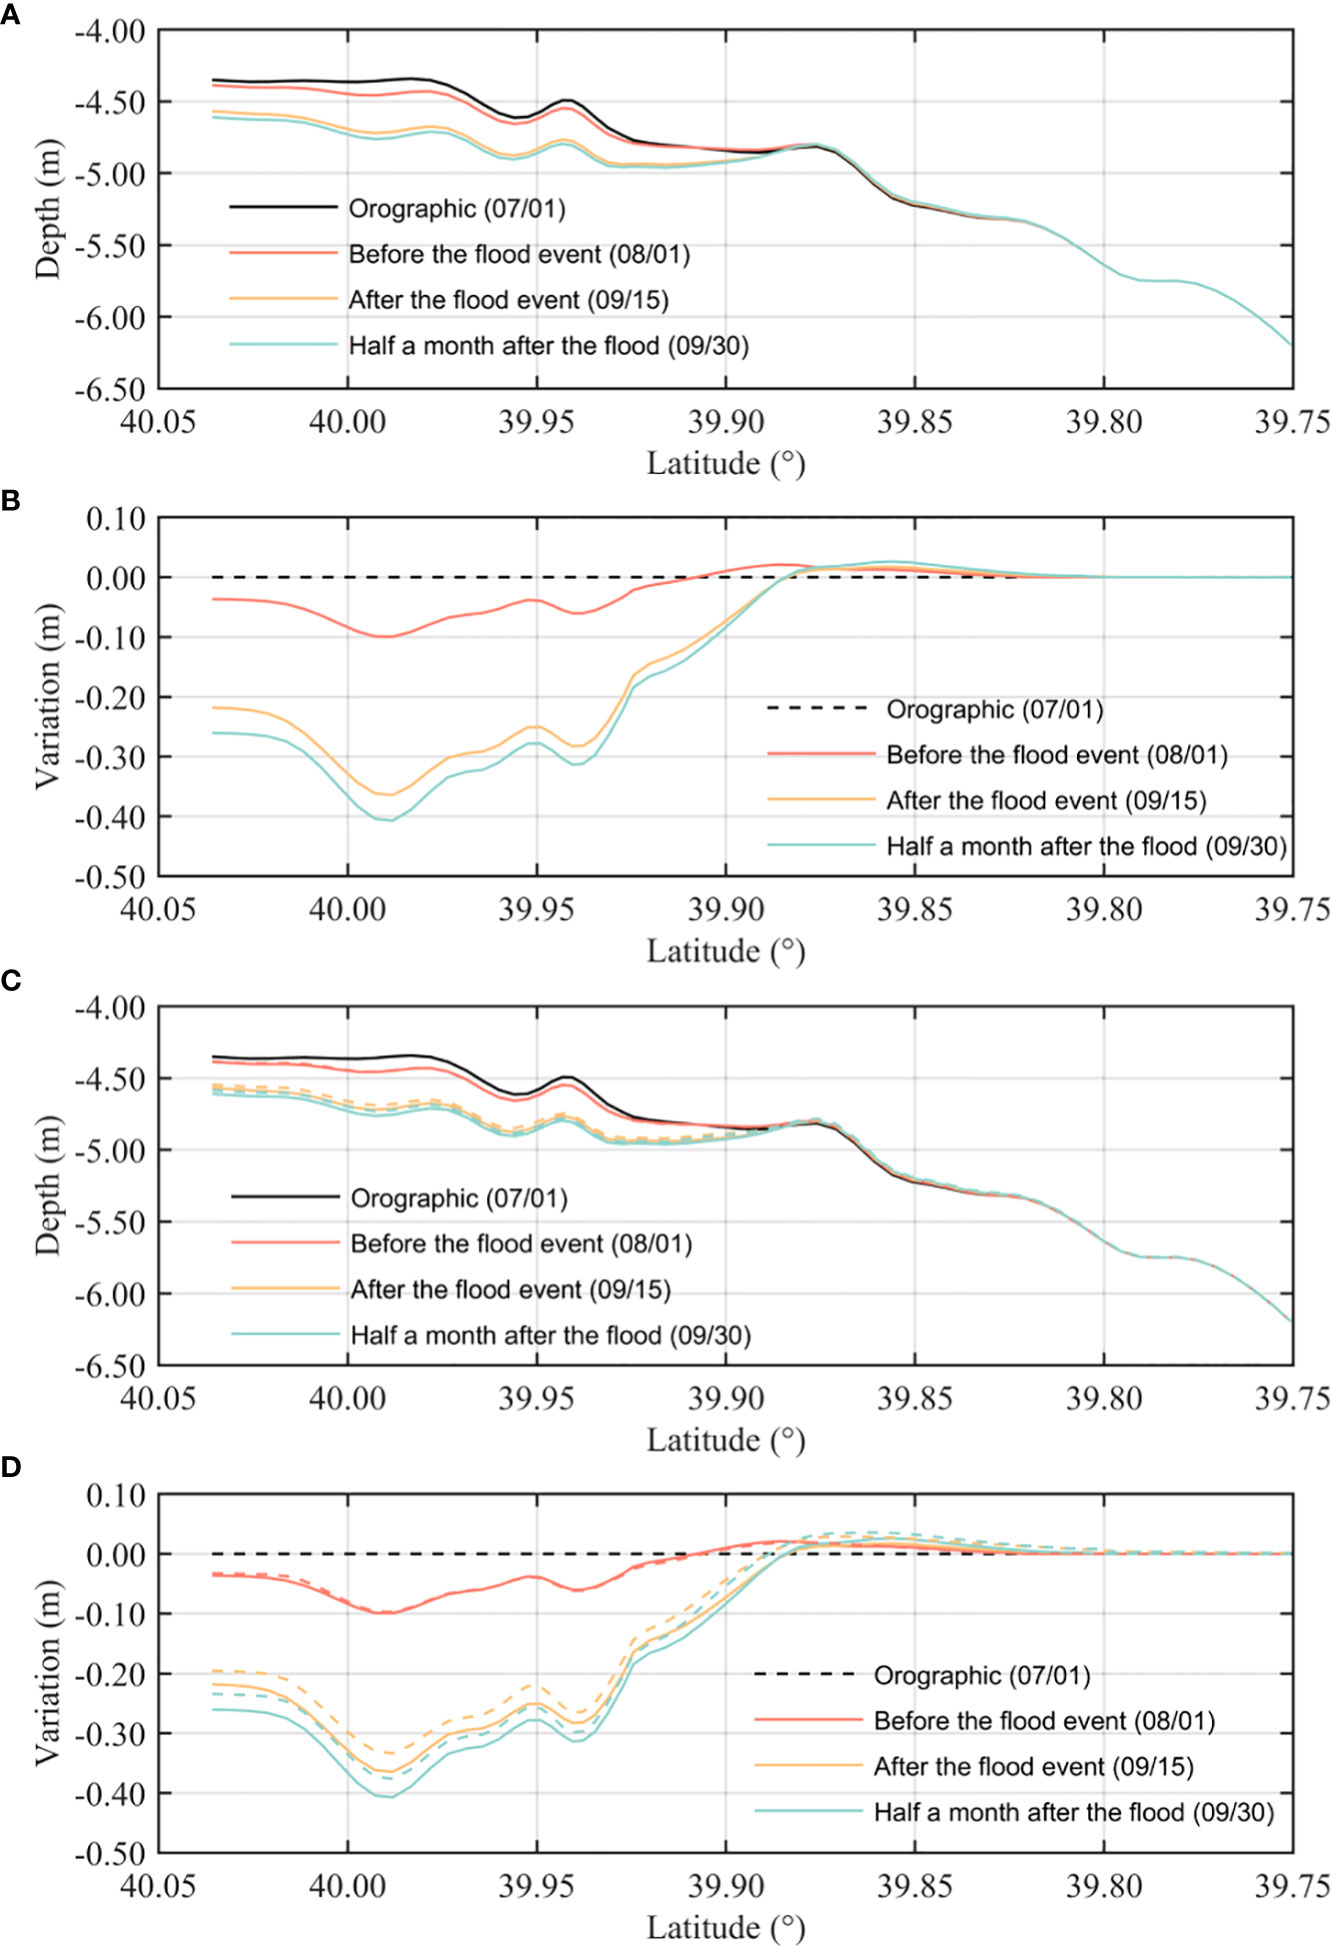
Figure 14 Changes in bottom bed thickness during the extreme flooding event: (A, C) total bottom topography before and after the flooding and (B, D) changes in bottom bed thickness. The solid lines are the results obtained using a fixed sediment load (10 kg/s), while the dashed lines are the results obtained under a real sediment load.
During the period before the flood event (07/01 to 08/01), the average runoff of the Yalu River basin is 1,070 m3/s. A sand bar is formed between 39.85°N and 39.9°N (Figure 14A). During the flood event period (08/01–09/15), the average runoff in the Yalu River basin is 6,028 m3/s. This sand bar is strongly scoured during flood events; large amounts of sediments are washed further south and settle between 39.8°N and 39.9°N. At 15 days after the flood event (09/30), the average runoff in the Yalu River basin during this period decreases to 2,124 m3/s. The sediments previously deposited in the south gradually move back to an upper location, forming a new sand bar with time. In addition, the strong flush caused by the extreme flooding increase the depth of the main stream channel from 39.9°N to 40°N, which is another dramatic change in estuarine morphology after the flooding. When the runoff returns back to normal levels during normal years, the bottom shear stress decreases, leading to a change in the sediment transport pattern. The newly formed sand bar has a different shape than before the flood event. This indicates that the estuarine morphology can be considerably changed after only one extreme flooding event (Figures 14A, B).
The results of bed thickness change under real runoff and sediment load, i.e., case 6, are shown in Figures 14C, D and Figure 15. A comparison is made between cases 6 and 5 (identical to case 6 but with a fixed sediment load). For the distribution of bed thickness change under real conditions (Figures 15D–F), before the flooding, the runoff rate is approximately the average rate during dry years with limited sediments. Therefore, this does not significantly influence bed thickness. During the flooding event, the substantially higher runoff enhances erosion in the main stream. Despite the fact that the sediment load is also large, it does not change the erosion pattern in the main stream; however, more sediments are deposited in the southeast area of the estuary. This pattern of morphological change remains almost the same 15 days after the flooding.
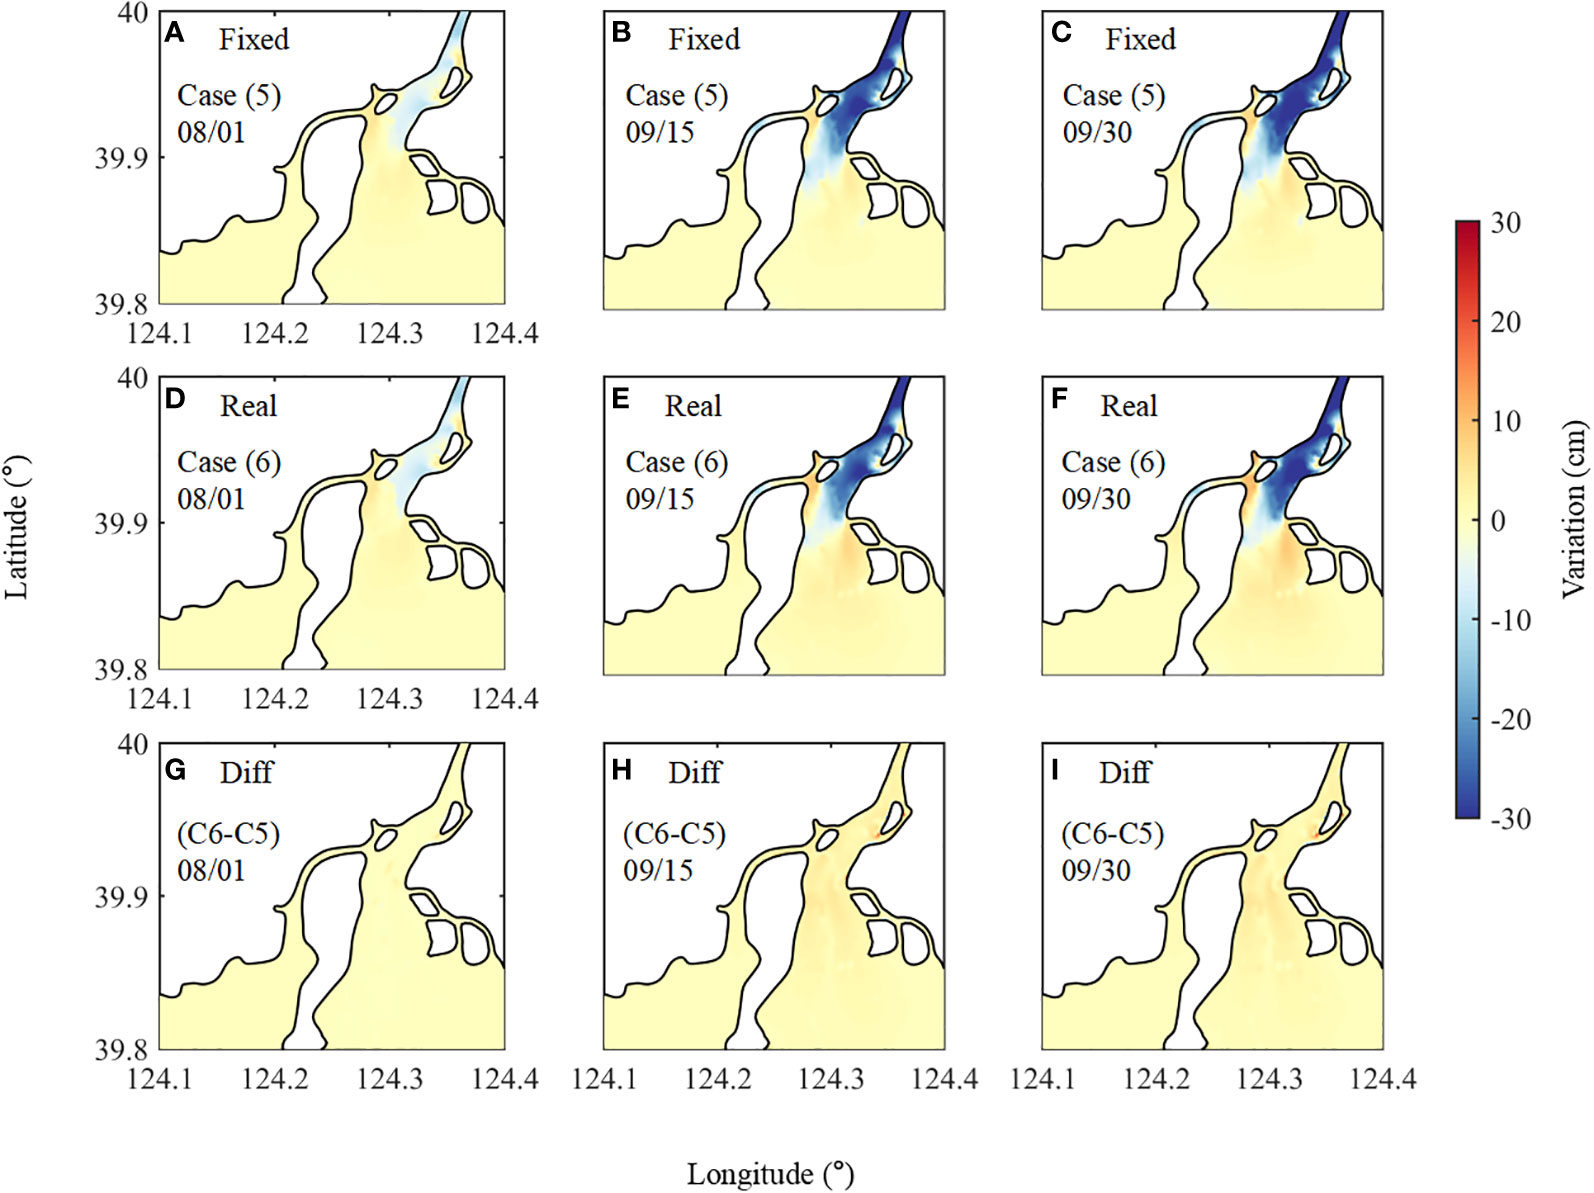
Figure 15 Horizontal distribution of estuarine bed thickness change after the extreme flooding event: (A–C) under a fixed sediment load (10 kg/s), (D–F) under a real sediment load, and the (G–I) difference between the above rows. The left column shows the results on 1 August 2009 (before the flooding), the middle column the results on 15 September 2009 (after the flooding), and the right column the results on 30 September 2009 (15 days after the flooding).
Comparing the pattern with a fixed sediment load (Figures 15A–C), the bed thickness does not drastically change under real sediment load conditions. Sediment supply from the river has always been a key factor controlling estuarine morphology; however, it does not appear to have an obvious impact in the YRE. The reason for this is that the Yalu River is generally a clear river, containing limited amounts of sediments. Thus, the fluvial sediment supply does not considerably alter the morphology pattern here, but the impact of runoff volume is significant (Figures 15G–I).
In summary, the results show that, prior to the flood event, most of the sediments in the YRE were silted at the south area close to Xia Island (Figures 15D–F). This could block the water channel between the West and Middle Rivers, decreasing water exchange between them. Such a process will, in turn, enhance siltation in the West River and further weaken its dynamics. This pattern did not change after extreme flooding, indicating that the West River may always experience siltation even upon flushing by a significantly large runoff. Thus, natural conditions cannot change its siltation; human activities, including dredging, should be carried out to maintain the water depth in the West River. Otherwise, it may eventually become a tidal creek.
5. Conclusion
Taking the YRE as an example, this study investigates the mechanism of morphological changes in a macro-tidal estuary during extreme flooding events. A 3D hydro-sediment baroclinic coastal model was established for the study area using FVCOM, and adequate measurements from field surveys and hydrological stations were analyzed to interpret the sedimentation process in a typical mountain stream estuary. This study provides a systematic analysis of the impacts of hydrodynamic conditions, vertical circulation, and tidal asymmetry on the sedimentation process in such estuaries.
The model results show that the sediment bed thickness in the YRE is very sensitive to changes in river discharge. An entrance sand bar is formed during dry and normal years, while it moves seaward, with a larger thickness, during wet years. During flooding events in wet years, the greatly enhanced velocity in the main estuarine channel will flush the bottom sediments to the south, which in turn ease severe siltation in the west channel near Chouduan Island. The runoff threshold required to shift this siltation into erosion is approximately 4,000 m3/s. For normal and dry years with lower runoff, the sediments mainly silt in the area between Xia Island and the West River, threatening water exchange through the West River, which may eventually completely block the channel between the West River and the Middle River. Changes in hydrodynamics caused by river discharge change can be described by four aspects: (1) current velocity increases for both flood and ebb during wet seasons, with the ebb tide enhanced more; (2) increased river discharge substantially enhances the seaward residual flow; (3) the large amount of freshwater pushes the estuarine salinity front further south, and (4) larger runoff causes stronger mixing in the estuary at flood tide and stronger stratification at ebb tide. Three main factors control the estuarine morphological change in the YRE: (1) stronger resuspension of the bottom sediments caused by larger shear stress during flooding events; (2) the interaction between runoff and tides contributes to Euler residual flow, which then has a greater impact on the net sediment transport than the tidal pumping effect (dominant when river discharge is limited), resulting in different sediment transport patterns; and (3) baroclinic effects in the YRE only affect a limited region during normal years, but have a stronger impact during flooding events, resulting in a larger sediment deposition in the southern part of the estuary.
As the YRE is a typical mountain stream macro-tidal estuary, with shallow water depths, the results of this study can be applied to other similar estuaries. Although this type of area is usually considered to be well mixed vertically, this study indicates that the vertical circulation structure must be considered for morphology studies in a macro-tidal estuary, especially during flooding events.
Data availability statement
The original contributions presented in the study are included in the article/supplementary material. Further inquiries can be directed to the corresponding author.
Author contributions
YD: conceptualization, resources, and writing—original draft. ZC: conceptualization, project administration, writing—review and editing. ZY: validation, project administration. All authors contributed to the article and approved the submitted version.
Funding
This study was funded by the National Key Research and Development Program of China (no. 2021YFB2601100) and the National Natural Science Foundation of China (nos. 52201309, 42276170, and 42106158).
Acknowledgments
We acknowledge the support from Nanjing University and Eastern Liaoning College for the great help in hydrodynamics field observation and we thank the hydrological stations in the Yalu River basin for providing measurements of river discharge.
Conflict of interest
The authors declare that the research was conducted in the absence of any commercial or financial relationships that could be construed as a potential conflict of interest.
Publisher’s note
All claims expressed in this article are solely those of the authors and do not necessarily represent those of their affiliated organizations, or those of the publisher, the editors and the reviewers. Any product that may be evaluated in this article, or claim that may be made by its manufacturer, is not guaranteed or endorsed by the publisher.
References
Andutta F. P., Patterson R. G., Wang X. H. (2019). Monsoon driven waves superpose the effect from macro-tidal currents on sediment resuspension and distribution. Estuarine Coast. Shelf Sci. 223, 85–93. doi: 10.1016/j.ecss.2019.04.036
Barbier E. B., Hacker S. D., Kennedy C., Koch E. W., Stier A. C., Silliman B. R. (2011). The value of estuarine and coastal ecosystem services. Ecol. Monogr. 81 (2), 169–193. doi: 10.1890/10-1510.1
Becherer J., Flöser G., Umlauf L., Burchard H. (2016). Estuarine circulation versus tidal pumping: Sediment transport in a well-mixed tidal inlet. J. Geophys. Res.: Oceans 121 (8), 6251–6270. doi: 10.1002/2016jc011640
Bolle A., Bing Wang Z., Amos C., De Ronde J. (2010). The influence of changes in tidal asymmetry on residual sediment transport in the Western scheldt. Continental Shelf Res. 30 (8), 871–882. doi: 10.1016/j.csr.2010.03.001
Bracken L. J., Turnbull L., Wainwright J., Bogaart P. (2015). Sediment connectivity: A framework for understanding sediment transfer at multiple scales. Earth Surface Processes Landforms 40 (2), 177–188. doi: 10.1002/esp.3635
Brown J. M., Davies A. G. (2010). Flood/ebb tidal asymmetry in a shallow sandy estuary and the impact on net sand transport. Geomorphology 114 (3), 431–439. doi: 10.1016/j.geomorph.2009.08.006
Burchard H., Baumert H. (1998). The formation of estuarine turbidity maxima due to density effects in the salt wedge. a hydrodynamic process study. J. Phys. Oceanograph. 28 (2), 309–321. doi: 10.1175/1520-0485(1998)028<0309:TFOETM>2.0.CO;2
Cheng Z., Jalon-Rójas I., Wang X. H., Liu Y. (2020). Impacts of land reclamation on sediment transport and sedimentary environment in a macro-tidal estuary. Estuarine Coast. Shelf Sci. 242 (October 2019) 106861. doi: 10.1016/j.ecss.2020.106861
Cheng Z., Wang X. H., Jalón-Rojas I., Liu Y. (2019). Reconstruction of sedimentation changes under anthropogenic influence in a medium-scale estuary based on a decadal chronological framework. Estuarine Coast. Shelf Sci. 227, 106295. doi: 10.1016/j.ecss.2019.106295
Cheng Z., Wang X. H., Paull D., Gao J. (2016). Application of the geostationary ocean color imager to mapping the diurnal and seasonal variability of surface suspended matter in a macro-tidal estuary. Remote Sens. 8 (3), 244. doi: 10.3390/rs8030244
Chen C., Huang H., Beardsley R. C., Xu Q., Limeburner R., Cowles G. W., et al. (2011). Tidal dynamics in the gulf of Maine and new England shelf: An application of FVCOM. J. Geophys. Res.: Oceans 116 (12), 1–14. doi: 10.1029/2011JC007054
Cooper J. A. G. (2002). The role of extreme floods in estuary-coastal behaviour: Contrasts between river- and tide-dominated microtidal estuaries. Sedimentary Geol. 150 (1–2), 123–137. doi: 10.1016/S0037-0738(01)00271-8
Croke J., Fryirs K., Thompson C. (2013). Channel-floodplain connectivity during an extreme flood event: Implications for sediment erosion, deposition, and delivery. Earth Surface Processes Landforms 38 (12), 1444–1456. doi: 10.1002/esp.3430
Dai Z., Mei X., Darby S. E., Lou Y., Li W. (2018). Fluvial sediment transfer in the changjiang (Yangtze) river-estuary depositional system. J. Hydrol. 566, 719–734. doi: 10.1016/j.jhydrol.2018.09.019
Dittmann S., Baring R., Baggalley S., Cantin A., Earl J., Gannon R., et al. (2015). Drought and flood effects on macrobenthic communities in the estuary of australia’s largest river system. Estuarine Coast. Shelf Sci. 165, 36–51. doi: 10.1016/j.ecss.2015.08.023
Dronkers J. (1986). Tidal asymmetry and estuarine morphology. Netherlands J. Sea Res. 20 (2–3), 117–131. doi: 10.1016/0077-7579(86)90036-0
Friedrichs C. T. (2012). “Tidal flat morphodynamics: A synthesis,” in Treatise on estuarine and coastal science, vol. 3. (Elsevier Inc). doi: 10.1016/B978-0-12-374711-2.00307-7
Friedrichs C. T., Aubrey D. G. (1988). Non-linear tidal distortion in shallow well-mixed estuaries: a synthesis. Estuarine Coast. Shelf Sci. 27 (5), 521–545. doi: 10.1016/0272-7714(88)90082-0
Galperin B., Sukoriansky S., Anderson P. S. (2007). On the critical Richardson number in stably stratified turbulence. Atmospheric Sci. Lett. 8 (3), 65–69. doi: 10.1002/asl.153
Gao J.h., Li J., Wang H., Bai F.l., Cheng Y., Wang Y.p. (2012). Rapid changes of sediment dynamic processes in yalu river estuary under anthropogenic impacts. Int. J. Sediment Res. 27 (1), 37–49. doi: 10.1016/S1001-6279(12)60014-6
Ge J., Torres R., Chen C., Liu J., Xu Y., Bellerby R., et al. (2020). Influence of suspended sediment front on nutrients and phytoplankton dynamics off the changjiang estuary: A FVCOM-ERSEM coupled model experiment. J. Mar. Syst. 204, 103292. doi: 10.1016/j.jmarsys.2019.103292
Grachev A. A., Andreas E. L., Fairall C. W., Guest P. S., Persson P. O. G. (2013). The critical Richardson number and limits of applicability of local similarity theory in the stable boundary layer. Boundary-Layer Meteorol. 147 (1), 51–82. doi: 10.1007/s10546-012-9771-0
Guo L., van der Wegen M., Roelvink J. A., He Q. (2014). The role of river flow and tidal asymmetry on 1-d estuarine morphodynamics. J. Geophys. Res.: Earth Surface 119 (11), 2315–2334. doi: 10.1002/2014jf003110
Hunt S., Bryan K. R., Mullarney J. C. (2015). The influence of wind and waves on the existence of stable intertidal morphology in meso-tidal estuaries. Geomorphology 228, 158–174. doi: 10.1016/j.geomorph.2014.09.001
Koiter A. J., Owens P. N., Petticrew E. L., Lobb D. A. (2013). The behavioural characteristics of sediment properties and their implications for sediment fingerprinting as an approach for identifying sediment sources in river basins. Earth-Science Rev. 125, 24–42. doi: 10.1016/j.earscirev.2013.05.009
Luan H. L., Ding P. X., Wang Z. B., Ge J. Z. (2017). Process-based morphodynamic modeling of the Yangtze estuary at a decadal timescale: Controls on estuarine evolution and future trends. Geomorphology 290, 347–364. doi: 10.1016/j.geomorph.2017.04.016
Luan H. L., Ding P. X., Wang Z. B., Ge J. Z., Yang S. L. (2016). Decadal morphological evolution of the Yangtze estuary in response to river input changes and estuarine engineering projects. Geomorphology 265, 12–23. doi: 10.1016/j.geomorph.2016.04.022
Lu J., Qiao F. L., Wang X. H., Wang Y. G., Teng Y., Xia C. S. (2011). A numerical study of transport dynamics and seasonal variability of the yellow river sediment in the bohai and yellow seas. Estuarine Coast. Shelf Sci. 95 (1), 39–51. doi: 10.1016/j.ecss.2011.08.001
MacCready P., Geyer W. R. (2010). Advances in estuarine physics. Annu. Rev. Mar. Sci. 2 (1), 35–58. doi: 10.1146/annurev-marine-120308-081015
Meade R. H. (1996). “Chapter 3: River-sediment inputs to major deltas,” in Sea Level-rise and coastal subsidence (U.S. Government). doi: 10.1007/978-94-015-8719-8_4
Milliman J. D., Meade R. H. (1983). World-wide delivery of river sediment to the oceans. J. Geol. 91 (1), 01–21. doi: 10.1086/628741
Nidzieko N. J. (2010). Tidal asymmetry in estuaries with mixed semidiurnal/diurnal tides. J. Geophys. Res.: Oceans 115 (8), 1–13. doi: 10.1029/2009JC005864
Philpot W. D. (1989). Bathymetric mapping with passive multispectral imagery. Appl. Optics 28 (8), 1569. doi: 10.1364/ao.28.001569
Poulenard J., Perrette Y., Fanget B., Quetin P., Trevisan D., Dorioz J. M. (2009). Infrared spectroscopy tracing of sediment sources in a small rural watershed (French Alps). Sci. Total Environ. 407 (8), 2808–2819. doi: 10.1016/j.scitotenv.2008.12.049
Ralston D. K., Talke S., Geyer W. R., Al-Zubaidi H. A. M., Sommerfield C. K. (2019). Bigger tides, less flooding: Effects of dredging on barotropic dynamics in a highly modified estuary. J. Geophys. Res.: Oceans 124 (1), 196–211. doi: 10.1029/2018JC014313
Rickson R. J. (2014). Can control of soil erosion mitigate water pollution by sediments? Sci. Total Environ. 468–469, 1187–1197. doi: 10.1016/j.scitotenv.2013.05.057
Song D., Wang X. H., Kiss A. E., Bao X. (2011). The contribution to tidal asymmetry by different combinations of tidal constituents. J. Geophys. Res.: Oceans 116 (12), 1–12. doi: 10.1029/2011JC007270
Stokes G. G. (1847). On the theory of oscillatory waves, trans. Cambridge Philos. Soc 8, 441–455. doi: 10.1017/CBO9780511702242.013
Stumpf R. P., Holderied K., Sinclair M. (2003). Determination of water depth with high-resolution satellite imagery over variable bottom types. Limnol. Oceanograph. 48 (1 II), 547–556. doi: 10.4319/lo.2003.48.1_part_2.0547
Traganos D., Poursanidis D., Aggarwal B., Chrysoulakis N., Reinartz P. (2018). Estimating satellite-derived bathymetry (SDB) with the Google earth engine and sentinel-2. Remote Sens. 10 (6), 1–18. doi: 10.3390/rs10060859
Van de Kreeke J., Robaczewska K. (1993). Tide-induced residual transport of coarse sediment; application to the EMS estuary. Netherlands J. Sea Res. 31 (3), 209–220. doi: 10.1016/0077-7579(93)90022-K
Van Maren D. S., Winterwerp J. C. (2013). The role of flow asymmetry and mud properties on tidal flat sedimentation. Continental Shelf Res. 60, S71–S84. doi: 10.1016/j.csr.2012.07.010
Vercruysse K., Grabowski R. C., Rickson R. J. (2017). Suspended sediment transport dynamics in rivers: Multi-scale drivers of temporal variation. Earth-Science Rev. 166 (2017), 38–52. doi: 10.1016/j.earscirev.2016.12.016
Ward P. J., Couasnon A., Eilander D., Haigh I. D., Hendry A., Muis S., et al. (2018). Dependence between high sea-level and high river discharge increases flood hazard in global deltas and estuaries. Environ. Res. Lett. 13 (8), 084012. doi: 10.1088/1748-9326/aad400
Whipple A. C., Luettich R. A., Reynolds-Fleming J. V., Neve R. H. (2018). Spatial differences in wind-driven sediment resuspension in a shallow, coastal estuary. Estuarine Coast. Shelf Sci. 213, 49–60. doi: 10.1016/j.ecss.2018.08.005
Xie D., Pan C., Gao S., Wang Z. B. (2018). Morphodynamics of the qiantang estuary, China: Controls of river flood events and tidal bores. Mar. Geol. 406 (June), 27–33. doi: 10.1016/j.margeo.2018.09.003
Xie D., Wang Z. B., van der Wegen M., Huang J. (2021). Morphodynamic modeling the impact of large-scale embankment on the large bar in a convergent estuary. Mar. Geol. 442 (August), 106638. doi: 10.1016/j.margeo.2021.106638
Yang G., Wang X. H., Cheng Z., Zhong Y., Oliver T. (2021). Modelling study on estuarine circulation and its effect on the turbidity maximum zone in the yalu river estuary, China. Estuarine Coast. Shelf Sci. 263 (June), 107634. doi: 10.1016/j.ecss.2021.107634
Zhu C., van Maren D. S., Guo L., Lin J., He Q., Wang Z. B. (2021). Effects of sediment-induced density gradients on the estuarine turbidity maximum in the Yangtze estuary. J. Geophys. Res.: Oceans 126 (5), e2020JC016927. doi: 10.1029/2020JC016927
Keywords: FVCOM, sediment transport, flooding events, estuarine morphology, macro-tidal estuary
Citation: Du Y, Cheng Z and You Z (2023) Morphological changes in a macro-tidal estuary during extreme flooding events. Front. Mar. Sci. 9:1112494. doi: 10.3389/fmars.2022.1112494
Received: 30 November 2022; Accepted: 19 December 2022;
Published: 10 January 2023.
Edited by:
Dehai Song, Ocean University of China, ChinaReviewed by:
Shenliang Chen, East China Normal University, ChinaLulu Qiao, Ocean University of China, China
Copyright © 2023 Du, Cheng and You. This is an open-access article distributed under the terms of the Creative Commons Attribution License (CC BY). The use, distribution or reproduction in other forums is permitted, provided the original author(s) and the copyright owner(s) are credited and that the original publication in this journal is cited, in accordance with accepted academic practice. No use, distribution or reproduction is permitted which does not comply with these terms.
*Correspondence: Zhixin Cheng, Y2hlbmd6aGl4aW5AZGxtdS5lZHUuY24=