 Tone Falkenhaug
 Cecilie Broms
 Espen Bagøien
 Nikolaos Nikolioudakis
- Institute of Marine Research (IMR), Bergen, Norway
The congeneric copepods Calanus finmarchicus and C. helgolandicus co-occur in the northern North Sea and Skagerrak where they play important roles as prey for higher trophic levels. This study analyses a 26-year time series (1994-2019) with a ~ two-week temporal resolution for Calanus spp. at a fixed monitoring station in Skagerrak, off southern Norway. Seasonal variation, inter-annual variability and long-term trends for the two species were examined. Strong differences in the species-specific seasonality were revealed, with C. finmarchicus dominating in spring and C. helgolandicus in autumn. The seasonal peak of C. finmarchicus was associated with relatively low temperatures (6-8°C) and high chlorophyll a concentration, while C. helgolandicus displayed its seasonal maximum at higher temperatures (11-16°C). C. finmarchicus was found to produce one dominant annual generation (in spring), but two or more generations are considered likely. Contrasting long-term trends in abundances were found for the two species, suggesting that their population sizes were affected by different mechanisms. The abundance of C. helgolandicus showed an increasing trend over the time period studied, apart from the last years. The abundance of C. finmarchicus was more variable and displayed no unidirectional long-term trends over the time series. The study revealed a shift in the phenology of Calanus spp. over the last 25 years at this site. Since 1994 the timing of the annual peaks in both C. finmarchicus and C. helgolandicus have advanced by about one month. Moreover, the seasonal pattern of C. helgolandicus, switched from a unimodal to a bimodal pattern around 2002, with a small additional peak also appearing in spring. The results suggest that the proximity to the Norwegian Trench influences the demography and abundance of C. finmarchicus in this coastal area, both as a gateway for the advective supply, as well as a habitat for local overwintering.
Introduction
Calanoid copepods of the genus Calanus spp. are major components of the zooplankton in the Northeast Atlantic Ocean and shelf seas (Conover, 1988; Melle et al., 2014). Two of the species in this ecologically important “Calanus complex” (Bonnet et al., 2005; Falk-Petersen et al., 2009), are the cold-boreal Calanus finmarchicus (Gunnerus, 1770) and the warm-temperate C. helgolandicus (Claus, 1863). The distributional range of C. finmarchicus covers parts of the sub-polar North Atlantic, from eastern Canada to the Nordic Seas and the North Sea (Jaschnov, 1970; Helaouët et al., 2011; Melle et al., 2014; Strand et al., 2020). This species is observed at least in the temperature range 0 - 14°C, but with highest concentrations between 5 - 9°C (Jónasdóttir and Koski, 2011; Strand et al., 2020). C. helgolandicus (Claus, 1863) is associated with shelf areas along the eastern Atlantic. It has a more southerly distribution, mainly from the Mediterranean to the North Sea (40° - 60°N; Helaouët and Beaugrand, 2007), and typically occupies habitats with temperatures between 9° and 20°C (Bonnet et al., 2005).
The northern North Sea and Skagerrak is a shelf ecosystem with a wide-open boundary to the North Atlantic. This region represents a transition zone, where the biogeographic distributions of C. finmarchicus and C. helgolandicus overlap. In this part of the North Sea, C. finmarchicus is close to the southern limit of its geographical distribution while C. helgolandicus is close to its northern limit (Wilson et al., 2016; Strand et al., 2020), and both species are thus expected to be sensitive to small variations in environmental variables. These two Calanus species dominate the zooplankton abundance in this area, where they can make up 90% of the mesozooplankton biomass (Krause et al., 2003; Bonnet et al., 2005), and are key prey for early-life stages and adults of commercially important fish species such as cod, herring and lesser sandeel (Munk and Nielsen, 1994; Arnott and Ruxton, 2002; Heath, 2007; van Deurs et al., 2009). Over the last five decades, extensive changes in the zooplankton communities in the North-East Atlantic and on the European shelves have taken place. These changes have likely been driven by increased ocean temperatures, and include a biogeographical shift for several copepod species, with a poleward extension of warm-water species associated with a decrease in the number of cold-water species (Beaugrand et al., 2002). As a result, the abundance of C. finmarchicus has declined by 70% in the North Sea since 1970, concurrent with an apparent increase in the abundance of C. helgolandicus (Fromentin and Planque, 1996; Planque and Taylor, 1998).
Whereas long-term changes in zooplankton abundance in the North Sea have been thoroughly studied, potential changes in seasonal cycles and phenology have received less attention. C. finmarchicus has generally been considered to have a predominantly one-year life cycle throughout most of its geographic range (e.g. Heath et al., 2000; Melle et al., 2014 and references therein). However, the importance of a second generation has received more attention in recent studies (e.g. Strand et al., 2020; Skjoldal et al., 2021) and as many as three generations can develop in the southern North Sea (Fransz et al., 1991; Hirche et al., 2001). Regardless of the number of generations, the seasonal cycle of C. finmarchicus is characterized by a strong annual peak occurring in spring, potentially followed by smaller secondary peaks in summer and fall (Planque and Fromentin, 1996). In contrast, C. helgolandicus typically has multiple generations each year and its seasonality varies with latitude (Bonnet et al., 2005). In the Mediterranean, the annual peak in C. helgolandicus occurs in spring, whereas in the North Sea and Northeast Atlantic the peak is displayed in autumn (Planque and Fromentin, 1996; Bonnet et al., 2005). Long-term changes in abundance as well as the seasonal cycle and phenology of C. finmarchicus and C. helgolandicus may have consequences for the North Sea and Skagerrak ecosystems. Several studies from this area have linked fish recruitment not only to the abundance, but also to the seasonality of the Calanus species that serve as important prey (Beaugrand et al., 2003; Johannessen et al., 2012; Durant et al., 2013).
The present study is based on a time series from Arendal Station 2, located in the northern Skagerrak, where Calanus spp. have been sampled with high temporal resolution from 1994 to 2019. The timeseries from this station is of interest for several reasons. First, even though long-term changes in abundances of Calanus species in the North Sea have been thoroughly described, this has mainly been based on the high-quality data from the Continuous Plankton Recorder (CPR, Batten et al., 2003; Richardson et al., 2006). However, these CPR-results have been criticized due to the sampling being confined within a narrow depth interval around ~ 7 m depth while observations suggest that C. finmarchicus and C. helgolandicus occupy different depths (Jónasdóttir and Koski, 2011). Changes in vertical distributions of the two species in parallel with changes in water temperatures, will not be captured by the sampling method of CPR, and may instead be interpreted as changes in abundance. The present study covers a larger part of the water column and may thus avoid biases due to changes in vertical distributions of the populations. In addition, our study presents data from a part of the North Sea where the CPR coverage is sparse and where few long-term monitoring data on zooplankton exist. This study may thus complement our understanding of the long-term changes of the most important zooplankton species in an area under pressure from human activities and climate change. Second, the high temporal resolution is well suited to examine the seasonal patterns of the species and to evaluate whether there have been changes in phenology during the last 26 years. Potential phenological changes within this area could represent valuable information regarding as to how these two species may respond to climate changes, knowledge that could prove useful also for other geographical areas.
This study aims at establishing for the first time the seasonal cycles and long-term trends in abundance for each of the congeneric copepods C. finmarchicus and C. helgolandicus in the northern Skagerrak. This includes a description and comparison of the demography and number of generations for the two co-occurring sibling species. We also explore potential changes in phenology throughout the studied period. The following research questions are addressed:
● Can distinct cohorts of the congeneric C. finmarchicus and C. helgolandicus be identified and followed at the study site?
● If so, how many generations do each of the species produce annually in the area?
● Do the species phenologies overlap during the productive season?
● Is there a clear trend in the phenology and abundances of both species during the last 26 years?
Materials and Methods
Study Site
This study is based on high frequency time-series data from 1994 to 2019 obtained from the Arendal Station 2 which is located in the northern Skagerrak, 1 nautical mile offshore at 75 m depth (58°23′N 8°49′E, Figures 1 and 2). The monitoring station is operated by the Institute of Marine Research in Norway. The Skagerrak is part of the north-west European Shelf and forms a transition area between the Baltic Sea and the North Sea proper. While the North Sea is a shallow shelf area, with an average depth of approximately 80 m, Skagerrak has as a mean depth of 200 m. The Skagerrak is directly connected to the Norwegian Sea via the Norwegian Trench, which extends southward from the Norwegian Sea and follows the Norwegian coastline into the center of Skagerrak where it reaches a maximum depth of 710 m. The predominant circulation in Skagerrak is anti-clockwise and is influenced by three main water masses of different origin. Warm, saline Atlantic water (salinity >35) enters the North Sea from the north and follows the western slope of the Norwegian Trench into Skagerrak, as the Norwegian Trench Atlantic Inflow (NTI; Furnes et al., 1986). Waters from the southern North Sea (Jutland Current, salinity < 34) carry relatively cold and fresh water along the west coast of Denmark and mixes with brackish water from the Baltic Sea, forming the Norwegian Coastal Current (NCC). The NCC flows along the Norwegian coast, transporting water out and northward from the Skagerrak and North Sea. Most of the water entering the North Sea shelf flows through Skagerrak before leaving, and many of the hydrographic events taking place in the North Sea will thus be reflected in this region. The coastal area of northern Skagerrak is strongly influenced by the brackish NCC and the outflow of freshwater from rivers, and the hydrographic conditions at the Arendal Station 2 are characterized by strong seasonal cycles in both salinity and temperature (Sætre et al., 2003; Albretsen et al., 2012). The site is influenced by relatively fresh coastal waters (25–32) in the upper 30 m and by more saline Skagerrak and North Sea water (32–35) deeper in the water-column. Surface water temperature ranges from 0°C to 20°C, with the annual minimum in March and maximum in August. The freshwater outflow combined with thermal heating results in the development of a pronounced pycnocline at 15-20 m from March to October. However, wind driven coastal upwelling is common along the coast, which may bring high salinity Atlantic water to the surface. A detailed description of the current system and hydrography in the North Sea-Skagerrak is given by Otto et al. (1990), Rohde (1996) and Sætre et al. (2003). A spring phytoplankton bloom, dominated by diatoms, usually starts between February and April and typically lasts for 2-4 weeks. Chlorophyll values are generally low during summer, followed by a smaller autumn bloom of dinoflagellates in August–September (Dahl and Johannessen, 1998; Dahl et al., 2005).
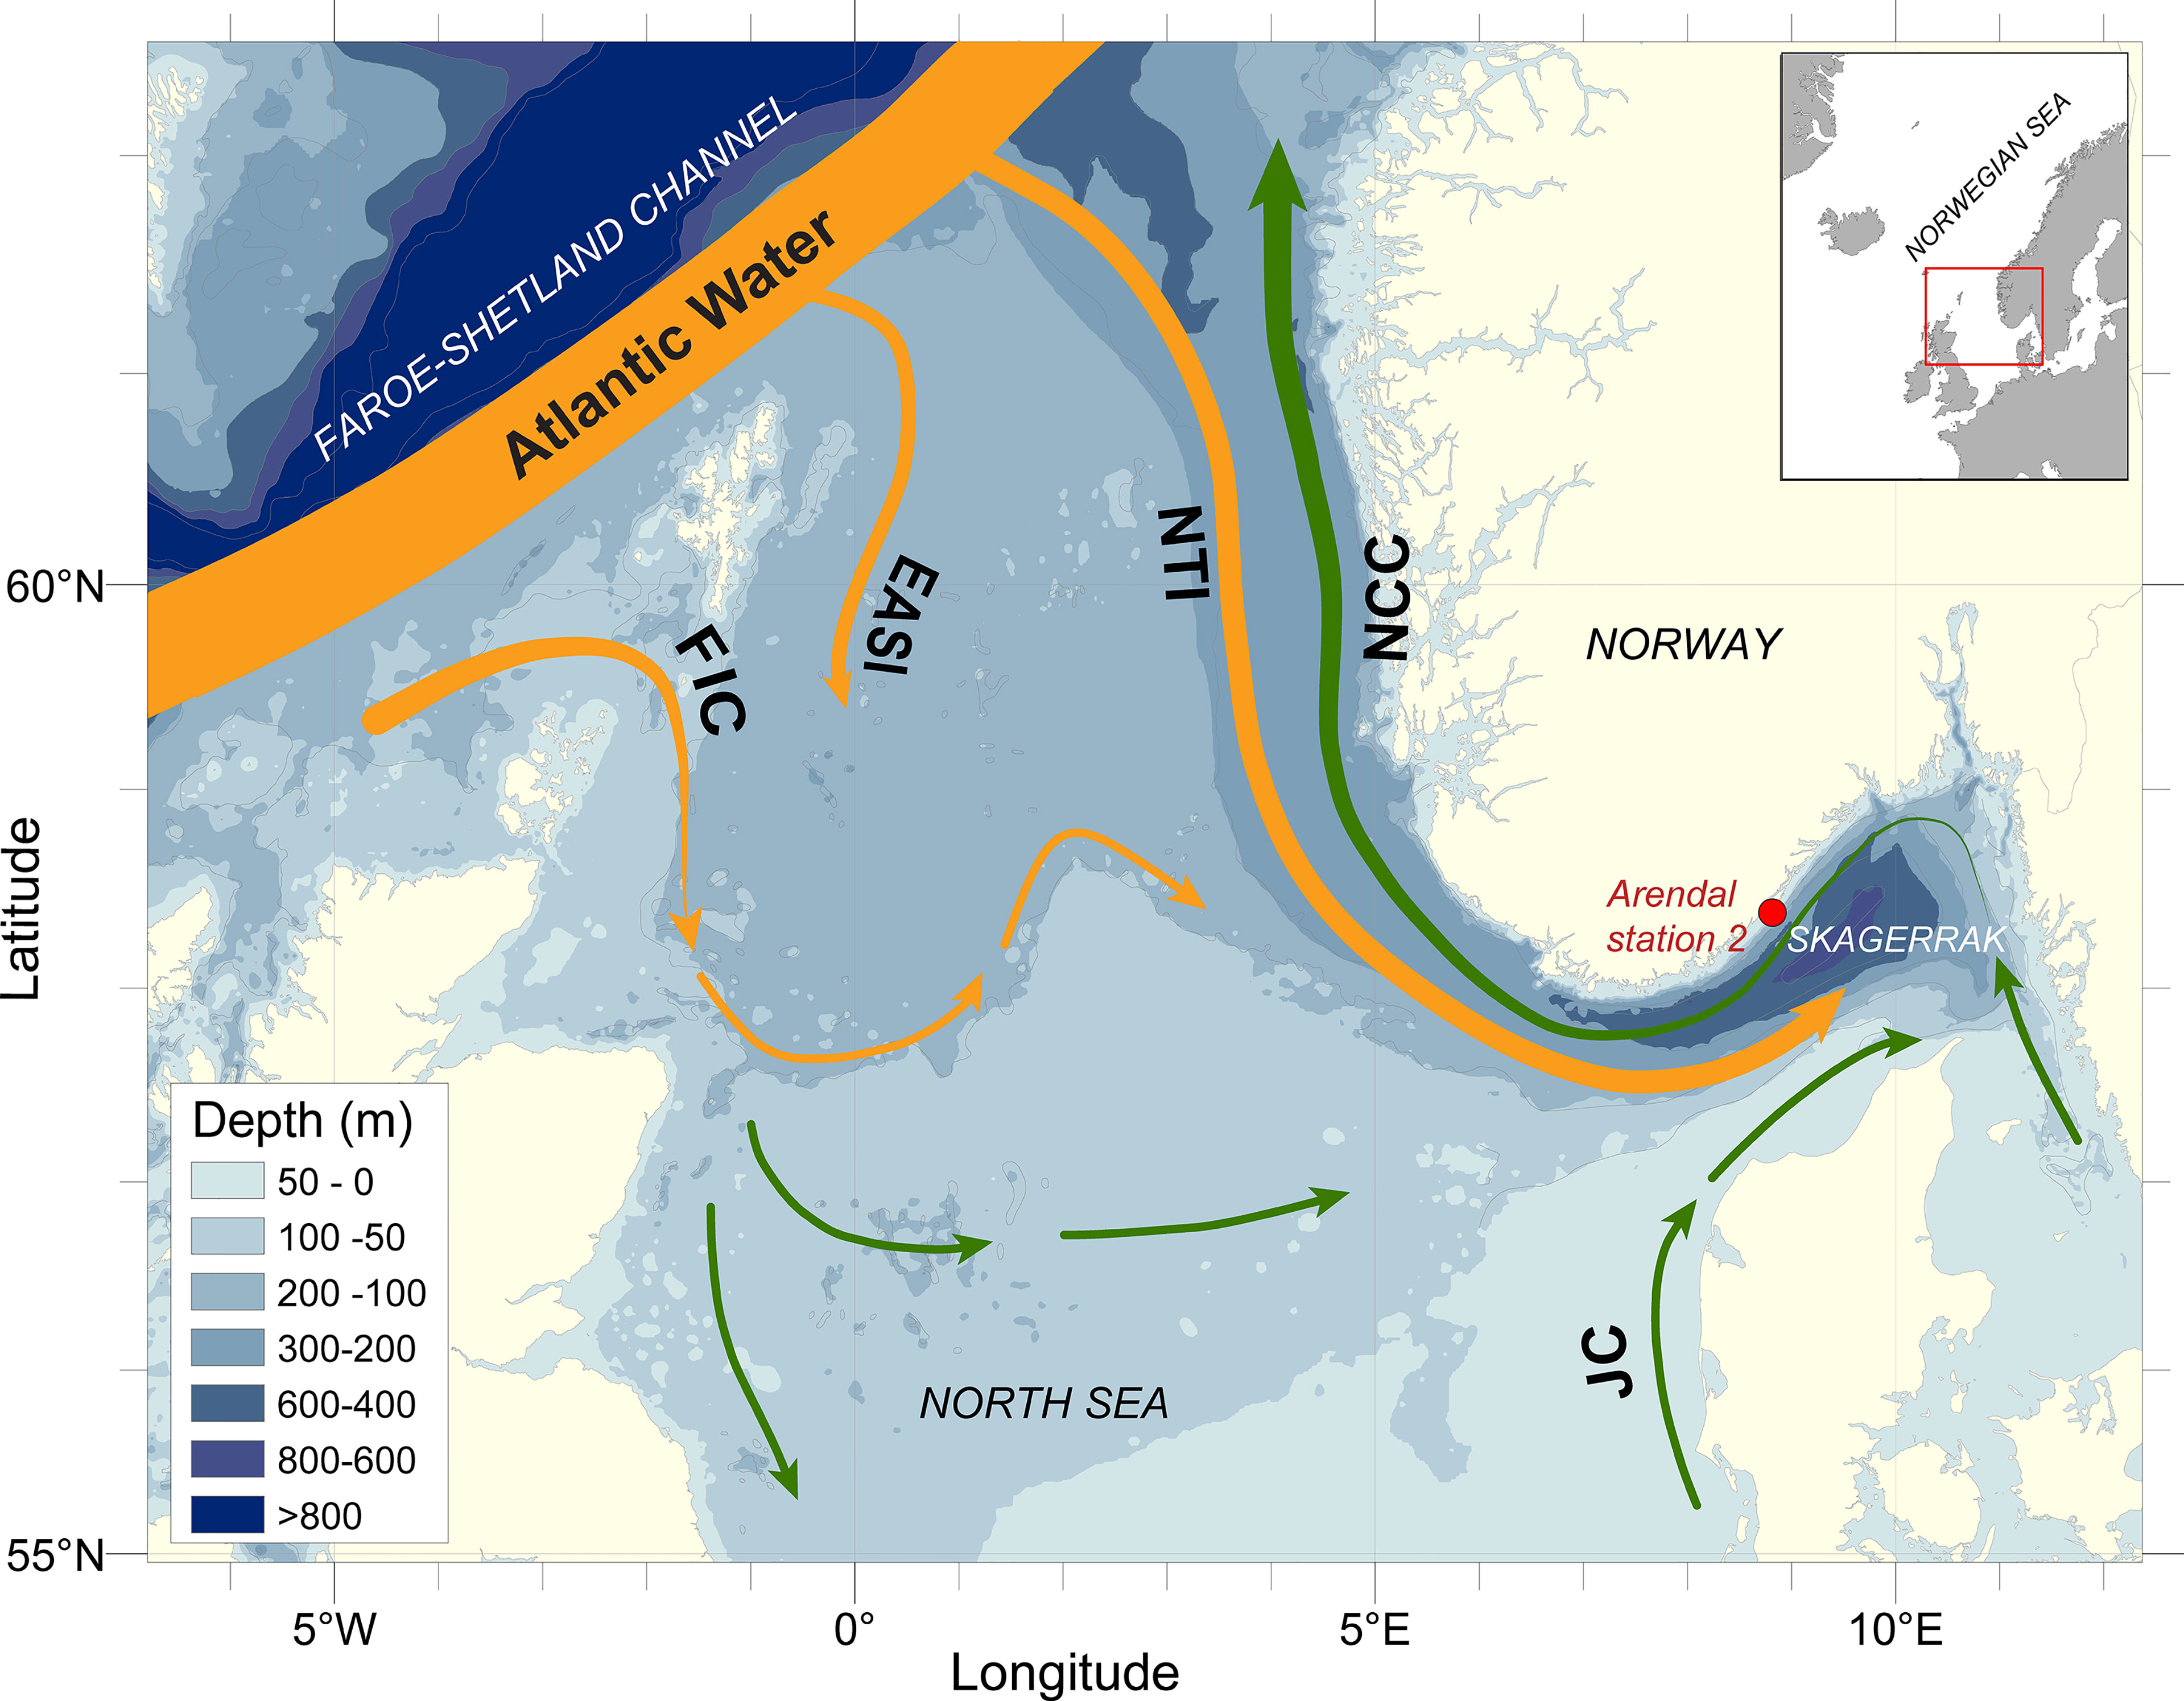
Figure 1 North Sea and Skagerrak with main currents and location of Arendal Station 2 monitoring site. NTI: Norwegian Trench Atlantic Inflow; NCC, Norwegian Coastal Current; ESAI, East Shetland Atlantic Inflow; FIC, Fair Isle Current; JC, Jutland Current. Inset map shows the location of the Skagerrak area relative to adjacent seas.
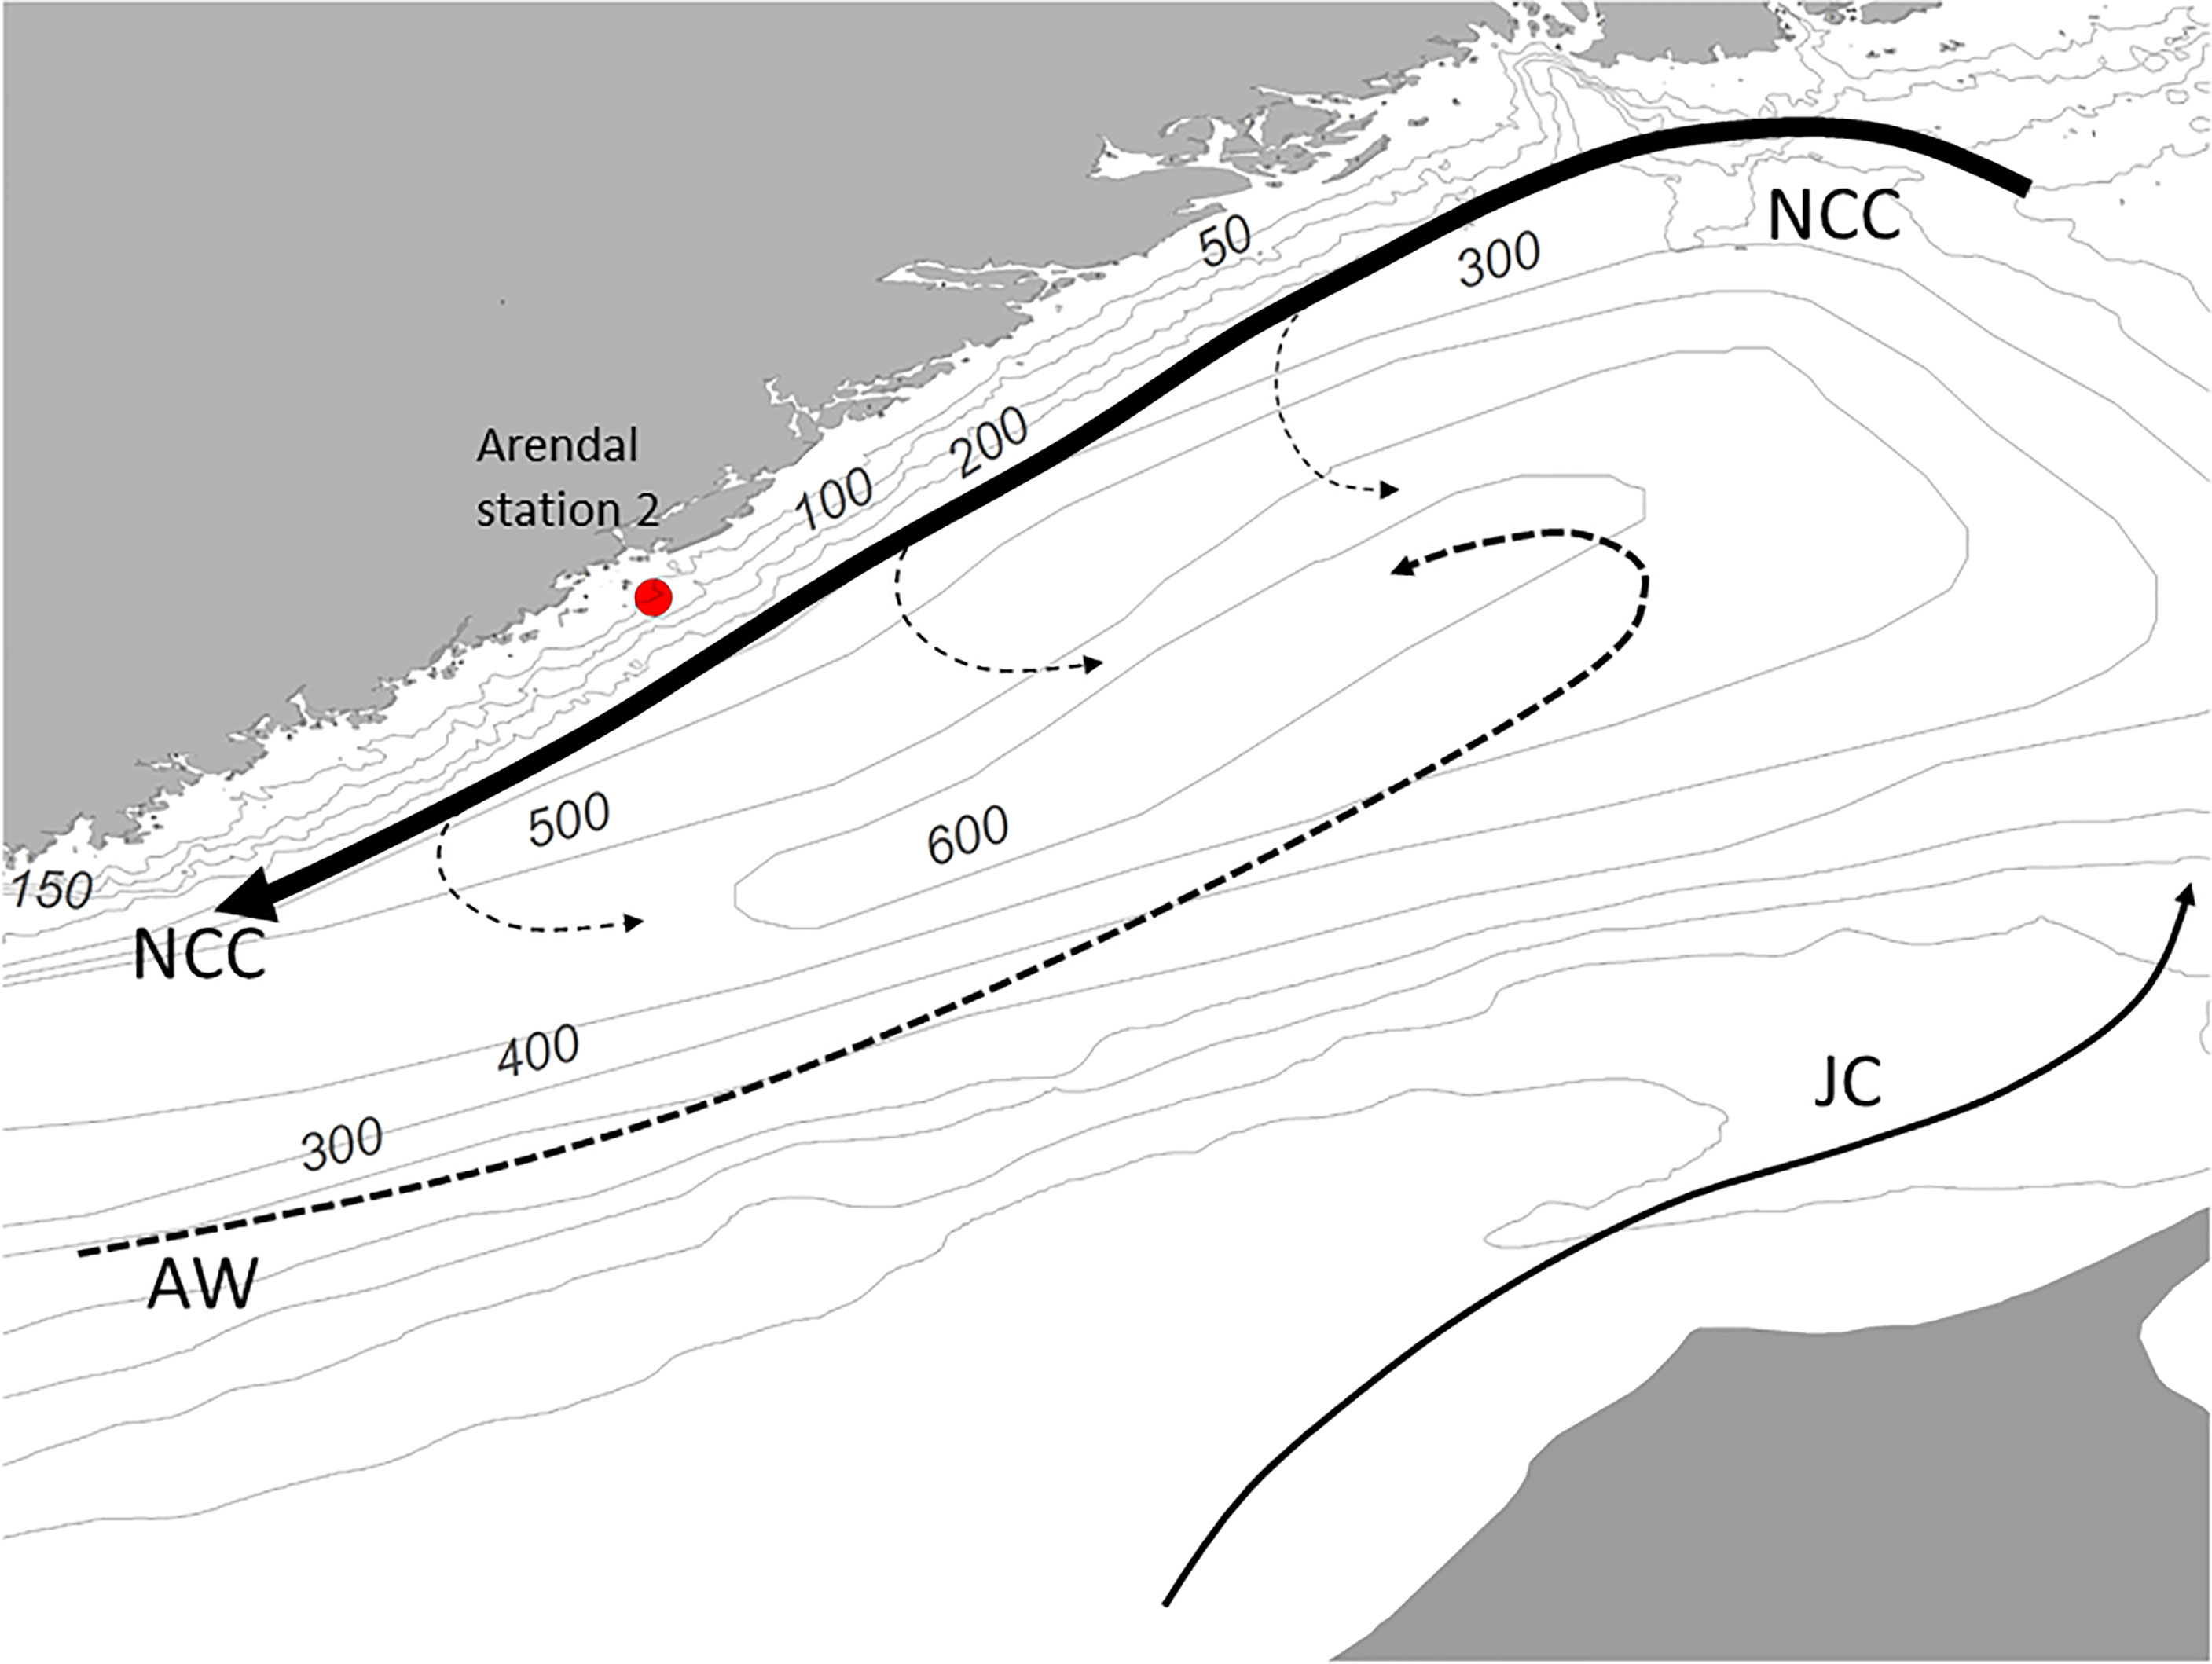
Figure 2 Local bathymetry and prevailing circulation systems in Skagerrak. NCC, Norwegian Coastal Current; AW, Atlantic water; JC, Jutland Current.
Data Collection
Plankton at the Arendal sampling site has generally been monitored once to twice a month since 1994. Zooplankton was sampled by vertical hauls from 50 m to the surface, using a standard WP2 net (specified in UNESCO, 1968) with mesh-size 180 µm. Each sample was split into two equal parts with a Motoda splitter (Motoda, 1959). One half of the sample was preserved in 4% borax buffered formaldehyde-seawater solution for species identification and enumeration, and the other half used for biomass measurements (not presented here). Calanus spp. were enumerated and identified to copepodite stage. In order to determine the proportions of C. finmarchicus and C. helgolandicus in the samples, 20 individuals of Calanus for each of the copepodite stages CV, CVI females and CVI males were identified to species according to Fleminger and Hulseman (1977). CV and female CVI of the two species were discriminated based on the morphology and teeth of the basipod of the fifth pair of swimming legs. Male CVI were identified on the basis of the relative lengths of the endopod and exopod of the fifth leg. The reliability of discriminating C. finmarchicus and C. helgolandicus as CV and CVI copepodites by morphology has been confirmed by molecular methods (Lindeque et al., 2006). The abundance of each species was obtained by multiplying the total number of Calanus spp. within each developmental stage, by the stage-specific proportions. Copepodite stages CI-IV were counted, but for these stages the two species cannot be separated morphologically (Frost, 1974; Fleminger and Hulsemann, 1977).
Time Series Analysis
Sampling for Calanus was generally carried out once to twice a month (irregular intervals). To regularize the time series, data for the different developmental stages, sexes and species of Calanus spp., were averaged to monthly values for each year. When no sampling took place within a month, data for the month were imputed using the mean of the preceding and following month. For the different stage-resolved monthly time series, 12 to 18 missing values were imputed, which represents 4-6% of the 300 monthly values. If zero counts of individuals were found in the sample(s) of a month for each of the time series, these were not imputed, retaining the zero count observations. Subsequently, three more time series were created by aggregating (i) copepodite stages CI to IV for Calanus spp. (‘Calanus spp. I-IV. I-IV’), (ii) stages CV, CVI male and CVI female for Calanus finmarchicus (‘C.fin V-VI’) and (iii) stage CV, CVI male and CVI female for Calanus helgolandicus (‘C.hel V-VI’). These three aggregated time series are the ones for which long term trends and periodicities are explored in the present study. Throughout the 1994-2019 study period, for each of the time series, the percentage of zero counts was 1.33%, 1.67% and 2.67 for Calanus spp. I-IV, C.fin V-VI and C.hel V-VI, respectively.
Each of the three time-series was subjected to Seasonal and Trend decomposition using Loess (STL) (Cleveland et al., 1990). STL was selected over other methods as it allows the seasonal component to change over time and the smoothness of the trend-cycle to be user-defined. A preliminary examination of the data revealed that the seasonal component was not constant over time. A 5-year window for the trend smoother was chosen, while the seasonal window was set to 12 months, thus allowing for variable amplitude and/or timing of the seasonal cycle. The selected 5-year trend smoother captured relatively well the long-term changes observed in the abundance of each aggregated time-series. Wider smoother-windows (e.g., 10 years) were tested, but led to over-smoothing, thus missing patterns with evident high/low abundance values, whereas lower values (e.g., 1 year) led to a very wiggly smoother from which long-term trends could not be easily discerned.
A Generalised Additive Model (GAM) (Hastie and Tibshirani, 1990; Wood, 2017) was used to evaluate potential changes in the seasonal patterns and abundance of the two species throughout the study period, for each of the three time series. The Tweedie distribution was chosen for its ability to handle zero values in the dataset through the parameter p which defines the model distribution. When 1<p<2, the model is a Poisson mixture of Gamma distributions. Let Y(t) be the observed abundance of the copepods in the studied time series. We assume that:
where ϕ is the dispersion parameter and the mean µi is linked to the linear predictor through a known link function g,
where Xi is a vector of covariates and β is a vector of unknown regression parameters. GAM fitting was done by setting the family argument to ‘tw’ for automatic estimation of the parameter p and generalized cross validation (GCV) was used to determine the optimal model fit. A tensor product smoother using ‘Month’ and ‘Year’ was applied to the abundance of each time series. All analysis was carried out in R 4.1.1 (R Core Team, 2021). For the STL decomposition and the GAM fitting the ‘fable’ (0.3.1, O'Hara-Wild et al., 2021) and ‘mgcv’ (Wood, 2017) packages were used, respectively. GAM plots were created using the ‘ggplot2’ (Wickham, 2016) and ‘mgcViz’ (Fasiolo et al., 2020) packages.
Results
Calanus spp. Seasonal Cycles
The seasonal variation in abundance of Calanus spp. was pronounced, and differences in the seasonal dynamics between Calanus finmarchicus and C. helgolandicus were evident. In Figures 3 and 4, data from all years have been pooled and thus show the general seasonal patterns over the period studied. Due to pooling of data for all years, between-year differences in timing must be assumed to result in a wider distribution than would be the case for any single year.
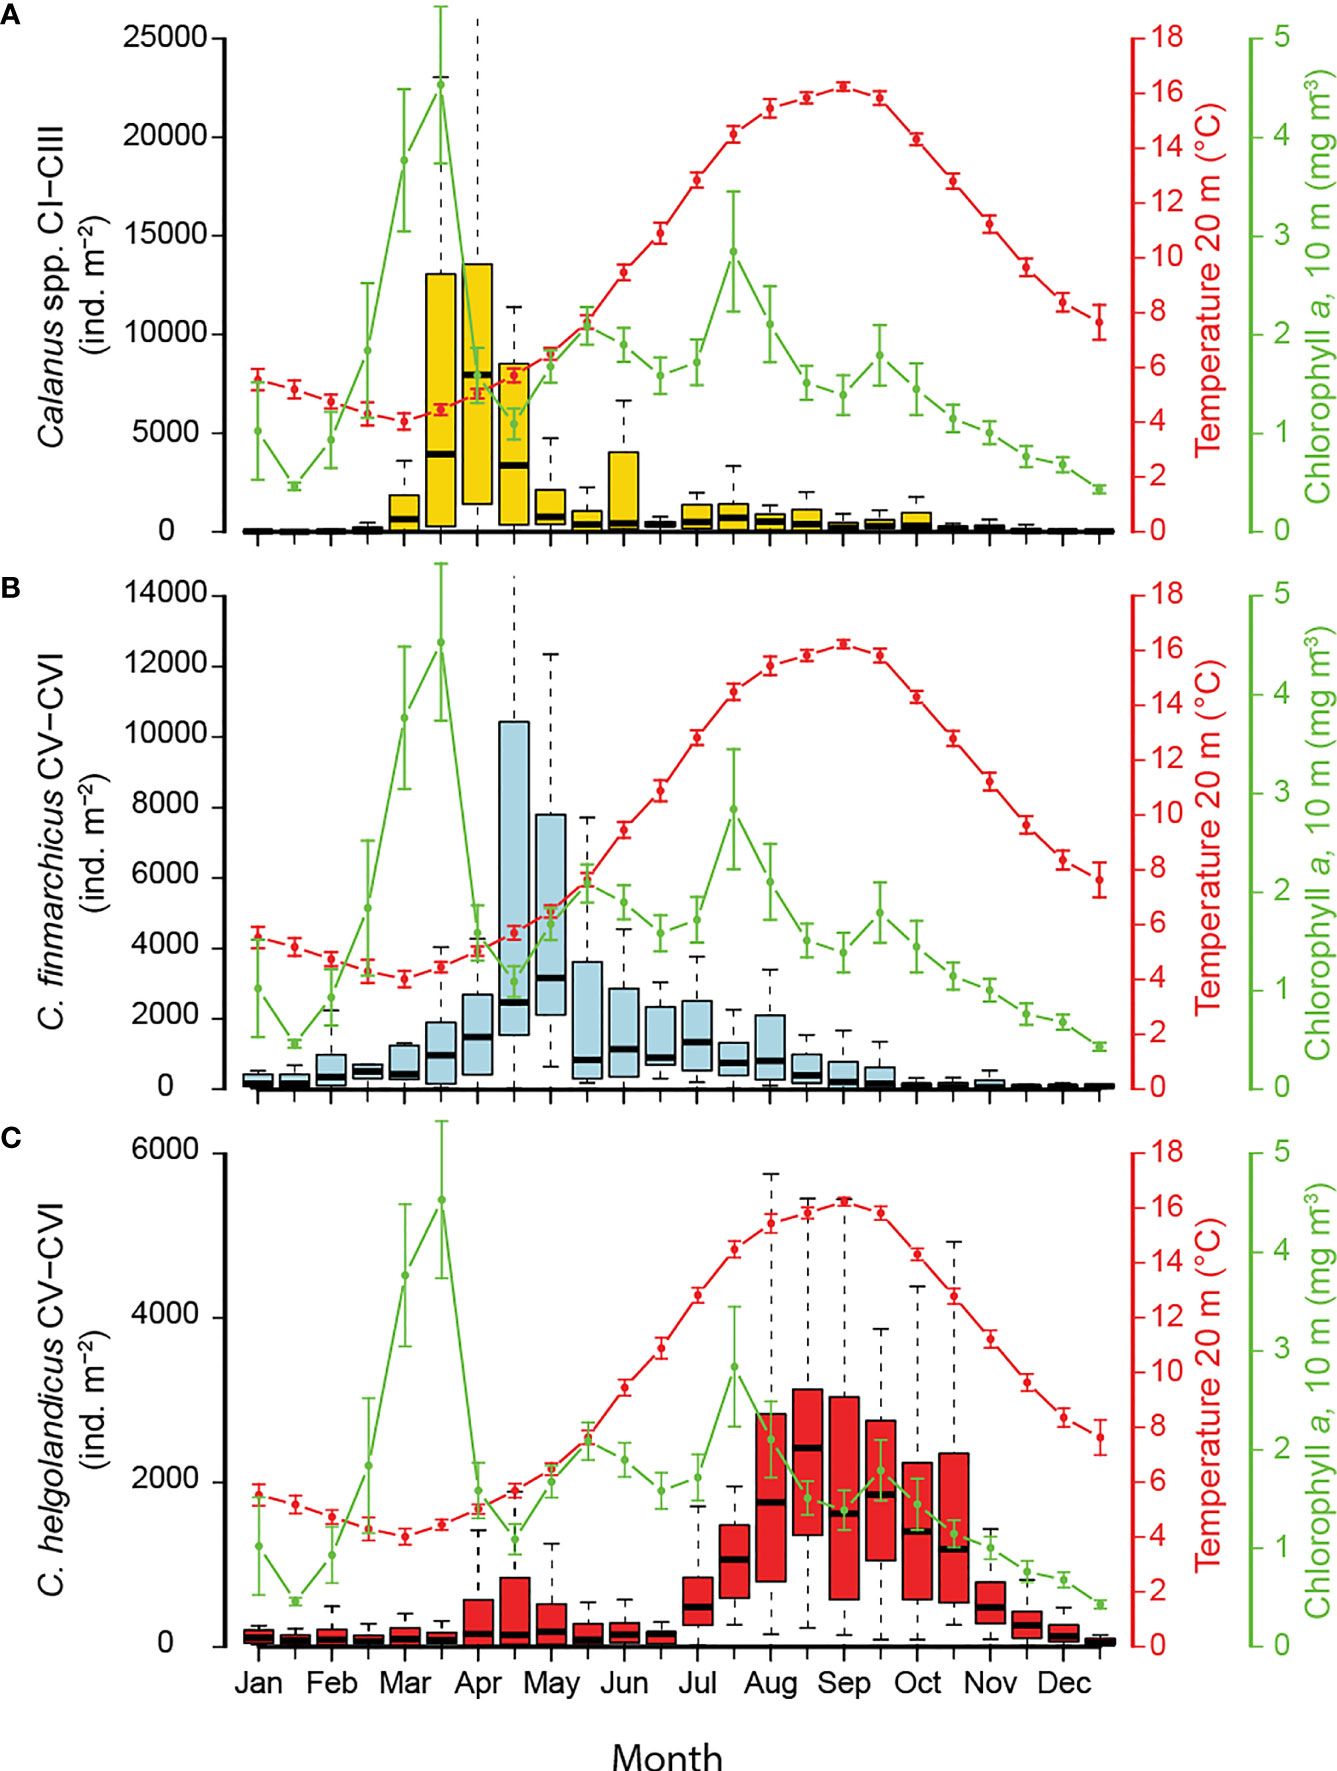
Figure 3 Seasonal pattern in abundances at 0-50 m depth of (A) Calanus spp. CI-CIII (B), C. finmarchicus CV-VI and (C) C. helgolandicus CV-VI. Lower and upper edges of boxes represent the 25 and 75 percentiles, and the horizontal lines the medians. Extreme observations outside the range of the whiskers are not shown. Seasonal variation in temperature (20 m, mean and standard error, SE) and Chl-a (10 m, mean and SE) on right axis. Data on temperature and Chl-a were obtained from the Norwegian Coastal Monitoring Programme.
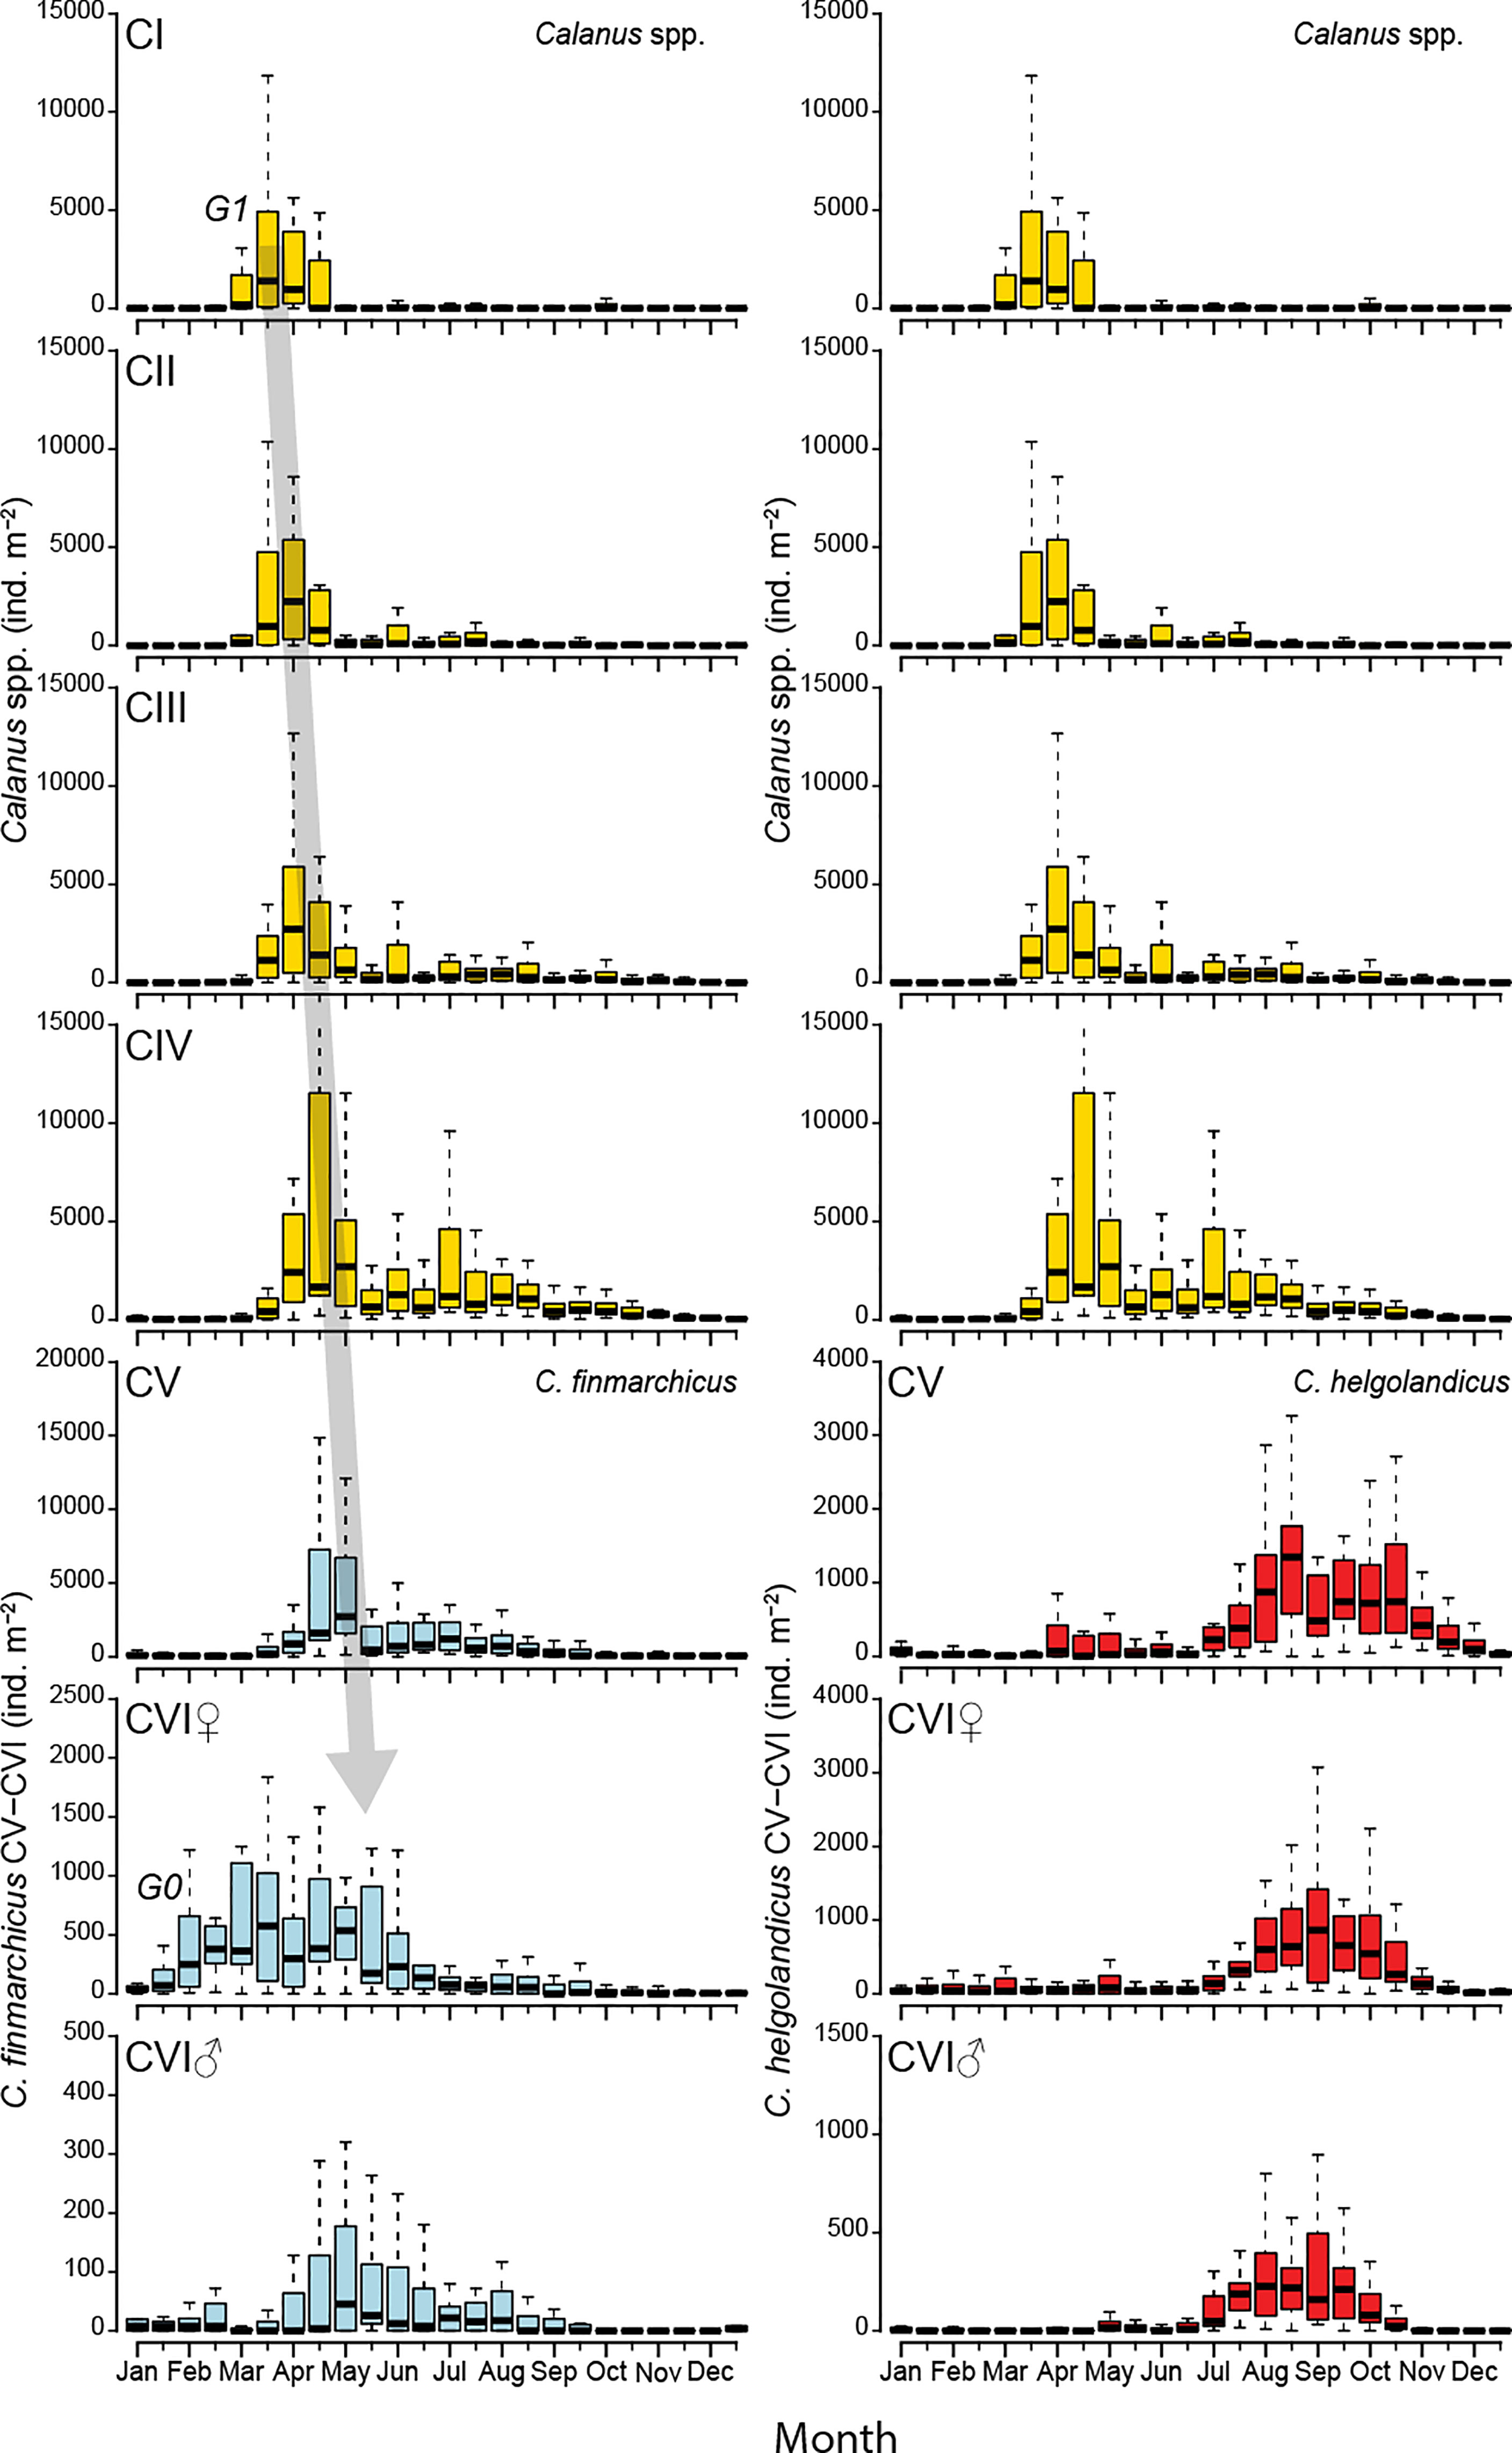
Figure 4 Boxplots of abundances of Calanus spp CI-IV (yellow), C. finmarchicus CV-VI (blue) and C. helgolandicus CV-VI (red) versus two-week period. Lower and upper edges of boxes represent the 25 and 75 percentiles, and the horizontal lines the medians. Extreme observations outside the range of the whiskers are not shown. Copepodite stages CI-IV were not identified to species but are included in both left- and right-hand panels to aid elucidation of stage and generation cycles for each species. The shadowed arrow indicates our suggested first new generation of C. finmarchicus of the year, G1; G0, overwintering population.
Young Calanus copepodites of stages CI-III generally appeared in late February (Figure 3A). These stages displayed a marked pulse that peaked from mid-March to mid-April (medians of ~ 3350-8000 ind. m-2, for the upper 50 m) and was strongly reduced by early May. This pulse of young copepodites belonging to the new generation of the year (G1) was well timed with the spring phytoplankton bloom, which occurred before the temperature in upper waters showed any notable increase. Still, the peak of these young copepodites showed a slight delay of about two weeks compared to the phytoplankton peak (Figure 3A).
Calanus finmarchicus of stage CV and adults (pooled) showed increasing numbers already from the beginning of January, a peak during mid-April to mid-May (~ 2500-3200 ind. m-2), and thereafter decreasing numbers (Figure 3B). Still, these older stages of C. finmarchicus remained present in moderate concentrations until early autumn. The overall distribution of these stages indicates that the older part of the C. finmarchicus population reached its peak about one month after the phytoplankton bloom had collapsed, and the population started to decrease about 4 months before the temperature had reached its maximum.
Calanus helgolandicus of stage CV and adults (pooled) were present throughout the year, though with their main occurrence during July-November with a long-lasting peak from about August to October (medians of ~ 1100-2400 ind. m-2, Figure 3C). The seasonal population distribution of older stages of C. helgolandicus mirrored the seasonal temperature cycle, with the highest abundances occurring when temperature was peaking. The highest abundance was at least one month delayed relative to the autumn phytoplankton bloom. Moderate increases of C. helgolandicus, however, were also noted in April-May when water-temperature was far lower (5-8°C).
Demography
Adult females of Calanus finmarchicus were practically absent from the station in winter until early January (Figure 4). Following a further modest increase in late January, the number of females rose markedly until reaching the annual maximum in late March (median of ~ 600 ind. m-2). Some variability in the spring abundances of adult females was evident, and in early May the concentrations were almost at the same level as in late March. Whether the spring distribution for abundance of C. finmarchicus adult females represents one single but somewhat irregular peak, or a composite of more peaks with differing timing is not clear (Figure 4). From mid-May the numbers decreased, and from July and for the rest of the year the levels were low (< 80 ind. m-2), except for a small increase in August. The seasonal development of the generations is carefully reviewed in the “Discussion” section.
Adult males of C. finmarchicus were present in low numbers at the station as early as January. Even if the medians were unchanged during January and February (8 ind. m-2), some years had higher abundances of males towards the end of February. (Figure 4). Thereafter the abundances generally remained at zero ind. m-2 or a very low level until March. The annual maximum of adult males occurred in the first half of May (median of 45 ind. m-2) (Figure 4). Male abundances then decreased, and remained at lower levels until mid-August, indicating a small new peak in July-early August. From October and for the rest of the year, C. finmarchicus adult males were practically absent.
C. finmarchicus copepodites of stage CV occurred in two annual peaks, the first peak very pronounced while the second peak far more subtle (Figure 4). CV were present in low numbers in winter (< 90 ind. m-2 during early September – mid April), their numbers thereafter increased rapidly to the annual maximum in early May (median of ~ 2700 ind. m-2). Abundances then fell abruptly to lower levels, thereafter increasing very slowly to reach a minor second peak in early July (median of ~1200 ind. m-2).
C. helgolandicus CV and adults displayed a rather synchronous seasonal pattern at the station. The species was present throughout the year and observed in low and variable numbers from January to July, with somewhat elevated occurrences of CV during April - early May being the most noticeable feature during the first half of the year (Figures 3 and 4). A simultaneous and strong increase in abundance of all three stages occurred from July to late August. C. helgolandicus CV reached its annual maximum (~1350 ind. m-2) in late August and showed elevated abundances until December. The peaks for adults occurred during August-September, followed by decreasing numbers, and low levels in November and December.
Calanus spp. stages CI-IV were present in low numbers during late December - late February (medians < 80 ind. m-2 of CI-IV pooled) (Figure 4). A strong increase in the abundance of CI occurred in early March, and the annual maximum for this stage was reached in the last half of March. Copepodite stages CII-III showed slightly delayed patterns compared to that of CI, with abundances peaking in the first half of April. Copepodite stages CI-III were present in variable though lower numbers also later in the season, but without showing clear and consistent secondary peaks. The seasonal pattern for stage CIV was similar to the patterns for CI-CIII, but with a little delay. Maximum abundances of stage CIV occurred in early April – early May. CIV also displayed considerable levels later in the year, with a rather wide secondary peak around July.
Interannual Trends in Abundance
The decomposition of the three aggregated Calanus time series (i.e., Calanus spp. stages CI-CIV, C. finmarchicus CV-VI and C. helgolandicus CV-VI) into trend and seasonal components is shown in Figure 5. Bars at the left side of each panel represent the relative scales of the components. The variation in size of the grey bars stems from the different scales of the respective plots; if the y-axis of each plot were set to the same range, the grey bars would have the same size. The short bar in the seasonal plots indicates that for all three time series, the seasonal cycle is explaining more of the observed variation in the data than the trend component (longer bars in the trend plots). The residuals (lowermost panels) show that there is substantial variation in the time series that is not explained by either the seasonal nor the long-term trend component (similar size to the grey bar of the ‘Data’ plot).
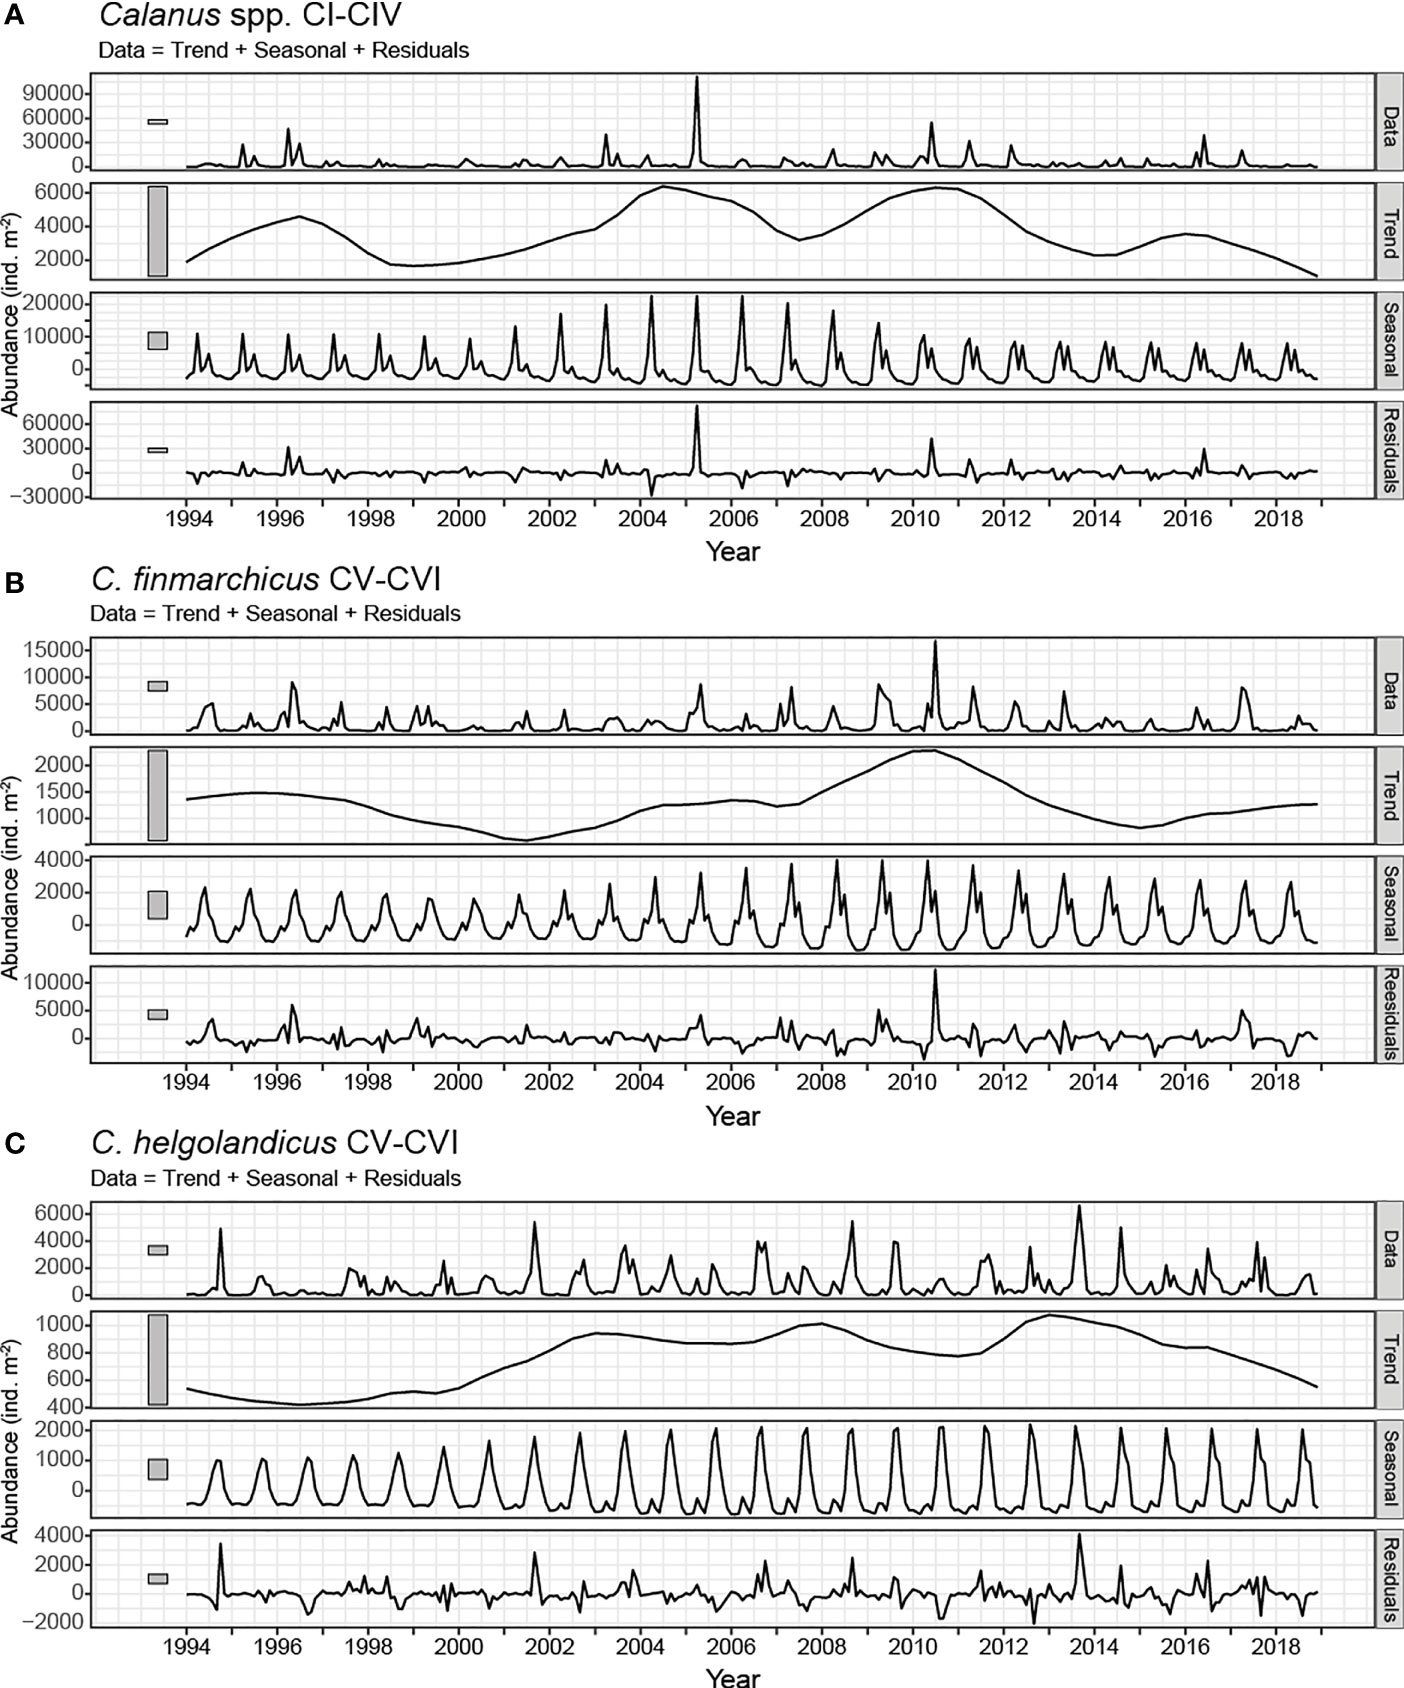
Figure 5 Seasonal and Trend time series decomposition using Loess with a 5-year trend window and 12-month seasonal window for the abundance of (A) Calanus spp. CI-IV, (B) C. finmarchicus CV-VI and (C) C. helgolandicus CV-VI. For each of the three time series shown (A–C), five sub-panels are presented. Original data are presented in the uppermost panels as monthly average abundances (Data). The Loess trend-cycle component (Trend) captures the interannual variability. The seasonal component (Season) shows the within-year variability throughout time. In the lowermost panel for each time series, the component representing the remainder is shown (Residuals), which is what is left after subtraction of the seasonal and the trend/cycle components from the original monthly abundances. Grey bars to the left of each panel show the relative scales of contribution of each component.
For Calanus spp. stages CI-IV no unidirectional trend was found. A period with high abundances was observed between 2003 and 2012, with a slight decrease in the middle of this period (Figure 5A, second panel). A few years with relatively high abundances were also observed at the beginning of the time series, whereas in the last decade the trend was generally decreasing.
Nor did we observe any unidirectional long-term trend for the abundance of C. finmarchicus CV-VI (Figure 5B, second panel). However, strong interannual variability was observed, with alternating periods of low and high densities. A period with high abundances was observed around 2009-2011, while much lower values were observed around the years 2001 and 2015. The annual abundances as represented by the trend for C. finmarchicus varied by a factor of 5 between high (~ 2010) and low (~2001) periods.
C. helgolandicus CV-VI (Figure 5C, second panel) had low abundance at the beginning of the time period. The population showed a marked increase from 2000 to 2003 and remained at a high level until 2014. The very last years, the levels decreased.
Interannual Variation in Seasonality
The seasonal trend-decomposition revealed that the seasonal component in all three time-series varied over time (Figure 5). Calanus spp. CI-IV (Figure 5A, third panel) showed a regular seasonal pattern, however with a period of higher amplitudes during 2002-2008. Since 2008 the amplitude of the peaks has declined. In C. finmarchicus CV-VI (Figure 5B, third panel) the spring peak dominated throughout the time series, however with varying amplitude. The variation in the amplitude mirrored the interannual trend in abundance, suggesting that the trend in C. finmarchicus is mainly related to variations in the spring abundances. In C. helgolandicus (CV-VI) one single annual peak was observed during the first years of the time-series (Figure 5C, third panel). However, since 2002 a bimodal seasonal pattern emerged, with a small spring peak, and a stronger peak later in the year with increasing amplitude.
Figure 6 shows the modelled seasonal dynamics over the years carried out with the GAM. This makes it possible to examine if there have been interannual changes in phenology and abundance during the time-period. The model suggests that there were two annual peaks in Calanus spp. CI-IV (deviance explained = 56.4%, Figures 6A, B). The seasonal timing of the spring peak has been consistent over the years, regularly occurring in mid-March. In contrast, the model suggests that the timing of the secondary peak has advanced by one month during 1994-2018, moving from July to June (Figure 6A).
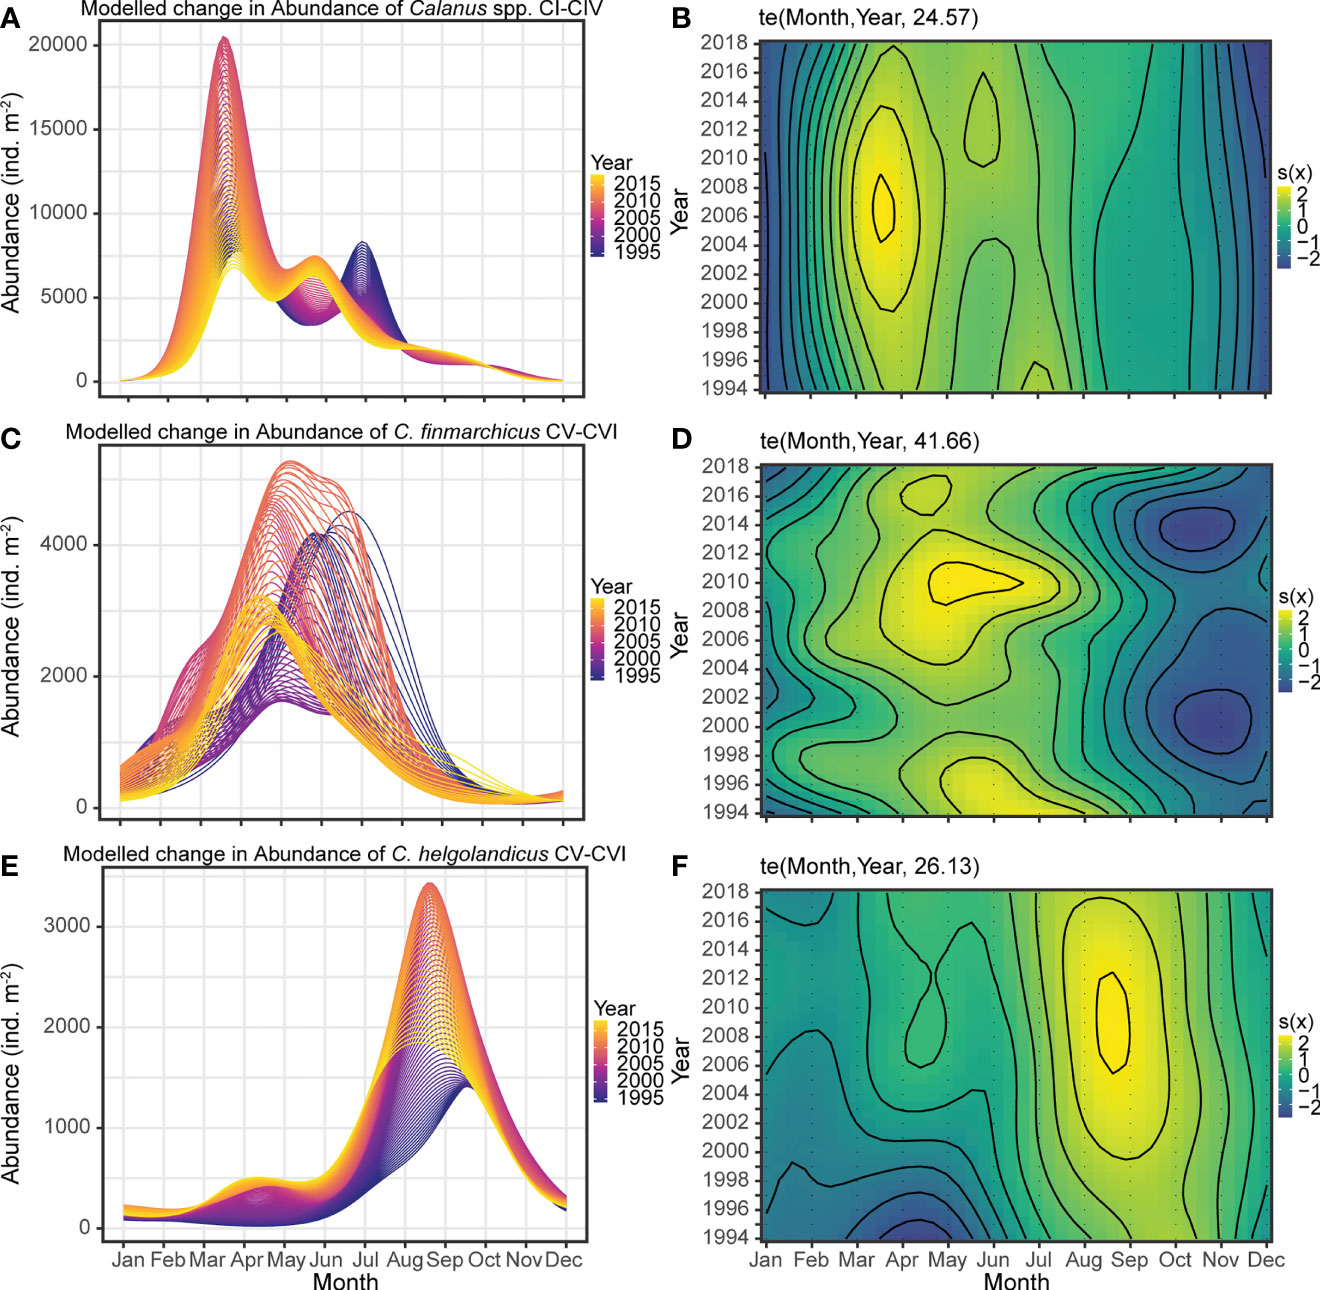
Figure 6 Modelled abundance of Calanus spp. stages CI-IV (A), C. finmarchicus CV-VI (C), and C. helgolandicus CV-VI (E) showing the within year variation throughout the study period. Model predictions are based on a tensor product smoother for the Month x Year interaction. Each line represents a year shown in a color gradient for better visualization. The smoother is also shown in the two-dimensional plane, with contours and color gradient denoting the intensity of the smoother effect, (B, D, F) for the three time series respectively.
One strong annual peak in C. finmarchicus CV-VI was predicted by the fitted model (deviance explained = 61.5%), with large interannual variability in abundances (Figures 6C, D). The fitted model suggests a gradual change in the timing of the annual peak in C. finmarchicus CV-VI, which has advanced by about one month during the time series.
A strong annual peak in C. helgolandicus CV-VI in autumn (August-September) was predicted by the model (deviance explained = 63.4%), with increasing abundances over the years (Figures 6E, F). Concurrent with the increasing abundances, the model indicates an earlier timing of the autumn peak over time, suggesting an advancement from mid-September to mid-August. Moreover, the model suggests that the seasonality of C. helgolandicus has changed from a unimodal to a bimodal pattern. In the early years of the time series, one single annual peak of C. helgolandicus was found, whereas after around 2002 an additional small peak appeared, occurring in mid-April. This is also evident from the time-series decomposition model shown in Figure 5C.
Discussion
This study presents the first in-depth description of the seasonal and interannual variability of Calanus finmarchicus and C. helgolandicus in northern Skagerrak. The two species co-occurred at this location throughout the year, but their seasonal maxima were separated in time. The annual peak in CV-VI of C. finmarchicus occurred in April-May in association with the phytoplankton spring bloom. In contrast, the same stages of C. helgolandicus had its annual maximum in August-September, well matched in time with the annual maxima in temperature, and also concurring with the late summer peak in chlorophyll. Similar to this finding, previous studies have demonstrated that in areas where the two species co-occur, they tend to be separated in time (Planque and Fromentin, 1996; Wilson et al., 2015). This has been interpreted as thermal niche differentiation between the two species, related to cooler temperatures earlier in the year and warmer temperatures later in the year (Helaouët and Beaugrand, 2007). In the present study, the annual maximum abundances of C. finmarchicus occurred at water temperatures 6-8°C while the peak in C. helgolandicus was found at 11-16°C. This is in agreement with previous observations of peak abundances of C. finmarchicus and C. helgolandicus at 0-9°C and 13-17°C respectively (Bonnet et al., 2005). Temperature has been found to be the most important factor influencing both spatial distributions and seasonality in both species (Planque and Fromentin, 1996; Montero et al., 2021). C. finmarchicus develops faster than C. helgolandicus at temperatures below 12°C, whereas C. helgolandicus develops faster than C. finmarchicus at temperatures above 13°C (Wilson et al., 2015). Based on model results, Møller et al. (2012) suggested that a temperature increase to above 11°C would trigger a shift from a C. finmarchicus to a C. helgolandicus dominated system. In line with this, we observed a seasonal shift at the Arendal station from C. finmarchicus to C. helgolandicus when temperatures reached 11°C in June. The seasonal variation in populations is not only related to temperature and food, but also to ocean circulation (Speirs et al., 2004). Young copepodites of C. finmarchicus have been shown to be transported into the North Sea from the north in surface layers during spring (Heath et al., 1999; Madden et al., 1999) while diapausing individuals enter the area during winter via the deep Norwegian Trench Atlantic Inflow (Gao et al., 2021; Figure 1). Furthermore, advective transport from warmer regions of the southern North Sea may contribute to the observed peak in C. helgolandicus (Planque and Fromentin, 1996; Wilson et al., 2016).
When co-occurring in time, the two species may also be separated in terms of their vertical distributions (Williams, 1985; Jonasdottir and Koski, 2011; Lindegren et al., 2020). Our data are based on depth-integrated samples from 50 m to the surface, and no information on vertical distributions are available from this site. Abundances of C. finmarchicus decreased to low numbers in July when surface temperatures reached >12°C. During the summer months it is likely that the species stayed below the thermocline where temperatures rarely exceeded 14°C. It is therefore possible that sampling from the uppermost 50 m may have caused some underestimation of the C. finmarchicus abundance during the later part of the year. Predation and descent to overwintering depths further off-shore may also contribute to the abrupt decline in July. Nevertheless, the observed seasonal cycle of C. finmarchicus at the Arendal station concurs with other studies from the northern North Sea where C. finmarchicus were found to start the descent for diapause in July and to be completely absent from the surface waters by September (Jonasdottir et al., 2005).
The here observed presence and increasing abundance of C. finmarchicus adults in January and February is in accordance with the timing of the termination of the overwintering period reported from the Northeast Atlantic (Østvedt, 1955; Melle et al., 2014). As younger copepodite stages were absent this early in the year, we suggest that C. finmarchicus adults present in January and February belong to the overwintering population (G0). The first individuals of the Calanus spp. CI peak in March and are probably the offspring from the adults of the overwintering generation observed in January/February, thus representing the first generation (G1) of C. finmarchicus. The further development of this first cohort is reflected in our data by the increase in C. finmarchicus CV and adults in April-May (Figure 4), which we believe also represent the first generation G1. This interpretation is supported by the expected developmental time of the different copepodite stages of C. finmarchicus (Corkett et al., 1986). At temperatures between 3.5 and 4°C (February-March), the estimated developmental times from eggs to CI are 26-28 days, suggesting that the first cohort of CI observed in early March were spawned in early February. The expected development time to CV is 55-60 days which agrees with the observed increase of CV in April.
Copepodite stages CI-IV were not identified to species in this study. However, based on the very low numbers of C. helgolandicus in early spring as well as the match in time with the following developmental stages, we interpret the majority of young copepodites observed March-April to be C. finmarchicus, while the second peak in July is a mixture of both species.
The timing of G1 at the Arendal station agrees well with previous studies from Skagerrak coastal water area (Båmstedt, 2000; Bagøien et al., 2000) but seems to be slightly earlier than reported for the Coastal Water further north off western Norway (Broms and Melle, 2007; Bagøien et al., 2012). We observed that stage CI started to increase markedly in early March, while stages CII and CIII showed the first strong increases about two weeks later in late March. In the Norwegian Coastal Current further north (62 - 70°N), the first strong increase in abundance of copepodites CI was observed from April, and the abundances of stages CI-III remained high until mid-June (Bagøien et al., 2012). Previous studies from coastal waters of northern Norway, have also reported the first generation of young copepodites to appear in April (Falkenhaug et al., 1997; Skreslet et al., 2000; Skjoldal et al., 2021). We conclude that the youngest copepodites of the G1 generation at the Arendal station (58°23′N) increase about one month earlier than has been reported for the coastal waters in the more northerly regions (north of 62°N). Broms and Melle (2007); Bagøien et al. (2012) and Skjoldal et al. (2021), all noted that young C. finmarchicus copepodites of the G1 generation had an earlier timing in coastal water compared to Atlantic Water, which was related to the earlier onset of the spring phytoplankton bloom in the stratified coastal waters (Bagøien et al., 2012). A possible explanation for the earlier timing of C. finmarchicus CI of G1 in Skagerrak coastal waters, compared to locations further north, is the earlier onset of the spring phytoplankton bloom at lower latitudes (Vikebø et al., 2012).
Our results suggest that C. finmarchicus produces one dominant annual generation (G1) at the Arendal station. The minor peak in CV observed in early July, and the increases in males and females in July-August may represent a smaller second generation (G2). Even if our data don’t show clear indications of more generations after that, more than two generations cannot be discarded. The first generation (G1) can be followed as one discrete cohort, while subsequent generation(s) were less clear. Considering the strong advective environment at the Arendal sampling site, the observation of a discrete G1 generation of C. finmarchicus is surprising. It has been suggested that discrete generations of C. finmarchicus are only produced in semi-enclosed localities (Aksnes and Magnesen, 1983) or at sites in close proximity to overwintering sites (Heath et al., 2000; Maar et al., 2013; Melle et al., 2014). In contrast, at locations more distant from overwintering sites, advective processes will lead to mixing of cohorts (Speirs et al., 2004), which hampers the interpretation of generations. C. finmarchicus is believed not to overwinter in the North Sea - Skagerrak in substantial numbers (Fransz et al., 1991; Heath et al., 1999; Madden et al., 1999). Nevertheless, overwintering aggregations are known to exist in the Norwegian Trench (Rees, 1949; Krause et al., 2003; Heath et al., 2004). Moreover, the Norwegian Trench is the major route of inflowing C. finmarchicus from the Norwegian Sea, (Backhaus et al., 1994; Heath et al., 1999; Gao et al., 2021) and diapausing C. finmarchicus are advected to the North Sea and Skagerrak by a deep inflow of Atlantic water, mainly during winter and early spring (Gao et al., 2021). The Arendal station is located on the northern slope of the Norwegian Trench which reaches its maximum depth (700 m) 40 km southeast of the monitoring station (Figure 2). The time for the appearance of the overwintering population (G0) in upper layers at the Arendal station was similar to what has been reported from other regions in the Norwegian Sea. We suggest that the proximity to the overwintering site in the Norwegian Trench enables the early spring invasion of G0 in February to this coastal area, and further that the observed spring cohort G1 of C. finmarchicus is the offspring of the overwintering stock originating from the Norwegian Trench.
C. finmarchicus has been found to complete 2-3 generations in the North Sea and Skagerrak (Båmstedt, 2000; Krause et al., 2003). We observed a small increase in CI-III in June-July, and somewhat elevated levels in C. finmarchicus CV and adults in July and August which may indicate a second generation (G2) of C. finmarchicus. However, the CI-III at this time of the year is likely a mixture of C. finmarchicus and C. helgolandicus. Moreover, Skagerrak is an advective system and some of the observed CV and adults may have been advected from the northern North Sea, or from nearby fjords. Females of G1 can continue to produce eggs for a month or more, and the developmental times of each stage will vary in relation to temperature and food availability (cf. Corkett et al., 1986). As a result, the secondary generations will be less synchronous and difficult to separate as cohorts.
For C. helgolandicus, the distinction of generations is less clear. A small increase in Calanus spp. CI-IV in July was followed by a peak in C. helgolandicus CV in late August, approximately two weeks prior to the annual peak in adults. Young copepodites were not identified to species, and the secondary peak in CI-CIV is probably a mixture of both C. finmarchicus and C. helgolandicus. The July peak in CI-CIV may represent a single cohort, indicating local production of C. helgolandicus in the area. Local populations of C. helgolandicus has been documented previously in Skagerrak and adjoining fjords (Bagøien et al., 2000; Jonasdottir et al., 2005). Yet, the large overlap in timing of the copepodite stages and adults strongly suggests that the population is also subject to advective transport from other areas, and there is probably considerable generational ‘smearing’ from both local and various up-stream locations. C. helgolandicus CV and adults were present all year at the Arendal site, although in low numbers during winter. It is generally believed that C. helgolandicus does not enter diapause but rather feed actively through winter (Williams and Conway, 1984; Bonnet et al., 2005). However, the overwintering behavior of this species remains unresolved (Wilson et al., 2015), as C. helgolandicus has been found to enter diapause in some locations (Hirche, 1983).
Interannual Trends
The Arendal time series revealed strong interannual variability in the abundances of C. finmarchicus and C. helgolandicus, however with clear interspecific differences in their temporal patterns. This suggests that the population sizes of the two species are affected by different mechanisms, as has previously been shown by Montero et al., (2021). While a generally increasing trend, apart from the very latest years with decreasing levels, was observed for C. helgolandicus, no unidirectional long-term trend was detected in C. finmarchichus. In fact, the abundance of C. finmarchicus has, based on expectations that this species is decreasing in the North Sea and Skagerrak area and retreating northwards (Beaugrand et al., 2002; Chust et al., 2014), remained surprisingly unchanged over time. However, intermittent shorter periods with high and low abundances were observed.
The lack of a consistent long-term trend in C. finmarchicus at this monitoring site is in contrast with previous studies based on CPR data, showing a long-term decrease in occurrences of this species in the North Sea during the last decades. Since the 1960s the biomass of C. finmarchicus has declined by 70% in the North Sea (Fromentin and Planque, 1996; Reid et al., 2003) which has been related to rising temperatures. The most dramatic reduction in C. finmarchicus occurred in the late 1980’s, often referred to as the North Sea regime shift (Beaugrand, 2004; Alvarez-Fernandez et al., 2012). The Arendal time series was initiated after the major decline of Calanus in the North Sea, and the abundances at this site prior to the 1980’s are not known. A reduction in the C. finmarchicus population at this site may thus have taken place prior to the initiation of the time-series presented here, which may explain why no consistent long-term decline was observed. If so, we might speculate that C. finmarchicus now is at a lower level at this site compared to the decades before the present time series.
A period with high abundances of C. finmarchicus was observed around 2009-2011. Comparing our data with the CPR data for the relevant standard area (B1) reveals similar patterns for C. finmarchicus in years after 1994 (Montero et al., 2021) with peak abundances in 2010. Similarly, a period with a higher ratio of C. finmarchicus to C. helgolandicus was reported from the North Atlantic CPR data during 2009-2011, which was related to years of low winter North Atlantic Oscillation index (NAO; Edwards et al., 2014). Indeed, the period of high abundances of C. finmarchicus reported here coincides with a period of strong negative NAO index in winters 2009/2010 and 2010/2011, reflected in below average SST in the NE Atlantic (González-Pola et al., 2020).
C. finmarchicus populations in the North Sea are not self-sustained and are highly dependent on the inflow from the Norwegian Sea (Heath et al., 1999; Gao et al., 2021). Variability in C. finmarchicus abundances in the North Sea have previously been linked to the NAO (Fromentin and Planque, 1996) which again is correlated with the inflow of water to the North Sea and the Skagerrak (Winther and Johannessen, 2006; Hjøllo et al., 2009). In the late 1980’s, this relationship broke down, which was explained by a decline in the overwintering stock in the southern Norwegian Sea and the Faroe Shetland Channel, and a northward shift of the species as a result of ocean warming (Heath et al., 1999; Reid et al., 2003). In the southern Norwegian Sea, a reduction in the abundance of C. finmarchicus and C. hyperboreus have been observed after 2003, and the abundances have remained at lower levels since then (Kristiansen et al., 2019; Skagseth et al., 2022). These changes have been attributed to reduced inflow of subarctic and arctic waters into the Norwegian Sea from west, which in turn has been linked to changes in the North Atlantic subpolar gyre (Kristiansen et al., 2019; Skagseth et al., 2022). However, the underlying mechanisms for the variations in C. finmarchicus population size in the North Sea and Skagerrak are still poorly understood and both large scale physical processes as well as local drivers need to be considered (Papworth et al., 2016). Recent studies suggest that the decoupling of NAO in the late 1980’s mainly occurred in western areas, while in the northeastern North Sea the fluctuations in C. finmarchicus remain related to NAO (Montero et al., 2021). In agreement with this, Gao et al. (2021) concluded that the inflow of C. finmarchicus biomass into the North Sea through the Norwegian Trench, accounted for 41% of the biomass in the North Sea and thus is a strong driver for the interannual variability of this species. Furthermore, Maar et al. (2013) suggested that the annual abundance of C. finmarchicus in the North Sea is sensitive to the degree of overwintering within the North Sea, because it allows individuals of this species to utilize the spring bloom more efficiently and independently of the timing and amount of oceanic inflow. It has also been suggested that the inflow of C. finmarchicus through the Norwegian Trench can facilitate favorable nursing conditions to the spring spawning North Sea cod (Huserbråten et al., 2018). The Norwegian Trench is thus of significance both as a gateway for the transport of Calanus to the area (Gao et al., 2021), as well as a habitat for local overwintering (Heath et al., 2004).
An increasing trend in the abundance of C. helgolandicus at the Arendal station was found until about 2013, being especially pronounced during 2000-2003. This is in accordance with numerous studies based on CPR data, reporting that this species has become more abundant and widely distributed in the North Sea over the past 50 years (Fromentin and Planque, 1996; Beaugrand, et al., 2002; Reid et al., 2003; Chust et al., 2014). Similar observations have been made at fixed point monitoring stations around the North Sea: At Helgoland (southern North Sea), C. helgolandicus has been increasing since the 1980’s, while in waters off Stonehaven (Scotland) an increase was not observed until 1999 (Bonnet et al., 2005). In contrast, Maud et al. (2015) found no temporal change in the abundance of C. helgolandicus at the Plymouth L4 site (English Channel) during 1988-2012. This suggests spatial differences in the dynamics of C. helgolandicus within the North Sea, implying that the species is more sensitive to environmental changes nearer the edge of its geographical range (Helaouët et al., 2013; Maar et al., 2013). The expansion of C. helgolandicus in the North Sea has been attributed to increased oceanic temperatures due to climate change (Reygondeau and Beaugrand, 2011) and temperature has been considered as the main factor affecting growth and population dynamics in C. helgolandicus (Møller et al., 2012; Montero et al., 2021). Sea temperatures in Skagerrak have increased by 1 C° since 1990 (Albretsen, 2012). We suspect that higher water temperatures have contributed to the increase in C. helgolandicus at this site.
Phenology
The present study indicates a shift in the phenology of Calanus spp. during the last 25 years at the northern Skagerrak study site. Since 1994 the annual autumn peak of Calanus spp. CI-IV seems to have advanced by about one month. In contrast, we observed no changes in the seasonal timing of the spring peak in Calanus spp. CI-IV. It should be kept in mind that the copepodite stages CI-IV were not identified to species, and the autumn peak was probably a mixture of both species.
Moreover, the models suggest an earlier timing of the annual peaks for both C. finmarchicus CV-VI and C. helgolandicus CV-VI. This is in line with studies reporting a shift towards earlier seasonal timing in a number of zooplankton taxa in the North Sea during the last decades (Edwards and Richardson, 2004; Mackas et al., 2012; Reygondeau et al., 2015). These changes have been related to rising temperatures, suggesting that plankton tend to follow an ‘earlier when warmer’ strategy (Mackas et al., 2012). Also, in the more northern Norwegian Sea, a small change in the timing of C. finmarchicus has been observed, where the spring peak was suggested to occur four days earlier (Dupont et al., 2017). The phenology of C. finmarchicus is strongly correlated with temperature (Mackas et al., 2012), and in the central North Sea the seasonal peak of this species has advanced by 10 days during 1958-2002 (Edwards and Richardson, 2004; Bonnet et al., 2005). Similarly, at Helgoland (southern North Sea), C. helgolandicus has shifted to an earlier timing by at least 1 month during the years 1975-2006 (Mackas et al., 2012). An earlier seasonal timing in Calanus species has been related to shorter development time with increasing temperatures (Cook et al., 2007) or to variations in the duration of the spring phytoplankton bloom (Aßmus et al., 2009).
Variations in timing and phenology of Calanus spp. may also be caused by advection of cohorts from other areas (Espinasse et al., 2018). The Arendal sampling site is located in a highly advective system, with a large degree of temporal variation (Rodhe, 1996). Consequently, advective supply of Calanus spp. to the site is expected to play an essential role in contributing to the observed temporal variations. However, despite the high temporal variability, spatial homogeneity has been documented for the area (Dahl and Johannessen, 1998). The observations made at the Arendal sampling site can thus be considered as representative for a larger area of the Skagerrak.
An important result of his study is the appearance of a small spring peak in C. helgolandicus at the Arendal station. The fitted models suggest a change in the seasonal pattern of C. helgolandicus, switching from a unimodal to a bimodal pattern around year 2002, when a small spring peak emerged. A similar change in the seasonality of C. helgolandicus has been described from other regions of the North Sea. Beare and McKenzie (1999) observed a change from one to two annual peaks in C. helgolandicus in the northern North Sea, where a small spring peak occurred during 1980-1999. In the western North Sea (Stonehaven time series), a small spring peak in C. helgolandicus developed during the late 1980’s (Bonnet et al., 2005; Wilson et al., 2015). Strand et al. (2020) reported spring occurrences of C. helgolandicus along a section in the northeastern North Sea based on CPR data from 2008-2016. Our study not only supports these findings, but also reveals that this spring peak appeared around the year 2002. We suggest that C. helgolandicus in the northeastern North Sea is approaching a seasonality reported as typical in more southerly areas (Bonnet et al., 2005).
The seasonal cycle of C. helgolandicus is mainly driven by the temperature regime, and different cycles have been observed for different areas (Bonnet et al., 2005). In warmer regions (southern North Sea and the Mediterranean), the peak in annual abundance occurs earlier in the year compared to the northern North Sea which is considered to be related to optimal temperature for fecundity and hatching (Bonnet et al., 2005; Wilson et al., 2016). Surprisingly, the small spring peak for C. helgolandicus at the Arendal station occurs in April-May when temperatures are below 8°C. Experimental studies suggest that C. helgolandicus is not able to develop from eggs to adults at these temperatures (Bonnet et al., 2009; Møller et al., 2012). The presence of C. helgolandicus at these low temperatures may indicate an adaption to lower temperatures as were suggested by Møller et al. (2012). However, the occurrence of C. helgolandicus in spring may also be explained by advective transport of spring populations from more southern and warmer regions in the North Sea. Analysis of possible relationships between the population dynamics and environmental conditions is outside the scope of this study. Whether the observed shifts in phenology is a response to changes in local conditions, or to large scale variations in advective processes will be addressed in future studies.
In order to reveal possible mechanisms behind phenological changes in the Calanus sibling species, further studies should consider detailed demographic data and multiple phenological indices. Moreover, extended sampling to full ocean depth, including the deeper areas of the Norwegian Trench, would provide a more complete picture of the Calanus populations in this area.
The observed changes in annual abundance and phenology of Calanus spp. at the Arendal station mainly took place around the years 2000 – 2005. During the same period a regime shift was identified in the North Sea (late 1990’s - early 2000’s; Alvarez-Fernandez et al., 2012; Beaugrand et al., 2014). Furthermore, several studies have suggested that major shifts took place in the coastal waters of the Norwegian Skagerrak in the early 2000’s, including a shift in stoichiometry (Frigstad et al., 2013), a change in the macroalgae community (Moy and Christie, 2012), and recruitment failure of coastal gadoid species (Johannessen et al., 2012). Even though this station is located at the shelf off the Norwegian coast and may thus not be representative for the larger North Sea, it might represent zooplankton changes that have taken place in Skagerrak and along the south coast of Norway. The present time-series may thus be more relevant indices, potentially explaining recruitment variability and failure in coastal fish populations, among others the decline in coastal cod populations (ICES, 2021).
Conclusions
This study presents the first comparative description of phenology and long-term variability of two co-occurring, congeneric species of Calanus in northern Skagerrak. The study demonstrates that both species produce more than one generation at this site, but only the first generation of C. finmarchicus could be followed as a single cohort. The phenologies of the two species were found to be separated in time, with C. finmarchicus dominating in spring and C. helgolandicus in autumn. Here we provide evidence that the phenologies of both Calanus species have changed over the last 25 years at this site. Since 1994 the timing of the annual peaks for older stages of both C. finmarchicus and C. helgolandicus have advanced by about one month. Moreover, the seasonal pattern of C. helgolandicus, has switched from a unimodal to a bimodal pattern, with a small additional peak also appearing in spring. Our results revealed a generally increasing trend in the abundance of C. helgolandicus at this site. In contrast, the abundance of C. finmarchicus was variable with no unidirectional long-term trend over the last 25 years.
We propose that the phenologies of the two species are separated in time due to different temperature preferences, which supports the occurrence of environmental niche separation between closely related copepod species. However, the observed changes in phenology of C. helgolandicus suggests that the species is approaching a seasonality reported as typical in more southerly areas, indicating an ability for species to adapt to changing environments. Variations in the timing of these ecologically important copepods, may have implications for higher trophic levels such as the survival of early life stages of fish. Our findings suggests that the proximity to the Norwegian Trench enables the early spring invasion of the overwintering population of C. finmarchicus to the Skagerrak coastal area. We therefore conclude that the Norwegian Trench influences the demography and the abundance of C. finmarchicus in this coastal area, both as a gateway for the advective supply, and as a habitat for local overwintering. The contrasting long term trends in abundances of the two species suggest that the population sizes of C. finmarchicus and C. helgolandicus are affected by different drivers, which underlines that both large-scale climatic processes as well as local biological drivers should be considered in order to understand the complex underlying mechanisms behind the variability.
Data Availability Statement
The original contributions presented in the study are included in the article/supplementary material. Further inquiries can be directed to the corresponding author.
Author Contributions
TF, CB, and EB were responsible for writing the manuscript. TF and EB compiled and organized the database. NN performed the time series analysis. EB, NN, and TF made figures and maps. All co-authors contributed substantially to the interpretation of the data and writing of the manuscript and gave final approval for publication.
Funding
This study was supported by the “CoastRisk” project (No. 299554/F40) and the “Sustainable harvesting in the Norwegian Sea and adjacent ecosystems” project (No. 299554), both funded by the Research Council of Norway (RCN). An earlier part of this study was supported by the RCN through projects RECNOR (No. 178 679/S40) and ECCO (No. 200508). The monitoring at Arendal Station 2 is operated by the Institute of Marine Research, partly funded by the Norwegian Environment Agency.
Conflict of Interest
The authors declare that the research was conducted in the absence of any commercial or financial relationships that could be construed as a potential conflict of interest.
Publisher’s Note
All claims expressed in this article are solely those of the authors and do not necessarily represent those of their affiliated organizations, or those of the publisher, the editors and the reviewers. Any product that may be evaluated in this article, or claim that may be made by its manufacturer, is not guaranteed or endorsed by the publisher.
Acknowledgments
We thank the many colleagues at the IMR Flødevigen Research Station who have been collecting and processing samples from Arendal Station 2 since 1994. Special thanks to Lena Omli for establishing the zooplankton time-series. We thank Lena Omli, Signe Johannessen, Jon Rønning and Gaston Aguirre for enumeration and species identifications of Calanus. The authors are grateful to Dr. Maud Alix for assistance with the figures. We also thank the referees for their constructive reviews that helped to improve the final version of the manuscript.
References
Aßmus J., Melle W., Tjøstheim D., Edwards M. (2009). Seasonal Cycles and Long-Term Trends of Plankton in Shelf and Oceanic Habitats of the Norwegian Sea in Relation to Environmental Variables. Deep. Sea. Res. (Part. II. Top. Stud. Oceanogr.) 56, 1895–1909. doi: 10.1016/j.dsr2.2008.11.004
Aksnes D. L., Magnesen T. (1983). Distribution, Development, and Production of Calanus Finmarchicus (Gunnerus) in Lindåspollene, Western Norway 1979. Sarsia 68, 195–207. doi: 10.1080/00364827.1983.10420572
Albretsen J., Aure J., Sætre R., Danielssen D. S. (2012). Climatic Variability in the Skagerrak and Coastal Waters of Norway. ICES. J. Mar. Sci. 69, 758–763. doi: 10.1093/icesjms/fsr187
Alvarez-Fernandez S., Lindeboom H., Meesters E. (2012). Temporal Changes in Plankton of the North Sea: Community Shifts and Environmental Drivers. Mar. Ecol. Prog. Ser. 462, 21–38. doi: 10.3354/meps09817
Arnott S. A., Ruxton G. D. (2002). Sandeel Recruitment in the North Sea: Demographic, Climatic and Trophic Effects. Mar. Ecol. Prog. Ser. 238, 199–210. doi: 10.3354/meps238199
Backhaus J. O., Harms I. H., Krause M., Heath M. R. (1994). An Hypothesis Concerning the Space-Time Succession of Calanus Finmarchicus in the Northern North Sea. ICES. J. Mar. Sci. 54, 169–180. doi: 10.1006/jmsc.1994.1018
Bagøien E., Kaartvedt S., Øverås S. (2000). Seasonal Vertical Migrations of Calanus Spp. In Oslofjorden. Sarsia 85, 299–311. doi: 10.1080/00364827.2000.10414581
Bagøien E., Melle W., Kaartvedt S. (2012). Seasonal Development of Mixed Layer Depths, Nutrients, Chlorophyll and Calanus Finmarchicus in the Norwegian Sea - A Basin-Scale Habitat Comparison. Prog. Oceanogr. 103, 58–79. doi: 10.1016/j.pocean.2012.04.014
Båmstedt U. (2000). Life Cycle, Seasonal Vertical Distribution and Feeding of Calanus Finmarchicus in Skagerrak Coastal Water. Mar. Biol. 137, 279–289. doi: 10.1007/s002270000337
Batten S. D., Clark R., Flinkman J., Hays G. C., John E., John A. W. G., et al. (2003). CPR Sampling: The Technical Background, Materials and Methods, Consistency and Comparability. Prog. Oceanogr. 58, 193–215. doi: 10.1016/j.pocean.2003.08.004
Beare D., McKenzie E. (1999). Temporal Patterns in the Surface Abundance of Calanus Finmarchicus and C. Helgolandicus in the Northern North Sea 1958–1996 Inferred From Continuous Plankton Recorder Data. Mar. Ecol. Prog. Ser. 190, 241–251. doi: 10.3354/meps190241
Beaugrand G. (2004). The North Sea Regime Shift: Evidence, Causes, Mechanisms and Consequences. Prog. Oceanogr. 60, 245–262. doi: 10.1016/j.pocean.2004.02.018
Beaugrand G., Brander K. M., Lindley J. A., Souissi S., Reid P. C. (2003). Plankton Effect on Cod Recruitment in the North Sea. Nature 426, 661–664. doi: 10.1038/nature02164
Beaugrand G., Harlay X., Edwards M. (2014). Detecting Plankton Shifts in the North Sea: A New Abrupt Ecosystem Shift Between 1996 and 2003. Mar. Ecol. Prog. Ser. 502, 85–104. doi: 10.3354/meps10693
Beaugrand G., Reid P. C., Ibanez F., Lindley J. A., Edwards M. (2002). Reorganization of North Atlantic Marine Copepod Biodiversity and Climate. Science 296, 1692–1693. doi: 10.1126/science.1071329
Bonnet D., Harris R. P., Yebra L., Guilhaumon F., Conway D. V. P., Hirst A. G. (2009). Temperature Effects on Calanus Helgolandicus (Copepoda: Calanoida) Development Time and Egg Production. J. Plankton. Res. 31, 31–44. doi: 10.1093/plankt/fbn099
Bonnet D., Richardson A., Harris R., Hirst A., Beaugrand G., Edwards M., et al. (2005). An Overview of Calanus Helgolandicus Ecology in European Waters. Prog. Oceanogr. 65, 1–53. doi: 10.1016/j.pocean.2005.02.002
Broms C., Melle W. (2007). Seasonal Development of Calanus Finmarchicus in Relation to Phytoplankton Bloom Dynamics in the Norwegian Sea. Deep. Sea. Res. II. 54, 2760–2775. doi: 10.1016/j.dsr2.2007.08.021
Chust G., Castellani C., Licandro P., Ibaibarriaga L., Sagarminaga Y., Irigoien X. (2014). Are Calanus Spp. Shifting Poleward in the North Atlantic? A Habitat Modelling Approach. ICES. J. Mar. Sci. 71, 241–253. doi: 10.1093/icesjms/fst147
Cleveland R. B., Cleveland W. S., McRae J. E., Terpenning I. J. (1990). STL: A Seasonal-Trend Decomposition Procedure Based on Loess. J. Off. Stat 6 (1), 3–33.
Conover R. J. (1988). Comparative Life Histories in the Genera Calanus and Neocalanus in High Latitudes of the Northern Hemisphere. Hydrobiologia 167/168, 127–142. doi: 10.1007/BF00026299
Cook K. B., Bunker A., Hay S., Hirst A. G., Speirs D. C. (2007). Naupliar Development Times and Survival of the Copepods Calanus Helgolandicus and Calanus Finmarchicus in Relation to Food and Temperature. J. Plankton. Res. 29, 757–767. doi: 10.1093/plankt/fbm056
Corkett C. J., McLaren I. A., Sevigny J. M. (1986). The Rearing of the Marine Calanoid Copepods Calanus Finmarchicus (Gunnerus), C. Glacialis Jashnov and C. Hyperboreus Kroyer With Comment on the Equiproportional Rule. Syllogeus 58, 539–546.
Dahl E., Bagøien E., Edvardsen B., Stenseth N. C. (2005). The Dynamics of Chrysochromulina Species in the Skagerrak in Relation to Environmental Conditions. J. Sea. Res. 54, 15–24. doi: 10.1016/j.seares.2005.02.004
Dahl E., Johannessen T. (1998). Temporal and Spatial Variability of Phytoplankton and Chlorophyll a: Lessons From the South Coast of Norway and the Skagerrak. J. Mat. Sci. 55, 680–687. doi: 10.1006/JMSC.1998.0401
Dupont N., Bagøien E., Melle W. (2017). Inter-Annual Variability in Spring Abundance of Adult Calanus finmarchicus From the Overwintering Population in the Southeastern Norwegian Sea. Prog. Oceanogr. 152, 75–85. doi: 10.1016/j.pocean.2017.02.004
Durant J. M., Hjermann D.Ø., Falkenhaug T., Gifford D. J., Naustvoll L. J., Sullivan B. K., et al. (2013). Extension of the Match-Mismatch Hypothesis to Predator-Controlled Systems. Mar. Ecol. Prog. Ser. 474, 43–52. doi: 10.3354/meps10089
Edwards M., Helaouët P., Johns D. G., Batten S., Beaugrand G., Chiba S., et al. (2014). “Global Marine Ecological Status Report: Results From the Global CPR Survey 2012/2013,” in SAHFOS Technical Report, vol. 10. (Plymouth, U.K: Sir Alister Hardy Foundation for Ocean Science), 1–37.
Edwards M., Richardson A. (2004). Impact of Climate Change on Marine Pelagic Phenology and Trophic Mismatch. Nature 430, 881–884. doi: 10.1038/nature02808
Espinasse M., Halsband C., Varpe Ø., Gislason A., Gudmundsson K., Falk-Petersen S., et al. (2018). Interannual Phenological Variability in Two North-East Atlantic Populations of. Calanus. Finmarchicus. Mar. Biol. Res. 14 (7), 752–767. doi: 10.1080/17451000.2018.1506135
Falkenhaug T., Tande K., Timonin A. (1997). Spatio-Temporal Variations in the Copepod Community in Malangen, Northern Norway. J. Plankton. Res. 19, 449–468. doi: 10.1093/plankt/19.4.449
Falk-Petersen S., Mayzaud P., Kattner G., Sargent J. R. (2009). Lipids and Life Strategy of Arctic Calanus. Mar. Biol. Res. 5, 18–39. doi: 10.1080/17451000802512267
Fasiolo M., Nedellec R., Goude Y., Wood S. N. (2020). Scalable Visualization Methods for Modern Generalized Additive Models. J. Comput. Graph. Stat. 29 (1), 78–86. doi: 10.1080/10618600.2019.1629942
Fleminger A., Hulsemann K. (1977). Geographical Range and Taxonomic Divergence in North Atlantic Calanus (C. Helgolandicus, C. Finmarchicus and C. Glacialis). Mar. Biol. 40, 233–248. doi: 10.1007/BF00390879
Fransz H. G., Colebrook J. M., Gamble J. C., Krause M. (1991). The Zooplankton of the North Sea. Neth. J. Sea. Res. 28, 1–52. doi: 10.1016/0077-7579(91)90003-j
Frigstad H., Andersen T., Hessen D. O., Jeansson E., Skogen M., Naustvoll L. J., et al. (2013). Long-Term Trends in Carbon, Nutrients and Stoichiometry in Norwegian Coastal Waters: Evidence of a Regime Shift. Prog. Oceanogr. 111, 113–124. doi: 10.1016/j.pocean.2013.01.006
Fromentin J. M., Planque B. (1996). Calanus and Environment in the Eastern North Atlantic. II. Influence of the North Atlantic Oscillation on C. Finmarchicus and C. Helgolandicus. Mar. Ecol. Prog. Ser. 134, 111–118. doi: 10.3354/meps134111
Frost B. W. (1974). Calanus Marshallae, a New Species of Calanoid Copepod Closely Allied to the Sibling Species C. Finmarchicus and C. Glacialis. Mar. Biol. 26, 77–99. doi: 10.1007/BF00389089
Furnes G. K., Hackett B., Sætre R. (1986). Retroflection of Atlantic Water in the Norwegian Trench. Deep. Sea. Res. Part A. Oceanogr. Res. Pap. 33, 247–265. doi: 10.1016/0198-0149(86)90121-4
Gao S., Hjøllo S. S., Falkenhaug T., Strand E., Edwards M., Skogen M. (2021). Overwintering Distribution, Inflow Patterns and Sustainability of Calanus Finmarchicus in the North Sea. Prog. Oceanogr. 194, 102567. doi: 10.1016/j.pocean.2021.102567
González-Pola C., Larsen K. M. H., Fratantoni P., Beszczynska-Möller A. (2020). ICES Report on Ocean Climate 2019. ICES. Coop. Res. Rep. 350, 136. doi: 10.17895/ices.pub.7537
Hastie T. J., Tibshirani R. J. (1990). Generalized Additive Models (Boca Raton: Chapman & Hall/CRC), 392.
Heath M. R. (2007). The Consumption of Zooplankton by Early Life Stages of Fish in the North Sea. ICES. J. Mar. Sci. 64, 1650–1663. doi: 10.1093/icesjms/fsm156
Heath M. R., Astthorsson O. S., Dunn J., Ellertsen B., Gaard E., Gislason A., et al. (2000). Comparative Analysis of Calanus Finmarchicus Demography at Locations Around the Northeast Atlantic. ICES. J. Mar. Sci. 57, 1562–1580. doi: 10.1006/jmsc.2000.0950
Heath M. R., Backhaus J. O., Richardson K., McKenzie E., Slagstad D., Beare D., et al. (1999). Climate Fluctuations and the Spring Invasion of the North Sea by Calanus Finmarchicus. Fish. Oceanogr. 8, 163–176. doi: 10.1046/j.1365-2419.1999.00008.x
Heath M. R., Boyle P. R., Gislason A., Gurney W. S. C., Hay S. J., Head E. J. H., et al. (2004). Comparative Ecology of Overwintering Calanus Finmarchicus in the Northern North Atlantic, and Implications for Life Cycle Patterns. ICES. J. Mar. Sci. 61 (4), 698–708. doi: 10.1016/j.icesjms.2004.03.013
Helaouët P., Beaugrand G. (2007). Macroecology of Calanus Finmarchicus and C. Helgolandicus in the North Atlantic Ocean and Adjacent Seas. Mar. Ecol. Prog. Ser. 345, 147–165. doi: 10.3354/meps06775
Helaouët P., Beaugrand G., Reid P. C. (2011). Macrophysiology of Calanus Finmarchicus in the North Atlantic Ocean. Prog. Oceanogr. 91, 217–228. doi: 10.1016/j.pocean.2010.11.003
Helaouët P., Beaugrand G., Edwards M. (2013). Understanding Long-Term Changes in Species Abundance Using a Niche-Based Approach. PloS One 8, e79186. doi: 10.1371/journal.pone.0079186
Hirche H. J. (1983). Overwintering of C. Finmarchicus and C. Helgolandicus. Mar. Ecol. Prog. Ser. 11, 281–290. doi: 10.3354/meps011281
Hirche H. J., Brey T., Niehoff B. (2001). A High-Frequency Time Series at Ocean Weather Ship Station M (Norwegian Sea): Population Dynamics of Calanus Finmarchicus. Mar. Ecol. Prog. Ser. 219, 205–219. doi: 10.3354/meps219205
Hjøllo S. S., Skogen M. D., Svendsen E. (2009). Exploring Currents and Heat Within the North Sea Using a Numerical Model. J. Mar. Syst. 78, 180–192. doi: 10.1016/j.jmarsys.2009.06.001
Huserbråten M. B. O., Moland E., Albretsen J. (2018). Cod at Drift in the North Sea. Prog. Oceanogr. 167, 116–124. doi: 10.1016/j.pocean.2018.07.005
ICES (2021). Report of the Working Group on the Assessment of Demersal Stocks in the North Sea and Skagerrak (WGNSSK). ICES. Sci. Rep. 3 (66), 988. doi: 10.17895/ices.pub.8211
Jaschnov W. A. (1970). Distribution of Calanus Species in the Seas of the Northern Hemisphere. Internat. Rev. Der. Gesamt. Hydrobiol. Und. Hydrograph. 55, 197–212. doi: 10.1002/iroh.19700550203
Johannessen T., Dahl E., Falkenhaug T., Naustvoll L. J. (2012). Concurrent Recruitment Failure in Gadoids and Changes in the Plankton Community Along the Norwegian Skagerrak Coast After 2002. ICES 69, 795–801. doi: 10.1093/icesjms/fsr194
Jónasdóttir S. H., Koski M. (2011). Biological Processes in the North Sea: Comparison of Calanus Helgolandicus and Calanus Finmarchicus Vertical Distribution and Production. J. Plankton. Res. 33, 85–103. doi: 10.1093/plankt/fbq085
Jonasdottir S. H., Trung N., Hansen F., Gärtner S. (2005). Egg Production and Hatching Success in the Calanoid Copepods Calanus Helgolandicus and Calanus Finmarchicus in the North Sea From March to September 2001. J. Plankton. Res. 27, 1239–1259. doi: 10.1093/plankt/fbi091
Krause M., Fock H., Greve W., Winkler G. (2003). North Sea Zooplankton: A Review. Senckenb. Marit. 33, 71–204. doi: 10.1007/BF03043048
Kristiansen I., Hjalmar H., Petursdottir H., Gislason A., Broms C., Melle W., et al. (2019). Decreased Influx of Calanus Spp. Into the Southwestern Norwegian Sea Since 2003. Deep. Sea. Res. Part I. 149, 103048. doi: 10.1016/j.dsr.2019.05.008
Lindegren M., Thomas M. K., Jónasdóttir S., Nielsen T. G., Munk P. (2020). Environmental Niche Separation Promotes Coexistence Among Ecologically Similar Zooplankton Species—North Sea Copepods as a Case Study. Limnol. Oceanogr. 65, 545–556. doi: 10.1002/lno.11322
Lindeque P. K., Hay S. J., Heath M. R., Ingvarsdottir A., Rasmussen J., Smerdon G. R., et al. (2006). Integrating Conventional Microscopy and Molecular Analysis to Analyse the Abundance and Distribution of Four Calanus Congeners in the North Atlantic. J. Plankton. Res. 2, 221–238. doi: 10.1007/BF03043048
Møller E. F., Maar M., Jónasdóttir S. H., Gissel Nielsen T., Tönnesson K. (2012). The Effect of Changes in Temperature and Food on the Development of Calanus Finmarchicus and Calanus Helgolandicus Populations. Limnol. Oceanogr. 57, 211–220. doi: 10.4319/lo.2012.57.1.0211
Maar M., Møller E. F., Gürkan Z., Jonasdottir S. H., Nielsen T. G. (2013). Sensitivity of Calanus Spp. Copepods to Environmental Changes in the North Sea Using Life-Stage Structured Models. Prog. Oceanogr. 111, 24–37. doi: 10.1016/j.pocean.2012.10.004
Mackas D. L., Greve W., Edwards M., Chiba S., Tadokoro K., Eloire D., et al. (2012). Changing Zooplankton Seasonality in a Changing Ocean: Comparing Time Series of Zooplankton Phenology. Prog. Oceanogr. 97–100, 31–62. doi: 10.1016/j.pocean.2011.11.005
Madden H., Beare D., Heath M. R., Fraser J. G., Gallego A. (1999). The Spring/Early Summer Distribution of Calanus Spp. In the Northern North Sea and Adjacent Areas. Fish. Oceanogr. 8, 138–152. doi: 10.1046/j.1365-2419.1999.00006.x
Maud J. L., Atkinson A., Hirst A. G., Lindeque P. K., Widdicombe C. E., Harmer R. A., et al. (2015). How Does Calanus Helgolandicus Maintain Its Population in a Variable Environment? Analysis of a 25-Year Time Series From the English Channel. Prog. Oceanogr. 137, 513–523. doi: 10.1016/j.pocean.2015.04.028
Melle W., Runge J., Head E., Plourde S., Castellani C., Licandro P., et al. (2014). The North Atlantic Ocean as Habitat for Calanus Finmarchicus: Environmental Factors and Life History Traits. Prog. Oceanogr. 129, 244–284. doi: 10.1016/j.pocean.2014.04.026
Montero J. T., Lima M., Estay S. A., Rezende E. L. (2021). Spatial and Temporal Shift in the Factors Affecting the Population Dynamics of Calanus Copepods in the North Sea. Glob. Change. Biol. 27, 576–586. doi: 10.1111/gcb.15394
Moy F. E., Christie H. (2012). Large-Scale Shift From Sugar Kelp (Saccharina Latissima) to Ephemeral Algae Along the South and West Coast of Norway. Mar. Biol. Res. 8 (4), 309–321. doi: 10.1080/17451000.2011.637561
Munk P., Nielsen T. (1994). Trophodynamics of the Plankton Community at Dogger Bank: Predatory Impact by Larval Fish. J. Plankton. Res. 16, 1225–1245. doi: 10.1093/plankt/16.9.1225
O'Hara-Wild M., Hyndman R., Wang E., Caceres G. (2021). Fable: Forecasting Models for Tidy Time Series (R package version 0.3.1). Available at: https://CRAN.R-project.org/package=fable.
Østvedt O. J. (1955). Zooplankton Investigations From Weather-Ship M in the Norwegian Sea 1948–49. Hvalrådets. Skrift. 40, 1–93.
Otto L., Zimmerman J. T. F., Furnes G. K., Mork M., Sætre R., Becker G. (1990). Review of the Physical Oceanography of the North Sea. Neth. J. Sea. Res. 26, 161– 238. doi: 10.1016/0077-7579(90)90091-T
Papworth D. J., Marini S., Conversi A. (2016). A Novel, Unbiased Analysis Approach for Investigating Population Dynamics: A Case Study on Calanus Finmarchicus and Its Decline in the North Sea. PloS One 11 (7), e0158230. doi: 10.1371/journal.pone.0158230
Planque B., Fromentin J. M. (1996). Calanus and Environment in the Eastern North Atlantic. I. Spatial and Temporal Patterns of C. Finmarchicus and C. Helgolandicus. Mar. Ecol. Prog. Ser. 134, 101–109. doi: 10.3354/meps134101
Planque B., Taylor A. H. (1998). Long-Term Changes In Zooplankton and the Climate of the North Atlantic. ICES J. Mar. Sci. 55, 644–654. doi: 10.3354/meps134101
R Core Team (2021). R: A Language and Environment for Statistical Computing (Vienna, Austria: R Foundation for Statistical Computing). Available at: https://www.R-project.org/.
Rees C. B. (1949). Continuous Plankton Records: The Distribution of Calanus Finmarchicus (Gunn.) and Its Two Forms in the North Sea. Hull. Bull. Mar. Ecol. 2, 215–275.
Reid P. C., Edwards M., Beaugrand G., Skogen M., Stevens D. (2003). Periodic Changes in the Zooplankton of the North Sea During the Twentieth Century Linked to Oceanic Inflow. Fish. Oceanogr. 12, 260–269. doi: 10.1046/j.1365-2419.2003.00252.x
Reygondeau G., Beaugrand G. (2011). Future Climate-Driven Shifts in Distribution of Calanus Finmarchicus. Global Change Biol. 17, 756–766. doi: 10.1111/j.1365-2486.2010.02310.x
Reygondeau G., Molinero J. C., Coombs S., MacKenzie B. R., Bonnet D. (2015). Progressive Changes in the Western English Channel Foster a Reorganization in the Plankton Food Web. Prog. Oceanogr. 137, 524–532. doi: 10.1016/j.pocean.2015.04.025
Richardson A. J., Walne A. W., John A. W. G., Jonas T. D., Lindley J. A., Sims D. W., et al. (2006). Using Continuous Plankton Recorder Data. Prog. Oceanogr. 68, 27–74. doi: 10.1016/j.pocean.2005.09.011
Rodhe J. (1996). On the Dynamics of the Large-Scale Circulation of the Skagerrak. J. Sea. Res. 35, 23–38. doi: 10.1016/S1385-1101(96)90731-5
Sætre R., Aure J., Danielsen D. S. (2003). Long-Term Hydrographic Variability Patterns Off the Norwegian Coast and in the Skagerrak. ICES. Mar. Sci. Symp. 219, 150–159.
Skjoldal H. R., Aarflot J. M., Bagøien E., Skagseth Ø., Rønning J., Lien V. S. (2021). Seasonal and Interannual Variability in Abundance and Population Development of Calanus Finmarchicus at the Western Entrance to the Barents Se-2019. Prog. Oceanogr. 195, 102574. doi: 10.1016/j.pocean.2021.102574
Skreslet S., Olsen K., Mohus Å., Tande K. S. (2000). Stage-Specific Habitats of Calanus Finmarchicus and Calanus Helgolandicus in a Stratified Northern Norwegian Fjord. ICES. J. Mar. Sci. 57, 1656–1663. doi: 10.1006/jmsc.2000.0968
Speirs D. C., Gurney W. S. C., Holmes S. J., Heath M. R., Wood S. N., Clarke E. D. (2004). Understanding Demography in an Advective Environment: Modelling Calanus Finmarchicus in the Norwegian Sea. J. Anim. Ecol. 73, 897–910. doi: 10.1111/j.0021-8790.2004.00857.x
Strand E., Bagøien E., Edwards M., Broms C., Klevjer T. (2020). Spatial Distributions and Seasonality of Four Calanus Species in the Northeast Atlantic. Prog. Oceanogr. 185, 102344. doi: 10.1016/j.pocean.2020.102344
UNESCO. (1968). “UNESCO Zooplankton Sampling. Part I and Part II,” in Monographs on Oceanographic Methodology. Eds. Tranter D. J., Fraser J. H. (Paris: UNESCO), 174.
van Deurs M., van Hal R., Tomczak M. T., Jonasdottir S. H., Dolmer P. (2009). Recruitment of Lesser Sandeel Ammodytes Marinus in Relation to Density Dependence and Zooplankton Composition. Mar. Ecol. Prog. Ser. 381, 249–258. doi: 10.3354/meps07960
Vikebø F. B., Korosov A., Stenevik E. K., Husebø Å., Slotte A. (2012). Spatio-Temporal Overlap of Hatching in Norwegian Spring-Spawning Herring and the Spring Phytoplankton Bloom at Available Spawning Substrata. ICES. J. Mar. Sci. 69, 1298–1302. doi: 10.1093/icesjms/fss083
Wickham H. (2016). Ggplot2: Elegant Graphics for Data Analysis Vol. 2016 (New York:Springer-Verlag New York.). doi: 10.1007/978-0-387-98141-3
Williams R. (1985). Vertical Distribution of Calanus Finmarchicus and C. Helgolandicus in Relation to the Development of the Seasonal Thermocline in the Celtic Sea. Mar. Biol. 86, 145–149. doi: 10.1007/BF00399020
Williams R., Conway D. V. P. (1984). Vertical Distribution, and Seasonal and Diurnal Migration of Calanus Helgolandicus in the Celtic Sea. Mar. Biol. 79, 63–73. doi: 10.1007/BF00404986
Wilson R. J., Heath M. R., Speirs D. C. (2016). Spatial Modeling of Calanus Finmarchicus and Calanus Helgolandicus: Parameter Differences Explain Differences in Biogeography. Front. Mar. Sci. 3, 157. doi: 10.3389/fmars.2016.00157
Wilson R. J., Speirs D. C., Heath M. R. (2015). On the Surprising Lack of Differences Between Two Congeneric Calanoid Copepod Species, Calanus Finmarchicus and C. Helgolandicus. Prog. Oceanogr. 134, 413–431. doi: 10.1016/j.pocean.2014.12.008
Winther N. G., Johannessen J. A. (2006). North Sea Circulation: Atlantic Inflow and Its Destination. J. Geophys. Res. 111, C12018. doi: 10.1029/2005JC003310
Wood S. N. (2017). Mgcv: Mixed GAM Computation Vehicle With GCV/AIC/REML Smoothness Estimation. Available at: https://cran.r-project.org/web/packages/mgcv/index.html.
Keywords: Calanus, time-series, trends, seasonal variations, phenology, demography, Skagerrak, North Sea
Citation: Falkenhaug T, Broms C, Bagøien E and Nikolioudakis N (2022) Temporal Variability of Co-Occurring Calanus finmarchicus and C. helgolandicus in Skagerrak. Front. Mar. Sci. 9:779335. doi: 10.3389/fmars.2022.779335
Received: 18 September 2021; Accepted: 05 April 2022;
Published: 19 May 2022.
Edited by:
Teresa Sofia Giesta da Silva, Marine and Freshwater Research Institute, IcelandReviewed by:
Frederic Maps, Laval University, CanadaHjálmar Hátún, Faroe Marine Research Institute (FAMRI), Faro Islands
Copyright © 2022 Falkenhaug, Broms, Bagøien and Nikolioudakis. This is an open-access article distributed under the terms of the Creative Commons Attribution License (CC BY). The use, distribution or reproduction in other forums is permitted, provided the original author(s) and the copyright owner(s) are credited and that the original publication in this journal is cited, in accordance with accepted academic practice. No use, distribution or reproduction is permitted which does not comply with these terms.
*Correspondence: Tone Falkenhaug, dG9uZS5mYWxrZW5oYXVnQGhpLm5v