 Julia Oelker
 Svetlana N. Losa
 Andreas Richter
 Astrid Bracher
- 1Department of Physics and Electrical Engineering, Institute of Environmental Physics, University of Bremen, Bremen, Germany
- 2Phytooptics Group, Physical Oceanography of Polar Seas, Climate Sciences, Alfred Wegener Institute, Helmholtz Centre for Polar and Marine Research, Bremerhaven, Germany
- 3Shirshov Institute of Oceanology, Russian Academy of Sciences, Moscow, Russia
Ultraviolet (UV) radiation plays an important role in the ocean for the biogeochemical cycling through photooxidation of colored dissolved organic matter and metals. It also influences the release of trace gases into the atmosphere. Understanding interaction and climate feedback mechanisms of these processes requires global long-term monitoring of UV radiation in the ocean. Ocean color sensors provide the diffuse attenuation coefficient for downwelling solar irradiance (Kd) as an estimate for the mean light penetration depth in the surface ocean. However, Kd products for the UV spectral range are currently only indirectly inferred from measurements in the visible spectral region. We exploit the UV and visible wavelengths of the TROPOMI sensor onboard Sentinel-5P to directly infer diffuse attenuation coefficients in the UV and blue spectral range. Our approach is based on Differential Optical Absorption Spectroscopy in combination with radiative transfer modeling which has been used in earlier studies to successfully derive Kd in the blue from the vibrational Raman scattering (VRS) signal. VRS was detected in the backscattered radiances of TROPOMI-like sensors at a spectral resolution around 0.5 nm. We adapt this method for the TROPOMI sensor and more spectral regions to obtain two novel Kd products in the UV range (312.5–338.5 nm and 356.5–390 nm), additionally to the blue Kd (390–423 nm). One month of TROPOMI data show high sensitivity to retrieve VRS (fit errors <15%). The resulting Kd values in the UV and blue agree reasonably (RMSD <0.31 m−1) with in-situ data measured during a transatlantic cruise. Kd-blue compared to wavelength-converted Kd(490) products from OLCI and OC-CCI shows that the differences between the three data sets are within uncertainties given for the OC-CCI product. TROPOMI Kd-blue results have higher quality and much higher spatial coverage and resolution than previous ones from SCIAMACHY, GOME-2, and OMI. Perspectively, global TROPOMI Kd products, once thoroughly validated, can be used as input for modeling, e.g., photochemical reaction rates of climatically important compounds and inhibition of primary productivity.
1. Introduction
Light governs large-scale biological, physical, and chemical processes in the ocean. Incoming radiation heats the ocean thereby influencing mixed layer dynamics (Ohlmann et al., 1996) and ocean circulation, which in turn is coupled to atmospheric temperature and circulation (Lewis et al., 1990; Miller et al., 2003; Shell et al., 2003). Optically active biological and chemical constituents influence the heat and radiation budget of the ocean (Sathyendranath et al., 1991; Morel and Antoine, 1994; Frouin and Iacobellis, 2002). Visible radiation controls primary productivity of phytoplankton and higher aquatic plants (Sathyendranath et al., 1989) and thus the base of almost all life in the ocean. In contrast, ultraviolet (UV) radiation damages phytoplankton cells and other microorganisms (Cullen and Neale, 1994; Sinha and Hader, 2002). Interactions between climate change and UV radiation penetrating the ocean and its effect on biogeochemical cycles are complex (Zepp et al., 2003, 2007). Upon photodegradation of colored dissolved organic matter (CDOM), the primary absorber of UV radiation in the ocean (Siegel et al., 2002), light penetration and nutrient availability increase. UV radiation also affects bioavailability of iron, copper, and other trace metals and the exchange of trace gases across the air-sea interface, changing atmospheric chemistry.
Adequately describing these light-ocean interaction processes and their role in biogeochemical cycling and climate change feedback mechanisms requires measurements of radiation parameters on a regular basis and large scales (IOCCG, 2008). Ocean color satellite missions routinely monitor the global ocean from space providing some insight into radiation in the ocean (Frouin et al., 2018). Standard products that are operationally provided are the photosynthetically available radiation above the surface (PAR) and the diffuse attenuation coefficient (Kd) at 490 nm (Kd(490)). Kd describes how fast the incoming light diminishes with depth. The mean Kd over distant depths z1 and z2 can be calculated from the plane downwelling irradiance Ed as (Lee et al., 2005b).
with wavelength λ. From passive remote sensing, the average Kd of the surface ocean can be retrieved. It contains information on the first optical depth, i.e., the depth at which the plane downwelling irradiance below the ocean surface has decreased to around 37%. It is a valuable parameter used for estimating, e.g., heat budget (Lewis et al., 1990; Morel and Antoine, 1994; Kara et al., 2004) and primary productivity (Platt, 1986; Sathyendranath et al., 1989). Kd(490) and Kd at other wavelengths (Kd(λ)) can be calculated from ocean color satellite data using empirical (based on band ratios, e.g., Austin and Petzold, 1981; Morel and Maritorena, 2001; Shen et al., 2017), semi-analytical (Lee et al., 2005b; Morel et al., 2007b; Wang et al., 2009), or neural network (Jamet et al., 2012) approaches.
Current ocean color satellites provide only limited information on light reflected from the ocean in the UV. For most ocean color sensors, the shortest wavelength band lies around 412 nm, some reach down to 380 nm (e.g., Second-Generation Global Imager on GCOM-C, Okamura et al., 2019). The only recent OC sensor with a band at shorter wavelengths, 355 nm, is the Ultraviolet Imager on HaiYang-1C satellite launched in 2018 (http://www.nsoas.org.cn/eng/item/204.html). Future missions also aim at providing measurements in the UV spectral range. For instance, the Ocean Color Instrument of the upcoming PACE mission is planned to record radiances from 340 nm with spectral resolution of 5 nm. However, the PACE mission will not be launched before November 2023 (https://pace.oceansciences.org/). So far, the only existing UV product for ocean color applications is the above-surface planar spectral UV irradiance at noon from the hyperspectral Ozone Monitoring Instrument (OMI) (Tanskanen et al., 2006). Information on Kd in the UV has been indirectly obtained from ocean color information at visible wavelengths in several studies. Kd in the UV is empirically related to Kd or absorption at visible wavebands (Smyth, 2011; Lee et al., 2013), blue-green reflectance ratios (Johannessen et al., 2003), or principle components of visible reflectances remote-sensing reflectance (Rrs) (Fichot et al., 2008) or it is estimated using an ocean case-I UV model with the chlorophyll-a concentration (Chla) from ocean color sensors as input (Vasilkov et al., 2005). All of these approaches rely on the rather weak relationship of optical properties between the UV and visible wavelength range (Vasilkov et al., 2002a; Morel et al., 2007a). Wang et al. (2021) developed a deep-learning system to obtain Rrs in the UV from Rrs at visible bands; then Rrs(UV) was used to derive Kd at 360, 380, and 400 nm. They demonstrate the non-linearity between Rrs at UV and visible wavelengths. Frouin et al. (2018) have summarized user needs for radiometric satellite products, revealing a need for information on ocean radiation in the UV. They suggest to fill parts of this knowledge gap by utilizing current satellite missions such as Sentinel-5P for UV products.
In this study, we exploit Sentinel-5P Tropospheric Monitoring Instrument's (TROPOMI) UV and visible bands for deriving two novel Kd products in the UV. These products describe the average Kd in the wavelength regions 312.5 to 338.5 nm and 356.5 to 390 nm for the first optical depth. In addition, we derive the average Kd in the range 390 to 423 nm. Our approach is based on earlier studies deriving this latter Kd in the blue spectral range from SCIAMACHY (Scanning Imaging Absorption Spectrometer for Atmospheric CHartographY), GOME-2 (Global Ozone Monitoring Experiment 2), and OMI satellite data (Dinter et al., 2015; Oelker et al., 2019). Differential Optical Absorption Spectroscopy (DOAS) is used to target the Vibrational Raman Scattering (VRS) signal in the ocean. The number of these inelastic scattering processes depends on the number of photons in the ocean and causes filling-in of absorption structures such as Fraunhofer lines in the solar spectrum. Because VRS is negligible in the atmosphere, the VRS signal found in backscattered radiances measured by satellites can be linked to the radiation in the ocean using radiative transfer simulations.
Our study conceptually shows the feasibility by presenting first results of the novel Kd-UV products and the Kd-blue product. We focus on 1 month of TROPOMI data in 2018, 11 May to 9 June, for which in-situ Kd(λ) data is available from a R/V Polarstern cruise transecting the Atlantic Ocean from Punta Arenas, Chile, to Bremerhaven, Germany. The quality of these Kd products is evaluated against this in-situ data set and wavelength-converted multispectral Kd products from the Ocean Colour Climate Change Initiative (OC-CCI) data set and the Sentinel-3A Ocean and Land Colour Instrument (OLCI).
2. Materials and Methods
2.1. Data Sets
2.1.1. TROPOMI Data
The satellite Sentinel-5 Precursor (S5P) hosts the Tropospheric Monitoring Instrument (TROPOMI) (Veefkind et al., 2012). It is in a low Earth orbit and its standard level 2 products provide daily global measurements of atmospheric trace gases and aerosols. The satellite was launched in October 2017. Local solar time at ascending node is 13:30. TROPOMI measures backscattered radiances at a spatial resolution of 3.5 by 7 km at nadir which was improved to 3.5 by 5.5 km in August 2019 due to high signal-to-noise performance. Once per day the solar irradiance is recorded. Measurements are taken in push-broom configuration at a swath width of 2,600 km providing daily global coverage. TROPOMI has spectral bands in the UV, visible (VIS), near-infrared, and the shortwave infrared. Relevant for developing the Kd products in this study are band 3 (UV) from 310 to 405 nm and band 4 (VIS) from 405 to 500 nm. Spectral resolution of these bands is around 0.55 nm. We used level 1b TROPOMI radiances V01.00.00 and corresponding daily UVN (bands 1 to 6) irradiances (Vonk, 2018). Clouds shield the radiance signal from the ocean, so the TROPOMI data set was filtered for cloud-free scenes using a cloud fraction of 0.05 as threshold. Cloud fractions were taken from FRESCO type cloud retrieval in the nitrogen dioxide fit window (van Geffen et al., 2019). Pixels over land and inland waters were removed from the data set.
2.1.2. In-situ Data
Radiometric data was collected from 11 May to 9 June 2018 on Polarstern expedition PS113, crossing the Atlantic from Punta Arenas, Chile, to Bremerhaven, Germany. Two irradiance sensors (RAMSES ACC-2-VIS, TriOS GmbH, Germany) covering the wavelength region from 320 nm to 950 nm with a spectral sampling of 3.3 nm, resolution of 10 nm, and accuracy of 0.3 nm were used to measure the underwater downwelling irradiance Ed(z, λ). One sensor was mounted to a steel frame for vertical profiling at 0.1 m/s down to 130 m at a distance of 5 m to the ship, outside of the ship's shading, at 19 discrete stations. It is additionally equipped with an inclination and pressure sensor. The second sensor was mounted on an undulating platform (Triaxus, extended version, MacArtney, Denmark) towed behind the research vessel at a speed of 8 knots for several transects along the cruise track. Vertical movement of the Triaxus was 1 m/s. The depth was determined with a Seabird CTD mounted to the Triaxus and the inclination in all directions was recorded by the Triaxus hardware. Measurements were taken with automatically adjusted integration times between 4 and 8 s. Triaxus profile data was only processed if the euphotic depth was reached and values of the downwelling irradiance at 15 m depth and a wavelength of 400 nm were greater than 150 mW m−2 nm−1 (all station data fulfilled these criteria). Radiometric data from 6 transects between 2 and 48 h long were identified useful for determining Kd(λ). Generally, profile measurements were only valid if the instrument's inclination in either dimension was <14°. A third RAMSES ACC-2-VIS sensor mounted on top of the ship recorded the incident downwelling irradiance above the surface , to correct for incident sunlight variations. Mean Kd was calculated from Ed(z, λ) profiles mostly over the depth interval 7 to 22 m for the stations and 7 to 30 m, some 7 to 60 m, for the Triaxus profiles. Kd-UVAB, Kd-UVA and Kd-blue used for validation were derived as described in section 2.3.3 for the simulations. Details on measurement procedure can be found in Bracher et al. (2020). In situ Kd data are available at Bracher and Dinter (2021), Bracher et al. (2022).
2.2. Multispectral Satellite Data
Derived Kd products from TROPOMI were compared to Kd(490) from Sentinel-3A OLCI and the OC-CCI data set. OLCI onboard Sentinel-3A has a spatial resolution of 300 m. Ocean color information is obtained from 21 spectral bands. The operational Kd(490) product is calculated based on the OK2-560 algorithm (Morel et al., 2007b) which is based on an empirical relation between Chla and Kd(490), with Chla derived from an empirical band-ratio algorithm. OLCI data was downloaded via EUMETSAT Streaming Service (version IPF 6.11, processing baseline v2.23). As second multispectral data set, the OC-CCI data set (Sathyendranath et al., 2019) version 4.2 (Sathyendranath et al., 2020) (http://www.esa-oceancolour-cci.org) was used. It is a merged product consisting of information from the MODIS-Aqua and VIIRS sensors for 2018. Data is provided on a sinusoidal grid with 4 km spatial and daily temporal resolution. Kd(490) is retrieved semi-analytically (Lee et al., 2005b). Absorption and backscattering are first obtained in a quasi-analytical approach (Lee et al., 2002) and then related to Kd(490) using look-up tables (LUTs) established with radiative transfer modeling.
2.3. Algorithm
Vibrational Raman Scattering (VRS) is an inelastic scattering process which occurs in the ocean when photons scatter off water molecules (Walrafen, 1966). It therefore contains information of the number of photons in the ocean. Photons are scattered to longer wavelengths with a wavelength shift of 33 to 99 nm in the UV-VIS (Haltrin and Kattawar, 1993). Absorption features such as Fraunhofer lines in the solar spectrum filled-in by these photons are detectable in backscattered radiances recorded by satellites, appearing as a so-called pseudo-absorption, known as the Ring effect (Grainger and Ring, 1962). Using Differential Optical Absorption Spectroscopy (DOAS), the VRS signal can be identified in backscattered radiances from satellite sensors with sufficient spectral resolution (~0.5 nm) (Vasilkov et al., 2002b; Vountas et al., 2003, 2007). Since VRS is negligible in the atmosphere (Vountas et al., 1998), Dinter et al. (2015) exploited these spectral features to infer the light availability and Kd in the ocean from SCIAMACHY backscattered radiances via radiative transfer modeling. Oelker et al. (2019) closely followed this approach with some modifications on DOAS and RTM settings to derive Kd from SCIAMACHY and additionally OMI and GOME-2 for nearly 1 year of data in 2007. We based our algorithm on these earlier works with minor modifications and extended it to the UV spectral region. In the following, we summarize the retrieval steps for deriving Kd from VRS, see also the flowchart in Figure 1.
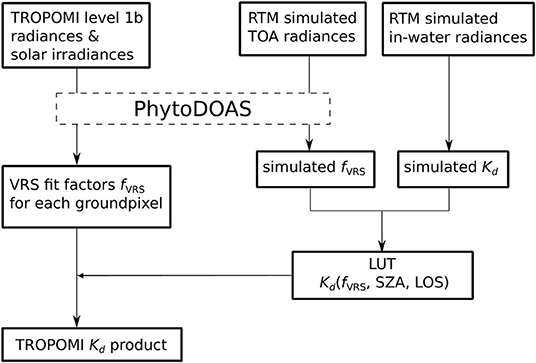
Figure 1. Flow chart illustrating TROPOMI Kd algorithm.
2.3.1. PhytoDOAS
Differential Optical Absorption Spectroscopy (DOAS) (Perner and Platt, 1979) is a method for inferring atmospheric trace gas concentrations from high-frequency absorption features in backscattered radiances. The optical depth τ is calculated from backscattered radiances I divided by a reference spectrum, e.g., an extra-terrestrial solar spectrum I0. Low-frequency features such as Rayleigh and aerosol scattering and aerosol absorption are removed by subtracting a low-order polynomial. Absorption spectra of atmospheric trace gases are fitted to the high-frequency part of the optical depth to infer their concentrations. DOAS has been extended to the ocean domain (PhytoDOAS) for retrieving phytoplankton functional types (Bracher et al., 2009; Sadeghi et al., 2012), light availability (Dinter et al., 2015), Kd (Dinter et al., 2015; Oelker et al., 2019) through VRS (Vountas et al., 2003, 2007), and phytoplankton fluorescence (Wolanin et al., 2015) by including (pseudo-) absorption spectra for oceanic constituents and inelastic processes. Inelastic scattering processes, such as VRS, lead to filling-in of Fraunhofer lines. These are treated as pseudo-absorbers in DOAS. Following the model established by Vountas et al. (1998) their compensation spectra (named pseudo-absorption cross section which is unit-less) σ can be calculated from the top of atmosphere (TOA) radiances using a coupled ocean-atmosphere radiative transfer model (RTM) simulating one model run including (I+) and a second excluding (I−) inelastic processes:
For this study, three VRS fits were performed in three spectral regions 349.5 to 382 nm, 405 to 450 nm, and 450 to 493 nm, in the following referred to as UV, short-blue, and blue window, respectively. The blue and short-blue windows lie in TROPOMI's band 4, whereas the UV window lies in band 3. VRS fit factors have been successfully retrieved in the UV window using data from the GOME and SCIAMACHY sensor (Vountas et al., 2003, 2007). The blue window is slightly shorter than in Dinter et al. (2015) and Oelker et al. (2019), because TROPOMI's band 4 ends before 497 nm. VRS fits in the short-blue window are tested here for the first time. Considering all relevant processes in these fit windows for targeting VRS, the DOAS equation can be formulated as:
with atmospheric absorption cross sections σa,j(λ) of J atmospheric absorbers and pseudo-absorption cross section σR(λ) for Rotational Raman Scattering (RRS) in the atmosphere based on Equation (2). The pseudo-absorption cross section for VRS (σVRS) was calculated based on Equation (2) from modeled case I TOA radiances for Chla of 0.1 mg/m3 and a solar zenith angle (SZA) of 40° (see Figure 2, for more details on RTM setup see Section 2.3.2). This reference cross section describes the effect at the TOA of spectral redistribution due to VRS at Chla of 0.1 mg/m3 (reference spectra simulated for other Chla are presented in Supplementary Figure 1A). VRS fit factors (SVRS) at this Chla are equal to 1.0 since a linear relationship is obtained between VRS fit factors and Chla around Chla = 0.1 mg/m3 (compare Supplementary Figure 1C). The ocean weighting function (σOC) was defined as in Dinter et al. (2015) and calculated from case I TOA radiances for a SZA of 40°. The weighting function describes the change in TOA radiance caused by a small change in Chla. It was calculated for a change in Chla from 0.1 mg/m3 to 0.11 mg/m3. For the blue and short-blue window, the following atmospheric absorbers (a, j with J = 4) were fitted: absorption cross sections for ozone (O3) (Serdyuchenko et al., 2014), nitrogen dioxide (NO2) (Vandaele et al., 1998), water vapor (H2O) (Rothman et al., 2013, using HITRAN 2009), and oxygen dimer (O4) (Thalman and Volkamer, 2013). The VRS fits in the blue and short-blue window only differ in wavelength region, whereas the UV window fit additionally differs in fitted atmospheric absorbers. In the UV window, the absorption cross section for bromine monoxide (BrO) was additionally fitted, but water vapor was removed from the list of absorbers. For all three fit windows, a second order polynomial was chosen (M = 2) which accounts for all broad band effects such as elastic scattering in atmosphere and ocean and aerosol, colored dissolved organic matter (CDOM) and non-algae particle absorption. Equation 3 is solved for the fit factors S for the fitted targets (OC, VRS, RRS and each atmospheric absorber) and the polynomial coefficients xm using least-squares minimization (Richter, 1997).
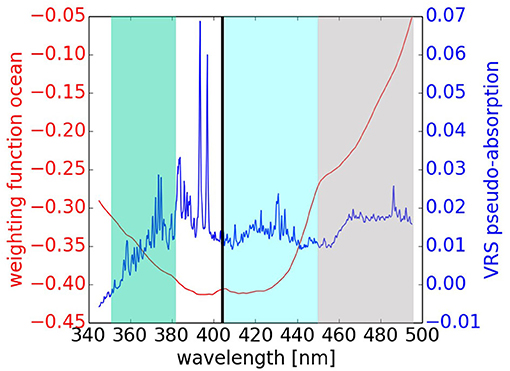
Figure 2. Simulated VRS pseudo-absorption and ocean weighting function cross sections as function of wavelength. Colored areas indicate UV (green), short-blue (blue) and blue (gray) DOAS fit windows. The thick black line marks the end/start of band 3/4.
2.3.2. RTM SCIATRAN
The coupled ocean-atmosphere RTM SCIATRAN (Blum et al., 2012; Rozanov et al., 2014, 2017, https://www.iup.uni-bremen.de/sciatran/) version 4.0.8 was used for radiance simulations for calculating pseudo-absorption cross sections and LUTs. Two types of RTM simulations have to be performed for the LUTs used to convert VRS fit factors to Kd. On the one hand, top-of-atmosphere (TOA) radiances, and on the other hand, underwater radiant fluxes for various ocean scenarios are needed. 23 different case-1 scenarios (Morel and Maritorena, 2001) were modeled with Chla ranging between 0 and 30 mg/m3, i.e., optical properties of the ocean are driven by Chla, other optically active constituents such as CDOM change proportionally. Similar to the case-1 model in Hydrolight (Mobley and Sundman, 2013), the phytoplankton absorption spectrum (Prieur and Sathyendranath, 1981) was extrapolated into the UV range as an exponentially decaying function leading to a CDOM-dominated UV case-1 model. A background maritime aerosol was assumed with aerosol optical depth (AOD) of 0.1 at 550 nm. Detailed model settings can be found in Oelker et al. (2019) adapted from Dinter et al. (2015).
SCIATRAN can accurately model inelastic scattering processes such as VRS which was evaluated by comparison with other radiative transfer models and experimental data from satellite, ship-based, and underwater instruments (Rozanov et al., 2017). The VRS implementation is based on the parameterization of Haltrin and Kattawar (1993) in which the VRS emission is a sum of four Gaussian functions based on experimental results of Walrafen (1966) for a water temperature of 30° C (note: the temperature dependence of VRS has so far not been implemented in SCIATRAN). The total Raman scattering coefficient is set to a value of 2.7·10−4 m−1 at a reference wavelength of 488 nm. The wavelength dependence is parameterized as a resonance model. Details on the VRS parameterization can be found in Appendix A of Rozanov et al. (2017).
TROPOMI-specific adaptations were made for this study. Since spectral alignment is very important for the DOAS retrieval, a TROPOMI-measured extraterrestrial solar spectrum was used for the TOA radiance calculations. A solar spectrum measurement from a middle row of the charge-coupled device (row 225, 0-based) from May 2018 was chosen. Underwater fluxes were simulated at a spectral resolution of 0.5 nm using a Fraunhofer atlas (Chance and Kurucz, 2010) since they are insensitive to the exact spectral resolution. Geometry settings were chosen to cover all of TROPOMI's viewing geometries [5° steps for SZA and viewing zenith angle (VZA)], except for the azimuth angle which was held constant (90°).
2.3.3. Look-Up-Table for Deriving Kd From VRS
Following Dinter et al. (2015), Oelker et al. (2019), the LUT for deriving Kd from VRS was built by combining VRS PhytoDOAS fits on simulated TOA radiances with Kd calculated from simulated underwater radiant fluxes. PhytoDOAS fit settings for the retrieval of theoretical VRS fit factors from the modeled TOA radiances are the same as for the retrieval on satellite radiances (see Section 2.3.1) except that for atmospheric cross sections water vapor was not fitted, since it was not included in the SCIATRAN simulation. The underwater radiant flux simulations provide the downwelling irradiance (Ed) at discrete depths z. Taking into account the wavelength shift of the VRS process (Dinter et al., 2015), Ed(z, λ) was integrated over the specific VRS excitation wavelength range: for VRS-UV between 312.5 nm and 338.5 nm (UVAB), for VRS-short-blue between 356.5 nm and 390 nm (UVA), and for VRS-blue between 390 nm and 423 nm (blue). Then, according to Equation 1, the Ed(z, UVAB), Ed(z, UVA), and Ed(z, blue) were used to calculate the mean Kd(UVAB), Kd(UVA) and Kd(UVAB), respectively, until the first optical depth (see Supplementary Figure 1). The first optical depth, as defined by Gordon and McCluney (1975), was determined via linear interpolation of the log-transformed Ed(z). Kd calculations and VRS PhytoDOAS retrievals were performed for each SZA and each VZA separately, an example for VRS-blue and Kd-blue is shown in Supplementary Figures 1C,D. VRS fit factors were matched with Kd calculated from scenarios with the same Chla. As an update to the two-dimensional LUTs in Dinter et al. (2015); Oelker et al. (2019), for each spectral Kd its specific, three-dimensional LUT was created where Kd is a function of VRS fit factor, SZA, and (newly added) VZA (see Supplementary Figure 2).
We note here that the LUT approach used in this study does not restrict the retrieval to ocean scenarios which correspond exactly to the chosen RTM parameterization. For instance, increased CDOM absorption with respect to a reference Chla value will lead to a reduction in VRS signal and, consistently, a lower Kd will be derived. Since this change in CDOM is, however, connected with a change in spectral shape of the VRS pseudo-absorption spectrum, the conversion to Kd via the LUT can lead to errors. The retrieval sensitivity with respect to the RTM model settings was therefore investigated next.
2.3.4. Sensitivity Analysis
The algorithm sensitivity was evaluated with respect to model settings similar to the sensitivity analysis for Kd-blue retrievals presented in Oelker et al. (2019). Besides also considering the sensitivity of retrievals of Kd-UVAB and Kd-UVA, we extend the sensitivity analysis to the following parameters: CDOM spectral slope, UV-absorbing pigments, liquid water absorption, wind speed, and ozone concentration.
For each parameter, the sensitivity is analyzed as follows. An RTM simulation is performed to calculate radiances and radiant fluxes in which one parameter is increased or decreased with respect to the standard scenario used to build the LUT. The PhytoDOAS fit is performed on this modified scenario. Resulting VRS fit factors are converted to Kd using the LUT. The resulting Kd is compared to the expected value, , calculated from the radiant fluxes of the modified scenario. The deviation of derived from expected Kd is determined in percent.
Since mainly only a change in inherent optical properties changes Kd, the parameters can be separated into two groups. One group comprises the atmospheric and surface parameters which have no or only a minimal effect on the mean Kd over the first optical depth, but may influence VRS. The second group comprises the oceanic parameters which affect both, Kd and VRS. For the second group, Kd changes can be large, however, VRS changes accordingly, and Kd may be retrieved correctly within an uncertainty which is only a fraction of the change in Kd.
Parameters within the first group were varied as follows: wind speed was reduced to 1 m/s and increased to 8 m/s (standard: 4.1 m/s); aerosol optical depth (AOD) was reduced to 0.05 and increased to 0.2 (standard: 0.1); ozone profile was changed to one with reduced ozone concentration of 290 DU (standard: 420 DU).
The case-I assumption is generally not valid in the UV domain. The absorption coefficient can not be accurately described using Chla (Vasilkov et al., 2002a; Morel et al., 2007a). The influence of the case-I parameterization used for the optical constituents in the ocean on the ultraviolet Kd retrievals needs to be checked carefully. Case-I parameterization for the visible wavelength range were used in combination with a recent pure water absorption spectrum accurately measured for UV wavelengths (Mason et al., 2016). Nevertheless, the influence of the choice of water absorption spectrum is checked. A modified scenario is simulated with liquid water absorption coefficients from Pope and Fry (1997) which significantly differ at short wavelengths from those measured by Mason et al. (2016). High uncertainty also lies within the settings for phytoplankton and CDOM absorption. Presence of mycosporine amino acids (MAA) causes higher UV absorption than prescribed in our standard case-I parameterization. MAA absorb between 320 and 350 nm with a peak around 330 to 340 nm (Bracher and Wiencke, 2000). Presence of these UV-absorbing pigments should therefore mainly influence Kd-UVAB. A modified scenario was simulated using a phytoplankton absorption spectrum with medium MAA absorption (S9 from Bracher and Wiencke, 2000). High variability can also be expected for the CDOM spectral slope, 0.01 to 0.03 nm−1 (Vodacek and Blough, 1997) as compared to 0.014 nm−1 in the standard case-I scenario. Modified RTM simulations were made with a reduced CDOM spectral slope of 0.007 nm−1 and an increased CDOM spectral slope of 0.03 nm−1. Also the CDOM coefficient was modified as in Oelker et al. (2019), while keeping the CDOM spectral slope at 0.014 nm−1.
2.3.5. Offset Correction
TROPOMI-VRS blue fit factor range was higher than the range obtained when PhytoDOAS was applied to the simulated TOA radiances for constructing the LUTs. This resulted in a high bias of derived TROPOMI Kd-blue compared to matchup Kd-blue data from in-situ which indicated an offset between the measurement reality and the model, necessitating an empirical offset correction. The exact origin of the offset is so far unknown (discussed in Section 4.1), however, such global offsets are often observed in DOAS retrievals, especially for weak atmospheric absorbers, i.e., small signals (e.g., Wittrock et al., 2006; Platt and Stutz, 2008). Kd-blue agreed much better with the wavelength-converted Kd(490) from OLCI and OC-CCI when a constant was added to the VRS fit factors. Generally, TROPOMI Kd-blue is closer to the OLCI Kd-blue than the OC-CCI Kd-blue and correlation is highest for low Kd values (see Table 3). For developing an empirical VRS-fit offset correction, we concentrated on comparing the low values (Kd-blue <0.15m−1) from the TROPOMI Kd-blue to those from the OLCI Kd-blue data set to determine the offset that best corrects the data. The comparison was calculated for the entire study time period using 5 min gridded daily Kd data as input. It covered a wide range of conditions (Chla 0.01 to 0.5 mg/m3, colored matter and phytoplankton absorption at 440 nm 0.003 to 0.05 m−1 and 0.001 to 0.02 m−1, respectively, SZA 10° to 70° and VZA <60°). The offset correction of the VRS fit was optimized such that a linear total-least-square regression on this comparison data set (limited to Kd < 0.15 m−1) yielded a slope close to one. The optimal offset was found to be 0.186. Regression statistics for this setting were a slope of 1.01, intercept of −0.002 m−1, and Pearson correlation coefficient of 0.80. The offset was used to correct all VRS fit factors and by that the whole Kd range. Details on the original Kd-blue data set and the applied correction can be found in the Supplementary Material (Supplementary Figures 3, 4).
2.4. Kd Product Quality Evaluation
Kd products were evaluated against in-situ and multispectral Kd data sets. For all comparisons, we provide the slope and intercept of least-square regressions, the Pearson correlation coefficient, the bias, the mean absolute error (MAE), root-mean-square difference (RMSD), and the unbiased RMSD, calculated as , as typical estimates used for ocean color variables (Brewin et al., 2015; Seegers et al., 2018).
2.4.1. Wavelength Conversion for Kd(490)
In order to compare our TROPOMI-derived Kd products to Kd(490) from OLCI and OC-CCI, Kd(490) needs to be wavelength-converted first. The spectral relationship between Kd-blue, Kd-UVA, Kd-UVAB and Kd(490) was investigated based on the in-situ Kd(λ) from 19 stations of PS113. Kd-blue, Kd-UVA, Kd-UVAB were determined from the in-situ Kd(λ) by averaging over the corresponding wavelength ranges. They were then plotted against the in-situ Kd(490). Linear regression results can be found in Table 1. There is a tight relationship between Kd-blue and Kd(490). Correlation with Kd(490) decreases with decreasing wavelength. Based on these results, OLCI and OC-CCI Kd(490) were wavelength-converted using
with slope a and intercept b from Table 1.
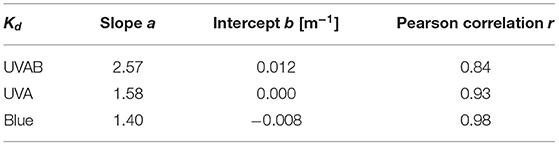
Table 1. Linear least-square regression results for in-situ Kd-UVAB, Kd-UVA and Kd-blue compared against in-situ Kd(490) from 19 stations during PS113.
2.4.2. Match-Up Analysis
Match-ups between geolocation of PS113 stations and TROPOMI ground pixels were calculated using a loose criterion given the low number of stations (N = 19). We searched for each station for TROPOMI match-ups within ±2 days and a radius of 5.5 km. If several match-ups were found in this time period, the match-up closest in time to the satellite measurement is taken. If more than one TROPOMI pixel lies within search criteria, the mean TROPOMI Kd was calculated and the standard deviation was noted as uncertainty of the TROPOMI Kd. Using this loose criterion, match-ups were found for 8 stations. OLCI and OC-CCI data were used to further quality control these 8 match-ups. The same spatial and temporal collocation criteria were applied to high-resolution OLCI data to find the corresponding OLCI data for each match-up. Following the Sentinel-3 ocean color validation protocol (EUMETSAT, 2021), OLCI match-ups were only considered valid if half of the pixel box was filled and if the coefficient of variation was not larger than 0.2. In addition, OC-CCI match-ups were determined with spatial collocation criterion of 1 by 1 (corresponding to TROPOMI criterion) and 3 by 3 pixel box to additionally check the spatial homogeneity as for OLCI. 7 of the TROPOMI match-ups were confirmed to be valid.
The same search criterion was applied to find match-ups between PS113 Triaxus and TROPOMI Kd. Again, the match-ups closest in time to the satellite measurement were selected and TROPOMI Kd is averaged in case more than one ground pixel lies within search radius. If several Triaxus measurements were matched with the same TROPOMI measurement, the Triaxus measurements were averaged and the standard deviation noted as variability in the Triaxus measurements, which indicates the spatial variability of the water mass. Thirty-five match-ups remain after averaging. Due to the focus of the oceanographic survey, Triaxus platform operations were taken to study the submesocale variability, especially between different water masses (as presented for a specific transect of the same cruise in von Appen et al., 2020). Since TROPOMI pixels are quite large, matchups with Triaxus data often show high innerpixel variability, while TROPOMI can only represent the mean value for the whole area.
3. Results
We present for the three ranges of wavelengths the TROPOMI results of the VRS DOAS fits (section 3.1), the derived Kd-data which are also compared to in-situ and wavelength converted multispectral satellite Kd data (section 3.2), and the results of the sensitivity of the retrieval to parametrizations used in the RTM SCIATRAN (Section 3.3).
3.1. TROPOMI VRS DOAS Fits in the UV and Blue
The distribution of VRS fit factors, including fit residuals, for the three wavelength ranges were evaluated for the time period of the PS113 expedition in the Atlantic Ocean. Figure 3 shows an example of the differential optical depth for VRS, the ocean weighting function (second and third term in equation 3, respectively) and the VRS fit residual when the PhytoDOAS retrieval was applied to a TROPOMI ground pixel in the South Atlantic Gyre in the short-blue wavelength region. As expected for this region a strong VRS signal is obtained with the fit residual showing about 10% of this magnitude. Also the ocean weighting function is well-fitted with similar order of residual values. Similarly good fit results are obtained for the same pixel for the VRS fit in the UV and blue (see Supplementary Figure 5). This indicates that the signals from VRS and other ocean parameters are detected very well by the DOAS fit in the TOA radiances.
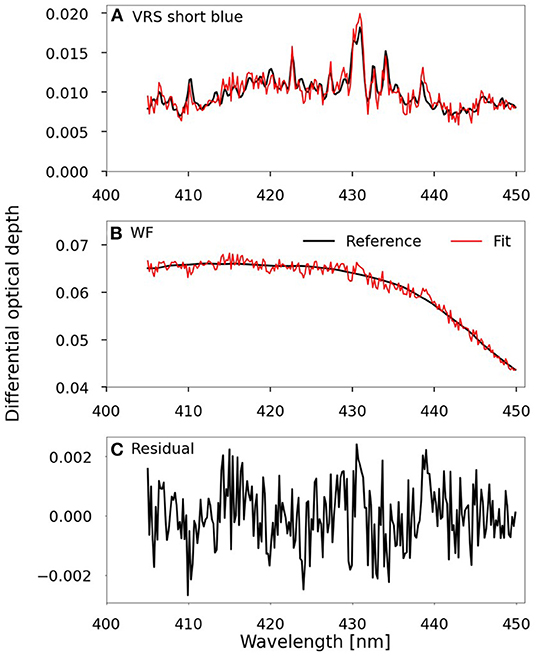
Figure 3. Differential optical depth for (A) VRS, (B) other oceanic parameters (oceanic weighting function - WF) and (C) overall fit residual of the spectral fit of TROPOMI TOA radiances using DOAS for the short-blue (405–450 nm) wavelength range for one pixel measured on 11 May 2018 at 16:02:37, 29.09°W, 32.12°S, at 59.56° SZA. For plots (A,B), the black line shows as reference the differential cross section multiplied by the retrieval fit factor for the corresponding ground pixel and the red line the reference plus the overall fit residual.
Figure 4 shows a monthly composite of VRS fit factors for the three PhytoDOAS fit windows in the (Figure 4A) UV, (Figure 4B) short-blue, and (Figure 4C) blue in the Atlantic Ocean for the time period 11 May to 9 June. VRS fit factors in the blue window are presented offset-corrected. The data was gridded to 0.083° (~9 km). For all three fit windows, high and low VRS fit factors are found in typically low and high Chla regions corresponding to low and high light penetration into the ocean, respectively. As expected, the VRS signal decreases with decreasing wavelength. Fit quality is similar for the PhytoDOAS fits in all three fit windows. The average root mean square (RMS) of all fit residuals in this area and time period and its standard deviation were evaluated to 1.0·10−3±3·10−4 for the UV (excluding 26 outliers with RMS > 4), 0.9·10−3±2·10−4 for the short-blue, and 1.0·10−3±3·10−4 for the blue fit window. For each ground pixel the fit error which is the relative uncertainty of the fit factor as determined from the linear least-squares DOAS fit, given in per cent, is provided. These errors (summarized in Table 4) are lowest for VRS-UV ranging from 5 to 10%, increased for VRS-short-blue to 10 to 15% and highest for VRS-blue with 15 to 20% within the given sensitivity range of Kd < 0.3 m−1, maximum errors for high Kd-/Chl-a waters are <20%, <40%, and <90%, respectively. VRS fit factors from different fit windows are not strictly correlated, e.g., differences appear around Newfoundland and Great Britain.
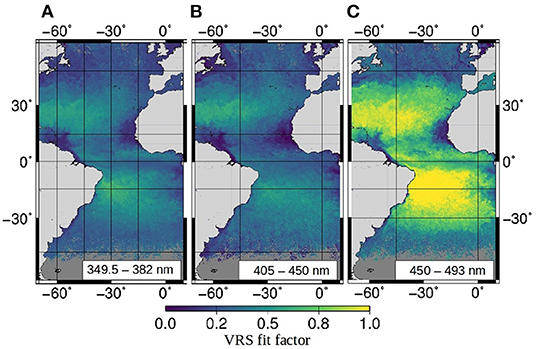
Figure 4. VRS fit factors in the (A) UV, (B) short-blue, and (C) blue fit window in the Atlantic Ocean gridded at 0.083° as mean for 11 May to 9 June 2018.
3.2. TROPOMI Kd Retrievals From the UV-B to the Blue
Kd was pixel-wise derived from the TROPOMI VRS fit factors using separate LUTs for each wavelength region. Figure 5 shows the resulting (Figure 5A) Kd-UVAB, (Figure 5B) Kd-UVA, and (Figure 5C) Kd-blue in the Atlantic Ocean gridded to 0.083° over the time period from 11 May to 9 June 2018. Lowest Kd are found in the North and South Atlantic Gyres, highest Kd in the upwelling regions along the African coast and the Amazon river plume. With decreasing wavelength, Kd increases. However, Kd-UVAB is not generally larger than Kd-UVA. In the upwelling regions off the coast of West African, the Amazon river plume, around Newfoundland, and around Great Britain the ratio Kd-UVA/Kd-UVAB is larger than 1 (roughly 1.25 on average, 2 in extreme cases). Kd-blue is strikingly larger than Kd-UVA and UVAB in the productive areas north of the Northern Atlantic Gyre.
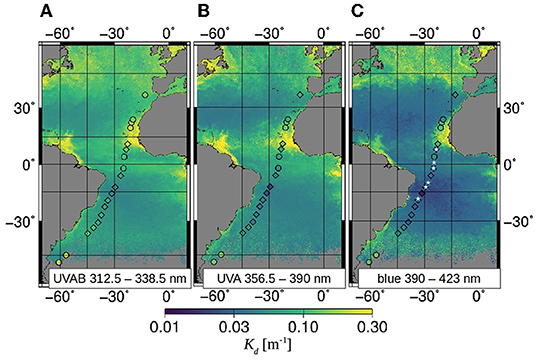
Figure 5. TROPOMI (A) Kd-UVAB, (B) Kd-UVA, and (C) Kd-blue in the Atlantic Ocean gridded at 0.083° as mean for 11 May to 9 June 2018. Accordingly, Kd-UVAB, Kd-UVA, and Kd-blue measured in-situ at 19 stations during expedition PS113 are overlayed as diamonds (match-ups) and circles (unmatched stations). (C) White stars mark the location of the Triaxus transects for which match-ups were found.
Derived TROPOMI Kd products were compared to in-situ Kd measurements taken during expedition PS113. Figure 5 shows the location of the PS113 stations and Triaxus transects. A rough correspondence between station Kd data and the satellite monthly mean Kd is already seen. For a direct comparison, match-ups between TROPOMI and in-situ data were evaluated. Match-ups for TROPOMI Kd-UVAB, Kd-UVA, and Kd-blue plotted against the corresponding in-situ Kd (Figure 6) show an overall good agreement for all three spectral wavelength regions, considering the loose match-up criterion. TROPOMI Kd-blue shows good agreement with the in-situ Kd-blue, which might not be so surprising since we offset-corrected the VRS fit factors for this wavelength range such that agreement is maximized for low Kd-blue with OLCI Kd-blue. Linear regression (Table 2) obtains a slope of 0.88 and an intercept of −0.003 m−1. TROPOMI Kd-UVAB is systematically lower than the in-situ Kd-UVAB over the sampled Kd range (slope of 0.86 and an intercept of −0.026 m−1) with a bias of −0.026 m−1. For TROPOMI Kd-UVA, an overestimation is observed that increases with Kd-UVA (slope of 2.85 and an intercept of −0.080 m−1). In line with this observation, bias, RMSD, and MAE are much lower for TROPOMI Kd-blue, and similar for Kd-UVAB and UVA except for the larger bias found for Kd-UVAB. Considering the unbiased RMSD, performance of TROPOMI Kd-blue and Kd-UVAB is similar and worse for Kd-UVA.
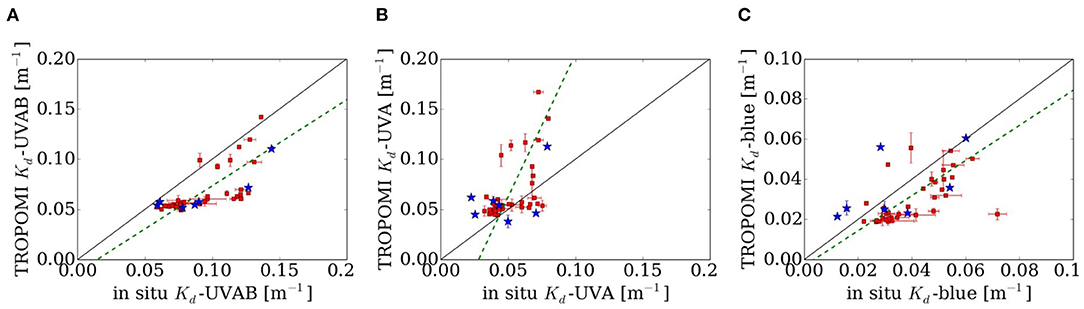
Figure 6. TROPOMI (A) Kd-UVAB, (B) Kd-UVA, and (C) Kd-blue against in-situ Kd-UVAB, Kd-UVA, and Kd-blue. Match-ups between TROPOMI Kd data and PS113 in-situ data were searched for within ±2 days and 5.5 km radius of the in-situ measurement. If more than one match-up was found within these search criteria, the mean TROPOMI and in situ Kd were calculated with standard deviation shown as error bar.
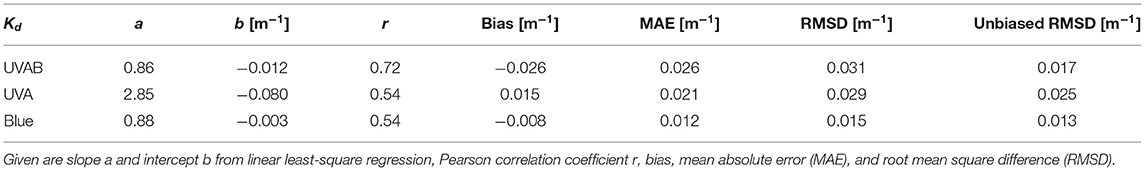
Table 2. Metrics for the match-ups between TROPOMI against in-situ Kd-UVAB, Kd-UVA, and Kd-blue, N = 42.
TROPOMI Kd-blue was compared to Kd data from the multispectral OLCI and OC-CCI data sets to evaluate random errors and regional differences between the data sets. For the latter, Kd(490) was converted to Kd-blue via a linear wavelength conversion scheme (Table 1). Since this wavelength conversion is principally valid for relating Kd(490) to Kd-blue, the comparison was restricted to Kd-blue and not extended to the UV Kd. For the study period and on the same grid as in Figures 4, 5, 7 shows Kd-blue for (Figure 7A) TROPOMI in comparison to (Figure 7B) OLCI and (Figure 7C) OC-CCI. Overall, TROPOMI Kd-blue patterns resemble the multispectral ones (e.g., gyres and productive areas around the Amazon river plume, Mauretanian upwelling system, English Channel). Regional differences are observed between TROPOMI and the multispectral Kd-blue, but also among the multispectral products. In the Atlantic gyres, OC-CCI Kd-blue is significantly higher than the other two products. Similar to OLCI, OC-CCI Kd-blue is lower in the North than in the South Atlantic Gyre, whereas TROPOMI Kd-blue is lower in the South. In the productive areas in the North Atlantic, the TROPOMI Kd-blue product appears noisier than the multispectral products. A distinct difference again is visible near Newfoundland. OLCI and OC-CCI show similar high-Kd patterns north of Newfoundland whereas this pattern does not occur in the TROPOMI Kd-blue product. Around Great Britain, Kd-blue patterns from the multispectral products are not so similar to each other as those from OC-CCI compared to TROPOMI. Differences appear in maximum values south of 40°S, where SZAs are large and data coverage is low and differs between sensors. Despite these differences between the three data sets, comparison with RMSD (Figure 7D) as provided in the OC-CCI data set (converted to the blue spectral region) shows that these differences are on the order of the uncertainty of the OC-CCI product (see Supplementary Material for difference maps, Supplementary Figure 6).
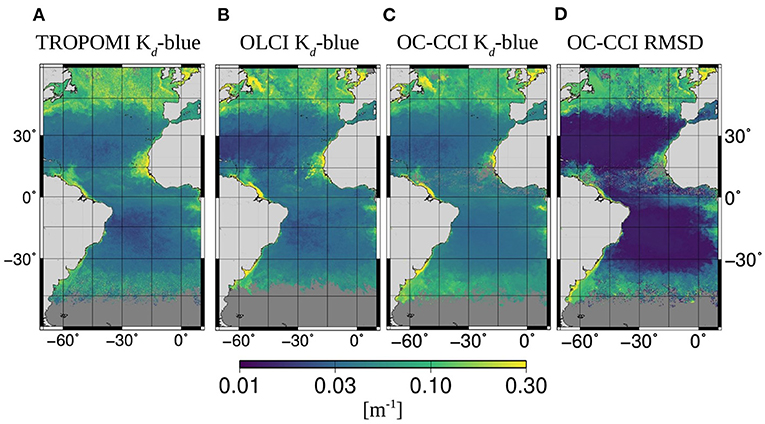
Figure 7. (A) TROPOMI, (B) OLCI, and (C) OC-CCI Kd-blue gridded at 0.083° as mean for 11 May to 9 June 2018. (D) RMSD provided in the OC-CCI product which was wavelength-converted to blue spectral range.
All above mentioned data sets were gridded to 0.083° on a daily basis for the study period. Then, the satellite Kd-blue products were intercompared (TROPOMI vs. OLCI, TROPOMI vs. OC-CCI, and OLCI vs. OC-CCI) as well as the three TROPOMI Kd products among each other either based on the full data set or on a masked data set, where values above 0.3 m−1 were excluded (Table 3). As can be seen from Figure 5, most satellite scenes are within this masked data set. Correlations between masked data sets are generally much larger than for full data sets. Significant correlation is found between TROPOMI Kd-blue and the multispectral Kd-blue, with slightly better agreement between TROPOMI and OLCI, r = 0.77 for masked data set, than between TROPOMI and OC-CCI, r = 0.74 for masked data set. We note that the VRS fit factors underlying the Kd-blue product were corrected such that TROPOMI vs. OLCI yields a slope of one for an even smaller data set (Kd-blue <0.15 m−1). For the larger masked data set (Kd-blue <0.3 m−1), a slope of unity is still found. Higher correlation is found between the multispectral data sets (r = 0.92). However, biases are observed depending on Kd-blue range. OC-CCI is larger than OLCI for small Kd-blue values, lower for medium Kd-blue values and again larger for the highest Kd-blue values in the data set. The hyperspectral UV Kd were only compared to TROPOMI Kd-blue and not to the multispectral data sets, since the wavelength conversion is less valid for the shorter wavelengths and the intercomparison indirectly contains information of the UV Kd with the multispectral products. The correlation between Kd-blue and Kd-UVA is lower than the one between Kd-blue and Kd-UVAB, contrasting the finding on the relationship between the Kd from the in-situ Kd(λ).
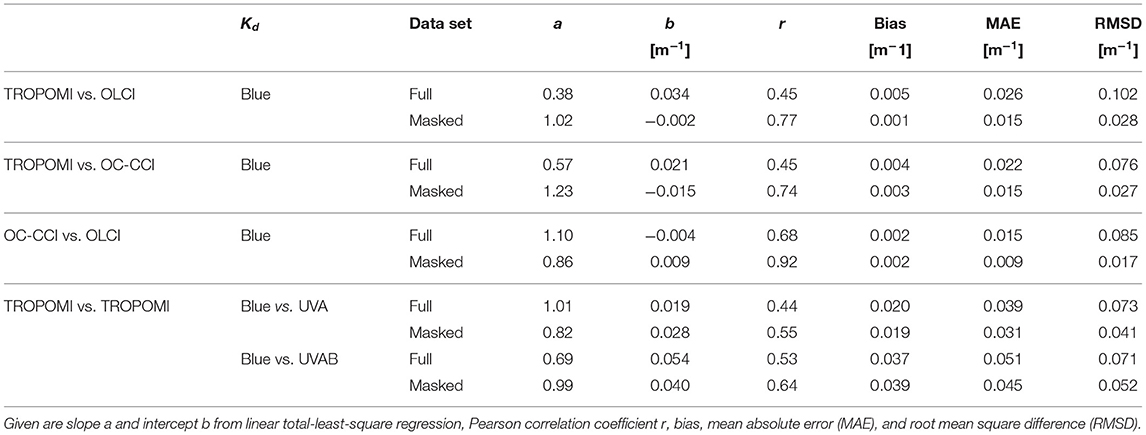
Table 3. Comparison between TROPOMI against OLCI and OC-CCI Kd-blue, Kd-UVA and Kd-UVAB calculated on daily gridded data (0.083°) over time period 11 May to 9 June 2018.
3.3. Kd Retrieval Sensitivity
The overall retrieval performance was additionally evaluated through the sensitivity analysis with respect to chosen RTM settings. The varied atmospheric and surface parameters have a different influence on the filling-in by VRS as determined by Equation 2. The influence of AOD and wind speed is largest for the blue fit window and decreases with decreasing wavelength. It is negligible for wavelengths shorter than 360 nm. The influence of the ozone concentration is largest at the short wavelengths. It is negligible for wavelengths longer than 370 nm. Results for changes in AOD and wind speed were therefore only investigated for the short-blue and blue fit window and in ozone for the UV fit window (see Supplementary Figure 6).
The influence of aerosols on the Kd-blue retrieval was already presented in Oelker et al. (2019). A constant deviation over the Kd-blue range was found which was less than −5% for the reduced AOD scenario and less than +20% for the increased AOD scenario. Figures 8A,B show that the influence of aerosols on the Kd-UVA retrieval is similar in magnitude. The effect of aerosols on the Kd-UVAB retrieval (not shown) is significantly lower with only +5% deviation for the increased AOD scenario. Figures 8C,D show the Kd-blue retrieval sensitivity with respect to wind speed. For most SZA, an altered wind speed causes deviations from the expected Kd-blue well below 5%. Larger deviations of up to ±10% are found for specific SZA at the lower SZA range (≤ 15°) depending on wind speed. The influence on Kd-UVA was even smaller as expected from the behavior of the filling-in by VRS. For the same specific SZA, deviations up to ±5% can be found (not shown). The influence of the ozone column on the Kd-UVAB retrieval is below 5% shown in Figure 8E.
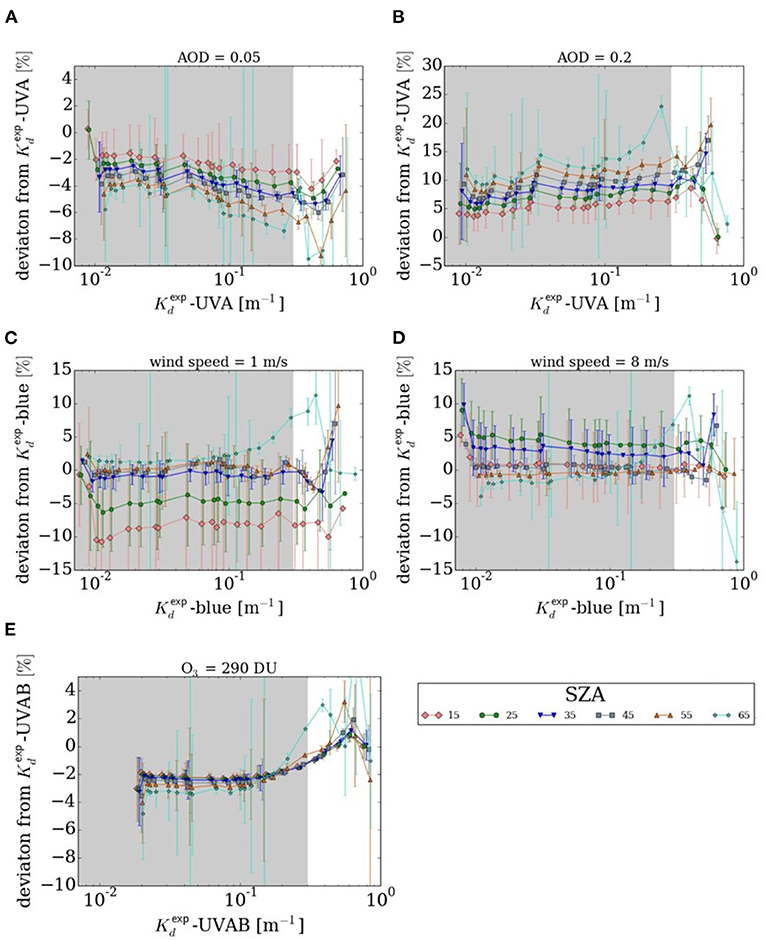
Figure 8. Deviation of derived from expected Kd in case of (A) reduced AOD, (B) increased AOD, (C) reduced wind speed, (D) increased wind speed, and (E) reduced ozone column for different SZA. Results were averaged for different VZA with the standard deviation given as errorbar. Panels (A,B) show results for Kd-UVA, (C,D) for Kd-blue, and (E) for Kd-UVAB.
Figure 9 shows the change in Kd-UVAB caused by the altered parameterizations with respect to the standard scenario, calculated as . Implemented changes cause drastic changes in Kd-UVAB. The influence of the water absorption coefficients, MAA absorption, and a high CDOM spectral slope is especially large. For the clearest waters, the water absorption by Pope and Fry (1997) leads to an increase in Kd-UVAB by 200%. A similar increase is found for MAA absorption for waters with highest Chla content. Since the reference wavelength for CDOM absorption is in the visible spectral region, an increase in CDOM spectral slope causes extreme changes in Kd-UVAB (about 200-430%). The other tested variations in CDOM parameterization in comparison lead to moderate changes in Kd-UVAB below 100%.
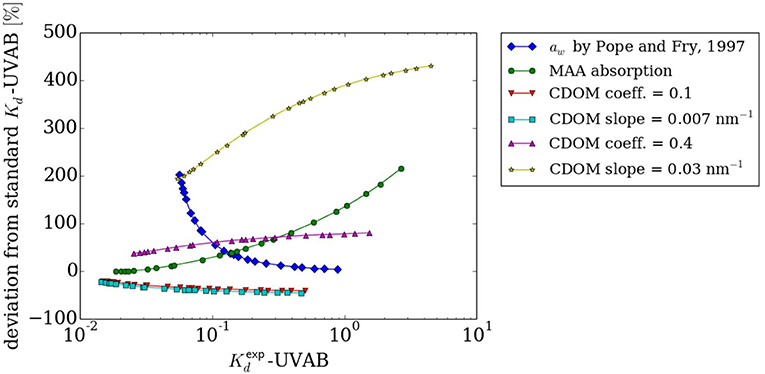
Figure 9. Deviation of -UVAB as in the modified scenario from Kd-UVAB in the standard scenario as function of -UVAB for tested variations in oceanic parameters.
Figure 10 shows retrieval sensitivity results for the oceanic parameters for Kd-UVAB. It can be seen that the retrieval performance is robust for Kd < 0.3 m−1 which is highlighted in gray in Figure 10. This finding is in accordance with what we have seen in the comparison of Kd-blue with the multispectral data sets, the TROPOMI Kd can be well-retrieved for scenes with Kd < 0.3 m−1, discussed in Section 4.3. At higher Kd values, especially when considering MAA absorption and CDOM slope coefficients at high SZA (>60°) at high VZA (>65°), large error bars are obtained for the retrievals. This effect should be kept in mind, when the algorithm is applied in high latitudes. In the investigated Atlantic region, SZA are only moderately high and satellite pixels with high VZA are screened out by the cloud filter due to their larger pixel size. In the following, we focus on the Kd range below 0.3 m−1.
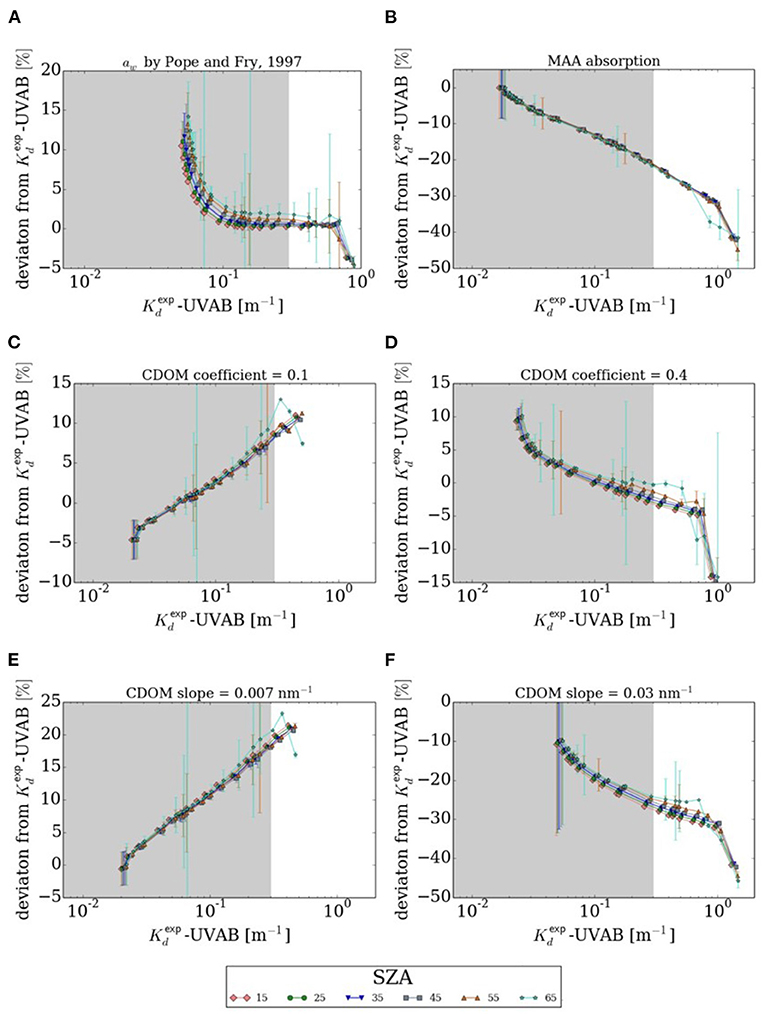
Figure 10. Deviation of derived from expected Kd-UVAB in case of (A) liquid water absorption by Pope and Fry (1997), and (B) MAA absorption, (C) reduced and (D) increased CDOM coefficient, (E) reduced and (F) increased CDOM spectral slope as function of expected Kd-UVAB. Results were averaged for different VZA with the standard deviation given as error bar.
The change in water absorption spectrum results in an overestimation of 15% for clear water scenarios which reduces to zero for high Chla scenarios, see Figure 10A. The overestimation is counter-intuitive, since is higher than . A changed parameterization often also causes a spectral change in Kd which impacts the VRS fit quality and can result in this unexpected behavior. MAA absorption leads to an underestimation which increases to 20% at Kd-UVAB = 0.3 m−1 and can be significantly higher for higher Kd-UVAB (Figure 10B). A change in CDOM coefficient causes deviations of ±10% (Figures 10C,D). A reduced CDOM spectral slope results in an overestimation of up to 20% and an increased CDOM spectral slope in an underestimation of up to 30% depending on Chla as shown in Figures 10E,F. The influence on the Kd-UVA retrieval was also evaluated with respect to water absorption and CDOM. Results are qualitatively similar, however, the influence is generally smaller. Overestimation up to 10% for the change in water absorption, overestimation of up to 10% in case of reduced CDOM spectral slope, and underestimation up to 25% in case of increased CDOM spectral slope are found. A change in CDOM coefficients leads to similar deviations of ±10%.
Table 4 summarizes the maximum model errors to expect when not correctly parameterizing the oceanic and atmospheric parameters within the TROPOMI Kd algorithm.
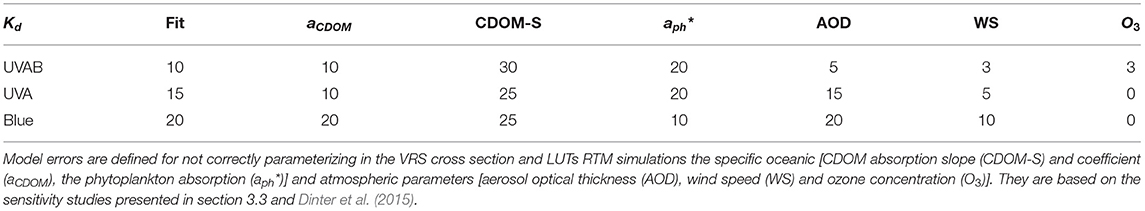
Table 4. Maximum VRS fit (fit) and model errors provided in percent for the TROPOMI Kd-UVAB, Kd-UVA, and Kd-blue retrievals <0.3 m−1.
4. Discussion
4.1. VRS Retrievability
The VRS signal in TROPOMI-measured backscattered radiances can be successfully identified using DOAS. Spatial patterns of VRS fit factors are consistent with distribution patterns of Chla, the main driver for light attenuation in the open ocean. Absolute values of VRS fit factors retrieved from TROPOMI data are in reasonable agreement with those retrieved from simulated backscattered radiances shown by the successful conversion to Kd using the RTM-based LUTs. TROPOMI VRS fits are very sensitive which is proven by low fit residuals and errors. These are one order of magnitude lower than the results obtained with DOAS from older atmospheric sensors such as GOME, SCIAMACHY, GOME-2 and OMI (Vountas et al., 2003, 2007; Dinter et al., 2015; Oelker et al., 2019). Still, a source of systematic uncertainty could be that the VRS pseudo-absorption cross section compensates the VRS spectral features less well for Chla that substantially differ from the reference value since it is calculated for Chla of 0.1 mg/m3. However, the LUT approach accounts for the variability of Chla, SZA and VZA, thereby lowering to a large extent this effect which we consider sufficient for this feasibility study. The quality of this approach could be further improved in the future by exploring iterative DOAS approaches (e.g., Richter, 2009). The conversion of TROPOMI VRS fit factors to Kd yielded better results for the UV and short-blue than for the blue fit window. A simple additive correction was necessary here.
The requirement of an additive correction factor that brings together retrieved fit factors with model predictions is a typical DOAS problem (Irie et al., 2015; Seo et al., 2019). Peters et al. (2014) pointed out that theoretical VRS pseudo-absorption spectra are not ideal for compensating VRS structures in actual DOAS measurements of clear waters. Such a mismatch could explain the requirement of a correction term. If this is the case, the effect of this mismatch on the DOAS retrieval is dependent on fit window, since we did not observe an obvious need for a correction of VRS fit factors in the short-blue and UV fit windows. Similar to this study, Oelker et al. (2019) have encountered discrepancies between retrieved VRS fit factors on satellite and simulated backscattered radiances for the sensors GOME-2, OMI, and SCIAMACHY. They managed to reduce this discrepancy by including cross sections in the DOAS fit for GOME-2 and SCIAMACHY which account for spectral features caused by instrumentation. The DOAS VRS fit on OMI data showed no sensitivity to empirical cross sections. We checked if such empirical cross sections calculated from fit residuals over cloudy scenes - which are essentially VRS-free scenes - improve the situation for TROPOMI. No impact on VRS fit factors was found. We therefore suggest a different reason for the required offset correction. While performing DOAS fits on simulated data, we observed a correlation with O4 that is strongest in the blue fit window, weaker in the short-blue fit window and weakest in the UV fit window. This correlation behaves differently for fits of actual satellite scenes. DOAS retrievals targeting O4 also often require additive correction factors, caused by an insufficient quality of the O4 absorption cross section (Spinei et al., 2015). The effect of O4 on the VRS retrieval should be further investigated to obtain a correction which is independent from other Kd products.
4.2. Ultraviolet Kd Product Quality
We relied on in-situ match-up analysis to evaluate Kd-UV product quality, on which multispectral sensors do not provide any information. Match-up analysis was not feasible for older hyperspectral sensors due to large ground pixel sizes. Before TROPOMI was launched, OMI had the best spatial resolution with 13 km by 24 km at nadir. The spatial resolution has dramatically increased with TROPOMI to 3.5 km by 7 km at nadir in 2018. This is still a large pixel size for comparison with point measurements, yet our results show a decent agreement between match-ups of hyperspectral and in-situ Kd. Since the number of stations and transects was small, we used a loose criterion for searching for match-ups. The temporal discrepancy between satellite and in-situ data certainly adds uncertainty to the comparison, however, the in-situ data for which match-ups were found was sampled in regions with rather low temporal dynamics. A search criterion of ±2 days is therefore certainly not ideal, but a good compromise. Match-ups with in-situ data were obtained within two different biogeochemical provinces, the South Atlantic Tropical Gyre (SATL) and the Western Tropical Atlantic (WTRA) according to Longhurst et al. (1995) (compare Bracher et al., 2020). The evaluation of the Kd product quality is therefore restricted to the low Kd range. The discrete station data to derive diffuse attenuation has been obtained close to the ship and uncertainty introduced by residual reflection by the ship's hull may be large. We could not quantify this effect directly, however, it should be rather small: Within Bracher et al. (2020), using the same station and Triaxus Ed data of our study phytoplankton group Chla including an uncertainty assessment was derived. It showed a homogeneous data set with no differences between closely located station and Triaxus based data. Similarly, also for our in-situ Kd data, no significant difference in values between closely located station and Triaxus data was observed. We want to highlight that we claim the Triaxus data to be not at all influenced by the ship reflectance, since the radiometry installed on the Triaxus system is towed at a distance of >500 m to the ship. Besides, our radiometric measurement set-up at the discrete stations has also been used within the international field intercomparison of radiometer measurements for ocean color validation in 2018. Results showed that measurements from this set-up was within 10% to the other radiometric measurement devices and AERONET-OC reference system in the blue wavelength region (Tilstone et al., 2020).
TROPOMI ultraviolet Kd products are promising as shown by comparison to in-situ data. Overall, there is good agreement between the TROPOMI and in-situ Kd. Quality of the in-situ Kd at short wavelengths is limited. The TriOS sensor only measures down to 320 nm and its measurement accuracy appears to decrease toward this lower end of the spectral range as observed also by other users (Nicolaus et al., 2010). Consequently, the in-situ Kd-UVAB has a spectral mismatch to the TROPOMI Kd-UVAB. Evaluated from the RTM simulations, the in-situ Kd-UVAB is expected to be about 5 to 10% lower than the satellite Kd-UVAB due to this spectral mismatch, which would imply an even larger underestimation of Kd-UVAB by TROPOMI. Potential biases of TROPOMI Kd-UVAB need to be checked in the future with high-quality radiometric measurements in the UV spectral range.
Kd-UVAB at <1 mg m−3 Chla should be larger than Kd-UVA resulting from RTM (Dinter et al., 2015), considering that CDOM absorption decreases exponentially with wavelength. A decreasing Ed with decreasing wavelength in the UV is backed up by field data (Baker and Smith, 1982; Conde et al., 2000). An exception might be waters with extremely low CDOM concentrations for which hardly any difference was observed between Kd at 310 and 465 nm (Højerslev and Aas, 1991). However, the ratio between Kd-UVA and Kd-UVAB is larger than 1 for high-Kd (>>0.3 m−1) waters where we do not expect low CDOM concentrations. The multiplicative bias might be correctable by adding an offset to the VRS fit factors in the short-blue fit window similar to the offset correction performed for Kd-blue. We did not try to correct the VRS fit factors used to calculate Kd-UVA since no reference is available at the moment.
In addition to these systematic biases, spatial patterns differ between the two Kd-UV products. Daily comparisons of the gridded products with Kd-blue showed a lower correlation with Kd-UVA than with Kd-UVAB. This observation contrasts the analysis of the spectral relationships between Kd at different wavelengths derived from the in-situ Kd(λ). However, quality of the in-situ measurements decreases with wavelength, naturally causing the correlation coefficient to decrease with wavelength. Other studies found also a decreasingly robust relationship with wavelength between Kd in the UV range and optical properties in the VIS range (Johannessen et al., 2003; Vasilkov et al., 2005; Smyth, 2011). A very robust relationship between Kd at 310 and 465 nm with correlation 0.998 was found in low-CDOM waters (Højerslev and Aas, 1991). It is therefore not generally clear, how robustly the Kd-UV are related to Kd-blue in different parts of the ocean. Light attenuation in the UV is mainly determined by CDOM and mycosporine-like amino acid (MAA) absorption. Based on its origin, CDOM has different absorption characteristics. VIS absorption is much stronger for humic substances with less steep spectral slope as opposed to mostly protein degrading substances of marine origin (Nelson and Siegel, 2002).
MAA production depends on UV irradiation and species composition (Vernet et al., 1994) and mainly influences Kd-UVAB due to MAA absorption peaks at 330 to 340 nm (for influence on Kd-UVA, see also discussion in Wang et al., 2021). Presence of MAA should therefore mainly influence Kd-UVAB. Since the link between optical properties in different spectral regions of the UV-VIS is not robust from a biogeochemical perspective, it is necessary to directly infer spectral information on light penetration, highlighting the importance of this study. By covering three spectral regions, the TROPOMI Kd products can give insight on CDOM origin and MAA production. The algorithm sensitivity analysis has shown that the Kd-UV retrievals are only moderately sensitive to the chosen RTM parameterization (see further discussion in Section 4.4). Changes in Kd-UV caused by sufficiently large changes in CDOM and phytoplankton absorption should therefore be resolvable.
More in-situ data, covering a larger Kd range and of high quality in the UV spectral region, are necessary to thoroughly evaluate Kd-UV performance. A larger data set could then also be used for estimating if a correction term for Kd-UVA is necessary as well as for quantifying this correction term.
4.3. Blue Kd Product Quality
TROPOMI Kd-blue agrees well with OLCI and OC-CCI Kd-blue. Differences between the TROPOMI, OLCI, and OC-CCI Kd-blue products are within the uncertainties given for the OC-CCI data set. Higher agreement between the two multispectral Kd-blue data sets than between multi- and hyperspectral ones has to be put into perspective, considering different ground pixel sizes of the sensors. In addition, a perfect correlation between multi- and hyperspectral products is not expected due to the uncertainty associated with the wavelength conversion. We therefore want to stress the importance of direct retrievals of Kd at other wavelengths. However, we are confident that the comparison between the hyperspectral and multispectral Kd-blue is robust in the oligotrophic waters of our study area because wavelength conversion was calculated from in-situ data measured in exactly these waters in the time period of the study. Evaluating the offset correction term from comparison with OLCI Kd-blue for small values (Kd-blue <0.15 m−1) is meaningful. Systematic biases between the data sets cannot be evaluated independently, but comparing them was possible with respect to regional differences, discrepancies for Kd-blue values above 0.15 m−1, and random errors.
Kd-blue product quality is especially good in most of the open ocean, but reduced in areas where Kd-blue > 0.3 m−1 which covers less then 5% of the world's ocean. Oelker et al. (2019) pointed out that the strength of the hyperspectral algorithm lies in low-Kd waters since the VRS signal is highest here. The retrieval sensitivity decreases with increasing Kd. In some cases, the hyperspectral algorithm seems to fail for high-Kd scenes causing obvious regional discrepancies in the TROPOMI Kd-blue product, as in the waters around Newfoundland, as compared to the multispectral sensor values. Not only the general retrieval sensitivity plays a role for the performance in productive areas, also the model setup. Because we set up our model for case-I waters, our Kd-blue product is only valid for open ocean scenarios. For coastal applications, the model has to be adjusted accordingly. The multispectral algorithms have already been adapted for high-Kd waters. The semi-analytical algorithm by Lee et al. (2005b) has shown to perform well in coastal areas (Lee et al., 2005a) and inland waters (Gomes et al., 2018) whereas the OK2-555 algorithm by Morel et al. (2007b) only covers case-1 waters.
The TROPOMI Kd-blue product outperforms other hyperspectral Kd-blue products. The product quality is higher in more productive waters than for SCIAMACHY, OMI, and GOME-2. Oelker et al. (2019) limited the Kd-blue products from these three older hyperspectral sensors to below 0.15 m−1. For these reduced data sets, correlations with OC-CCI Kd-blue around 0.65 were achieved. Since their metrics are given for daily comparisons of almost 1 year of data, we cannot compare our monthly metrics one to one. However, TROPOMI Kd-blue correlation with the multispectral Kd-blue is above 0.7 for the reduced data set including values up to 0.3 m−1. The scatter plots presented in Oelker et al. (2019) show that the hyperspectral Kd-blue already diverges from the OC-CCI Kd-blue in this Kd regime. Partially, this improvement is caused by the much lower ground pixel size of TROPOMI, which is closer to the multispectral satellite footprints, and thus reduces the representation error between the data sets. Smaller ground pixel sizes also reduce the inhomogeneity in satellite scenes improving fit quality. The improved DOAS fit quality of TROPOMI compared to its heritage sensors has also been found for UV-VIS retrievals of atmospheric trace gases (Seo et al., 2019; van Geffen et al., 2020). The spread in the scatter plots appearing as a “butterfly shape” was first observed by Dinter et al. (2015) for SCIAMACHY and has appeared in all comparisons between hyper- and multispectral Kd products so far (see Supplementary Material for TROPOMI scatter plots, Supplementary Figure 4). A systematic difference in the method or sensor measurement technique seems to cause a behavior where multispectral data see high Kd values for scenes for which the hyperspectral Kd is low and vice versa. Hardly any high-Kd scenes occur in the data sets where hyper- and multispectral Kd are in agreement. This behavior was discussed in Dinter et al. (2015) and Oelker et al. (2019) and attributed to low retrieval sensitivity for high-Kd scenes causing one wing of the distribution and to cloud contamination and large deviations from the average ocean scenario prescribed in the model causing the other wing.
4.4. TROPOMI Kd Products Uncertainty
When specifying the uncertainty of the retrieved VRS fit factor and derived Kd retrievals, several effects have to be taken into account.
Photon-shot noise, related to the number of photons collected in a single measurement and governed by the probability distribution of incoming photons (Burrows and Borrell, 2011), together with readout noise and the detector's dark signal, are the main sources of random errors in the radiance measurements.
Systematic errors in the VRS fit factors are introduced by an imperfect wavelength calibration and other instrumental features not fully calibrated for in the TROPOMI Level-1 data calibration (e.g., Ludewig et al., 2020) and uncertainties in the reference spectra of all considered atmospheric absorbers, RRS, VRS and oceanic weighting function. The uncertainties in the reference spectra are propagated into the conversion of the VRS fit factor into Kd. The LUTs, used for the conversion, further introduce systematic uncertainties by not fully representing atmospheric and oceanic optical properties. In addition, the presence of clouds could lead to significant uncertainties in satellite retrievals.
Within our retrieval the errors introduced by clouds can be considered as marginal as we apply a strict cloud filtering. The VRS fit factor error represents random errors listed above and also includes most of the systematic errors considering imperfect wavelength calibration, instrumental effects and uncertainties in the reference spectra. The results from the retrieval sensitivity studies (provided in Section 3.3, Dinter et al., 2015; Oelker et al., 2019) as quantitative assessment of the TROPOMI Kd uncertainty give information on the systematic errors introduced by specific settings of the parametrizations in SCIATRAN related to LUTs to convert the VRS fit factor into the Kd value which are discussed in the following.
The influence of atmospheric and surface parameterizations on the TROPOMI Kd retrievals can be considered generally low. Uncertainties increase with the difference between conditions found for an actual satellite scene and the average ones used in the simulated standard scenario. Largest uncertainties can be expected for scenes with high aerosol loadings, which only occur in specific regions and times of the year (Remer et al., 2008). For the Atlantic region, Saharan dust storms can have a significant influence (e.g., van der Does et al., 2016). Maritime aerosols were investigated here while terrestrial dust might have even stronger impacts. However, these critical scenes are largely removed through the strict cloud filter criterion used in the retrieval (cloud fraction of 0.01). We conclude that the here presented LUT presents a solid basis for Kd retrievals in the blue and UV spectral range. Compared to other semi-analytic approaches, the degree of assumptions made is similar. For instance, RTM simulations for the Kd method by Lee et al. (2005a) were also made for a mean global wind speed. Nevertheless, to further enhance the quality of the LUT-derived Kd in the future, the dimensionality of the LUT can be further increased to include aerosol loading, wind speed, and ozone column as input parameters that can be taken from ancillary data sets with sufficient quality. Parameters like aerosol optical depth and ozone column are even provided by the TROPOMI sensor.
With respect to the oceanic parameters, the TROPOMI Kd retrievals are rather insensitive to the chosen RTM parameterization compared to the large variability that this parameterization causes in Kd in the UV spectral range. The analysis in this study focused on the UV spectral range for two reasons: (1) the influence of oceanic parameterization on the Kd-blue was already discussed in Dinter et al. (2015) and Oelker et al. (2019) and (2) parameterization in the UV spectral range is less straight forward since a simple parameterization with Chla as used in the visible region for case I waters is not suitable (Vasilkov et al., 2002b; Morel et al., 2007a). As demonstrated by the sensitivity analysis, the exact oceanic RTM parameterization is not of importance since a change in oceanic parameter causes a change in Kd and VRS. The uncertainties of derived Kd for scenes with large differences to the reference RTM scenario are only a fraction of the change in Kd for these scenes. The sensitivity analysis results underline the robust retrievability of Kd in the UV spectral range using DOAS VRS-fits in combination with a LUT-based approach, as it had been found for Kd-blue in Dinter et al. (2015) and Oelker et al. (2019).
Kd retrievals from OC sensors show low uncertainties for the visible spectral range. For the semi-analytical OC-CCI Kd(490) algorithm, Lee et al. (2005b) report that for 90% of the retrieved Kd(490) are within 25% of the in-situ measurement. It is not yet clear if similar quality can be reached for estimation of Kd-UV from the UV bands of current OC sensors or the UV wavelengths of the upcoming PACE mission. Due to lower intensity of the solar radiation in the UV, UV measurements are generally closer to the noise level. Also, atmospheric correction is more challenging at these short wavelengths (Frouin et al., 2019). Indirect retrievals of Kd-UV from OC bands at visible wavelengths have also shown decent performance. For instance, Fichot et al. (2008) obtain Kd(380) with mean relative error of about 10% and Kd(340) and Kd(325) with mean relative error around 18% from validation with 72 in-situ match-ups. They note that presence of MAA can cause larger errors on their retrieval at the shorter wavelengths. Because of the loose relationship between the spectral range below 360 nm and the visible, (Wang et al., 2021) do not apply their neural network approach in this spectral range. We stress that a direct approach, analyzing the radiation backscattered in the UV wavelengths, should be further pursued to obtain Kd below 360 nm. In addition, the algorithm presented in this study provides an independent approach which can be used as verification for the Kd products from typical OC sensors which is especially important for the to date presented indirect Kd-UV OC data which are based on highly empirical approaches. Regions where empirical relationships might not hold are potentially identified.
Since the TROPOMI data acquisition started in May 2018, in-situ radiance measurements of underwater profiles have been very limited. The current in-situ matchup data set is too small to be included in a comprehensive error budget evaluation for our TROPOMI Kd retrievals. We use the maximum retrieval errors based on the relative VRS fit error (see discussion in Section 4.1) and the results from the retrieval sensitivity studies (provided in Section 3.3 and Dinter et al., 2015) as quantitative assessment of the TROPOMI Kd uncertainty (see Table 4). More precise calculations of the total error of the Kd retrieval are currently not possible since we do not know the distribution function of the optical and atmospheric constituents in the atmosphere and ocean. In addition, the uncertainty which is introduced for the Kd retrieval by the VRS offset correction is not quantified (see discussion in Section 4.1). We expect that the TROPOMI Kd-blue error (at least for Kd < 0.3 m−1) will not be larger than those provided for OC-CCI. This is based on the rather low theoretical retrieval uncertainties, the low relative VRS fit factor errors and that for TROPOMI Kd-blue we obtained an agreement to the OC-CCI and OLCI Kd products within OC-CCI RMSD. Since Kd-UV retrievals even showed lower relative fit error and theoretical error for atmospheric parametrizations in SCIATRAN, we consider their total error to be similar or even lower.
5. Conclusion
We successfully exploited TROPOMI's UV-VIS bands for deriving Kd in the open ocean. This first application of TROPOMI data for oceanic retrievals yields promising results. Two novel Kd products in the UV [312.5 to 338.5 nm (UVAB) and 356.5 to 390 nm (UVA)] were presented showing plausible agreement with Kd in-situ data. In addition, a Kd product in the blue was retrieved (390 to 423 nm) that showed a better performance than Kd-blue from SCIAMACHY, GOME-2 and OMI in earlier studies. Kd-blue agrees well with the wavelength-converted Kd(490) products from the multispectral data sets OLCI and OC-CCI. Differences between the three Kd-blue products were found to be within the uncertainties of the OC-CCI data set.
The robust agreement of TROPOMI Kd products with multispectral data sets and the reasonable agreement with in-situ data show that VRS can be successfully retrieved using PhytoDOAS and converted to Kd using an RTM-based LUT. Several retrieval sensitivities were investigated in detail, leading to suggestions for LUT improvements for future products. An empirical offset correction had to be applied to the VRS fit factors going into the Kd-blue product. The TROPOMI Kd-blue product is therefore not independent from the OLCI wavelength-converted Kd(490) products used as reference. A correlation with the retrieved atmospheric O4 columns was found that might cause this offset. Finding a correction that aims at the origin of this problem and is independent from other Kd data sets is desirable.
This study presents the first direct satellite retrievals of Kd in the UV spectral range. We view the TROPOMI Kd products as potentially gap-filling, providing information in wavelength regions not accessible with current and, to some extent, also planned ocean color sensors and therefore highly encourage further exploration of TROPOMI data for oceanic UV applications. Valuable information can be drawn in more than 95% of the open ocean. At the current state, TROPOMI Kd products for scenes with Kd < 0.3 m−1 show reasonable uncertainties. In clear water regions, the TROPOMI Kd products might even outperform the multispectral Kd products from a theoretical point of view. More extensive comparisons with in-situ data is necessary to answer this question. This study therefore also stresses the need for collecting high-quality in-situ radiometric measurements in the UV spectral range. As a next step, a Kd time series over the TROPOMI recording time period can be derived and analyzed on global scales to investigate temporal and spatial stability of the products. Once thoroughly validated, TROPOMI Kd-UV data sets can be used, e.g., for modeling of photochemical reaction rates of climatically important chemical substances (Smyth, 2011) and for estimating UV dose rates in combination with mixed layer depth data and UV irradiance above surface (Vasilkov et al., 2001; Smyth, 2011). Intercomparison of the three spectral TROPOMI-derived Kd in the UV-VIS region can give insight on CDOM origin and production of UV-protective pigments by phytoplankton and be used as an indicator for UV-sensitive and optically interesting regions in the open ocean.
Data Availability Statement
The TROPOMI Kd data for the three wavelengths regions and the in-situ spectrally resolved Kd data are stored at PANGAEA Bracher and Dinter (2021); Bracher et al. (2022); Oelker et al. (2022). All other data are already publicly available as cited in section 2.
Author Contributions
JO extended the algorithm to the UV domain, performed DOAS retrievals, RTM simulations, designed and carried out the sensitivity analysis, calculated the resulting Kd product as well as the comparisons with in-situ and multispectral data, and wrote the first draft of the manuscript. SL helped with comparisons of TROPOMI-derived Kd products to multispectral and in-situ data sets and their discussion. AR provided the software for the DOAS retrievals and gave advice with respect to retrieval settings and use of cloud products. AB initiated the project, gave the idea for the Kd-UV retrievals as well as provided the in-situ Kd data set, drafted the revision of the manuscript, and the answers to the reviewers. All authors reviewed the drafts presented by JO and AB, and gave valuable comments on presentation of results and their discussion as well as structure of the manuscript. All authors contributed to the article and approved the submitted version.
Funding
The main funding for this study was provided by the ESA S5P+Innovation Theme 7 Ocean Colour (S5POC) project (No 4000127533/19/I-NS). The contribution by SL was partially funded by the Deutsche Forschungsgemeinschaft (DFG, German Research Foundation)–Project number 268020496–TRR 172, within the Transregional Collaborative Research Center ArctiC Amplication: Climate Relevant Atmospheric and SurfaCe Processes, and Feedback Mechanisms (AC)3 (Project C03), and was also partially made in the framework of the state assignment of the Federal Agency for Scientific Organizations (FASO) Russia (theme 0128-2021-0014). Support for the sampling of in-situ data was provided by the Helmholtz Infrastructure Initiative FRAM. Ship time was provided under grant AWI_PS113_00.
Conflict of Interest
The authors declare that the research was conducted in the absence of any commercial or financial relationships that could be construed as a potential conflict of interest.
Publisher's Note
All claims expressed in this article are solely those of the authors and do not necessarily represent those of their affiliated organizations, or those of the publisher, the editors and the reviewers. Any product that may be evaluated in this article, or claim that may be made by its manufacturer, is not guaranteed or endorsed by the publisher.
Acknowledgments
We would like to thank the European Space Agency for funding this project in the frame of the Sentinel-5P + Innovation projects. Special thanks go to Marie-Helene Rio, project coordinator at ESA, for shaping the project focus on UV irradiation with us and supporting our ideas. We value the fruitful discussions during project meetings beneficial for the outcome of this manuscript. We further thank ESA and the Climate Change Initiative and EUMETSAT for the multispectral Kd data sets. We thank H. Xi, AWI, and S. Wiegmann, AWI, for supporting PS113 underwater light measurements and the captain, the crew and other scientists on board PS113 for their valuable support on board. We appreciate the work space and resources at the AWI and the IUP. We thank T. Dinter, AWI, for sharing Sentinel-3 visualization tools. JO was grateful for discussions on general structure and presentation of results with J. Rückert, IUP. We thank V. Rozanov, IUP, for helpful discussions regarding SCIATRAN parametrization and L. Alvarado, AWI, for assisting AB in visualizing TROPOMI detailed fit results and discussion on retrieval uncertainty. This study has evolved from the PhD thesis of Oelker (2021). Thanks to the reviewers and the editor for their valuable comments and suggestions that greatly improved this work.
Supplementary Material
The Supplementary Material for this article can be found online at: https://www.frontiersin.org/articles/10.3389/fmars.2022.787992/full#supplementary-material
References
Austin, R. W., and Petzold, T. J. (1981). The Determination of the Diffuse Attenuation Coefficient of Sea Water Using the Coastal Zone Color Scanner. Boston, MA: Springer US. doi: 10.1007/978-1-4613-3315-9_29
Baker, K. S., and Smith, R. C. (1982). Bio-optical classification and model of natural waters. Limnol. Oceanogr. 27, 500–509. doi: 10.4319/lo.1982.27.3.0500
Blum, M., Rozanov, V. V., Burrows, J. P., and Bracher, A. (2012). Coupled ocean-atmosphere radiative transfer model in the framework of software package SCIATRAN: selected comparisons to model and satellite data. Adv. Space Res. 49, 1728–1742. doi: 10.1016/j.asr.2012.02.012
Bracher, A., and Dinter, T. (2021). Mean spectral diffuse attenuation coefficients from 318 to 952 nm of underwater light profiles measured at discrete stations with radiometry during RV Polarstern cruise PS113 in the Atlantic Ocean. PANGAEA. doi: 10.1594/PANGAEA.931480
Bracher, A., Dinter, T., and von Appen, W. -J. (2022). Mean spectral diffuse attenuation coefficients from 320 to 917 nm from high spectrally resolved radiometric underwater light transmission profiles obtained by an undulating platform towed behind the ship. PANGAEA. doi: 10.1594/PANGAEA.939927
Bracher, A., Vountas, M., Dinter, T., Burrows, J. P., Röttgers, R., and Peeken, I. (2009). Quantitative observation of cyanobacteria and diatoms from space using PhytoDOAS on SCIAMACHY data. Biogeosciences 6, 751–764. doi: 10.5194/bg-6-751-2009
Bracher, A., Xi, H., Dinter, T., Mangin, A., Strass, V., von Appen, W.-J., et al. (2020). High resolution water column phytoplankton composition across the Atlantic Ocean from ship-towed vertical undulating radiometry. Front. Mar. Sci. 7, 235. doi: 10.3389/fmars.2020.00235
Bracher, A. U., and Wiencke, C. (2000). Simulation of the effects of naturally enhanced UV radiation on photosynthesis of antarctic phytoplankton. Mar. Ecol. Prog. Ser. 196, 127–141. doi: 10.3354/meps196127
Brewin, R. J., Sathyendranath, S., Muller, D., Brockmann, C., Deschamps, P.-Y., Devred, E., et al. (2015). The ocean colour climate change initiative: III. A round-robin comparison on in-water bio-optical algorithms. Remote Sens. Environ. 162, 271–294. doi: 10.1016/j.rse.2013.09.016
Burrows, J. P., Platt, U., and Borrell, P. (2011). Tropospheric Remote Sensing from Space. Berlin; Heidelberg: Springer. doi: 10.1007/978-3-642-14791-3_1
Chance, K., and Kurucz, R. L. (2010). An improved high-resolution solar reference spectrum for earth's atmosphere measurements in the ultraviolet, visible, and near infrared. J. Quant. Spectrosc. Radiat. Transfer 111, 1289–1295. doi: 10.1016/j.jqsrt.2010.01.036
Conde, D., Aubriot, L., and Sommaruga, R. (2000). Changes in UV penetration associated with marine intrusions and freshwater discharge in a shallow coastal Lagoon of the southern Atlantic Ocean. Marine Ecology Progress Series 207, 19–31. doi: 10.3354/meps207019
Cullen, J. J., and Neale, P. J. (1994). Ultraviolet radiation, ozone depletion, and marine photosynthesis. Photosynth. Res. 39, 303–320. doi: 10.1007/BF00014589
Dinter, T., Rozanov, V. V., Burrows, J. P., and Bracher, A. (2015). Retrieving the availability of light in the ocean utilising spectral signatures of vibrational Raman scattering in hyper-spectral satellite measurements. Ocean Sci. 11, 373–389. doi: 10.5194/os-11-373-2015
EUMETSAT (2021). Recommendations for Sentinel-3 OLCI Ocean Colour Product Validations in Comparison with In Situ Measurements-Matchup Protocols. Technical report, EUMETSAT.
Fichot, C. G., Sathyendranath, S., and Miller, W. L. (2008). SeaUV and seaUVc: algorithms for the retrieval of UV/visible diffuse attenuation coefficients from ocean color. Remote Sens. Environ. 112, 1584–1602. doi: 10.1016/j.rse.2007.08.009
Frouin, R., and Iacobellis, S. F. (2002). Influence of phytoplankton on the global radiation budget. J. Geophys. Res. Atmos. 107, ACL 5-1?ACL 5-10. doi: 10.1029/2001JD000562
Frouin, R., Ramon, D., Boss, E., Jolivet, D., Compiégne, M., Tan, J., et al. (2018). Satellite radiation products for ocean biology and biogeochemistry: needs, state-of-the-art, gaps, development priorities, and opportunities. Front. Mar. Sci. 5, 3. doi: 10.3389/fmars.2018.00003
Frouin, R. J., Franz, B. A., Ibrahim, A., Knobelspiesse, K., Ahmad, Z., Cairns, B., et al. (2019). Atmospheric correction of satellite ocean-color imagery during the pace era. Front. Earth Sci. 7, 145. doi: 10.3389/feart.2019.00145
Gomes, A., Bernardo, N., Carmo, A., Rodrigues, T., and Alcantara, E. (2018). Diffuse attenuation coefficient retrieval in cdom dominated inland water with high chlorophyll-a concentrations. Remote Sens. 10, 1063. doi: 10.3390/rs10071063
Grainger, J. F., and Ring, J. (1962). Anomalous Fraunhofer line profiles. Nature 193, 762. doi: 10.1038/193762a0
Haltrin, V. I., and Kattawar, G. W. (1993). Self-consistent solutions to the equation of transfer with elastic and inelastic scattering in oceanic optics: I. Model. Appl. Opt. 32, 5356–5367. doi: 10.1364/AO.32.005356
Højerslev, N., and Aas, E. (1991). A relationship for the penetration of ultraviolet B radiation into the Norwegian sea. J. Geophys. Res. Oceans 96, 17003–17005. doi: 10.1029/91JC01822
IOCCG (2008). Why Ocean Colour? The Societal Benefits of Ocean-Colour Technology. Reports of the International Ocean Colour Coordinating Group. IOCCG, Dartmouth, NS.
Irie, H., Nakayama, T., Shimizu, A., Yamazaki, A., Nagai, T., Uchiyama, A., et al. (2015). Evaluation of max-DOAS aerosol retrievals by coincident observations using crds, lidar, and sky radiometer Intsukuba, Japan. Atmos. Meas. Tech. 8, 2775–2788. doi: 10.5194/amt-8-2775-2015
Jamet, C., Loisel, H., and Dessailly, D. (2012). Retrieval of the spectral diffuse attenuation coefficient kd(λ) in open and coastal ocean waters using a neural network inversion. J. Geophys. Res. Oceans 117, C10. doi: 10.1029/2012JC008076
Johannessen, S. C., Miller, W. L., and Cullen, J. J. (2003). Calculation of UV attenuation and colored dissolved organic matter absorption spectra from measurements of ocean color. J. Geophys. Res. Oceans 108, C9. doi: 10.1029/2000JC000514
Kara, A. B., Hurlburt, H. E., Rochford, P. A., and O'Brien, J. J. (2004). The impact of water turbidity on interannual sea surface temperature simulations in a layered global ocean model. J. Phys. Oceanogr. 34, 345–359. doi: 10.1175/1520-0485(2004)034<0345:TIOWTO>2.0.CO;2
Lee, Z., Carder, K. L., and Arnone, R. A. (2002). Deriving inherent optical properties from water color: a multiband quasi-analytical algorithm for optically deep waters. Appl. Opt. 41, 5755–5772. doi: 10.1364/AO.41.005755
Lee, Z., Hu, C., Shang, S., Du, K., Lewis, M., Arnone, R., et al. (2013). Penetration of UV-visible solar radiation in the global oceans: insights from ocean color remote sensing. J. Geophys. Res. Oceans 118, 4241–4255. doi: 10.1002/jgrc.20308
Lee, Z.-P., Darecki, M., Carder, K. L., Davis, C. O., Stramski, D., and Rhea, W. J. (2005a). Diffuse attenuation coefficient of downwelling irradiance: an evaluation of remote sensing methods. J. Geophys. Res. Oceans 110, C02017. doi: 10.1029/2004JC002573
Lee, Z.-P., Du, K.-P., and Arnone, R. (2005b). A model for the diffuse attenuation coefficient of downwelling irradiance. J. Geophys. Res. Oceans 110, C02016. doi: 10.1029/2004JC002275
Lewis, M. R., Carr, M.-E., Feldman, G. C., Esaias, W., and McClain, C. (1990). Influence of penetrating solar radiation on the heat budget of the equatorial Pacific Ocean. Nature 347, 543–545. doi: 10.1038/347543a0
Longhurst, A., Sathyendranath, S., Platt, T., and Caverhill, C. (1995). An estimate of global primary production in the ocean from satellite radiometer data. J. Plankton Res. 17, 1245–1271. doi: 10.1093/plankt/17.6.1245
Ludewig, A., Kleipool, Q., Bartstra, R., Landzaat, R., Leloux, J., Loots, E., et al. (2020). In-flight calibration results of the TROPOMI payload on board the Sentinel-5 Precursor satellite. Atmos. Meas. Tech. 13, 3561–3580. doi: 10.5194/amt-13-3561-2020
Mason, J. D., Cone, M. T., and Fry, E. S. (2016). Ultraviolet (250-550 nm) absorption spectrum of pure water. Appl. Opt. 55, 7163–7172. doi: 10.1364/AO.55.007163
Miller, A. J., Alexander, M. A., Boer, G. J., Chai, F., Denman, K., Erickson, D. J., et al. (2003). Potential feedbacks between Pacific Ocean ecosystems and interdecadal climate variations. Bull. Am. Meteorol. Soc. 84, 617–634. doi: 10.1175/BAMS-84-5-617
Mobley, C., and Sundman, L. (2013). HydroLight 5.2 - EcoLight 5.2 Technical Documentation. Technical report, Sequoia Scientific, Inc.
Morel, A., and Antoine, D. (1994). Heating rate within the upper ocean in relation to its bio-optical state. J. Phys. Oceanogr. 24, 1652–1665. doi: 10.1175/1520-0485(1994)024<1652:HRWTUO>2.0.CO;2
Morel, A., Claustre, H., Antoine, D., and Gentili, B. (2007a). Natural variability of bio-optical properties in case 1 waters: attenuation and reflectance within the visible and near-UV spectral domains, as observed in south pacific and mediterranean waters. Biogeosciences 4, 913–925. doi: 10.5194/bg-4-913-2007
Morel, A., Huot, Y., Gentili, B., Werdell, P. J., Hooker, S. B., and Franz, B. A. (2007b). Examining the consistency of products derived from various ocean color sensors in open ocean (case 1) waters in the perspective of a multi-sensor approach. Remote Sens. Environ. 111, 69–88. doi: 10.1016/j.rse.2007.03.012
Morel, A., and Maritorena, S. (2001). Bio-optical properties of oceanic waters: a reappraisal. J. Geophys. Res. Oceans 106, 7163–7180. doi: 10.1029/2000JC000319
Nelson, N. B., and Siegel, D. A. (2002). “Chapter 11: Chromophoric DOM in the open ocean,” in Biogeochemistry of Marine Dissolved Organic Matter, eds D. A. Hansell and C. A. Carlson (San Diego, CA: Academic Press), 547–578. doi: 10.1016/B978-012323841-2/50013-0
Nicolaus, M., Hudson, S. R., Gerland, S., and Munderloh, K. (2010). A modern concept for autonomous and continuous measurements of spectral Albedo and transmittance of sea ice. Cold Regions Sci. Technol. 62, 14–28. doi: 10.1016/j.coldregions.2010.03.001
Oelker, J. (2021). Suitability of atmospheric satellite sensors for ocean color applications (PhD thesis). Department of Physics and Engineering, University Bremen, Bremen, Germany.
Oelker, J., Richter, A., Dinter, T., Rozanov, V. V., Burrows, J. P., and Bracher, A. (2019). Global diffuse attenuation derived from vibrational raman scattering detected in hyperspectral backscattered satellite spectra. Opt. Express 27, A829–A855. doi: 10.1364/OE.27.00A829
Oelker, J., Richter, A., Losa, S. N., Alvarado, L. M. A., and Bracher, A. (2022). Mean spectral diffuse attenuation coefficients averaged for 320 nm to 338.5 nm (UVAB), 356.5 nm to 390 nm (UVA) and 390 nm to 423 nm (blue) in the Atlantic Ocean from Sentinel-5P instrument TROPOMI. PANGAEA. doi: 10.1594/PANGAEA.940352
Ohlmann, J. C., Siegel, D. A., and Gautier, C. (1996). Ocean mixed layer radiant heating and solar penetration: a global analysis. J. Clim. 9, 2265–2280. doi: 10.1175/1520-0442(1996)009<2265:OMLRHA>2.0.CO;2
Okamura, Y., Yamada, Y., Urabe, T., Ando, S., and Tanaka, K. (2019). “In-orbit observation of the Second Generation Global Imager (SGLI) and study towards follow-on imaging radiometer,” in IGARSS 2019 - 2019 IEEE International Geoscience and Remote Sensing Symposium (Yokohama), 5792–5795. doi: 10.1109/IGARSS.2019.8900124
Perner, D., and Platt, U. (1979). Detection of nitrous acid in the atmosphere by differential optical absorption. Geophys. Res. Lett. 6, 917–920. doi: 10.1029/GL006i012p00917
Peters, E., Wittrock, F., Richter, A., Alvarado, L. M. A., Rozanov, V. V., and Burrows, J. P. (2014). Liquid water absorption and scattering effects in DOAS retrievals over oceans. Atmos. Meas. Tech. 7, 4203–4221. doi: 10.5194/amt-7-4203-2014
Platt, T. (1986). Primary production of the ocean water column as a function of surface light intensity: algorithms for remote sensing. Deep Sea Res. A Oceanogr. Res. Pap. 33, 149–163. doi: 10.1016/0198-0149(86)90115-9
Platt, U., and Stutz, J. (2008). Differential Optical Absorption Spectroscopy. Berlin; Heidelberg: Springer.
Pope, R. M., and Fry, E. S. (1997). Absorption spectrum (380-700 nm) of pure water. II. Integrating cavity measurements. Appl. Opt. 36, 8710–8723. doi: 10.1364/AO.36.008710
Prieur, L., and Sathyendranath, S. (1981). An optical classification of coastal and oceanic waters based on the specific spectral absorption curves of phytoplankton pigments, dissolved organic matter, and other particulate materials1. Limnol. Oceanogr. 26, 671–689. doi: 10.4319/lo.1981.26.4.0671
Remer, L. A., Kleidman, R. G., Levy, R. C., Kaufman, Y. J., Tanré, D., Mattoo, S., et al. (2008). Global aerosol climatology from the MODIS satellite sensors. J. Geophys. Res. Atmos. 113, D14SD07. doi: 10.1029/2007JD009661
Richter, A. (1997). Measurements of stratospheric trace species above Bremen, 53N using absorption spectroscopy (dissertation). University of Bremen, Bremen, Germany.
Richter, A. (2009). Algorithm Theoretical Basis Document for the GOME-2 Rapid Volcanic SO2 Product. Technical report, Insitute of Environmental Physics, University of Bremen.
Rothman, L. S., Gordon, I. E., Babikov, Y., Barbe, A., Benner, D. C., Bernath, P. F., et al. (2013). The HITRAN2012 molecular spectroscopic database. J. Quant. Spectrosc. Radiat. Transfer 130, 4–50. doi: 10.1016/j.jqsrt.2013.07.002
Rozanov, V. V., Dinter, T., Rozanov, A. V., Wolanin, A., Bracher, A., and Burrows, J. P. (2017). Radiative transfer modeling through terrestrial atmosphere and ocean accounting for inelastic processes: Software package SCIATRAN. J. Quant. Spectrosc. Radiat. Transfer 194, 65–85. doi: 10.1016/j.jqsrt.2017.03.009
Rozanov, V. V., Rozanov, A. V., Kokhanovsky, A. A., and Burrows, J. P. (2014). Radiative transfer through terrestrial atmosphere and ocean: software package SCIATRAN. J. Quant. Spectrosc. Radiat. Transfer 133, 13–71. doi: 10.1016/j.jqsrt.2013.07.004
Sadeghi, A., Dinter, T., Vountas, M., Taylor, B. B., Altenburg-Soppa, M., Peeken, I., et al. (2012). Improvement to the PhytoDOAS method for identification of coccolithophores using hyper-spectral satellite data. Ocean Sci. 8, 1055–1070. doi: 10.5194/os-8-1055-2012
Sathyendranath, S., Brewin, R., Brockmann, C., Brotas, V., Calton, B., Chuprin, A., et al. (2019). An ocean-colour time series for use in climate studies: the experience of the ocean-colour climate change initiative (OC-CCI). Sensors 19, 4285. doi: 10.3390/s19194285
Sathyendranath, S., GoUVeia, A. D., Shetye, S. R., Ravindran, P., and Platt, T. (1991). Biological control of surface temperature in the arabian sea. Nature 349, 54–56. doi: 10.1038/349054a0
Sathyendranath, S., Jackson, T., Brockmann, C., Brotas, V., Calton, B., Chuprin, A., et al. (2020). ESA Ocean Colour Climate Change Initiative (ocean_colour_cci): Global Chlorophyll-A Data Products Gridded on a Sinusoidal Projection, Version 4.2. Centre for Environmental Data Analysis. Technical report.
Sathyendranath, S., Platt, T., Caverhill, C. M., Warnock, R. E., and Lewis, M. R. (1989). Remote sensing of oceanic primary production: computations using a spectral model. Deep Sea Res. A. Oceanogr. Res. Pap. 36, 431–453. doi: 10.1016/0198-0149(89)90046-0
Seegers, B. N., Stumpf, R. P., Schaeffer, B. A., Loftin, K. A., and Werdell, P. J. (2018). Performance metrics for the assessment of satellite data products: an ocean color case study. Opt. Express 26, 7404–7422. doi: 10.1364/OE.26.007404
Seo, S., Richter, A., Blechschmidt, A.-M., Bougoudis, I., and Burrows, J. P. (2019). First high-resolution bro column retrievals from tropomi. Atmos. Meas. Tech. 12, 2913–2932. doi: 10.5194/amt-12-2913-2019
Serdyuchenko, A., Gorshelev, V., Weber, M., Chehade, W., and Burrows, J. P. (2014). High spectral resolution ozone absorption cross-sections-Part 2: temperature dependence. Atmos. Meas. Tech. 7, 625–636. doi: 10.5194/amt-7-625-2014
Shell, K. M., Frouin, R., Nakamoto, S., and Somerville, R. C. J. (2003). Atmospheric response to solar radiation absorbed by phytoplankton. J. Geophys. Res. Atmos. 108, D15. doi: 10.1029/2003JD003440
Shen, M., Duan, H., Cao, Z., Xue, K., Loiselle, S., and Yesou, H. (2017). Determination of the downwelling diffuse attenuation coefficient of lake water with the sentinel-3a OLCI. Remote Sens. 9, 1246. doi: 10.3390/rs9121246
Siegel, D. A., Maritorena, S., Nelson, N. B., Hansell, D. A., and Lorenzi-Kayser, M. (2002). Global distribution and dynamics of colored dissolved and detrital organic materials. J. Geophys. Res. Oceans 107, 21-1–21-14. doi: 10.1029/2001JC000965
Sinha, R. P., and Hader, D.-P. (2002). UV-induced dna damage and repair: a review. Photochem. Photobiol. Sci. 1, 225–236. doi: 10.1039/b201230h
Smyth, T. J. (2011). Penetration of UV irradiance into the global ocean. J. Geophys. Res. Oceans 116, C11. doi: 10.1029/2011JC007183
Spinei, E., Cede, A., Herman, J., Mount, G. H., Eloranta, E., Morley, B., et al. (2015). Ground-based direct-sun doas and airborne max-DOAS measurements of the collision-induced oxygen complex, o2o2, absorption with significant pressure and temperature differences. Atmos. Meas. Tech. 8, 793–809. doi: 10.5194/amt-8-793-2015
Tanskanen, A., Maatta, A., Krotkov, N., Herman, J., Kaurola, J., Koskela, T., et al. (2006). Surface ultraviolet irradiance from omi. IEEE Trans. Geosci. Remote Sens. 44, 1267–1271. doi: 10.1109/TGRS.2005.862203
Thalman, R., and Volkamer, R. (2013). Temperature dependent absorption cross-sections of O2-O2 collision pairs between 340 and 630 nm and at atmospherically relevant pressure. Phys. Chem. Chem. Phys. 15, 15371–15381. doi: 10.1039/c3cp50968k
Tilstone, G., Dall2019Olmo, G., Hieronymi, M., Ruddick, K., Beck, M., Ligi, M., et al. (2020). Field intercomparison of radiometer measurements for ocean colour validation. Remote Sens. 12, 10. doi: 10.3390/rs12101587
van der Does, M., Korte, L. F., Munday, C. I., Brummer, G.-J. A., and Stuut, J.-B. W. (2016). Particle size traces modern Saharan dust transport and deposition across the equatorial North Atlantic. Atmos. Chem. Phys. 16, 13697–13710. doi: 10.5194/acp-16-13697-2016
van Geffen, J., Boersma, K. F., Eskes, H., Sneep, M., ter Linden, M., Zara, M., et al. (2020). S5p TROPOMI no2 slant column retrieval: method, stability, uncertainties and comparisons with OMI. Atmos. Meas. Tech. 13, 1315–1335. doi: 10.5194/amt-13-1315-2020
van Geffen, J., Eskes, H., Boersma, K., Maasakkers, J., and Veefkind, J. (2019). TROPOMI ATBD of the total and tropospheric NO2 data products. Technical report, Royal Netherlands Meteorological Institute.
Vandaele, A., Hermans, C., Simon, P., Carleer, M., Colin, R., Fally, S., et al. (1998). Measurements of the no2 absorption cross-section from 42 000 cm-1 to 10 000 cm-1 (238-1000 nm) at 220 k and 294 k. J. Quant. Spectrosc. Radiat. Transfer 59, 171–184. doi: 10.1016/S0022-4073(97)00168-4
Vasilkov, A., Krotkov, N., Herman, J., Mcclain, C., Arrigo, K., and Robinson, W. (2001). Global mapping of underwater UV irradiances and dna-weighted exposures using total ozone mapping spectrometer and sea-viewing wide field-of-view sensor data products. J. Geophys. Res. 106, 27205–27219. doi: 10.1029/2000JC000373
Vasilkov, A. P., Herman, J. R., Ahmad, Z., Kahru, M., and Mitchell, B. G. (2005). Assessment of the ultraviolet radiation field in ocean waters from space-based measurements and full radiative-transfer calculations. Appl. Opt. 44, 2863–2869. doi: 10.1364/AO.44.002863
Vasilkov, A. P., Herman, J. R., Krotkov, N. A., Kahru, M., Mitchell, B. G., and Hsu, C. (2002a). Problems in assessment of the ultraviolet penetration into natural waters from space-based measurements. Opt. Eng. 41, 3019–3027. doi: 10.1117/1.1516822
Vasilkov, A. P., Joiner, J., Gleason, J., and Bhartia, P. K. (2002b). Ocean Raman scattering in satellite backscatter UV measurements. Geophys. Res. Lett. 29, 14–18. doi: 10.1029/2002GL014955
Veefkind, J., Aben, I., McMullan, K., Förster, H., de Vries, J., Otter, G., et al. (2012). Tropomi on the esa sentinel-5 precursor: a GMEs mission for global observations of the atmospheric composition for climate, air quality and ozone layer applications. Remote Sens. Environ. 120, 70–83. doi: 10.1016/j.rse.2011.09.027
Vernet, M., Brody, E. A., Holm-Hansen, O., and Mitchell, B. G. (1994). The response of Antarctic phytoplankton to ultraviolet radiation: absorption, photosynthesis, and taxonomic composition. Antarctic Res. Ser. 62, 143–158. doi: 10.1029/AR062p0143
Vodacek, A., and Blough, N. V. (1997). “Seasonal variation of CDOM in the Middle Atlantic Bight: terrestrial inputs and photooxidation,” in Ocean Optics XIII, eds S. G. Ackleson and R. J. Frouin (Halifax, Nova Scotia: International Society for Optics and Photonics, SPIE), 132–137. doi: 10.4319/lo.1997.42.4.0674
von Appen, W.-J., Strass, V. H., Bracher, A., Xi, H., Hörstmann, C., Iversen, M. H., et al. (2020). High-resolution physical-biogeochemical structure of a filament and an eddy of upwelled water off northwest africa. Ocean Sci. 16, 253–270. doi: 10.5194/os-16-253-2020
Vonk, F. (2018). Input/Output Data Specification for the TROPOMI L01b Data Processor. Technical report, Royal Netherlands Meteorological Institute.
Vountas, M., Dinter, T., Bracher, A., Burrows, J. P., and Sierk, B. (2007). Spectral studies of ocean water with space-borne sensor SCIAMACHY using Differential Optical Absorption Spectroscopy (DOAS). Ocean Sci. 3, 429–440. doi: 10.5194/os-3-429-2007
Vountas, M., Richter, A., Wittrock, F., and Burrows, J. P. (2003). Inelastic scattering in ocean water and its impact on trace gas retrievals from satellite data. Atmos. Chem. Phys. 3, 1365–1375. doi: 10.5194/acp-3-1365-2003
Vountas, M., Rozanov, V., and Burrows, J. (1998). Ring effect: impact of rotational raman scattering on radiative transfer in earth's atmosphere. J. Quant. Spectrosc. Radiat. Transfer 60, 943–961. doi: 10.1016/S0022-4073(97)00186-6
Walrafen, G. E. (1966). Raman spectral studies of the effects of temperature on water and electrolyte solutions. J. Chem. Phys. 44, 1546–1558. doi: 10.1063/1.1726891
Wang, M., Son, S., and Harding, L. W. Jr. (2009). Retrieval of diffuse attenuation coefficient in the chesapeake bay and turbid ocean regions for satellite ocean color applications. J. Geophys. Res. Oceans 114, C10. doi: 10.1029/2009JC005286
Wang, Y., Lee, Z., Wei, J., Shang, S., Wang, M., and Lai, W. (2021). Extending satellite ocean color remote sensing to the near-blue ultraviolet bands. Remote Sens. Environ. 253, 112228. doi: 10.1016/j.rse.2020.112228
Wittrock, F., Richter, A., Oetjen, H., Burrows, J. P., Kanakidou, M., Myriokefalitakis, S., et al. (2006). Simultaneous global observations of glyoxal and formaldehyde from space. Geophys. Res. Lett. 33, L16804. doi: 10.1029/2006GL026310
Wolanin, A., Rozanov, V. V., Dinter, T., Noël, S., Vountas, M., Burrows, J. P., et al. (2015). Global retrieval of marine and terrestrial chlorophyll fluorescence at its red peak using hyperspectral top of atmosphere radiance measurements: feasibility study and first results. Remote Sens. Environ. 166, 243–261. doi: 10.1016/j.rse.2015.05.018
Zepp, R. G., Callaghan, T. V., and Erickson, I. I. I. D. J. (2003). Interactive effects of ozone depletion and climate change on biogeochemical cycles. Photochem. Photobiol. Sci. 2, 51–61. doi: 10.1039/b211154n
Keywords: diffuse attenuation coefficient, ultraviolet radiation, TROPOMI, DOAS, ocean color
Citation: Oelker J, Losa SN, Richter A and Bracher A (2022) TROPOMI-Retrieved Underwater Light Attenuation in Three Spectral Regions in the Ultraviolet and Blue. Front. Mar. Sci. 9:787992. doi: 10.3389/fmars.2022.787992
Received: 01 October 2021; Accepted: 14 February 2022;
Published: 17 March 2022.
Edited by:
Griet Neukermans, Ghent University, BelgiumReviewed by:
Zhongping Lee, University of Massachusetts Boston, United StatesJian Xu, National Space Science Center (CAS), China
Cédric Jamet, UMR8187 Laboratoire d'océanologie et de Géosciences (LOG), France
Copyright © 2022 Oelker, Losa, Richter and Bracher. This is an open-access article distributed under the terms of the Creative Commons Attribution License (CC BY). The use, distribution or reproduction in other forums is permitted, provided the original author(s) and the copyright owner(s) are credited and that the original publication in this journal is cited, in accordance with accepted academic practice. No use, distribution or reproduction is permitted which does not comply with these terms.
*Correspondence: Astrid Bracher, YXN0cmlkLmJyYWNoZXJAYXdpLmRl