 Hector M. Guzman
 Caroline M. Collatos
 Catalina G. Gomez
- 1Smithsonian Tropical Research Institute, Panama, Panama
- 2School for the Environment, University of Massachusetts, Boston, MA, United States
- 3Anderson Cabot Center for Ocean Life, New England Aquarium, Boston, MA, United States
- 4Centro de Ciencias del Mar y Limnología, Universidad de Panama, Panama, Panama
- 5Coiba Scientific Station (COIBA AIP), City of Knowledge, Panama, Panama
Whale sharks (Rhincodon typus) are found circumglobally in tropical, subtropical, and warm temperate waters, and their known seasonal aggregations and migratory movements are influenced by factors such as ocean currents, thermobiological systems, and patterns of productivity. Several locations in the eastern tropical Pacific Ocean are known habitats for R. typus; Although it has long been known that whale sharks aggregate along the Panama coast, little is known in relation to their movement patterns, behavior, and habitat use. In this study, we investigated the movements and behaviors of R. typus tagged in Panama in relation to oceanographic variables and examined the overlap of foraging habitat and migratory routes with marine protected areas (MPAs), industrial fishing areas, and marine traffic. Satellite tracks from 30 R. typus tagged in the coastal waters of Panama were examined, including nine tags suspicious of earlier detachment. A hidden Markov model was then used to identify different behavioral states (foraging and migrating) and their relationships with environmental variables (sea surface temperature, primary productivity, chlorophyll-a concentrations, and eddy location/speed) Tracks were also superimposed on maps of MPAs, industrial fishing areas, and regional marine vessel traffic to identify the degree of overlap. Rhincodon typus foraged mainly within the Panamanian exclusive economic zone but also moved north and south along the coast and out to the open ocean. Significant differences in environmental conditions were found between sites in which foraging and migrating behaviors were recorded. Higher productivity and chlorophyl concentration were associated with foraging behavior, while higher eddy speeds were observed when sharks migrated. Rhincodon typus used MPAs; however, there was a high degree of overlap between their habitat and areas of industrial fishing and marine vessel traffic. Our results highlight the use of the coastal waters of Panama, oceanic seamounts, and ridges, MPAs and industrial fishing areas by R. typus for foraging and migration. Additionally, our findings highlight the importance of satellite tracking studies for understanding the behavior and habitat use of highly mobile migratory species, such as R. typus.
1 Introduction
Whale sharks (Rhincodon typus) are the largest fish species in the world (Colman, 1997; Rowat and Brooks, 2012), measuring up to 20 m in length (Chen et al., 1997). These filter feeders are found circumglobally in warm and temperate waters (Colman, 1997; Rowat and Brooks, 2012; Meekan et al., 2017; Norman et al., 2017; Guzman et al., 2021) and follow oceanic currents, undergoing vast transoceanic migrations of more than 20,000 km (Guzman et al., 2018). Rhincodon typus inhabits and seasonally aggregates in both coastal and oceanic areas; large seasonal aggregations have been documented in Madagascar, Mozambique, the Galapagos, the Seychelles, the Maldives, Ningaloo Reef in Australia, Isla Contoy off Mexico, and in the northern waters of the Gulf of Mexico (de la Parra Venegas et al., 2011; Rowat and Brooks, 2012; Meekan et al., 2017; Norman et al., 2017; Diamant et al., 2018). These seasonal aggregations and migration routes are largely driven by oceanic currents, plankton blooms, and fish and coral spawning events (Heyman et al., 2001; Riley et al., 2010).
Studies about R. typus aggregations and habitat use have been documented and studied around the globe and have been related to feeding areas (Ketchum et al., 2012; Acuña-Marrero et al., 2014), reproduction (Rowat and Brooks, 2012; Acuña-Marrero et al., 2014), and movements (Acuña-Marrero et al., 2014). However, the use of the coastal Pacific waters of Panama by this species is not well understood. Rhincodon typus was first documented in Panamanian waters as early as 1932 (Gudger, 1938; Hueter et al., 2013). Located off the Pacific coast off Panama, the Coiba National Park (CNP) is a habitat for R. typus during the months of December to March (Hearn et al., 2016; Guzman et al., 2018). During this time, R. typus appears to exhibit seasonal presence and is frequently observed in an area called Wahoo Rock in the CNP (Guzman et al., 2018). In 2011, Guzman et al. (2018) tagged three female R. typus with towed satellite transmitters in this area. One of these tagged sharks was detected in Panamanian coastal waters for a total of 116 d, spent 226 d between Panama and Clipperton Island, and completed a transpacific journey of over 20,000 km to the Marianas Trench in 841 d (Guzman et al., 2018). The Panamanian population of whale sharks has shown global genetic connectivity with the Arabian Gulf, Western Indian Ocean and Mexico (Guzman et al., 2021). While these results suggest that Panamanian waters are an important habitat for R. typus, there is still extremely limited research on their presence and movement in this area.
R. typus is highly threatened by illegal fishing, boating activity, and bycatch within Panamanian waters and adjacent coastal areas (Guzman H, personal observation). As elasmobranchs are slow-growing species with late maturity and relatively low fecundity (Hoenig and Gruber, 1990; Joung et al., 1996), R. typus is highly vulnerable to population decline and overfishing, and currently listed as ‘globally endangered’ on the IUCN Red List (Pierce and Norman, 2016). Thus, research focused on the population demographics, occurrence, movements, habitats, and overlap of R. typus with anthropogenic factors, such vessel traffic, and industrial fishing grounds, can further both local and global knowledge of this endangered species and aid conservation efforts.
To advance our understanding of the presence, habitat use, migratory movements, and potential overlap with marine protected areas (MPAs), industrial fishing areas, and marine traffic, this project deployed satellite tags on R. typus along the Pacific coast of Panama. The specific objectives of the study were to (1) present comparative analyses for the interpretation of presumably detached or fre-floating tags (sensu Hearn et al., 2013) trajectories synchronized with real-time surface currents and winds; (2) illustrate the use of the CNP and surrounding areas by R. typus; (3) investigate potential relationships between sea surface temperature (STT), chlorophyll-a concentrations, daily primary productivity, eddies, bathymetry, and R. typus movements; and (4) examine R. typus habit use and migration routes in relation to MPAs, industrial fishing areas, and regional marine traffic.
2 Materials and Methods
2.1 Tagging Procedures
R. typus individuals were tagged between 2007 and 2012 at several locations in Pacific Panama with near real-time tether/towed satellite transmitters (model SPOT 253C; Wildlife Computers, Redmond, WA, USA). The tag model used specifies a battery life of 280 d, assuming 250 Argos transmissions per day, which occur only when the fish is swimming near the surface and the transmitter is exposed. To maximize battery life, transmitters were programmed to limit transmissions to a time block from 01:00 to 22:00 h every 2 d and to slow the repetition rate after 10 successive dry transmissions. The float tag was attached to the fish ca. 10 cm below the first dorsal fin by a 1.5 m tether made of stainless-steel cable and a 3.5 cm stainless steel dart using a 3.0-m Manny Puig™ pole spear. Visibility and sea conditions precluded obtaining the sex and size estimates, important demography variables “to ascertain the conservation status and ensure persistence of the specie” (sensu Sequeira et al., 2016). The Animal Care and Use Committee of the Smithsonian Tropical Research Institute approved this sampling procedure.
2.2 Behavioral Models
ARGOS transmissions were filtered by deleting all transmissions in land (dry), quality “Z” and movements representing speeds over 100 km/day (6.4 km faster than the maximum speed reported by Eckert and Stewart, 2001). Two comparable analyses were performed: one using complete filtered transmission data (CD) of the animals and one with partially trimmed or removed trajectories (see l Figures S1) for suspicious of earlier detachment or freely floating tags (sensu Hearn et al., 2013). A Bayesian state-space random walk (SSRW) model for animal movement was used to optimize the obtained R. typus tracks based on ARGOS satellite tracking data error, which Vincent et al. (2002) calculated to be around 226 m for location class (LC) LC3, 372 m for LC2, and 757 m for LC1 and LC A. This model was used because it is useful when observations occur irregularly in time and when working with ARGOS transmission estimation errors (Jonsen et al., 2005). The model was run using the “fit_ssm” function in the “bsam” package (Jonsen, 2016) of R software (version 3.4.4; R Core Team, 2018). The model was set to have four time-steps per day (tstep = 0.25), 5,000 samples during the adaptation and update phases, a thinning of 10 to minimize within-chain sample autocorrelation, and a span of 0.2 for the degree of smoothing.
Bayesian SSRW-corrected R. typus tracks were modeled with a hidden Markov model (HMM) to identify two different behavioral states—foraging and migratory behavior. The environmental variables described in Table 1 were used as the model covariates. The HMM model was run using the “fitHMM” function in the “moveHMM” R package (Michelot et al., 2016). The initial values used to differentiate between foraging and migrating behavioral states were set to 5 ± 2 m and 30 ± 10 m for the step mean, respectively, and pi was set to 0 for the turning angle.
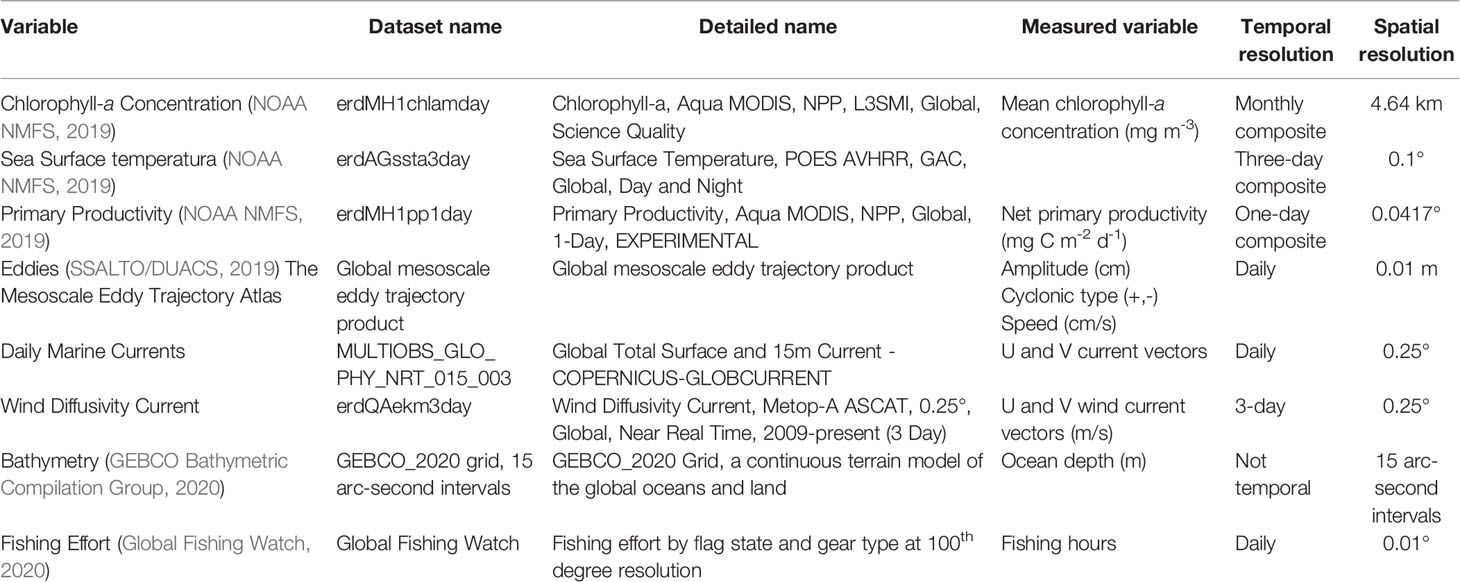
Table 1 Environmental variables obtained for each Rhincodon typus location.
Foraging areas were identified and mapped by creating a kernel density plot (in ArcGIS v10.6) with all the modeled locations identified by the HMM model for that behavioral state. Low-use, medium-use, and high-use areas were determined based on the first, second, and third quartiles, respectively.
2.3 Environmental Variables, Fishing Effort, Vessel Traffic, and Protected Areas
2.3.1 Sea Surface Temperature (SST), Chlorophyll-a Concentration, and Daily Primary Productivity
Data were obtained from NOAA’s Environmental Research Division ERDDAP server (NOAA, 2019). Chlorophyll-a concentrations (NOAA NMFS, 2019) were measured in mg m-3 with a monthly composite temporal resolution of 4.64 km (the most complete dataset in NOAA for the temporal and spatial scale of this study). The SST layer (NOAA NMFS, 2019) had a spatial resolution of 0.1° with a three-day composite analysis in °C. Primary productivity (NOAA NMFS, 2019) was measured as the net primary productivity of C per day (mg C m-2 d-1) with a spatial resolution of 0.0417° (Table 1). Data were paired (in time and space) to each modeled R. typus location using the “xtracto” function in the “rerddapXtracto” R software package (Xtractomatic, 2018).
2.3.2 Eddies, Currents, and Winds
R. typus locations were superimposed on previously identified eddies that overlapped the animal trajectories in time and space. The location, amplitude, speed, and type (cyclonic or anticyclonic) of eddies that occurred during the study period were obtained from the Mesoscale Eddy Trajectories Atlas [SSALTO/DUACS, 2019]. All R. typus locations that occurred within an eddy were identified by creating a circle around each eddy center (diameter equal to eddy amplitude) and extracting the eddy data for each R. typus location using the “Spatial Analyst tool” in ArcGIS (v10.6).
Daily marine currents (surface and 15 m depth at ¼ ° resolution) were obtained from Copernicus database named: MULTIOBS_GLO_PHY_NRT_015_003 (Global Total Surface and 15m Current (COPERNICUS-GLOBCURRENT) from Altimetric Geostrophic Current and Modeled Ekman Current Processing) available at: https://resources.marine.copernicus.eu/product-detail/MULTIOBS_GLO_PHY_NRT_015_003/DOCUMENTATION. We used 3-day wind diffusivity currents (WDC) obtained from Metop-A ASCAT, with a 0.25° resolution (Table 1) available at: https://coastwatch.pfeg.noaa.gov/erddap/griddap/erdQAekm3day.html. WDC is measured at 0 m elevation while just “wind” is measured at 10 m elevation. Current speed and WDC were calculated from V and U current vectors and overlapped spatially and temporary with whale shark transmissions (Table 1). Current speed, WDC, and whale shark traveling speed were correlated using Pearson method. Spatial data was overlapped using the Spatial Join function in ArcGIS Pro software (set to a search radio of 30 km) and temporal data and correlations were performed in R software.
2.3.3 Bathymetry, and Seamount Use
Rhincodon typus locations were overlaid on the Nibbon Foundation GEBCO gridded bathymetric dataset (GEBCO Bathymetric Compilation Group, 2020). Differences in water depth between behavioral states (migrating or foraging) were tested using the Wilcoxon test. We used a Resource Selection Model (Function “RSPF” in the Resource Selection R package) (Subhash et al. 2019) to evaluate the use of seamounts or underwater ridges during R. typus migration. The proportion of the oceanic areas (50 m away from shore) with depths above -1,000 m were quantified by extracting the depth of 50,000 random points from the GEBCO bathymetric dataset and modeled as “available resources”, the “used resources” were given by the R. typus modeled locations above the -1,000m threshold.
2.3.4 Fishing Effort, Vessel Traffic Routes, and Marine Protected Areas Use
Fishing effort data were obtained from the Global Fishing Watch (GFW) dataset (Kroodsma et al., 2018). This dataset describes the number of fishing hours per square kilometer (h km-2) based on the detection of > 70,000 unique AIS devices on fishing vessels from 2012 to 2016 (Kroodsma et al., 2018), and an updated version including data from 2017 and 2018. Rhincodon typus locations were overlaid onto the MPAs and industrial fishing areas. There was no temporal overlap between the fishing effort data (Kroodsma et al., 2018) and R. typus modeled locations; therefore, the quarterly mean of fishing effort was used as a reference. The fishing effort trimestral mean inside the study area was divided into three categories, low, medium, and high, corresponding to the first, second, and third quartiles of the data, respectively.
The location data also overlapped with regional marine vessel traffic. Long-range identification and tracking (LRIT) data were obtained from Pole Star Panama for all months in 2013 for the entire region. Pole Star is a leader company in maritime intelligence that monitors with satellite transmitters more than 34,000 ships worldwide. The impact of vessel traffic was estimated by creating a kernel density analysis weighted by vessel speed (speed reported by the Pole Star data) and identifying low-, medium-, and high-impact areas (based on kernel´s data quartiles of the combined effect of vessel density and traveling speed). Rhincodon typus locations that occurred inside a MPA were identified using the World Database on Protected Areas [administered by the United Nations Environment Program (UNEP) and the International Union for the Conservation of Nature (IUCN), managed by the UNEP World Conservation Monitoring Centre (UNEP-WCMC)]. All spatial analyses were performed using ArcGIS (v10.6).
2.4 Analyses of Potentially Detached or Freely Floating Tags
Hearn et al. (2018) determined detachment point of towed SPOT-5 satellite tags by comparing the trajectories of four tagged whale sharks (one individual with a SPLASH) that transmitted between 31 and 167 days and two deliberately floating tags. They concluded that detachment points can be usually identified by interpreting daily transmission times, class quality along with depth and temperature of the transmitted data. In addition, this interpretation can be facilitated with available information on general ocean circulation patterns (Hearn et al., 2018).
We used daily sequences of transmission times (sensu Hearn et al., 2013) to preliminary test those tags were attached to the sharks and not freely floating along the currents and winds (Figure S1). Shark traveling speed was calculated using filtered but unmodeled locations. Shark tracks (consecutive list of locations) were converted to ArcGIS line shapefiles using the Data Management tool “XY to Line”, which created a line along chronological locations. Each track line was then split at each location point by using the ArcGIS tool “Split Line at Point”, resulting in segmented tracks with individual lines between locations. The length (km) of each segment of the track was then calculated by using the “Calculate Geometry” tool available in the Attribute Table menu in ArcGIS. The difference in time (hr) between consecutive locations was calculated and used to estimate traveling speed (TS) between locations as: TS= Segment length (km)/time difference between consecutive points (hr).
Daily marine currents (surface and 15 m depth at ¼ ° resolution) were obtained from Copernicus database named: MULTIOBS_GLO_PHY_NRT_015_003 (Global Total Surface and 15m Current (COPERNICUS-GLOBCURRENT) from Altimetric Geostrophic Current and Modeled Ekman Current Processing. Current Speed (CS) was calculated from V and U current vectors using the Pythagorean theorem in where: CS=square root(V2+U2). Current speed, at ¼° resolution was overlapped spatially with whale shark locations by using the “Spatial Join” function in ArcGIS Pro software (set to a search radio of 30 km for each location). A temporal overlap was done by merging the two datasets (current speed and shark locations) by date in R software. Current speed (mean speed within 30 km around each location during the transmission day) and whale shark traveling speed (for the segment between two consecutive locations) were correlated using Pearson method Figures S1, 2). This correlation was analyzed independently when whale shark transmissions occurred inside an eddy as explained earlier in the manuscript.
3 Results
3.1 Rhincodon typus Movements and Behavior
Solitary individuals were tagged sporadically between September 2007 and March 2012. A total of 32 R. typus were tagged along the Pacific coast of Panama; 25 were tagged in the Gulf of Chiriquí and 7 were tagged in the Las Perlas Archipelago, Gulf of Panama (Table 2). Two tags failed to transmit. A total of nine sharks showed dubious transmission times or detached shortly after tagging (Figure S1): five with long migrations and high frequency of transmission rates in morning hours (54741, 54745, 54764, 54878, 107719) were isolated from the analyses, and four tags with relative short movements were partially trimmed when transmission rates changed (107708, 54747, 54749, 54870). Those nine full trajectories, however, were modeled and analyzed for detachment by correlating sharks traveling speed with real-time marine current speed and wind current (see below). Accordingly, to compare analyses, results are presented for trimmed/removed data followed by full untrimmed data (30 tags) in parenthesis. Tagged sharks transmitted 51 d (498) with up to 307 (1,053) transmissions (Table 2). Rhincodon typus migrated north (to the Gulf of Tehuantepec, Mexico), south (to Ecuador), and to the open ocean (Figure 1).
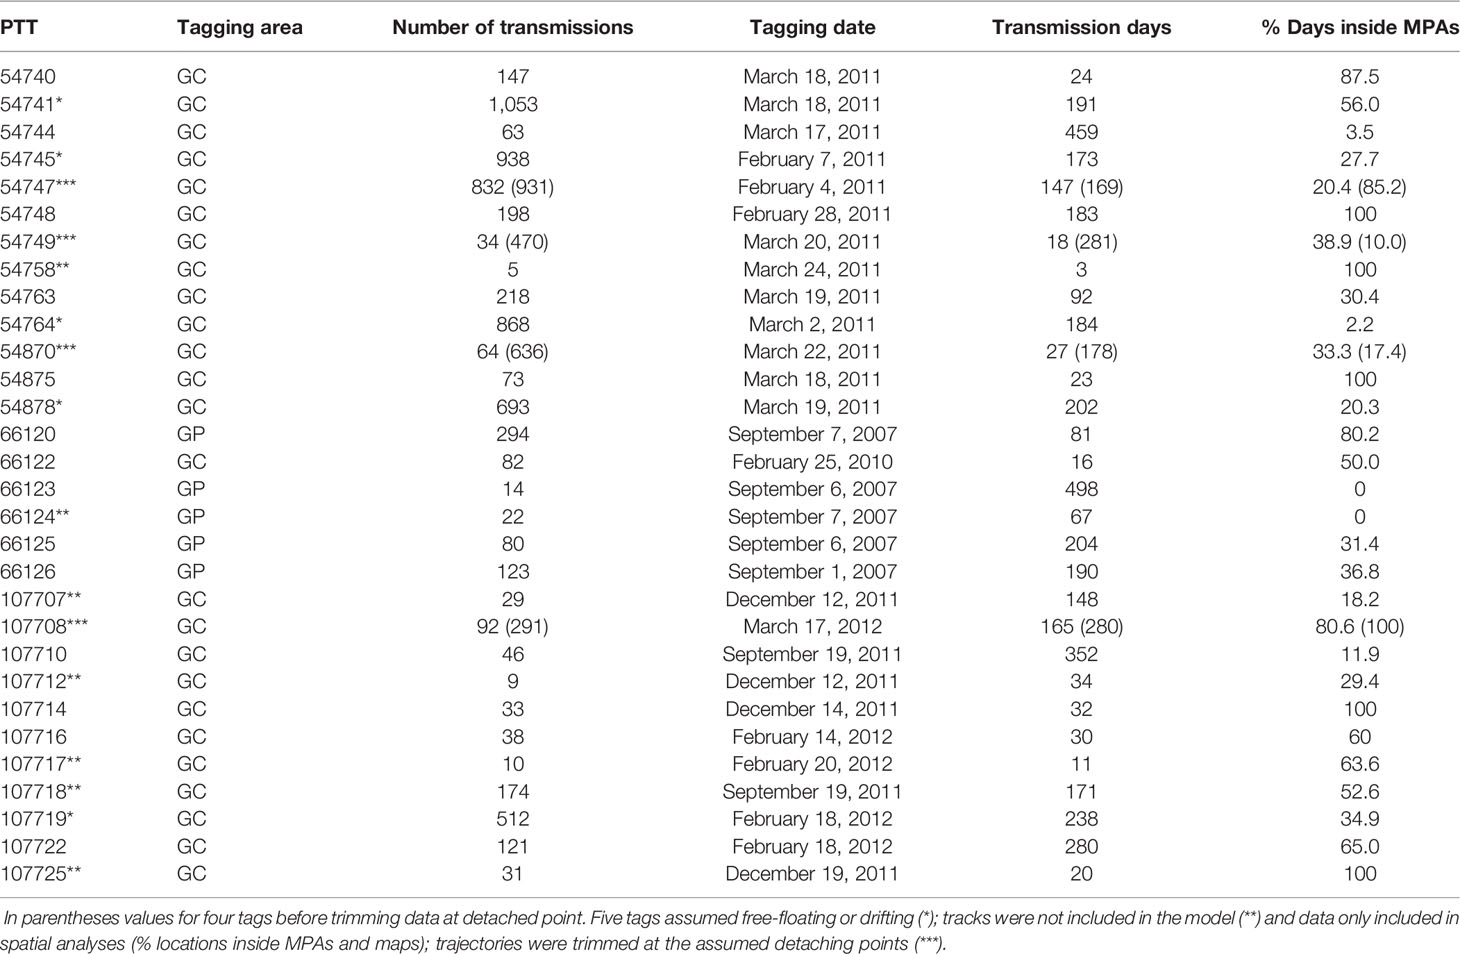
Table 2 Rhincodon typus tagged (30) in the Gulf of Panama (GP) and the Gulf of Chiriquí (GC), Satellite transmitter identification number (PTT).
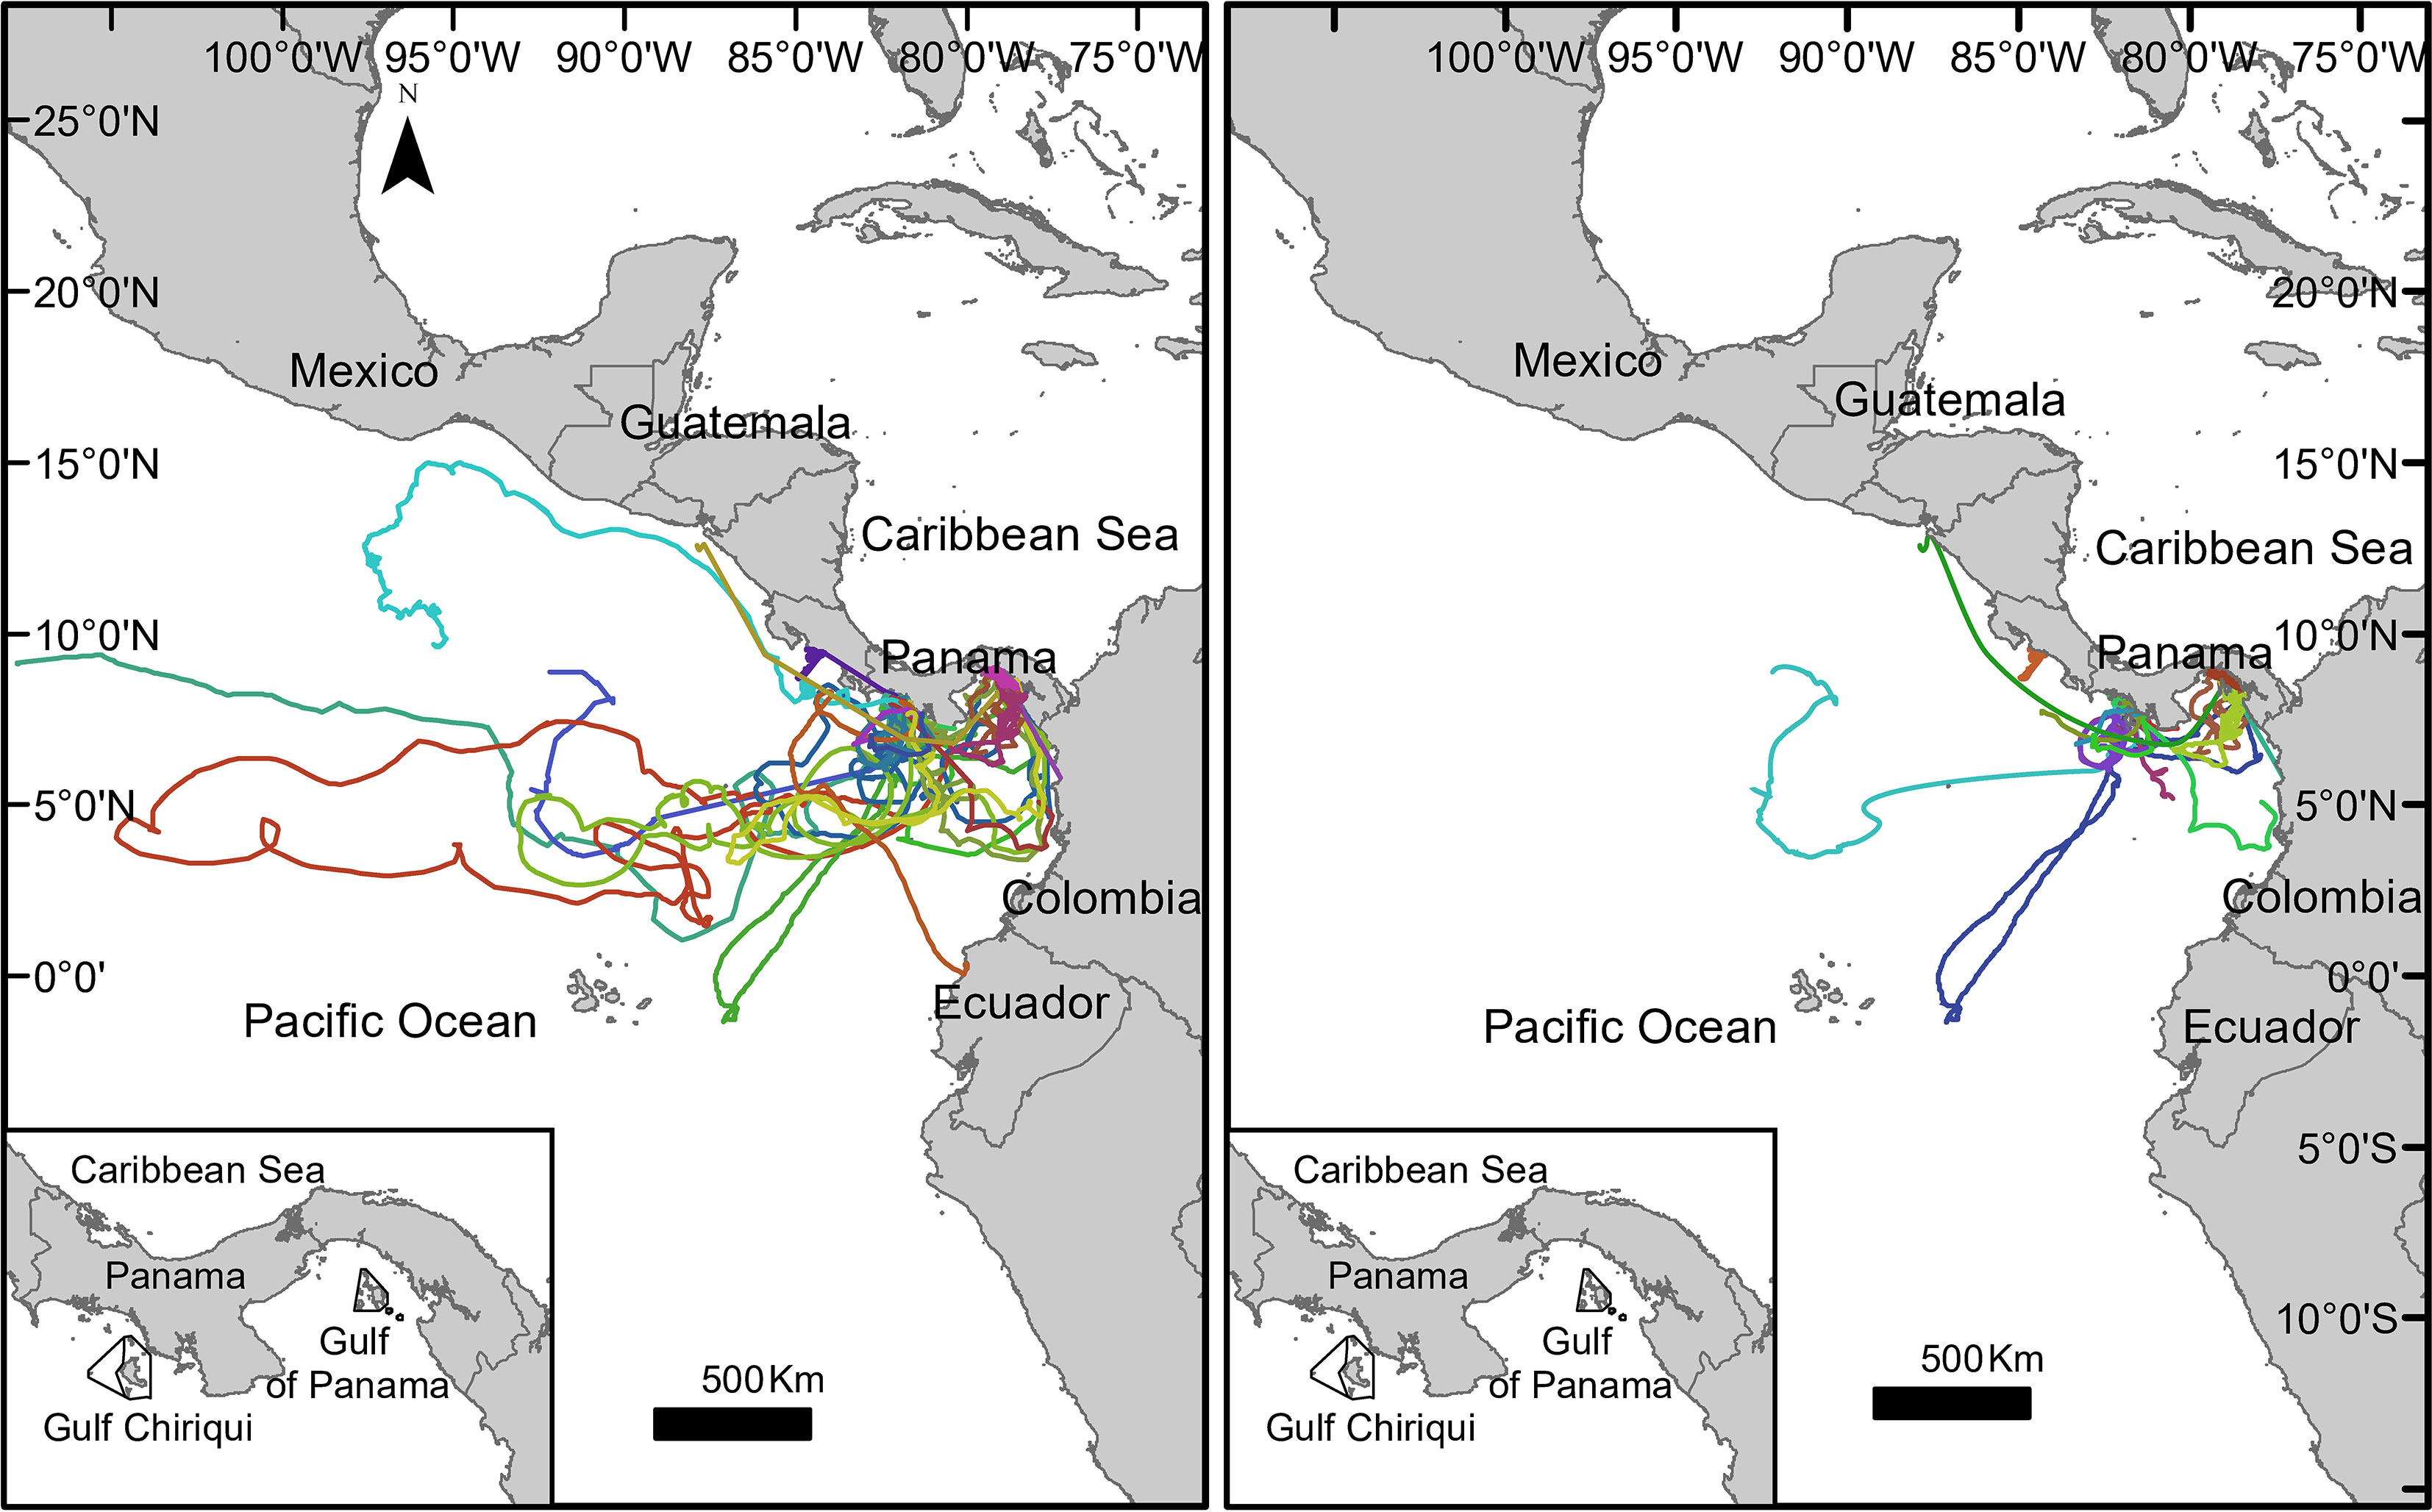
Figure 1 Migratory tracks of 30 Rhincodon typus tagged with satellite transmitters off the Pacific coast of Panama: complete trajectories of 30 individuals (left plot); removed or partially trimmed of 25 individuals (right plot). Inset with map of the Pacific coast of Panama showing the Rhincodon typus tagging areas around Coiba National Park (Gulf of Chiriquí) and the northeast Las Perlas Archipelago (Gulf of Panama).
A Pearson correlation test showed that the number of transmission days did not correlate with the number of transmissions (r2 = 0.05). Transmitters need to be at the surface for a certain amount of time to send a correct location, and some R. typus may only surface sporadically or under rough sea conditions, meaning that while an individual shark’s tag may be transmitting, received transmissions may be infrequent or sporadic.
The random walk state-space model was run for 18 (24) of the 30 tagged R. typus. Four sharks had information gaps > 100 without transmission, which impeded the ability of the model to run properly. For these four cases, the original data were split into ‘before’ and ‘after’ the data gap; these periods were modeled separately and then bound together to create a single modeled track. Seven sharks had too few transmission days or transmissions to run the model. These seven sharks were not included in the MHH model but were included in the estimation of % of locations inside MPAs, and in calculating the spatial and temporal overlap with vessel traffic and fishing grounds (see Table 2). From a total of 1,053 Argos locations, the Bayesian state-space random walk model (programed to estimate the location of each whale shark at four locations per day) resulted in 3,118 (9,968) modeled locations, now on referred to as “modeled locations”. Based on these modeled locations sharks traveled at a mean speed of 8.5 (10.4) km/day with a maximum speed of 76.9 km/day (Table 3).
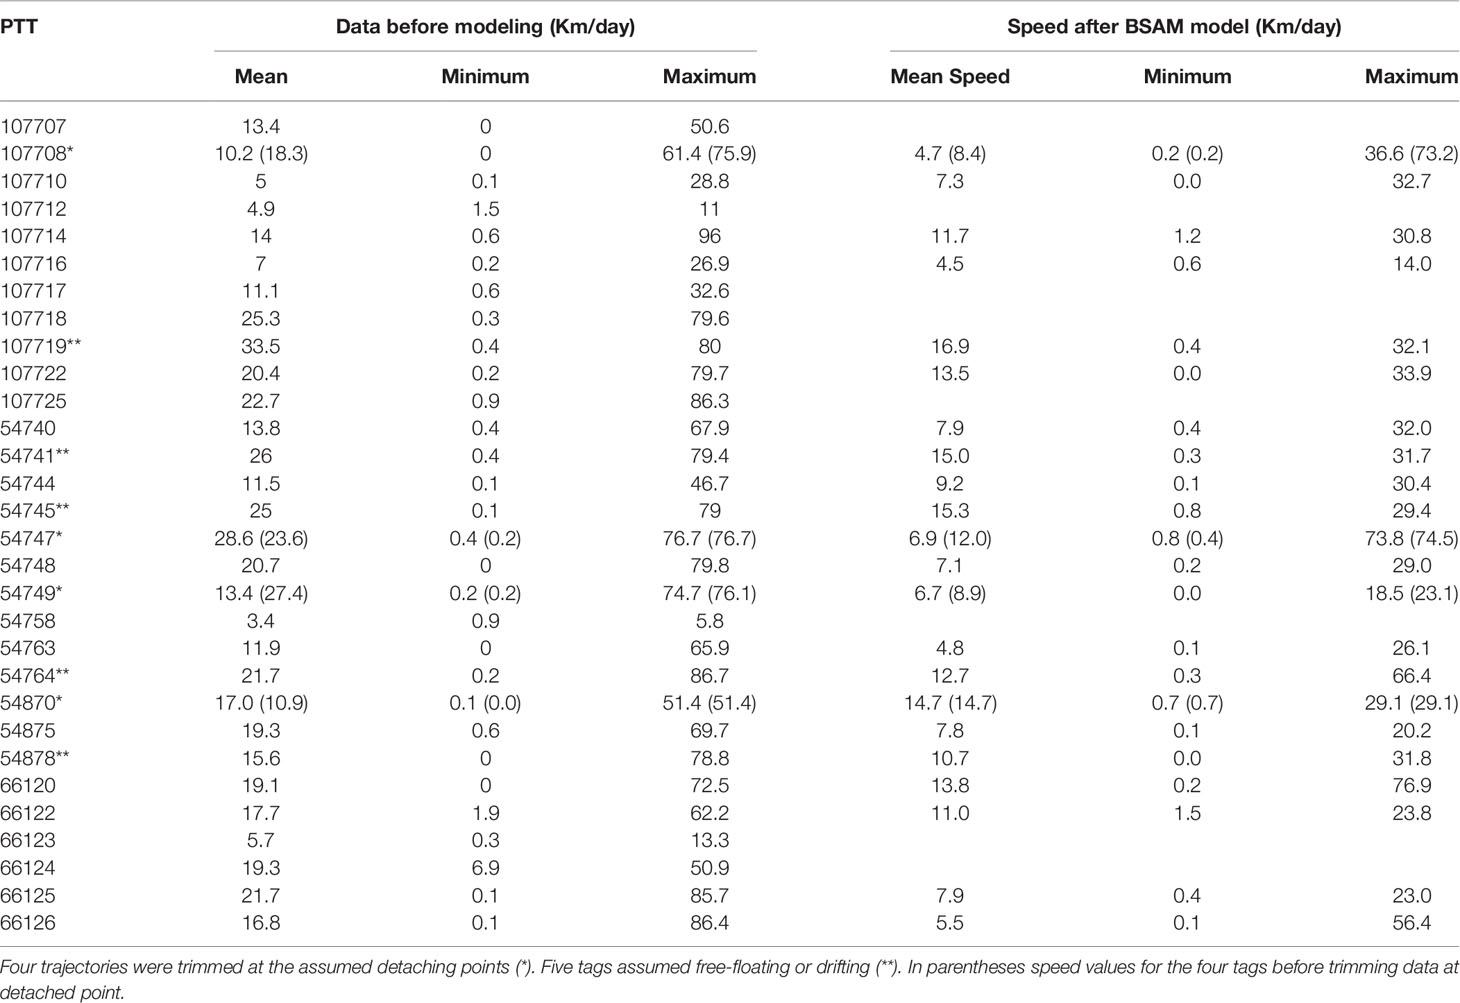
Table 3 Mean, maximum and minimum traveling speed of 30 tagged whale sharks before and after the Bayesian State-Space Model for animal Movement (BSAM).
Based on the MHH model, R. typus spent equal amount of time foraging and migrating, with an average of 50% ± 6.5% (± SE) of their time foraging (range = 0%–100%) and 49.7% ± 6.5% of their time migrating (range = 0%–100%), contrary to the full trajectory data with an average of 76% ± 0.04% (± SE) foraging (range = 17%–100%) and 24% ± 0.04% migrating (range = 0%–83%) (Table 4, Figure 2 top). Tagged R. typus foraged mainly inside the Panamanian Exclusive Economic Zone (EEZ) or the territorial waters in both the Gulf of Panama and the Gulf of Chiriquí and, to a lesser extent, parallel to 4°N, north and east of the Galapagos islands (Figure 2 bottom).
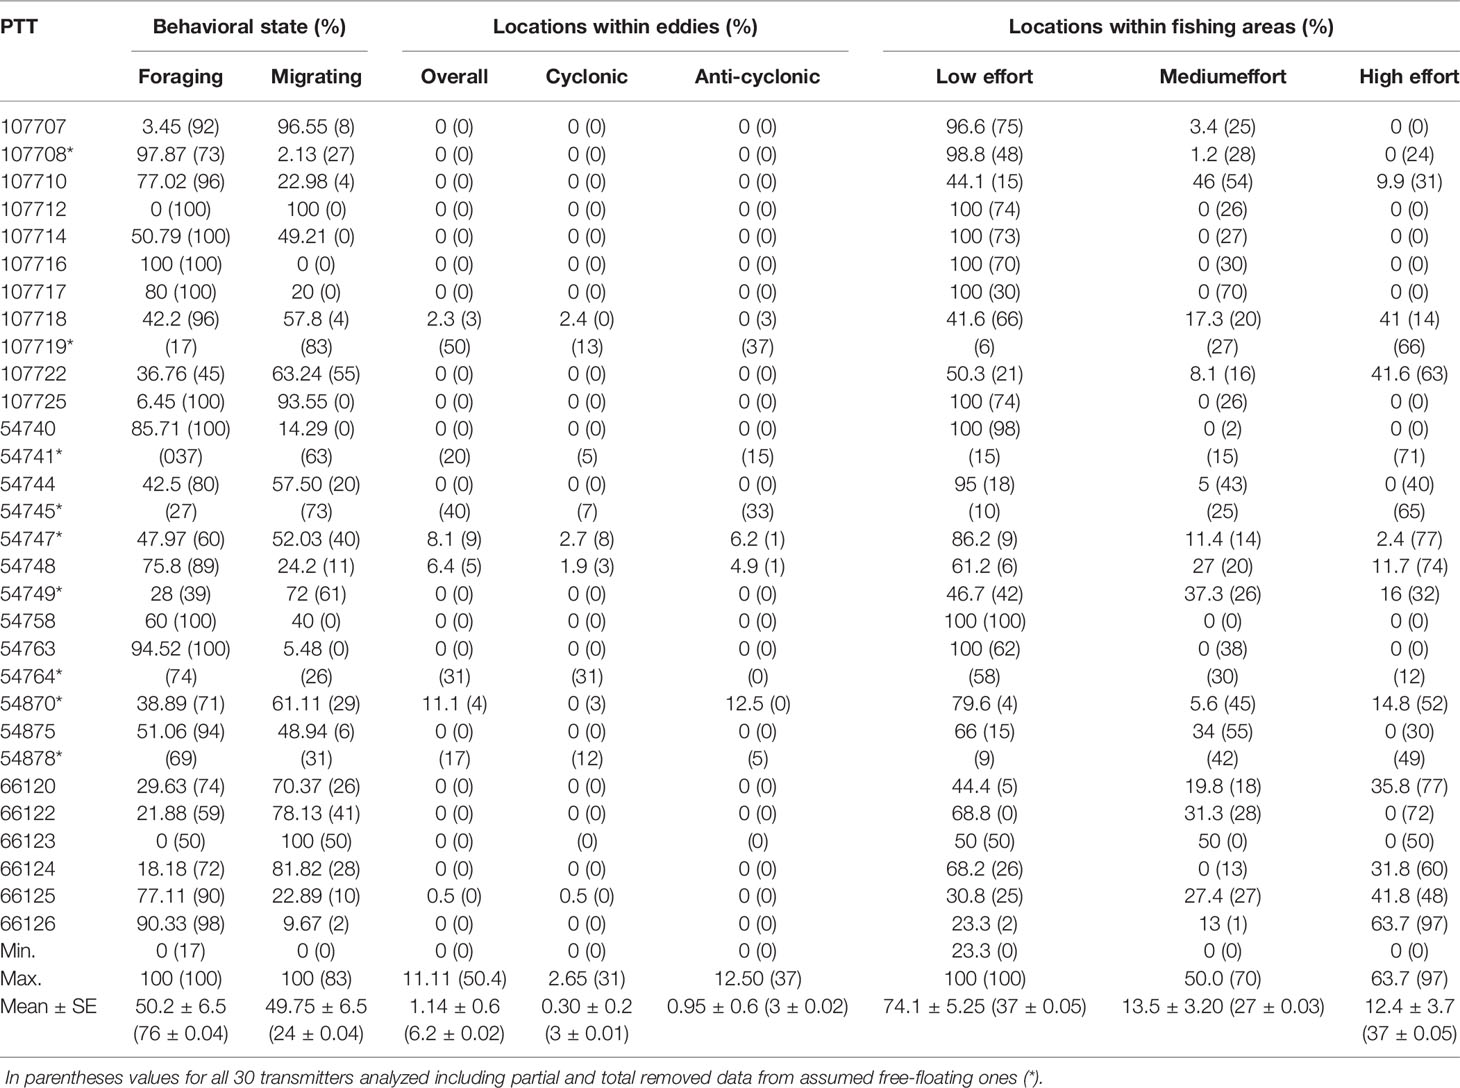
Table 4 Percentage of Rhincodon typus locations for each behavioral state, within eddies, and within industrial fishing areas.
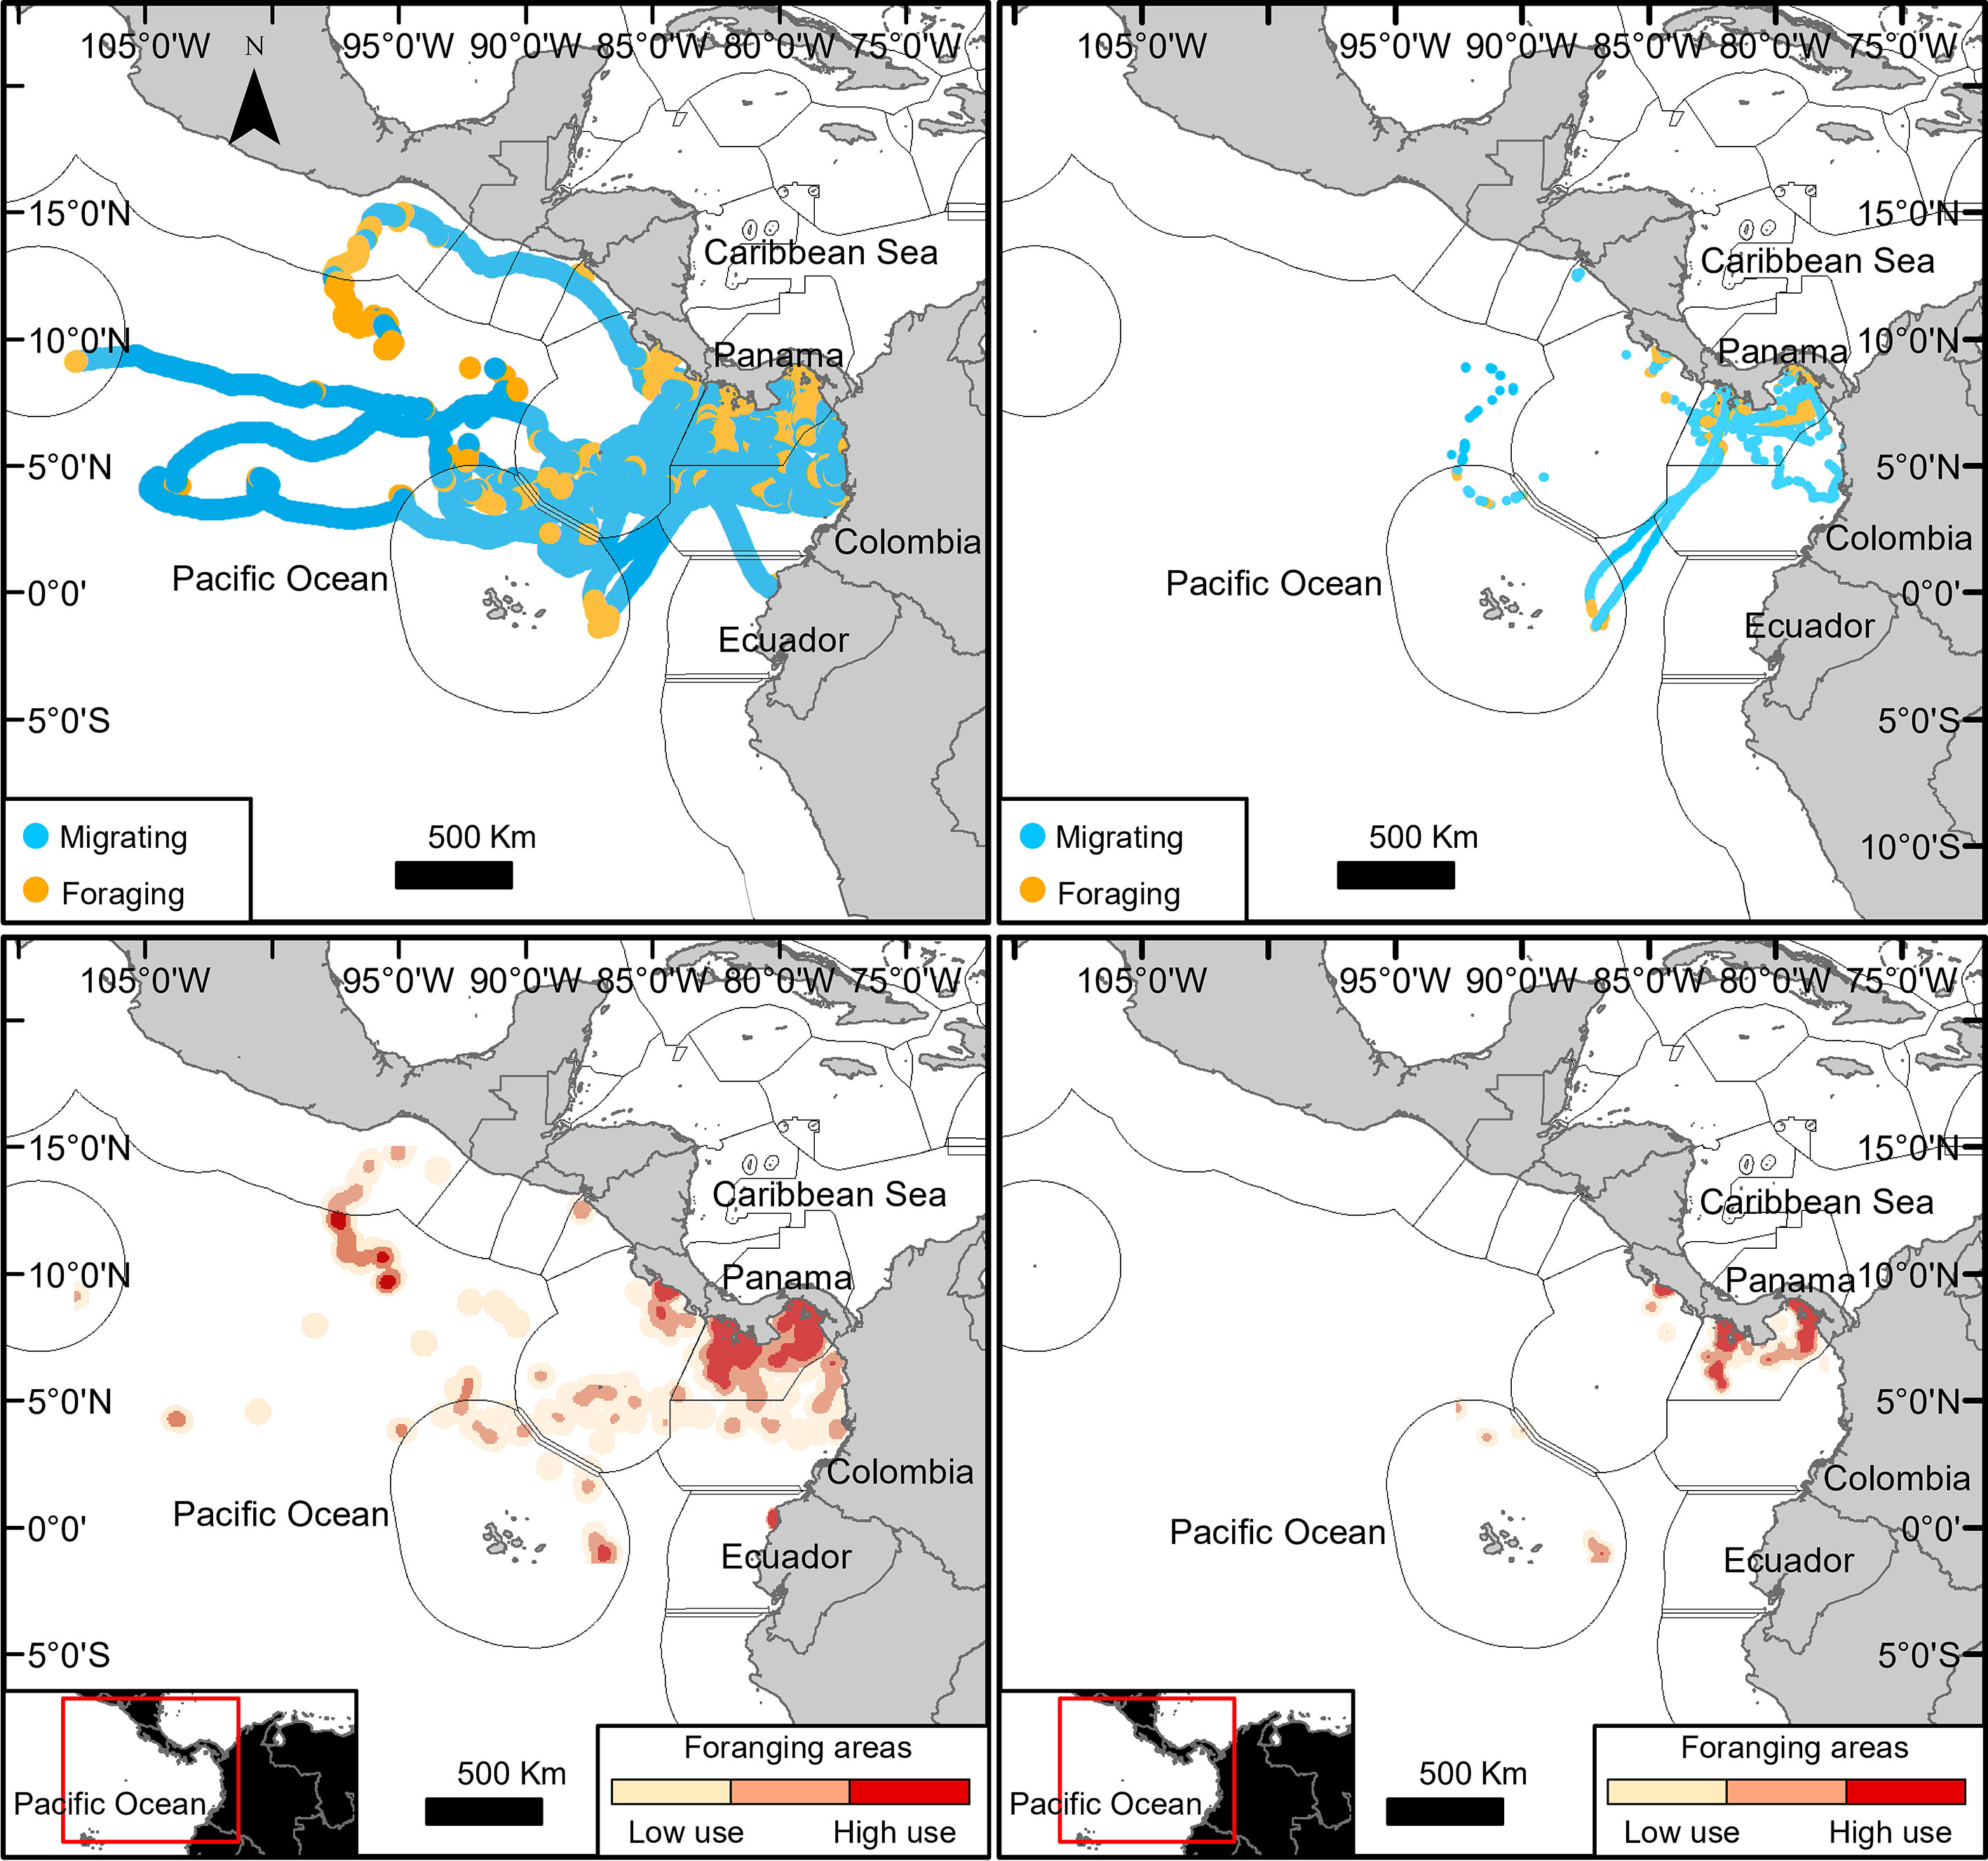
Figure 2 Rhincodon typus behavioral states identified by a hidden Markov model: R. typus locations for two behavioral states—migrating (blue) and foraging (orange) (top plots); high-, medium-, and low-use (darkest to lighter) R. typus foraging areas (botton plots). Complete trajectories of 30 individuals (left plots); removed or partially trimmed of 25 individuals (right plots).
3.2 Rhincodon typus and Environmental Variables
The MHH model results showed that environmental conditions were different for each behavior. Specifically, chlorophyll-a concentrations and primary productivity were significantly higher when R. typus were foraging (p < 0.001 in both cases). The SST did not differ significantly between the two behavioral states (Table 5). Mean water depths were significantly (p < 0.05) deeper when the tagged sharks were migrating -1,534.4 ± 41.3 m (-2,366.5 ± 20.9 m) than when they were foraging -765.6 ± 26.8 m (-1,015.5 ± 18.2 m) (Table 5), and most foraging locations 76.9% (66.5%) occurred in coastal waters (< 50 km from the shore). Oceanic areas (50 km away from shore) shallower than 1,000 m were scarce within the study area, covering only 2.05% (3.64%) of the territory, however, up to 5.5% (19%) of the modeled locations occurred within these “shallow” areas indicating a significant use of seamounts and ridges by R. typus but only for the complete data (Resource Selection model, p < 0.005). The probability of changing between behavioral states (i.e., from migrating to foraging and vice versa), as well as the probability of staying in a particular state under the stationary distribution (Figure 3), was correlated with chlorophyll-a, productivity, and SST (Table 6).
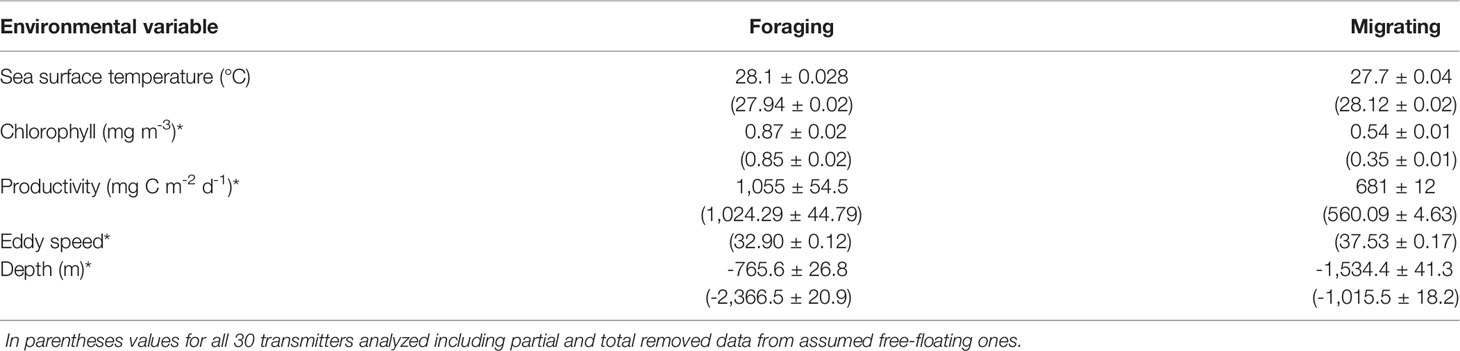
Table 5 Mean (± SE) of environmental variables during each behavioral state (* indicates a significant difference between behaviors where p < 0.001).
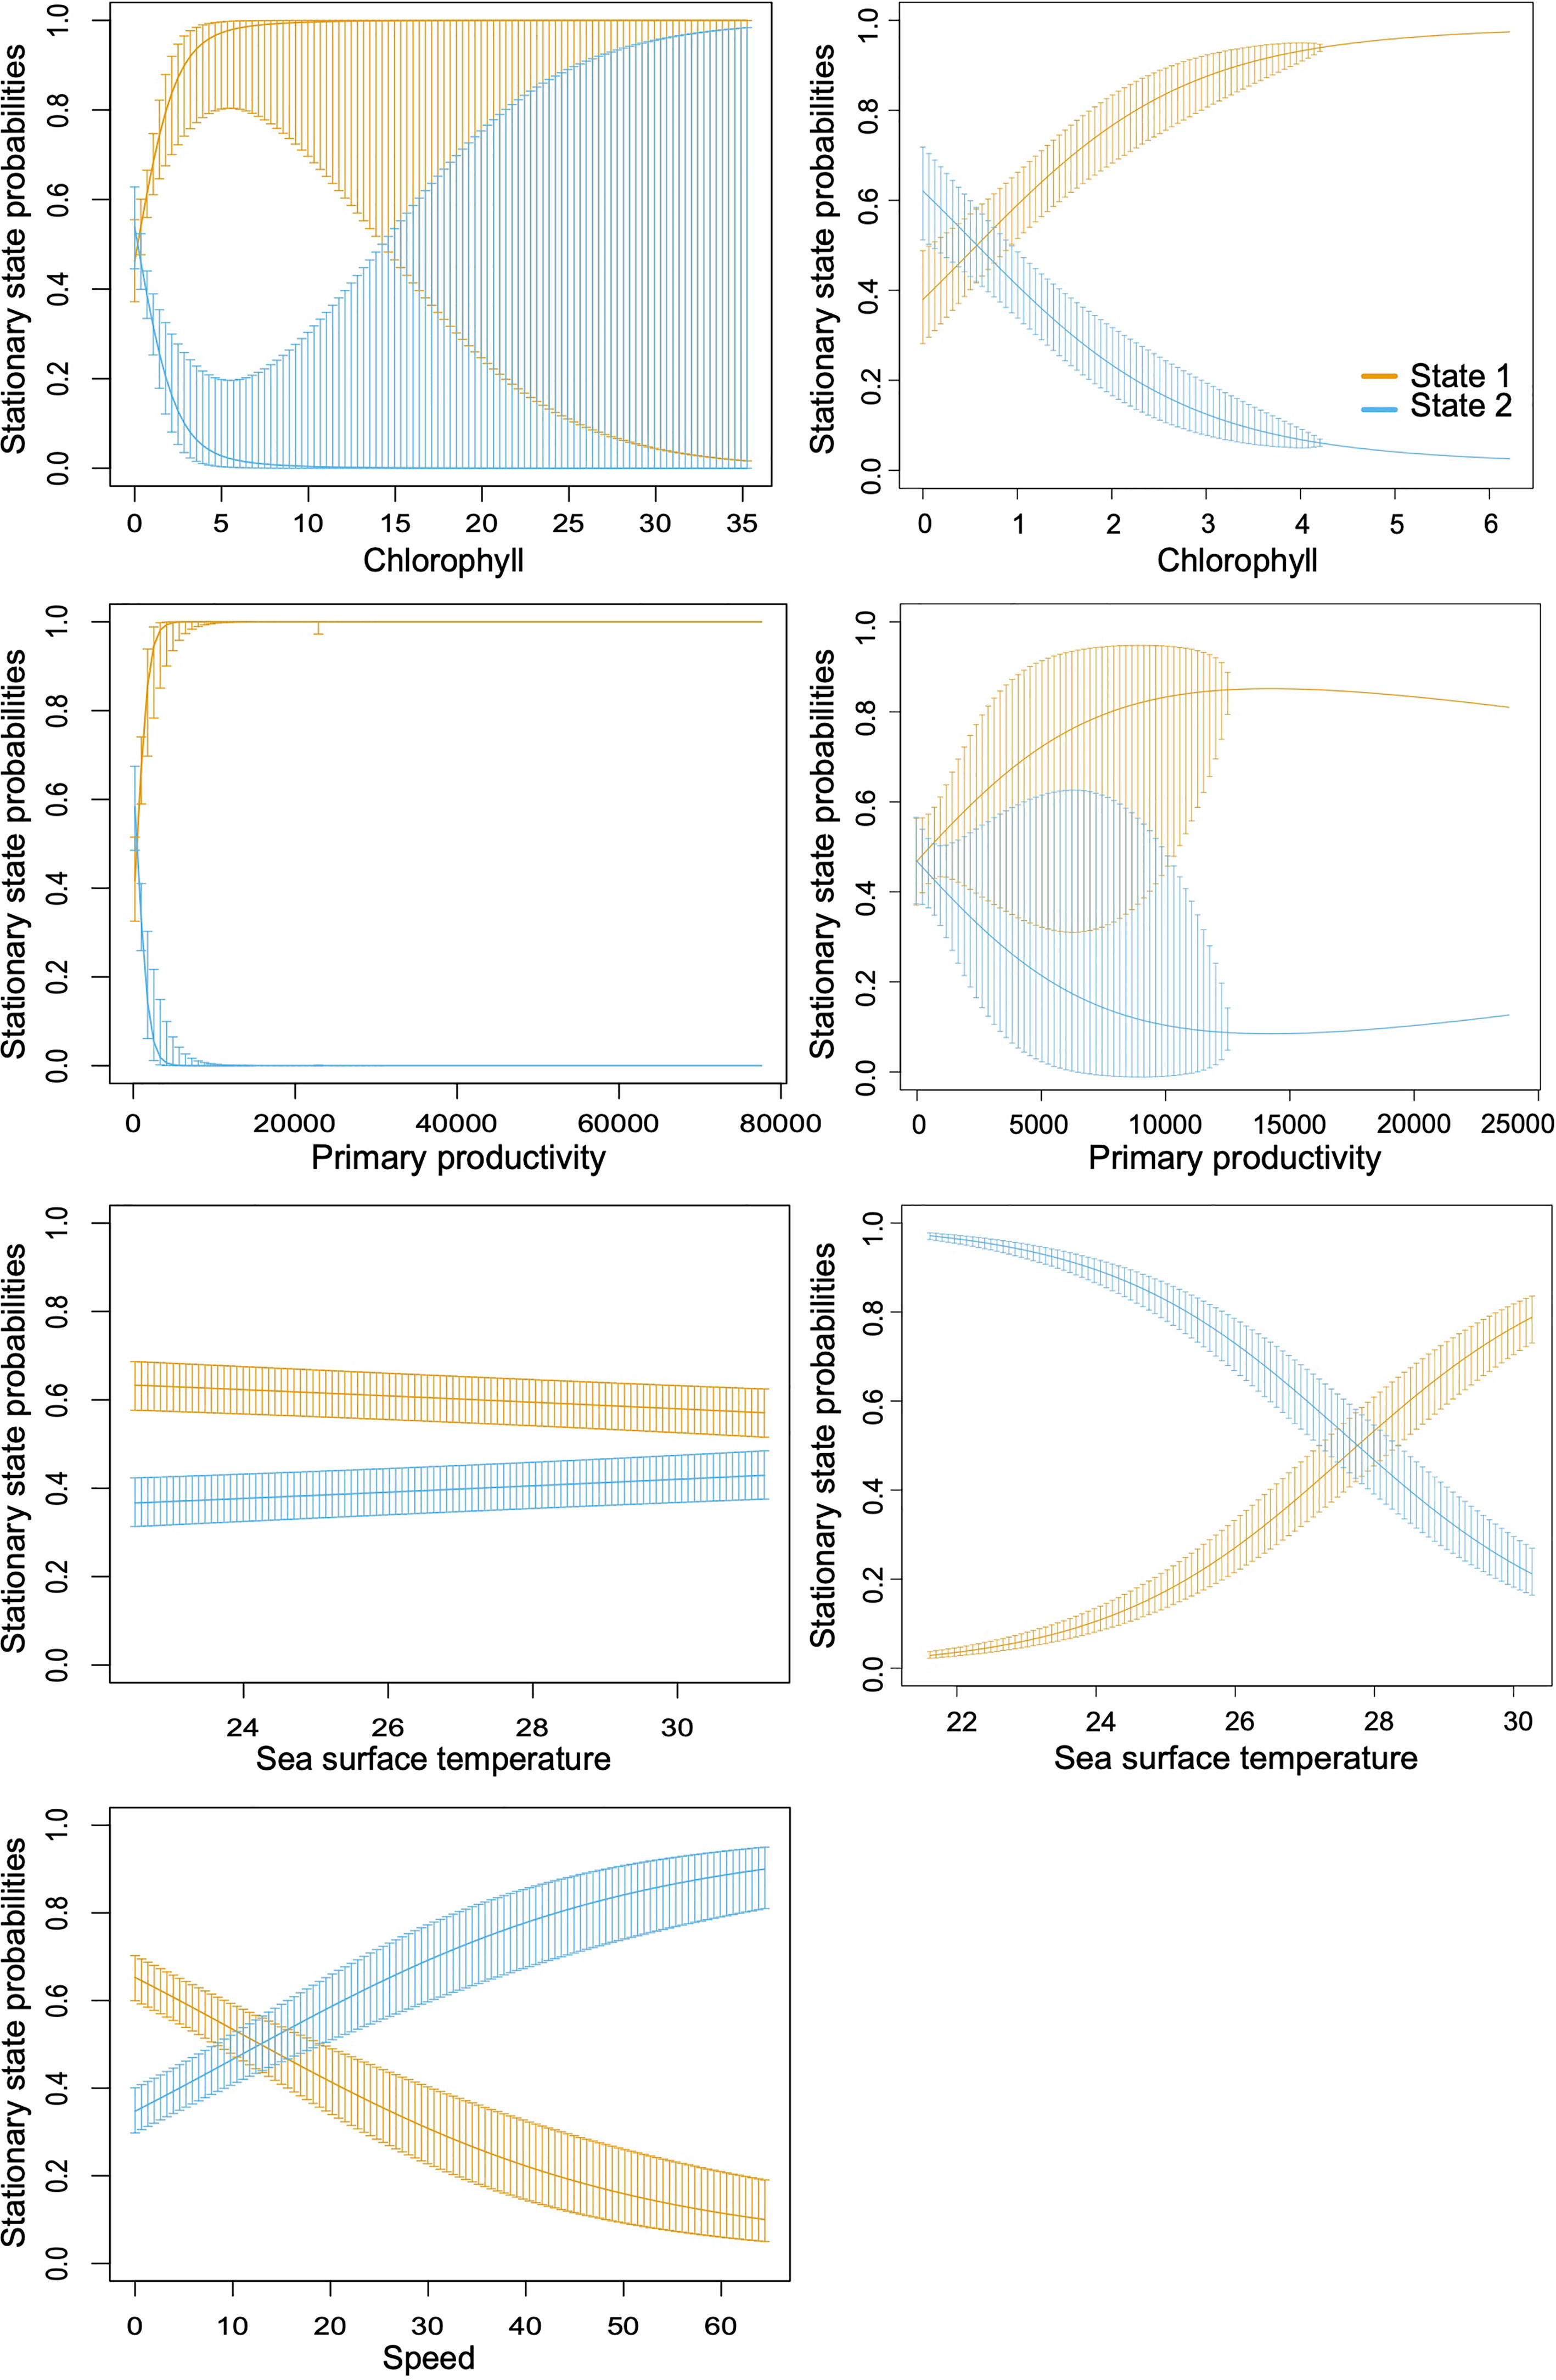
Figure 3 Probabilities of remaining in a particular behavioral state calculated by the Hidden Markov Model (HMM) (state 1 = foraging, state 2 = migrating). Complete trajectories of 30 individuals (left plots); removed or partially trimmed of 25 individuals (right plots).

Table 6 Regression coefficients for the transition probabilities.
There was a total of 24,437 eddies registered inside the study area between September 2007 and December 2012 (study period), only five of the analyzed shark tracks spend some time within an eddie, ranging from 0.5% to 11% of their time, especially in anticyclonic eddies (65%) (Figure 4 top right, Table 4). However, full analyzed trajectories showed 10.25% of R. typus tracks overlapped temporal and spatially within them. On average, R. typus spent 6.2 ± 0.02% of their time within an eddy, although there was a high degree of variation among individuals. Six animals spent a significant amount of time (up to 50.4% in the case of individual 107719) within eddies. When foraging, an average of 10.9 ± 2.0% of the locations were within an eddy compared to 17.7% when migrating. When whale sharks were located inside an eddy, the eddy speeds (measured within the amplitude of an eddy) were significantly higher when R. typus were migrating (p < 0.001). There was not an apparent preference for staying in cyclonic or anticyclonic eddies, the frequency of whale sharks inside each these was 50%, both when calculated with the number of modeled locations or time spend inside the eddy (Table 4, Figure 4 top left).
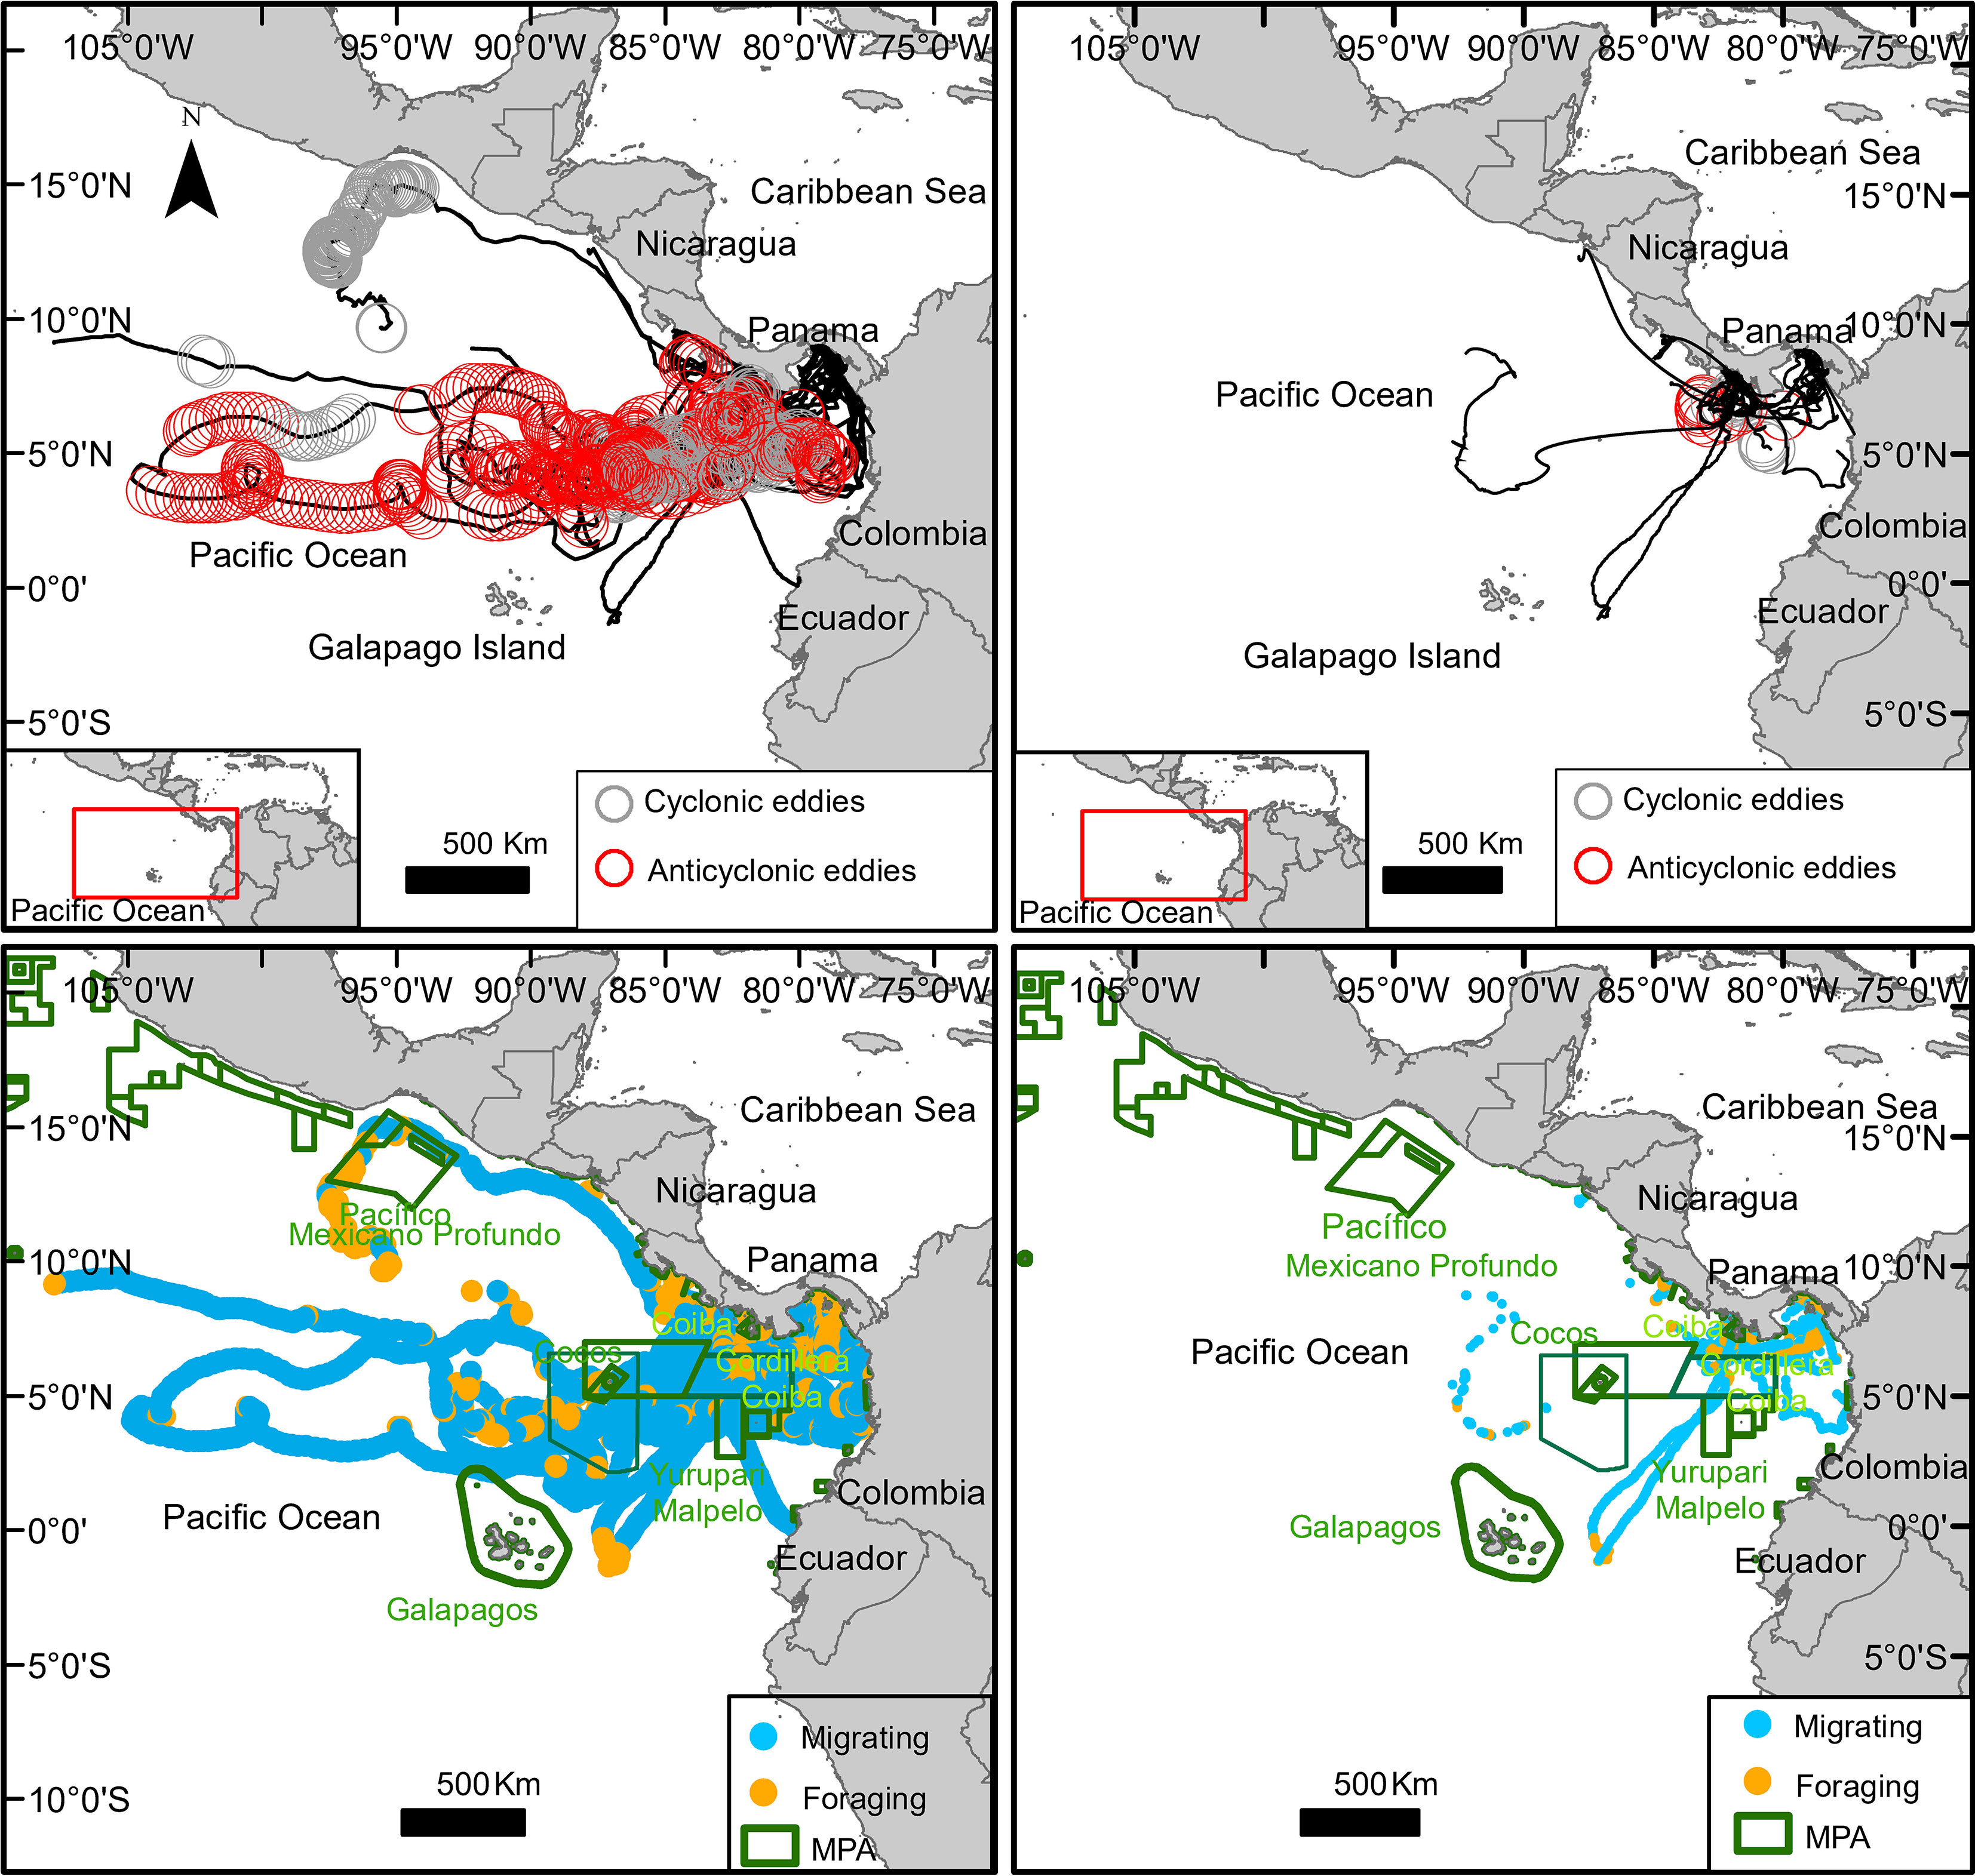
Figure 4 Rhincodon typus tracks superimposed on real-time eddies (cyclonic in grey, anti-cyclonic in red) (top plots); Rhincodon typus modeled locations (blue = migrating and orange = foraging) superimposed on marine protected areas (MPAs) (botton plots). Complete trajectories of 30 individuals (left plots); removed or partially trimmed of 25 individuals (right plots).
3.3 Rhincodon typus in Marine Protected Areas
R. typus visited a total of 10 (17) MPAs within three (five) countries (Mexico, Costa Rica, Panama, Colombia, and Ecuador) with 3.4% (22.6%) of the modeled locations occurring within an MPA, which accounted for a mean of 35.8 ± 5.4% (48 ± 6.3%) of their time; 97% (86%) of these locations occurred in Panama with higher rates in Parque Nacional Coiba and the recently expanded oceanic MPA Cordillera Coiba with nearly 68,000 km2 (Figure 4 bottom, Tables 2, 7).
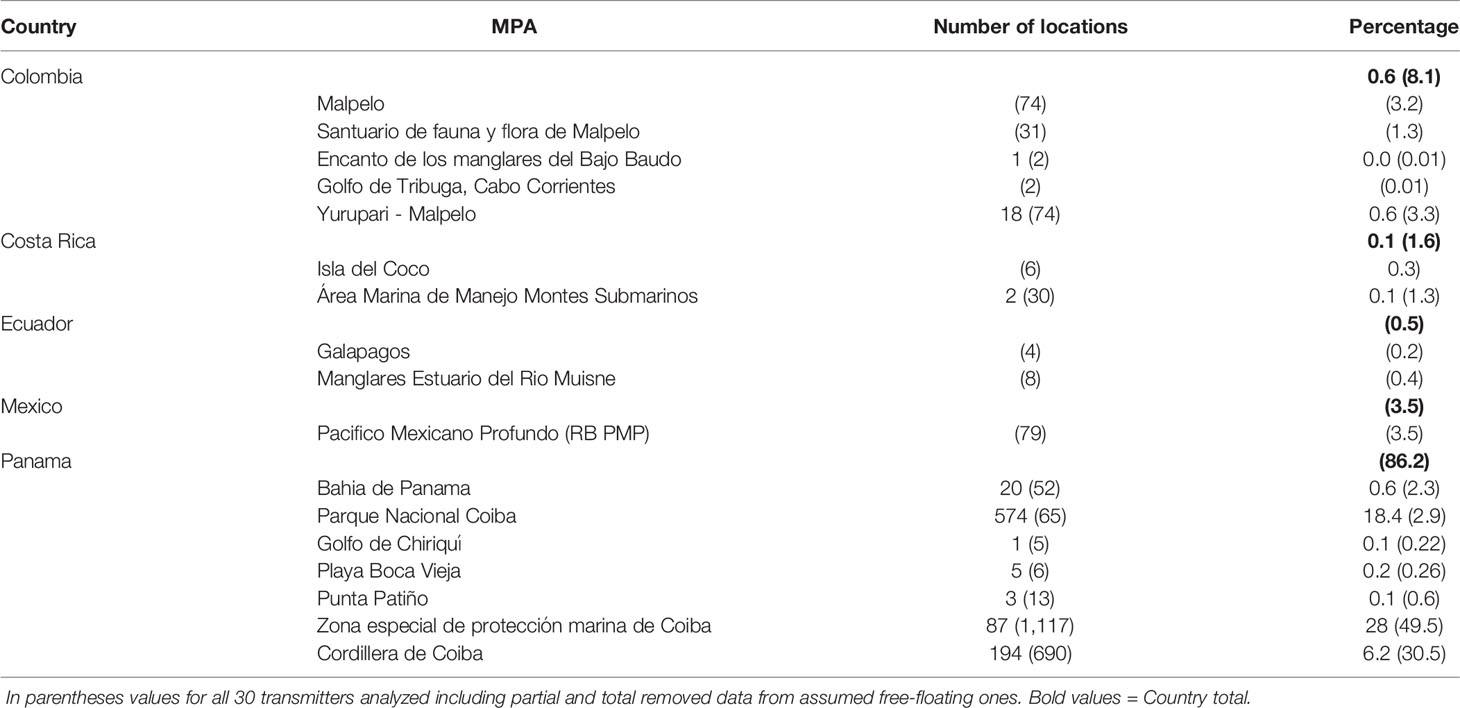
Table 7 Number and percentage of Rhincodon typus total modeled locations within marine protected areas (MPAs).
3.4 Rhincodon typus in Fishing Areas and Commercial Vessel Traffic
Of the areas occupied by tagged R. typus, 26.2% (50%) of all modeled locations occurred within high-effort fishing areas, 15% in medium-effort and 58% in low effort areas (Figure 5 top). In these areas, 86% of the fishing was tuna purse seines with a monthly average (mean ± SE) of 4,025 ± 1,417 fishing hours (503,987 fishing events between 2012 and 2018), and 13% were drifting longlines with a monthly average of 621.4 ± 157 fishing hours (174,701 fishing events). Purse seine effort did not differ significantly between the first, second, or fourth quarters (p > 0.05) but was lower during the third trimester (16%). Most of the drifting longline effort in the area occurred during the last quarter (53.2%). Vessels with a Colombian flag were the most common (25.2%, equivalent to an average of 1,170 fishing hours per month) followed by vessels from Mexico (24.26%), Venezuela (14.9%), and Panama (14.3%). The majority 70.9% (88.8%) of R. typus modeled locations occurred within high-impact vessel traffic areas (areas with a higher density of vessels moving at higher speeds), 22% (11.2%) of the modeled locations occurred with medium impact areas, and 6.9% (0.0%) modeled locations occurred within low-impact areas (Figure 5 bottom).
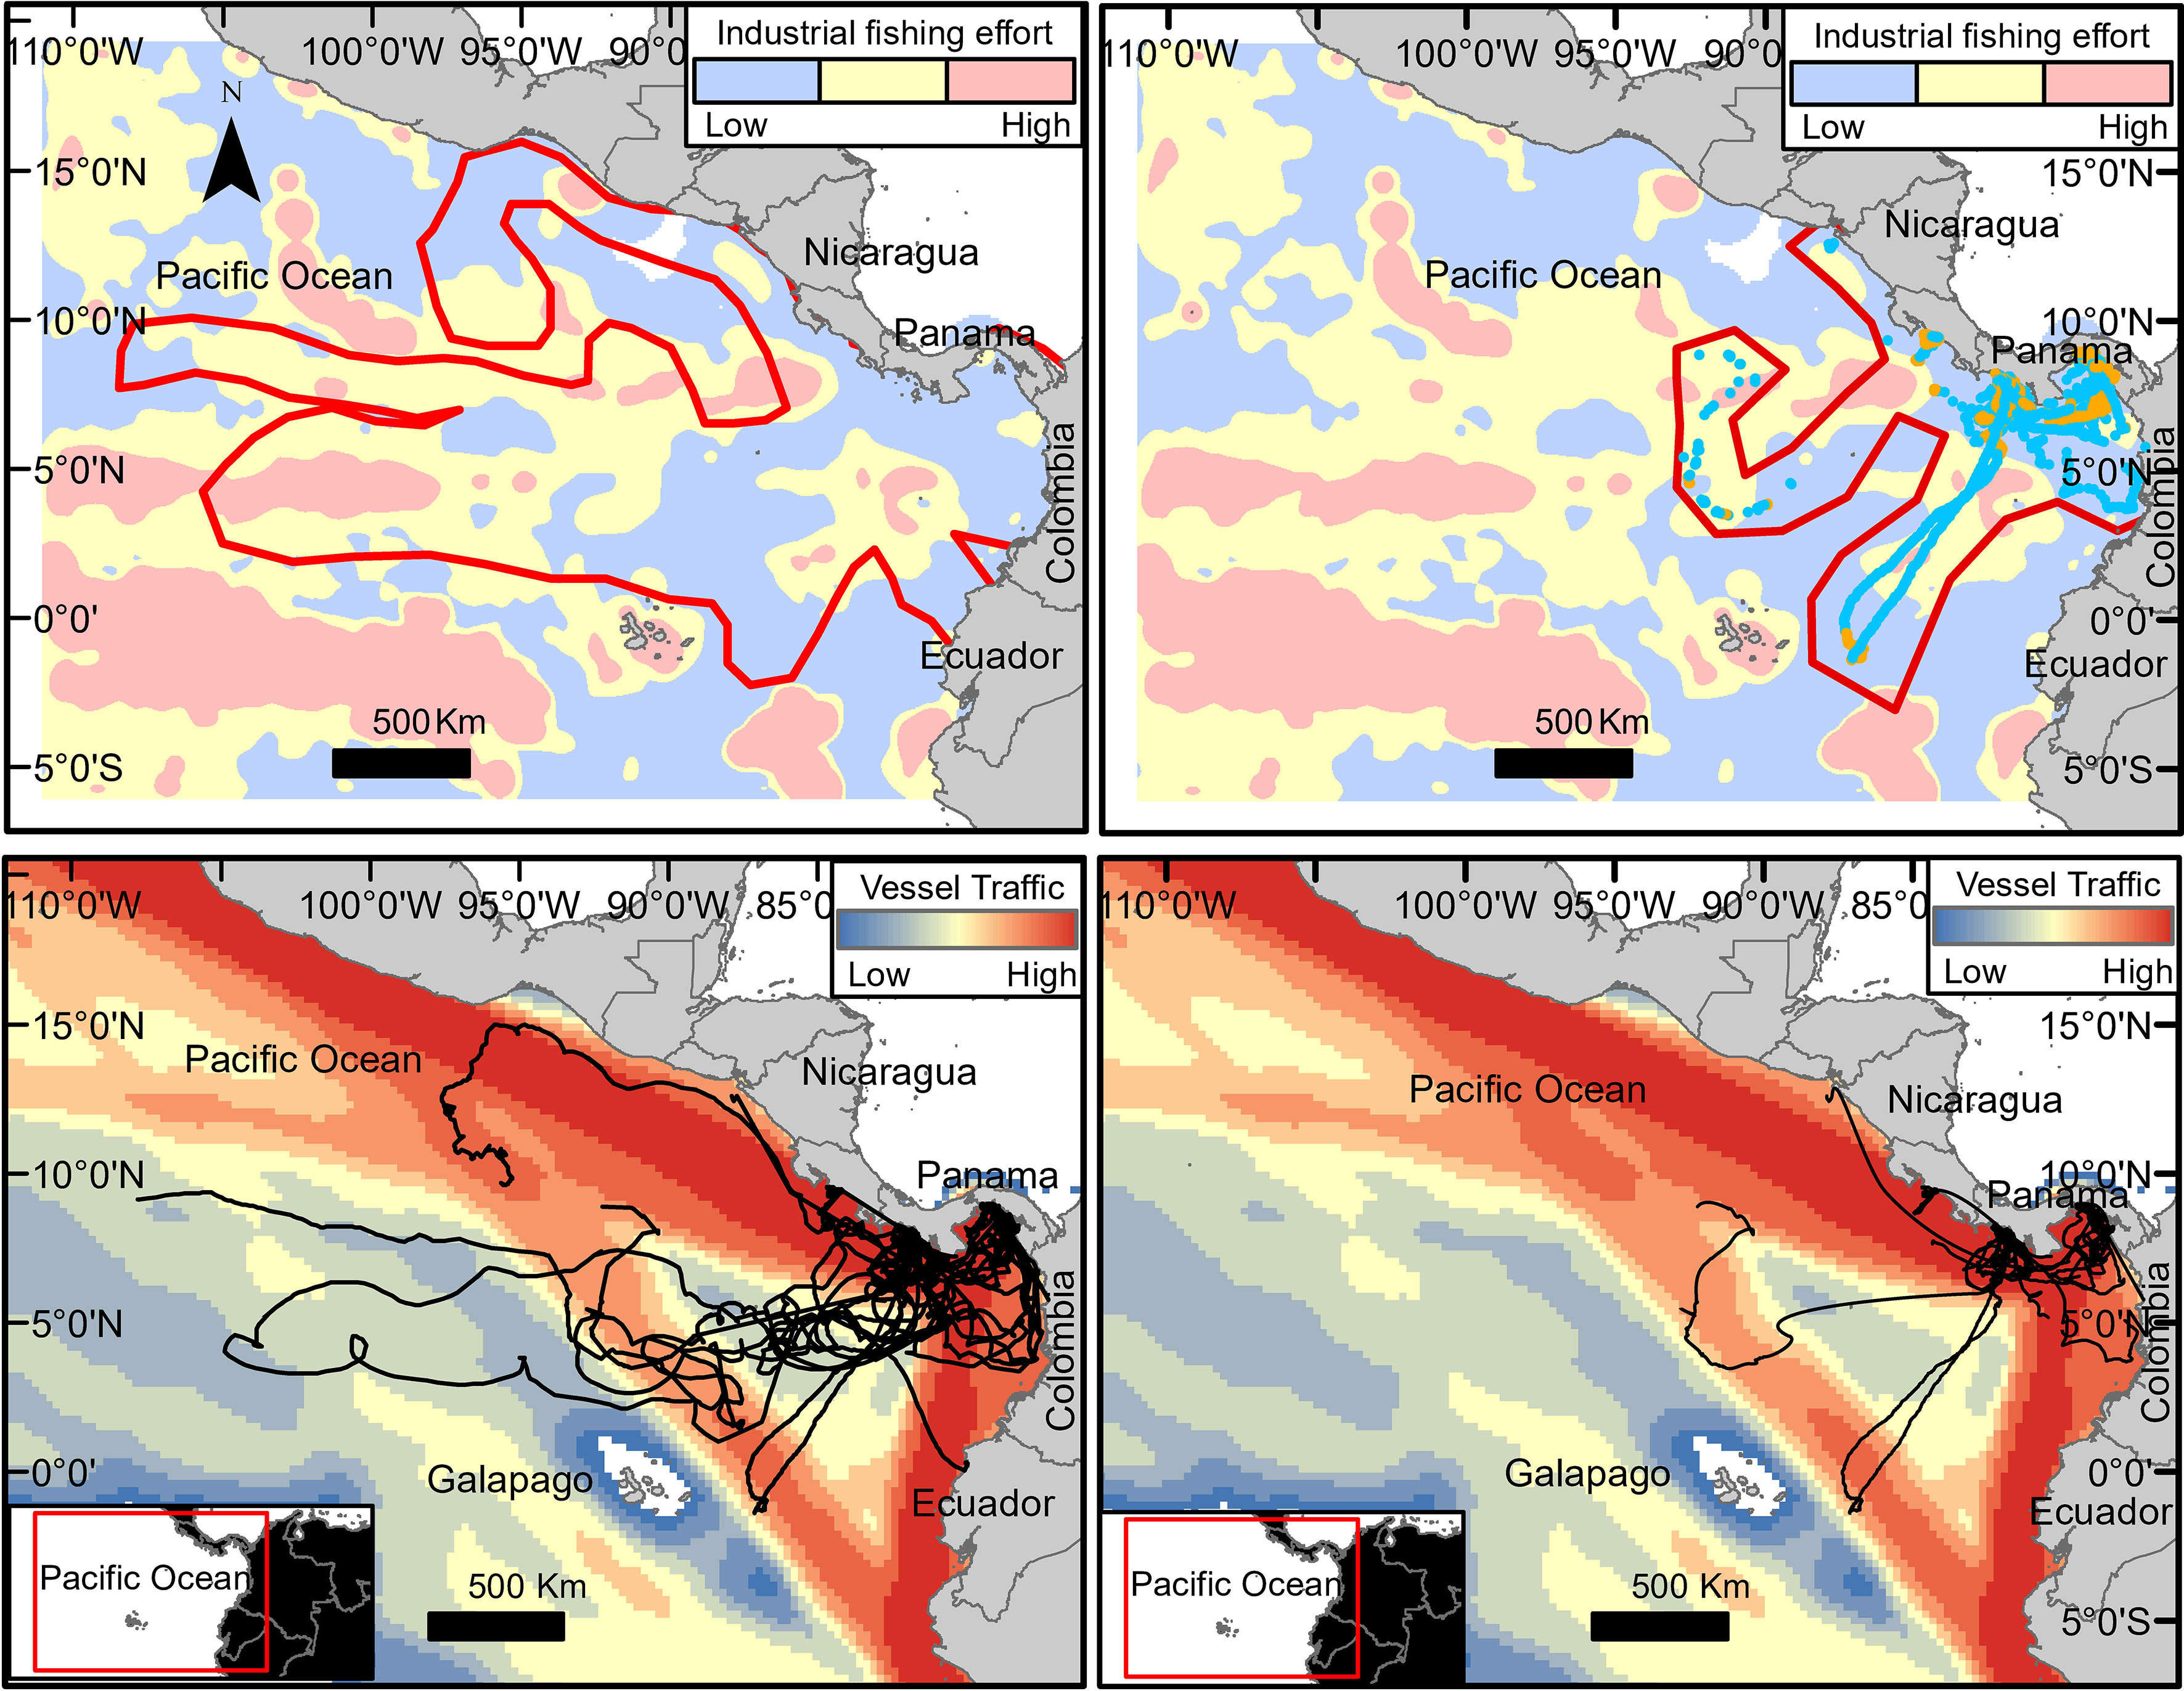
Figure 5 Level of threat within areas used by Rhincodon typus: industrial fishing effort within R. typus habitat (red polygon) as the combined effect of density of fishing boats and fishing hours (top plots); vessel traffic, as the combined effect of density of vessels and their traveling speed (botton plots). Complete trajectories of 30 individuals (left plots); removed or partially trimmed of 25 individuals (right plots).
3.5 Detached or Free-Floating Tags Versus Marine Currents and Winds
Traveling speed was not correlated to current speed (Figures S1, 2) at two different depths for any of the five suspicious whale shark trajectories: 107719 (R= 0.078, p>0.05 at surface; R=0.15, p>0.005 at 15 m), 54741(R= -0.032, p>0.05; R=0.025, p>0.005), 54745 (R= -0.004, p>0.05; R=-0.1, p>0.005), 54764 (R= -0.2, p>0.05; R= 0.045, p>0.05), and 54878 (R= -0.2, p>0.05; R= -0.059, p>0.05). In addition, tag speed was tested for correlation with wind diffusivity current speed and marine currents, no correlation was found between these three variables, except for a significant correlation between tag speed and wind speed for tag 54764 (Table 8). These analyses suggest that those five tags were not floating on the surface, carried away by marine currents and winds, or detached from the animal.
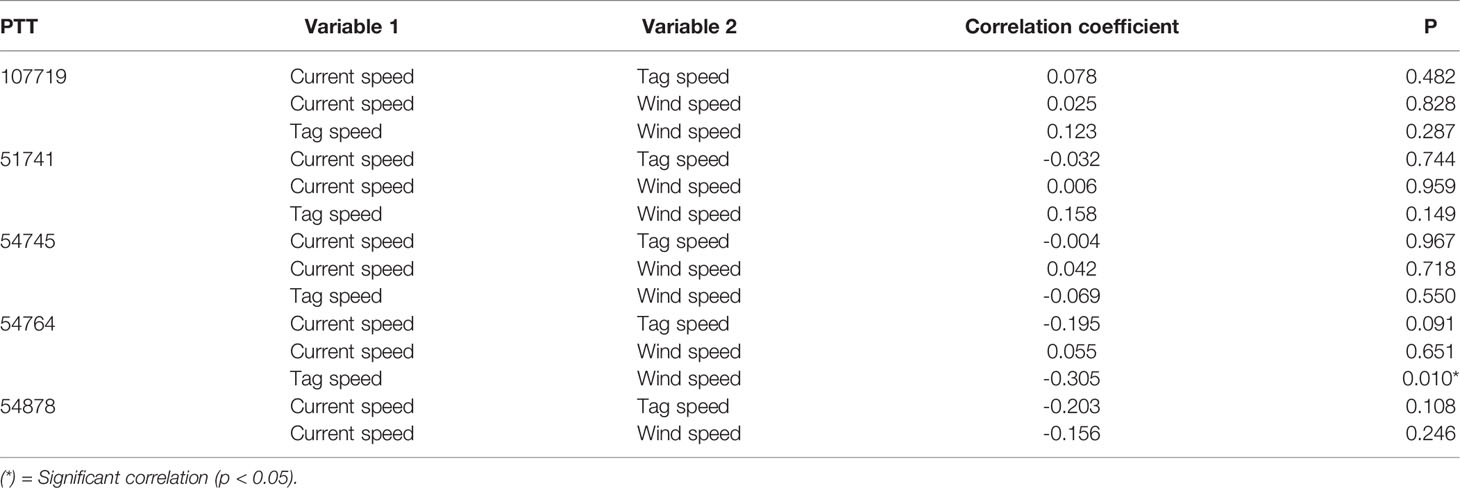
Table 8 Correlations between tag, marine current, and wind diffusivity current speeds for five tags assumed to be detached or free-floating.
4 Discussion
For the first time, we investigated the movement, behavior, and habitat use of 30 R. typus individuals tagged in Panamanian waters. Our results indicate that the sharks spent the majority of their time foraging inside the Panamanian EEZ but also moved north to Mexico, south to Ecuador, and west to the open ocean. One female (PTT no. 107715) previously reported, traveled over 20,000 km to the western Indo-Pacific, which is the longest recorded trans-Pacific migration of an R. typus individual (also see Guzman et al., 2018). In comparison, tracking data from 27 adult female R. typus tagged near Darwin Island in the Galápagos archipelago revealed that individuals remained in the tagging area for short periods of time before moving into the open equatorial Pacific (Hearn et al., 2016). Similarly, immature individuals tagged in the Gulf of California largely remained in the Gulf, while adults moved out into the Pacific (Eckert and Stewart, 2001; Ramírez-Macías et al., 2017). Taken together, these studies indicate the importance of the coastal waters of the tropical eastern Pacific and the offshore areas of the Cocos and Galapagos islands as foraging and migratory habitats for R. typus (Acuña-Marrero et al., 2014). In addition, genetic connectivity between the biogeographic regions of the Eastern Pacific and the Indo-Pacific, particularly with the Western Indo-Pacific Ocean has been demonstrated for Panamanian transient individuals (Guzman et al., 2021), and as inferred migration route (Sequeira et al., 2013).
4.1 Analyses and Interpretation of Potential Detached or Free-Drifting Tags
We analyzed and plotted the individual tracks for all 30 animals. However, we paid particular attention to those five tags with the longest record (PTTS 107719, 54741, 54745, 54764, and 54878) that seem to suggest that they separated from the animal at some point and continued transmitting with the ocean currents. Hearn et al. (2013) recognized the small sample size used in the analyses, the “considerable variation among individuals in the length and time spent at the surface”, and that data recorded by Argos satellite were intermittently with gaps of several days in some of the tagged animals. We cannot explain technically why transmissions in our longest records were at the same time on every day, and recognize this potential caveat. However, our analyses open the door to an alternative interpretation that could take more into account the animal’s diving behavior (surface, vertical) while migrating or provisioning (feeding), and the lack of information on the movement and habitat use of whale sharks away from shallow coastal areas (Brunnschweiler et al., 2009). Graham et al. (2006) demonstrated that whale sharks could display “ultradian, diel and circa-lunar rhythmicity of diving behavior” during feeding. In addition, daily provisioning patterns change significantly during the day, apparently in response to changes in temperature and perhaps the size of the individual (Araujo et al., 2020).
Consequently, we argue that it is not easy to discern from the number and frequency of ARGOS transmissions alone the movement of whale sharks in an open ocean highly influenced by current, eddies, and sea surface height. Especially if it is considered that our data was properly filtered to correct potential satellite errors, went through two modeling processes (Bayesian and Markov models) to understand and interpret their trajectories and behaviors, and these trajectories, in turn, were analyzed with each individual’s velocity information, current velocity and current velocity within the eddies. Hearn et al. (2018) showed floating tags drifting into open ocean at very different speeds and following an unmeasured current pattern into an eddy; we instead, measured animal movement in real-time and no relationship with surface currents and surface wind were observed, as previously reported for the species (Sleeman et al., 2010).
4.2 Environmental Variables and the Distribution of Rhincodon typus
Previous studies have shown that the distribution and aggregation of R. typus are associated with physical and biological oceanographic features relating to productivity (Stevens, 2007). Indeed, our results show that most inferred foraging occurred in shallower coastal waters, with a significant use of seamounts and ridges, and was significantly related to productivity and chlorophyll-a concentrations. This is in accordance with findings from other locations, where seasonal R. typus aggregations are typically associated with temporary increases in food resources (Stevens, 2007). In the tropical eastern Pacific, productivity is strongly influenced by the upwelling systems. Ryan et al. (2017) examined R. typus movements in relation to thermo-biological frontal systems in the eastern Pacific and found a strong association between individual movements and the northern equatorial upwelling front, with 80% of shark positions occurring within the front. The same authors observed that seasonal movements between the equatorial and eastern boundary upwelling systems linked to productivity. Thus, our data indicate that R. typus in Panamanian waters exhibit similar foraging behaviors to individuals inhabiting the Pacific.
Migratory R. typus behavior has been linked to environmental factors such as water depth, SST, and eddy currents (Heyman et al., 2001; Riley et al., 2010). In our study, R. typus spent more time in eddies while migrating (17%) than foraging (10%), and when inside an eddy, eddy speed was significantly related to migratory behavior. Additionally, the two individual sharks that spent the most time within eddies were also those that spent the highest proportion of their time migrating (83% and 73%). Indeed, mesoscale eddies are important drivers of ocean ecosystem structure and are foraging hotspots for many marine animals in the eastern Pacific (Willett et al., 2006; Della Penna and Gaube, 2020). Eddy formation can drive the vertical movement of nutrients and phytoplankton and trap productive waters (Della Penna and Gaube, 2020). This may encourage R. typus to follow eddies during their migration to find food sources. Both anticyclonic eddies, which are associated with positive sea level anomalies (in the Tehuantepec and Papagayo eddy areas) and cyclonic eddies, which are associated with negative sea level anomalies (in the Humboldt Current), are linked to R. typus tracks (Revelles et al., 2007). Therefore, R. typus movement may not be specific to eddy type but more influenced by eddy speed. It has been suggested that the temperature gradients associated with eddies can be used for navigation by whale sharks (Sleeman et al., 2010). This might explain the observed association between higher eddy speeds and migratory behavior. However, it is important to note that seasonal and inter-annual variability in oceanographic conditions is characteristic of the eastern tropical Pacific, which may account for some of the variation between individuals and between regions.
4.3 Rhincodon typus Inside Marine Protected Areas
R. typus visited 17 MPAs within five countries, yet only 22.6% of the modeled locations occurred within an MPA. This may be considered an underestimation due to the ongoing increase of MPAs in the region. While MPAs are a valuable conservation tool, their effectiveness may be somewhat limited for highly mobile species (Norman, 1999; Reynolds et al., 2017). For migratory species such as R. typus, transboundary MPAs and MPA networks are especially important conservation approaches, as are efforts to protect oceanic areas (such as Cordillera de Coiba) and areas beyond national jurisdiction. In some areas, MPAs have been established to protect seasonal and year-round R. typus aggregations, such as South Ari Atoll in the Maldives and Ningaloo Reef in Australia. Additionally, the Marine Conservation Corridor of the Eastern Tropical Pacific (MCCETP) between the islands of Cocos, Galapagos, Malpelo, and Coiba was formally established in 2004 for the conservation and sustainable use of biodiversity in the equatorial eastern Pacific. Our observations highlight the importance of this area for R. typus. Adaptive management approaches and the use of dynamic MPAs that incorporate spatially dynamic ocean features, such as thermal fronts, are also important considerations given the importance of these features for R. typus and ongoing shifts in species distributions (Hooker et al., 2011).
4.4 Rhincodon typus Interactions With Fisheries
Injury and mortality because of interactions with fishing gear, including long lines (Wang et al., 2021), have emerged as key threat to many marine species, especially sharks and rays (Stevens et al., 2000). In our study, tagged R. typus transmitted from low-, medium-, and high-effort fishing areas, although approximately half of the modeled locations occurred from high-fishing-effort areas. The observed overlap with the tuna purse seine fishery is perhaps unsurprising given that purse seine fishing occurs more frequently in areas with high net primary productivity (Kroodsma et al., 2018), and tuna are often associated with other large species. Such fishing activities close to R. typus can lead to accidental capture and entanglement. Capietto et al. (2014) examined the spatial-temporal distribution of R. typus and fishery interaction hotspots in the Atlantic and Indian Oceans and recorded the number and fate of captured animals. They found high rates of incidental capture but low mortality because of these interactions. In contrast, high rates of mortality associated with fishing activities have been recorded in the Pacific Ocean (Western and Central Pacific Fisheries Commission, 2010). While we assessed fishing effort based on 70,000 out of 2.9 million motorized fishing vessels, small vessels (< 24 m) not equipped with an AIS system were not included (Kroodsma et al., 2018) despite also posing a threat. While there is a clear overlap between R. typus habitat use and fishing areas, long-term assessments of post-release survival are needed to obtain a clearer picture of the true impact of fishing on R. typus populations in the eastern Pacific (Capietto et al., 2014). Bycatch of juveniles and neonates in Peruvian waters is a clear example of the impact of fisheries on the species at any maturity stage (Pajuelo et al., 2018).
4.5 Rhincodon typus Interactions With Marine Traffic
As slow-moving surface dwellers, R. typus are vulnerable to collision with marine vessel traffic, and there is a high degree of global overlap between shipping activity and habitat use (Pirotta et al., 2019; Womersley et al., 2021; Womersley et al., 2022). Based on our observations, most modeled locations from tagged individuals occurred within high-impact vessel traffic areas, that is, a high density of vessels moving at high speed. Previous studies have found that individual R. typus spend approximately half of their time in surface waters (< 10 m depth) (Eckert and Stewart, 2001; Rowat and Gore, 2007; Womersley et al., 2021), and interactions with ships can result in behavioral modification, disturbance, displacement, injury, and even mortality (Pirotta et al., 2019; Womersley et al., 2021). Given the spatial overlap between marine vessels and R. typus habitat use, injury and mortality from ship collisions could be a significant factor in observed population declines (Womersley et al., 2022). Additional research is, therefore, needed to elucidate the extent of such interactions and their effects on R. typus fitness, survival, and, ultimately, population status.
Overall, this study shows that the coastal waters of Panama form an important foraging and migratory habitat for R. typus from which nomadic individuals move to other key areas in the eastern Pacific and the Indo-Pacific. Our observations highlight the need for further conservation of these habitats and the R. typus populations they support. Furthermore, we found that oceanographic processes are key determinants of R. typus distribution and behavior, primarily via influences on productivity, making R. typus vulnerable to changing climate conditions that can increase, water temperature, El Niño-Southern Oscillation events, ocean stratification and reduce productivity (Sequeira et al., 2014; Fiedler and Lavín, 2017; Riascos et al., 2019).
The high degree of overlap between R. typus habitat and human activities highlights the need for marine conservation planning approaches beyond MPAs at key aggregation sites, and the insights gleaned from this work can inform conservation planning at appropriate scales. More generally, our study highlights the value of satellite tracking studies for understanding the behavior, habitat use, and potential adaptation to climate change of highly mobile migratory species, such as R. typus.
Geopolitics have an impact in the conservation of transboundary species including marine protected areas where conflicts can be amplified (Harrison et al., 2018; Mackelworth et al., 2019). Our results suggest that this transboundary species could benefit from a regional conservation plan that includes high seas or international waters to improve its protection. Local regulations and management practices are in place in most countries along with the eastern Pacific offshore islands and some coastal areas, including fishing and product commercialization prohibitions and promoting ecotourism. Establishing a functional marine corridor or seaway (Migravia) was suggested (Guzman et al., 2021), and a plan for connecting EZZ waters of Ecuador, Colombia, Panama, and Costa Rica is in progress, but Peru must be included. The only existing corridor politically was established in 2014 along with six Central American countries, including Panama, Costa Rica, Nicaragua, Honduras, El Salvador, and Guatemala (OSPESCA, 2014). However, the protection of large high-seas areas, perhaps used along the shark’s migratory routes for feeding and breeding as observed in this study, is not considered. We recommend the following actions: 1) Create a regional science-policy task force to coordinate the conservation of whale sharks in the eastern Pacific (Mexico-Peru minimum); 2) Develop marine territorial planning identifying critical aggregation areas potentially used for feeding and breeding; 3) Analyze migratory routes coupled with marine currents and vessel traffic routes to identify potential risk areas; 4) Increase satellite tagging efforts in the high-seas and coastal areas to understand the movement ecology of the species better.
Authors's Note
Global Fishing Watch has made every attempt to ensure the completeness, accuracy and reliability of the information provided on this Site. However, due to the nature and inherent limitations in source materials for information provided, Global Fishing Watch qualifies all designations of vessel fishing activity, including synonyms of the term “fishing activity”, such as “fishing” or “fishing effort”, as “apparent”, rather than certain. And accordingly, the information is provided “as is” without warranty of any kind.
Data Availability Statement
The raw data supporting the conclusions of this article will be made available by the authors, without undue reservation.
Ethics Statement
The animal study was reviewed and approved by Smithsonian Tropical Research Institute ACUC.
Author Contributions
HG conceived the study, tagged all animals, and developed the research questions and analytical procedures. CG developed the statistical methods, programmed the R-codes, and performed the statistical analyses. HG, CG, and CC edited and approved the final version of the manuscript.
Funding
This research was partially funded by the MarViva Foundation (Panama), the International Community Foundation-CANDEO, the Secretaria Nacional de Ciencia, Tecnología e Innovación de Panamá (SENACYT), the Sistema Nacional de Investigadores from SENACYT, and the Smithsonian Tropical Research Institute.
Conflict of Interest
The authors declare that the research was conducted in the absence of any commercial or financial relationships that could be construed as a potential conflict of interest.
Publisher’s Note
All claims expressed in this article are solely those of the authors and do not necessarily represent those of their affiliated organizations, or those of the publisher, the editors and the reviewers. Any product that may be evaluated in this article, or claim that may be made by its manufacturer, is not guaranteed or endorsed by the publisher.
Acknowledgments
We thank C. Guevara and K. Mantel for their logistical assistance in the field. We also thank Marianne Fish and Editage (www.editage.com) for formatting and English language editing. We thanks five reviewers for the revision of the manuscript.
Supplementary Material
The Supplementary Material for this article can be found online at: https://www.frontiersin.org/articles/10.3389/fmars.2022.793248/full#supplementary-material
References
Acuña-Marrero D., Jiménez J., Smith F., Doherty P. F. Jr, Hearn A., Green J. R., et al. (2014). Whale Shark (Rhincodon Typus) Seasonal Presence, Residence Time and Habitat Use at Darwin Island, Galapagos Marine Reserve. PLos One 9 (12), e115946. doi: 10.1371/journal.pone.0115946
Araujo G., Labaja J., Snow S., Huveneers C., Ponzo A. (2020). Changes in Diving Behaviour and Habitat Use of Provisioned Whale Sharks: Implications for Management. Sci. Rep. 10 (1), 1–12. doi: 10.1038/s41598-020-73416-2
Brunnschweiler J. M., Baensch H., Pierce S. J., Sims D. W. (2009). Deep-Diving Behaviour of a Whale Shark Rhincodon Typus During Long-Distance Movement in the Western Indian Ocean. J. Fish Biol. 74 (3), 706–714. doi: 10.1111/j.1095-8649.2008.02155.x
Capietto A., Escalle L., Chavance P., Dubroca L., Delgado de Molina A., Murua H., et al. (2014). Mortality of Marine Megafauna Induced by Fisheries: Insights From the Whale Shark, the World’s Largest Fish. Biol. Conserv. 174, 147–151. doi: 10.1016/j.biocon.2014.03.024
Chen C. T., Liu K. M., Joung S. J. (1997). Preliminary Report on Taiwan's Whale Shark Fishery. TRAFFIC Bull. 17, 53–57. http://scholars.ntou.edu.tw/handle/123456789/16686
Colman J. G. (1997). A Review of the Biology and Ecology of the Whale Shark. J. Fish Biol. 51, 1219–1234. doi: 10.1111/j.1095-8649.1997.tb01138.x
de la Parra Venegas R., Hueter R., González Cano J., Tyminski J., Gregorio Remolina J., Maslanka M., et al. (2011). An Unprecedented Aggregation of Whale Sharks, Rhincodon Typus, in Mexican Coastal Waters of the Caribbean Sea. PLos One 6, e18994. doi: 10.1371/journal.pone.0018994
Della Penna A., Gaube P. (2020). Mesoscale Eddies Structure Mesopelagic Communities. Front. Mar. Sci. 7. doi: 10.3389/fmars.2020.00454
Diamant S., Rohner C. A., Kiszka J. J., d’Echon A. G., d’Echon T. G., Sourisseau E., et al. (2018). Movements and Habitat Use of Satellite-Tagged Whale Sharks Off Western Madagascar. Endanger. Species Res. 36, 49–58. doi: 10.3354/esr00889
Eckert S. A., Stewart B. S. (2001). Telemetry and Satellite Tracking of Whale Sharks, Rhincodon Typus, in the Sea of Cortez, Mexico and the North Pacific Ocean. Environ. Biol. Fish. 60, 299–308. doi: 10.1023/A:1007674716437
E.U. Copernicus Marine Service Information (2022) MULTIOBS_GLO_PHY_NRT_015_003 (Global Total Surface and 15m Current - COPERNICUS-GLOBCURRENT) From Altimetric Geostrophic Current and Modeled Ekman Current Processing). Available at: https://resources.marine.copernicus.eu/product-detail/MULTIOBS_GLO_PHY_NRT_015_003/DOCUMENTATION (Accessed January 2022).
Fiedler P. C., Lavín M. F. (2017). Oceanographic Conditions of the Eastern Tropical Pacific in Coral Reefs of the Eastern Tropical. Eds. Glynn P. W., Manzello D. P., Enochs I. C. (Netherlands: Springer), 59–83.
GEBCO Bathymetric Compilation Group (2020) Grid. 2020. Available at: https://dx.doi.org/10.5285/a29c5465-b138-234d-e053-6c86abc040b9 (Accessed May 7, 2021).
Global Fishing Watch. Available at: https://globalfishingwatch.org/ (Accessed November 30, 2020).
Graham R. T., Roberts C. M., Smart J. C. (2006). Diving Behaviour of Whale Sharks in Relation to a Predictable Food Pulse. J. R. Soc Interface. 3 (6), 109–116. doi: 10.1098/rsif.2005.0082
Gudger E. W. (1938). A Whale Shark Rammed by a Vessel Off the Pacific Coast of Western Panama. Nature 141, 516. doi: 10.1038/141516a0
Guzman H. M., Beaver C. E., Diaz-Ferguson E. (2021). Novel Insights Into the Genetic Population Connectivity of Transient Whale Sharks (Rhincodon Typus) in Pacific Panama Provide Crucial Data for Conservation Efforts. Frontier Mar. Sci. 8, 744109. doi: 10.3389/fmars.2021.744109
Guzman H. M., Gomez C. G., Hearn A., Eckert S. A. (2018). Longest Recorded Transpacific Migration of a Whale Shark (Rhincodon Typus). Mar. Biodivers. Rec. 11, 1–6. doi: 10.1186/s41200-018-0143-4
Harrison A. L., Costa D. P., Winship A. J., Benson S. R., Bograd S. J., Antolos M., et al. (2018). The Political Biogeography of Migratory Marine Predators. Nat. Ecol. Evol. 2 (10), 1571–1578. doi: 10.1038/s41559-018-0646-8
Hearn A. R., Green J. R., Espinoza E., Peñaherrera C., Acuña D., Klimley A. P. (2013). Simple Criteria to Determine Detachment Point of Towed Satellite Tags Provide First Evidence of Return Migrations of Whale Sharks (Rhincodon Typus) at the Galapagos Islands, Ecuador. Anim. Biotelemetry 1, 1–10. doi: 10.1186/2050-3385-1-11
Hearn A. R., Green J., Román M. H., Acuña-Marrero D., Espinoza E., Klimley A. P. (2016). Adult Female Whale Sharks Make Long-Distance Movements Past Darwin Island (Galapagos, Ecuador) in the Eastern Tropical Pacific. Mar. Biol. 163, 214. doi: 10.1007/s00227-016-2991-y
Heyman W. D., Graham R. T., Kjerfve B., Johannes R. E. (2001). Whale Sharks Rhincodon Typus Aggregate to Feed on Fish Spawn in Belize. Mar. Ecol. Prog. Ser. 215, 275–282. doi: 10.3354/meps215275
Hoenig J. M., Gruber S. H. (1990)Life-History Patterns in the Elasmobranchs: Implications for Fisheries Management in NOAA Tech. Rep. Nmfs. In: Elasmobranchs as Living Resources: Advances in the Biology, Ecology, Systematics, and the Status of the Fisheries (NOAA Technical Report NMFS). Available at: https://www.st.nmfs.noaa.gov/spo/SPO/tr90opt.pdf (Accessed May 10, 2021).
Hooker S., Cañadas A., Hyrenbach K., Corrigan C., Polovina J., Reeves R. (2011). Making Protected Area Networks Effective for Marine Top Predators. Endang. Species Res. 13, 203–218. doi: 10.3354/esr00322
Hueter R. E., Tyminski J. P., de la Parra R. (2013). Horizontal Movements, Migration Patterns, and Population Structure of Whale Sharks in the Gulf of Mexico and Northwestern Caribbean Sea. PLos One 8, e71883. doi: 10.1371/journal.pone.0071883
Jonsen I. (2016). Joint Estimation Over Multiple Individuals Improves Behavioural State Inference From Animal Movement Data. Sci. Rep. 6, 20625. doi: 10.1038/srep20625
Jonsen I. D., Flemming J. M., Myers R. A. (2005). Robust State-Space Modeling of Animal Movement Data. Ecology 86, 2874–2880. doi: 10.1890/04-1852
Joung S. J., Chen C. T., Clark E., Uchida S., Huang W. Y. P. (1996). The Whale Shark (Rhincodon Typus) is a Livebearer: 300 Embryos Found in One ‘Megamamma’ Supreme. Environ. Biol. Fish. 46, 219–223. doi: 10.1007/BF00004997
Ketchum J. T., Galván-Magaña F., Klimley A. P. (2012). Segregation and Foraging Ecology of Whale Sharks, Rhincodon Typus, in the Southwestern Gulf of California. Environ. Biol. Fishes. 96 (6), 779–795. doi: 10.1007/s10641-012-0071-9
Kroodsma D. A., Mayorga J., Hochberg T., Miller N. A., Boerder K., Ferretti F., et al. (2018). Tracking the Global Footprint of Fisheries. Science 359, 04–908. doi: 10.1126/science.aao5646
Mackelworth P. C., Teff Seker Y., Vega-Fernández T., Marques M., Lopes F., D’Anna G., et al. (2019). Geopolitics and Marine Conservation: Synergies and Conflicts. Front. Mar. Sci. 6. doi: 10.3389/fmars.2019.00759
Meekan M., Austin C. M., Tan M. H., Wei N. W. V., Miller A., Pierce S. J., et al. (2017). iDNA at Sea: Recovery of Whale Shark (Rhincodon Typus) Mitochondrial DNA Sequences From the Whale Shark Copepod (Pandarus Rhincodonicus) Confirms Global Population Structure. Front. Mar. Sci. 4. doi: 10.3389/fmars.2017.00420
Michelot T., Langrock R., Patterson T. A. (2016). moveHMM: An R Package for the Statistical Modelling of Animal Movement Data Using Hidden Markov Models. Methods Ecol. Evol. 7, 1308–1315. doi: 10.1111/2041-210X.12578
NOAA. ERDDAP. Available at: http://coastwatch.pfeg.noaa.gov/erddap/index.html (Accessed July 12, 2019).
NOAA NMFS SWFSC ERD Chlorophyll-A (Erdmh1chlamday). Available at: https://coastwatch.pfeg.noaa.gov/erddap/search/index.html?page=1&itemsPerPage=1000&searchFor=erdMH1chlamday (Accessed July 12, 2019).
NOAA NMFS SWFSC ERD Sea Surface Temperature. Available at: https://coastwatch.pfeg.noaa.gov/erddap/search/index.html?page=1&itemsPerPage=1000&searchFor=erdAGssta3day (Accessed July 12, 2019).
NOAA NMFS SWFSC ERD Primary Productivity. Available at: https://coastwatch.pfeg.noaa.gov/erddap/search/index.html?page=1&itemsPerPage=1000&searchFor=erdMH1pp1day (Accessed July 12, 2019).
Norman B. M. (1999). Aspects of the Biology and Ecotourism Industry of the Whale Shark Rhincodon Typus in North-Western Australia (Perth, Australia: Murdoch University).
Norman B. M., Holmberg J. A., Arzoumanian Z., Reynolds S. D., Wilson R. P., Rob D., et al. (2017). Undersea Constellations: The Global Biology of an Endangered Marine Mega-Vertebrate Further Informed Through Citizen Science. BioScience 67, 1029–1043. doi: 10.1093/biosci/bix127
OSPESCA (2014) Reglamento Regional OSP-07-2014, Para Fortalecer La Sostenibilidad Poblacional Del Tiburón Ballena (Rhincodon Typus) En Los Países Miembros Del SICA. El Salvador. Available at: http://www.fao.org/faolex/results/details/es/c/LEX-FAOC180626/.
Pajuelo M., Alfaro-Shigueto J., Romero M., Pásara-Polack A., Solano A., Vela G., et al. (2018). Occurrence and Bycatch of Juvenile and Neonate Whale Sharks (Rhincodon Typus) in Peruvian Waters. Pac. Sci. 72, 463–473. doi: 10.2984/72.4.6
Pierce S. J., Norman B. (2016). e.T19488A2365291. Rhincodon typus. The IUCN Red List of Threatened Species 2016. doi: 10.2305/IUCN.UK.2016-1.RLTS.T19488A2365291.en. (Accessed November 4, 2020).
Pirotta V., Grech A., Jonsen I. D., Laurance W. F., Harcourt R. G. (2019). Consequences of Global Shipping Traffic for Marine Giants. Front. Ecol. Environ. 17, 39–47. doi: 10.1002/fee.1987
Protected planet - protected areas (WDPA). Available at: https://www.protectedplanet.net/en/search-areas?filters%5Bdb_type%5D%5B%5D=wdpa (Accessed June 1, 2020).
Ramírez-Macías D., Queiroz N., Pierce S. J., Humphries N. E., Sims D. W., Brunnschweiler J. M. (2017). Oceanic Adults, Coastal Juveniles: Tracking the Habitat Use of Whale Sharks Off the Pacific Coast of Mexico. PeerJ 5, e3271. doi: 10.7717/peerj.3271
R Core Team (2018) R: A Language and Environment for Statistical Computing (Vienna: R Foundation for Statistical Computing). Available at: https://www.R-project.org/ (Accessed July 12, 2019).
Revelles M., Isern-Fontanet J., Cardona L., San Félix M., Carreras C., Aguilar A. (2007). Mesoscale Eddies, Surface Circulation and the Scale of Habitat Selection by Immature Loggerhead Sea Turtles. J. Exp. Mar. Biol. Ecol. 347, 41–57. doi: 10.1016/j.jembe.2007.03.013
Reynolds S. D., Norman B. M., Beger M., Franklin C. E., Dwyer R. G. (2017). Movement, Distribution, and Marine Reserve Use by an Endangered Migratory Giant. Divers. Distrib. 23, 1268–1279. doi: 10.1111/ddi.12618
Riascos J. M., Gutierrez D., Ecribano R., Thatje S. (2019). Editorial: El Niño-Southern Oscillation on a Changing Planet: Consequences for Coastal Ecosystems. Front. Mar. Sci. 6. doi: 10.3389/fmars.2019.00774
Riley M. J., Hale M. S., Harman A., Rees R. G. (2010). Analysis of Whale Shark Rhincodon Typus Aggregations Near South Ari Atoll, Maldives Archipelago. Aquat. Biol. 8, 145–150. doi: 10.3354/ab00215
Rowat D., Brooks K. S. (2012). A Review of the Biology, Fisheries and Conservation of the Whale Shark Rhincodon Typus. J. Fish Biol. 80, 1019–1056. doi: 10.1111/j.1095-8649.2012.03252.x
Rowat D., Gore M. (2007). Regional Scale Horizontal and Local Scale Vertical Movements of Whale Sharks in the Indian Ocean Off Seychelles. Fish. Res. 84, 32–40. doi: 10.1016/j.fishres.2006.11.009
Ryan J. P., Green J. R., Espinoza E., Hearn A. R. (2017). Association of Whale Sharks (Rhincodon Typus) With Thermo-Biological Frontal Systems of the Eastern Tropical Pacific. PLos One 12, e0182599. doi: 10.1371/journal.pone.0182599
Sequeira A. M., Mellin C., Fordham D. A., Meekan M. G., Bradshaw C. J. A. (2014). Predicting Current and Future Global Distributions of Whale Sharks. Global Change Biol. 20, 778–789. doi: 10.1111/gcb.12343
Sequeira A. M., Mellin C., Meekan M. G., Sims D. W., Bradshaw C. J. (2013). Inferred Global Connectivity of Whale Shark Rhincodon Typus Populations. J. Fish Biol. 82, 367–389. doi: 10.1111/jfb.12017
Sequeira A. M., Thums M., Brooks K., Meekan M. G. (2016). Error and Bias in Size Estimates of Whale Sharks: Implications for Understanding Demography. R. Soc Open Sci. 3, 150668. doi: 10.1098/rsos.150668
Sleeman J. C., Meekan M. G., Wilson S. G., Polovina J. J., Stevens J. D., Boggs G. S., et al. (2010). To Go or Not to Go With the Flow: Environmental Influences on Whale Shark Movement Patterns. J. Exp. Mar. Biol. Ecol. 390, 84–98. doi: 10.1016/j.jembe.2010.05.009
SSALTO/DUACS (2019) The Altimeter the Mesoscale Eddy Trajectory Atlas Products Were Produced by SSALTO/DUACS and Distributed by AVISO+ (http://www.aviso.altimetry.fr/) With Support From CNES, in Collaboration With Oregon State University With Support From NASA. Available at: https://www.aviso.altimetry.fr/en/data/products/value-added-products/global-mesoscale-eddy-trajectory-product.html (Accessed July, 2019).
Stevens J. D. (2007). Whale Shark (Rhincodon Typus) Biology and Ecology: A Review of the Primary Literature. Fish Res. 84, 4–9. doi: 10.1016/j.fishres.2006.11.008
Stevens J. D., Bonfil R., Dulvy N. K., Walker P. A. (2000). The Effects of Fishing on Sharks, Rays, and Chimaeras (Chondrichthyans), and the Implications for Marine Ecosystems. ICES J. Mar. Sci. 57, 476–494. doi: 10.1006/jmsc.2000.0724
Subhash R. L., Jonah L. K., Solymos P. (2019). ““ResourceSelection”: Resource Selection (Probability) Functions for Use-Availability Data,” in R Package Version 0.3-5. Available at: https://CRAN.R-project.org/package=ResourceSelection. Accessed: July 15, 2020).
Vincent C., Mcconnell B. J., Ridoux V., Fedak M. A. (2002). Assessment of Argos Location Accuracy From Satellite Tags Deployed on Captive Gray Seals. Marine Mammal Science, 18(1):156–66.
Wang J., Gao C., Wu F., Gao X., Chen J., Dai X., et al (2021). The Discards and Bycatch of Chinese Tuna Longline Fleets in the Pacific Ocean From 2010 to 2018. Biological Conservation, 255:109011.
Western & Central Pacific Fisheries Commission (WCPFC) (2010) Summary Information on Whale Shark and Cetacean Interactions in the Tropical WCPFC Purse Seine Fishery. Available at: https://www.wcpfc.int/node/2670 (Accessed May 10, 2021).
Willett C. S., Leben R. R., Lavín M. F. (2006). Eddies and Tropical Instability Waves in the Eastern Tropical Pacific: A Review. Prog. Oceanogr. 69, 218–238. doi: 10.1016/j.pocean.2006.03.010
Womersley F., Hancock J., Cameron T. Perry C. T., Rowat D. (2021). Wound-Healing Capabilities of Whale Sharks (Rhincodon Typus) and Implications for Conservation Management. Conserv. Physiol. 9, 1–17. doi: 10.1093/conphys/coaa120
Womersley F. C., Humphries N. E., Queiroz N., Vedor M., da Costa I., Furtado M., et al. (2002). Global Collision-Risk Hotspots of Marine Traffic and the World’s Largest Fish, the Whale Shark. Proc. Nat. Acad. Sci. 119 (20), e2117440119. doi: 10.1073/pnas.2117440119
Xtractomatic M. R. (2018) Accessing Environmental Data From ERD’s ERDDAP Server. Available at: https://CRAN.R-project.org/package=xtractomatic (Accessed July 12, 2019).
Keywords: Rhincodon typus, satellite tracks, habitat use, marine protected areas, migration, fisheries, Panama
Citation: Guzman HM, Collatos CM and Gomez CG (2022) Movement, Behavior, and Habitat Use of Whale Sharks (Rhincodon typus) in the Tropical Eastern Pacific Ocean. Front. Mar. Sci. 9:793248. doi: 10.3389/fmars.2022.793248
Received: 11 October 2021; Accepted: 27 May 2022;
Published: 30 June 2022.
Edited by:
Mark Meekan, Australian Institute of Marine Science (AIMS), AustraliaReviewed by:
Aaron Carlisle, University of Delaware, United StatesAbdul Hamid A. Toha, University of Papua, Indonesia
Hawis Madduppa, Bogor Agricultural University, Indonesia
David Morgan, Murdoch University, Australia
Rob Harcourt, Macquarie University, Australia
Copyright © 2022 Guzman, Collatos and Gomez. This is an open-access article distributed under the terms of the Creative Commons Attribution License (CC BY). The use, distribution or reproduction in other forums is permitted, provided the original author(s) and the copyright owner(s) are credited and that the original publication in this journal is cited, in accordance with accepted academic practice. No use, distribution or reproduction is permitted which does not comply with these terms.
*Correspondence: Hector M. Guzman, Z3V6bWFuaEBzaS5lZHU=