 Paige Hoel
 Alexa Fredston
 Benjamin S. Halpern
- 1Atmospheric and Oceanic Science Department, University of California, Los Angeles, Los Angeles, CA, United States
- 2Department of Ecology, Evolution, and Natural Resources, Rutgers University, New Brunswick, NJ, United States
- 3National Center for Ecological Analysis and Synthesis, University of California, Santa Barbara, Santa Barbara, CA, United States
- 4Bren School of Environmental Science and Management, University of California, Santa Barbara, Santa Barbara, CA, United States
Coastal environments globally are experiencing an increase in the influence and impact of human activities. Assessing the amount of modification that anthropogenic impacts cause to coastal ecosystems is imperative for characterizing and predicting habitat loss and degradation, and prioritizing conservation measures. However, as the spatial scale and data availability of coastal ecosystems vary immensely, many of the established practices on habitat risk assessment are applicable only to small scales and regions with extensive monitoring efforts. Traditional small-scale assessments also present a challenge when trying to prioritize remediation and resources over larger areas or regions. Here we show a simplified risk assessment framework, applied to a global scenario to rank the risk of loss of ecological diversity within ecoregions. Using established knowledge on sensitivities of mangroves, seagrasses, and stony corals, we create a weighted risk scoring system for each biogenic habitat. This risk score is combined with the species richness in a given ecoregion to create a priority ranking. We find that seagrass contains the largest area at severe risk of ecological diversity loss, followed by stony corals and mangroves. This work establishes a framework for assessing risk of loss of ecological diversity within ecoregions that can be used to rank the needs of the regions, from local scale applications to global scale as presented here, without extensive computing resources or exhaustive datasets.
Introduction
Human impacts to coastal oceans have increased as our influence on these diverse and productive systems expands every year (Smith et al., 1999; Rabouille et al., 2001; Rabalais et al., 2010; Halpern et al., 2015). Impacts range from “direct” destruction of habitats such as physical damage of coral reefs, dredging of seagrasses, and mangrove deforestation, to “indirect” impacts that stem from activities far from the coastline (Coverdale et al., 2014). One of the most prominent impacts stems from land-based “indirect” human activities such as agriculture and forestry, which contribute to runoff that is transported via watersheds to the marine environment (Carpenter et al., 1998). Runoff can include sediments, nutrients such as nitrogen and phosphorus, wastewater effluent, and industrial and urban chemicals (Smith et al., 1999). This runoff in turn impacts ecosystems, for example through eutrophication or loss of ecological diversity and species richness (Diaz and Rosenberg, 2008; Rabalais et al., 2010; Worm and Lotze, 2016). In order to effectively mitigate detrimental impacts such as collapses of food webs, hypoxia (often referred to as “dead zones”), and/or loss of keystone species, coastal managers need to understand several problems, including: where and how much land based human activities are influencing coastal marine ecosystems (Cloern, 2001; Halpern et al., 2009; Klein et al., 2010), and which of these impacted ecosystems are at greatest risk of loss of biodiversity (De Fontaubert et al., 1996; Urban et al., 2016).
Land based stressors which perturb local nutrient cycles and sediment dynamics may be caused by pollution from many different sources, often disconnected from marine systems both geographically and in terms of management and governance (Halpern et al., 2009). Local data on coastal runoff exists in some large case studies (Rabalais et al., 2002; Carstensen et al., 2006), however, there is generally a limited amount of coastal nutrient and sediment data at the local scale (Pellerin et al., 2016). Without local data, resource managers often make decisions about how to mitigate runoff impacts in an absence of any quantitative guidance, although qualitative decision frameworks exist to guide this process (Stem et al., 2005).
Natural resource managers and conservation practitioners are often tasked to make decisions about where to prioritize marine conservation efforts on short timescales and limited data available for analysis (Fredston-Hermann et al., 2016). Prioritization of conservation is difficult for these managers to judge without information on the direct and indirect impacts of land based human activities on coastal ecosystems (Stem et al., 2005). When conducting these analysis, a platform that can integrate a broad array of data types and creates a rich visualization, such as geographic information science (GIS) applications, would be ideal. GIS applications overlaying related risk factors in coastal systems have proven to aid in ecosystem planning and management (Stokes and Morrison, 2003; Tuda et al., 2014). Using this tool environmental planners can gain a far greater visual perspective on the scale of impact as well as the potential for resilience for their region (Noble et al., 2019).
Large-scale models of human impacts to coastal marine ecosystems have revealed the degree of ecological degradation at the global scale (Smith et al., 1999; Rabalais et al., 2010; Fabricius, 2011) as well as the complexity of human-ocean interactions (Halpern et al., 2015); Halpern et al. (2009) established a method of incorporating effects of land-sea interactions into prioritizing marine conservation efforts. This study incorporated four key land based drivers of ecological change, nutrient input, organic and inorganic pollution, and the direct impact of coastal populations. The analysis was global in coverage and presented a quantitative method of establishing priority in marine conservation. This study, however, did not account for specific ecosystem vulnerability, and the hotspots identified were independent of any species-specific data from that region.
The goal of our study was to create a spatially explicit representation of the risk coastal oceans face from human impacts and demonstrate this utility by creating a global coastal risk priority measurement within GIS. We adapt a previous ecosystem-based management framework (Fredston-Hermann et al., 2016) to generate biogenic habitat specific scores of vulnerability. This vulnerability was then combined with species richness data to generate a priority ranking for conservation. This habitat-specific analysis prioritizes regions that face the highest risk of loss of ecological diversity. We utilized the concept of multicriteria decision-making (MCDM; Massam, 1988) in GIS to create a spatially explicit model of risk along coastal ocean environments for specific biogenic habitats, adapted from the logic of Halpern et al. (2009). This risk score was combined with species richness data to create a conservation priority ranking.
Scenarios of global risk due to nitrogen and sediment impacts were depicted for three biogenic habitat types: seagrass, mangrove, and stony coral. Biogenic habitats refer not only to the species, but the surrounding environment created by that species (De Fontaubert et al., 1996). Not only are there rich datasets that exist for these three habitats, but also the ecosystems together cover coastal oceans globally with the exception of high latitudes (above 60 degrees North and South). Each of these three keystone species face some similar challenges, as well as independent risks The combination of physical damage to seagrass systems via dredging, fishing, and motor boating and light limitation from algal overgrowth from nutrient loading will dramatically increase the rates of which seagrass areas are destroyed (Burkholder et al., 2007). It has been estimated that 25% of coral regions are at risk due to watershed runoff alone (Rude et al., 2015). Roughly 1050 Ha of mangrove forests are felled annually for use as building materials and timber (Alongi, 2002).
It is important, however, to note that seagrasses, mangroves, and stony corals are in greater concentration in tropical regions, making our species-specific analysis inherently tropics focused. The level of detail to which seagrasses, mangroves, and coral have been studied allows for a rich historical account of change, a promising proxy to cross-reference our analysis (Short and Wyllie-Echeverria, 1996; Alongi, 2002; Burkholder et al., 2007; Klein et al., 2010; Erftemeijer et al., 2012; Cavanaugh et al., 2015).
This paper (1) presents a novel method of adapting an ecosystem-based management framework evaluating direct and indirect impacts of land based human activities on coastal ecosystems at a global scale, (2) discusses methodology for data integration and visualization, and (3) provides a framework, which allows coastal planners to compare vulnerability of specific species across coastal regions, using seagrass, mangrove and stone coral biogenic habitats as examples. Our analysis specified to loss of species richness within a biogenic habitat. The methodology presented here demonstrates one application of a flexible rudimentary model of prioritizing regions of high risk from human impact, and is applied to a dataset that, although lacking data from some polar regions and tropical islands, allows us to analyze many high-risk coastal oceans globally.
Materials and Methods
To understand the risk of human impact on coastal ecosystems and ecological diversity, we used Multi-criteria decision-making in ArcGis Pro (ArcGIS Pro, n.d.) to create a model and risk score. Risk, for the context of this paper, is the potential of the region to experience runoff related impacts that could cause a loss of ecological diversity. Multi-criteria decision-making (MCDM) is a method used to investigate a number of outcomes in light of multiple criteria (Massam, 1988). When used in a GIS environment, MCDM has proven to be successful for both large- and small-scale studies describing ecosystem-based services (Huang et al., 2011; Sánchez-Lozano et al., 2013).
The source of the data used in this study is the Nature Conservancy, accessed via the ArcGIS Living Atlas of the World (ArcGIS Living Atlas of the World, n.d.).
Generation of Criteria
For this global modeling exercise, the pre-existing framework designed by Fredston-Hermann et al. (2016), and the logic of the cumulative impact model used in Halpern et al. (2009) was used as a base for analysis. The framework was summarized into three inputs for analysis: nitrogen loading, sediment flux, and population impact. These layers aimed to capture the main influences of human related runoff, without overlapping data sources that might cause double-counting for an impact (Figure 1).
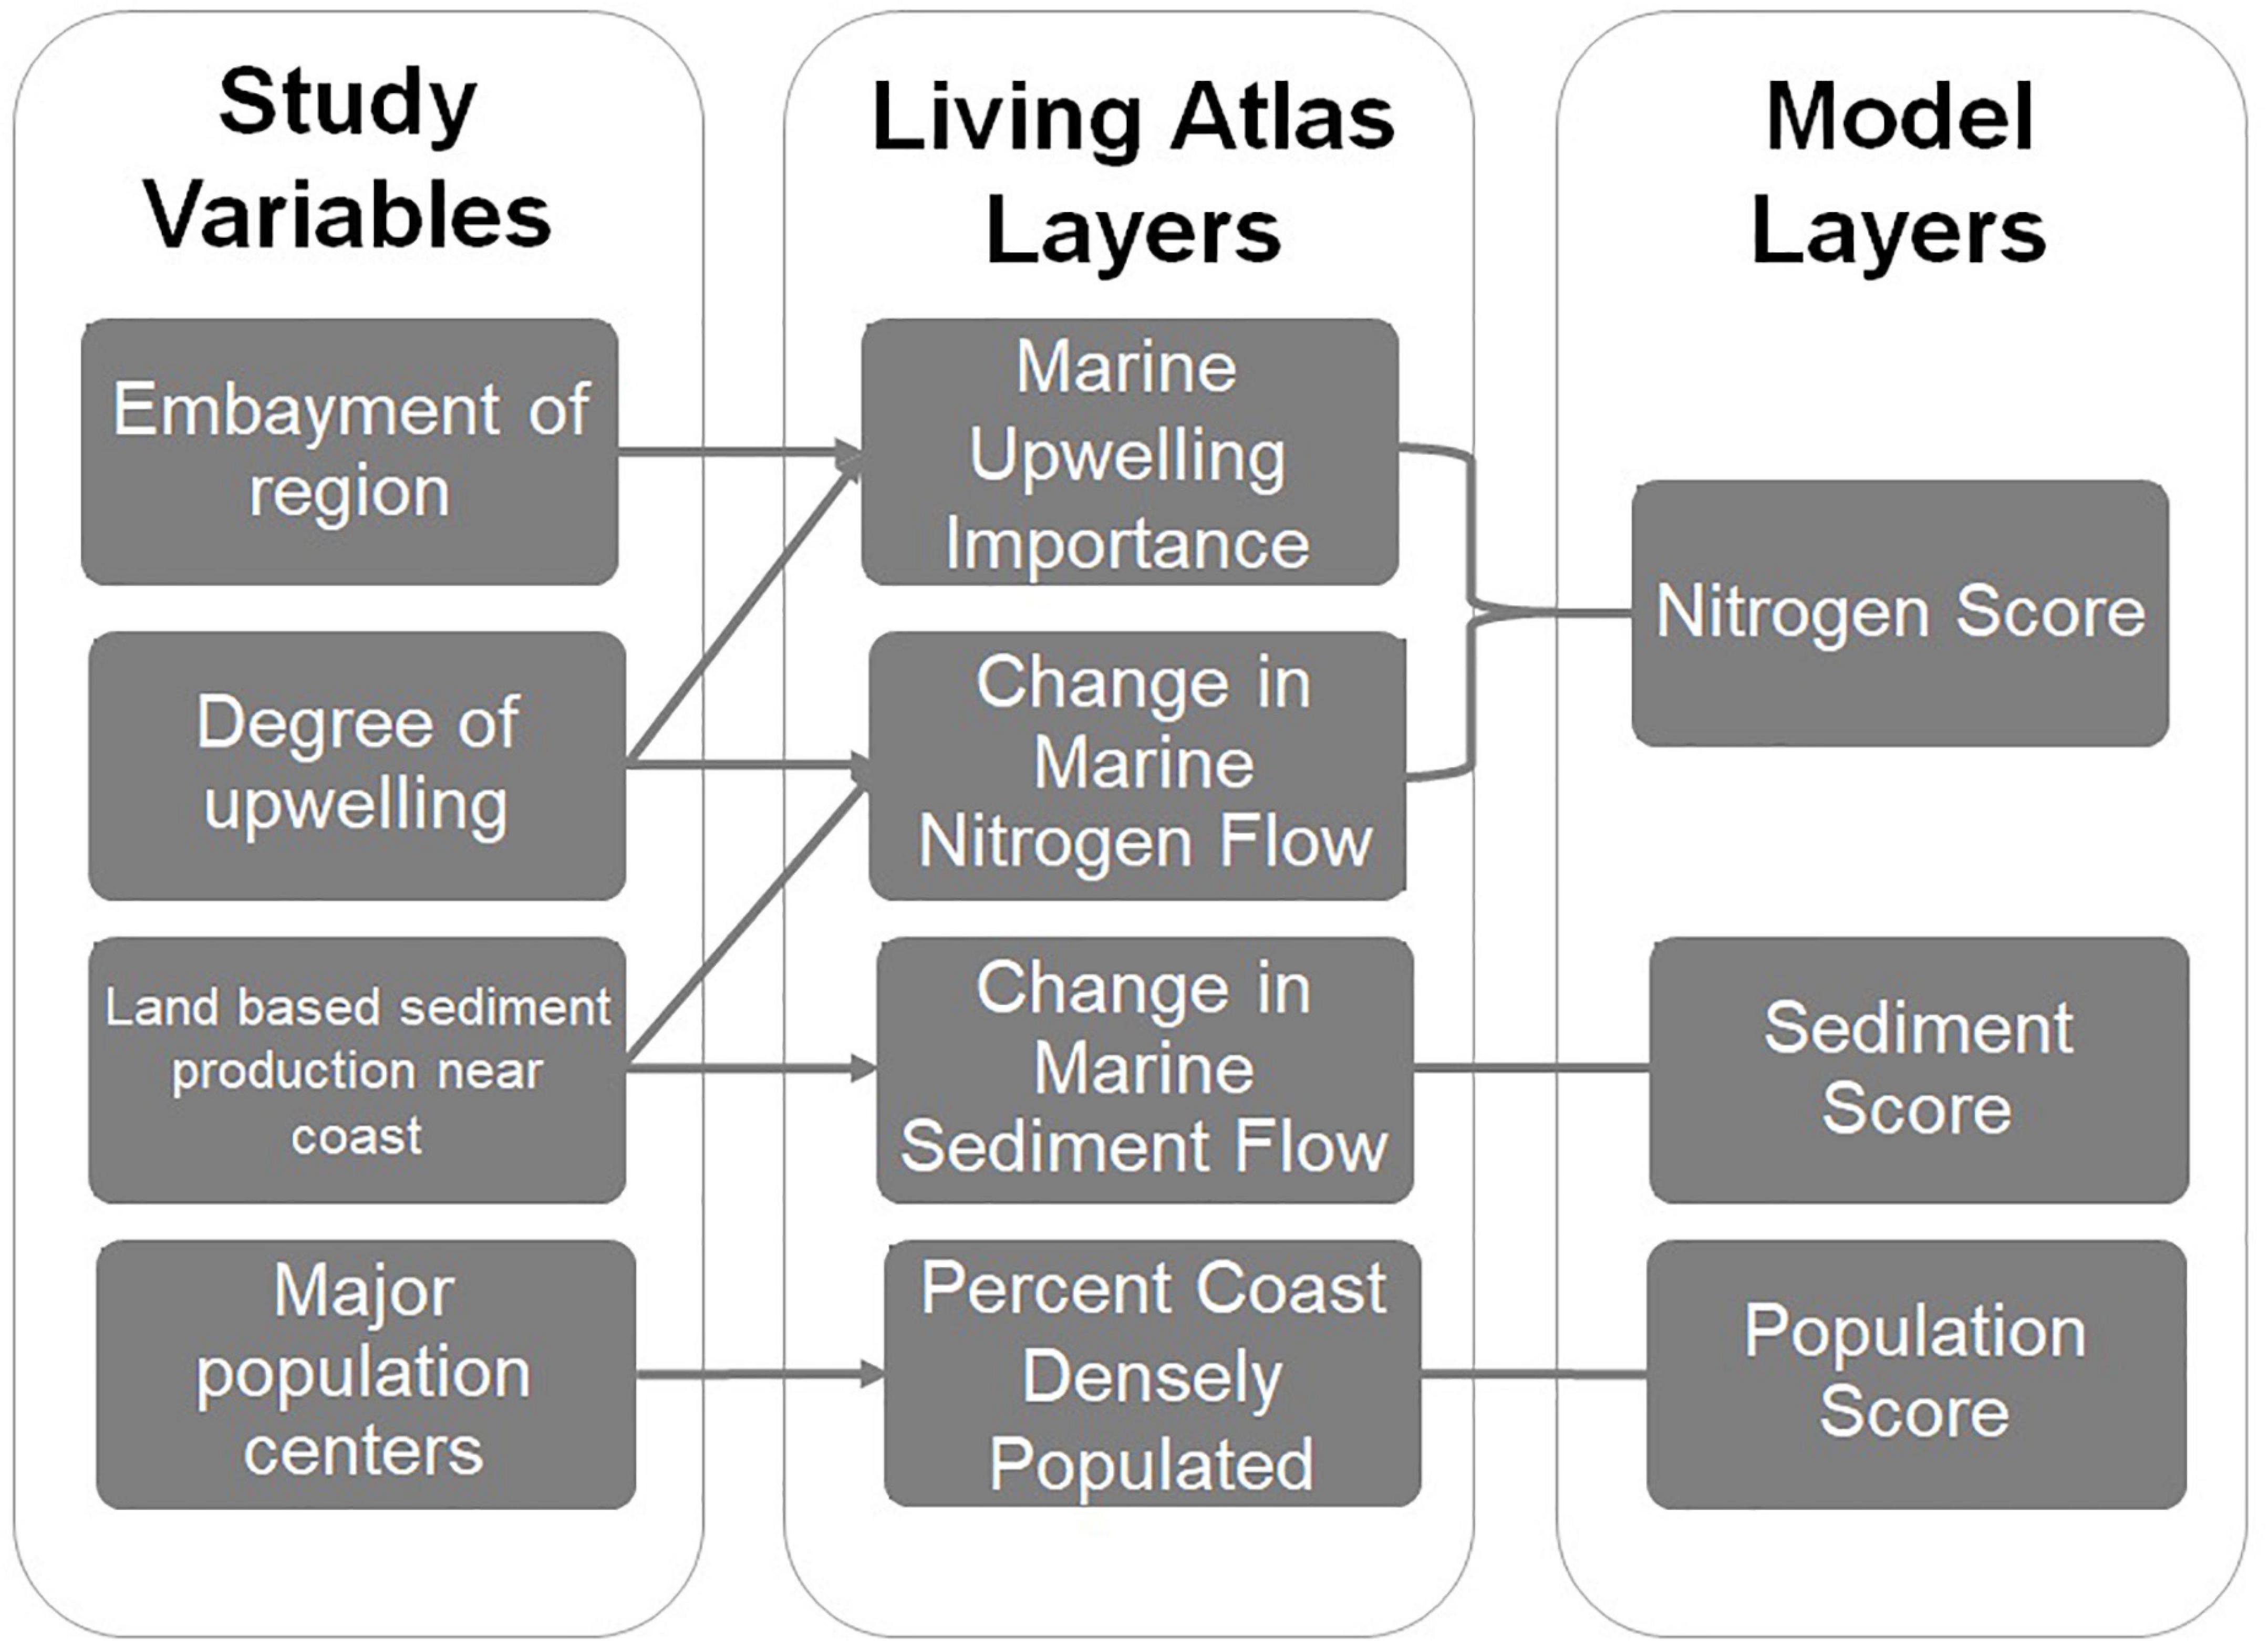
Figure 1. Process of matching spatial data to a pre-existing ecosystem based management framework created by Fredston-Hermann et al. (2016). The framework was then matched to ecological GIS information provided by the Atlas of Global Conservation, with arrows indicating what variables are satisfied by Living Atlas Layers. In ArcGIS Pro data was combined to create a distinct nitrogen, sediment, and population score for each individual world ecoregion.
Acquisition of Data
With all criteria already defined, acquiring data relied on the following factors:
1. All layers maintaining a global extent and similar resolution.
2. Individual layers matching the subject of the desired factor.
3. Individual layers having enough classification values within data so that a weighted sum of all three factors would be able to generate a meaningful result.
The coastal zones of analysis were classified by “world ecoregions.” Ecoregions were created by the World Wildlife Foundation and characterize areas with similar large-scale patterns and species (Spalding et al., 2007). All data was acquired through the ArcGIS Living Atlas of the World (ESRI, Inc.), an online data library provided through ESRI (ArcGIS Living Atlas of the World, n.d.). The source of each layer was The Atlas of Global Conservation (Hoekstra and Molnar, 2010). This assured a uniform coastal evaluation. By using world ecoregions, we assume that the values present in a region (packaged in a GIS format as a “polygon”) for a world ecoregion is uniform.
The nitrogen score incorporates two crucial determinants of how damaging nitrogen enriched runoff is to coastal marine ecosystems (Figure 1): Is the coastal nutrient rich due to upwelling? And is this an enclosed or shallow region? The decision of whether nitrogen loading should be viewed as a major detriment or a naturally routine and therefore not a major cause for concern to a region was based on the following logic: If a region did not receive upwelling or relatively little, the region had less likely of a chance to be experiencing fluctuations in natural marine nitrogen, and therefore is highly impacted when experiencing human caused nitrogen inputs. If a region had consistent upwelling trends, then the region was likely to have experienced fluctuations in marine nitrogen and would be less sensitive to changes in human induced inputs of marine nitrogen (Fredston-Hermann et al., 2016).
The sediment score quantifies whether the watershed has any nutrient or sediment producing processes (Figure 1). Human activities have caused both massive increases and decreases in sediment flux. Ocean regions can rely on natural fluxes of sediment to deliver nutrients. Other regions, such as coral reefs and seagrasses, can be smothered from an increase in sediment flux (Ralph et al., 2007; Fabricius et al., 2003; Fabricius, 2011). A disturbance from the natural mean sediment flux, whether an increase or decrease, can cause harm to coastal ocean environments. Our calculation considers both large increases and decreases in sediment flow to be harmful, however, very few regions experienced a decrease in sediment flow. Although it is valuable to understand where nitrogen and sediment alone have changed globally, patterns of nitrogen and sediment disturbance do not capture the complex impacts of land based human activities on marine ecosystems (Halpern et al., 2009).
The population score captures the presence of major population centers (Figure 1). This field has been used in prior studies to address the general degradation of the coastline (Murphy et al., 2019). In our application, population aims to project impacts not necessarily captured in the nitrogen or sediment fields, such as shoreline alteration or anchoring. Areas with large amounts of boating traffic can experience discharge of sewage from vessels. This injection of nitrogen is difficult to measure and track. In addition, when marine vegetation is removed to make way for development such as piers and ports, the sediment that was previously held in place by the vegetation is now untethered and will flow freely. Both examples show how human alteration within the ocean is difficult to track and quantify. To make an accurate model, we cannot ignore the direct physical alterations we make underwater. This density of population was captured for area within 5 km of the coastline.
Classification of Substrate
Each ecoregion of the seafloor was analyzed according to the sensitivities of mangroves, seagrasses, and stony corals. Using data from the Nature Conservancy (Hoekstra and Molnar, 2010), the three ecological habitats studied were Seagrass, Mangrove, and Stony Coral. Not only do these three species have widespread geographic coverage which allow for a nearly global analysis (excluding high latitudes), but also the numerous studies on the health of these keystone species provided resources for checking the accuracy of the analysis (Short and Wyllie-Echeverria, 1996; Burkholder et al., 2007; Spalding et al., 2010; Fabricius, 2011; Alongi, 2015). The prevalence of individual habitats was measured by comparison of number of species of seagrasses, stony corals, and mangroves across ecoregions in which data was available. The range of species present was divided into five classification categories, all of which were natural breaks in data as determined by the Nature Conservancy. Each ecoregion had a score on a scale of 1–5 for species diversity for the three ecological habitats based off of the Jenks Natural Breaks classification scheme (Jenks, 1967). Three global analyses resulted, one for each of the ecological habitats studied. In the case that there were no species present for Seagrass, Mangrove, or Stony Coral, the region was excluded from the ecosystem analysis. This applied only in extreme arctic regions.
Weighting
To give more context to the results of the risk analysis, a specification had to be made by which impact severity would reflect the biogenic habitat they were applied to. To determine relative impact weight of factors on biogenic habitat scenarios, we conducted a literature review. The review focused on global analysis of seagrass, mangrove, and stony coral biogenic habitats within the past 20 years. From the literature we used specifically cited weights as well as descriptions of severity of impact of specific factors to determine weights. It should be noted that these weights are subjective due to the fact that sources sometimes lacked our specific factors or carried additional risk factors we incorporated into the three general scores, “Nitrogen”, “Population”, and “Sediment”. The weights represent the amount of sensitivity, with a high weight implying the habitat type is very sensitive to that perturbation.
Comparing the literature of all three habitat types, seagrass had the highest reaction to nitrogen and sediment, primarily nitrogen loading (Short and Wyllie-Echeverria, 1996). Human caused harm to seagrasses can include a reduction of light penetration due to sedimentation and algal overgrowth, causing a decrease in photosynthesis (Ralph et al., 2007). Nitrogen inputs in seagrass regions trigger algal overgrowth (Burkholder et al., 2007), which can trigger cascading effects more detrimental and permanent than suspended sediment alone in the water column. It should be noted that suspended sediment without concurrent nutrient loading is still detrimental to these species, by creating a reduction in water clarity and therefore light limitation (Short and Wyllie-Echeverria, 1996). For this reason, the weight of nitrogen was higher than sediment. Detriments to seagrasses through population expansion not already accounted for in nitrogen and sediment are small, and the population score was made to be far smaller than both sediment and nitrogen (see Table 1).
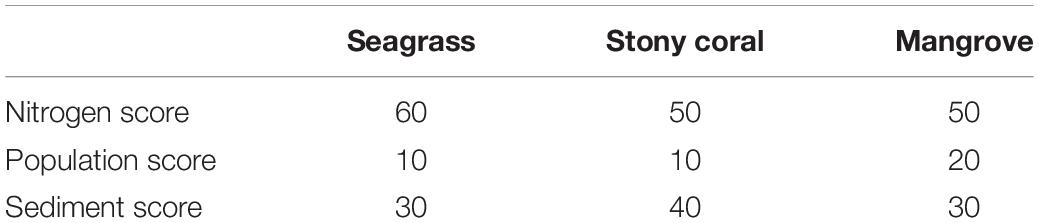
Table 1. Risk weighting schema for Seagrass, Stony Coral, and Mangrove ecological scenarios used in the MCDM GIS analysis. These weights were determined through an extensive literature review (Fabricius, 2005; Burkholder et al., 2007; Doney et al., 2012; Alongi, 2015).
Mangroves are predicted to decrease in population as salinity increases, sediment yield declines, and sea level increases. With the large impacts from salinity and sea level rise, the population weight of mangroves is higher than stony coral regions and seagrass regions. Disturbances in sediment have vast implications on mangrove regions (Peters et al., 1997). Regions downstream from damming have lost significant amounts of habitat (Alongi, 2002). For this reason, mangrove regions were given a sediment weight of 30%.
Because sediment and nitrogen disturbances in tropical oceans are typically confounded (Fabricius, 2011; Risk, 2014) it is difficult to determine what risk factor has the largest impact on coral species. In our assessment of corals, nitrogen and sediment were close in weight (50 and 40%) while population impacts were considered to have a small impact.
During the calculations, areas with missing scores for any of the factors were given a score of 0 and ultimately excluded from the analysis. Because of this, many island regions are not included in the final findings, due to a lack of nitrogen data. Ecoregions in Southeast Asia and Western Australia lacked nitrogen data as well. Many of the zones excluded from the final findings were documented with sensitive habitats (Carruthers et al., 2002). With nitrogen data these regions are likely to rank as high-risk zones. Due to these gaps in nitrogen data, the amount of risk these regions face is unknown.
Risk Priority Analysis
To prioritize intervention for high risk biogenic habitats, the raw risk score was weighted with the number of species present and divided by the total area of the biogenic habitat. The resulting ranking represents the areas with the highest species richness and risk.
Results
We adapted a spatially explicit ecosystem-based management framework of runoff impacts and applied it to global coastal oceans in a GIS framework. To represent the main elements of human impacts to the coastal oceans we used data on nitrogen loading, sediment flux, and coastline population density. This model was applied the biogenic habitats of seagrass, mangrove, and stony coral. Once an impact score was generated, we generated a priority ranking for risk of species diversity loss due to runoff impacts.
Habitat Specific Analysis
In our biogenic habitat analysis, we used a population density layer as a proxy for impacts such as recreation, pollution from shipping traffic, and direct non-point sewage runoff, that would not be captured in the sediment or nitrogen data alone. To analyze the impacts on each biogenic habitat, the area of low (score of 1), medium low (score of 2), medium high (score of 3), high (score of 4), and severe (score of 5) scores were summed and averaged against the complete area of coast containing that ecology (Figure 2).
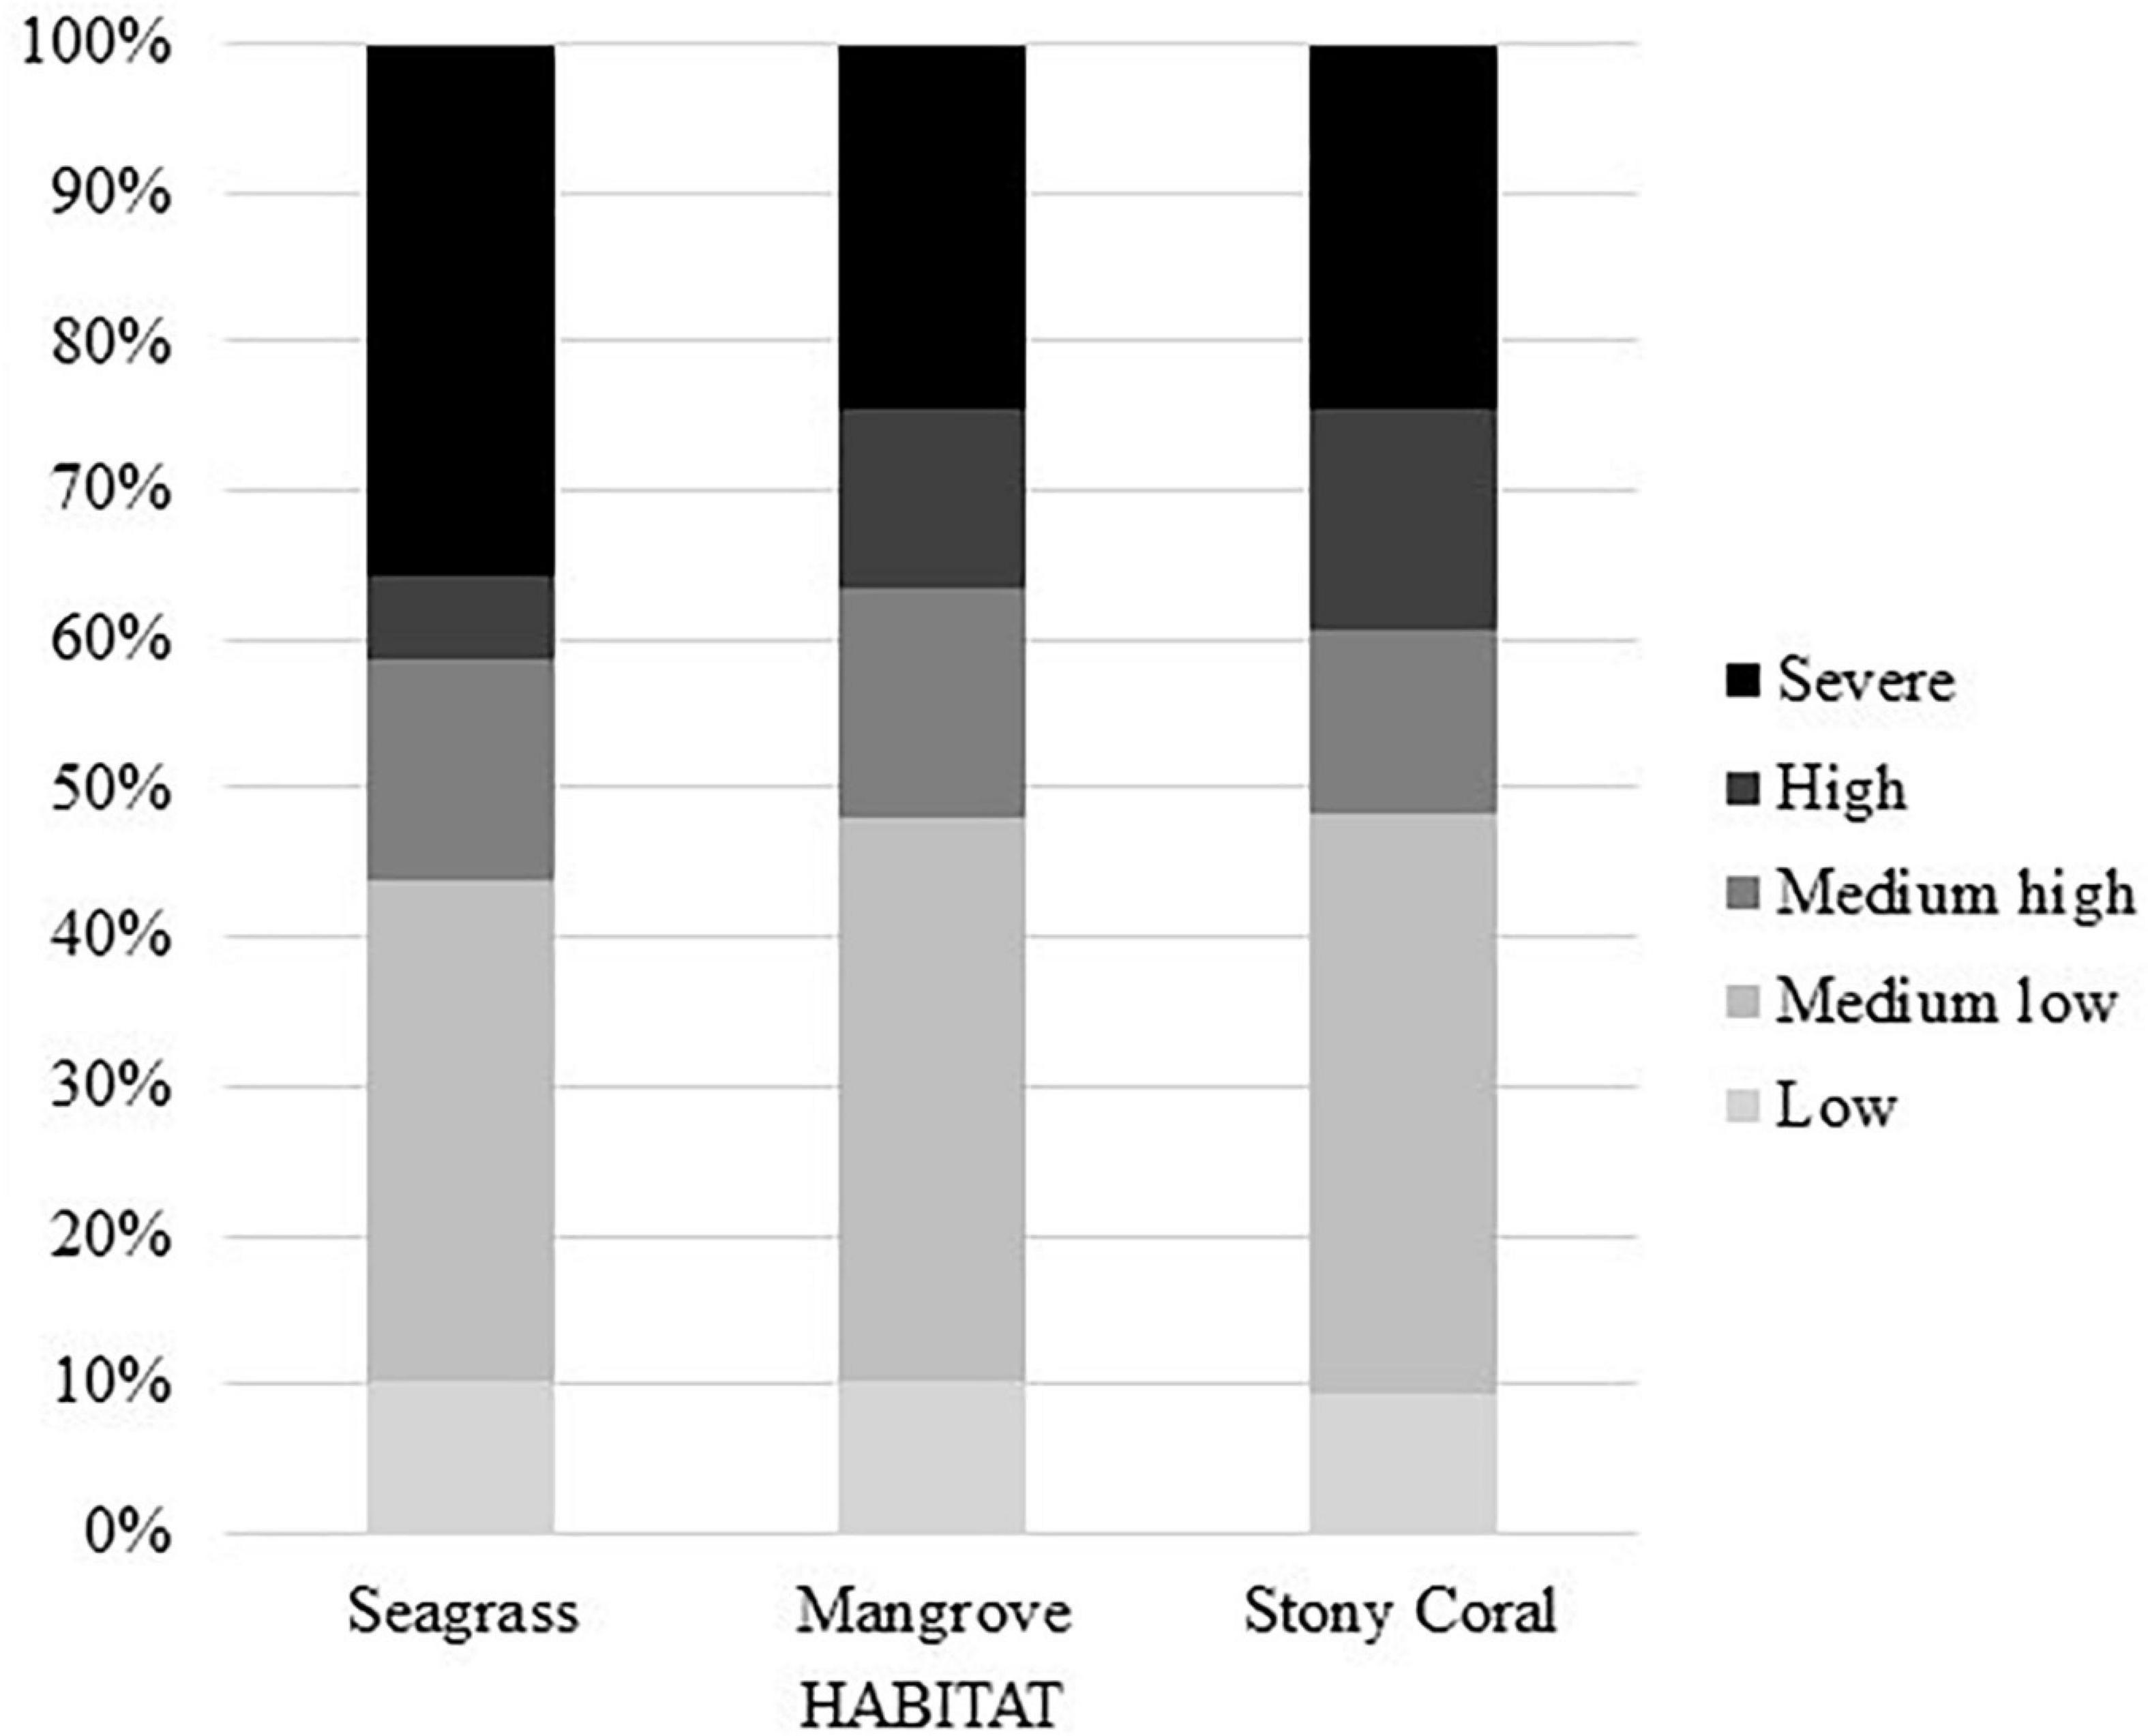
Figure 2. Biogenic habitat percent area risk scores. Seagrass has the largest percentage of severe risk area, while all three have relatively similar percentages of low-risk area.
An additional prioritization ranking is presented, which combines the risk score with the species density (Table 2). The remaining results are specific to seagrass, mangrove, and story coral analysis, respectively.
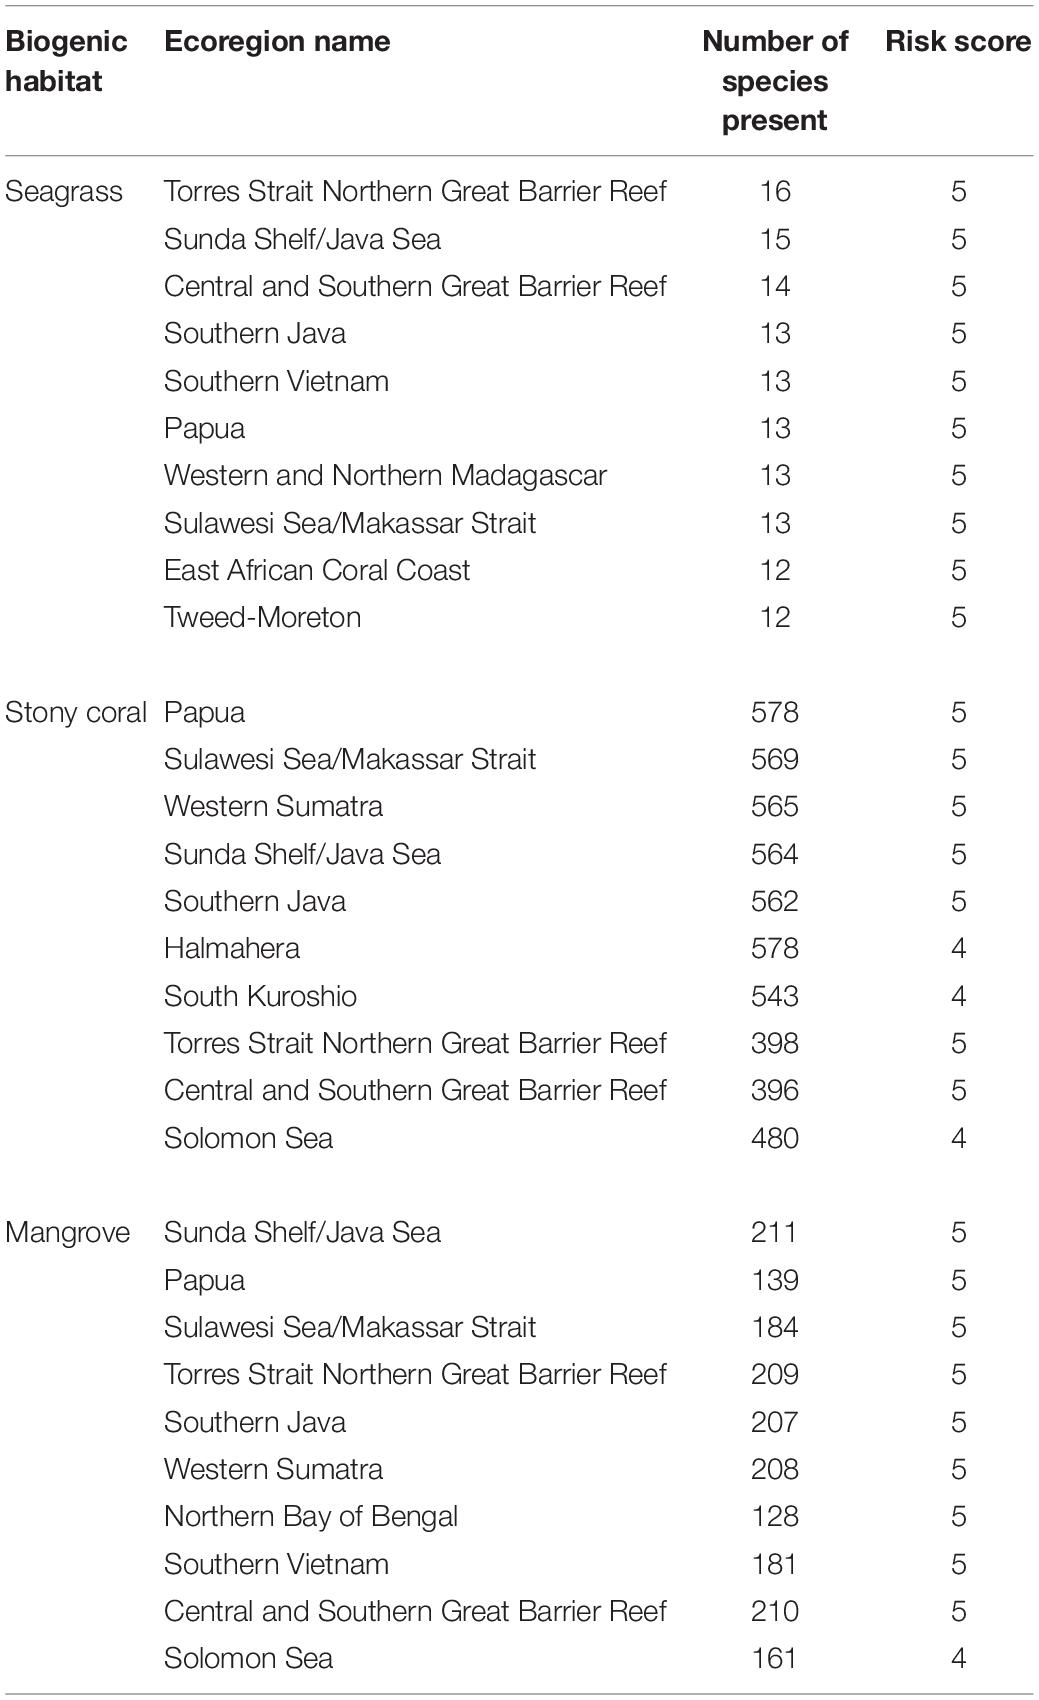
Table 2. These areas represent the top ten ecoregions for each habitat with the highest risk to their species as well as the highest species richness. Ecoregions are ranked by score, descending from the top.
Seagrass
Seagrass dominated regions had the greatest proportion area of low risk (score of 1 in our model) regions compared to other biogenic habitats at 10% total area as well as severe risk (score of 5 in our model) regions at 36% total area (Figure 2). The distribution of these low-risk regions have a large variation globally (Figure 3). In our study, a high proportion of the regions scored as severe risk lacked significant upwelling. Top ecoregion areas of concern for loss of ecological diversity are the Torres Strait Northern Great Barrier Reef, Sunda Shelf/Java Sea, and Central and Southern Great Barrier Reef (Table 2).
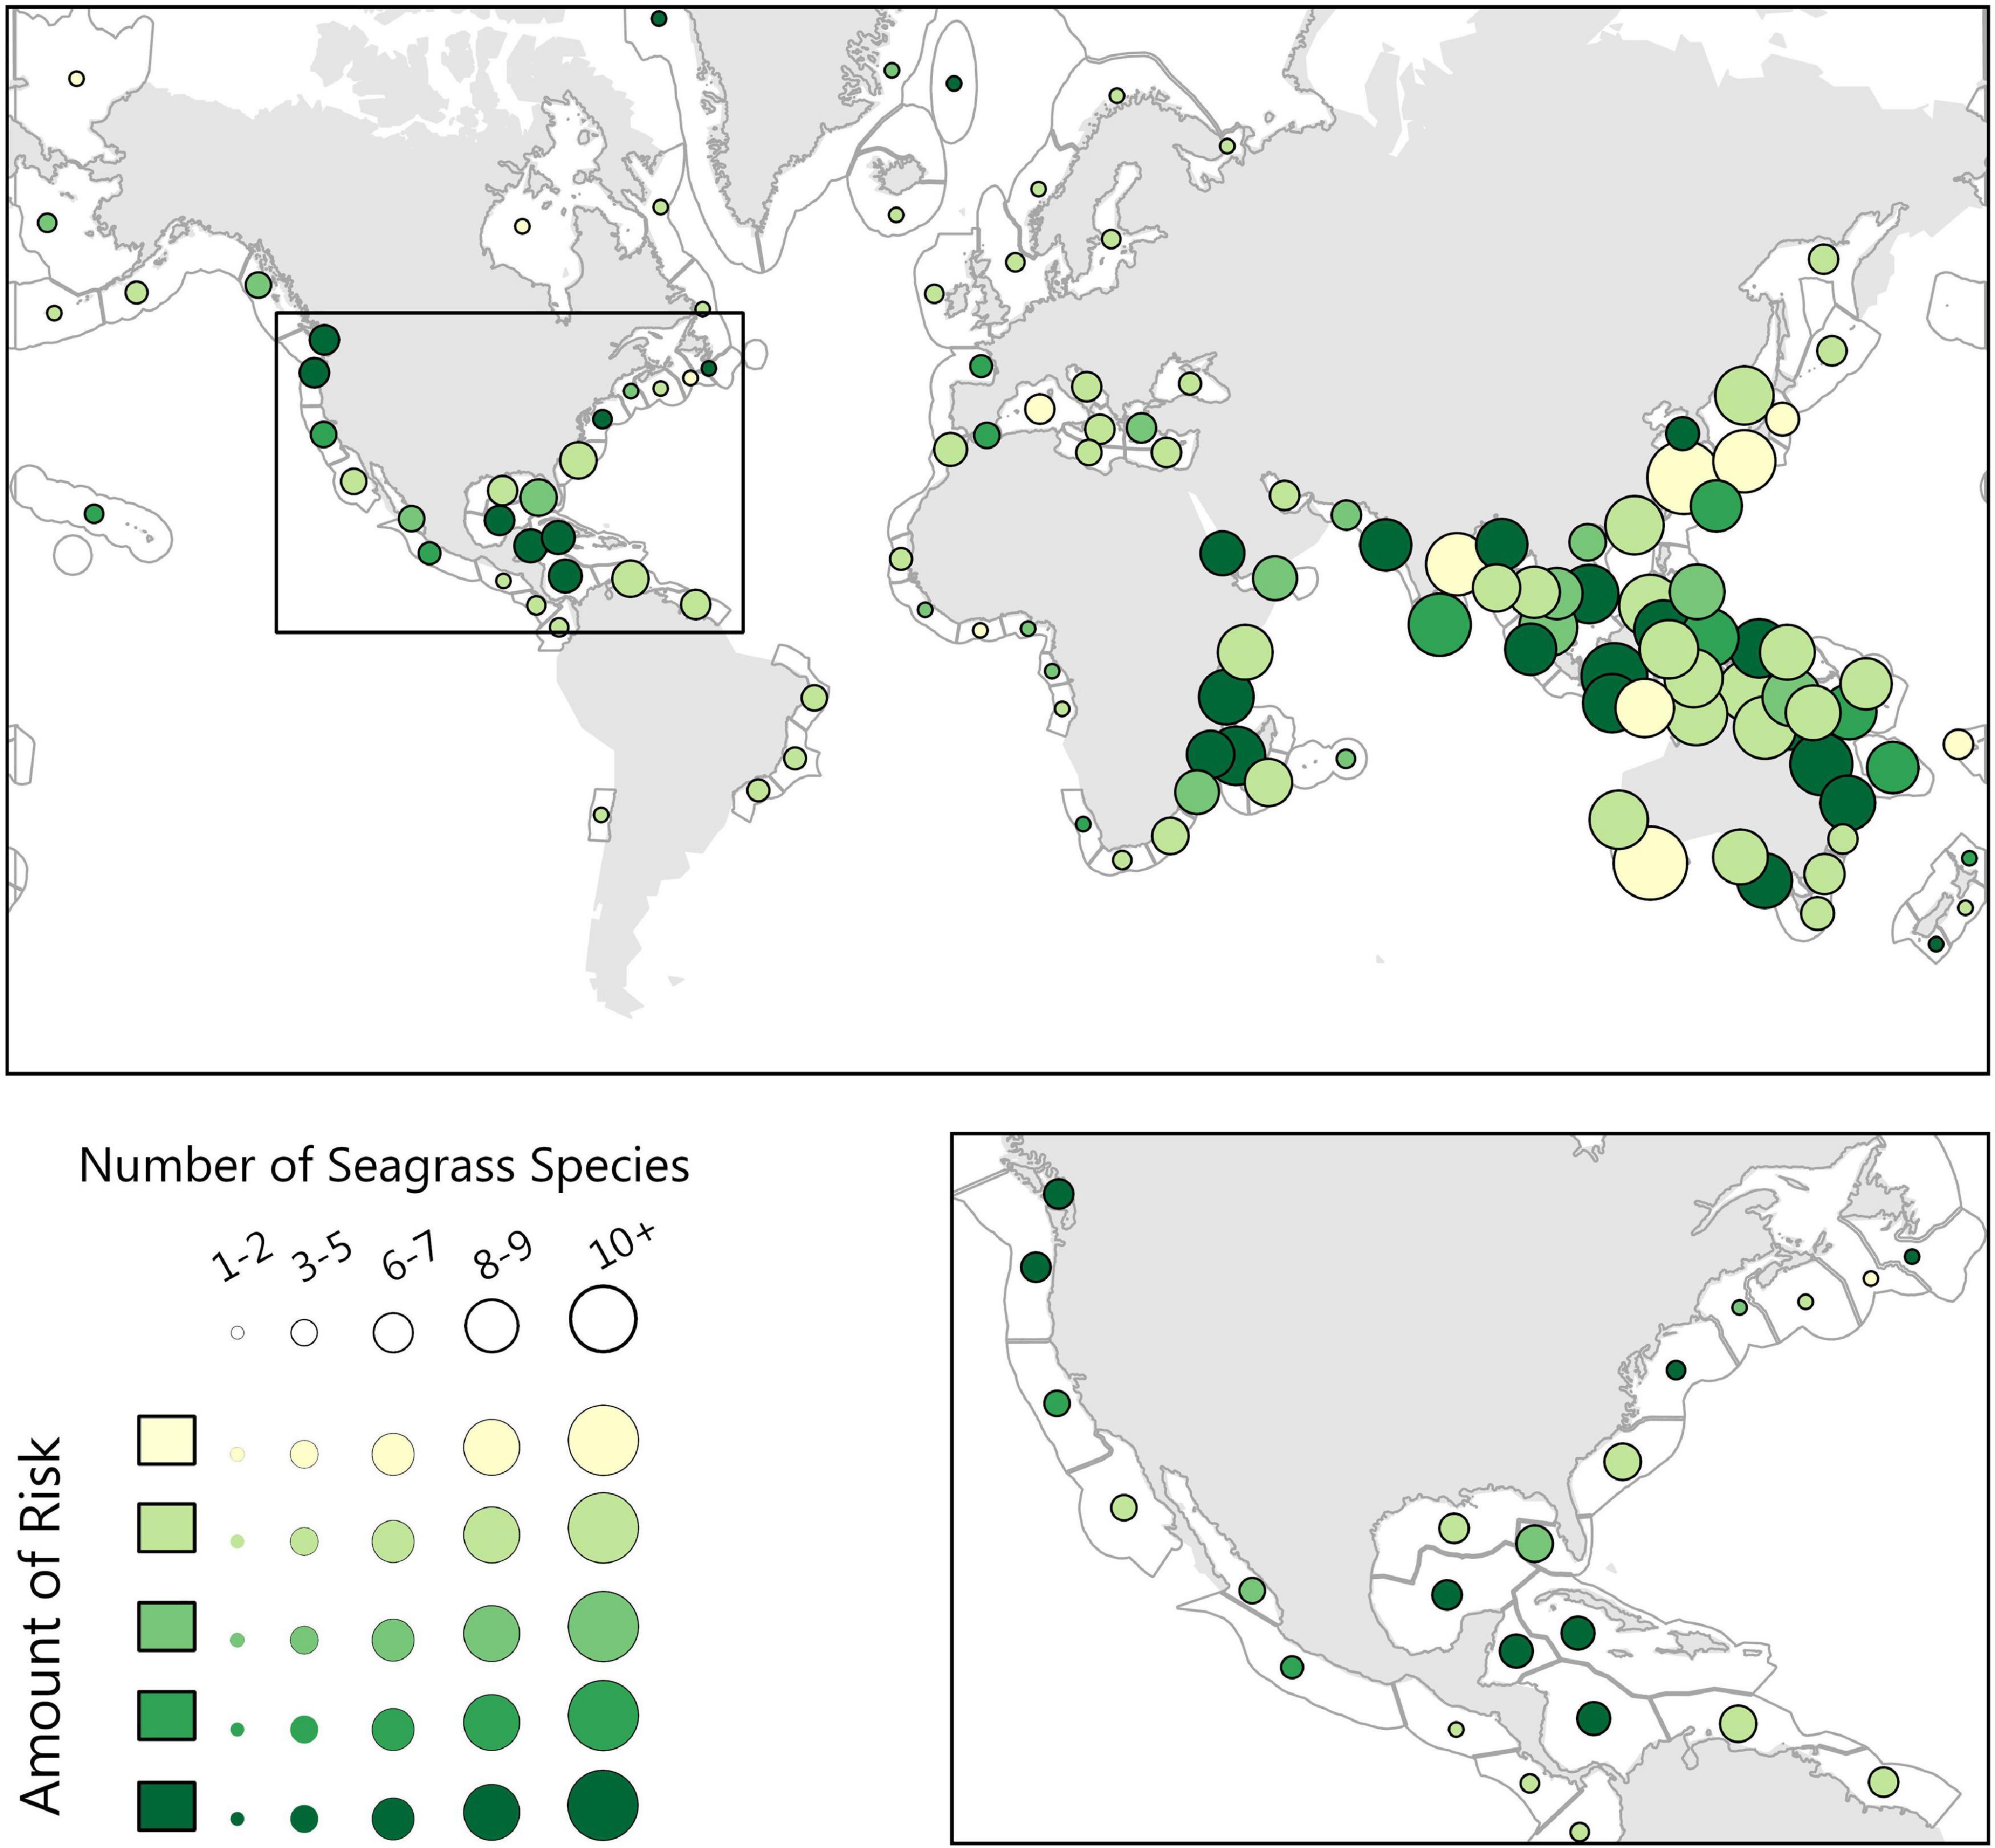
Figure 3. The Seagrass biogenic habitat risk analysis, where risk is symbolized as the color of the circle, dark being highest risk, and the size of the circle symbolizing the number of seagrass species present. Here we highlight North America, where the Gulf of Mexico and the Caribbean stand out as medium to high-risk areas.
Mangrove
Ninety-nine percent of Mangrove-containing regions received a risk score of medium low (2) or higher (Figure 4). Moreover, our finding that 22% of mangrove habitat areas are at severe risk is likely an underestimate, because we did not incorporate freshwater regions where most mangrove destruction has occurred. Priority ecoregions of concern are Papua, Sulawesi Sea/Makassar Strait, and Western Sumatra (Table 2).
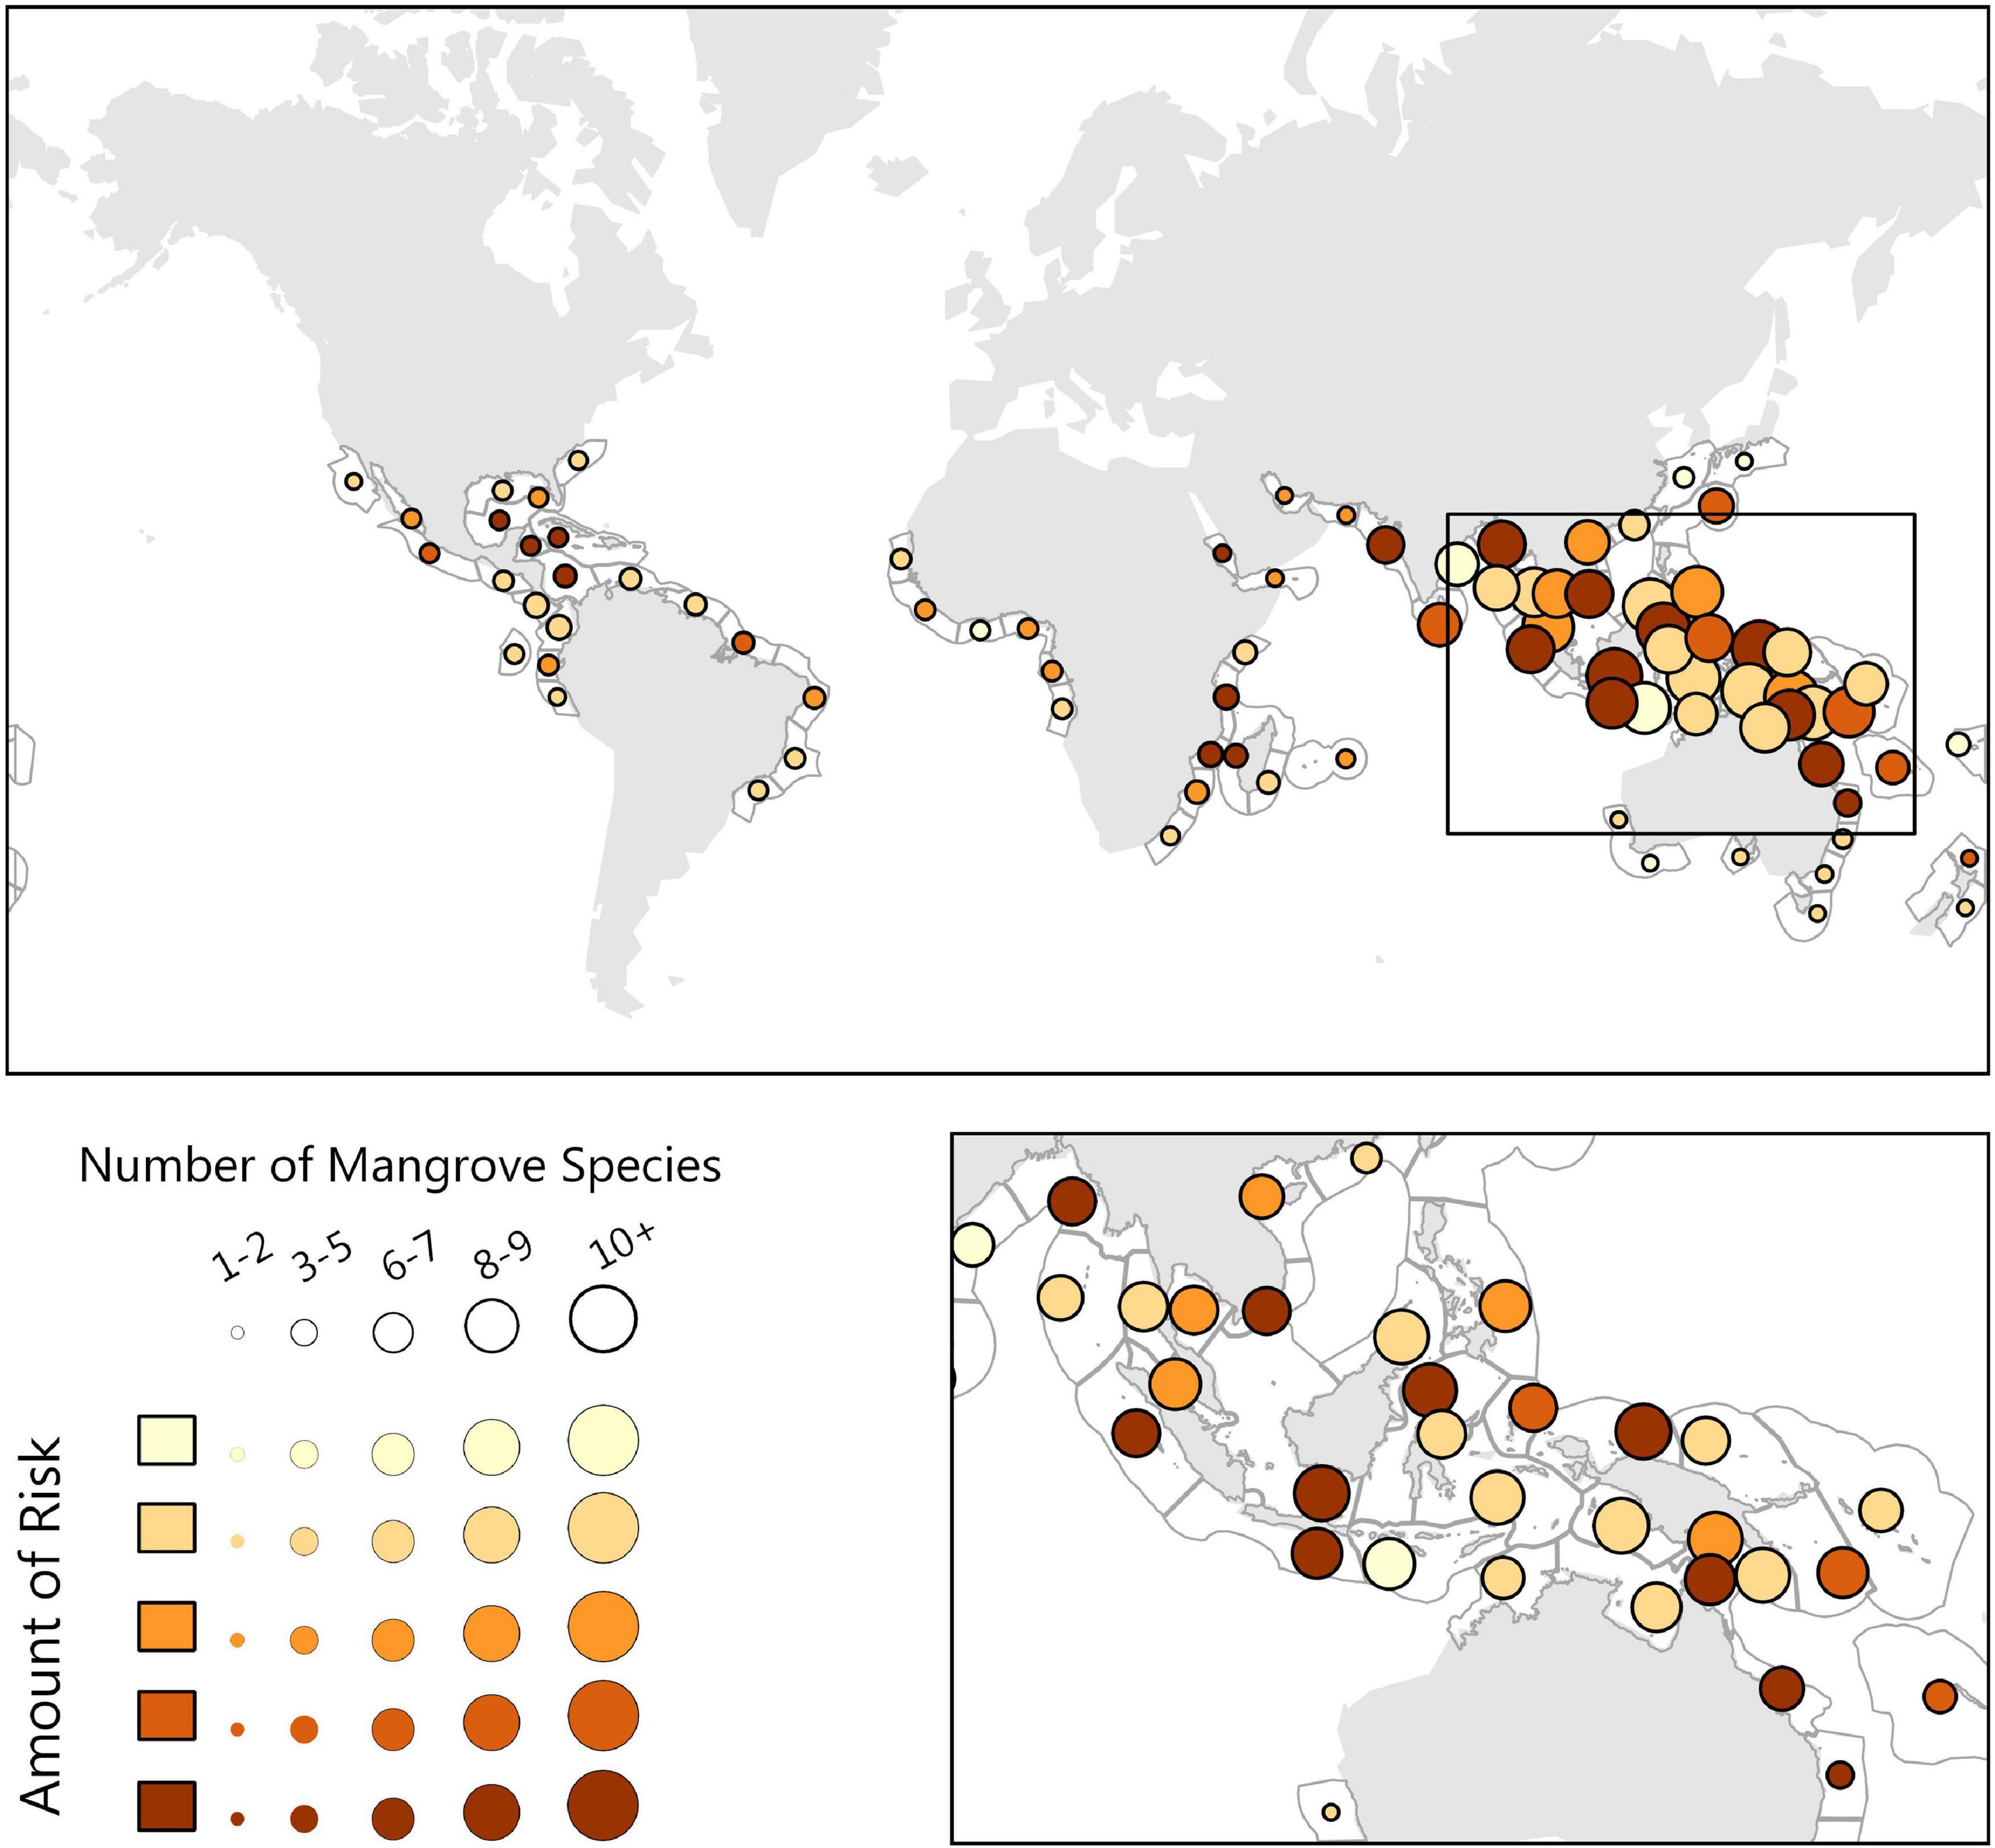
Figure 4. The Mangrove biogenic habitat risk analysis, where risk is symbolized as the color of the circle, dark being highest risk, and the size of the circle symbolizing the number of mangrove species present Here we highlight the Southeast Asian Ocean, which contains a high density of mangrove species and risk scores that vary from low to high.
Stony Coral
Our model of stony coral habitats estimates roughly 52% of total coral reef area is at medium to severe risk from land-based impacts (Figure 5), and 64% of the Central Indo-Pacific realm area at medium to severe risk. Provinces with high-risk scores and species richness include Madagascar, Southern and Western India, and multiple regions in Southeast Asia. More specifically, the three highest risk ecoregions are the Sunda Shelf/Java Sea, Papua, and Sulawesi Sea/Makassar Strait (Table 2).
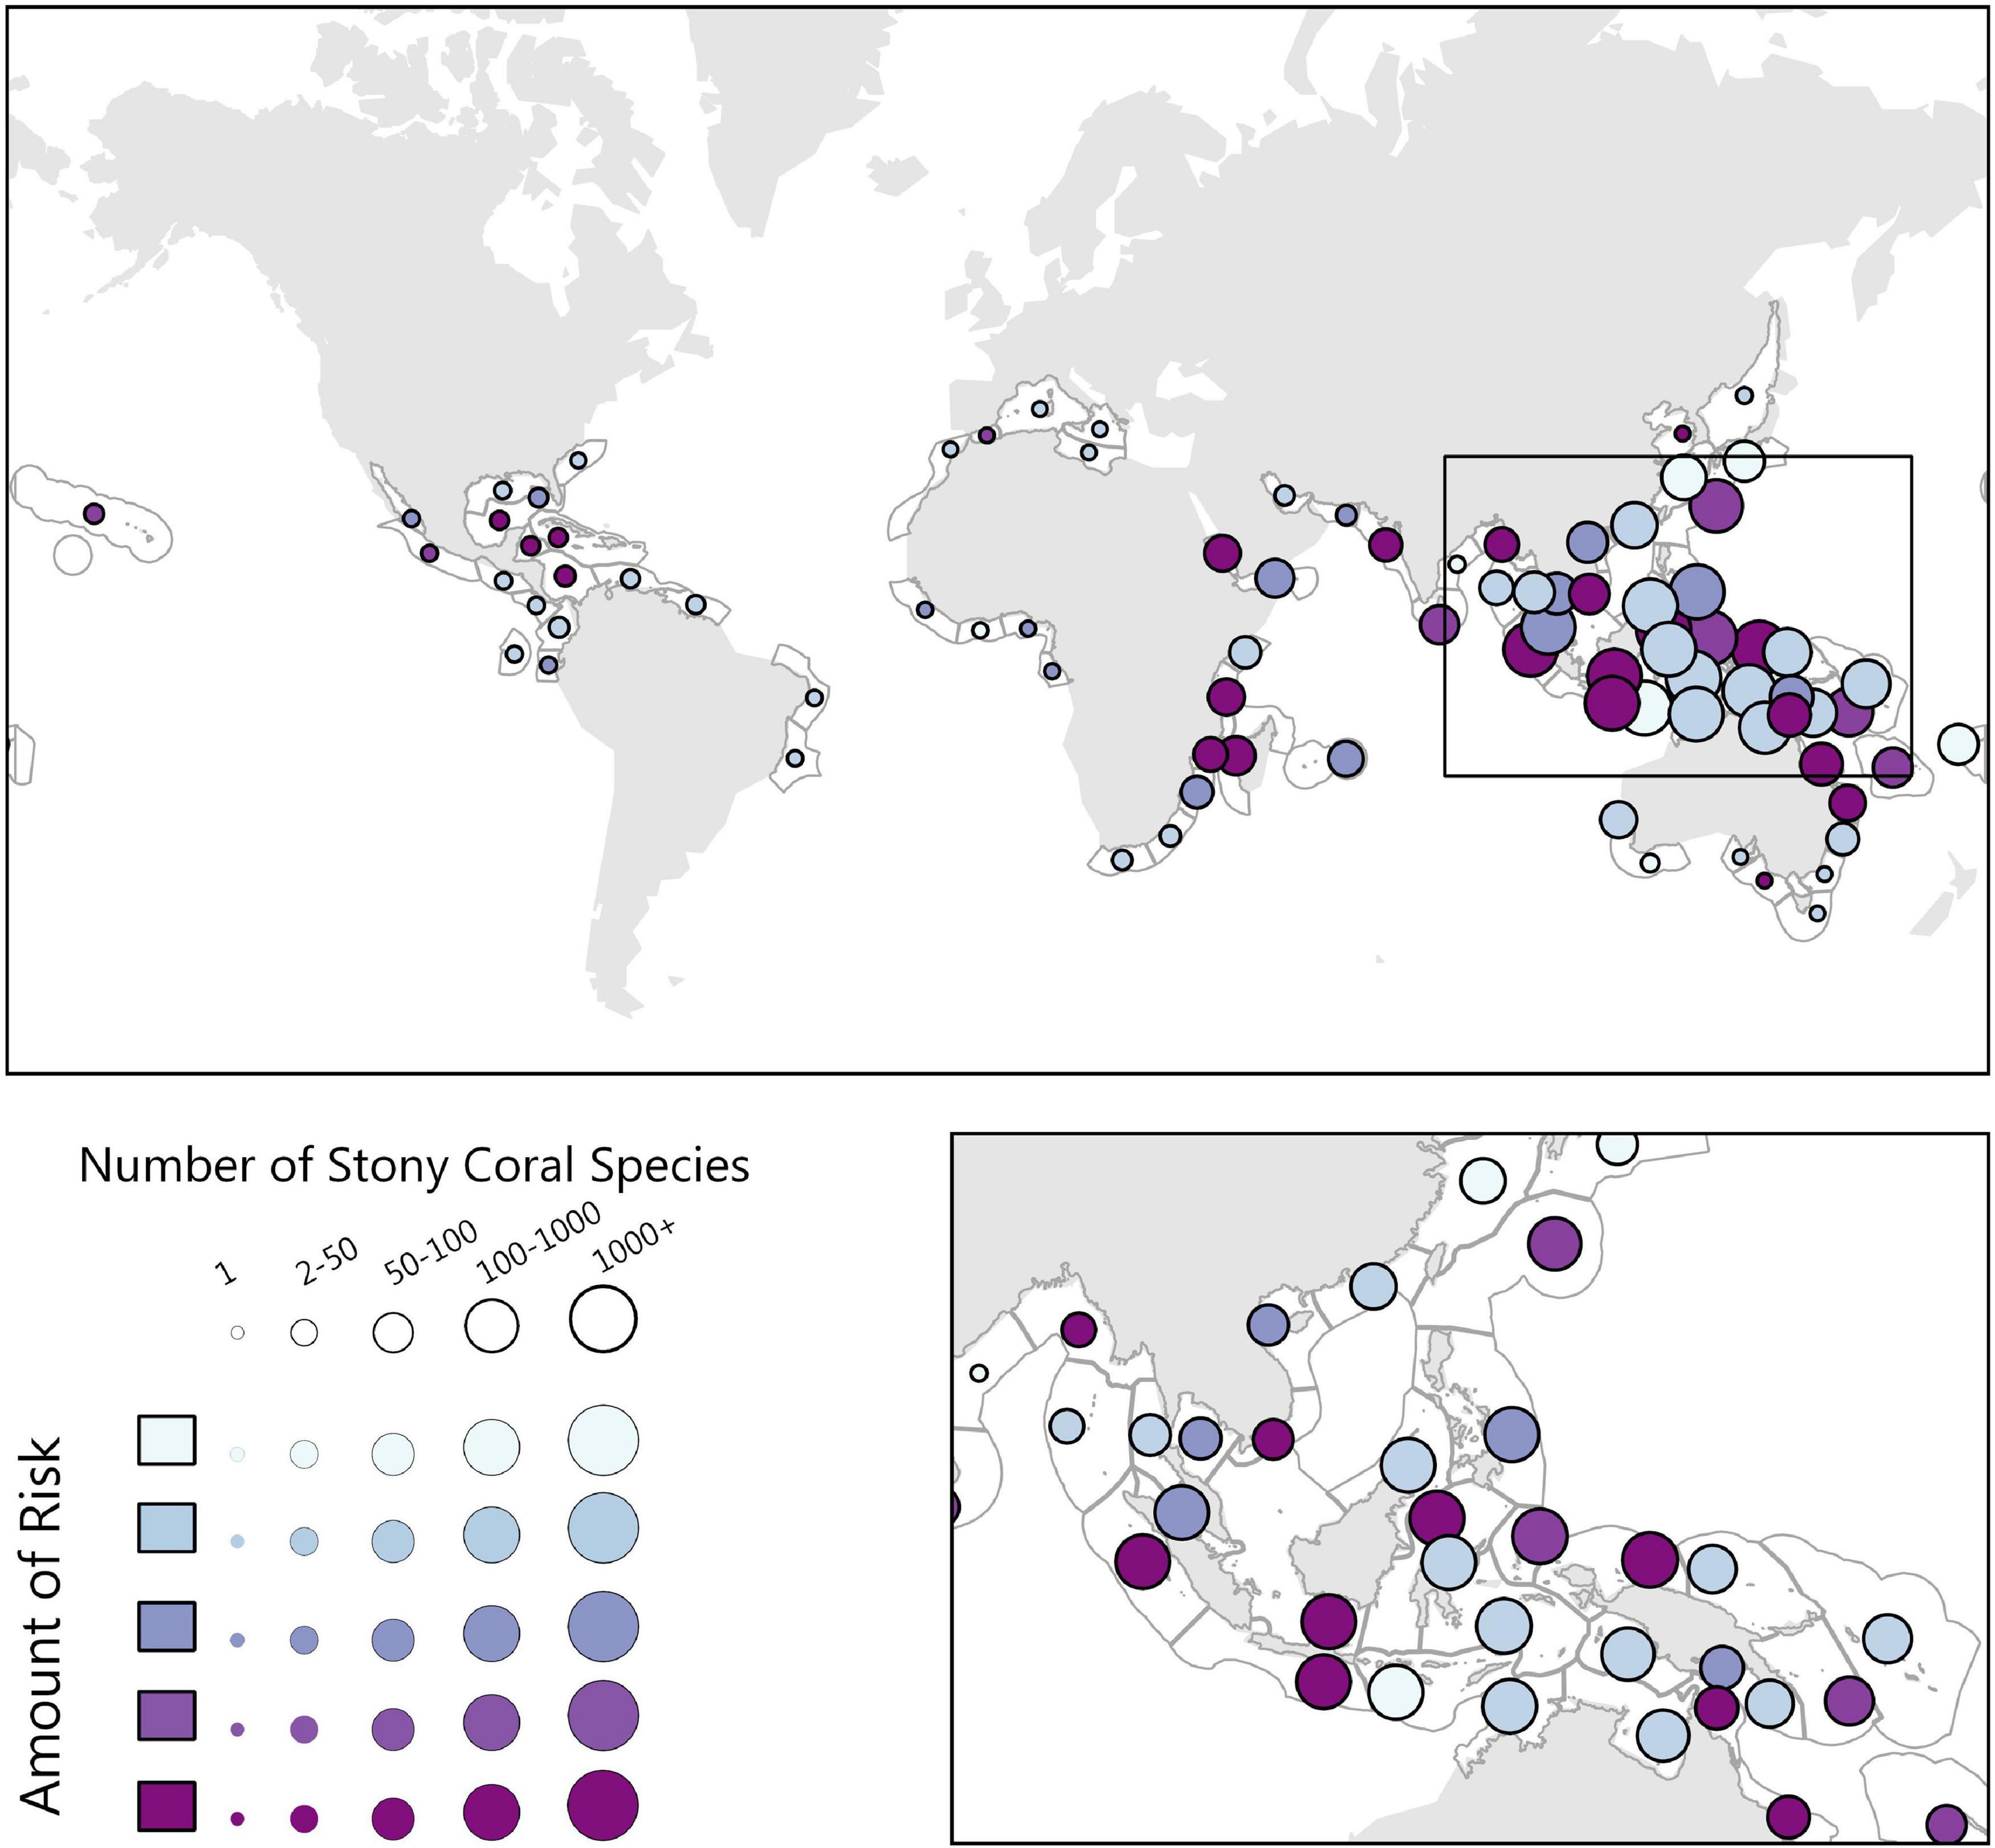
Figure 5. The Stony Coral biogenic habitat risk analysis, where risk is symbolized as the color of the circle, dark being highest risk, and the size of the circle symbolizing the number of stony coral species present. Here we highlight the Southeast Asian Ocean, which, similar to the mangrove biogenic habitat, contains a high density of species and risk scores that vary from low to high.
Discussion
Our results (1) demonstrate the utility of adapting a pre-existing ecosystem-based management framework to systematically evaluate impacts to biogenic habitats of concern and (2) how to use risk scores combined with species richness data to inform habitat conservation prioritization. To demonstrate our methodology, we tested the framework on a global extent and with multiple species. These tests were validated with findings from recent literature. Our discussion first addresses the results of our example analysis compared to literature. We then discuss the general utility of using this GIS based analysis for informing systematic risk analysis and habitat-specific conservation prioritization. Our risk analysis was specified to loss of species richness within a biogenic habitat to avoid ambiguity in the interpretation of the results.
High biogenic habitat risk scores were identified in every continent studied including tropical and temperate regions, which is consistent with observations of species richness loss (Worm and Lotze, 2016). Across all three biogenic habitats, the regions of Southeast Asian islands are highest risk. Most of the enclosed or embayed regions such as Hudson Bay, the Mediterranean Sea, and the southern Gulf of Mexico were scored as high risk. This finding is consistent with the consensus that embayed regions experience less flushing and exchange of ocean water, and as a result can accumulate high concentrations of nutrients and sediment (Drupp et al., 2011).
The most common scores across all scenarios were medium low and severe (Figure 2). Many of the severe regions were shared across the seagrass, mangrove, and stony coral analyses, such as western India, the Red Sea, and Eastern Africa. These three regional results were in agreement with threat hotspots identified by Halpern et al., 2009, which additionally takes into account the size of the threat area. In all three scenarios (seagrass, mangrove, and stony coral) 33–39% of the total area evaluated experienced a risk score of 2 (medium low). This result is promising, demonstrating that although humans are having an impact, their impact is relatively minimal, the coast is relatively resilient and can rebound from large human perturbations, or a combination of both. Seagrass regions have the highest variation in risk scores. Only 6% of seagrass area has a high-risk score (4) whereas 40% area has a severe risk score (5). Our finding that 52% of stony coral coastal regions are medium to severe rick are consistent with Bryant et al. (1998), who found that 58% of the world’s reefs are threatened by human activity and 80% of reefs in Southeast Asia are at medium and high potential threat risk. Mangrove regions have the lowest variation in risk score distribution (Figure 2), as well as the lowest variation in weights for the model itself (Table 1). In the mangrove biogenic habitat analysis, high risk regions of Amazonia, southeast Asia, and western India may provide evidence for stress on mangrove habitats in equatorial regions, which is consistent with other mangrove modeling studies (Cavanaugh et al., 2015). These risks, combined with current observations that mangroves are moving pole ward due to decreasing cold events (Cavanaugh et al., 2014), provide evidence that mangroves will become less successful at surviving in tropical regions due to climate change (Osland et al., 2017).
Our model incorporated the impact of upwelling and boundary currents in its treatment of nitrogen, giving a less severe impact of nitrogen loading in regions where these physical phenomena already provide variability in ambient nitrogen concentrations. For example, some semi-permanent oxygen minimum zones occur on eastern boundaries such as the coastlines of North America, the eastern North Atlantic Ocean, and the eastern tropical Pacific. This is due to typical upwelling system patterns, which bring an influx of nutrient rich waters from the deep ocean, which can cause an increase in productivity and as a result a decrease in oxygen (Rabalais et al., 2010).
In each biogenic habitat scenario, there were medium to high-risk scores in the Caribbean and Southeast Asia. Fertilizers likely contributed to the vast increases of nitrogen inputs in Asia and Europe (Bobrovitskaya et al., 2003). The combination of a lack in significant upwelling and large nitrogen inputs in these regions cause all three models to evaluate Asian and European regions as a high-risk. Although scenarios may differ in risk score in the Caribbean and Southeast Asian oceanic regions, it should be noted that in subtidal tropical ecoregions, disturbances can cause chain reactions (Corredor et al., 1999). Magnitude of impact of these cascading effects of ecological disturbance on species greatly depends on the biodiversity of the regions (Urban et al., 2016).
Spatial inconsistences between our biogenic habitat risk scores and similar studies (Bryant et al., 1998) are in large part due to the lack of temporal data for nitrogen loading in the central tropical pacific. With consistent data, the number of coral regions at risk will likely increase (Fabricius, 2011). Although the sediment layer covers the changes since preindustrial times, the nitrogen layer does not. Many recovering regions such as the Baltic Sea and the Gulf of Mexico have lowered their nitrogen loading, and as a result their current risk score is low. However, those regions may still be in poor health due to past disturbances (Carstensen et al., 2006). Discrepancies in the time in which the data was sampled, potential seasonal and temporal variations in the data, and large-scale ocean currents and turbulence at the time of sampling may all have influenced our nitrogen score, as well as the lack of data in some island regions. We also acknowledge that without polar regions, which are particularly sensitive to climate change (Worm and Lotze, 2016), our analysis, although large in extent, cannot be interpreted as “global”.
To improve the spatial analysis in future work incorporating geographic distance, linear decay, and isolation as a component of the model with finer resolution data would create an additional component of prioritization for proximity to coastline. In addition, a factor for degree of isolation would provide keen insight to island regions that experience more difficulty in recovering from events such as coral bleaching. Finally, an incorporation of direct impacts on coastal marine ecosystems such as direct destruction of habitat is needed, especially in regions with high amounts of tourism and development. Ultimately, these analysis factors would enhance our applications assessing where coastlines should be protected and how we should prioritize our actions of coastal ocean conservation.
Our MCDM approach, a simple prioritization and weighting scheme, lends itself to a straightforward interpretation of results and can be applied by coastal planners to regional analyses. We used data from an open-source initiative both to achieve maximum global coverage in data layers, and to allow our methodology to be easily be adapted to other use cases. Spatial relationships are difficult to capture without visual interpretation. GIS allows for a quick visualization of all factors that contribute to a risk score. When analyzing for risk of loss of ecological diversity, managers would greatly benefit from a coupled visual and analytical comparison between regions, which we are able to achieve in this exercise.
In this paper we demonstrate the utility of presenting results of coastal ocean risk analysis in a spatial format via GIS. Creating a spatially explicit model for risk of change due to human impact at a global scale illuminates the need for understanding of the ecological makeup of the habitat being analyzed. Our risk analysis results describe the risk of loss of ecological diversity across three separate biogenic habitats, seagrass, mangrove, and stony corals. Once a management framework is established for a region, the relative sensitivities of factors can be changed to apply to any species present in the region. Using this template to assess all biogenic habitats uniformly would also save time on behalf of coastal managers and planners.
Data Availability Statement
The original contributions presented in the study are included in the article/supplementary material, further inquiries can be directed to the corresponding author.
Author Contributions
PH conducted the primary work including data acquisition, analysis, and writing. AF and BH contributed insight on analysis and editorial work on the manuscript. All authors contributed to the article and approved the submitted version.
Conflict of Interest
The authors declare that the research was conducted in the absence of any commercial or financial relationships that could be construed as a potential conflict of interest.
Publisher’s Note
All claims expressed in this article are solely those of the authors and do not necessarily represent those of their affiliated organizations, or those of the publisher, the editors and the reviewers. Any product that may be evaluated in this article, or claim that may be made by its manufacturer, is not guaranteed or endorsed by the publisher.
References
Alongi, D. M. (2002). Present state and future of the world’s mangrove forests. Environ. Conserv. 29, 331–349. doi: 10.1017/S0376892902000231
Alongi, D. M. (2015). The impact of climate change on mangrove forests. Curr. Clim. Change Rep. 1, 30–39. doi: 10.1007/s40641-015-0002-x
Bobrovitskaya, N. N., Kokorev, A. V., and Lemeshko, N. A. (2003). Regional patterns in recent trends in sediment yields of Eurasian and Siberian rivers. Glob. Planet. Change 39, 127–146. doi: 10.1016/S0921-8181(03)00021-3
Bryant, D., Burke, L., and Spalding, M. (1998). Reefs at Risk: A Map-Based Indicator of Threats to the World’s Coral Reefs. Washington, DC: World Resources Institute.
Burkholder, J. M., Tomasko, D. A., and Touchette, B. W. (2007). Seagrasses and eutrophication. J. Exp. Mar. Biol. Ecol. 350, 46–72. doi: 10.1016/j.jembe.2007.06.024
Carpenter, S. R., Caraco, N. F., Correll, D. L., Howarth, R. W., Sharpley, A. N., and Smith, V. H. (1998). Nonpoint Pollution of Surface Waters with Phosphorus and Nitrogen. Ecol. Appl. 83, 559–568.
Carruthers, T. J. B., Dennison, W. C., Longstaff, B. J., Waycott, M., Abal, E. G., McKenzie, L. J., et al. (2002). Seagrass habitats of northeast Australia: models of key processes and controls. Bull. Mar. Sci. 71, 1153–1169.
Carstensen, J., Conley, D. J., Andersen, J. H., and Ærtebjerg, G. (2006). Coastal eutrophication and trend reversal: a Danish case study. Limnol. Oceanogr. 51, 398–408. doi: 10.4319/lo.2006.51.1_part_2.0398
Cavanaugh, K. C., Kellner, J. R., Forde, A. J., Gruner, D. S., Parker, J. D., Rodriguez, W., et al. (2014). Poleward expansion of mangroves is a threshold response to decreased frequency of extreme cold events. Proc. Natl. Acad. Sci. U. S. A. 111, 723–727. doi: 10.1073/pnas.1315800111
Cavanaugh, K. C., Parker, J. D., Cook-Patton, S. C., Feller, I. C., Williams, A. P., and Kellner, J. R. (2015). Integrating physiological threshold experiments with climate modeling to project mangrove species’ range expansion. Glob. Change Biol. 21, 1928–1938. doi: 10.1111/gcb.12843
Cloern, J. E. (2001). Our evolving conceptual model of the coastal eutrophication problem. Mar. Ecol. Prog. Ser. 210, 223–253. doi: 10.3354/meps210223
Corredor, J. E., Howarth, R. W., Twilley, R. R., and Morell, J. M. (1999). Nitrogen cycling and anthropogenic impact in the tropical interamerican seas. Biogeochemistry 46, 163–178.
Coverdale, T. C., Brisson, C. P., Young, E. W., Yin, S. F., Donnelly, J. P., and Bertness, M. D. (2014). Indirect Human Impacts Reverse Centuries of Carbon Sequestration and Salt Marsh Accretion. PLoS One 9:e93296. doi: 10.1371/journal.pone.0093296
De Fontaubert, A. C., Downes, D. R., and Agardy, T. (1996). Biodiversity in the Seas: implementing the Convention on Biological Diversity in Marine and Coastal Habitats. Gland, Switzerland: IUCN.
Diaz, R. J., and Rosenberg, R. (2008). Spreading Dead Zones and Consequences for Marine Ecosystems. Science 321, 926–929. doi: 10.1126/science.1156401
Doney, S. C., Ruckelshaus, M., Emmett Duffy, J., Barry, J. P., Chan, F., and English, C. A. (2012). Climate Change Impacts on Marine Ecosystems. Annu. Rev. Mar. Sci. 4, 11–37. doi: 10.1146/annurev-marine-041911-111611
Drupp, P., De Carlo, E. H., Mackenzie, F. T., Bienfang, P., and Sabine, C. L. (2011). Nutrient Inputs, Phytoplankton Response, and CO2 Variations in a Semi-Enclosed Subtropical Embayment, Kaneohe Bay, Hawaii. Aquat. Geochem. 17, 473–498. doi: 10.1007/s10498-010-9115-y
Erftemeijer, P. L. A., Riegl, B., Hoeksema, B. W., and Todd, P. A. (2012). Environmental impacts of dredging and other sediment disturbances on corals: a review. Mar. Pollut. Bull. 64, 1737–1765. doi: 10.1016/j.marpolbul.2012.05.008
Fabricius, K. E. (2011). “Factors Determining the Resilience of Coral Reefs to Eutrophication: a Review and Conceptual Model,” in Coral Reefs: an Ecosystem in Transition, eds Z. Dubinsky and N. Stambler (Netherlands, Dordrecht: Springer), 493–505.
Fabricius, K. E. (2005). Effects of terrestrial runoff on the ecology of corals and coral reefs: review and synthesis. Mar. Pollut. Bull. 50, 125–146. doi: 10.1016/j.marpolbul.2004.11.028
Fabricius, K. E., Wild, C., Wolanski, E., and Abele, D. (2003). Effects of transparent exopolymer particles and muddy terrigenous sediments on the survival of hard coral recruits. Estuar. Coast. Shelf Sci. 57, 613–621. doi: 10.1016/S0272-7714(02)00400-6
Fredston-Hermann, A., Brown, C. J., Albert, S., Klein, C. J., Mangubhai, S., Nelson, J. L., et al. (2016). Where Does River Runoff Matter for Coastal Marine Conservation? Front. Mar. Sci. 3:273. doi: 10.3389/fmars.2016.00273
Halpern, B. S., Ebert, C. M., Kappel, C. V., Madin, E. M. P., Micheli, F., Perry, M., et al. (2009). Global priority areas for incorporating land-sea connections in marine conservation. Conserv. Lett. 2, 189–196. doi: 10.1111/j.1755-263X.2009.00060.x
Halpern, B. S., Frazier, M., Potapenko, J., Casey, K. S., Koenig, K., Longo, C., et al. (2015). Spatial and temporal changes in cumulative human impacts on the world’s ocean. Nat. Commun. 6:7615. doi: 10.1038/ncomms8615
Hoekstra, J. M., and Molnar, J. L. (eds) (2010). The atlas of global conservation: changes, challenges and opportunities to make a difference. Berkeley: University of California Press.
Huang, I. B., Keisler, J., and Linkov, I. (2011). Multi-criteria decision analysis in environmental sciences: ten years of applications and trends. Sci. Total Environ. 409, 3578–3594. doi: 10.1016/j.scitotenv.2011.06.022
Jenks, G. F. (1967). The Data Model Concept in Statistical Mapping. Int. Yearbook Cartogr. 7, 186–190.
Klein, C. J., Ban, N. C., Halpern, B. S., Beger, M., Game, E. T., Grantham, H. S., et al. (2010). Prioritizing Land and Sea Conservation Investments to Protect Coral Reefs. PLoS One 5:e12431. doi: 10.1371/journal.pone.0012431
Massam, B. H. (1988). Multi-criteria decision making (MCDM) techniques in planning. Prog. Plann. 30, 1–84.
Murphy, G. E. P., Wong, M. C., and Lotze, H. K. (2019). A human impact metric for coastal ecosystems with application to seagrass beds in Atlantic Canada. FACETS 4, 210–237. doi: 10.1139/facets-2018-0044
Noble, M. M., Harasti, D., Pittock, J., and Doran, B. (2019). Linking the social to the ecological using GIS methods in marine spatial planning and management to support resilience: a review. Mar. Policy 108:103657. doi: 10.1016/j.marpol.2019.103657
Osland, M. J., Day, R. H., Hall, C. T., Brumfield, M. D., Dugas, J. L., and Jones, W. R. (2017). Mangrove expansion and contraction at a poleward range limit: climate extremes and land-ocean temperature gradients. Ecology 98, 125–137. doi: 10.1002/ecy.1625
Pellerin, B. A., Stauffer, B. A., Young, D. A., Sullivan, D. J., Bricker, S. B., Walbridge, M. R., et al. (2016). Emerging tools for continuous nutrient monitoring networks: sensors advancing science and water resources protection. J. Am. Water Resour. Assoc. 52, 993–1008. doi: 10.1111/1752-1688.12386
Peters, E. C., Gassman, N. J., Firman, J. C., Richmond, R. H., and Power, E. A. (1997). Ecotoxicology of tropical marine ecosystems. Environ. Toxicol. Chem. 16, 12–40.
Rabalais, N. N., Díaz, R. J., Levin, L. A., Turner, R. E., Gilbert, D., and Zhang, J. (2010). Dynamics and distribution of natural and human-caused hypoxia. Biogeosciences 7, 585–619. doi: 10.5194/bg-7-585-2010
Rabalais, N. N., Turner, R. E., and Wiseman, W. J. (2002). Gulf of Mexico Hypoxia, A.K.A. “The Dead Zone.” Annu. Rev. Ecol. Syst. 33, 235–263. doi: 10.1146/annurev.ecolsys.33.010802.150513
Rabouille, C., Mackenzie, F. T., and Ver, L. M. (2001). Influence of the human perturbation on carbon, nitrogen, and oxygen biogeochemical cycles in the global coastal ocean. Geochim. Cosmochim. Acta 65, 3615–3641.
Ralph, P. J., Durako, M. J., Enríquez, S., Collier, C. J., and Doblin, M. A. (2007). Impact of light limitation on seagrasses. J. Exp. Mar. Biol. Ecol. 350, 176–193. doi: 10.1016/j.jembe.2007.06.017
Risk, M. J. (2014). Assessing the effects of sediments and nutrients on coral reefs. Curr. Opin. Environ. Sustain. 7, 108–117. doi: 10.1016/j.cosust.2014.01.003
Rude, J., Minks, A., Doheny, B., Tyner, M., Maher, K., Huffard, C., et al. (2015). Ridge to reef modelling for use within land-sea planning under data-limited conditions: ridge to reef modelling under data-limited conditions. Aquat. Conserv. Mar. Freshw. Ecosyst. 26, 251–264. doi: 10.1002/aqc.2548
Sánchez-Lozano, J. M., Teruel-Solano, J., Soto-Elvira, P. L., and Socorro García-Cascales, M. (2013). Geographical Information Systems (GIS) and Multi-Criteria Decision Making (MCDM) methods for the evaluation of solar farms locations: case study in south-eastern Spain. Renew. Sustain. Energy Rev. 24, 544–556. doi: 10.1016/j.rser.2013.03.019
Short, F. T., and Wyllie-Echeverria, S. (1996). Natural and human-induced disturbance of seagrasses. Environ. Conserv. 23, 17–27. doi: 10.1017/s0376892900038212
Smith, V. H., Tilman, G. D., and Nekola, J. C. (1999). Eutrophication: impacts of excess nutrient inputs on freshwater, marine, and terrestrial ecosystems. Environ. Pollut. 100, 179–196. doi: 10.1016/s0269-7491(99)00091-3
Spalding, M., Kainuma, M., and Collins, L. (2010). World atlas of mangroves. Milton Park: Routledge.
Spalding, M. D., Fox, H. E., Allen, G. R., Davidson, N., Ferdana, Z. A., Finlayson, M. A. X., et al. (2007). Marine ecoregions of the world: a bioregionalization of coastal and shelf areas. BioScience 57, 573–583. doi: 10.1111/cla.12453
Stem, C., Margoluis, R., Salafsky, N., and Brown, M. (2005). Monitoring and Evaluation in Conservation: a Review of Trends and Approaches. Conserv. Biol. 19, 295–309. doi: 10.1111/j.1523-1739.2005.00594.x
Stokes, D., and Morrison, P. (2003). GIS-Based Conservation Planning: a Powerful Tool to be Used with Caution. How did it happen that a method so sound in principle produced results so at odds with the real world? Conserv. Pract. 4, 38–42. doi: 10.1111/j.1526-4629.2003.tb00054.x
Tuda, A. O., Stevens, T. F., and Rodwell, L. D. (2014). Resolving coastal conflicts using marine spatial planning. J. Environ. Manag. 133, 59–68. doi: 10.1016/j.jenvman.2013.10.029
Urban, M. C., Bocedi, G., Hendry, A. P., Mihoub, J.-B., Peer, G., Singer, A., et al. (2016). Improving the forecast for biodiversity under climate change. Science 353:aad8466. doi: 10.1126/science.aad8466
Keywords: GIS, coastal ecosystems, conceptual framework, risk modeling, ecological diversity
Citation: Hoel P, Fredston A and Halpern BS (2022) An Evaluation Framework for Risk of Coastal Marine Ecological Diversity Loss From Land-Based Impacts. Front. Mar. Sci. 9:796050. doi: 10.3389/fmars.2022.796050
Received: 15 October 2021; Accepted: 18 February 2022;
Published: 08 April 2022.
Edited by:
Leslie New, Ursinus College, United StatesReviewed by:
Mohammad Reza Shokri, Shahid Beheshti University, IranPeter Convey, British Antarctic Survey (BAS), United Kingdom
Copyright © 2022 Hoel, Fredston and Halpern. This is an open-access article distributed under the terms of the Creative Commons Attribution License (CC BY). The use, distribution or reproduction in other forums is permitted, provided the original author(s) and the copyright owner(s) are credited and that the original publication in this journal is cited, in accordance with accepted academic practice. No use, distribution or reproduction is permitted which does not comply with these terms.
*Correspondence: Paige Hoel, cGFpZ2Vob2VsQGF0bW9zLnVjbGEuZWR1