 Gohar A. Petrossian
 Bryce Barthuly
 Monique C. Sosnowski
- John Jay College of Criminal Justice, The City University of New York, New York, NY, United States
To effectively monitor fisheries resources and combat illegal, unreported, and unregulated fishing, human labor exploitation onboard fishing vessels amongst other crimes, such as the trafficking of weapons, humans, and narcotics, it is important that more attention is paid to the likely facilitators of these activities, one of these being at-sea transshipment of fish. Even though transshipment is a common practice that has taken place for decades, little is known about the overall networks, operational practices, and global spatial patterns of the central actors involved in such activities. This research aims to fill that knowledge gap by understanding the networks of activities of the actors who play a central role in these global transshipment activities. Using data from Global Fishing Watch on global transshipment events that took place between 2015 and 2020, this research (a) identifies the central carriers involved in transshipment events, (b) visualizes their networks of activities and interactions with fishing vessels, (c) examines the spatial distribution of their activities; and (d) determines whether these vessels use open-registry flags when engaging in transshipments, and if so, which. In exploring the role that central actors play within networks of transshipments, targeted mechanisms can be designed to better monitor such activities.
Introduction
Transshipments involve the exchange of resources, such as fuel, crew, gear, and fish at sea or at port, between vessels. Such exchanges can take place between fishing vessels and carriers (otherwise known as reefers, or refrigerated cargo vessels), converted fishing vessels, “mini-reefers” (fishing vessels that switch operations between transporting and catching the fish), factory vessels (also known as fish processing vessels), small transport vessels (used for the transport of seafood and fish), or containers (WATF, 2021). Transshipment activities often take place in the high seas beyond the jurisdiction of any country, or in areas with unclear jurisdiction (Boerder et al., 2018). If a transshipment occurs at sea, this can increase the fishing vessels’ efficiency by removing their need to offload their catches at ports and by reducing the overall operating costs. By transshipping its catches, fishing vessels can also potentially obscure the origin of catches that may or may not have been caught legally (Boerder et al., 2018). This is especially problematic, since transshipments often involve vulnerable and valuable species, such as sharks, tuna, salmon, billfish, crab, and mackerel (Gianni and Simpson, 2005), and monitoring these transshipment activities is of significant importance (McKinney et al., 2020).
The ability to monitor fisheries resources and combat illegal, unreported, and unregulated (IUU) fishing, amongst other crimes such as the trafficking of weapons, humans, and narcotics, as well as human labor exploitation (White et al., 2000; Bruwer, 2020), requires that more attention be paid to one of the facilitators of these activities – transshipment (Ewell et al., 2017; Brush, 2021). While evidence on transshipment as a key facilitator of trafficking in weapons, humans, and narcotics is still limited, its links to IUU fishing are better established.
Illegal, unreported, and unregulated fishing is one of the most significant crimes of our century, and has led to serious social, economic, and environmental impacts (World Ocean Review, 2013; Petrossian, 2019). Global fisheries lose an upward of $36 billion annually to IUU fishing (Pauly and Zeller, 2016), or about 1,800 pounds of wild caught fish every second (Pew Charitable Trusts, 2013; GIATC, 2015; Pew Charitable Trusts, 2018). IUU fishing spans all parts of the world and affects almost every coastal country. Considering that over 90% of all commercial fishing activity occurs in the exclusive economic zones of coastal countries, the direct impacts of IUU fishing on these countries is incontestable. The impacts of IUU fishing are especially prevalent in developing countries. For example, many of the developing countries obtain over 50% of their protein input from seafood (Food and Agriculture Organization [FAO], 2018), and the significant reduction in their protein resources due to IUU fishing has increased the pressure for basic survival (Crowell and Turvold, 2020). As a result of this, fishermen in many poverty-stricken communities have either been recruited by illegal fishing vessels and risked being subjected to human rights abuses (Environmental Justice Foundation [EJF], 2010), or were recruited by drug traffickers (The Tico Times, 2014), thus putting not only themselves but also their families at significant risks. An Associated Press investigation in 2014, for example, revealed enslavement, imprisonment, and bonded labor of Burmese and Cambodian fishermen onboard Thai fishing vessels (McDowell et al., 2015). In addition to labor trafficking, IUU fishing has also been linked to other serious crimes, such as piracy (Weldemichael, 2019); drug trafficking (Belhabib et al., 2020); organized crime and corruption (UNODC, 2011, 2019; Phelps et al., 2015); and money laundering (Witbooi et al., 2020).
Illegal, unreported, and unregulated fishing has also had significant impacts on the marine environment, such as in the case of blast fishing, bottom trawling, and cyanide fishing, which collectively have damaged coral reefs and kelp forests, bottom dwelling non-target species and juvenile fish (Chevallier, 2017). Additionally, IUU fishing vessels use illegal gear and methods, as a result of which non-target marine species, many of which are either endangered or critically endangered, are accidentally caught in the nets or lines and die. These species include sea turtles, sharks, seals, whales, as well as albatrosses (Petrossian, 2019), among others.
In an effort to detect and prevent IUU fishing and other crimes that can be potentially facilitated by transshipment vessels, some regional fisheries management organizations (RFMOs) have adopted measures to monitor and regulate this activity. For example, such RFMOs as Inter-American Tropical Tuna Commission (IATTC); International Commission for the Conservation of Atlantic Tunas (ICCAT), the Indian Ocean Tuna Commission (IOTC), Western and Central Pacific Fisheries Commission (WCPFC), the General Fisheries Commission for the Mediterranean (GFCM), and the Southeast Atlantic Fisheries Organization (SEAFO), have introduced restrictions and increased requirements on transshipment activities. Another example is the establishment of different inspection and monitoring measures for improved oversight over fish catches that take place within the Convention Area of the Convention for the Conservation of Antarctic Marine Living Resources (CCAMLR) (CCAMLR, 2017). Despite these regulations, RFMOs often face enforcement challenges due to the lack of independent observer coverage, available control and monitoring mechanisms, and the extent of the areas to be monitored (Miller et al., 2018).
Even though transshipment is a common practice that has taken place for decades, little is known about the overall networks of operational practices, global spatial patterns, and main players involved in such activities. This research aims to fill some of that knowledge gap by understanding the networks of activities of the central actors – defined as actors who are most influential and key players in the network – involved in global transshipment activities. In exploring the role that central actors play within networks of transshipments, targeted interventions can be designed to better monitor and control such activities. The next sections will help situate the research questions, methods, and main findings, by providing an overview of what is known regarding transshipment activities to date.
Literature Review
Existing research has explored a range of attributes associated with global transshipment activities. Most relevant to the current study is the work on (1) the geographic scope of transshipment activities; (2) flag pairings of involved vessels; and (3) the identification of the actors involved in transshipping.
Geographic Scope
Starting with the broader topic – geographic scope -, Boerder et al. (2018) analyzed Global Fishing Watch data on transshipment events that took place between 2012 through 2017. They found that although transshipping occurred in all oceans and exclusive economic zones (EEZs), distinct global hot spots emerged. Such hotspots included areas within the Indian Ocean and the equatorial Pacific, as well as within EEZs bordering Western African countries. Within these EEZs, transshipments were also notably found to occur closer to fishing grounds.
Using the same data source and time frame as Boerder et al. (2018), Miller et al. (2018) analyzed Global Fishing Watch data from 2012 through 2017 on transshipment encounters and loitering events in an effort to identify patterns related to the spatial distribution and the flag pairings of these activities. Much like Boerder et al. (2018), Miller et al.’s (2018) findings revealed that transshipment encounters and loitering events occurred both within the high seas and the EEZs of coastal countries.
Flag Pairings
As for flag pairings, the Miller et al. (2018) study found that fishing vessels from China, Taiwan, South Korea, and Japan (the next common fishing vessel flag states engaged in these activities, apart from the United States) were associated with transshipment vessels flagged to Panama, Liberia, and Vanuatu, all of which are known open-registry states. These analyses excluded Russia-to-Russia events due to their accounting for a significant majority of the events within the Russian EEZ.
Actors Involved in Transshipping
Three studies looked more closely at the actors involved in global transshipping activities. These include studies carried out by MRAG (2019, 2020) and Global Fishing Watch (2021). Global Fishing Watch (2021) performed an analysis focusing on the supply chain of transshipping. Specifically, they examined the activities of transshipment and bunker vessels and their relationship to distant water fishing fleets. The researchers found that the carrier vessels were involved in the process of transferring fish from vessels to ports, while bunker vessels served as enablers. Bunker vessels serviced fishing vessels at sea in an effort to reduce the fishing vessels’ need to return to port. The overall aim of this study was to make recommendations on transparency improvement surrounding global transshipping events.
MRAG (2019, 2020) made similar efforts to identify actors involved in transshipment activities by focusing on the WCPFC and the ICCAT Convention Areas. Both MRAG reports aimed to analyze the “business ecosystem” of transshipping. In doing so, they identified key actors, companies, and economic drivers. Their in-depth report illustrated the complexities of global transshipping activities and aimed to make recommendations on the improved regulation and monitoring of these activities around the world.
Other Transshipping Research
Other, less directly relevant, research on the various aspects of transshipping includes studies by Greenpeace (2020), which identified the risks associated with global transshipment activities; Stop Illegal Fishing (2020), which examined transshipment events within the Western Indian Ocean (WIO) focusing on the transshipment activities involving tuna and tuna-like species (e.g., marlin, sailfish, swordfish); Seto et al. (2020), who examined transshipments within WCPFC’s Convention Area, focusing on the transparency of the activities occurring in the region and whether such activities were “traceable, verifiable, and legal”; the Pew Charitable Trusts (2019), which examined the dynamics of transshipment activities specifically within the WCPFC Convention Area and found that there was likely significant underreporting of actual transshipment events occurring in the area; both studies by Gianni and Simpson (2005) and Park and Stamato (2020), who have linked transshipping activity to IUU fishing vessels; and UN FAO’s study on the effectiveness of regulations currently in place at the national and regional levels to address transshipment activities (Mosteiro Cabanelas et al., 2020).
Materials and Methods
Social network analysis (SNA) will be applied to analyze the network dynamics of potential transshipment activities. SNA is an analytic method based on the idea that social life, in its many forms and conceptualizations, is created and influenced by relationships (Rapoport and Horvath, 1961; de Sola Pool and Kochen, 1978). This analytic method has been applied across a wide range of disciplines, from economics to geography, psychology, sociology, and criminology. Given that transshipments are “social” in nature, in that fishing vessels and reefers are interacting with one another, SNA is applied herein to understand these interactions.
Social network analysis is based on graph theory, which states that actors (in this case, individual reefers and fishing vessels) can be represented by points (or “nodes”), and the social relations between them, represented by lines (or “edges”) (Harary and Norman, 1953). In applying graph theory, it is not only the existence of these social interactions that is considered, but also the attributes of these interactions, such as their direction and strength. To study at-sea transshipments using SNA, information on transshipment events and the actors involved has been aggregated. This includes information on the occurrence of and locations of at-sea transshipments, as well as information on the flags used to carry out these activities.
Data Sources
A total of three primary data sources and multiple supplementary sources were used to extract information about the carrier and fishing vessels engaged in global transshipment events. These sources include: (a) Global Fishing Watch’s (GWF) Carrier Vessel Portal; (b) IHS Markit; and (c) Marine Traffic. Each of these sources is briefly described below.
Global Fishing Watch’s Carrier Vessel Portal
Global Fishing Watch and the Pew Charitable Trusts have collaboratively put together the transshipment event data publicly available through the Portal. The data on transshipment events were collected through the use of satellite technology, machine learning, and vessel authorization databases (Global Fishing Watch, n.d.). Using the Portal, this research extracted information on the events that occurred between 7 June 2015 and 6 June 2020, a full 5-year period. The data used in the current research were extracted in March 2021, therefore, the analyses are based on these data (which is dynamic and can change regularly). The database, using the filtered dates, included a total of 25,216 events, and involved a total of 691 carriers and 2,736 fishing vessels. For this study, this research used the “likely” transshipments database from the Portal, which is defined by GFW as interactions that occurred between two vessels that traveled at less than 2 knots speed, spent over 3 hours, and remained within 500 m of each other (Global Fishing Watch, n.d.).
Once the initial extracted data were examined, we made the decision to remove all the transshipment events that occurred within the Russian EEZ and specifically involved transshipment events between carriers and fishing vessels flagged to Russia. It is known that Russia-to-Russia transshipments take place within a self-contained system and have no or limited interaction with the global transshipment operations (Greenpeace, 2020). Additionally, considering almost 50% of the total transshipment events involved such interactions, including them would have prevented us from observing more nuanced relationships between the global transshipment actors in the network graphs. It would have also had limited policymaking utility. Once these events have been removed, this resulted in the exclusion of a total of 12,894 transshipment events from the total events database, leaving us with 12,322 events for the network analyses, which included a total of 600 carriers and 2,376 fishing vessels.
IHS-Markit
The IHS-Markit Maritime Portal Desktop contains a wealth of information about global fishing, merchant, and military ships. Through its Sea-web Ships Portal, subscribers can obtain detailed vessel ownership, status, flag, activity, and a plethora of other information. Both Marine Traffic and IHS-Markit data sources were used as complementary sources in this study for cases where vessel information (such as, for example, flag) was otherwise missing from the Global Fishing Watch database.
Marine Traffic
This is a community-driven project the goal of which is to provide vessel tracking information. In addition to the real-time information about vessel activities that can be obtained from their publicly available portal, Marine Traffic provides relevant information about the vessels, such as their name, call sign, flag, owner, insurer, and so on.
Other Supplementary Sources
In addition to these primary sources, this research used other supplementary sources to obtain and verify data collected on the carrier vessels from the other sources, such as their call sign, IMO number (when this was not available through the IHS-Markit portal), and vessel flag. These sources included WCPFC’s Record of Fishing Vessels; alltrack.org; fleetmon.com; myshiptracking.com; marinevesseltraffic.com; myship.com; shipinfo.net; vesseltracker.com; and vesselfinder.com. These supplementary sources were especially useful in cases where information on the vessels were missing from the three primary sources.
Analytical Strategy
Methods of Identifying the Central Actors
In this research, we used three different analytical methods to identify the central carriers involved in the global transshipment events. First, for all the transshipment events between the carriers and the fishing vessels, we calculated the number of total and unique/non-repeat interaction frequencies for carrier vessels. The total events were calculated by summing the frequencies of the events that each carrier engaged in, no matter if these events were carried out with the same or different fishing vessels. The unique/non-repeat frequencies, in turn, only considered events that took place with unique vessels (i.e., the repeat visits were removed). For example, a carrier can have 10 total encounters, but only five (5) unique ones, because some of these encounters can involve repeat fishing vessels (Figure 1 illustrates this distinction). The ratio between the total and unique frequencies was then calculated to isolate central carriers, with the assumption that those identified will not only hold the highest number of total connections, but these will also have the highest number of unique connections.
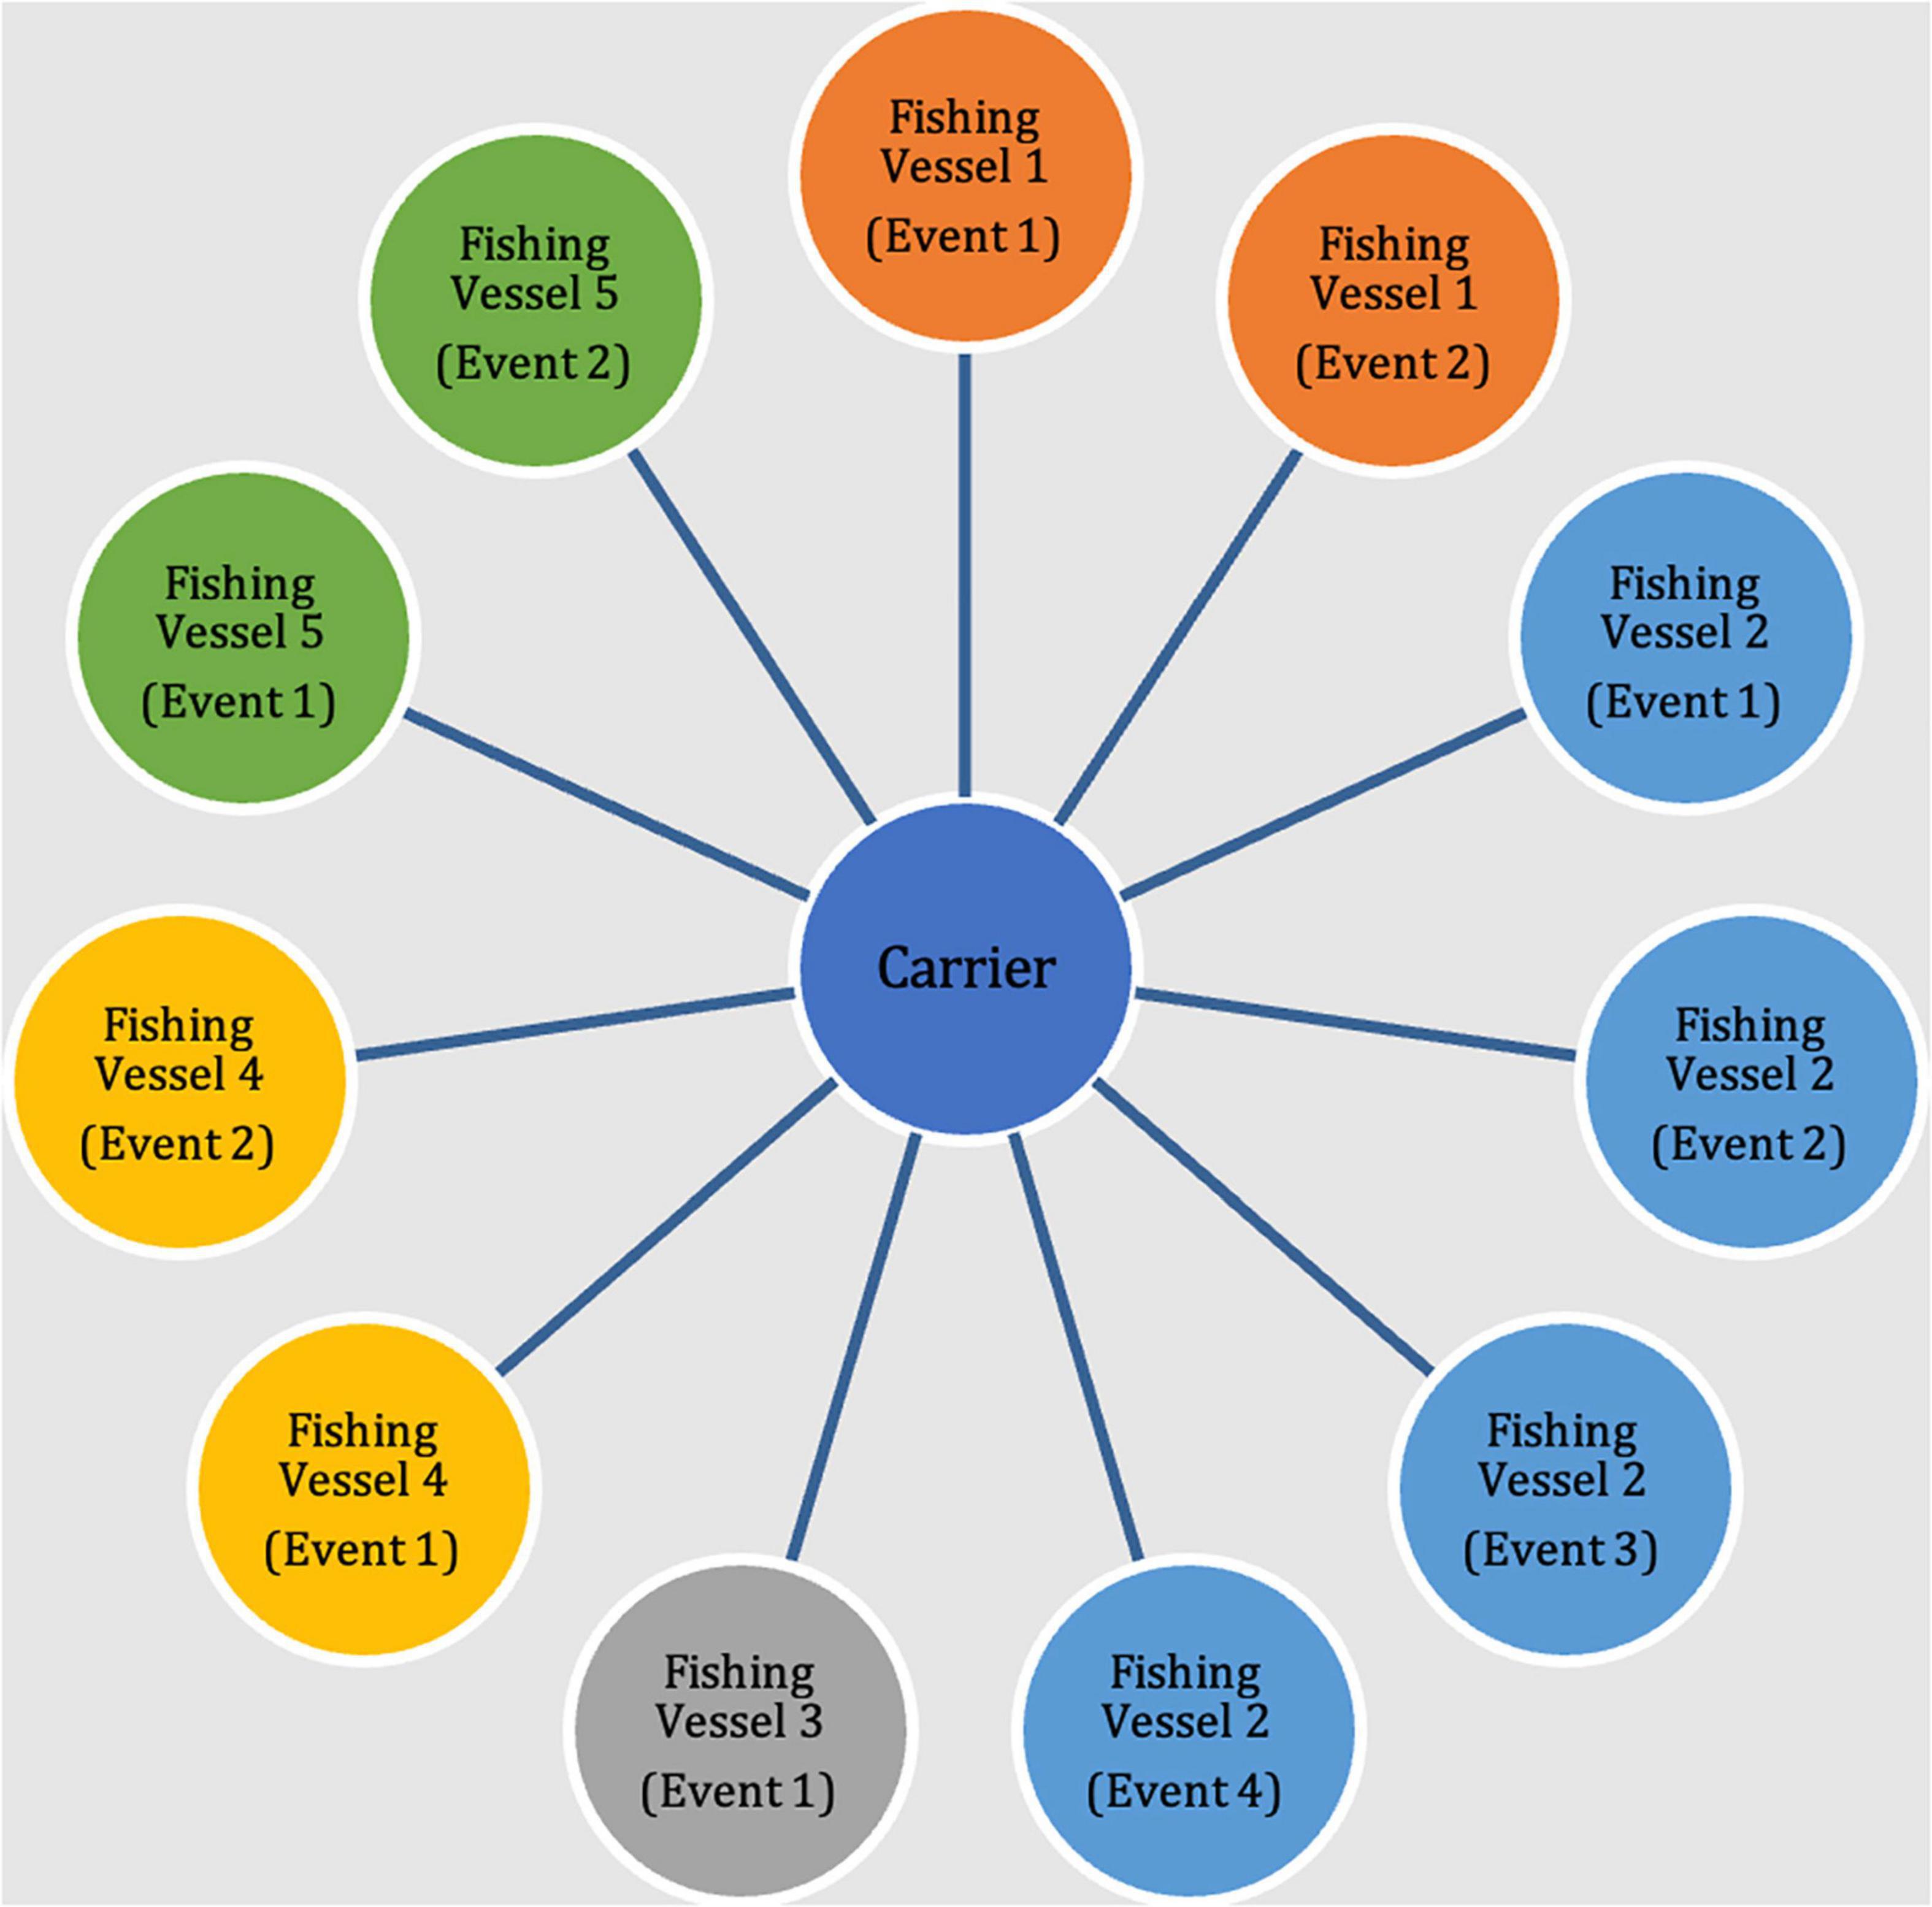
Figure 1. An illustration of total (n = 10) vs. unique/non-repeat (n = 5) transshipment events.
Second, both the degree and eigenvector centrality scores were generated for each carrier to identify those with highest scores on both centrality metrics. Degree centrality is a measure of the number of connections that a node has1. Eigenvector centrality is a measure that takes into consideration not only the number of connections that a node or an actor has, but also the degree of influence that the node’s immediate connections have in the entire network. Central carriers, therefore, were identified as those with high degree and eigenvector centrality scores; they were highly connected and influential in their networks.
Third, using the Pareto Principle, an 80/20 distribution analysis was conducted separately on two data sets: those that included the carriers and the total number of encounters with fishing vessels, and those that included the carriers that included the total number of unique encounters with fishing vessels. The Lorenz Curves and the associated Gini Coefficients were examined to make the decision about the central carriers (Figure 2). Using all three extraction methods, as well as identifying the consistencies between them, this research identified a total of 130 central carriers. These carriers comprised approximately 22% of the total carriers but accounted for a total of 8,840 (72%) transshipment events.
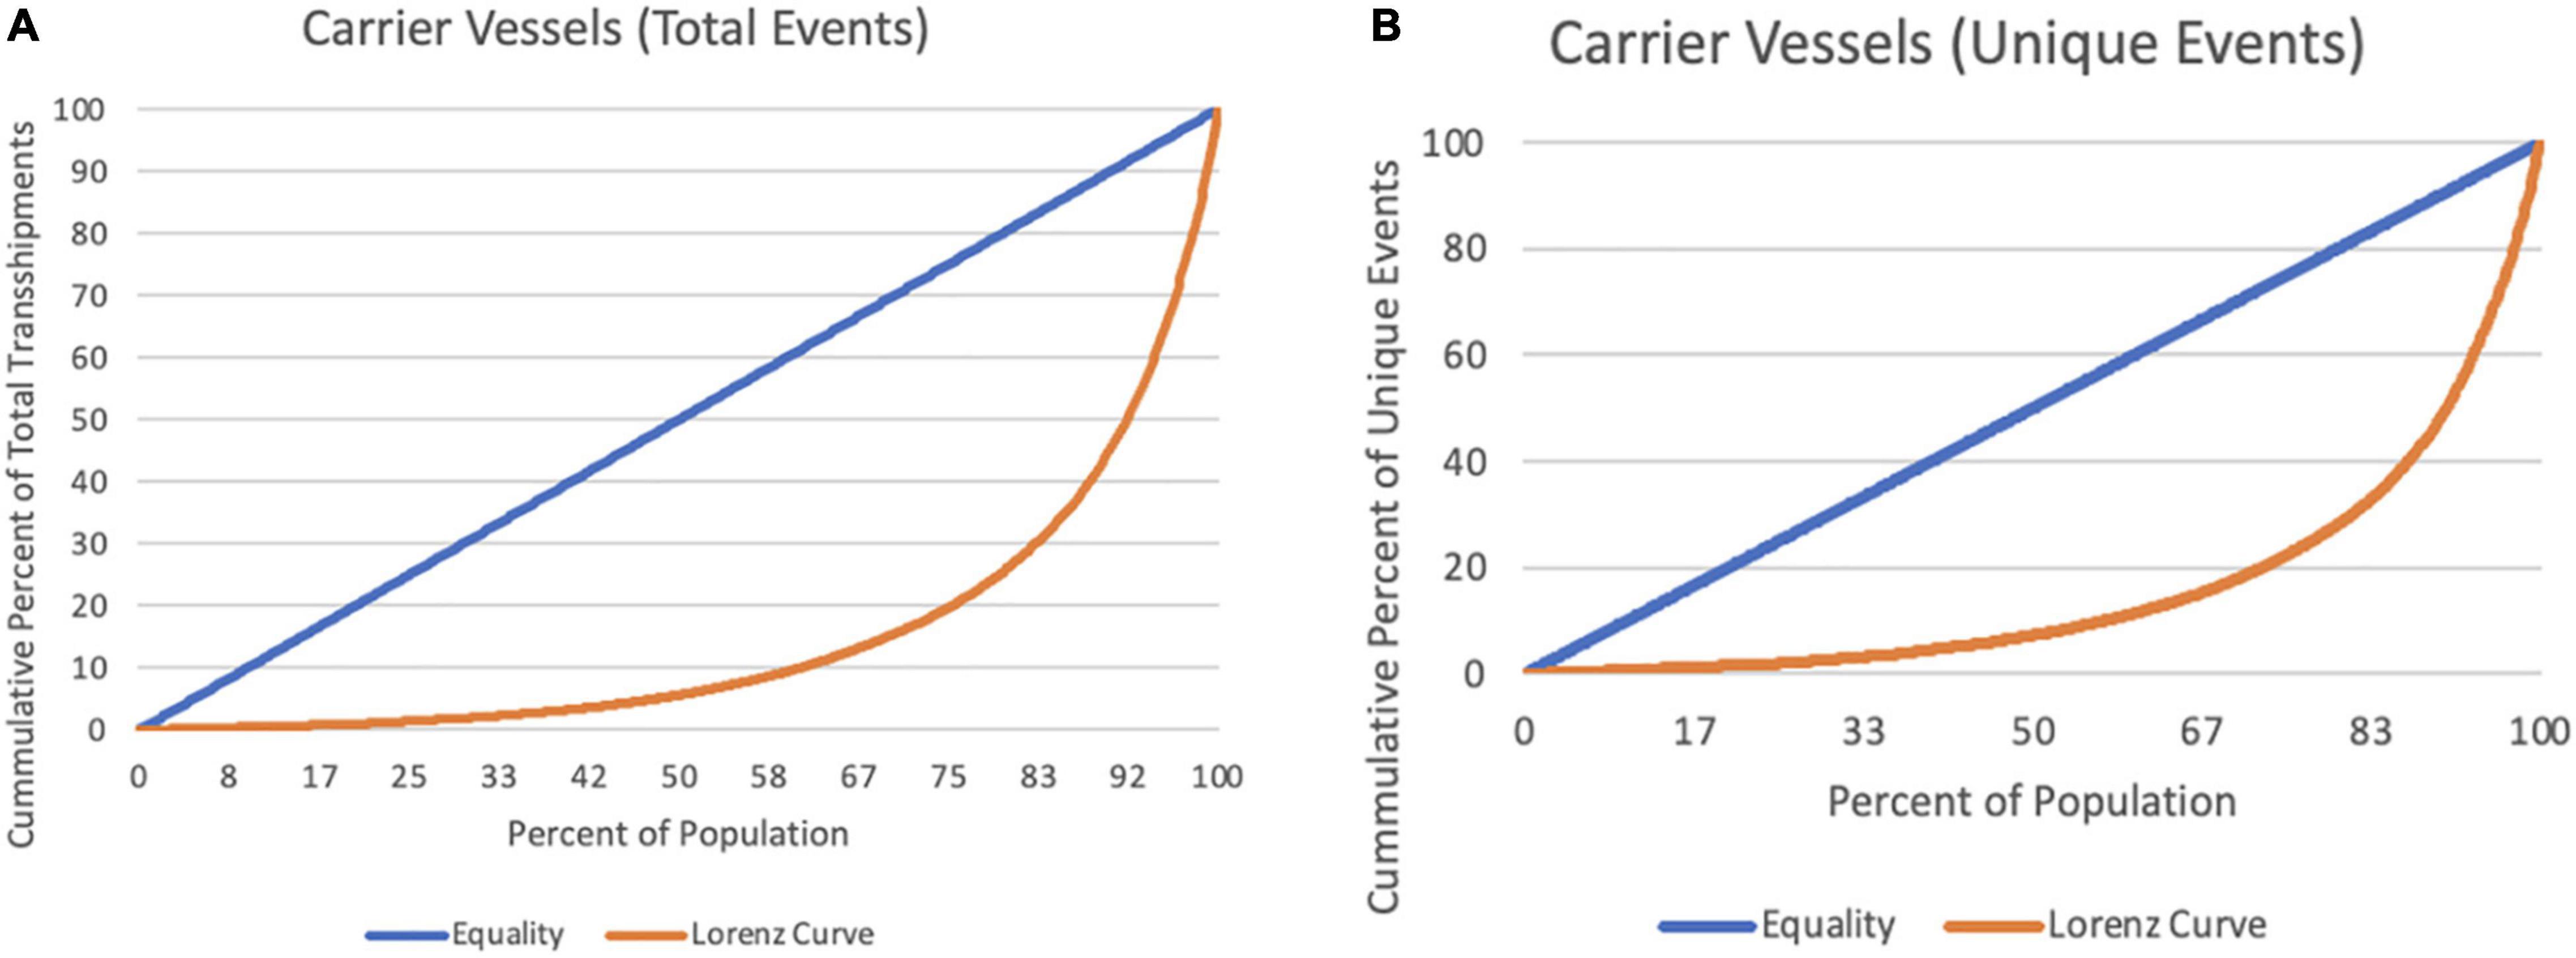
Figure 2. Lorenz curves for carrier vessels. (A) Total transshipment events (Gini = 0.70). (B) Unique transshipment events (Gini = 0.67).
Modularity (Community Detection) Analyses
Modularity analysis is a method used by researchers to speculate both the distribution and the strength of the division of a network into modules or communities. Essentially, modularity analysis allows researchers to identify communities based on the strength/density of the connections between the nodes (in this case, carrier and fishing vessels) within them. This analysis also allows the researcher to estimate the proportion of the overall network that the given community comprises, thus evaluating their relative importance in relation to other communities within the same global network. Discovering community structures is a critical step toward understanding complex network systems (Lancichinetti and Fortunato, 2009). Such structures are typically organized in compartments in which nodes have high density of connections to other nodes within the same compartment and less ties to those outside of the group.
Various methods of community structure detection have been proposed and evaluated by researchers in detecting compartments of large-scale network datasets (Lancichinetti and Fortunato, 2009). Currently, there are over 100 different types of algorithms used to identify communities. The Gephi software, used in this research, aids in identifying modular communities by applying Blondel’s algorithm and the Louvain method, one of the best performing algorithms/methods in terms of both identifying the modularities and its efficiency when dealing with large databases (Blondel et al., 2008). Importantly, Blondel’s algorithm has continuously demonstrated the production of high-quality and reliable community detection that is not computationally complex (Lancichinetti and Fortunato, 2009).
Spatial Analyses
To calculate the densities of the transshipment events involving central carriers, this study uses “Point Density Spatial Analyst Tool” in ArcGIS for Desktop. This tool evaluates the magnitude-per-unit area from the point features representing the locations (XY coordinates) where the given events are taking place. In this research, the unit areas represented approximately 1/2 degree by 1/2 degree grid cells, and we calculated the densities based on the presence or absence of the points within each spatial environment/grid cell.
Research Questions
Using social network analysis and spatial data analysis, this research explores the following four primary research questions:
1. What is the network structure of the central carriers involved in the transshipping events around the world?
2. What is the geographic scope and spatial distribution of the events involving these central carriers?
3. Under which country’s flags have the central carriers been operating, and with which countries’ flagged fishing vessels?
4. What are the distinct communities emerging within the networks and what is the importance of the weight of these communities when the global network involving the central carriers is considered?
Results
The Network Structure of Global Transshipment Events
The network graph drawn in Figure 3 shows the global transshipment events between 7 June 2015 and 6 June 20202 (excluding Russia-to-Russia) between carriers and fishing vessels. The graph includes a total of 12,322 events between 600 carriers, of which 130 are central, and 2,376 fishing vessels. The network graph shows distinct clusters of global transshipment activity as well as the strength of connections between actors. Specifically, three distinct clusters of transshipment activity are observed, which fall within the upper right and lower left parts of the network graph. These clusters are the result of actors primarily engaging in transshipment activities with other nodes or actors (i.e., carriers and fishing vessels) within that compartment, or section of the graph. Outside of such compartments, these actors engage in fewer activities and have less connections to other nodes in the entire network. Several actors, including central carriers, were identified in these clusters as shown in the lower right section of the network graph. These actors have distinctly strong connections as represented by the boldness of the lines between them.
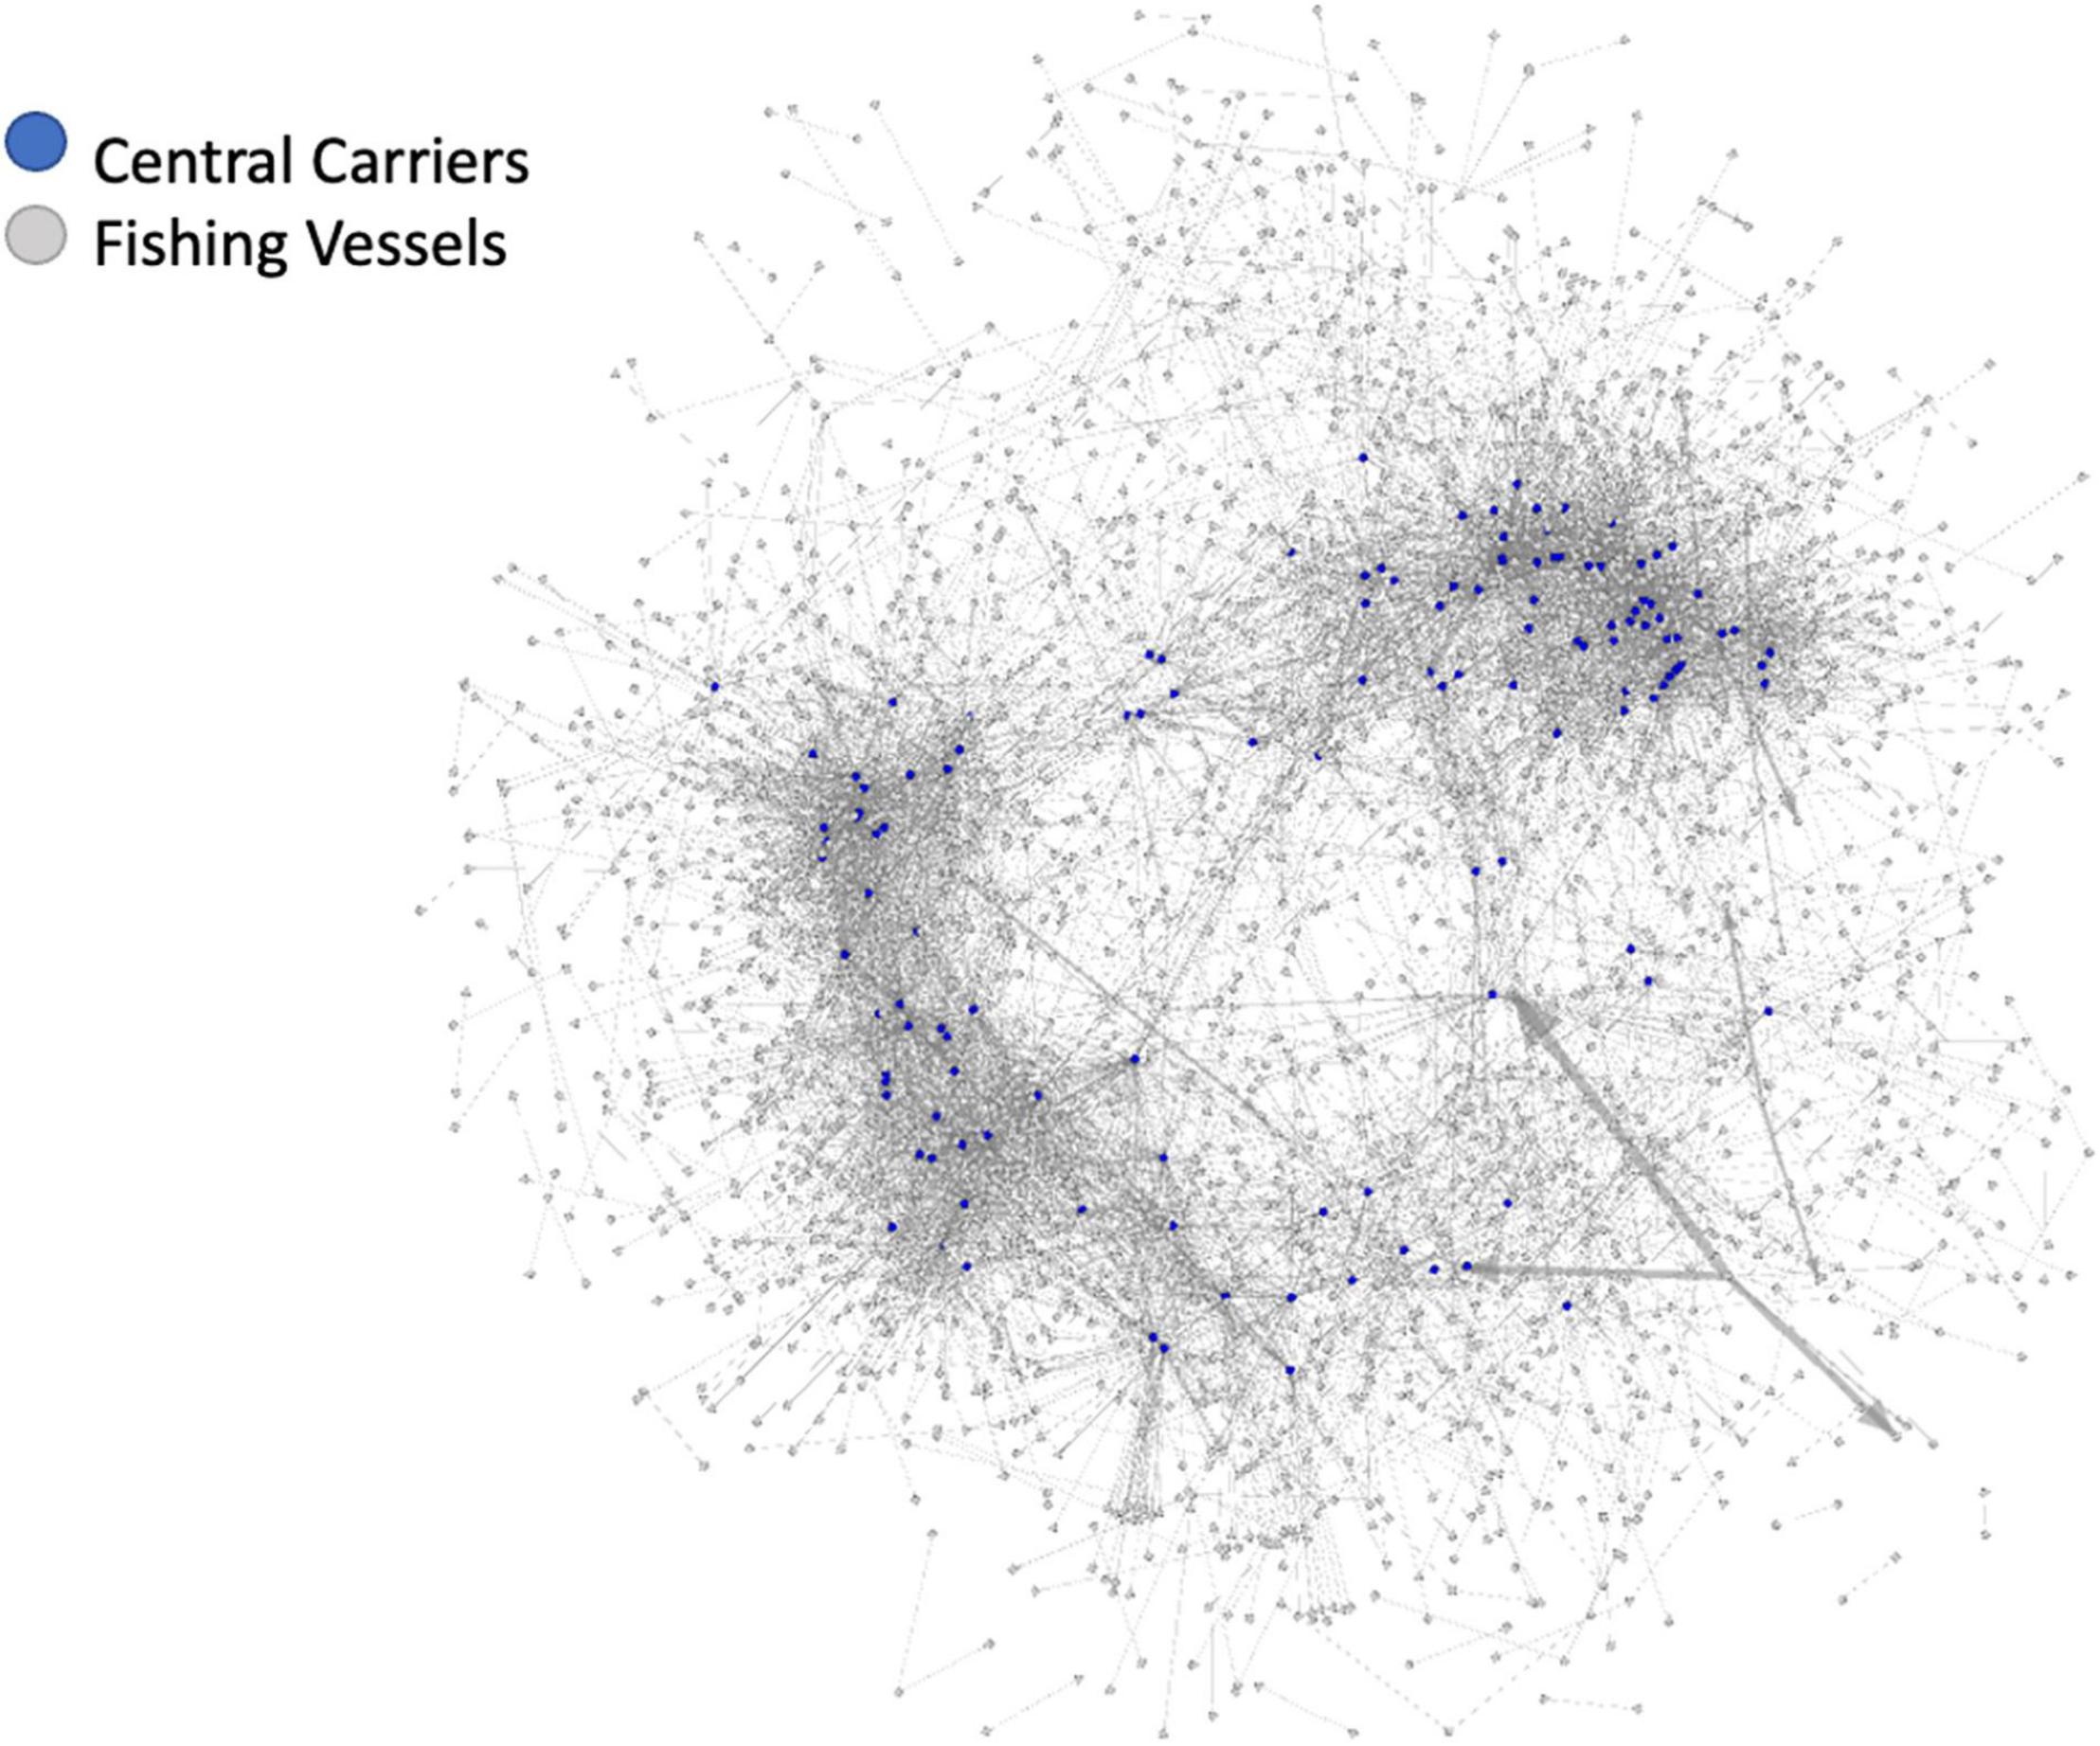
Figure 3. Network graph of global transshipment events.
The Network Structure of the Transshipment Events Involving Central Carriers
The network graph shown in Figure 4 displays the global transshipment events between 7 June 2015 and 6 June 2020 (excluding Russia-to-Russia) between the 130 carriers and fishing vessels only. The graph includes a total of 8,840 events between these 130 central carriers and 1,831 fishing vessels with which they interacted. Based on the network graph, a total of three distinct clusters as well as strengths of connections can be identified between the actors. Specifically, three clusters fall within the lower right and lower left parts of the network graph. Several actors demonstrate distinctly strong connections as shown by the boldness of the lines between them.
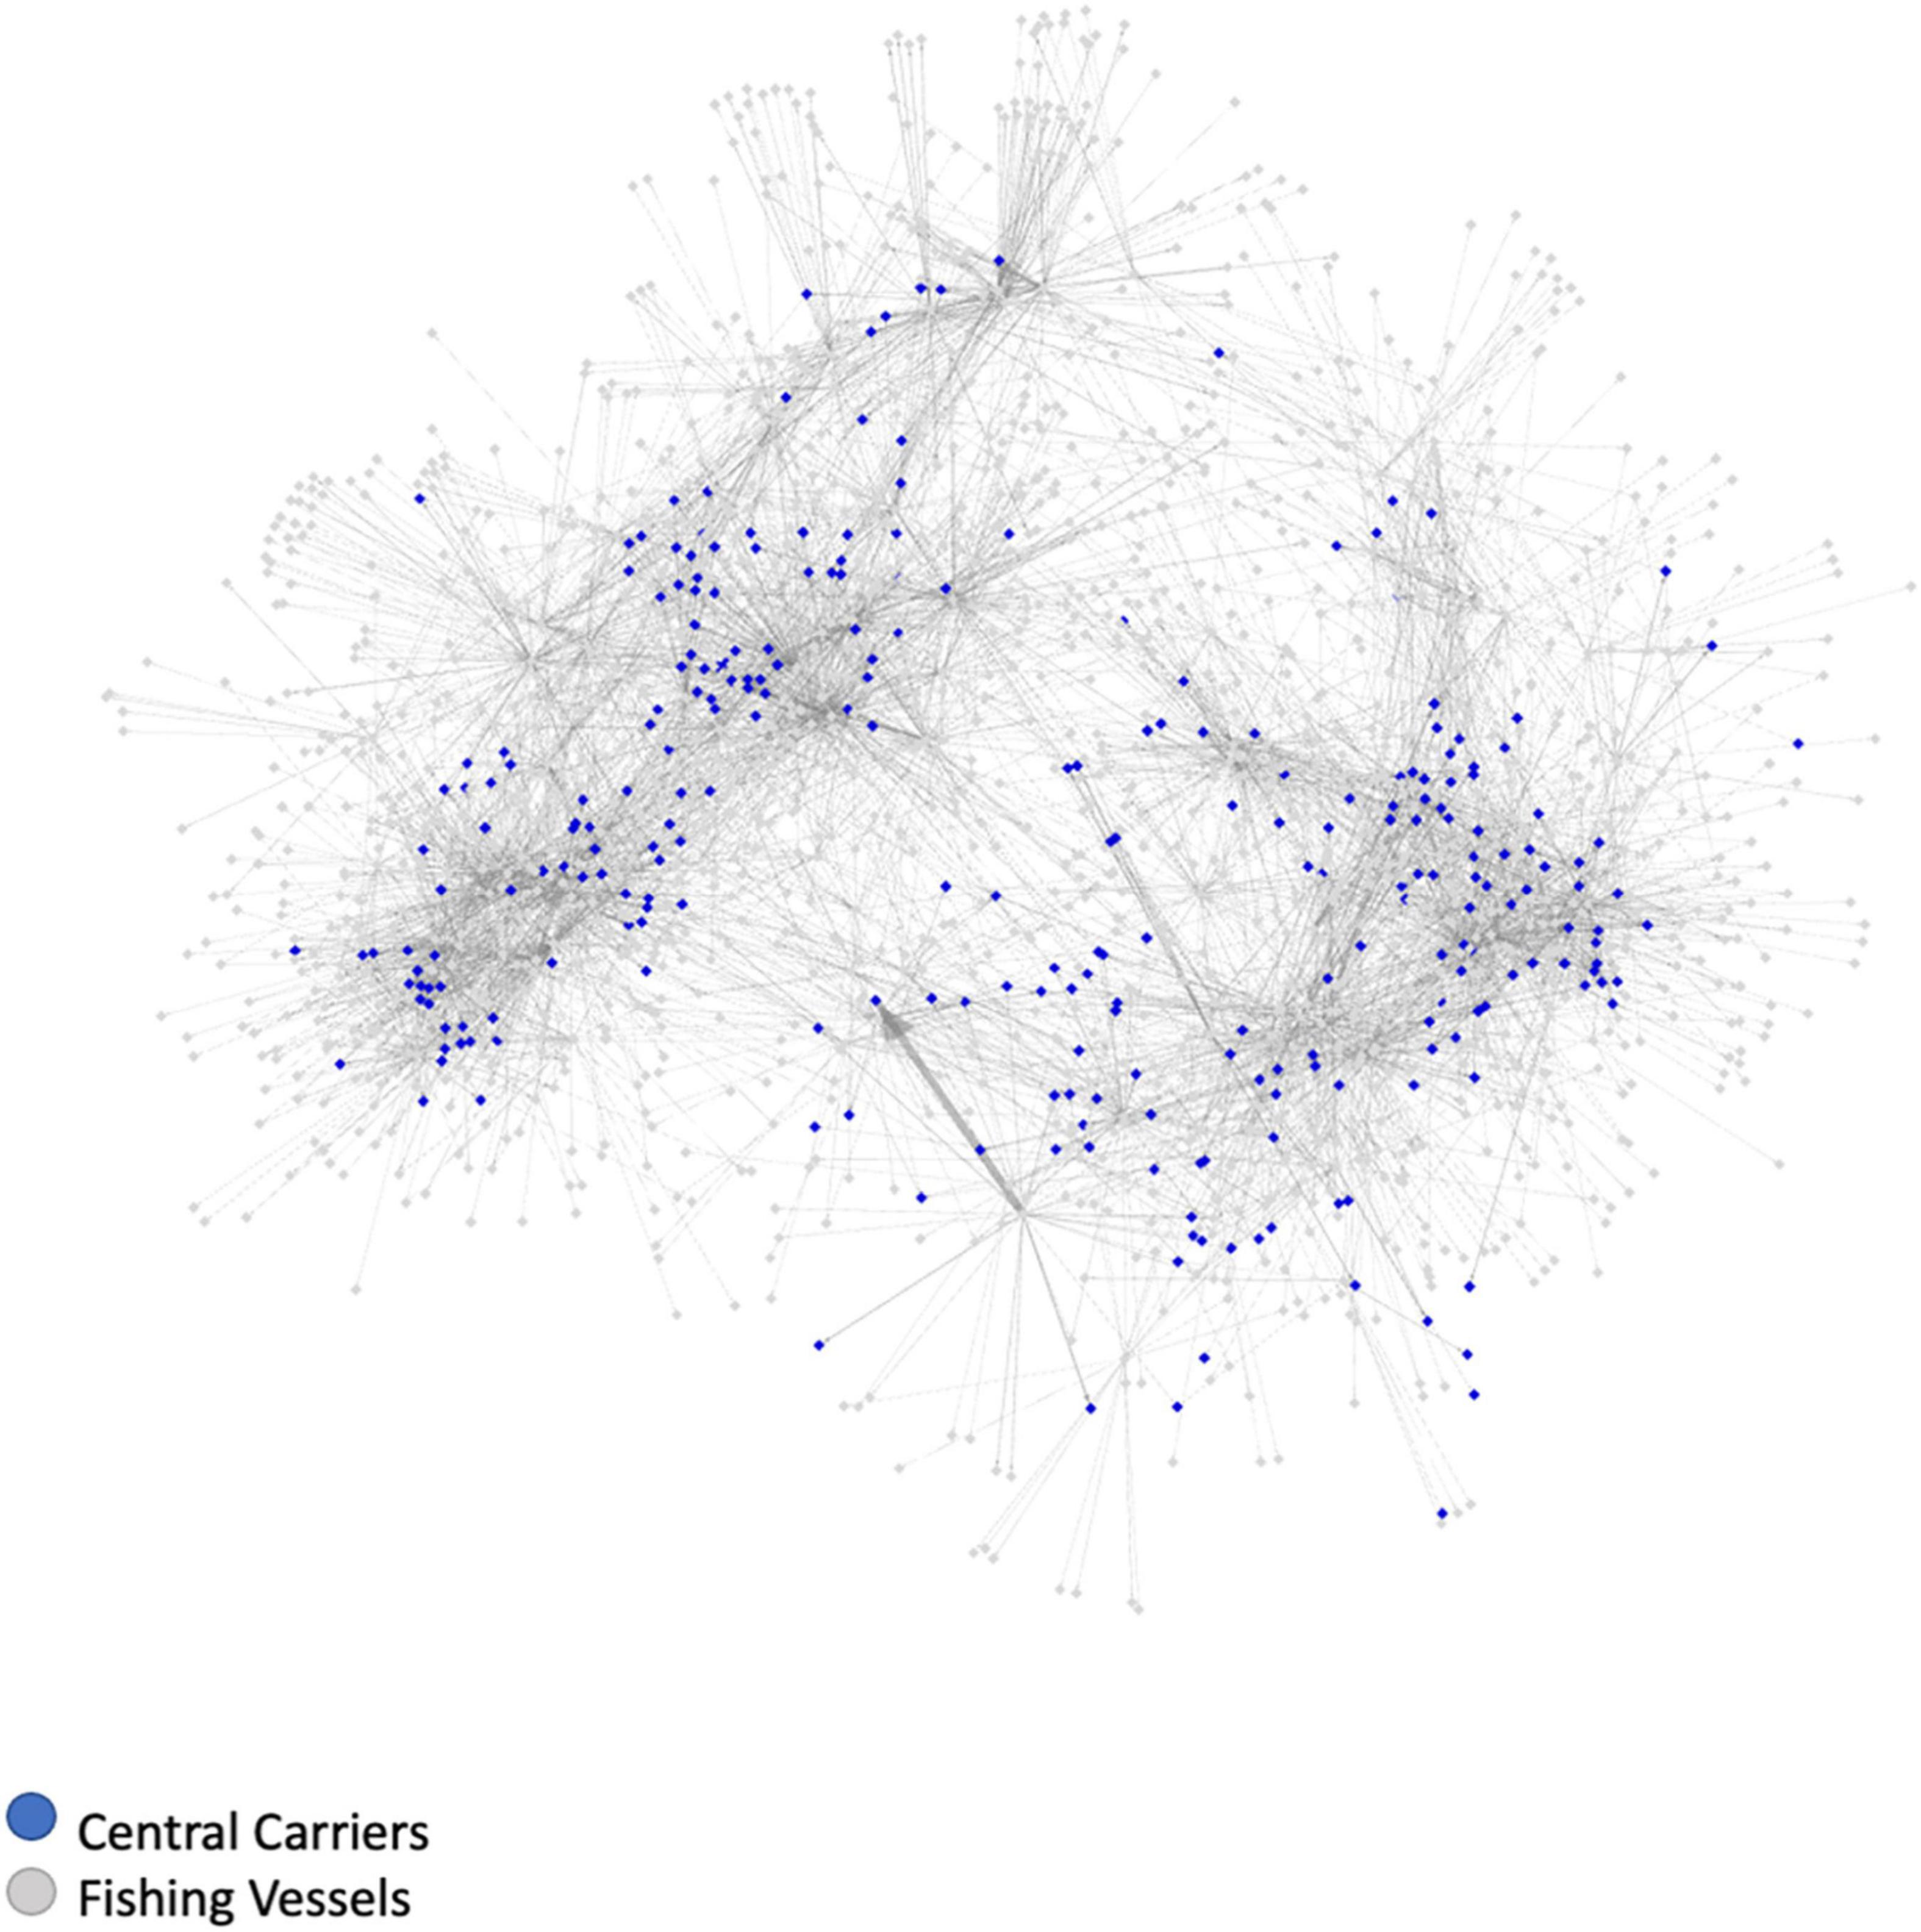
Figure 4. Network graph of global transshipment events involving 130 central carriers only.
The Spatial Distribution of the Transshipment Events Involving Central Carriers
As indicated earlier, only 130 central carriers (22% of all the carriers) within this global network accounted for a total of 8,840 (72%) of all the events within the network. The spatial analyses performed in this section specifically examine the global scale of the concentrations of the activities involving these 130 carriers. The map in Figure 5 shows the density of the concentrations of their activities represented by standard deviations from the mean (i.e., mean number of points within each grid cell). The higher standard deviations from the mean indicate higher concentration/density of the activity within it.
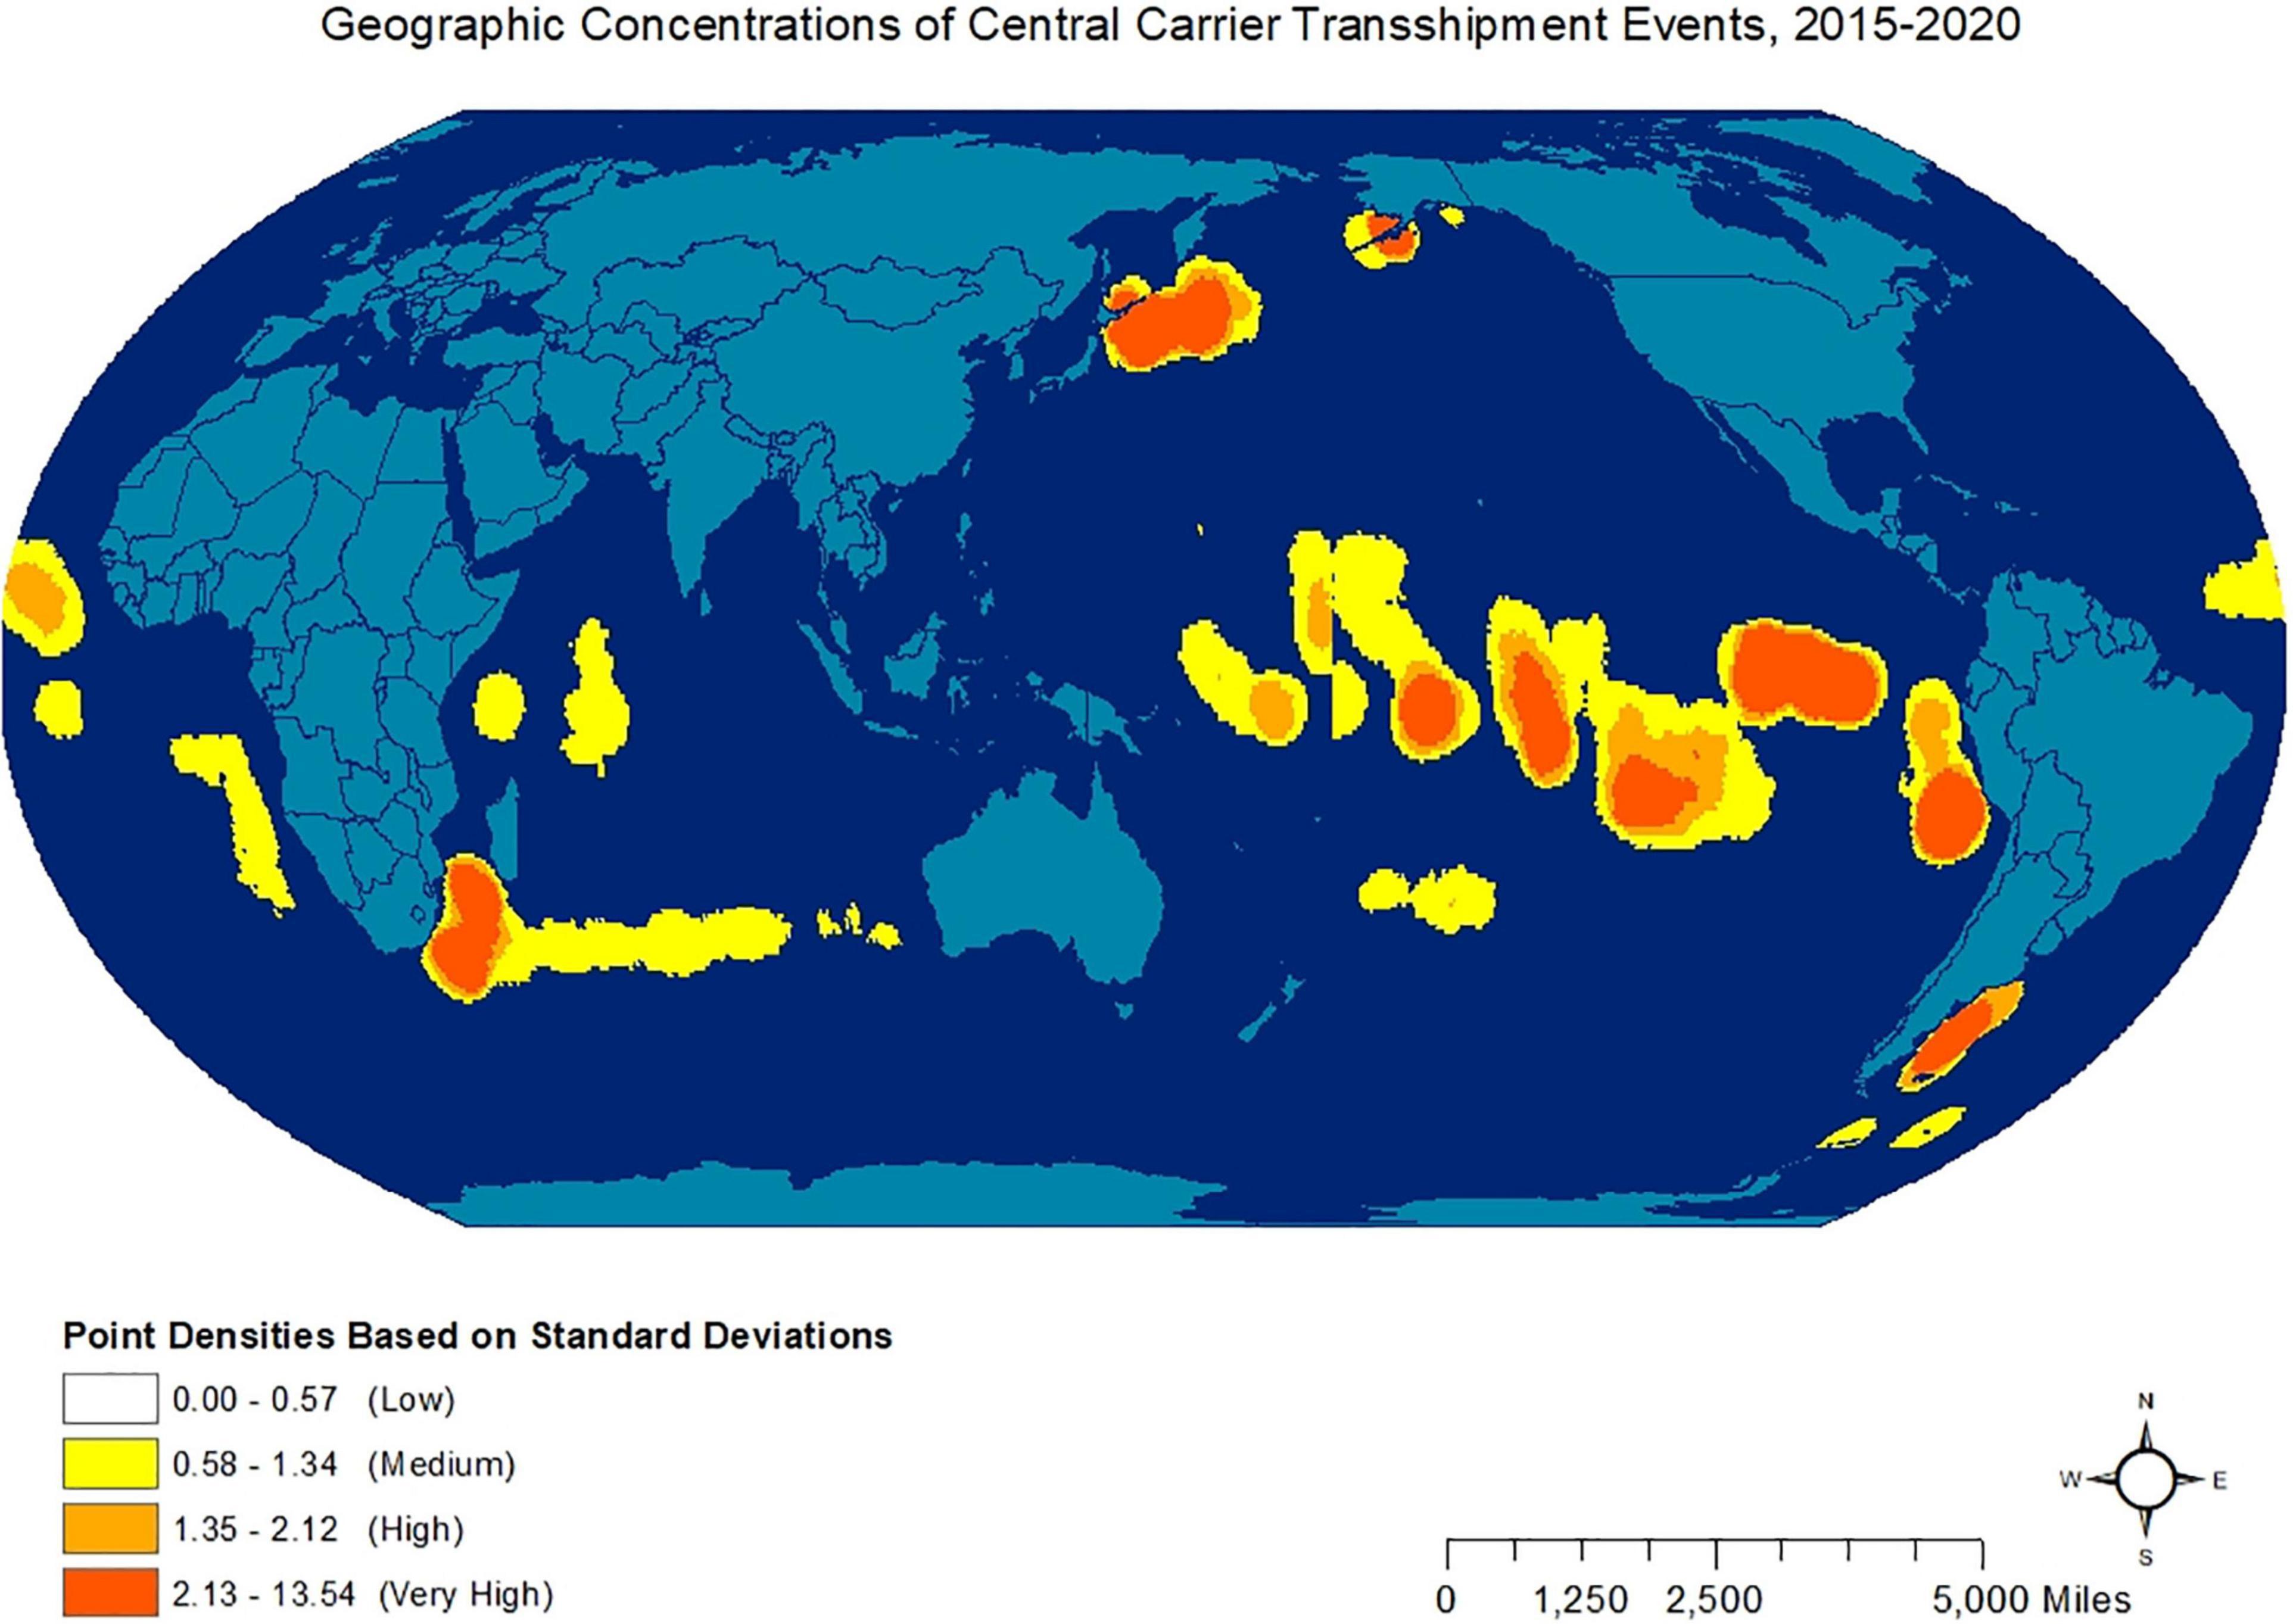
Figure 5. Transhipment events, 2015–2020.
The activities of the 130 central carriers are concentrated primarily in the Eastern Central Pacific (FAO area 77) and the northern section of the Southeast Pacific (FAO are 87) regions. A notable proportion of these activities takes place within the exclusive economic zones (EEZs) of the Pacific Islands, especially within the EEZs of such States and territories as Papua New Guinea, Nauru, Solomon Islands, Kiribati, Howland Island and Baker Island, Johnston Atoll, Marshall Islands, Phoenix Group, Tokelau, Cook Islands, and Jarvis Island. One of the highest concentrations of transshipment activities involving central carriers occurs within and immediately outside of an area pocketed between Phoenix Group, Tokelau, Cook Islands, and Jarvis Island; in a pocketed area between Line Group and French Polynesia; and within the outskirts of Pitcairn. In South America, Peru and Argentina, and to some extent Ecuador see transshipment events within their EEZs, while in Africa, such activities are most prominent in the EEZ of South Africa and to some extent Madagascar and Mozambique. In the West African coastline (i.e., the East Central Atlantic, FAO area 34), the activities of central carriers are primarily within the immediate outskirts of the EEZs of the countries. Transshipments involving central carriers are also prevalent in both the Western and Eastern Oceans (FAO areas 51 and 57, respectively), as well as the Northern Pacific (FAO are 61) and Western Central Pacific (FAO area 71) regions.
Flag-Based Networks
In order to better understand the prevalence of the types of flags the 130 central carrier and associated fishing vessels use in the global transshipment events, this research built two sets of graphs: a flag-based network graph showing the presence and the strength of the connections between flags, and a network graph that shows the volume of interaction between the top 20 most common flag pairings. Based on Figure 6A, vessels carrying the flag of Panama emerged as those with the strongest connections. The vessels carrying the flag of Panama have many connections with vessels flagged to other countries. Those vessels have an especially strong connection with those flagged to China and Thailand, as indicated by the density or thickness of the edges or the lines connecting them. The dark teal “community” in Figure 6A accounted for the 60.6% of the events, while the medium teal (second dominant community) involved 24.2% of these events.
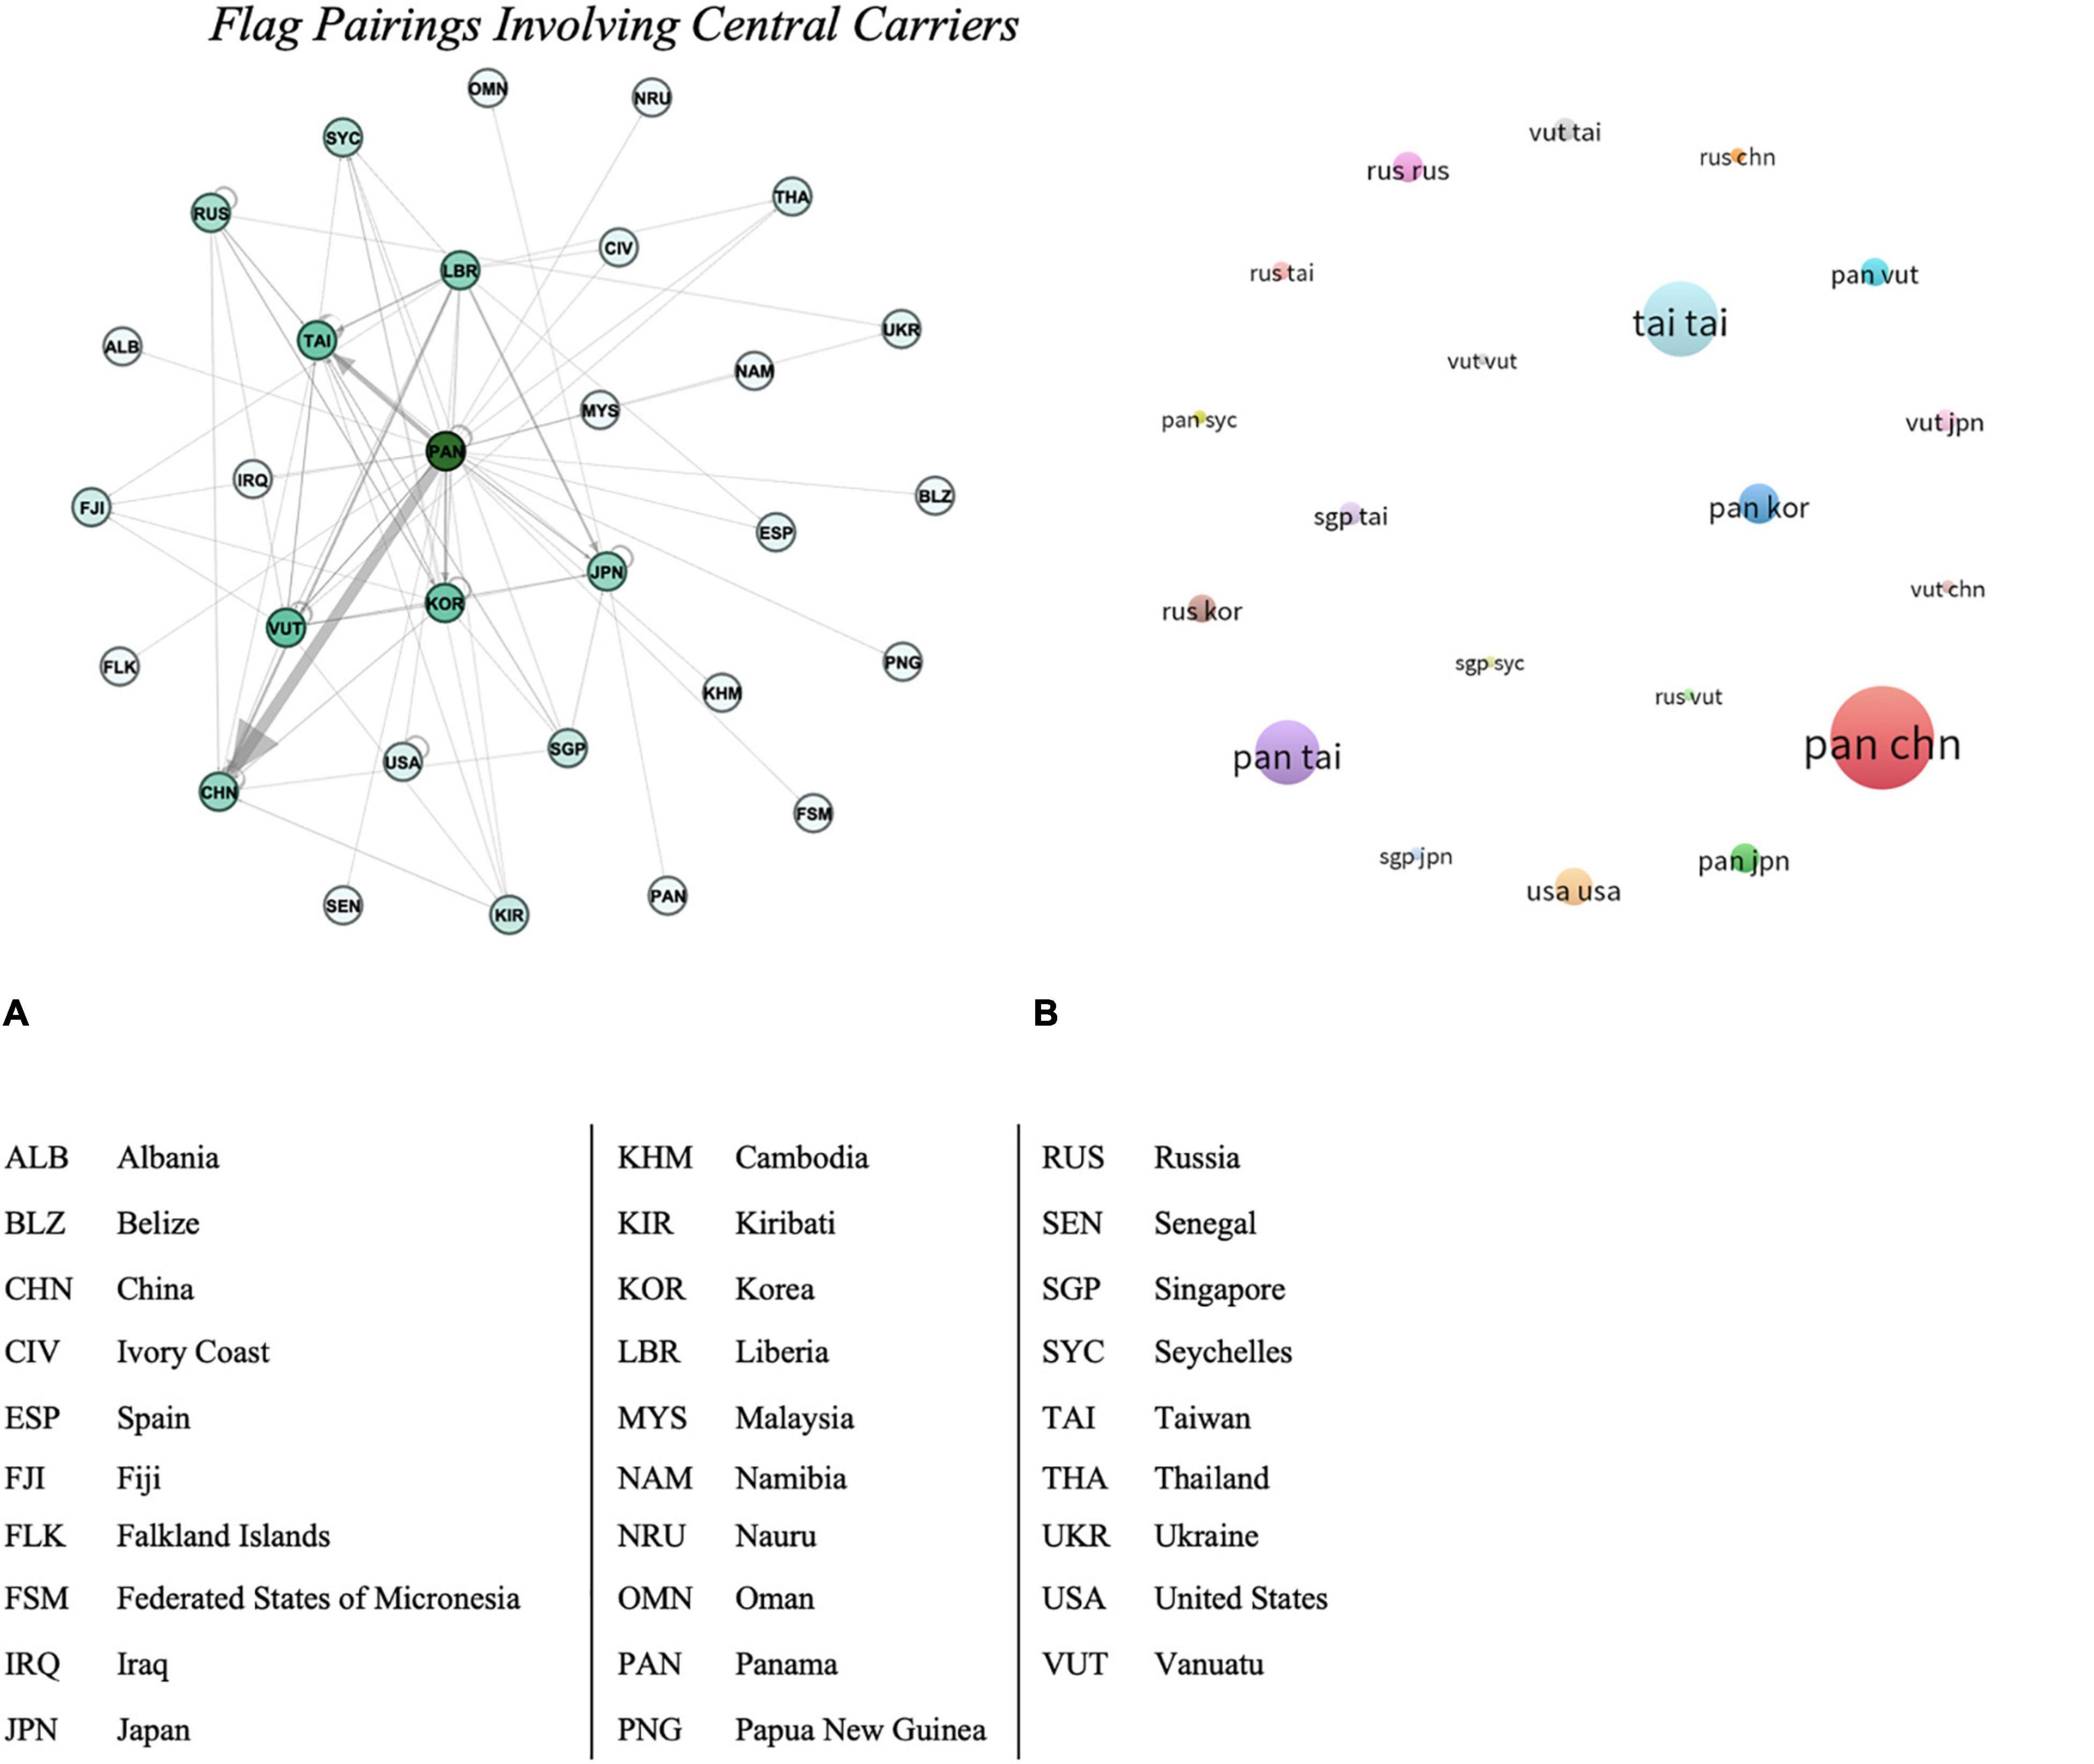
Figure 6. Flag pairings involving central carriers. (A) Flag-based network of transshipment events involving central carriers. (B) Top 20 flag pairings involving central carrier and fishing vessels.
Figure 6B quantifies the relationship between the pairs of flags that these vessels carried. The Panama ↔ China relationship comprised a total of 2,082 transshipment events, or roughly 24% of all the transshipment events involving central carriers (represented by the size of the circle in the graph). Moreover, a total of 13% (1,109 encounters) of the events involved Taiwan ↔ Taiwan flag pairs, 9% (812) – Panama ↔ Taiwan; and 4% (318) – Panama ↔ South Korea flag pairs. The remaining notable pairs include United States ↔ United States; Panama ↔ Japan; Russia ↔ South Korea; Panama ↔ Vanuatu; and Singapore ↔ Taiwan.
Additionally, based on Figure 7, which shows the geographic distribution of the activities of these four primary pairs of flags of vessels involving central carriers and fishing vessels, it is evident that these activities take place in distinct areas. For example, the transshipment events involving Panama ↔ China flags take place primarily in the Southeast Pacific (FAO area 87); whereas the Taiwan ↔ Taiwan transshipment events take place primarily in the Western Indian Ocean (FAO area 51). The geographic distribution of the transshipment events involving Panama ↔ Taiwan, and Panama ↔ South Korea is less spatially concentrated.
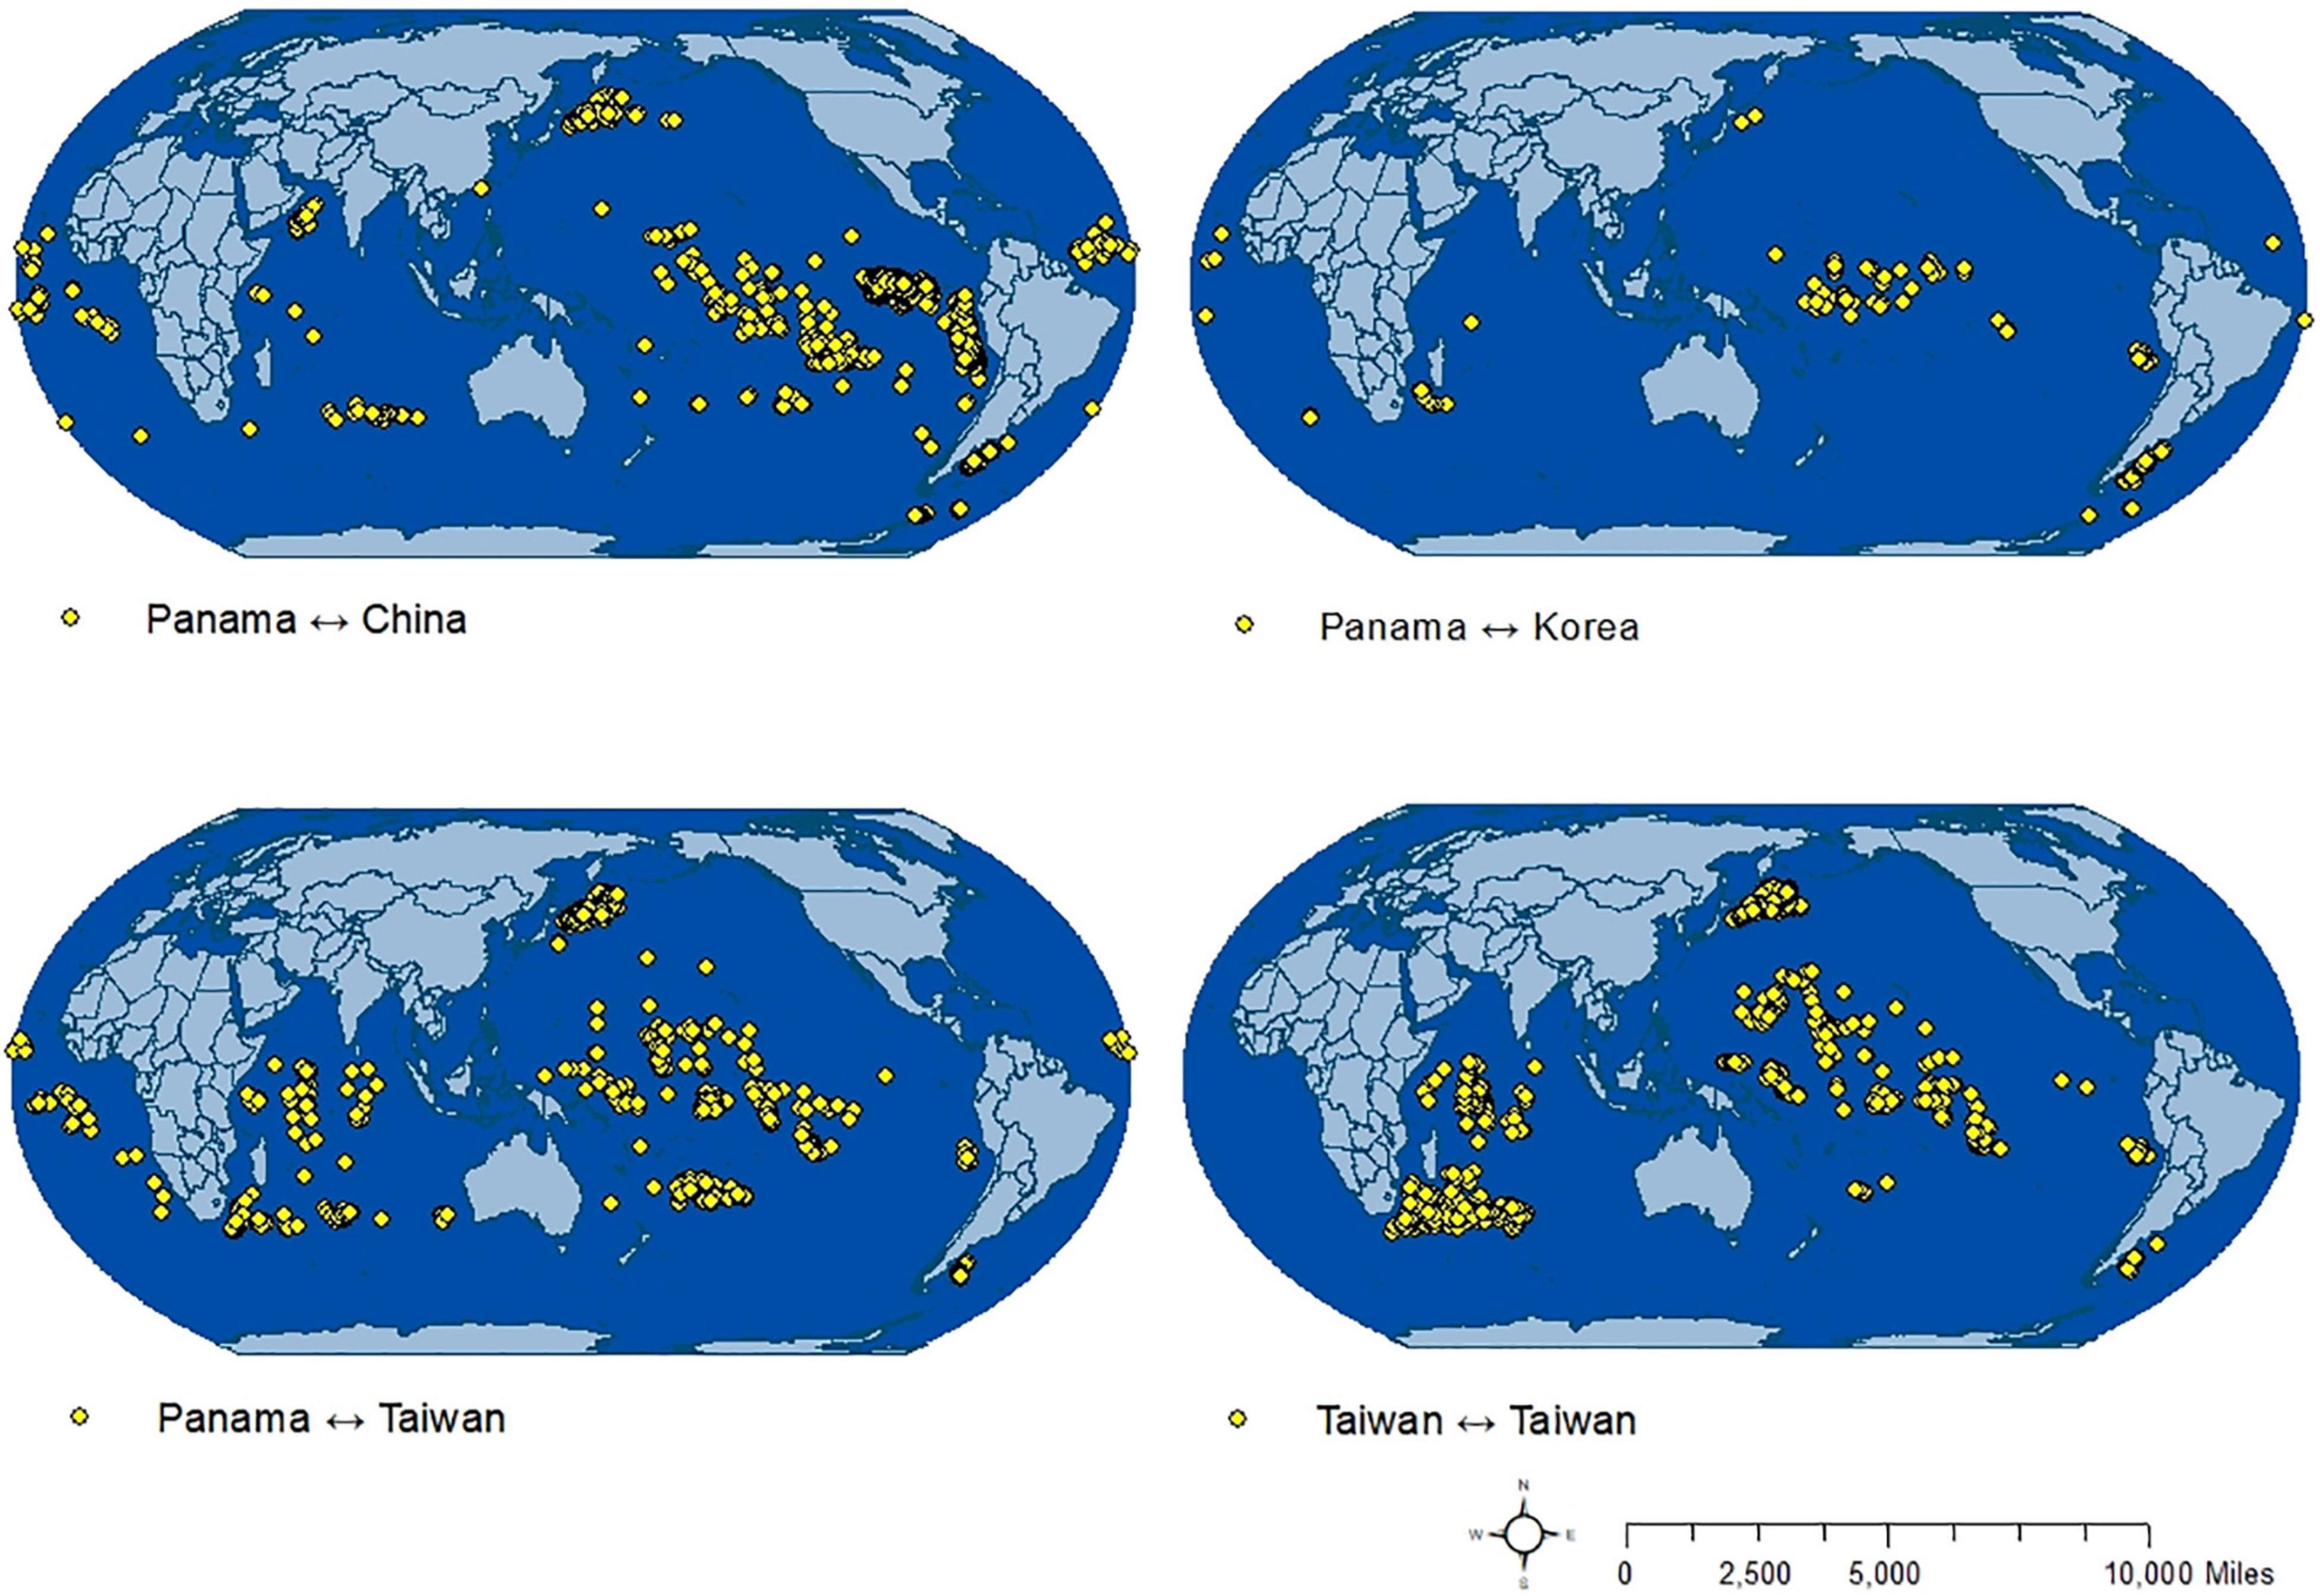
Figure 7. Geographic distribution of the activities of the vessels carrying the top four flag pairs.
Identifying Individual Communities by Modularity Class
A modularity analysis was performed to better understand the distribution and strength of different clusters of transshipment events. The modularity analysis conducted in this graph identified a total of twelve distinct communities that emerged with varying weights of importance to the overall global network involved in transshipment events between central carriers and fishing vessels. Three of those communities were identified as being principal in the network structure, collectively accounting for almost 49% of all activities within the network involving these actors. Of those concentrations of transshipment activity, Community “A” accounted for 22.73% of the relationships in the entire network, thus comprising the highest percentage of transshipment events. The number of associations that occurred within community “A” is followed by Community “B” (14.73%) and Community “C” (11.37%). The remaining nine communities combined accounted for about 51% of the activities of the entire network.
The following section provides a breakdown of each of the three top communities identified through modularity analyses. We present additional qualitative information that includes the vessel’s MMSI, IMO, name, associated flag and owner of the central actors located within each of the principal communities. We have also assessed the geographic spread of the activities of the carrier and fishing vessels for these communities.
Community “A”
Community “A” accounted for 22.73% of the connections (transshipment events) in the entire network (Figure 8). Actors within this community engaged in a total of 2,073 transshipment events involving 446 actors in the network, of which 23 were central carriers. Additional basic information on the central carriers located within this community is provided in Table 1. The central carriers in Community “A” are primarily flagged to Panama (N = 9), followed by Liberia (N = 8). As for ownership, three (3) of the vessels are flagged to Yamane Sangyo KK, while another two (2) are flagged to Taiseimaru Kaiun KK and Wang Tat Corp. Pte. Ltd., each. Figure 8 also shows the geographic spread of the activities of the carrier and fishing vessels. As shown, these activities cross multiple oceans and are clustered in the Western and Eastern Central Pacific regions (FAO Areas 71 and 77, respectively); Western and Eastern Indian Ocean (FAO Areas 51 and 57, respectively), as well as the Eastern Central and Southeast Atlantic (FAO Areas 34 and 47, respectively). It is worth mentioning that the transshipment events between the carriers and fishing vessels within this community take place within relatively close proximity to the exclusive economic zones of the countries on the Western African coast.
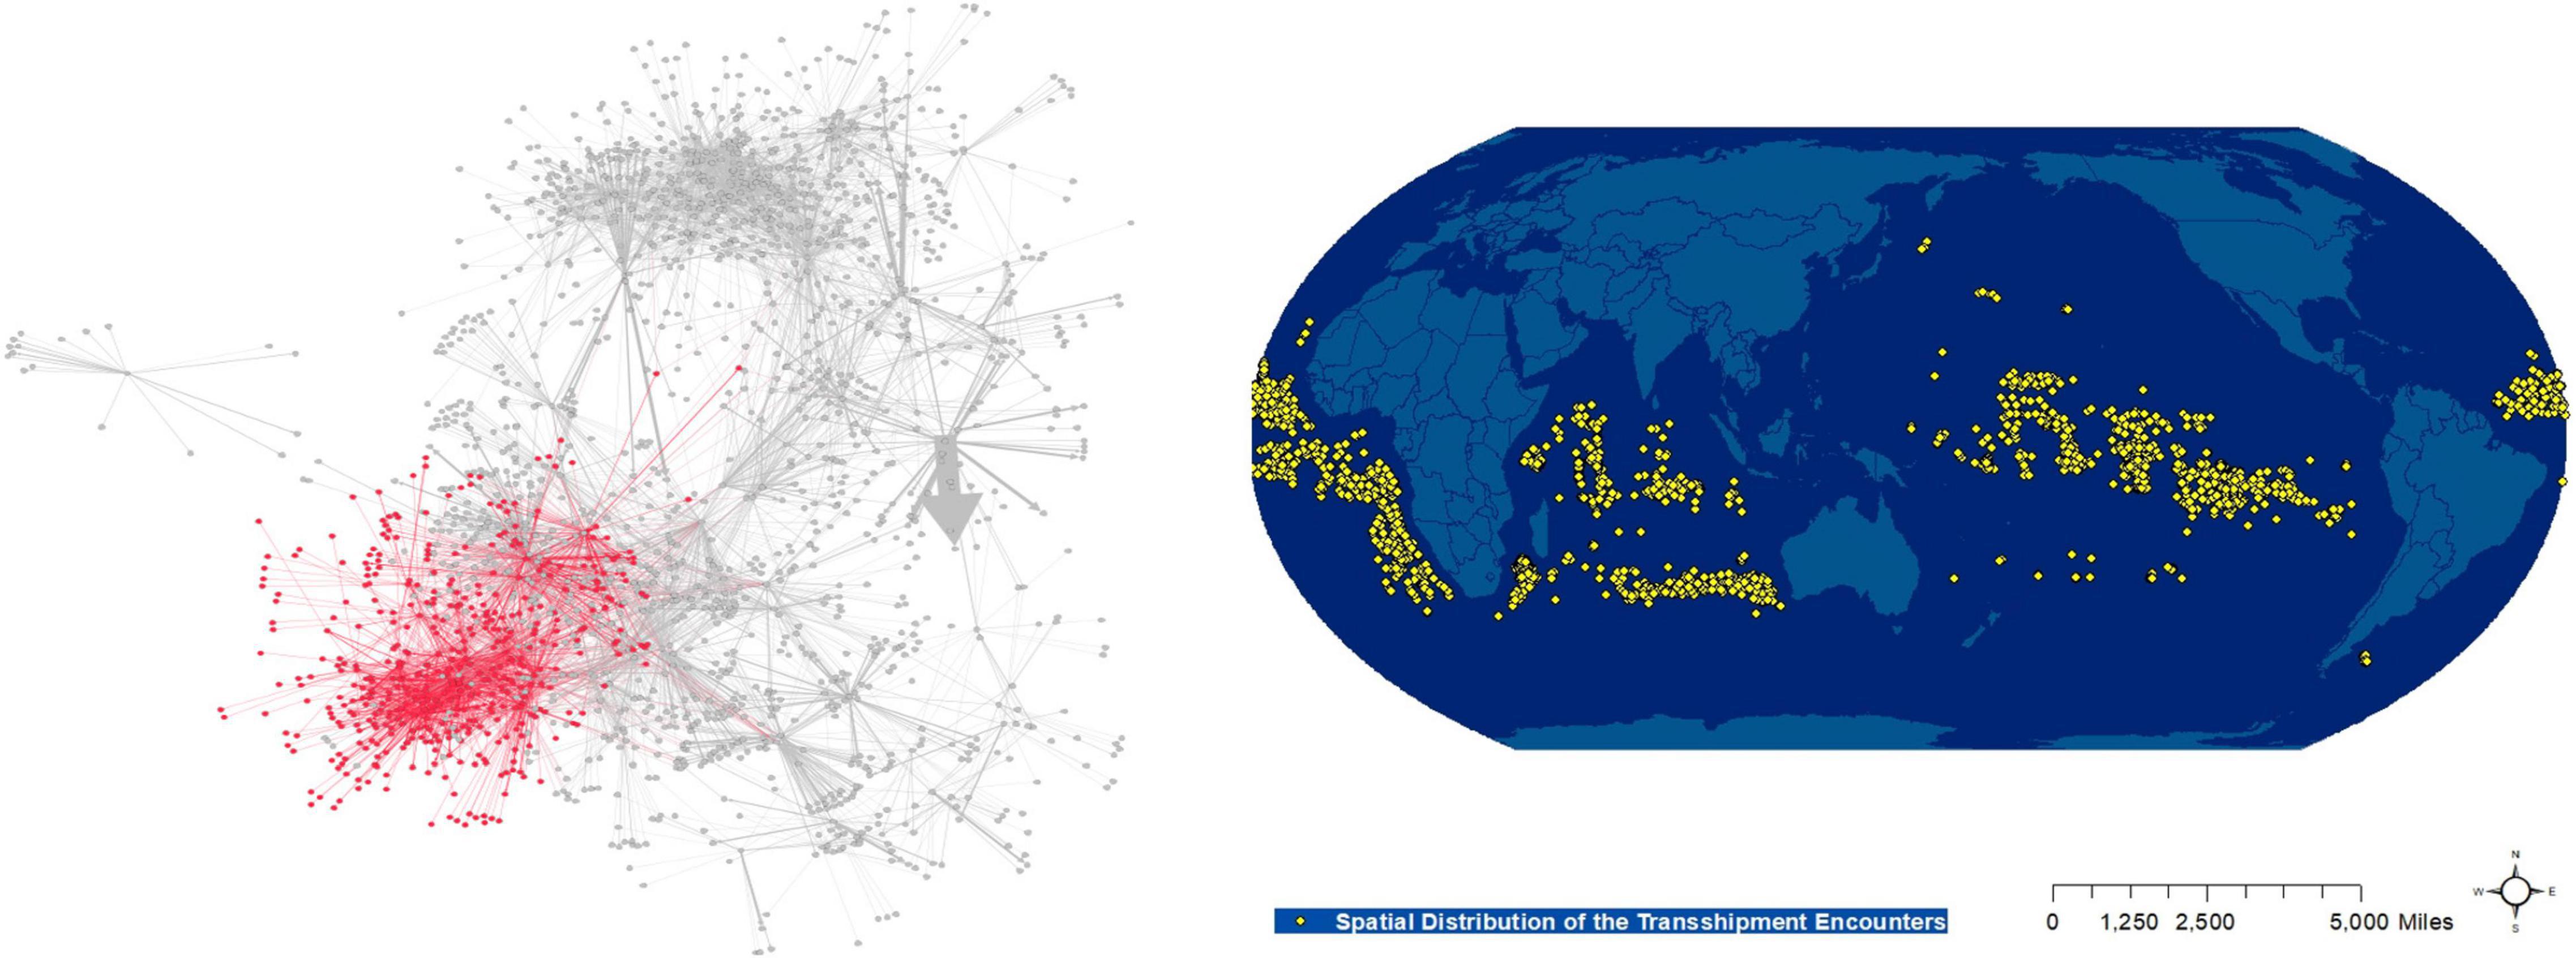
Figure 8. Network graph and geographic distributions of potential transshipment encounters between actors within Community “A” (June, 2015–June, 2020). The red color in the network graph to the left indicates the nodes and their links between the central carriers and fishing vessels identified as part of Community “A”. The map to the right displays the spatial distribution of their activities.
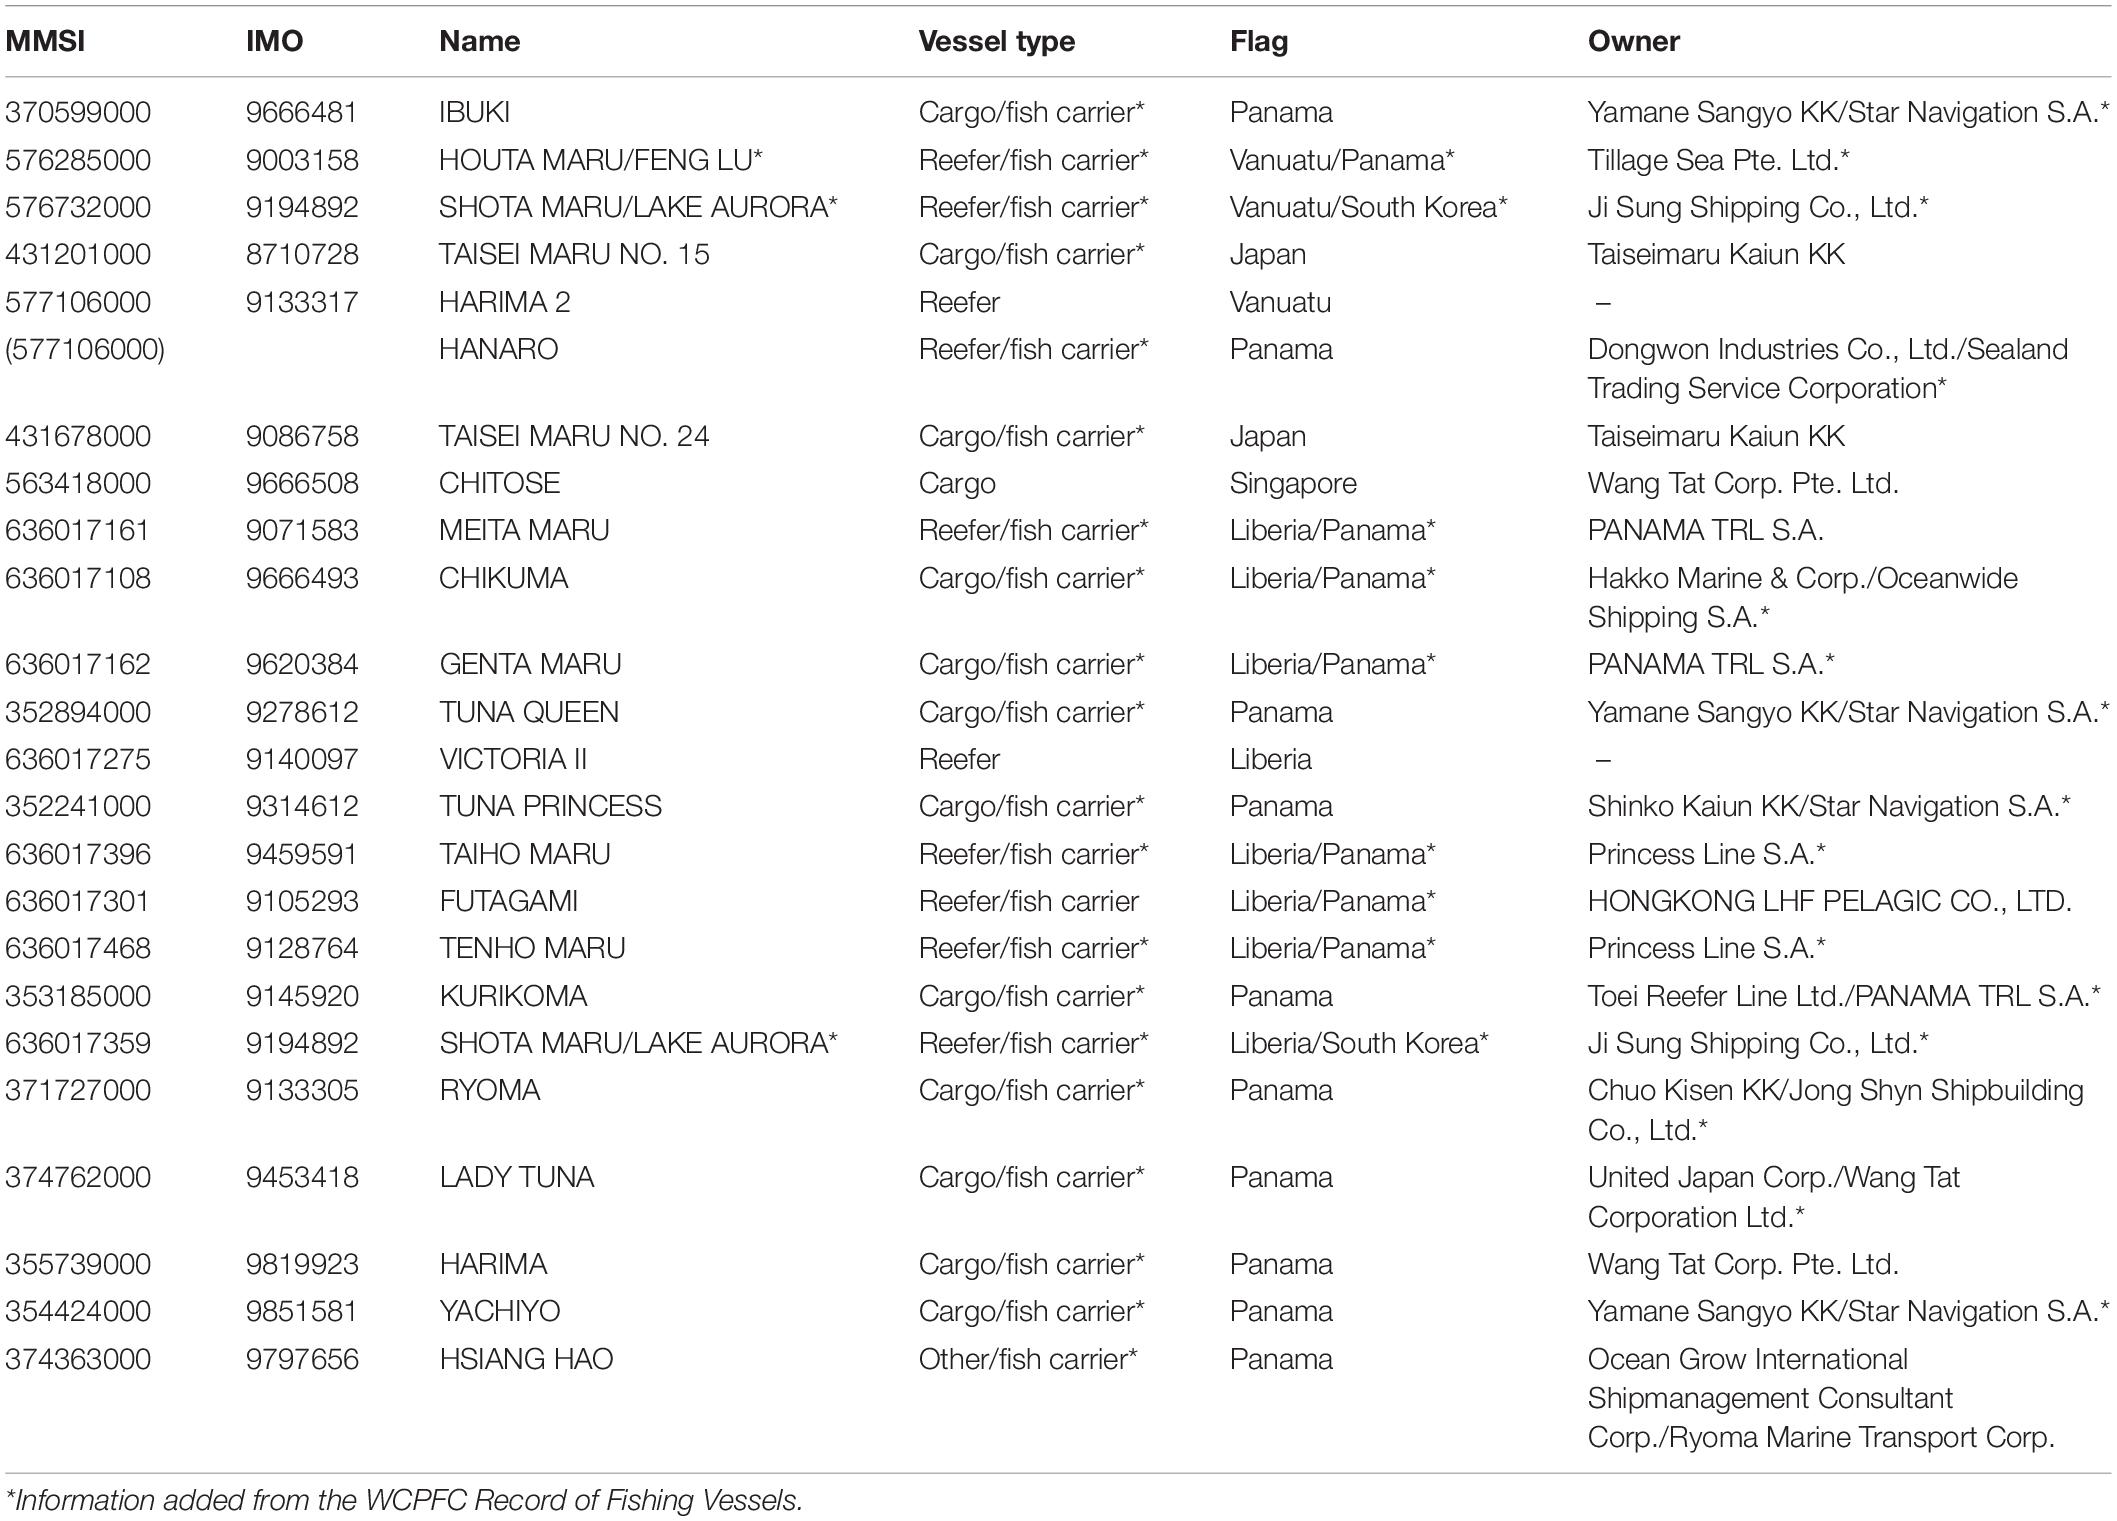
Table 1. Central carriers involved in Community “A”.
Community “B”
Community “B” accounted for 14.73% of all connections and 1,210 transshipment events involving 289 actors in the network, of which 12 were central carriers (Figure 9). When compared to other principal communities, this group contained the second highest proportion of transshipment events. Table 2 provides additional information on the central carriers located within this group. The central carriers in this community are flagged only to two states: Panama (N = 4) and Taiwan (N = 8). These vessels have rather diverse ownership, as only two are owned by the same company, being Tunago Shipping. Figure 9 also shows that the activities of the vessels within Community “B” are relatively confined in space when compared to those in Community “A,” however, they also cross several FAO areas, namely the Southern, Western, and Eastern Central Pacific (FAO Areas 81, 71, and 77, respectively), as well as the Western Indian Ocean (FAO Area 51). These activities are especially pronounced in the latter, demonstrating distinct clustering.
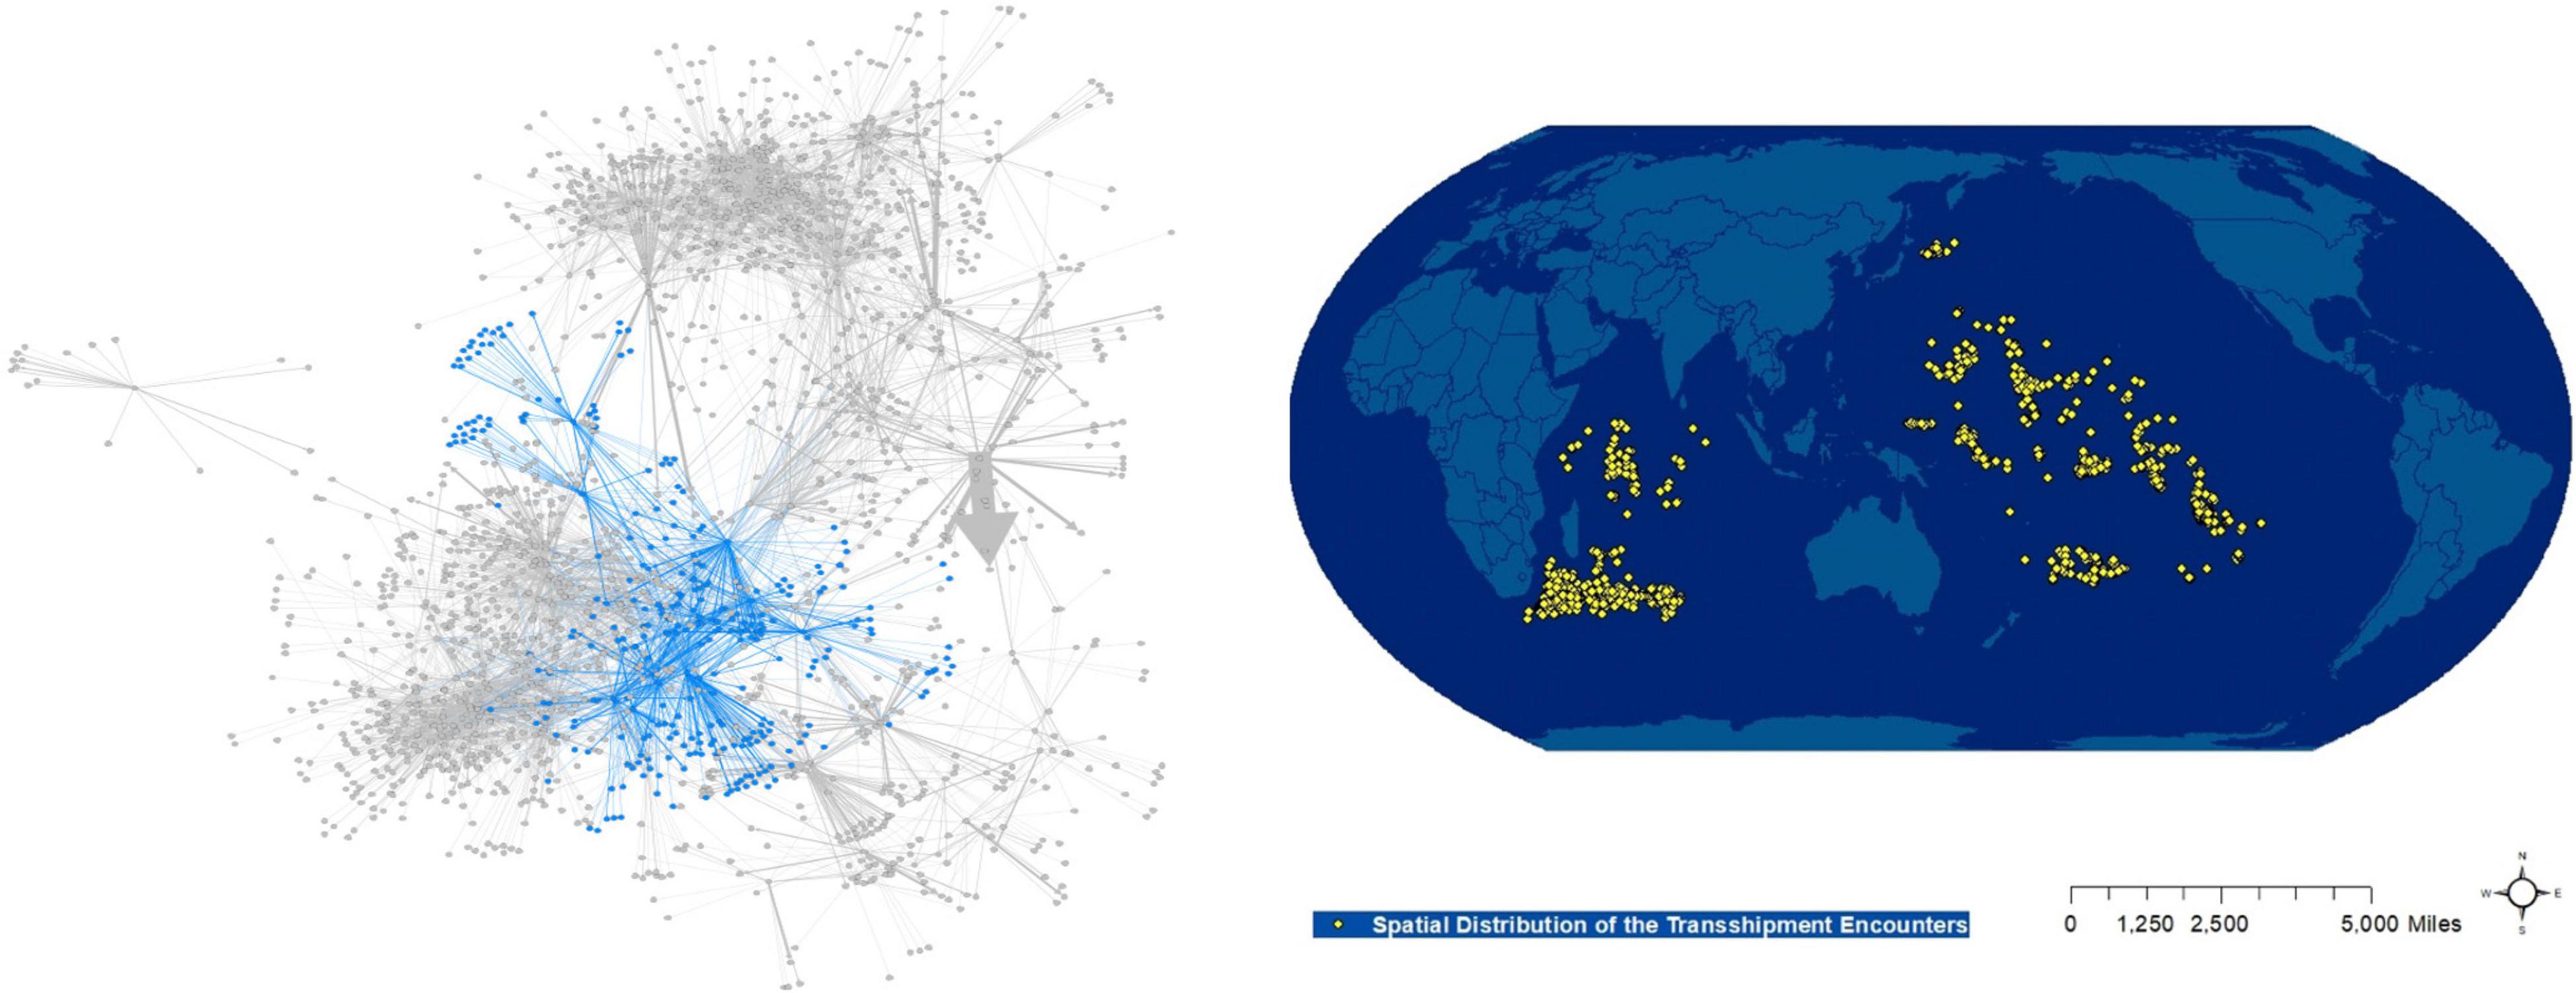
Figure 9. Network graphs and geographic distributions of transshipment encounters between actors within Community “B” (June, 2015–June, 2020). The blue color in the network graph to the left indicates the nodes and their link between the central carriers and fishing vessels identified as part of Community “B”. The map to the right displays the spatial distribution of their activities.
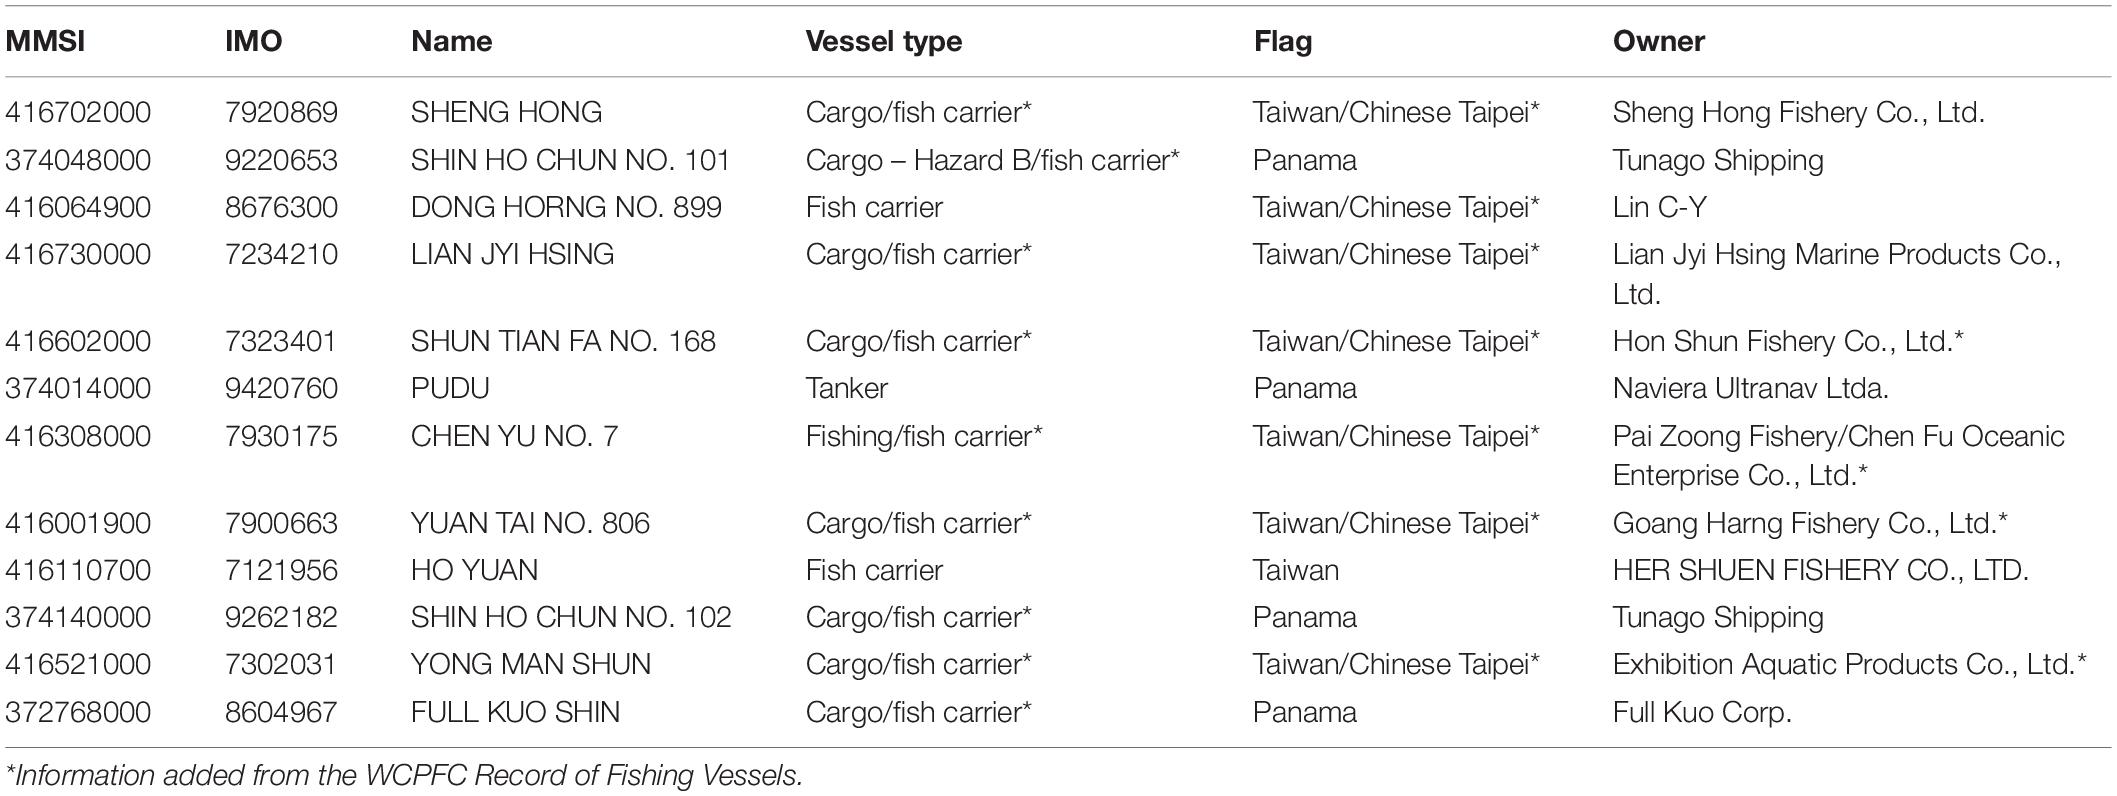
Table 2. Central carriers comprising Community “B”.
Community “C”
Community “C” accounted for 11.37% of all the activities in the larger network (Figure 10). In total, this community accounted for 545 transshipment events involving 223 actors in the network; five (5) of which were central carriers. When compared to the other principal communities, this group contained the third highest percentage of transshipment events. Table 3 provides additional information about the five central carriers identified within this community. The central carriers in this community are again flagged to just two states: Panama (N = 3) and China (N = 2). No repeat ownership is observed. Interestingly, however, the two Chinese flagged vessels share very similar names: Ping Tai Rong Leng1 and Pingtairongleng2 (formatted as registered). Figure 10 also presents the spatial distribution of the activities involving the vessels within this community. Overall, the spread is relatively unremarkable and is confined to the Western Central, Eastern Central and Southeast Pacific regions (FAO areas 71, 77, and 87, respectively), with a visible concentration of these activities clustering primarily within the Southeast Pacific region.
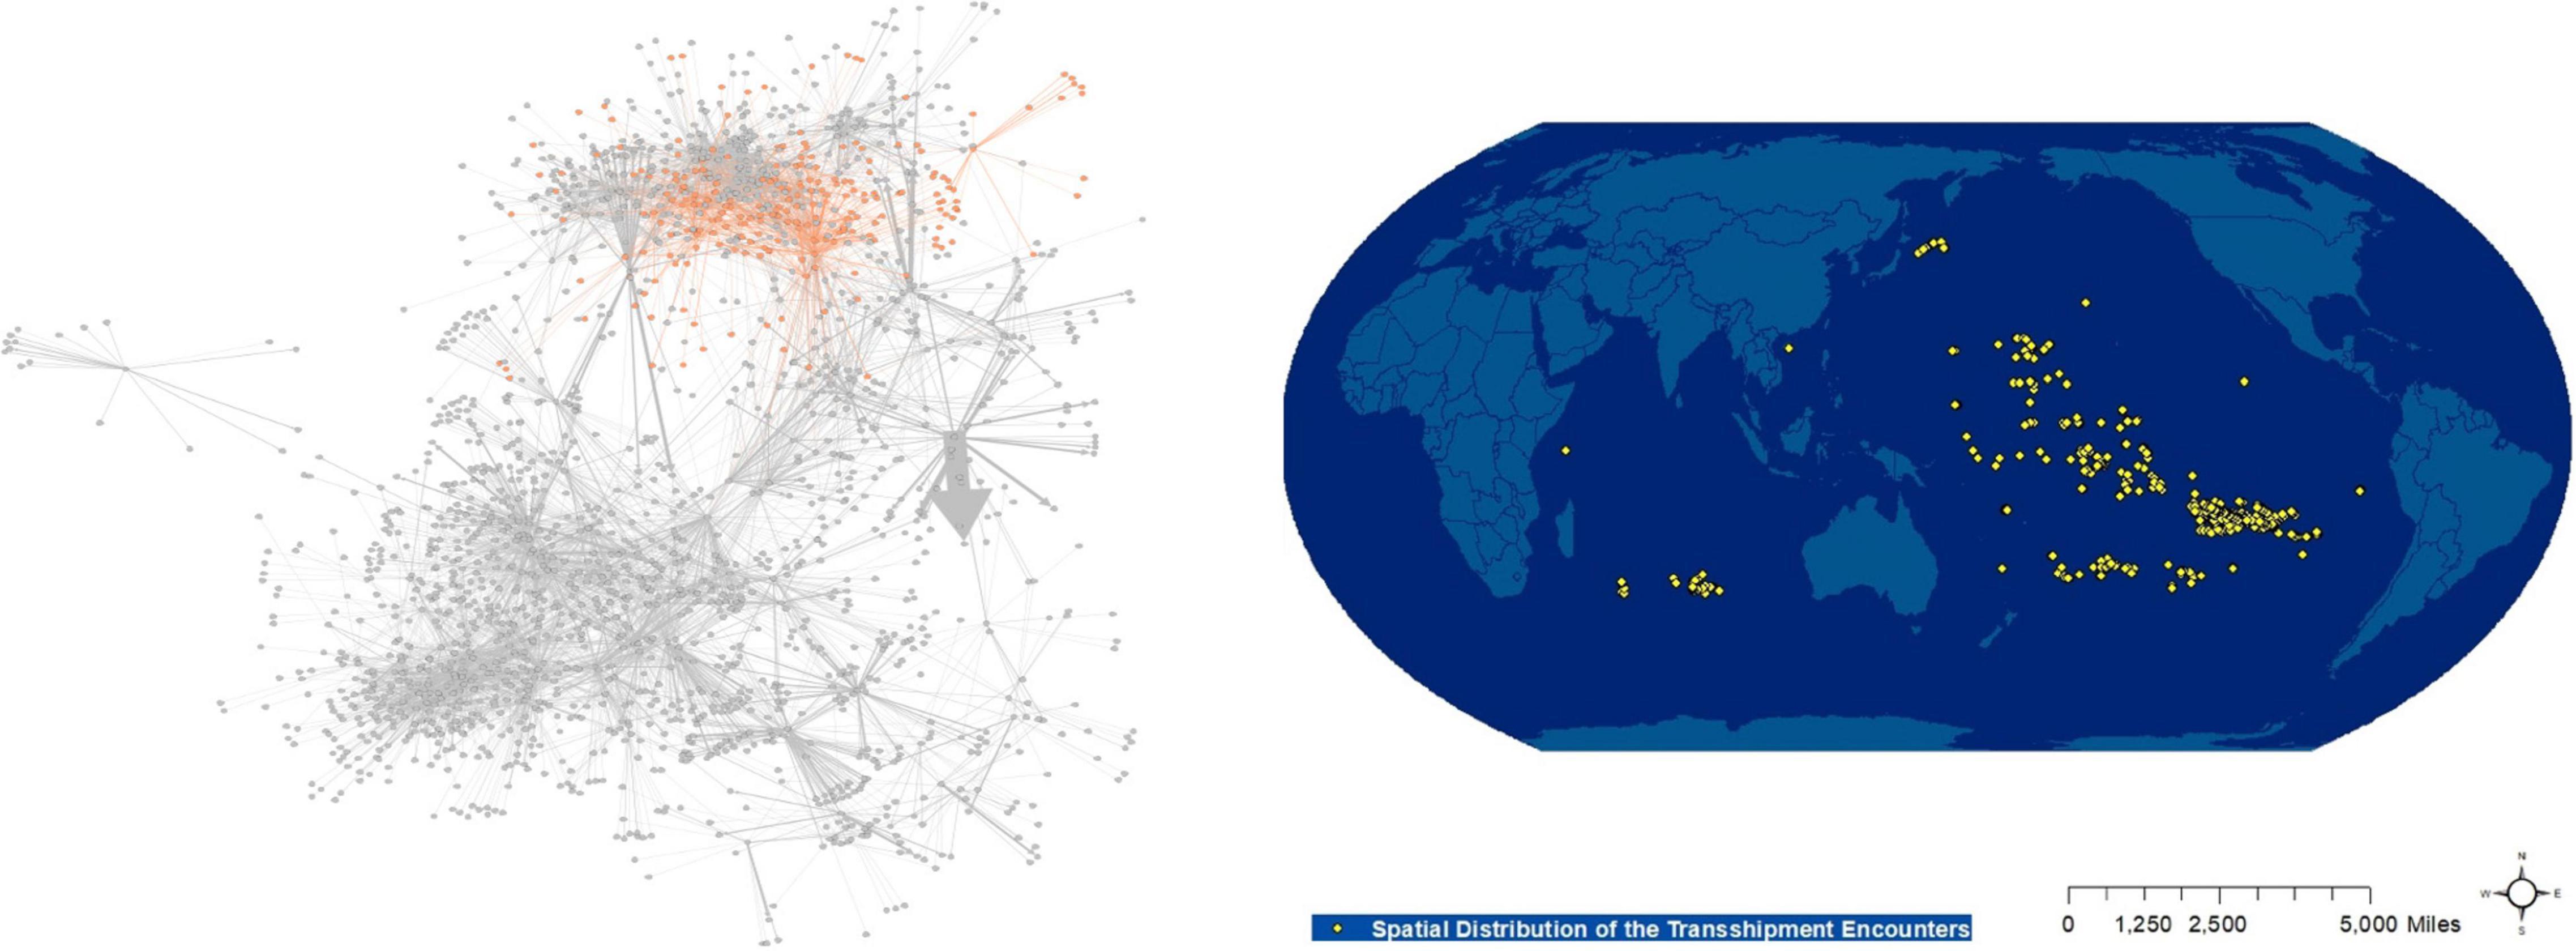
Figure 10. Network graphs and geographic distributions of transshipment encounters between actors within Community “C” (June, 2015–June, 2020). The orange color in the network graph to the left indicates the nodes and their links between the central carriers and fishing vessels identified as part of Community “C”. The map to the right displays the spatial distribution of their activities.
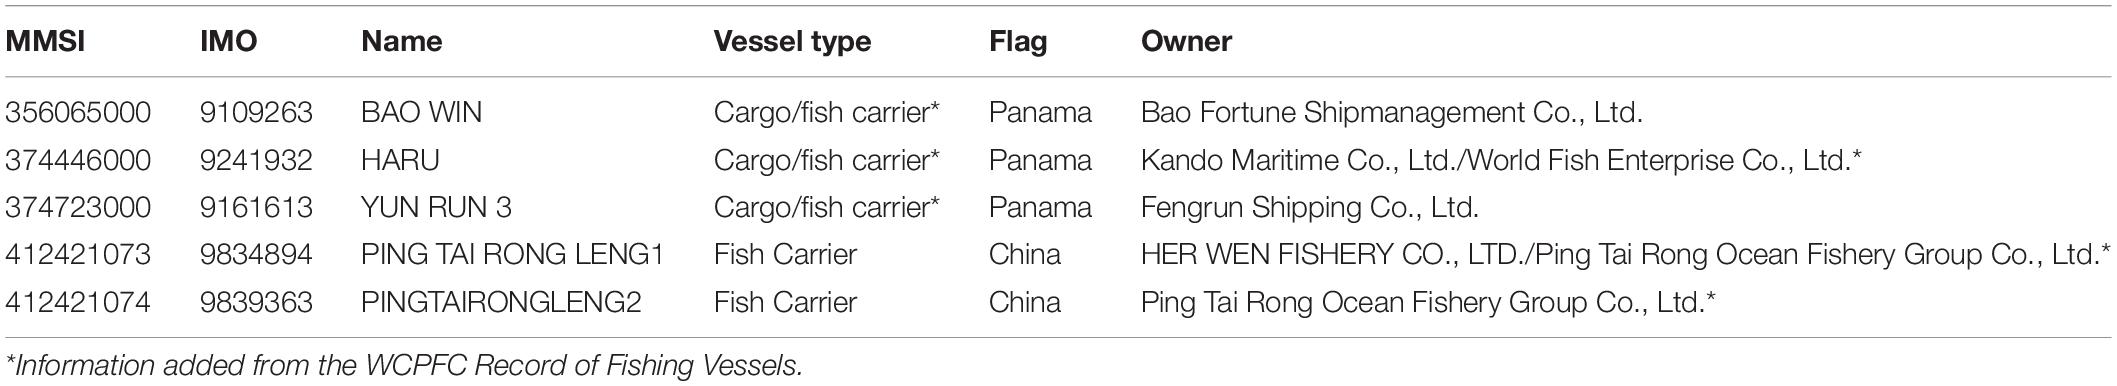
Table 3. Central carriers comprising community “C”.
Discussion
Summary of Findings
From 7 June 2015 to 6 June 2020, there were a total of 12,322 transshipment events between 600 carriers and 2,376 fishing vessels (excluding Russia-to-Russia events). Using a combination of extrapolation measures, this research was able to identify 130 carriers that were identified as “central.” These central carriers accounted for 72% (n = 8,840) of the transshipment events, which were concentrated primarily in the Eastern Central Pacific (FAO area 77) and the northern section of the Southeast Pacific (FAO area 87). Vessels carrying the Panamanian flag emerged as having the strongest connections to vessels flagged to other countries; notably strong connections were found with the flags of China and Taiwan. As for flag pairings, this Panama ↔ China relationship stood out. Further, network analyses utilizing modularity diagnostics aided in the identification of three notable communities operating within the larger global network of transshipping. These three (out of a total of 12) were determined to be principal in the overall global transshipment structure.
Distinct patterns were also observed when the networks were analyzed at the sub-network or community-levels. Community “A” comprised 22.73% of the connections in the entire network of transshipments involving central carriers and fishing vessels. The vessels within Community “A” were flagged primarily to Panama and Liberia. The transshipment events associated with this community were distributed globally, but clustering was observed near the West African EEZs and the Pacific States. Community “B” comprised 14.73% of all activities in the network involving central carriers. Unlike the central carriers in Community “A,” the central actors within this community did not include reefers. Rather, the carriers within Community “B” included cargo vessels, fishing vessels, tankers, and fish carriers, all of which are either flagged to Taiwan or Panama. Their activities occurred immediately outside of the EEZs (and almost none within) of Pacific Island states and those in South-Eastern Africa. Community “C” comprised 11.37% of all actors in the larger network, with vessels flagged to China and Panama. Their activities took place immediately outside of the EEZs of Pacific Island states, and had a distinct clustering around French Polynesia and Pitcairn.
Policy Recommendations
In order to reduce IUU fishing and other crimes that can be facilitated by transshipment activities in the open seas, it is vital that more concerted efforts be made to monitor and regulate these activities. Properly monitoring and regulating transshipments that take place both within countries’ exclusive economic zones and the high seas is a difficult task, and targeted interventions, policy instruments and regulatory guidance should be based on empirical knowledge and data-driven assumptions. This research makes evidence-based recommendations based on the empirical findings that emerged from the analyses conducted herein. These recommendations are broken down into those that are specific to central carriers and others that are more general and preventative in nature. While these recommendations are directed primarily at RFMOs due to their scope and regulatory involvement in global transshipping, they can also be useful to countries who have to monitor transshipment events within their exclusive economic zones.
Recommendations Specific to Identified Central Carriers
One of the main contributions of this research was to identify the key players involved in the global transshipment events. Approaching the issue using the Pareto Principle and various complementary analytical techniques, this research confirmed that only 130 carriers can be considered central, as they engaged in 72% of all the fish transshipments that took place during the 5 years examined. Subsequently, global RFMOs and other relevant maritime bodies should focus on these key carriers to maximize the utility of their efforts by first determining how many of the 130 central carriers operate within their convention areas. Additionally, regular inspections of the vessels they interact with should be undertaken as they arrive at or depart from ports, as outlined by the Port State Measures Agreement. The fishing vessels which these central carriers regularly engage with should also be identified so that onboard observers can be allocated to monitor the activities of both these targeted carriers and fishing vessels. Lastly, periodic audits should be carried out of the transshipment events these central carriers engage in to ensure that they are in compliance with RFMO regulations. Importantly, before RFMOs approve transshipment activities within their Convention Areas, they should base these decisions on the systematic and rigorous analysis of the data of these activities and the identification and flagging of potential key actors whose activities they should monitor more closely.
Recommendations Specific to Identified Communities
Interventions (such as inspection policies) that target the central carriers within the three communities will allow for the greatest impact in regard to implementing regulatory mechanisms. Because of this, RFMOs should work toward maintaining an acute awareness of the activities undertaken by the central carriers within their waters. Further, ongoing efforts should aim to continuously monitor the actors within the three communities and the interactions between them, as well as their central carriers, to ensure maximally effective, up-to-date, data-driven responses. Targeted interventions involving the central actors within these most active three communities will allow for the regulatory mechanisms to be leveraged to where they can have most impact. Additionally, RFMOs where the actors from within these communities engage in transshipment activities should remain informed about their activities and movements, as knowledge of the members within these communities will equip the RFMOs with the tools to better monitor their activities. This systematic and continuous identification of key communities and the patterns of interaction between them, as well as the monitoring of the key actors linking these communities will result in most efficient responses. Being informed about the network structures between these central actors will allow for data-driven policy and decision-making that is based on up-to-date information.
Recommendations Specific to Open-Registry Flags and Transshipment
The analysis of flags involved in transshipping events highlighted a significant prevalence of known open-registry flags. Key players included Panama, Vanuatu, and Liberia on behalf of both the carriers and fishing vessels. It is recommended that RFMOs design monitoring and control mechanisms to either prevent vessels carrying open-registry flags from transshipping, or that strict monitoring, control, and surveillance of such activities is undertaken to ensure that these flags are not used for the purposes of circumventing RFMO regulations. Some recommendations are proposed below.
• Preventing Transshipping Involving Open-Registry Flags. Vessels carrying the flags of known non-party States or those of known open-registry countries should be prohibited from transshipping at sea.
• Conducting Port Inspections. Port inspections should be carried out as detailed in the Port State Measures Agreement in order to deter offloading of illegally caught fish.
• Independent Monitoring. Independent monitoring of transshipment activities involving vessels that carry open-registry flags can include real-time electronic authorization and reporting or remote electronic monitoring (such as live streaming CCTV). Alternatively, it could be require that these vessels provide independent footage verifying the extent and nature of their activities at sea along with AIS tracking data to show their trips and encounters.
Limitations
Three overarching issues with using data derived from AIS have been outlined by Taconet et al. (2019). These include AIS (1) use, (2) reception, and (3) algorithm performance. In regard to AIS use, data can only be accessed from vessels that have an AIS device installed and are broadcasting (Taconet et al., 2019). While the International Maritime Organization (IMO) requires AIS use by vessels over 500 gross tons, for any vessel over 300 gross tons that is on an international voyage and for all passenger vessels, vessels have the ability to turn off their AIS. Turning off AIS signal on vessels has been previously linked to activities such as illegal fishing or hiding a fishing location from competing ships (Cutlip, 2016). The lack of this data may, therefore, impact analysts’ abilities to thoroughly understand the role transshipment could play with illicit activities. AIS reception varies around the world. In areas of high maritime traffic, it is possible for AIS signals to interfere with one another, reducing the reliability of satellite reception. This, along with the fact that AIS transceivers may not always be present along all coastlines, may cause gaps in AIS tracking information. Lastly, AIS algorithms are important to consider, as their performance impacts the proper identification of vessels and other vessel information (i.e., type).
Conclusion
This research is the first to examine the global transshipment activities of central carriers involved in these activities. The analyses allowed for the identification of carriers that were central in facilitating over 70% of the transshipment activities that took place during the 5-year period examined. It is also the first to conduct network analyses and modularity analyses to identify the key communities within global transshipment networks involving these specific central carriers. This more nuanced analysis allows for closer scrutiny as it pertains to the actors involved in global transshipping, the flags they use, and their geographic spread. Knowledge of the three communities that accounted for almost 50% of the activities should allow for more targeted monitoring that can take into consideration more information about the actors involved to have the most effective impact. Continued monitoring of the network structures between these actors will allow for the decision-making that will be based on up-to-date information and will be driven by data. Future studies can build upon the findings of this research to qualitatively explain and characterize the clusters identified in this research, including examining, in more depth, the ownership structures, their networks of relationships and the potential reasons why these actors interact most with each other. Such analyses would involve conducting in-depth interviews with major stakeholders and governments. Additionally, future research can potentially replicate the analyses conducted here in order to identify the clusters and communities of transshipment activities involving carriers and fishing vessels by gear type. Such analyses could provide even more nuanced and detailed information about the activities of the vessels, leading for more focused monitoring and surveillance of transshipments across the world.
Data Availability Statement
Publicly available datasets were analyzed in this study. This data can be found here: Global Fishing Watch Carrier Portal, https://globalfishingwatch.org/carrier-vessel-portal/.
Author Contributions
GP contributed to the analyses and write-up of the methods and results sections of the manuscript. BB contributed to the analyses and write-up of the introduction section of the manuscript. MS contributed to the analyses and write-up of the discussion and conclusion sections. All authors conceived of the idea, and proofread and edited the manuscript.
Funding
This research was funded by The Pew Charitable Trusts, Project #34289.
Conflict of Interest
The authors declare that the research was conducted in the absence of any commercial or financial relationships that could be construed as a potential conflict of interest.
Publisher’s Note
All claims expressed in this article are solely those of the authors and do not necessarily represent those of their affiliated organizations, or those of the publisher, the editors and the reviewers. Any product that may be evaluated in this article, or claim that may be made by its manufacturer, is not guaranteed or endorsed by the publisher.
Footnotes
- ^ The in- and out-degree centrality have not been assessed in this network due to these relationships being indirect.
- ^ At the time of this research study, transshipment data were only available through June 7th, 2020, thus the cutoff point.
References
Belhabib, D., Le Billon, P., and Wrathall, D. J. (2020). Narco-fish: global fisheries and drug trafficking. Fish Fisher. 21, 992–1007. doi: 10.1111/faf.12483
Blondel, V., Guillaume, J. L., Lambiotte, R., and Lefebvre, E. (2008). Fast unfolding of communities in large networks. J. Statist. Mech. Theory Exp. 10:P10008. doi: 10.1103/PhysRevE.83.036103
Boerder, K., Miller, N. A., and Worm, B. (2018). Global hot spots of transshipment of fish catch at sea. Sci. Adv. 4:eaat7159. doi: 10.1126/sciadv.aat7159
Brush, A. (2021). Strings Attached: exploring the Onshore Networks Behind Illegal, Unreported, and Unregulated Fishing. United States: C4ADS.
Bruwer, C. (2020). “Smuggling and trafficking of illicit goods by sea” in Global Challenges in Maritime Security an Introduction. ed. L. Otto (Germany: Springer International Publishing). 49–73. doi: 10.1007/978-3-030-34630-0_4
CCAMLR (2017). Conservation Measure 10-05, Catch documentation scheme for Dissostichus ’SPP. Australia: CCAMLR.
Chevallier, R. (2017). Safeguarding Tanzania’s Coral Reefs: the Case of Illegal Blast Fishing. South Africa: South African Institute of International Affairs. 46.
Crowell, B., and Turvold, W. (2020). Illegal, Unreported, and Unregulated Fishing and the Impacts on Maritime Security. Available online at: https://apcss.org/wp-content/uploads/2020/09/13-Crowell-25th3.pdf (accessed July 31, 2021).
Cutlip, K. (2016). Going Dark: when Vessels Turn Off AIS Broadcasts. Washington: Global Fishing Watch.
Environmental Justice Foundation [EJF] (2010). All at sea- the Abuse of Human Rights Aboard Illegal Fishing Vessels. London: Environmental Justice Foundation.
Ewell, C., Cullis-Suzuki, S., Ediger, M., Hocevar, J., Miller, D., and Jacquet, J. (2017). Potential ecological and social benefits of a moratorium on transshipment on the high seas. Mar. Policy 81, 293–300. doi: 10.1016/j.marpol.2017.04.004
Food and Agriculture Organization [FAO] (2018). Global Production by Production Source 1950–2016 (FishstatJ). Rome: FAO Fisheries and Aquaculture Department.
Gianni, M., and Simpson, W. (2005). The Changing Nature of High Seas Fishing: how Flags of Convenience Provide Cover for Illegal, Unreported and Unregulated Fishing. Canberra: DAFF.
GIATC (2015). Illegal Fishing: the Overlooked Organised Environmental Crime. Geneva: Global Initiative Against Transnational Organized Crime.
Global Fishing Watch (2021). Revealing the Supply Chain at Sea: a Global Analysis of Transshipment and Bunker Vessels. Washington: Global Fishing Watch.
Greenpeace (2020). Fishy Business: how transshipment at Sea Facilitates Illegal, Unreported, and Unregulated Fishing that Devastates Our Oceans. Available online at: https://media.greenpeace.org/archive/Report–Fishy-Business-27MZIFJ83AQUL.html (accessed July 31, 2021).
Harary, F., and Norman, R. Z. (1953). Graph Theory as a Mathematical Model in Social Science. University of Michigan: Institute for Social Research.
Lancichinetti, A., and Fortunato, S. (2009). Community detection algorithms: a comparative analysis. Phys. Rev. E 80:056117.
McDowell, R., Mason, M., and Mendoza, M. (2015). AP Investigation: are Slaves Catching the Fish You Buy?. United States: Associated Press.
McKinney, R., Gibbon, J., Wozniak, E., and Galland, G. (2020). Netting Billions 2020: a Global Tuna Valuation. Washington: The Pew Charitable Trusts.
Miller, N. A., Roan, A., Hochberg, T., Amos, J., and Kroodsma, D. A. (2018). Identifying global patterns of transshipment behavior. Front. Mar. Sci. 5:240. doi: 10.3389/fmars.2018.00240
Mosteiro Cabanelas, A., Quelch, G. D., Von Kistowski, K., Young, M., Carrara, G., Rey Aneiros, A., et al. (2020). Transshipment: a Closer Look: an in-depth Study in Support of the Development of International Guidelines. Italy: Food & Agriculture Organization.
MRAG (2019). WCPO Transshipment Business Ecosystem Study. Available online at: https://www.m2cms.com.au/uploaded/5/Pew%20WCPO%20Transhipment%20Report%20-%20final.pdf (accessed July 31, 2021).
MRAG (2020). ICCAT Transshipment Business Ecosystem Study. Available online at: https://www.m2cms.com.au/uploaded/5/Pew%20ICCAT%20Transhipment%20Report%20-%20final.pdf (accessed July 31, 2021).
Park, A. J., and Stamato, S. Z. (2020). “Social Network Analysis of Global Transshipment: A Framework for Discovering Illegal Fishing Networks” in 2020 IEEE/ACM International Conference on Advances in Social Networks Analysis and Mining (ASONAM). (United States: IEEE). 776–783. doi: 10.1109/ASONAM49781.2020.9381417
Pauly, D., and Zeller, D. (2016). Catch reconstructions reveal that global marine fisheries catches are higher than reported and declining. Nat. Commun. 7:10244. doi: 10.1038/ncomms10244
Petrossian, G. A. (2019). The Last Fish Swimming: the Global Crime of Illegal Fishing. United States: ABC-CLIO.
Pew Charitable Trusts (2018). Transshipment Reform Needed to Ensure Legal, Verifiable Transfer of Catch. United States: Pew Charitable Trusts.
Pew Charitable Trusts (2019). Transshipment in the Western and Central Pacific. United States: Pew Charitable Trusts.
Phelps, B. T. N., van der Werf, W., and Reitano, T. (2015). The Illegal Fishing and Organized Crime Nexus: illegal Fishing as Transnational Organized Crime. Geneva: The Global Initiative Against Transnational Organized Crime.
Seto, K., Miller, N., Young, M., and Hanich, Q. (2020). Toward transparent governance of transboundary fisheries: the case of Pacific tuna transshipment. Mar. Policy 136:104200. doi: 10.1016/j.marpol.2020.104200
Stop Illegal Fishing (2020). Moving Tuna: transshipment in the Western Indian Ocean, Gaborone, Botswana. Available at https://stopillegalfishing.com/wpcontent/uploads/2020/09/Moving-Tuna-FINAL-WEB2.pdf (accessed July 31, 2021).
Taconet, M., Kroodsma, D., and Fernandes, J. A. (2019). Global Atlas of AIS-based Fishing Activity: Challenges and Opportunities. Rome: Food and Agriculture Organization of the United Nations
The Tico Times (2014). Drug Traffickers lure Costa Rica’s Struggling Coastal Fishermen with Offers of Easy Money. San José: The Tico Times.
UNODC (2019). Rotten Fish: a guide on Addressing Corruption in the Fisheries Sector. Austria: UNODC.
WATF (2021). Transshipment and the FCWC Region. Available online at: https://stopillegalfishing.com/publications/transhipment-and-the-fcwc-region-case-studies/ (accessed July 31, 2021).
Weldemichael, A. T. (2019). Crimes within crimes in Somalia: double-dealing pirates, fraudulent negotiators, duplicitous intermediaries and treacherous illegal fishers. J. Territor. Maritime Stud. 6, 51–63.
White, A. T., Vogt, H. P., and Arin, T. (2000). The Philippine Coral Reefs Under Threat: the Economic Losses Caused by Reef Destruction. Mar. Poll. Bull. 40, 598–605. doi: 10.1016/S0025-326X(00)00022-9
Witbooi, E., Ali, K. D., Santosa, M. A., Hurley, G., Husein, Y., Maharaj, S., et al. (2020). Organized crime in the fisheries sector threatens a sustainable ocean economy. Nature 588, 48–56. doi: 10.1038/s41586-020-2913-5
World Ocean Review (2013). Plenty More Fish in the Sea?. Available online at: https://worldoceanreview.com/wp-content/downloads/wor2/WOR2_en_chapter_3.pdf (accessed July 31, 2021).
Keywords: modularity analysis, fisheries resource management, network analysis, IUU fishing, global transshipment networks, central carrier vessels
Citation: Petrossian GA, Barthuly B and Sosnowski MC (2022) Identifying Central Carriers and Detecting Key Communities Within the Global Fish Transshipment Networks. Front. Mar. Sci. 9:798893. doi: 10.3389/fmars.2022.798893
Received: 20 October 2021; Accepted: 22 February 2022;
Published: 31 March 2022.
Edited by:
Kum Fai Yuen, Nanyang Technological University, SingaporeReviewed by:
Kristina Boerder, Dalhousie University, CanadaYusheng Zhou, Nanyang Technological University, Singapore
Copyright © 2022 Petrossian, Barthuly and Sosnowski. This is an open-access article distributed under the terms of the Creative Commons Attribution License (CC BY). The use, distribution or reproduction in other forums is permitted, provided the original author(s) and the copyright owner(s) are credited and that the original publication in this journal is cited, in accordance with accepted academic practice. No use, distribution or reproduction is permitted which does not comply with these terms.
*Correspondence: Gohar A. Petrossian, Z3BldHJvc3NpYW5AampheS5jdW55LmVkdQ==