 Simon D. Goldsworthy1,2*
 Brad Page1,3
 Derek J. Hamer1,4
 Andrew D. Lowther1,5
 Peter D. Shaughnessy1,6
 Mark A. Hindell7Paul Burch1
 Daniel P. Costa8Shannon L. Fowler8,9Kristian Peters1,10
 Rebecca R. McIntosh1,11
 Frederic Bailleul1,2
 Alice I. Mackay1Roger Kirkwood1
 Dirk Holman12Simon Bryars10
- 1South Australian Research and Development Institute, Aquatic Sciences, West Beach, SA, Australia
- 2School of Earth and Environmental Sciences, University of Adelaide, Adelaide, SA, Australia
- 3Department of Primary Industries and Regions, Urrbrae, SA, Australia
- 4DBMS Global Oceans, Hobart, TAS, Australia
- 5Norwegian Polar Institute, Tromsø, Norway
- 6South Australian Museum, North Terrace, Adelaide, SA, Australia
- 7Institute of Marine and Antarctic Studies, University of Tasmania, Hobart, TAS, Australia
- 8Ecology and Evolutionary Biology, Long Marine Laboratory, University of California, Santa Cruz, Santa Cruz, CA, United States
- 9Department of Life Sciences, University of Roehampton, London, United Kingdom
- 10Department for Environment and Water, Adelaide, SA, Australia
- 11Conservation Department, Phillip Island Nature Parks, Cowes, VIC, Australia
- 12Department for Environment and Water, Port Lincoln, SA, Australia
Globally, the bycatch of marine mammals in fisheries represents the greatest source of human-caused mortality that threatens the sustainability of many populations and species. The Australian sea lion (Neophoca cinerea) is an endangered species, whose populations off South Australia (SA) have been subject to bycatch in a demersal gillnet fishery targeting sharks since the 1960s. A comprehensive assessment was undertaken of sea lion bycatch mortality that combined independent fishery observer data with species distribution models (underpinned by satellite tracking, abundance data and population modeling) to model the relationship between at-sea foraging effort and bycatch rate. Combined with the distribution of fishing effort, these models enabled the overall level of bycatch mortality to be estimated by age, sex and subpopulation, facilitating population viability analyses that indicated most subpopulations were declining, and subject to unsustainable levels of bycatch mortality. To reduce this mortality, the Australian Fisheries Management Authority implemented an Australian Sea Lion Management Strategy that included an independent observer program (ultimately 100% electronic monitoring of gillnet fishing off SA), permanent spatial gillnet closures around all sea lion breeding sites, bycatch mortality limits that triggered temporal (18 months) spatial closures when zone-specific bycatch trigger limits were reached, and incentives for gillnet fishers to switch to an alternate fishing method (longlines). The Strategy had immediate impacts on the fishery: it resulted in significant reductions in gillnet fishing effort and on the reported bycatch of sea lions. In the next decade, there was an estimated 98% reduction in sea lion bycatch mortality from gillnet interactions and an apparent stabilization of the decline in sea lion pup abundances at some impacted breeding sites. There was an almost complete transition in the fishery from gillnets to longlines, and fishing catches returned to pre-management levels. The successful implementation of management measures to mitigate sea lion bycatch mortality in the gillnet fishery off SA was rapid, science informed, adaptive, comprehensive, and backed by strong compliance and monitoring of the fishery. It provides an important case study which demonstrates how management measures can be effectively applied to mitigate bycatch mortality of marine mammals and other marine protected species.
Introduction
Incidental catch or bycatch in fisheries presents a major threat to many marine species and is one of the most significant sources of anthropogenic mortality of marine mammals (Read et al., 2006; Sims et al., 2008; Lewison et al., 2009; Kovacs et al., 2012; Komoroske and Lewison, 2015; Peltier et al., 2016, 2021; Gray and Kennelly, 2018; Luck et al., 2020). Although marine mammals are known to interact with most fishing gear types, interactions with gillnets are particularly pervasive and a significant source of marine mammal mortality (Read et al., 2006; Reeves et al., 2013). Gillnet fishery interactions pose the principal threat to many endangered small cetaceans (Brownell et al., 2019; Gulland et al., 2020; Cisneros-Mata et al., 2021; Owen et al., 2021), and also threaten many pinniped species (Hamer et al., 2011, 2013; Kovacs et al., 2012; Cosgrove et al., 2016; Machado et al., 2016; Jounela et al., 2019; Ramos et al., 2020). Although advances have been made in mitigating interactions with many gear types (Hamilton and Baker, 2019), interactions with gillnet fisheries continue to pose some of the greatest management and conservation challenges (Read et al., 2006; Reeves et al., 2013).
Australian sea lions (Neophoca cinerea) (ASLs) are an endangered pinniped, endemic to southern Australia (Goldsworthy, 2015; Goldsworthy et al., 2021). They are unique among pinnipeds in having a non-annual breeding cycle (∼18 months between successive breeding seasons) in which breeding can occur at any time of the year, breeding seasons last 4 to 9+ months and occur asynchronously across the species range (i.e., neighboring colonies can breed at different times). Asynchronous breeding is thought to be maintained by extreme philopatry and population sub-structuring that effectively makes most breeding sites subpopulations (Campbell et al., 2008; Lowther et al., 2012). The non-annual and asynchronous breeding habit of ASL makes systematic monitoring of their status and trends in abundance extremely challenging (Goldsworthy et al., 2021). Despite pup births being spread over many months, pup counts are still the main method to estimate the number of pups produced in a breeding season, and for monitoring changes in the status and trends of ASL populations (Goldsworthy et al., 2021). Breeding season pup production is a common measure of abundance in seals, because pups form the only age-class that is easily identifiable (natal pelage), and most pups are ashore at the end of a breeding season.
Australian sea lions are demersal foragers that are restricted to continental shelf waters; a foraging strategy that increases their likelihood of interacting with demersal gillnet fisheries (Goldsworthy and Page, 2007). During the early to mid-2000s, multiple lines of evidence suggested that interactions between ASLs and the demersal gillnet sector of the Gillnet Hook and Trap (GHAT) fishery off South Australia (SA) were a significant threat to the species, including: anecdotal reports of bycatch from some fishers (Shaughnessy et al., 2003); high incidence of sea lions entangled in gillnet material (Page et al., 2004); substantial overlap in fishing effort and sea lion foraging distributions (Goldsworthy and Page, 2007) and population recovery at a major breeding site following cessation of the fishery in the region (Goldsworthy et al., 2014). Furthermore, a recent assessment of status and trends in abundance of the species has indicated that populations off SA have declined by 67% over the last four decades, much of which may be attributable to historic bycatch in gillnet fisheries (Goldsworthy et al., 2021).
In the late 2000s, a major study was undertaken to assess the risk to ASL subpopulations from bycatch mortality in the GHAT fishery. It: (i) assessed interaction rates through a dedicated fishery observer program; (ii) developed species distribution models using satellite tracking data; (iii) compiled spatial data on the distribution of fishing effort and (iv) developed population models from sea lion surveys and demographic data to assess the likely impact from different levels of bycatch mortality on the sustainability of ASL populations (Goldsworthy et al., 2010). The study found that observed bycatch mortality rates were highly correlated with estimated sea lion foraging effort (a proxy for sea lion density at sea), enabling the estimation of the bycatch mortality that would result from different spatial distributions and levels of fishing effort. Population viability analyses (PVA) indicated that most ASL subpopulations off SA were declining and exposed to unsustainable levels of bycatch mortality. The study concluded that further declines, subpopulation extinctions and reductions in sea lion range would be likely unless bycatch mortality was reduced (Goldsworthy et al., 2010).
In response to these findings, the Australian Fisheries Management Authority (AFMA) introduced the Australian Sea Lion Management Strategy in June 2010 (Australian Fisheries Management Authority, 2010). Most of the core management measures in the Strategy were developed and refined in stages between 2010 and 2012 and included the introduction of an independent observer program, permanent spatial gillnet closures around all sea lion breeding sites, bycatch mortality limits that triggered temporal spatial closures, and incentives to switch to alternate fishing methods (longlines). The objectives of these measures were directed toward enabling the recovery of the species including all subpopulations (Australian Fisheries Management Authority, 2010). The Strategy has now been in place for over a decade, but its success in mitigating sea lion bycatch and enabling the recovery of affected populations has not been assessed.
The objectives of our study were to: (i) provide an overview of the methods used to estimate seal lion bycatch mortality in the GHAT fishery in the late 2000s and revise species distribution models and estimates of bycatch mortality and impacts on populations using updated abundance information; (ii) detail the chronology of bycatch mitigation measures developed and implemented as part of the ASL Management Strategy between 2010 and 2012; (iii) assess changes in fishing effort, bycatch mortality and the size of the sea lion population since the introduction of mitigation measures and (iv) evaluate the success of the ASL Management Strategy in reducing bycatch and enabling the recovery of sea lion populations. The steps of estimating sea lion bycatch and population impacts, implementation of bycatch management measures, and evaluation following management, are presented below in chronological order.
Estimating Sea Lion Bycatch and Population Impacts
Fishery Background
The fishery for shark in southern Australia extends back to early European settlement in the 1800s and was enhanced during the Second World War (Kailola et al., 1993). At that time the fishery targeted school shark (Galeorhinus galeus) with longlines. In 1964, monofilament gillnet was introduced and by the early 1970s gillnetting was the main fishing method (Kailola et al., 1993; Larcombe and McLoughlin, 2007). Catch and effort records exist for this fishery in SA and adjacent Commonwealth waters since at least 1973, with catch of school shark peaking in 1987. The fishery now targets gummy shark (Mustelus antarcticus) and over the last decade and a half there have been efforts to reduce the catch of school shark to allow its stocks to rebuild (Australian Fisheries Management Authority, 2015b).
In 2001, an Offshore Constitutional Settlement (OCS) transferred State management of school and gummy shark in coastal waters (extending out to 3 nautical miles offshore, excluding internal waters in bays and inlets) to AFMA (Larcombe and McLoughlin, 2007). It is managed as part of the GHAT fishery. The gillnet sector of the GHAT fishery is restricted to depths shallower than 183 m.
Bycatch Assessment Approach
Bycatch rate (numbers of animals caught per unit of fishing effort) is a common metric used to estimate the level of bycatch to which a species is subjected (Sims et al., 2008; Moore et al., 2021). Bycatch models may be improved, however, by incorporating geographic information on species distribution at sea (e.g., species distribution models) and distribution of fishing effort, as bycatch rates are often highly heterogeneous. ASLs are good candidate species for this approach because they are a non-migratory, breed colonially, undertake regular foraging trips to sea and show strong philopatry to natal breeding sites (Campbell, 2003; Kirkwood and Goldsworthy, 2013). Furthermore, ASL display a high degree of faithfulness to foraging locations and foraging modes, with individuals settling on a mode of foraging at a very young age (Lowther et al., 2011, 2012, 2013). ASLs are demersal foragers and dive continuously to the seabed throughout foraging trips (Kirkwood and Goldsworthy, 2013).
The assessment of bycatch impacts on ASLs from the gillnet fishery off SA integrated data on subpopulation abundance (the size and status of individual breeding sites/subpopulations can be estimated from the number of pups born per breeding season and demographic data, Goldsworthy et al., 2021) and foraging data (satellite telemetry and diving data) to develop at-sea species distribution models (SDMs), with most data obtained between 2000 and 2009 (Supplementary Tables 1, 2). Bycatch rates were estimated from a sample of observed gillnet hauls (2006–2008, see Hamer et al., 2013) and were then modeled in relation to ASL foraging effort at the location of the observed hauls, derived from the SDMs. This bycatch-rate estimation model was then applied to estimate the expected yearly bycatch that would have occurred from the spatial distribution of fishing effort between 2006 and 2009 (inclusive). Population viability analyses (PVA) then assessed bycatch impacts on the sustainability of individual subpopulations (see schematic in Figure 1).
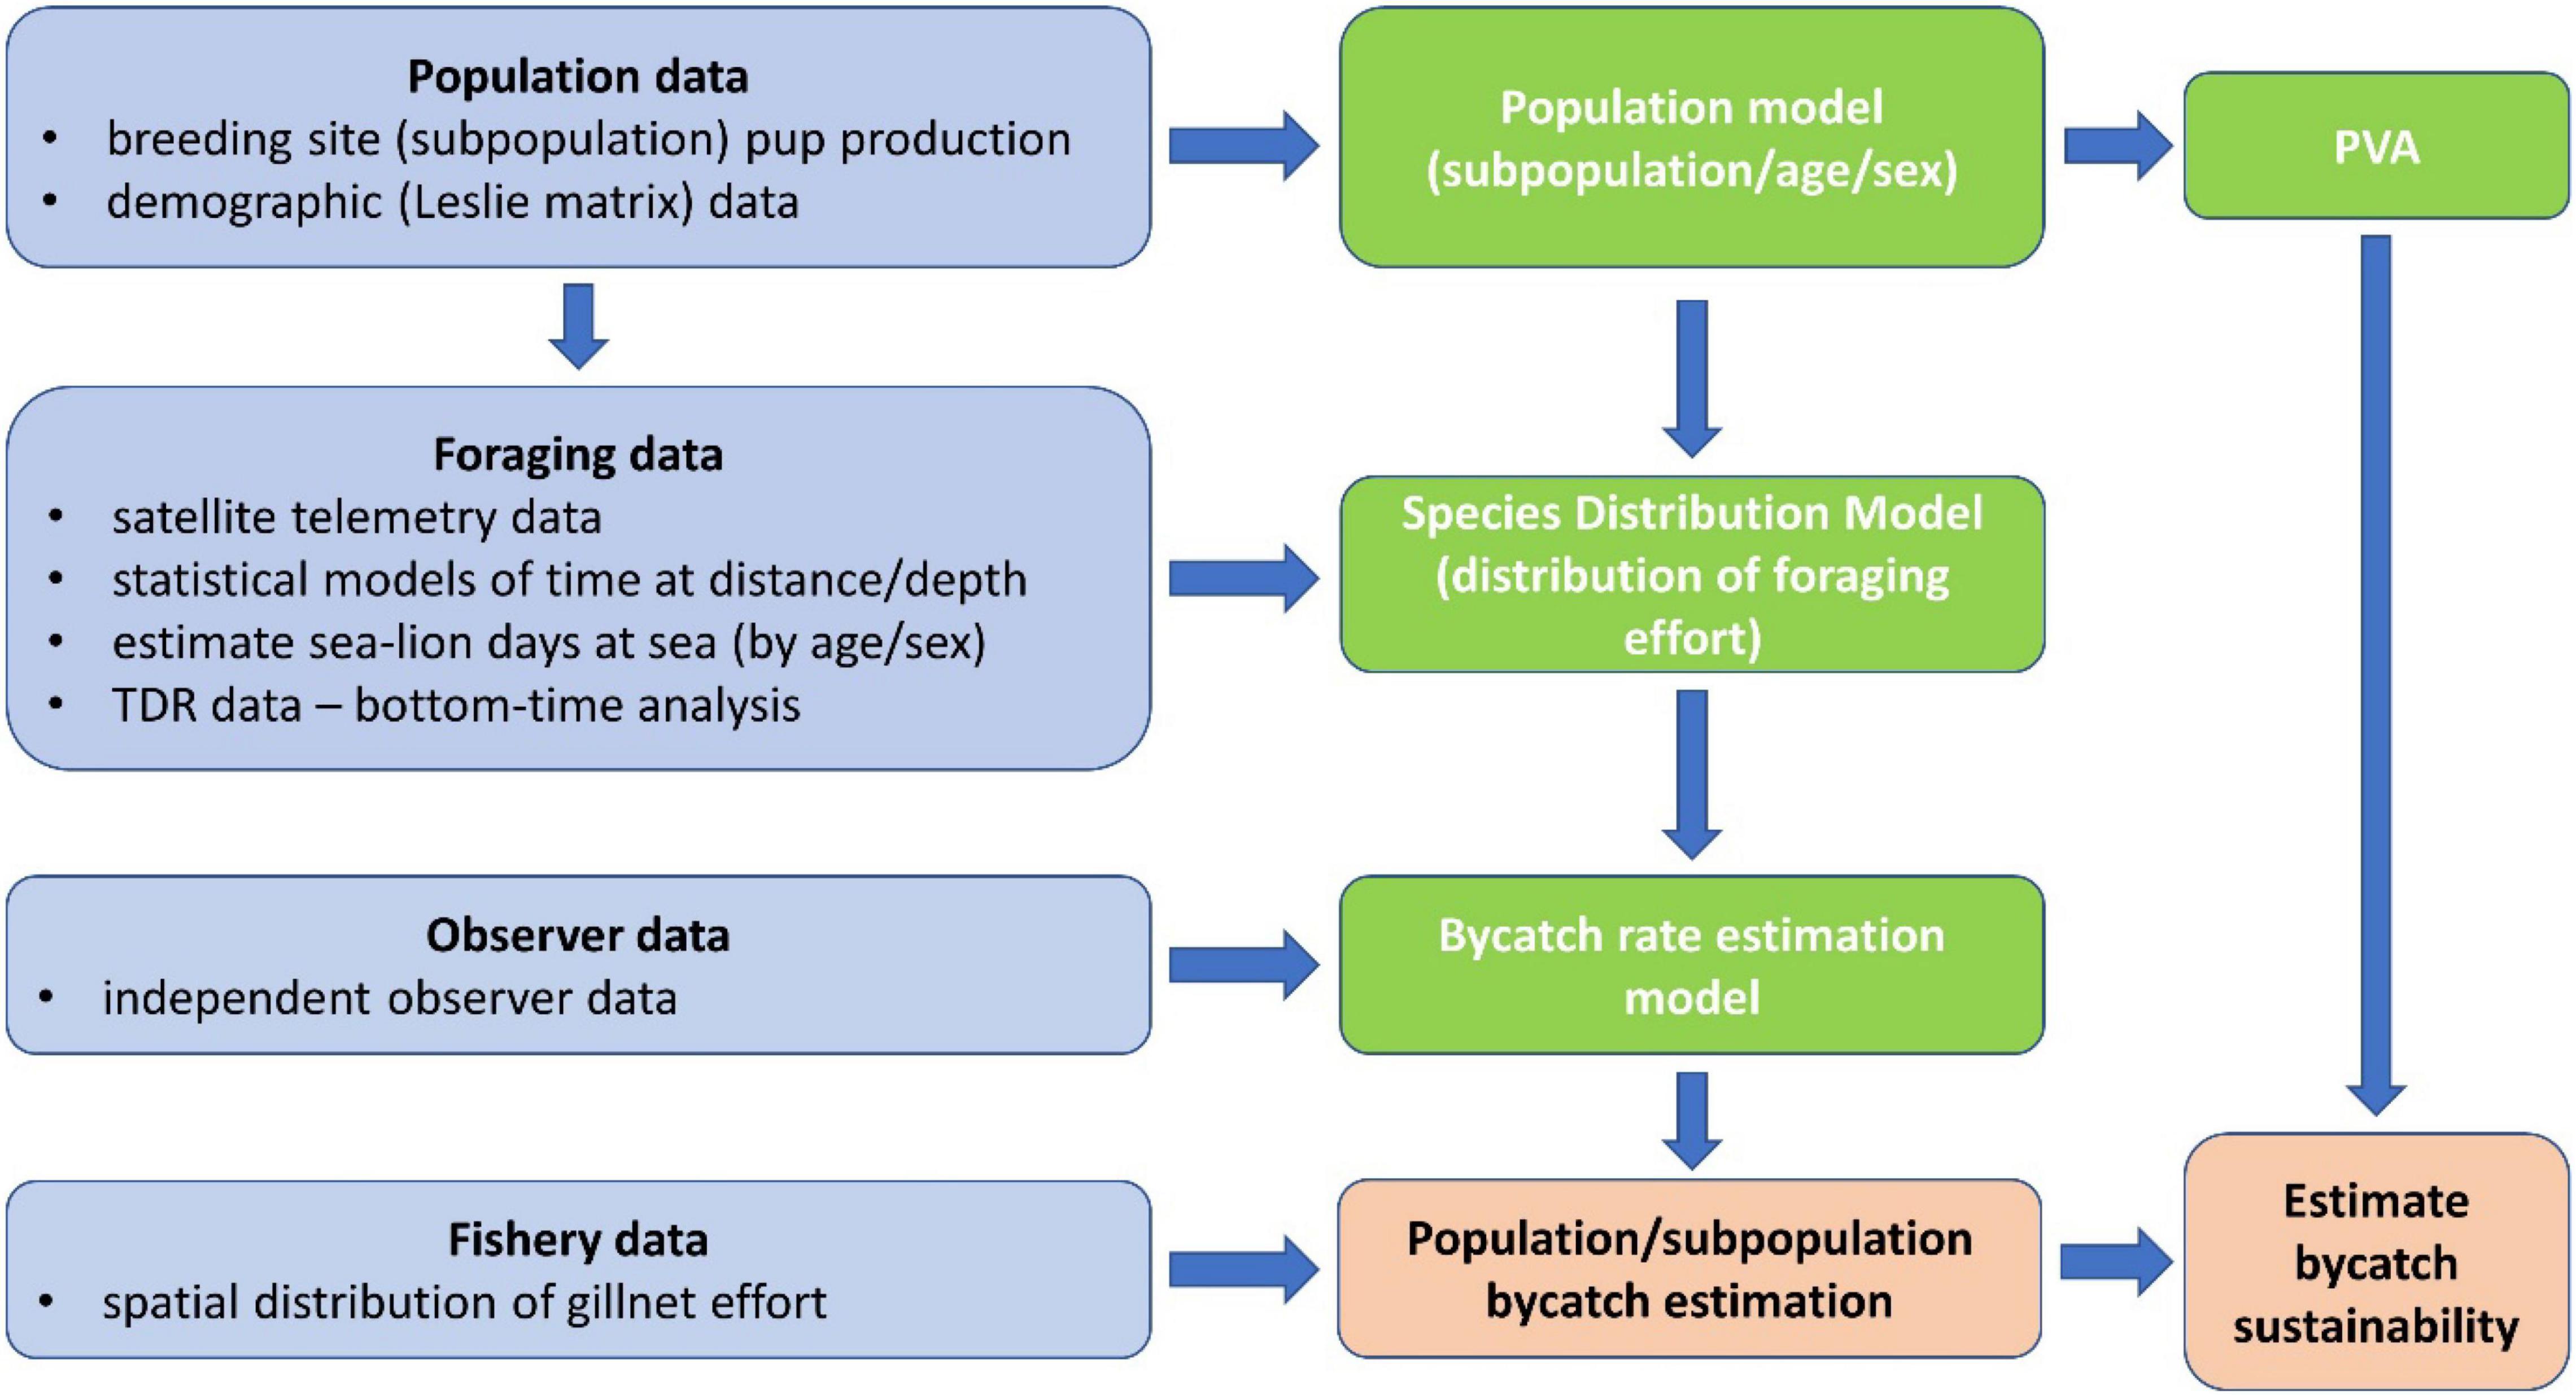
Figure 1. Schematic representation of the various components of data used, and the steps undertaken to develop the suite of models (population, species distribution and bycatch rate estimation models) used to estimate the bycatch mortality of ASL and its impact on population sustainability.
Population Model Development
Subpopulation Pup Production
Information on the location and size (pup production) of ASL breeding sites (subpopulations) within SA waters in 2010 was based on Goldsworthy et al. (2010), with some modifications including: removal of eight locations that are now recognized not to be breeding sites [Bunda 1, 2, 4, Point Fowler (Camel Foot Bay), Dorothee Island, North Islet, Cave and Black Points]; the addition of nine recently identified breeding sites (Bunda 09, 152, 155, Cap, Rocky (South), Little Hummock and Williams Islands, Curta Rocks and the Western Isles), and revision of pup production estimates for Nuyts Reef due to poor earlier surveys (combined pup production revised from 15 to 112) (Goldsworthy et al., 2021). This has increased the estimated ASL pup production in SA in 2010 from 3,107 pups to 3,271 (5% increase) (see Supplementary Table 1 and Supplementary Figure 1). Details on survey methodologies are presented in Goldsworthy et al. (2021).
Estimating the Size and Age Structure of Australian Sea Lion Subpopulations
The size of individual ASL subpopulations including the number of females and males was based on life-tables developed from demographic data collected at the Seal Bay subpopulation on Kangaroo Island (Goldsworthy et al., 2020). Age-specific survival estimates at Seal Bay were based upon the resight/return rates of 1,855 pups, microchipped across 11 consecutive breeding seasons between 2003 and 2018 (Goldsworthy et al., 2020). Capture-history matrices were constructed from the re-sight histories of individual sea lions over eleven cohorts. Re-sights were grouped into 32, 6-month intervals (Summer/Autumn: December to May and Winter/Spring: June to November). Capture-history matrices were used as input files for the capture–mark–recapture (CMR) program MARK (White and Burnham, 1999) to estimate survival and capture probabilities. As there were limited data for animals older than 12 years, age-specific survival estimates were restricted to animals < 12. RMark estimates of mean survival were fitted to a fourth order polynomial model, assuming a maximum longevity of 26 years for females and 21.5 years for males (McIntosh, 2007; Goldsworthy et al., 2020; Supplementary Table 3).
Species Distribution Model Development
Satellite Telemetry Data
Satellite telemetry data from 210 instrumented ASLs provided the raw data from which the spatial distribution of foraging effort was modeled (Supplementary Table 2). These included 157 adult females from 17 subpopulations, 31 adult males from 8 subpopulations and 22 juveniles from 4 subpopulations. Data amounted to 3,321 individual foraging trips (foraging trips are discrete at-sea events between protracted periods ashore): 2,334 from adult females, 566 from adult males and 421 from juveniles (Supplementary Table 2). Pup foraging was not included in the analysis. Although the foraging abilities of pups develop markedly from 6 to 18 months (Fowler et al., 2006; Lowther and Goldsworthy, 2012), information about the distribution of their foraging effort is limited. Telemetry data were derived from both ARGOS linked platform transmitting terminals (PTTs), and fully archival or archival/ARGOS linked GPS tags. A total of 100,934 satellite-derived locations were available for analysis.
Filtering and Analysis of Time Spent in Areas
Platform transmitting terminal satellite location data were obtained through CLS ARGOS (Toulouse, France). The location-class Z positions were omitted due to the magnitude of their error (Sterling and Ream, 2004), leaving location classes B, A, 0, 1, 2, 3 for subsequent analyses. For GPS telemetry units, location data were solved either using the LocSolve (Wildlife Computers, Redmond, WA, United States) or Sirtrack (Havelock North, New Zealand) software packages. The R statistical software (version 2.8.1, R Development Core Team, R Foundation for Statistical Computing, Vienna) and the Trip package (M. D. Sumner, University of Tasmania, Hobart) were used to apply a speed filter as described by McConnell et al. (1992) to remove erroneous positions. The maximum horizontal speed considered possible was 11.0 km/h. In order to remove all time on land and restrict subsequent analyses to data on foraging trips only, the departure and arrival times, and locations of successive foraging trips were calculated following the methods detailed by Goldsworthy et al. (2009).
To determine key areas used during foraging trips, a grid of cells (1.5 km × 1.5 km, i.e., 2.25 km2) was developed using the Trip package, and the amount of time that each sea lion spent within each cell was calculated assuming a constant horizontal speed between successive filtered locations and interpolated new positions every 15 min. Numbers of original and interpolated positions located within these cells were summed and assigned to the central node. To ensure that different deployment durations recorded for different sea lions did not bias comparisons, the amount of time spent in each cell was converted to a proportion of the total time spent at sea for each individual, subpopulation and or juvenile/adult (female/male) group (see examples in Supplementary Figure 2).
Model Development
The spatial distribution of foraging effort of ASL subpopulations throughout SA was estimated using statistical models. Alternate approaches using general linear models and generalized additive models were trialed but could not capture the over-dispersed nature of the observations and resulted in unrealistic truncations at natural limits to foraging distance and foraging depth.
Continental shelf and slope waters in SA were overlaid with a 1 km × 1 km grid and the distance from each subpopulation site to each node in the array was calculated. The depth at each cell node was calculated using bathymetric data from GeoScience Australia. For each subpopulation, the time spent at distance and depth from the subpopulation site was examined using density plots created within R. The fits of these density plots to the normal probability function
and the gamma probability density function,
were examined using the MASS package. The means (μ) and standard deviations (σ) were calculated for normal probability distributions, while the shape (k) and scale (θ) functions were determined for gamma distributions. The x variable represented either distance (km) or depth (m). Where distance or depth distributions appeared to be bimodal, mixed models of two normal or gamma distributions were fitted using maximum likelihood in R (MASS package). Where there was support for two separate distributions, means and standard deviations were estimated for each and the proportion that each distribution contributed to the overall foraging distribution was calculated.
The probability of an animal from a given subpopulation foraging in a particular cell was modeled as a continuous variable on the range [0, 1]. The probabilities were calculated as the joint probability (i.e., product) of distance and depth (using the means and standard deviations, or shape and scale functions for the normal or gamma probability functions, respectively), based on the distance of the node from the subpopulation and its depth, after standardizing each onto the range [0,1]. For adult females, subpopulation models were used where tracking data from more than two individuals were available. For all other subpopulations, a combined model (all females) was used to estimate foraging distribution. For adult males, pooled models were used to estimate the foraging distributions for subpopulations in the western Eyre Peninsula (West), Spencer Gulf and Gulf St Vincent (Gulf), and Kangaroo Island regions (KI). Because data for juveniles were limited, a pooled model for all subpopulations was used. Models for depth and distance were assumed to be independent. Each foraging model was constrained by the upper limits of the observed distance and depth in the data on which it was based, and coastal distance data were corrected to exclude over-land routes.
Estimates of the proportion of time spent at sea by adult females (0.517), adult males (0.580) and juveniles (0.471) were based on those calculated by Goldsworthy and Page (2007). Total foraging effort (seal days/year) was estimated as the product of the number of individual sea lions in each age stage and sex (Supplementary Table 3), the proportion of time at sea and the number of days in a year. The distribution of foraging effort was apportioned to each subpopulation based on the proportion of pup production (relative to total SA pup production, Supplementary Table 1), the number of individual seals from each age stage and gender, and the proportion of time they spent at sea. This enabled the estimation of total foraging effort (seal days/year) for each subpopulation and its adult female, male and juvenile components. The product of the adult female, adult male and juvenile foraging probabilities at each node for each subpopulation, and their total foraging effort, provided the enumeration of the estimated spatial distribution of foraging effort (seal days/year). For any 1 km × 1 km node in the array, this enabled the estimation of total ASL foraging effort and the proportion of that effort attributable to females and males from any subpopulation.
To estimate the amount of time ASLs could be vulnerable to bycatch in gillnets, which are set on the seabed and extend only 3–4 m up into the water column, the seals’ diving behaviors were assessed to determine how long they spent in this bottom phase of each dive. ASLs typically maintain a relatively constant bottom time duration independent of depth by increasing the duration of dives (Costa and Gales, 2003). However, as descent, ascent and inter-dive intervals increase with greater bottom depths, bottom time may decrease. To account for the potential effect of depth on bottom time, we examined data files from time-depth recorder (TDR, MK-7 TDRs Wildlife Computers, Redmond, WA, United States) deployments for 11 adult female and four adult male ASLs. These were analyzed using Instrument Helper (Version 1.0.0.5, Wildlife Computers) to derive dive depth, duration, bottom time (set as the time spent deeper than 80% of the maximum depth of each dive) and inter-dive interval. Percent bottom time in each dive cycle was then calculated as the duration of bottom time, divided by the dive duration plus the previous inter-dive interval. The effect of depth (log transformed) on percent bottom time (complementary log-log transformed) was examined using generalized linear mixed-effects models (GLMMs), using the lme4 package in R. A function describing how the proportion of bottom time varied with depth was derived and applied to each node within the foraging distribution model to provide an estimate of the total bottom (i.e., demersal foraging) time. For any 1 km × 1 km node in the array, this enabled the estimation of total ASL demersal foraging effort during which sea lions were at risk from interactions with set gillnets. As with overall foraging effort estimates, the proportion of demersal foraging effort attributable to females and males from any subpopulation for any node could be estimated. Foraging effort models were visualized and then interpolated (triangular method) and plotted using MapInfo Pro Advanced™ (Version 2019.3, Pitney Bowes Software Inc.).
Model Output
The SDM of the ASL population off SA emphasizes the importance of shallow coastal waters adjacent to breeding sites, and that the species’ foraging effort is restricted to shelf waters (Figure 2). Details on the parameters of the normal and gamma probability density functions used to model the distributions of foraging effort, their assessment and evaluation, are detailed in Goldsworthy et al. (2010).
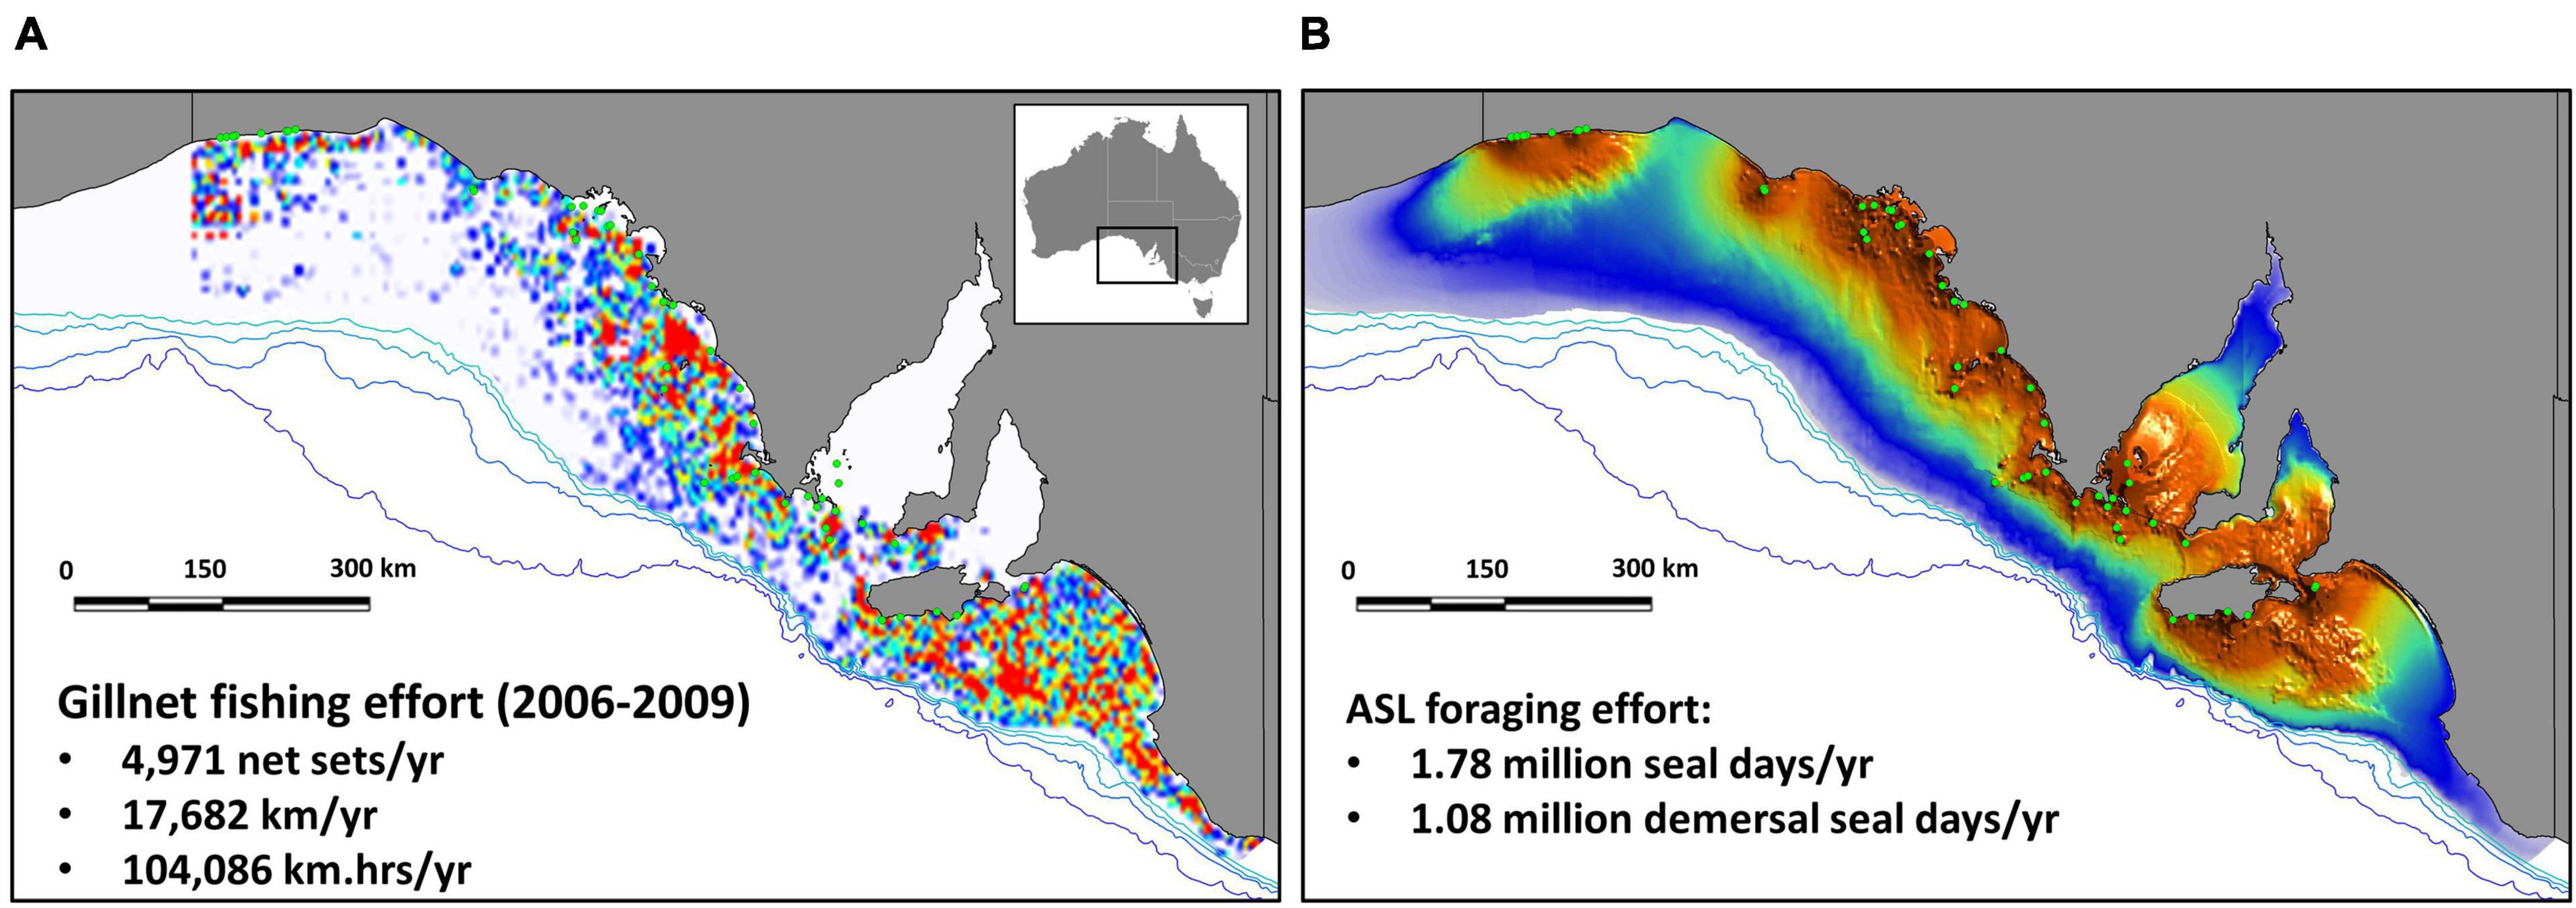
Figure 2. Heat map representing the spatial distribution of gillnet fishing effort off SA, between 2006 and 2009 (inclusive, i.e., 4 years), with average annual effort provided (net-sets, km, and km.hrs) (A); species distribution model (heat map) of ASL demersal foraging effort off SA based on estimated abundance in 2010, showing the location of 48 breeding sites (green circles) (B). Bathymetry lines are indicated from light to dark blue (200, 500, 1000, 2000 m).
Bycatch Impact Assessment
Independent Fishery Observer Program
Independent observers accompanied shark gillnet vessels in SA shelf waters on ten trips between February 2006 and January 2008, with most trips undertaken between August and March (Hamer et al., 2013). Observations were made from slightly outboard of the gunwale to obtain an unimpeded view of the net ascending vertically through the upper water column and onto the net roller during net-hauls. This ensured that any sea lions that could drop out of the net as it came out of the water were recorded. Records were made of the time and location of each of the 234 hauls, and the presence of drowned ASLs. Where possible, the sex and age class of ASLs were recorded (Hamer et al., 2013).
Bycatch Rate Estimation Model
The latitude and longitude of net-sets were plotted onto the species distribution model of ASL foraging effort, and the foraging effort for each net-set was extracted using the point-inspection feature in MapInfo™. Observer data were then sorted from least to most ASL demersal foraging effort days, and then successive ranges (bins) in demersal foraging effort were examined in terms of the number of ASL bycatch mortalities and total fishing effort. Bycatch mortality rates for each successive bin were then calculated in terms of net-set length (seals/km net-set) and net-set length × soak-time duration (seals/km.hr net-set). An unsupervised discretization approach examined different binning options based on bins of equal length (range in demersal foraging effort) or equal frequency (number of observed net-sets). Many of these produced bin ranges or sample sizes that were too small or did not contain bycatch mortality and hence precluded a valid bycatch-rate calculation. Because of the low number of observations at areas of high sea lion foraging effort, binning based on equal sample sizes produced better model fits. Models to examine how bycatch rate per unit of fishing effort varied in response to sea lion demersal foraging effort were examined using linear regressions.
Bycatch Estimation
Bycatch was estimated using two approaches. The first multiplied the bycatch rates derived directly from the observer data by the total fishing effort to provide a simple approximation of total bycatch. For the second approach, we estimated ASL bycatch by using the estimation model to predict bycatch rates for values of demersal foraging effort estimated for each net-set location, and then multiplied these rates by total fishing effort at that location.
The foraging distribution models of adult females, adult males and juveniles enabled the total foraging effort at each node to be apportioned by sex and subpopulation. From this it was possible to estimate bycatch of each component for each subpopulation. Based on the ASL life-table (Supplementary Table 3) and the number of foraging days of juvenile, adult female and adult male sea lions (Table 1), total female and male bycatch at any node was calculated as the total adult female, or male bycatch plus the proportion of juvenile bycatch estimated to be female (0.4141), or male (0.5859), respectively.
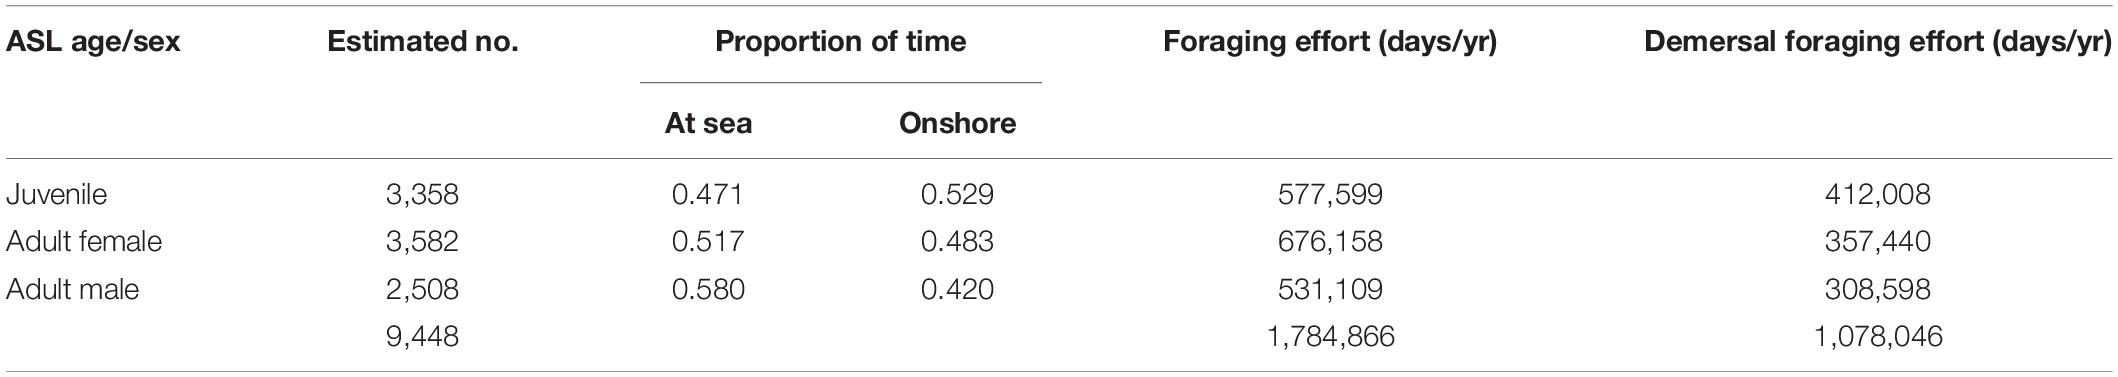
Table 1. Estimates of the number of juvenile, adult female and adult male ASL in the SA population and the proportion of time spent at sea and onshore based on satellite tracking data and their estimated overall total foraging and demersal foraging effort (seal days/yr).
To estimate ASL bycatch using the bycatch rate estimation model, the location of each net-set was required. However, prior to 2006, fishers only recorded catch and effort data within 1° × 1° blocks. In 2006, latitude and longitude recording of catch and effort was mandated by AFMA. As such, the level of historic bycatch was estimated based on fishing effort data for the period from the beginning of 2006–2009 inclusive (i.e., 4 years).
For this study, catch and effort data reported by latitude and longitude (to the nearest minute) were provided by AFMA. Effort data was reported in meters of net-set, and the duration of net-sets (soak-time, in minutes) was estimated based on the recorded time difference between the commencement of net-set to the commencement of net-haul.
Bycatch Impact on Population Viability
Population viability analyses incorporating Leslie matrix data for the Seal Bay subpopulation (Supplementary Table 4; Goldsworthy et al., 2020) were used to model changes in the abundance of all ASL subpopulations in SA through time, using the RAMAS® Metapop software (Version 3.0, Applied Biomathematics, Setauket, New York; Akçakaya, 1998). Only the female part of each subpopulation was modeled, so the estimated numbers in the first stage (pups) equaled half of the estimated pup production (assuming 1:1 sex-ratio at birth, Supplementary Table 1). Final stage survival rates were set to zero, with a standard deviation of 0.01 for all stage survival and fecundity estimates to provide a measure of environmental stochasticity (Akçakaya, 1998).
Density-independent PVAs were used to investigate the potential impacts of different levels of bycatch on ASL subpopulations. Individual subpopulations were modeled separately and assumed to be closed (i.e., no immigration or emigration). For ASLs, there is good evidence to support this assumption, with population genetic data indicating that the species demonstrates one of the highest levels of population subdivision among pinnipeds, with very high levels of mtDNA haplotype fixation among subpopulations (Campbell, 2003; Campbell et al., 2008; Lowther et al., 2012). These findings suggest that ASL females display extreme levels of philopatry, with little or no interchange of females among breeding colonies. Demographic stochasticity was simulated within RAMAS® Metapop, by sampling the number of survivors from a binomial distribution and pups from a Poisson distribution (Akçakaya, 1998).
PVAs were also used to investigate the potential implication of additional bycatch mortality on the status of each subpopulation. Conditional harvests within the population management feature of RAMAS® Metapop simulated the impacts of different levels of fishery bycatch, defined as the proportion of the total number of females aged > 1.5 years in a subpopulation removed per breeding season (1.5 years). Conditional harvests select only whole (integer) animals and select them from across all ages > 1.5 years, relative to their abundance within the subpopulation at the beginning of each modeled time step.
As the underlying rates of intrinsic growth are unknown for most ASL subpopulations, the implications of different bycatch rates were estimated for four intrinsic growth rates: 0%, 1%, 2% and 3% per breeding season. The different population growth models were simulated by adjusting relative survival levels and then calculating the resultant population trajectory (100 replicates of 34 breeding cycles, or 49.5 years).
Population viability analyses were used to predict the impact of different bycatch levels on future pup production. Non-pup stages were excluded from population totals at each time step to provide a time-series of estimated pup production for each simulation, because pup production is the principal metric used to estimate the status and trends in abundance of ASL populations (Goldsworthy et al., 2021). These were expressed as the exponential rate of increase (r), calculated from the slope of the exponential regression of pup numbers over time (breeding cycles); it was expressed as a percentage using the formula (er – 1) × 100.
Results of Bycatch and Population Impact Assessment
Overlap in Spatial Distribution of Gillnet Fishing Effort and Australian Sea Lion Foraging Effort
Annual fishing effort in the gillnet sector of the GHAT fishery off SA increased from around 3,000–12,000 km of net-set per year between 1973 and 1983, then to 43,000 km net-set in 1987. Fishing effort then decreased annually to about 23,000 km net-set in 1993 then increased to just over 32,000 km net-set in 1998. Annual fishing effort reduced in 2000 and remained at about 19,000 km net-set through to 2010, before declining to ∼3,000 km net-set to the end of June 2021 (most of this east of 139° longitude, i.e., outside of the ASL Management zones, see below) (Supplementary Figure 3).
The average annual fishing effort in the gillnet sector of the GHAT fishery off SA between 1 January 2006 and 31 December 2009 (4 years) was 4,971 sets (range 4,467–5,612), 17,682 km net-set (range 16,442–20,401) and 104,086 km.hr (range 92,213–121,258) (Figure 2A). Length of net-sets ranged between 1.0 and 6.2 km, with the most common lengths being 4.2 km (78%), 1.8 km (9%), 3.5 km (4%) and 2.4 km (3%). Soak-times averaged 5.8 h (sd = 2.6, range 0–24.0) and the net length times duration gave an average of 20.9 km.hrs per net-set (sd = 11.4, range 0.1–102.0).
Based on estimates of ASL pup production in 2010 (3,271), the total SA population size was 12,719, including 3,358 juveniles, 3,582 adult females, and 2,508 adult males (Table 1 and Supplementary Table 3). The total seal lion foraging effort was estimated to be 1,784,866 seal days/yr, or 1,078,046 demersal seal days/yr (Table 1). There was almost complete spatial overlap in gillnet fishing effort and sea lion foraging effort off SA in the mid-late 2000s (Figure 2). The main exceptions are the absence of fishing effort in the two gulfs and some of the coastal bays. These near coastal areas became closed to the fishery in 2001 when management of the school and gummy shark fishery was transferred from the State to the Commonwealth (Larcombe and McLoughlin, 2007). The very high degree of overlap in the gillnet fishing and sea lion foraging efforts is also apparent when effort is compared relative to depth and the minimum distance from ASL subpopulations (Supplementary Figure 4).
Observer Data
Observer data were collected over 146 sea days on ten trips (Table 2). A total of 994 km of net was observed hauled during 234 net-sets (Hamer et al., 2013), which equated to 19% of the total gillnet fishing effort over the 2-year program, or 37% of mean annual fishing effort. Twelve ASL bycatch mortalities were recorded; 10 (83%) of the dead sea lions dropped-out of the gillnet before or on contacting the net roller, as they ascended from the water (Hamer et al., 2013). The two (17%) dead sea lions that made it onto the deck of the vessel were small juveniles (one female, one male). Eleven of the 12 sea lions could be sexed, nine were female (6 adult, 3 juvenile) two were male (1 adult, 1 juvenile) and one juvenile was unable to be sexed (Hamer et al., 2013). The bycatch mortality rates based on the pooled observer data equated to 0.0513 seals/net-set, 0.0127 seals/km and 0.0021 seals/km.hr net-set (Table 2). Although the observer effort was largely collected from fishing activity off the western and lower Eyre Peninsula (Figure 3), the distribution of observer data relative to fishing depth and ASL foraging effort was representative of that of the broader fishery (Supplementary Figure 5).
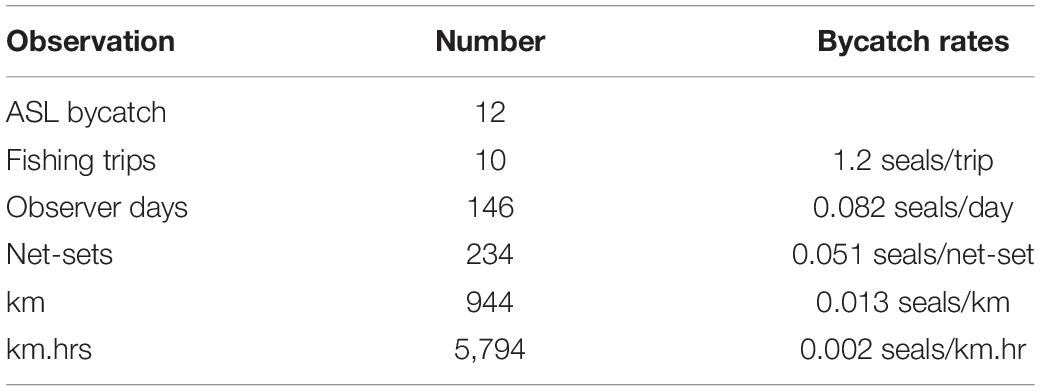
Table 2. Summary of the independent observer data collected in the shark gillnet GHAT fishery between February 2006 and February 2008.
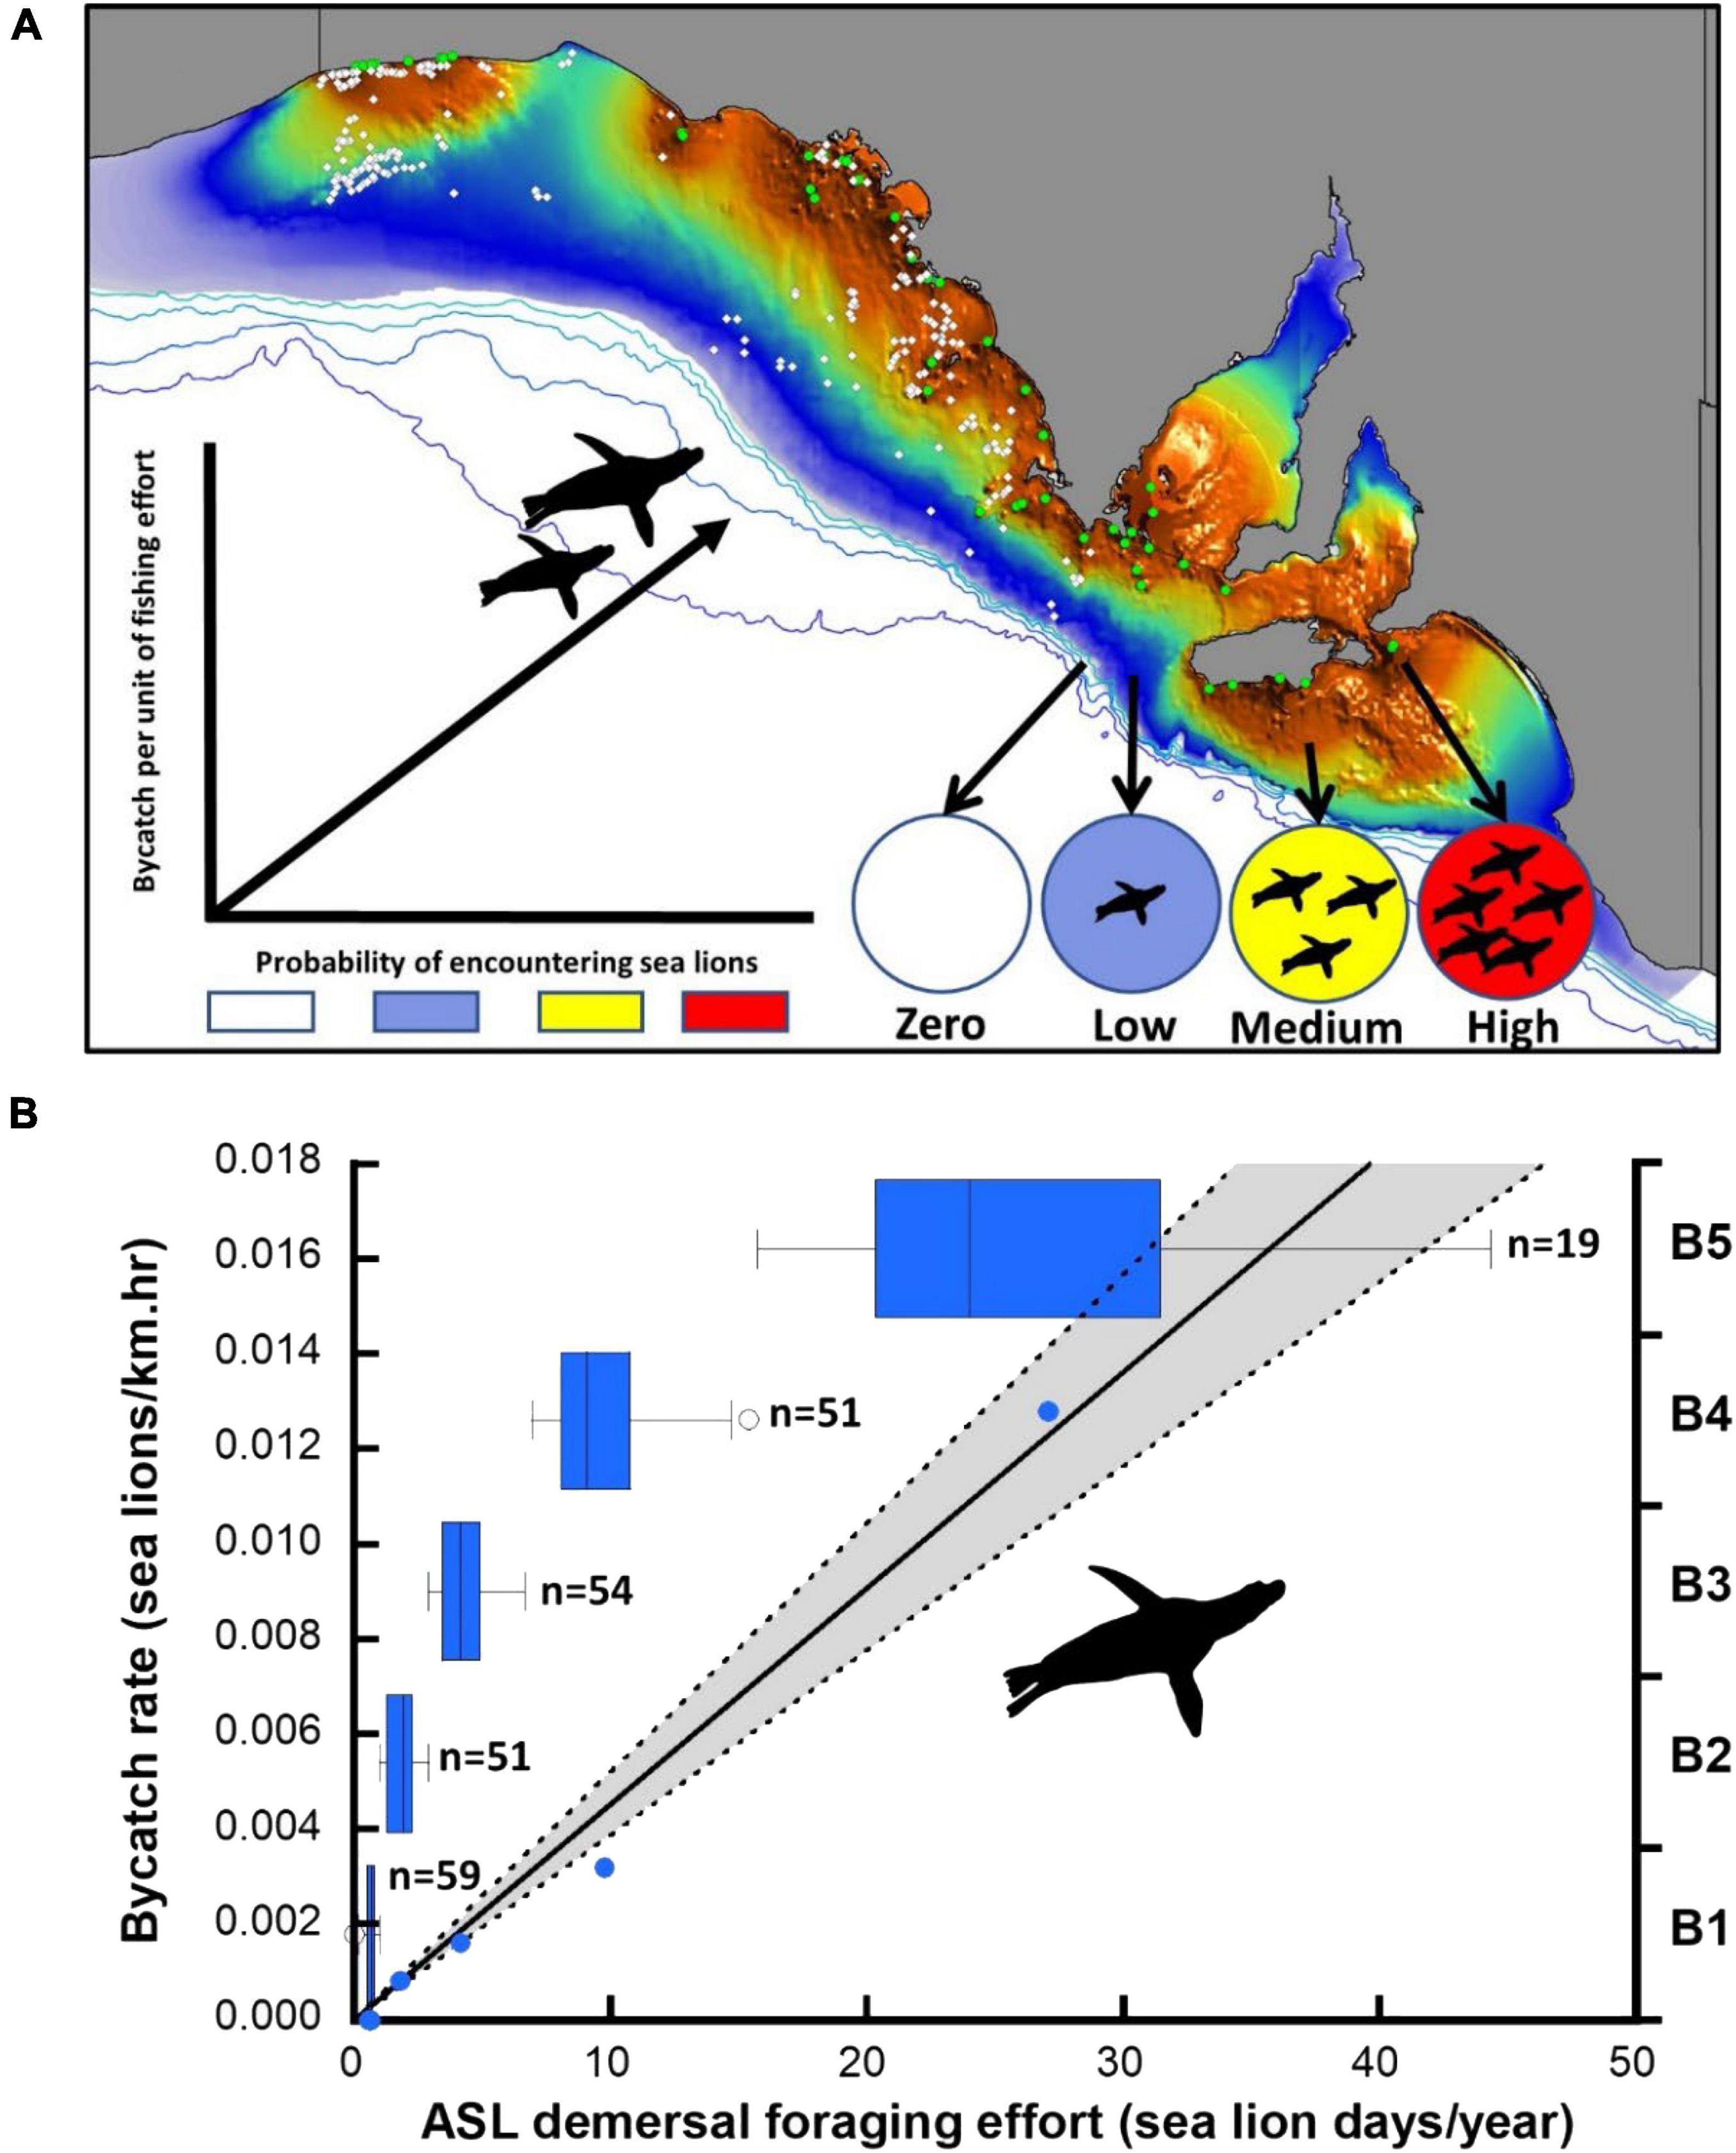
Figure 3. Distribution of observed net-sets (open circles) in the gillnet sector of the GHAT fishery off SA relative to the species distribution model of ASL demersal foraging effort (A). Colony locations (green circles) and the expected relationship between the probability of encountering sea lions and the bycatch rate per unit of fishing effort are indicated. (B) Linear model of the observed bycatch rate per unit of fishing effort and estimated ASL demersal foraging effort for the optimal 5-bin model (B1-B5), including box-plots to illustrate the sample size (observed net-sets) and foraging effort range differences of successive bins (blue circles are the data points underpinning the regression, 95% CL shaded).
Bycatch Rate Estimation Model
Using the species distribution model, sea lion foraging effort was estimated at the locations of the 234 independently observed net-sets (Figure 3). The expectation was that sea lion bycatch per unit of fishing effort would increase with increasing demersal foraging effort (the probability of encountering sea lions) (Figure 3). Because the percentage of net-sets observed was low and there was a large variation in underlying demersal foraging effort (0–44 d), individual observed net-sets were binned by increasing foraging effort. Five models were compared, with bin size ranging from four to eight (Table 3). The sample size (number of net-sets observed) within each bin was approximately equal for each model. Bycatch rate (seals/km and seals/km.hr) was significantly related to the underlying likelihood of encountering sea lions (demersal foraging effort) for all models (Table 3), was strongly linear and there was support for models with regression lines passing through the origin (Figure 3). This enabled the slopes of all models to be easily compared (Table 3). Model fits to variable bin numbers and sample sizes were examined, with the optimum derived from a 5-bin model (Table 3 and Figure 3). The statistical strength of these relationships supports the use of linear models to estimate the likely level of sea lion bycatch that would result from any level of fishing effort for any location.
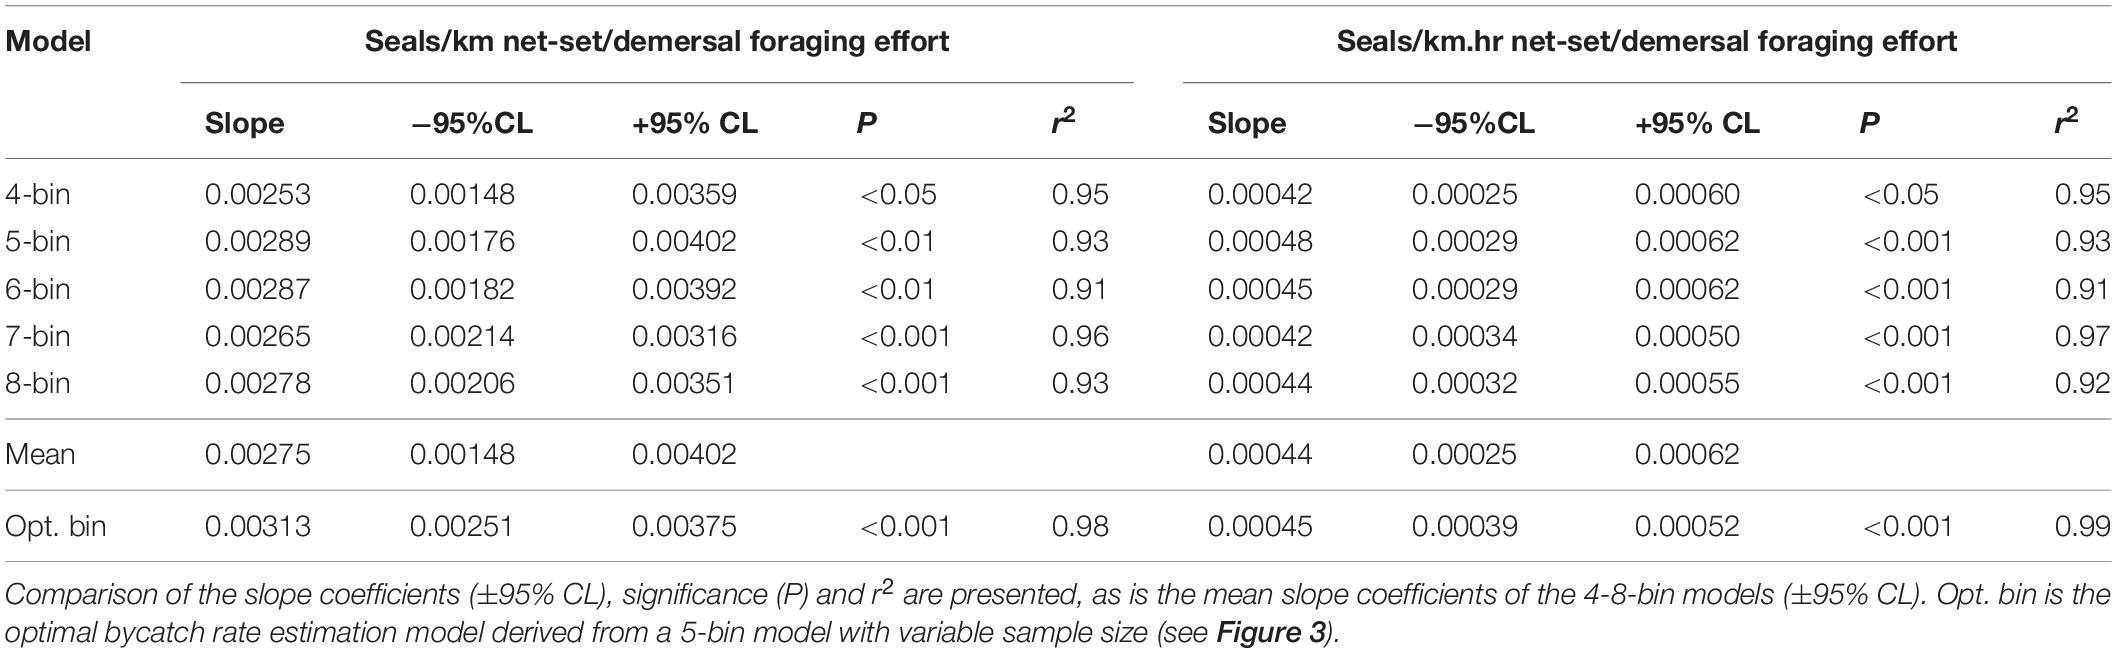
Table 3. Statistical and model coefficient outputs for alternate bycatch estimation models based on the number of data bins and their expression in terms of fishing effort (km and km.hrs).
The 1 km × 1 km array of ASL foraging effort contained 258,235 nodes where demersal foraging effort was > 0 (maximum value 687 seal days/year). Demersal foraging effort at the locations of the 234 observed net-sets ranged from 0–44 seal days/year, with only 1.3% of the 1 km × 1 km array nodes exceeding 44 seal days/yr. As no data were available to determine if the rates of sea lion bycatch per unit of fishing effort were the same as those described above in regions with > 44 seal days/yr, an upper limit of demersal foraging effort was set to the mean and ± 95% CL for 44 seal days/yr. This approximation will likely under-estimate the bycatch mortality rate in areas of very high ASL demersal foraging effort.
Estimated Sea Lion Bycatch
Based on vessel-observed ASL bycatch rates and the average level of fishing effort prior to bycatch mitigation efforts (2006–2009 inclusive), the annual bycatch mortality of ASLs in the gillnet (GHAT) fishery off SA was estimated to be 225 based on a bycatch rate of 0.0127 seals per km net-set, and 216 based on a bycatch rate of 0.0021 seals per km.hr net-set (Table 4).
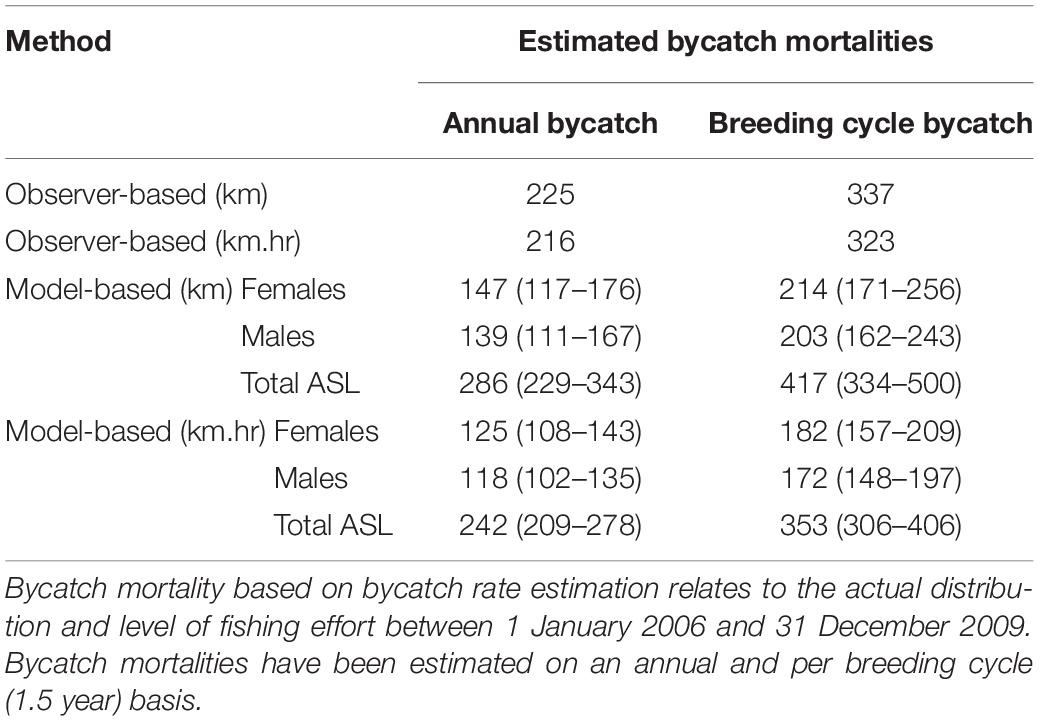
Table 4. Estimated ASL bycatch mortality in the gillnet sector of the GHAT fishery off SA based on observed rates of bycatch calculated from seals/km net-set (0.0127) and seals/km.hr (0.0021); and based on bycatch rate estimation (seal/km net-set and seals/km.hr), net-length (km) and net-length × soak time (km.hrs).
Based on the spatial distribution of fishing effort between 2006 and 2009, and the km.hr net-set model, the average annual ASL bycatch using the bycatch rate estimation method was 242 (209–278 ± 95% CL, Table 4). Annual and per-breeding cycle bycatch estimates for the km net-set models were about 18% higher than the km.hr net-set models. Bycatch estimates using the latter models are expected to be more accurate, given that the risk of bycatch is a function of both the net-set length and soak-time duration. Female ASLs accounted for 51% of the total estimated bycatch mortality, with an estimated bycatch of 125 (108–143, ± 95% CL) annually, or 182 (157–209) per breeding cycle (Table 4).
Bycatch Impact on Population Sustainability
Based on the ASL life-table with stable (0%) intrinsic growth, natural mortality of females > 1.5 years of age is 17.5% per 18 month breeding cycle. With the addition of the estimated level of female bycatch mortality (based on fishing effort between 2006 and 2009, inclusive), these rates increase by 3.6% (3.1–4.1%, ± 95% CL) to 21.0% (20.5–21.6%, ± 95% CL), representing a 20.5% (17.6–23.5%, ± 95% CL) increase above natural mortality levels in a stable population.
Between 2006 and 2009 (inclusive), an average of 2.6% (2.2–3.0% ± 95% CL, range 0–9.2%) of females (>1.5 years) in each subpopulation was estimated to have been lost to gillnet bycatch mortality per breeding cycle, assuming stable population growth.
Estimated impacts of bycatch on each subpopulation under different intrinsic growth scenarios (0, 1, 2, and 3%/year) vary markedly, with those off West Coast and southern Eyre Peninsula and in the Kangaroo Island region, expected to have the greatest rates of decline (Figure 4). Subpopulations within Spencer Gulf were least impacted as there was limited overlap between foraging distributions and fishing effort. Under the stable (0%) growth scenario, 92% of subpopulations were estimated to be in decline, including all subpopulations that overlapped with the fishery, with average growth rates of −3.5%/year (−4.1 to −2.4% ± 95% CL, range −20.1 to 0.0%). With a 1% growth scenario, 52% of subpopulations were estimated to be in decline, with average growth rates of −1.8%/year (−2.4 to −0.9% ± 95% CL, range −18.9 to 1.0%). With a 2% growth scenario, 40% of subpopulations were estimated to be in decline, with average growth rates of −0.1%/year (−0.6 to 0.6% ± 95% CL, range −16.3 to 2.0%). With a 3% growth scenario, 13% of subpopulations were estimated to be in decline, with average growth rates of 1.5%/year (1.1–1.9 to % ± 95% CL, range −9.4 to 3.0%) (Figure 4).
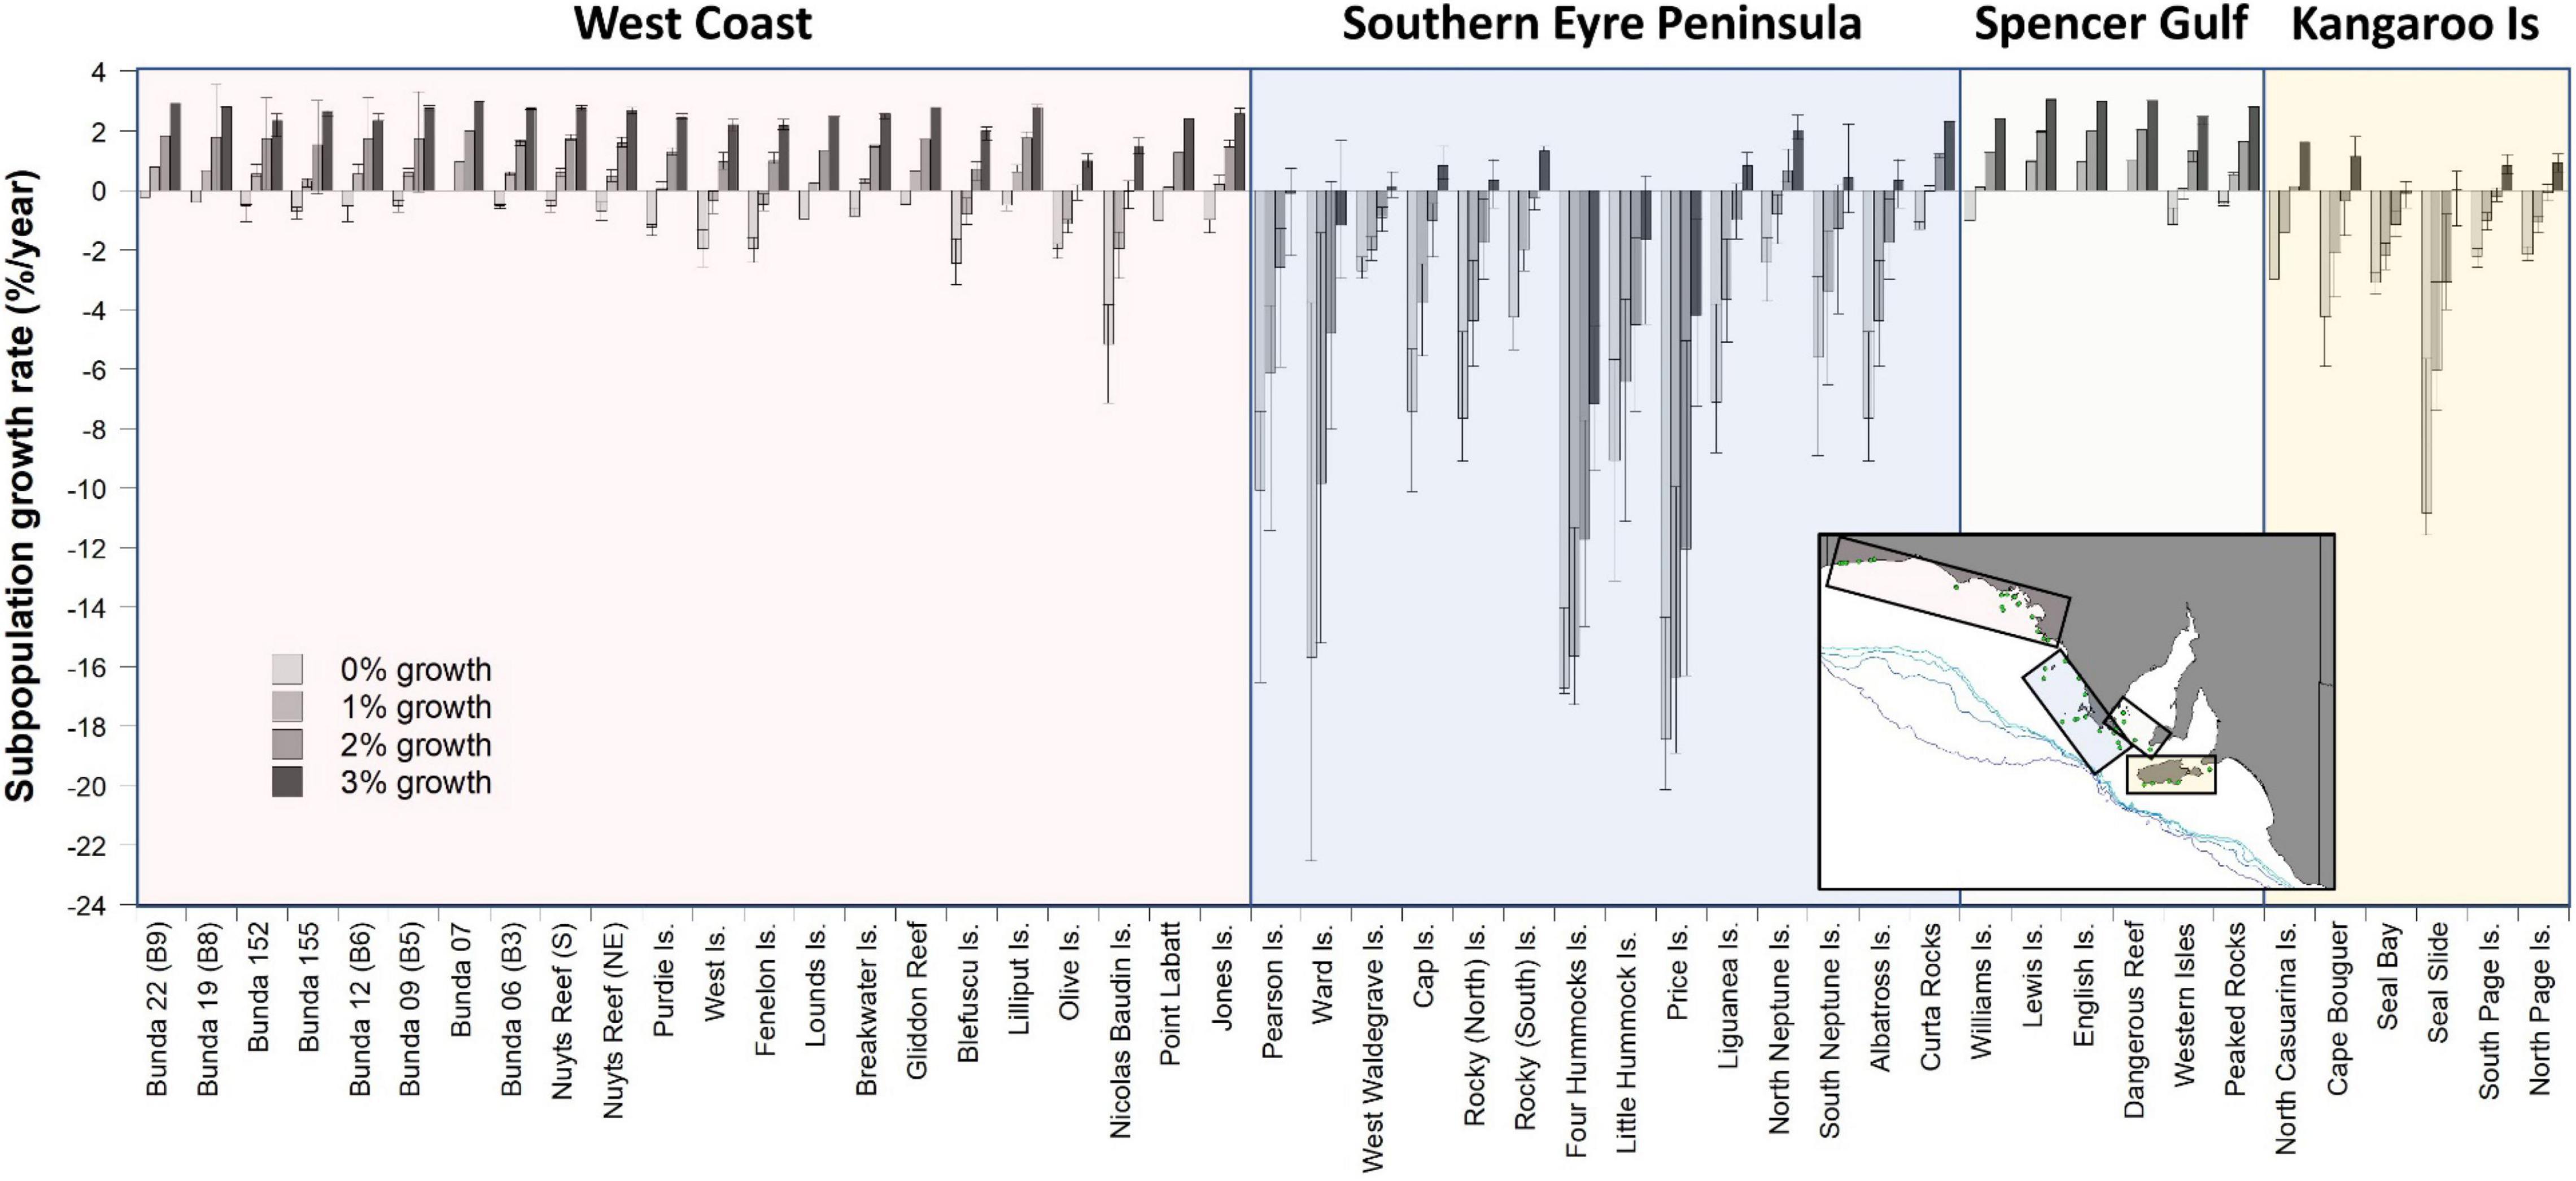
Figure 4. Estimated ASL subpopulation growth rates (±95% CL) based on the estimated bycatch mortalities resulting from the distribution of fishing effort in the gillnet GHAT fishery off SA from 2006 to 2009 (inclusive). Subpopulation growth rates are estimated for 34 breeding cycles (∼50 years) for four different intrinsic annual growth-rate scenarios (0, 1, 2, and 3%). Four regions are identified: West Coast, Southern Eyre Peninsula, Spencer Gulf and Kangaroo Island.
Implementation of Bycatch Management Measures
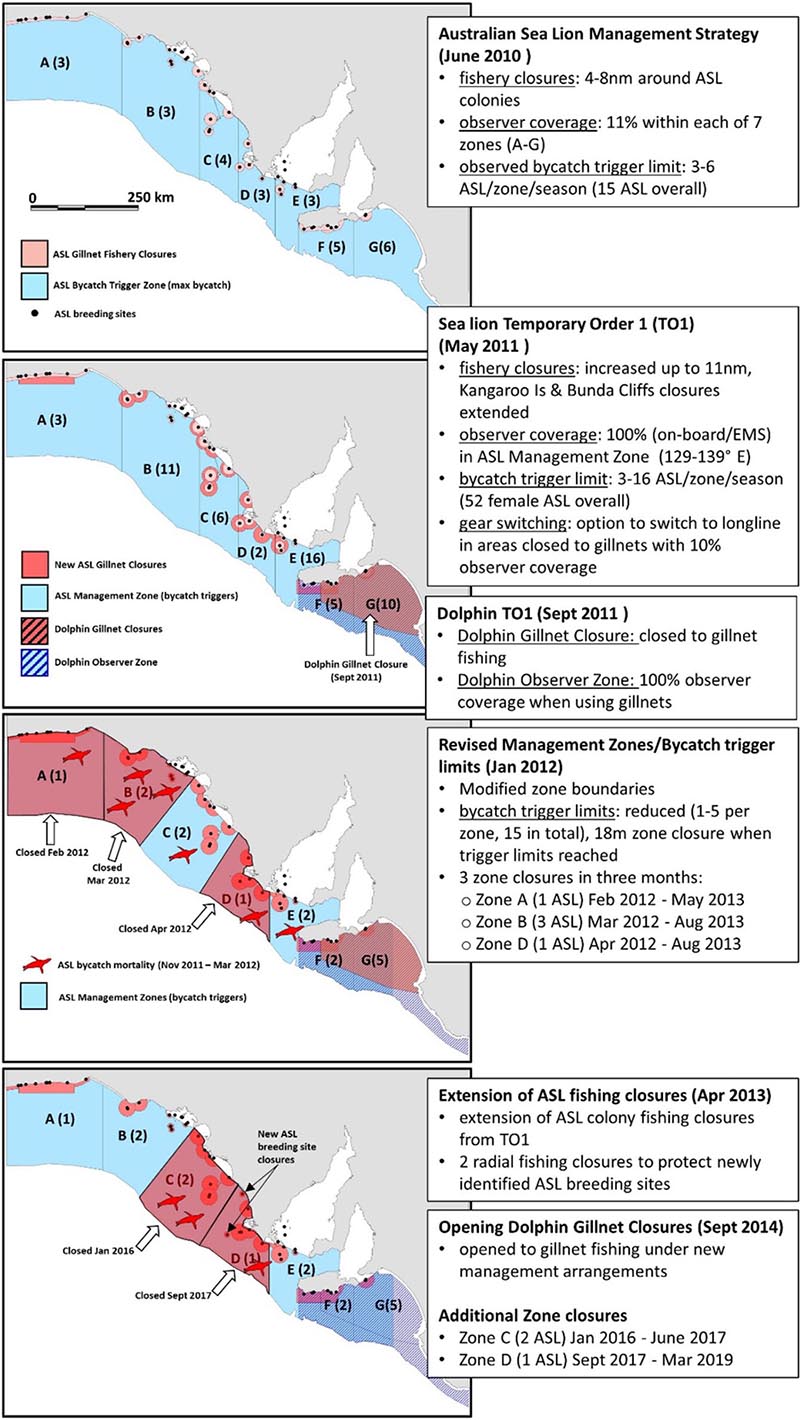
A timeline of the key bycatch mitigation and management actions implemented as part of the ASL Management Strategy between 2010 and 2013 by AFMA is presented in Box 1.
Box 1. A schematic of the key bycatch mitigation and management actions implemented as part of the ASL Management Strategy between 2010 and 2013.
Prior to the release of a report in April 2010 detailing unsustainable levels of ASL bycatch in the gillnet sector of the GHAT (Goldsworthy et al., 2010), AFMA undertook an observer program off SA (July 2009 to June 2010) that included sea lion specific observer protocols (100% of net-hauls observed to check for drop-outs). This included 108 sea days and 109 net-hauls (Australian Fisheries Management Authority, 2010). In December 2009 the gillnet fishing industry also introduced voluntary gillnet closures, 4 nm (7.3 km) in radius around all 48 known ASL breeding sites in SA (Australian Fisheries Management Authority, 2010).
In June 2010, AFMA implemented the ASL Management Strategy (Box 1). Key elements included increased independent observer coverage set at 11% of net sets within each of seven management zones (A-G) and formalizing the 4 nm fishery closures around all ASL colonies in SA (Baseline Closures), increasing the radius of closures to 6 nm (11.1 km) and 8 nm (14.8 km) around a number of ASL breeding sites estimated to be exposed to higher levels of bycatch mortality in the fishery (Goldsworthy et al., 2010) and additional 4 nm strip closures along the Bunda Cliffs and south coast of Kangaroo Island (Australian Fisheries Management Authority, 2010; Box 1). To reduce the incidence of bycatch in the areas open to the fishery, AFMA introduced bycatch mortality limits across each of the seven management zones that would trigger temporal spatial closures for the remainder of the financial year when zone-specific bycatch trigger limits were reached. Zone bycatch trigger limits ranged from 3–6 ASL per season with an overall trigger limit of 15 ASL for all of SA, based on 11% observer coverage. If 15 or more ASL mortalities were observed in a season, the remaining areas of the fishery would be closed until the end of the fishing season (Australian Fisheries Management Authority, 2010).
In May 2011, in response to under-reporting of marine mammal interactions by some fishers, AFMA introduced its Sea lion Temporary Order 1 (TO1). It increased observer coverage to 100% within an “Australian Seal Lion Management Zone” (SA coastal waters between 129° and 139° east longitude), either using on-board observers or electronic monitoring systems (EMS) that were being introduced into the fishery at the time. With observer effort increasing from 11 to 100%, the per zone observed trigger limits were increased to 3–16 ASL per season, with an overall trigger of 52 females or 104 ASL in total. The radius of some gillnet fishing closures around sea lion breeding sites were increased to 11 nm (20.4 km), including extension of the Bunda Cliffs and Kangaroo Island strip closures. In addition, TO1 gave affected fishers the option to switch to hooks (demersal longlines) in areas closed to gillnets, with 10% (rather than 100%) observer coverage (Box 1).
In September 2011, following 49 dolphin interactions in the previous 12 months, AFMA enacted a Dolphin Temporary Order which introduced a dolphin gillnet closure (27,239 km2) between Kangaroo Island and Cape Jaffa (see location in Box 1). A Dolphin Observer Zone was introduced in waters adjacent to the closed area that required 100% observer effort when using gillnets (Box 1). As with TO1, affected fishers were given the option to switch to longlines in gillnet closures, with 10% observer coverage. In November 2011, a second Sea lion Temporary Order (TO2) commenced that effectively extended the ASL gillnet fishery closures and required 100% observer coverage from TO1 until April 2013.
Following consultation with marine mammal experts and other stakeholders, AFMA introduced several changes to the bycatch trigger limits and management zones in January 2012. These included a marked reduction in the per zone bycatch trigger limits to 1–5 ASL per fishing season with an overall trigger limit of 15 ASL, and with zones closed for 18 months from the time the trigger limit was reached (instead of for the remainder of the fishing season). In addition, two zone boundaries (B/C, C/D) were modified to be almost perpendicular to the coast (Box 1). Following these management changes and the bycatch mortality of seven ASL over a 4-month period, three zone closures were triggered: Zone A (1 ASL death; closed Feb 2012, reopened May 2013); Zone B (3 ASL deaths; closed Mar 2012, reopened Aug 2013) and Zone D (1 ASL death; closed Apr 2012, reopened Aug 2013). Single ASL bycatch mortalities were reported for Zone C (trigger limit of 2 ASL) and Zone E (trigger limit of 2 ASL), with their zone trigger limits reset to zero in May 2012.
In April 2013, AFMA extended the TO1 gillnet fishing closures and added new radial closures around two newly detected ASL breeding sites at Cap and Rocky (South) Islands. Since then, two management zones were triggered and subjected to temporal closures: Zone C (2 ASL deaths; closed Jan 2016, reopened Jun 2017) and Zone D (1 ASL death; closed Sep 2017, reopened Mar 2019) (Box 1). The permanent spatial closures to gillnet fishing off SA introduced between 2010 and 2013 covered a combined area of 18,500 km2 (Australian Fisheries Management Authority, 2015a).
Evaluating Success of the Australian Sea Lion Management Strategy
Impact of Management Actions on Fishing Effort and Estimated Australian Sea Lion Bycatch Mortality
Using the methods developed to quantify ASL bycatch mortality (section “Estimating Sea Lion Bycatch and Population Impacts”), fishing effort data from 1 January 2006 to 30 June 2021 were used to estimate changes in ASL bycatch in the gillnet sector of the GHAT fishery off SA (i.e., estimating ASL demersal foraging effort for each net-set location, and with net soak time, applying the bycatch rate estimation model to estimate sea lion bycatch mortality) and concomitant changes in effort of the gillnet and the longline fisheries.
The introduction of management measures to mitigate ASL bycatch (largely through the ASL Management Strategy) had immediate effect on gillnet fishing effort and ASL bycatch mortality (Figure 5). Within 2 years of the implementation of the ASL Management Strategy, gillnet fishing effort had reduced by 80%, and ASL bycatch mortality had declined by an estimated 84% (Figure 5). By June 2021, gillnet fishing effort had declined by 95% off SA (and by 98% within the ASL Management Zone), and estimated ASL bycatch mortality had declined by 98% from pre-bycatch management levels. Concomitant with the management restrictions on gillnets, the use of demersal longlines increased fivefold over pre-bycatch management levels (Figure 5). Despite these marked changes in fishing effort and gear type, the catch of the main target species (gummy shark) taken within the ASL Management Zone was similar in 2020/21 to that in 2009/10, the year prior to the implementation of the ASL Management Strategy (264,342 and 265,038 kg, respectively). Over this time, the portion of the catch taken by gillnets declined from 96 to 2%, while the portion of the catch taken using demersal longlines increased from 4 to 98%.
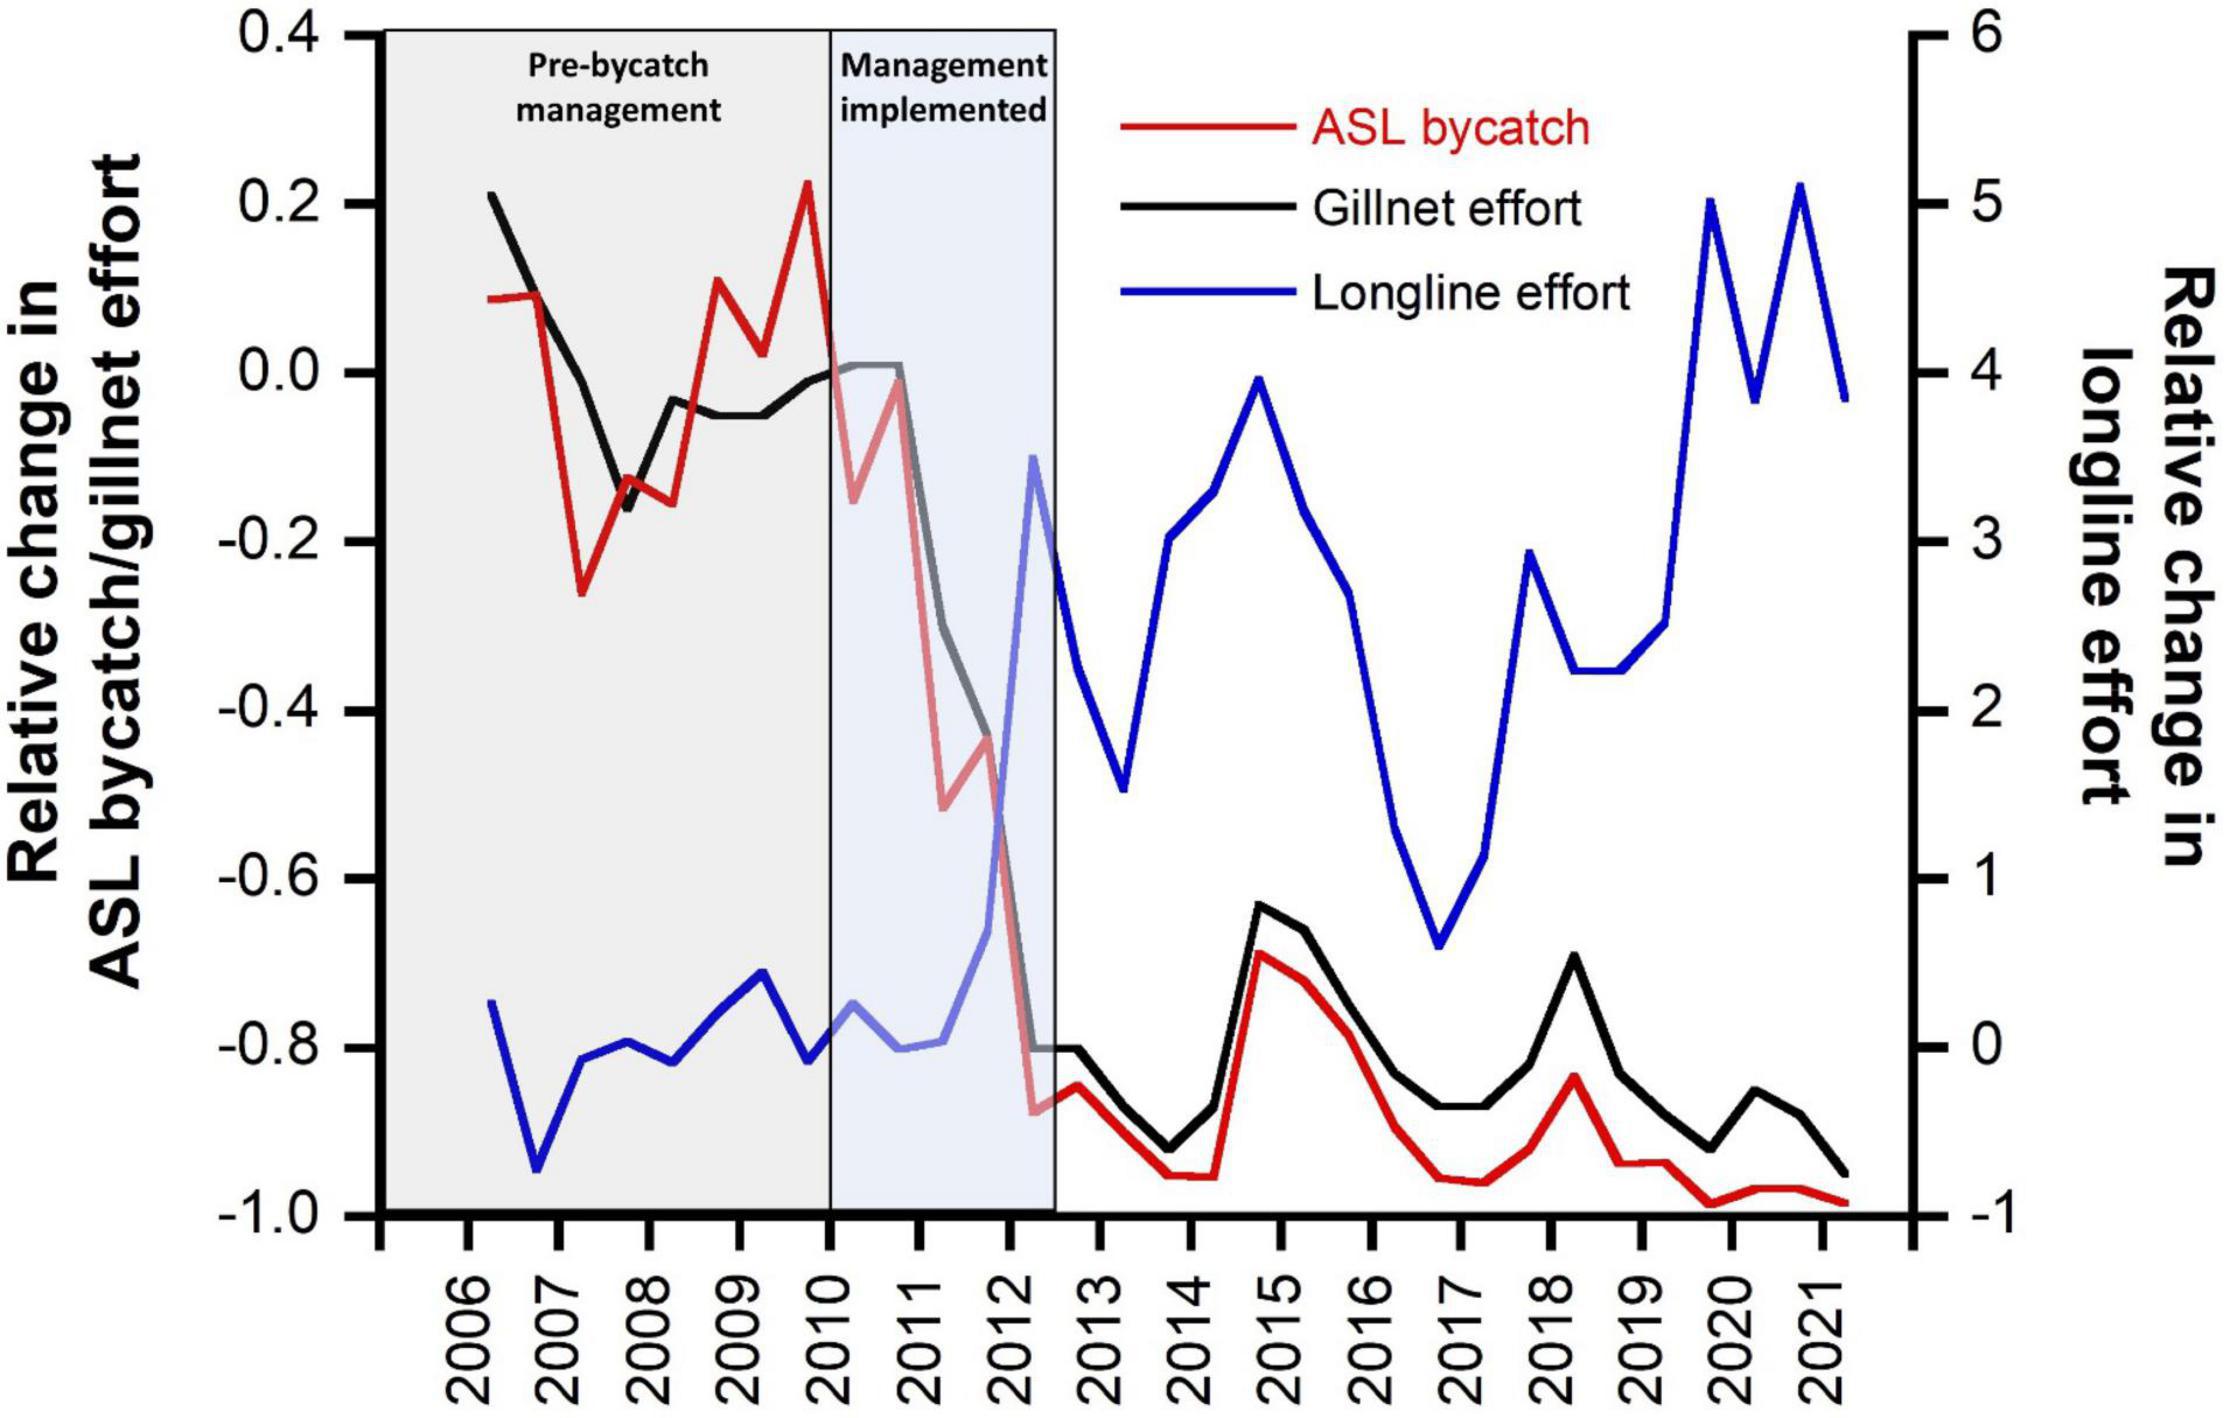
Figure 5. Changes in gillnet and longline fishing effort and estimated ASL bycatch relative to average pre-management levels (2006–2009, inclusive) in the GHAT fishery off South Australia. Time periods are highlighted for before and after implementation of bycatch management.
Impact of Management Actions on Australian Sea Lion Bycatch
Reported interactions with seals in the GHAT fishery off SA since the introduction of 100% monitoring of fishing effort in 2011 (by observers, electronic monitoring and vessel logbooks) declined consistently (Figure 6). The species of seals recorded interacting with fishing activity by fishers in their logbooks, or recorded through EM is not always reliable, but it is likely that most were ASL. In 2011 and 2012, a total of 11 and 10 interactions were recorded, respectively, and following the 18-month closures of three ASL Management Zones in 2012, only one seal interaction was reported. When these three zones re-opened, seal interactions increased to eight in 2014, and steadily declined thereafter.
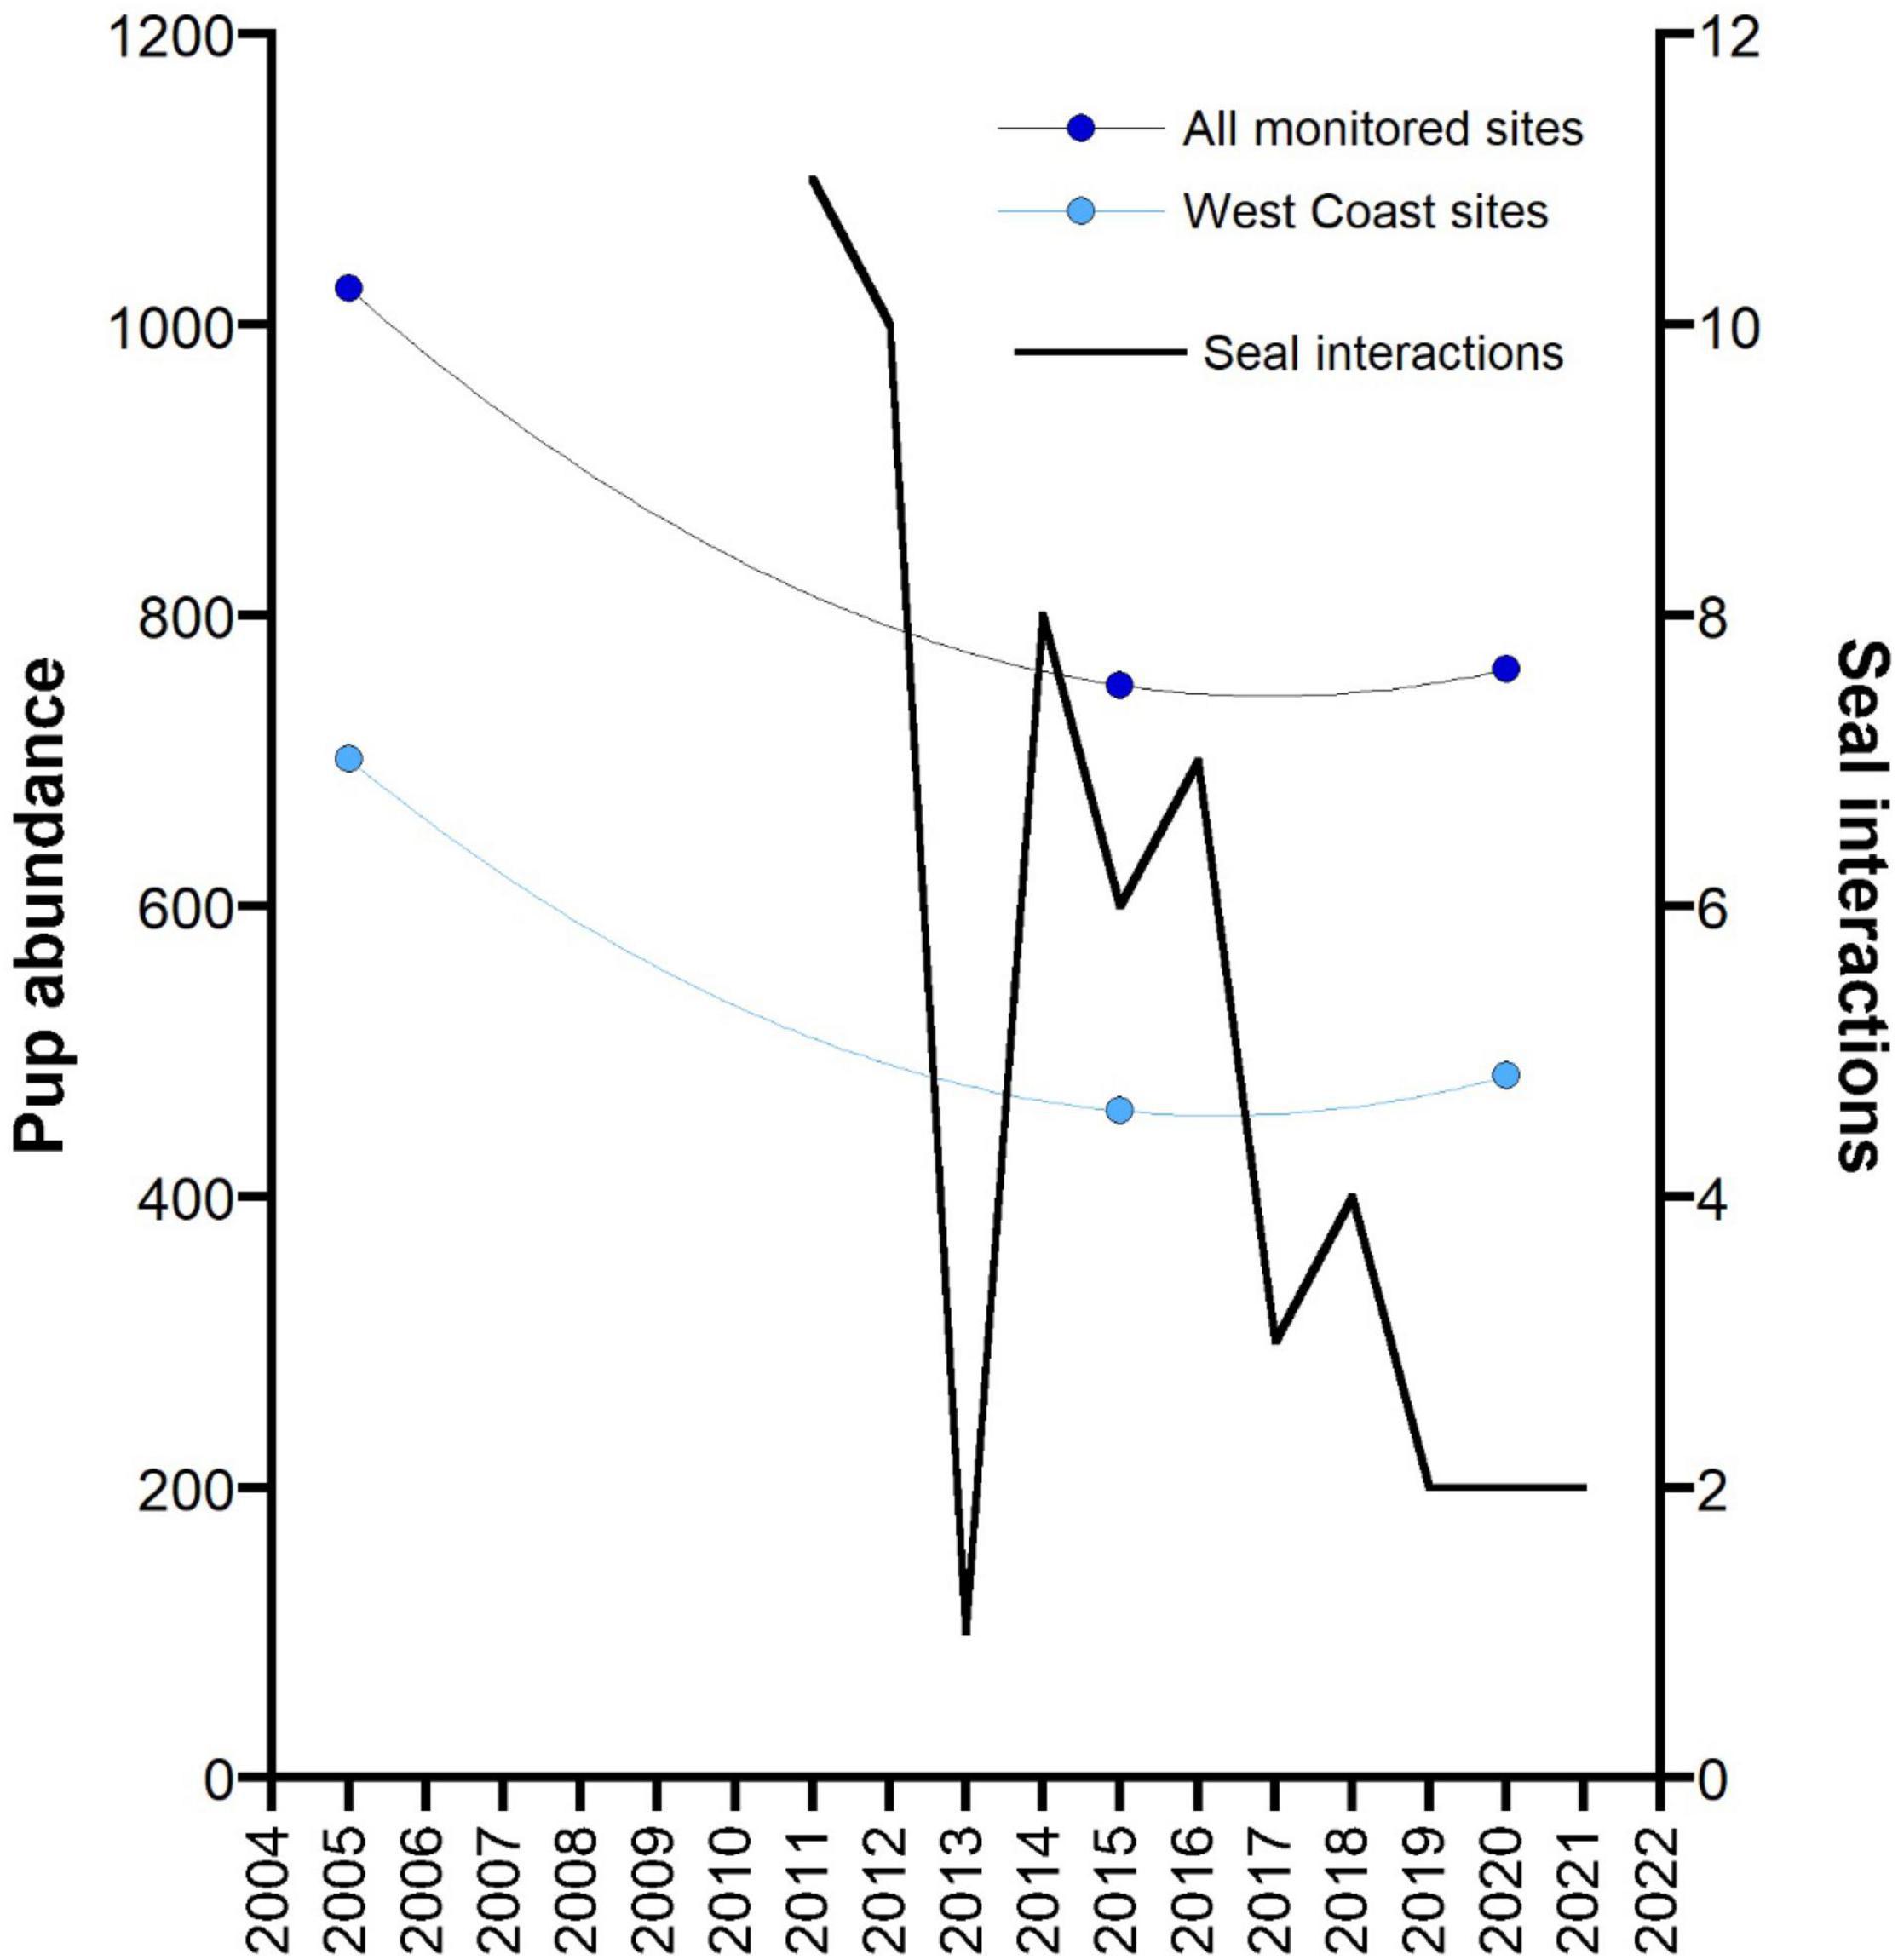
Figure 6. Changes in the total pup abundance from 12 monitored ASL breeding sites in the area of the GHAT fishery off South Australia across three main survey periods: the mid-2000s (2004–2006), mid-2010s (2014–2015) and the late 2010s (2019–2020). Data for a subset of these sites on the west coast of the Eyre Peninsula (West Coast sites) are also presented. Both data sets are fitted to a second order polynomial. The reported number of interactions with seals in the GHAT fishery off SA since the introduction of 100% monitoring of fishing effort (2011) (by observers, electronic monitoring and vessel logbooks) are also presented.
Impact of Management Actions on Change in Sea Lion Abundance
Although the ratio of pups to total population varies in relation to a pinniped’s population status (declining, stable, increasing), monitoring changes in pup numbers over time still provides an valid index of change in population growth (Berkson and DeMaster, 1985). The data on pup abundance for ASL breeding sites off SA is patchy, with time-series data only available for a subset of breeding sites and for variable time periods (Goldsworthy et al., 2021). To assess if there has been a change in population abundance prior to and following the introduction of bycatch mitigation measures in the GHAT fishery off SA, we compared the total pup abundance from a subset of 12 ASL breeding sites from the area of the fishery (Spencer Gulf populations excluded) that had been surveyed in each of three main surveys conducted in the mid-2000s (2004–2006), the mid-2010s (2014–2015) and the late 2010s (2019–2020). Total pup numbers declined by 26.6% between the mid-2000s and mid-2010s. This decline appeared to have been arrested by 2020, with a 1.5% increase in pup numbers between 2015 and 2020 (Figure 6). The strongest indication that the decline had been arrested came from the west-coast Eyre Peninsula breeding sites that made up most (75%) of the monitored breeding sites. These sites showed a 34.5% decline between the mid-2000s and mid-2010s (701–459) then increased by 5.2% up to 2020 (Figure 6).
Discussion
Estimating Pre-management Bycatch and Its Impact on Australian Sea Lion Populations
This study confirms previous reports indicating that high levels of bycatch mortality of ASL occurred in the demersal gillnet sector of the GHAT fishery off SA, prior to the introduction of management measures to mitigate bycatch in 2010 (Goldsworthy et al., 2010; Hamer et al., 2013). The level of bycatch mortality impacting most subpopulations then was likely to be unsustainable and may have led to subpopulation extinctions and reductions in sea lion range unless the bycatch mortality was reduced.
This study provides a unique and comprehensive assessment of bycatch impact that combined independent observer data with species distribution models (underpinned by extensive satellite tracking, abundance data and population modeling), enabling the relationship between sea lion foraging effort and observed bycatch rate to be modeled. These models allowed sea lion bycatch to be estimated across the fishery, the impacts on subpopulations to be assessed, and the potential benefit of alternate management options (gillnet fishing closures, redistribution of fishing effort) to be evaluated (Goldsworthy et al., 2010). Results were clear and compelling and drove prompt management action. The approach provides a good example of how spatial analyses of marine megafauna movement data can be used to inform marine spatial management (Sequeira et al., 2019). Although species distribution models have been used previously to identify potential bycatch hotspots (Thorne et al., 2019), this study is unique in demonstrating that foraging effort (encounter probability) correlates with bycatch rate. Moreover, the results enabled the development of bycatch rate estimation models that were used to estimate bycatch across the fishery, and inform management options (Goldsworthy et al., 2010).
Spatial analyses indicated almost complete overlap between the distributions of ASL foraging and gillnet fishing effort with most of the pre-management fishing effort occurring within the depth and distance limits of foraging sea lions. The only subpopulations where overlap was likely to be low were in southern Spencer Gulf, which was closed to the GHAT fishery in 2000. Using the bycatch rate estimation model, average annual bycatch mortality of sea lions in the late-2000s, using updated population data, was estimated to be 242 (209- 278); very similar to that estimated by Goldsworthy et al. (2010) (256 sea lion per year, 187–347). These values are about 12–18% higher than those obtained using a simple multiplication of vessel-observed bycatch rates with total fishing effort and are likely to be more accurate because they consider the spatial heterogeneity in interaction probability. They are also about 15% greater than the estimate of Hamer et al. (2013) (193–227 per year) based on fishing effort off SA between 2000 and 2008. Bycatch mortality was estimated to increase total mortality (natural + bycatch mortality) by ∼20% (assuming stable intrinsic growth), and to have contributed significantly to the decline in many ASL subpopulations (e.g., 40–92% of subpopulations in decline with intrinsic growth rates ranging from 0–2%/year).
The impacts of bycatch mortality on the sustainability of ASL populations off SA have likely been substantial, given the levels of historic gillnet fishing effort and the absence of management regulations to reduce bycatch for almost 50 years since gillnets were introduced into the fishery in 1964 (Kailola et al., 1993; Larcombe and McLoughlin, 2007). Total fishing effort in the late 1980s and early 1990s was more than double the mean fishing effort between 2000 and 2010 when bycatch of ASL (pre-management) was assessed (Supplementary Figure 3). The distribution of ASL abundance across the species’ range is notably uneven, with small subpopulations next to medium and larger sites and no apparent spatial pattern (Goldsworthy et al., 2021). This marked within-region heterogeneity in the size and trends in subpopulations likely reflects variability in natural and anthropogenic factors at a local scale (Goldsworthy et al., 2021). Pronounced inter-site and inter-individual differences in foraging strategies, identified from tracking studies (Lowther and Goldsworthy, 2011) potentially facilitate the shaping of within-region differences in population dynamics. Vulnerability to bycatch mortality is tightly coupled to the foraging distributions of individual sea lions. As such, subpopulations and individual sea lions with foraging distributions that closely match the distribution of fishing effort are likely to have been highly selected against over multiple decades of interactions with the gillnet fishery, potentially shaping the uneven distribution of abundance and the prevalence of small and declining subpopulations (Goldsworthy et al., 2021). Evidence from this study suggests that sequential depletion of ASL subpopulations from bycatch mortality in the gillnet fishery is likely to have contributed significantly to the marked (>60%) decline in the species abundance over the last 40 years, and to their Endangered status (Goldsworthy, 2015; Goldsworthy et al., 2021). Our analyses support the assessment of Goldsworthy et al. (2020) that historic (pre-management) bycatch in the gillnet fishery could explain an up to 7%/year decline in ASL numbers off SA.
As significant as historic (pre-management) bycatch levels have likely been, our analyses probably underestimated the magnitude of bycatch mortality in the gillnet fishery and its impacts on ASL populations. Our observer program recorded 10 of the 12 (83%) observed sea lion bycatch mortalities to drop out of the gillnet before reaching the net roller and deck. Based on this, fewer than 20% of bycaught animals could reach the deck of fishing vessels. The body size of ASLs caught in gillnets is likely to be the main factor determining the likelihood of dropping out, as the two animals observed to reach the deck were small juveniles. It is likely that an additional portion of bycaught sea lions drop out below the surface as the net tension increases during hauling operations. These would be undetectable to an observer on the vessel. The extent of sub-surface drop-outs, or cryptic mortality is unknown but its contribution to overall bycatch mortality could be significant. If cryptic bycatch contributed an additional 5–10% bycatch mortality, the implication for the sustainability of ASL populations would be substantial. A number of studies have attempted to estimate cryptic bycatch mortality of marine mammals, mostly of small cetaceans (Moore et al., 2021). Cryptic sources of fishing mortality are not just an issue for marine mammal bycatch and its estimation can be very challenging (Gilman et al., 2013).
Key Management Actions
Following the release of a report detailing unsustainable levels of ASL bycatch in the gillnet sector of the GHAT off SA (Goldsworthy et al., 2010), AFMA’s implementation of the ASL Management Strategy had immediate impacts on the fishery. It resulted in significant reductions in fishing effort (especially in proximity to sea lion breeding sites) and on the reported bycatch mortality of sea lions. In the decade since these measures were introduced, there has been an almost complete transition to alternate fishing gear (gillnets to longlines), a reduction in the numbers of reported ASL interactions and an apparent stabilization in pup abundances of some impacted ASL populations. Key elements of the ASL Management Strategy that have reduced the bycatch of ASLs are discussed below.
Independent Observer Program
The comprehensive observer program developed through the ASL Management Strategy has arguably underpinned the success of the other measures introduced to reduce the bycatch mortality of ASLs. Following introduction of the Strategy, independent observer coverage was set at 11% of net sets within each of seven ASL Management Zones (A-G) but was increased to 100% in May 2011 following under-reporting of marine mammal interactions by some fishers. Observer coverage was met initially by on-board observers or using electronic monitoring systems, but from July 2015, electronic monitoring became mandatory (Australian Fisheries Management Authority, 2015a). AFMA independently reviewed all footage from vessels using gillnets in the ASL Management Zone, and between 2011 and 2015 detected no cases where a fisher failed to report an ASL interaction (Australian Fisheries Management Authority, 2015a). The introduction of electronic monitoring across a number of AFMA managed fisheries has led to a significant increase in logbook reporting of protected species interactions, including ASLs and dolphins in the GHAT fishery (Emery et al., 2019). Under Australia’s Environment Protection and Biodiversity Conservation Act 1999 (EPBC Act), all interactions with protected (EPBC Act–listed) species must be reported in fishery logbooks.
Spatial Fishing Closures
A combination of permanent and temporal spatial fishing closures was the core mitigation strategy to reduce ASL bycatch mortality. The intent of permanent gillnet fishing closures was to remove fishing effort from areas of high sea lion foraging effort where the impacts on subpopulation sustainability were potentially greatest. Permanent gillnet fishery closures were introduced around all SA ASL breeding sites in 2010, with further increases introduced in 2011 and 2013 (Australian Fisheries Management Authority, 2015a). The different sizes of permanent closures were based on the combination of bycatch risk (estimated number of mortalities), subpopulation vulnerability (extinction risk) and size (extra protection to larger breeding sites) (Goldsworthy et al., 2010; Australian Fisheries Management Authority, 2015a). As central-place foragers, breeding sites represent core locations where sea lions return to rest between foraging trips. As such, the areas around breeding sites are continually traversed by animals departing and returning from foraging trips and represent areas with the greatest risk of bycatch from any fishing effort. Placing permanent gillnet fishing closures around all breeding sites greatly reduced the risks of bycatch from these high-density areas.
In contrast to permanent spatial closures, temporal closures were applied to areas open to gillnet fishing within the ASL Management Zone, with the intent to reduce sea lion bycatch mortality to within sustainable limits. An upper bycatch limit, or trigger limit was set for each of seven zones, as well as an overall bycatch limit. The temporal closure duration when a zone trigger limit was reached was originally set for the remainder of the fishing season (irrespective of when a trigger was reached), but in 2012 it was increased to 18 months (the breeding cycle duration of ASLs) (Australian Fisheries Management Authority, 2015a). AFMA determined that a bycatch rate of 1.5% of sea lion females per breeding cycle would be sufficiently precautionary and applied this to the total female population within each zone. However, noting the large number of small and genetically isolated breeding sites, and that for most (80% of ASL sites) a single female bycatch mortality would exceed the 1.5% limit (if applied to subpopulations), AFMA recognized the need to manage bycatch mortality at the subpopulation level and introduced more precautionary zone trigger limits (1–5 sea lions per zone) (Australian Fisheries Management Authority, 2015a). These arrangements came into effect in January 2012, reducing the overall annual trigger from 52 to 15 sea lions, and most zone triggers to just 1–2 sea lions per fishing season. Following the bycatch mortality of seven ASL over a 4-month period, three zones were closed by April 2012. This management action had immediate effect in markedly reducing gillnet fishing effort, driving the transition to alternate fishing gear, and reducing ASL bycatch mortality.
Gear Switching
Recognizing the impact on fishers from the large permanent and temporal gillnet closures on their capacity to catch their shark quota, AFMA provided incentives for fishers to switch fishing gear. This included the ability to fish with shark hooks (bottom-set longlines) inside both permanent and temporal gillnet closures and to do so with just 10% observer coverage (Australian Fisheries Management Authority, 2015a). In the decade following introduction of the Strategy, there was a progressive decline in gillnet fishing effort from within the ASL Management Zone and an increase in longline effort. By the 2020/21 fishing season, longlines accounted for 98% of the gummy shark catch within the ASL Management Zone, and catch levels were back to pre-management levels. Although nine interactions between seals (including fur seals) and longline fishers were recorded off SA between 2011 and 2018, only one was recorded as fatal (a fur seal) and in all three encounters with ASL the animals were reported alive.
Despite the apparent success of gear switching, it created significant challenges for fishers. Some continued to use gillnets in fishing grounds outside of the ASL Management Zone, including Bass Strait. Fishers who switched to longlines have faced increased costs associated with purchasing or modifying their vessels, setting up new gear, buying bait and hiring additional crew to assist with baiting and setting/hauling gear. Furthermore, between 2005 and 2015, an Australian Government voluntary fishing concession buyback scheme resulted in a 27% reduction in the number of vessels fishing for shark off SA (Australian Fisheries Management Authority, 2015a). The impacts and cost associated with adapting to changes from the ASL Management Strategy, likely influenced the decision of some fishers to take a buyback and exit the fishery. There have also been stock sustainability concerns that have arisen with the transition from a more selective (gillnet) to less selective (longline) fishing method, as well some interactions with seabirds (shearwaters and albatross) that AFMA continue to monitor (Knuckey et al., 2014; Australian Fisheries Management Authority, 2015a).
Implications of the Australian Sea Lion Management Strategy for Australian Sea Lion Recovery
Australian Fisheries Management Authority’s ASL Management Strategy was implemented to address Wildlife Trade Operations (WTO) requirements set on the gillnet sector of the GHAT fishery under Part 13A of Australia’s EPBC Act, with similar requirements now listed under Part 13 (Protected Species) (Department of Agriculture Water and the Environment, 2019). Recent assessment of the Southern and Eastern Scalefish and Shark Fishery, which the GHAT fishery forms part of, requires “AFMA to continue to: (a) maintain management measures clearly directed toward limiting the impact of fishing activity on Australian Sea Lions to levels which will assist in enabling the recovery of the species, including all subpopulations, and (b) monitor and review the adequacy of its Australian Sea Lion management measures, in consultation with marine mammal experts.” Results from this study suggest that the Strategy has been highly successful in significantly reducing ASL bycatch mortality resulting from gillnet fishing, through a combination of measures that included a comprehensive observer program, permanent and temporal fishing closures with bycatch trigger limits, and incentives to switch gear that resulted in an almost total transition from gillnets to longlines in the ASL Management Zone. These measures have directly led to an estimated 98% reduction in ASL bycatch from gillnet interactions. There are potential residual risks from cryptic mortality that remain uncertain but given low gillnet fishing effort in the ASL Management Zone, these risks are likely to be low. Ongoing assessment of the level and spatial distribution of gillnet effort is warranted.
Although there has been comprehensive monitoring of how management measures have reduced the mortality of ASL through AFMA’s electronic monitoring program (with 100% review of footage from gillnet fishers in the ASL Management Zone), there has been no systematic monitoring of changes in abundance of ASL subpopulations to assess if these management measures have enabled recovery of the “species, including all subpopulations.” Some population monitoring has occurred since the introduction of the ASL Management Strategy, but it has largely been opportunistic (Goldsworthy et al., 2021). Although pup abundance trends from some affected subpopulations detailed in this study suggest that declines have slowed and possibly halted, consistent and long-term monitoring is required to demonstrate that the fishery is meeting its requirements under Part 13 of the EPBC Act.
A recent study suggested that the minimum time to detect at least a 5% increase in pup abundance, with modest recovery rates (∼1%/year), following a hypothetical management action to eliminate bycatch mortality was 6 years (Goldsworthy et al., 2020). This period is consistent with the age of recruitment in ASL, where most females have their first pup at age six (although some not until 10.5 years). However, the actual time required to detect a recovery is uncertain, and would be influenced by multiple factors including the frequency, timing, and precision of surveys, as well as seasonal and stochastic environmental factors that affect pup production within any breeding season and the underlying intrinsic growth rate (Goldsworthy et al., 2020). Taking these factors into account, it may take 1–2 decades to be confident that a recovery has or has not occurred. Given this long period, it is important for current management strategies that aim to limit fishery impacts on ASL to remain in place, and for systematic monitoring of ASL populations to be implemented and continued. The extent to which mitigation of gillnet fishery bycatch mortality by AFMA has addressed broader ASL conservation concerns for the population off SA, such as those detailed in the species recovery plan (Department of Sustainability Environment Water Population and Communities, 2013), can only be evaluated with further monitoring of populations.
There are two other sectors in Australia that manage demersal gillnet fisheries that potentially interact with ASL populations. The large mesh gillnet component of the Marine Scalefish Fishery managed by the SA Government, and the Temperate Demersal Gillnet and Demersal Longline Fishery managed by the Western Australian (WA) Government. The SA and WA Governments are also required to limit gillnet fishery impacts on sea lions under Part 13 of the EPBC Act, but they have done this differently to the Australian Government (AFMA). SA fishers are not permitted to target gummy or school shark, and instead use large-mesh gillnets to target whaler sharks (Carcharhinus brachyurus and C. obscurus). The gillnet catch is small (<6 t between 2013 and 2018) with longlines accounting for ∼90% of recent catch (Steer et al., 2020). To address potential interactions between the fishery and sea lions, the Department of Primary Industry and Regions SA introduced large-mesh net effort-triggers in 2016 that could invoke fishery area closures, but no trigger limits have been reached since implementation (Department of Primary Industries and Regions South Australia, 2019). There are presently no restrictions on using this gear type in any of the AFMA ASL permanent closures, many of which occur within SA State waters, and there is no independent observer program in the fishery to monitor interactions with sea lions.
In WA, the Temperate Demersal Gillnet and Demersal Longline Fishery operates in continental shelf waters off the south and lower west coasts and utilizes similar vessels and gear to that used in the gillnet sector of the GHAT fishery, with about 820 t of sharks and rays landed in 2017/18, mostly using gillnets (Braccini and Blay, 2020). In 2018, the WA Department of Primary Industries and Regional Development introduced gillnet exclusion zones (6–33 km radial gillnet closures) around 33 ASL breeding sites covering a total of 17,300 km2 (Department of Primary Industries and Regional Development, 2021). However, given the absence of vessel monitoring systems (independent observer coverage or electronic monitoring), management measures to reduce sea lion bycatch in the areas fished (e.g., bycatch trigger limits) and monitoring of ASL populations, there is no capacity to assess the degree to which gillnet closures are reducing the incidence of sea lion bycatch or assess if their populations are recovering.
Based on our assessment, without sea lion bycatch trigger limits and a comprehensive independent monitoring program, the introduction of permanent gillnet closures on their own are unlikely to reduce the bycatch mortality of ASL to sustainable levels. As such, there is a very significant risk that the current management measures in WA are inadequate and are not preventing further declines in its ASL populations. The absence of baseline data on ASL populations off the south coast of WA and the need for ongoing monitoring has been recognized (Goldsworthy et al., 2021). There is an urgent need to introduce further mitigation and monitoring measures in WA demersal gillnet fisheries to limit their impacts on sea lion populations. Greater consistency and coordination in how each fishing sector limits the impact of gillnet fisheries on ASLs, meets its Part 13 requirements and monitors the effectiveness of management measures would improve the conservation outcomes for sea lions.
Global Implications
Globally, the bycatch of marine mammals in gillnet fisheries poses one of the most significant sources of anthropogenic mortality, and one of the most challenging to manage (Read et al., 2006; Reeves et al., 2013). With many fishing gear types, the bycatch of marine mammals can be reduced through gear modification and/or changes to fishing practices and behaviors, but these approaches have typically been less successful in gillnet fisheries (FAO, 2021). Efforts to reduce the incidence of bycatch in gillnet fisheries using acoustic deterrents or alerting devices have generally had limited success, with some notable exceptions (Dawson et al., 2013; Kratzer et al., 2021). The greatest success in reducing the bycatch of marine mammals in gillnet fisheries has come from management measures that either limit or restrict gillnet effort (through spatial and temporal closures) or remove it entirely by switching to alternate fishing methods (Berninsone et al., 2020; FAO, 2021). This approach was taken in the gillnet sector of the GHAT fishery off SA, where a combination of permanent and temporary spatial closures linked to bycatch trigger limits, and the switching from gillnets to longline fishing methods, has seen a marked reduction in sea lion bycatch mortality.
The assessment of the impact of bycatch mortality on ASL in gillnet fisheries off SA, followed by a science-informed adaptive management processes, has arguably set an important precedent both nationally and internationally. Not only has bycatch mortality been reduced to levels that should enable sea lion populations to recover, a decade on from the introduction of management measures fishing catches have returned to pre-management levels. In the context of managing marine mammal bycatch globally, it is an extraordinary outcome, and as such, provides an important case study which will hopefully demonstrate how measures could be applied elsewhere to effectively manage the leading source of anthropogenic mortality of marine mammals and other marine protected species.
Data Availability Statement
The raw data supporting the conclusions of this article will be made available by the authors, without undue reservation.
Ethics Statement
The animal study was reviewed and approved by Primary Industries and Regions SA Animal Ethics Committee (Project 32-12).
Author Contributions
SG, BP, DHa, and PS planned and designed the project. SG, BP, DHa, PS, AL, DC, SF, KP, RM, FB, AM, RK, and DHo collected or contributed data. SG, MH, PB, and FB analyzed data. SG wrote the manuscript. SB provided project support. All authors contributed to the article and approved the submitted version.
Funding
Support for this project was provided by the Fisheries Research and Development Corporation (FRDC project number 2007-041), the Department of Agriculture, Water and the Environment (DAWE) and the Department for the Environment and Water (DEW).
Conflict of Interest
The authors declare that the research was conducted in the absence of any commercial or financial relationships that could be construed as a potential conflict of interest.
Publisher’s Note
All claims expressed in this article are solely those of the authors and do not necessarily represent those of their affiliated organizations, or those of the publisher, the editors and the reviewers. Any product that may be evaluated in this article, or claim that may be made by its manufacturer, is not guaranteed or endorsed by the publisher.
Acknowledgments
We would like to thank the Fish Factory (L., K. and P. Toumazos) and skippers and crew for support of the bycatch observer programs, and Alex Ivey (SARDI) for assisting with observer work. We would also like to thank FRDC staff (especially Caroline Stewardson and Crispian Ashby), AFMA staff (especially Shane Gaddes, Beth Gibson, Trent Timmiss, Matt Daniel, Neil Hughes, Sally Weekes, Aaron Puckeridge, Lou Cathro), former members of GHATMAC, Shark RAG (especially Jeremy Prince, Steve McCormack and Ian Freeman), and Ian Knuckey (Fishwell Consulting) for support. Geert Aarts and Sophie Brasseur (IMARES, University of Wageningen, Holland) and Rick McGarvey (SARDI) provided modeling and statistical advice. We would also further like to thank Simon Clark (formerly DEW) for assistance with project development, especially in the Great Australian Bight.
Supplementary Material
The Supplementary Material for this article can be found online at: https://www.frontiersin.org/articles/10.3389/fmars.2022.799102/full#supplementary-material
References
Akçakaya, H. R. (1998). RAMAS Metapop: Viability Analysis for Stage-Structured Metapopulations (Version 3.0). Setauket, NY: Applied Biomathematics.
Australian Fisheries Management Authority (2010). Australian Sea Lion Management Strategy, Southern and Eastern Scalefish and Shark Fishery. Available online at: https://fish.gov.au/Archived-Reports/2012/reports/Documents/AFMA_2010b.pdf (accessed September 15, 2021).
Australian Fisheries Management Authority (2015b). School Shark (Galeorhinus galeus) Stock Rebuilding Strategy: Revised 2015. Available online at: https://www.afma.gov.au/sites/default/files/uploads/2014/12/School-Shark-Rebuilding-Strategy.pdf (accessed September 15, 2021).
Australian Fisheries Management Authority (2015a). Australian Sea Lion Management Strategy, Southern and Eastern Scalefish and Shark Fishery (Arrangements Effective From 1 May 2013; Version 2.0–Updated July 2015. Available online at: http://www.afma.gov.au/wp-content/uploads/2014/03/Australian-Sea-Lion-Management-Strategy-2015-v2.0-FINAL.pdf (accessed September 15, 2021).
Berkson, J. M., and DeMaster, D. P. (1985). Use of pup counts in indexing population changes in pinnipeds. Canad. J. Fisher. Aquat. Sci. 42, 873–879. doi: 10.1139/f85-111
Berninsone, L. G., Bordino, P., Gnecco, M., Foutel, M., Mackay, A. I., and Werner, T. B. (2020). Switching gillnets to longlines: an alternative to mitigate the bycatch of Franciscana dolphins (Pontoporia blainvillei) in Argentina. Front. Mar. Sci. 7:699. doi: 10.3389/fmars.2020.00699
Braccini, M., and Blay, N. (2020). “Temperate demersal gillnet and demersal longline fishery fisheries resource status report 2019,” in Status Reports of the Fisheries and Aquatic Resources of Western Australia 2018/19: The State of the Fisheries, eds D. J. Gaughan and K. Santoro (Kensington, WA: Department of Primary Industries and Regional Development, Western Australia).
Brownell, R. L., Reeves, R. R., Read, A. J., Smith, B. D., Thomas, P. O., Ralls, K., et al. (2019). Bycatch in gillnet fisheries threatens critically endangered small cetaceans and other aquatic megafauna. Endang. Spec. Res. 40, 285–296. doi: 10.3354/esr00994
Campbell, R. (2003). Demography and Population Genetic Structure of the Australian Sea Lion, Neophoca cinerea. Ph.D. thesis. Perth, WA: University of Western Australia.
Campbell, R. A., Gales, N. J., Lento, G. M., and Baker, C. S. (2008). Islands in the sea: extreme female natal site fidelity in the Australian sea lion, Neophoca cinerea. Biol. Lett. 4, 139–142. doi: 10.1098/rsbl.2007.0487
Cisneros-Mata, M. A., Delgado, J. A., and Rodríguez-Félix, D. (2021). Viability of the vaquita, Phocoena sinus (Cetacea: Phocoenidae) population, threatened by poaching of Totoaba macdonaldi (Perciformes: Sciaenidae). Rev. Biol. Trop. 69:589447. doi: 10.15517/rbt.v69i2.45475
Cosgrove, R., Gosch, M., Reid, D., Sheridan, M., Chopin, N., Jessopp, M., et al. (2016). Seal bycatch in gillnet and entangling net fisheries in Irish waters. Fisher. Res. 183, 192–199. doi: 10.1016/j.fishres.2016.06.007
Costa, D. P., and Gales, N. J. (2003). Energetics of a benthic diver: seasonal foraging ecology of the Australian sea lion, Neophoca cinerea. Ecol. Monogr. 73, 27–43. doi: 10.1890/0012-9615(2003)073[0027:eoabds]2.0.co;2
Dawson, S. M., Northridge, S., Waples, D., and Read, A. J. (2013). To ping or not to ping: the use of active acoustic devices in mitigating interactions between small cetaceans and gillnet fisheries. Endang. Spec. Res. 19, 201–221. doi: 10.3354/esr00464
Department of Agriculture Water and the Environment (2019). Assessment Report for Southern and Eastern Scalefish and Shark Fishery – February 2019, February 2019. Commonwealth of Australia. Available online at: https://www.environment.gov.au/system/files/pages/bbf3e30a-2fa3-45d6-b20c-7623b995cbcd/files/assessment-southern-eastern-scalefish-shark-fishery-2019.pdf (accessed September 15, 2021).
Department of Primary Industries and Regional Development (2021). Western Australia’s Temperate Demersal Gillnet and Demersal Longline Fishery. Submission to the Department of Agriculture, Water and the Environment Against the Guidelines for Ecologically Sustainable Management of Fisheries, April 2021. Available online at: https://www.environment.gov.au/system/files/consultations/0e2fdc9b-0b3d-4bf8-894a-b23244f63d70/files/wa-temperate-shark-application-2021.pdf (accessed September 15, 2021).
Department of Primary Industries and Regions South Australia (2019). Ecological assessment of the South Australian Marine Scalefish Fishery – Reassessment report prepared for the Department of the Environment and Energy. Available online at: https://www.environment.gov.au/system/files/consultations/0135a6c3-6009-4b29-a56a-24e3c004baa0/files/ecological-assessment-south-australian-marine-scalefish-fishery-2019.pdf (accessed September 15, 2021).
Department of Sustainability Environment Water Population and Communities (2013). Recovery Plan for the Australian Sea Lion (Neophoca cinerea), Commonwealth of Australia. Canberra, ACT: Department of Sustainability Environment Water Population and Communities.
Emery, T. J., Noriega, R., Williams, A. J., and Larcombe, J. (2019). Changes in logbook reporting by commercial fishers following the implementation of electronic monitoring in Australian Commonwealth fisheries. Mar. Policy 104, 135–145. doi: 10.1016/j.marpol.2019.01.018
FAO (2021). Fishing Operations. Guidelines to Prevent and Reduce Bycatch of Marine Mammals in Capture Fisheries. FAO Technical Guidelines for Responsible Fisheries No.1, Suppl. 4. Rome: FAO. doi: 10.4060/cb2887en
Fowler, S. L., Costa, D. P., Arnould, J. P. Y., Gales, N. J., and Kuhn, C. E. (2006). Ontogeny of diving behaviour in the Australian sea lion: trials of adolescence in a late bloomer. J. Anim. Ecol. 75, 358–367. doi: 10.1111/j.1365-2656.2006.01055.x
Gilman, E., Suuronen, P., Hall, M., and Kennelly, S. (2013). Causes and methods to estimate cryptic sources of fishing mortality. J. Fish Biol. 83, 766–803. doi: 10.1111/jfb.12148
Goldsworthy, S. D. (2015). Neophoca cinerea. The IUCN Red List of Threatened Species. Version 2015.2. Available online at: www.iucnredlist.org (accessed September 15, 2021).
Goldsworthy, S. D., and Page, B. (2007). A risk-assessment approach to evaluating the significance of seal bycatch in two Australian fisheries. Biol. Conserv. 139, 269–285. doi: 10.1016/j.biocon.2007.07.010
Goldsworthy, S. D., Hodgson, J., and Holman, D. (2020). Australian Sea Lion Investigations: 2018-19. SARDI Aquatic Sciences Pubblication No. F2020/000052–1, SARDI Research Report Series No. 1051. Adelaide, SA, 88. Available online at: https://www.pir.sa.gov.au/__data/assets/pdf_file/0004/358285/Australian_sea_lion_investigations_2018-19.pdf (accessed September 15, 2021).
Goldsworthy, S. D., Page, B., Shaughnessy, P. D., and Linnane, A. (2010). Mitigating Seal Interactions in the SRLF and the Gillnet Sector SESSF in South Australia. SARDI Aquatic Sciences Publication Number F2009/000613-1, SARDI Research Report Series Number 405. Adelaide, SA, 213. Available online at: https://www.pir.sa.gov.au/__data/assets/pdf_file/0013/232006/No_405_Mitigating_Seal_Interactions_in_the_SRLF_and_the_Gillnet_Sector_SESSF_in_SA.pdf (accessed September 15, 2021).
Goldsworthy, S. D., Page, B., Shaughnessy, P. D., Hamer, D., Peters, K. D., McIntosh, R. R., et al. (2009). Innovative Solutions for Aquaculture Planning and Management: Addressing Seal Interactions in the Finfish Aquaculture Industry. SARDI Publication Number F2008/000222-1, SARDI Research Report series No. 288. Adelaide, SA, 287. Available online at: https://www.pir.sa.gov.au/__data/assets/pdf_file/0007/231793/No_288_Part_A_Innovative_solutions_for_aquaculture_planning_and_management_addressing_seal_interactions_in_the_finfish_aquaculture_industry.pdf and https://www.pir.sa.gov.au/__data/assets/pdf_file/0008/231794/No_288_Part_B_Innovative_solutions_for_aquaculture_planning_and_management_addressing_seal_interactions_in_the_finfish_aquaculture_industry.pdf (accessed September 15, 2021).
Goldsworthy, S. D., Shaughnessy, P. D., and Page, B. (2014). “Seals in Spencer Gulf,” in Natural History of Spencer Gulf, eds S. A. Shepherd, S. Madigan, B. M. Gillanders, S. Murray-Jones, and D. Wiltshire (Adelaide, SA: Royal Society of South Australia), 254–265.
Goldsworthy, S. D., Shaughnessy, P. D., Mackay, A. I., Bailleul, F., Holman, D., Lowther, A. D., et al. (2021). Assessment of the status and trends in abundance of a coastal pinniped, the Australian sea lion Neophoca cinerea. Endang. Spec. Res. 44, 421–437. doi: 10.3354/esr01118
Gray, C. A., and Kennelly, S. J. (2018). Bycatches of endangered, threatened and protected species in marine fisheries. Rev. Fish Biol. Fisher. 28, 521–541. doi: 10.1007/s11160-018-9520-7
Gulland, F., Danil, K., Bolton, J., Ylitalo, G., Okrucky, R. S., Rebolledo, F., et al. (2020). Vaquitas (Phocoena sinus) continue to die from bycatch not pollutants. Vet. Rec. 20:187. doi: 10.1136/vr.105949
Hamer, D. J., Goldsworthy, S. D., Costa, D. P., Fowler, S. L., Page, B., and Sumner, M. D. (2013). The endangered Australian sea lion extensively overlaps with and regularly becomes by-catch in demersal shark gill-nets in South Australian shelf waters. Biol. Conserv. 157, 386–400. doi: 10.1016/j.biocon.2012.07.010
Hamer, D. J., Ward, T. M., Shaughnessy, P. D., and Clark, S. R. (2011). Assessing the effectiveness of the Great Australian Bight Marine Park in protecting the endangered Australian sea lion Neophoca cinerea from bycatch mortality in shark gillnets. Endang. Spec. Res. 14, 203–216. doi: 10.3354/esr00353
Hamilton, S., and Baker, G. B. (2019). Technical mitigation to reduce marine mammal bycatch and entanglement in commercial fishing gear: lessons learnt and future directions. Rev. Fish Biol. Fisher. 29, 223–247. doi: 10.1007/s11160-019-09550-6
Jounela, P., Sipila, T., Koskela, J., Tiilikainen, R., Auttila, M., Niemi, M., et al. (2019). Incidental bycatch mortality and fishing restrictions: impacts on juvenile survival in the Endangered Saimaa ringed seal Pusa hispida saimensis. Endang. Spec. Res. 38, 91–99. doi: 10.3354/esr00939
Kailola, P. J., Williams, M. J., Stewart, P. C., Reichelt, R. E., Mcnee, A., and Grieve, C. (1993). Australian Fisheries Resources. Canberra, ACT: Bureau of Resource Sciences, and the Fisheries Research and Development Corporation.
Knuckey, I., Ciconte, A., Koopman, M., Hudson, R., and Rogers, P. (2014). Trials of Longlines to Target Gummy Shark in SESSF Waters off South Australia. FRDC Project 2011/068. Queenscliff, VIC: Fishwell Consulting, 105.
Komoroske, L. M., and Lewison, R. L. (2015). Addressing fisheries bycatch in a changing world. Front. Mar. Sci. 2:83. doi: 10.3389/fmars.2015.00083
Kovacs, K. M., Aguilar, A., Aurioles, D., Burkanov, V., Campagna, C., Gales, N., et al. (2012). Global threats to pinnipeds. Mar. Mam. Sci. 28, 414–436. doi: 10.1111/j.1748-7692.2011.00479.x
Kratzer, I. M. F., Brooks, M. E., Bilgin, S., Ozdemir, S., Kindt-Larsen, L., Larsen, F., et al. (2021). Using acoustically visible gillnets to reduce bycatch of a small cetacean: first pilot trials in a commercial fishery. Fisher. Res. 21:243. doi: 10.1016/j.fishres.2021.106088
Larcombe, J., and McLoughlin, K. (2007). Fishery Status Reports 2006: Status of Fish Stocks Managed by the Australian Government. Canberra, ACT: Australian Government Department of Agriculture, Fisheries and Forestry, Bureau of Rural Sciences.
Lewison, R. L., Soykan, C. U., and Franklin, J. (2009). Mapping the bycatch seascape: multispecies and multi-scale spatial patterns of fisheries bycatch. Ecol. Appl. 19, 920–930. doi: 10.1890/08-0623.1
Lowther, A. D., and Goldsworthy, S. D. (2011). Detecting alternate foraging ecotypes in Australian sea lion (Neophoca cinerea) colonies using stable isotope analysis. Mar. Mam. Sci. 27, 567–586. doi: 10.1111/j.1748-7692.2010.00425.x
Lowther, A. D., Harcourt, R. G., Page, B., and Goldsworthy, S. D. (2013). Steady as he goes: at-sea movement of adult male Australian sea lions in a dynamic marine environment. PLoS One 8:e74348. doi: 10.1371/journal.pone.0074348
Lowther, A., and Goldsworthy, S. (2012). Head start: Australian sea lion pups gain experience of adult foraging grounds before weaning. Mar. Biol. 159, 2687–2696. doi: 10.1007/s00227-012-2026-2
Lowther, A., Harcourt, R. G., Hamer, D., and Goldsworthy, S. (2011). Creatures of habit: foraging habitat fidelity of adult female Australian sea lions. Mar. Ecol. Progr. Ser. 443, 249–263. doi: 10.3354/meps09392
Lowther, A., Harcourt, R., Goldsworthy, S., and Stow, A. (2012). Population structure of adult female Australian sea lions is driven by fine-scale foraging site fidelity. Anim. Behav. 83, 691–701. doi: 10.1016/j.anbehav.2011.12.015
Luck, C., Jessopp, M., Tully, O., Cosgrove, R., Rogan, E., and Cronin, M. (2020). Estimating protected species bycatch from limited observer coverage: a case study of seal bycatch in static net fisheries. Glob. Ecol. Conserv. 2:24. doi: 10.1016/j.gecco.2020.e01213
Machado, R., Ott, P. H., Moreno, I. B., Danilewicz, D., Tavares, M., Crespo, E. A., et al. (2016). Operational interactions between South American sea lions and gillnet fishing in southern Brazil. Aquat. Conserv. Mar. Freshw. Ecosyst. 26, 108–120. doi: 10.1002/aqc.2554
McConnell, B. J., Chambers, C., Nicholas, K. S., and Fedak, M. A. (1992). Satellite tracking of grey seals (Halichoerus grypus). J. Zool. 226, 271–282.
McIntosh, R. R. (2007). Life History and Population Demograhics of the Australian Sea Lion. Ph.D. thesis. Melbourne, VIC: La Trobe University.
Moore, J., Heinemann, D., Francis, T., Hammond, P., Long, K. J., Punt, A. E., et al. (2021). Estimating bycatch mortality for marine mammal stock assessment: concepts and best practices. Front. Mar. Sci 8:752356. doi: 10.3389/fmars.2021.752356
Owen, K., Sköld, M., and Carlström, J. (2021). An increase in detection rates of the critically endangered Baltic Proper harbor porpoise in Swedish waters in recent years. Conserv. Sci. Pract. 2:e468. doi: 10.1111/csp2.468
Page, B., Mckenzie, J., McIntosh, R., Baylis, A., Morrissey, A., Calvert, N., et al. (2004). Entanglement of Australian sea lions and New Zealand fur seals in lost fishing gear and other marine debris before and after government and industry attempts to reduce the problem. Mar. Pollut. Bull. 49, 33–42. doi: 10.1016/j.marpolbul.2004.01.006
Peltier, H., Authier, M., Caurant, F., Dabin, W., Daniel, P., Dars, C., et al. (2021). In the wrong place at the wrong time: identifying spatiotemporal co-occurrence of bycaught common dolphins and fisheries in the bay of biscay (NE Atlantic) From 2010 to 2019. Front. Mar. Sci. 8:617342. doi: 10.3389/fmars.2021.617342
Peltier, H., Authier, M., Deaville, R., Dabin, W., Jepson, P. D., Van Canneyt, O., et al. (2016). Small cetacean bycatch as estimated from stranding schemes: the common dolphin case in the northeast Atlantic. Environ. Sci. Policy 63, 7–18. doi: 10.1016/j.envsci.2016.05.004
Ramos, K. L., Machado, R., and Schiavetti, A. (2020). Operational interactions between sea lion species (Otariinae) and commercial fisheries. Ethnobiol. Conserv. 9:22. doi: 10.15451/ec2020-06-9.22-1-34
Read, A. J., Drinker, P., and Northridge, S. (2006). Bycatch of marine mammals in US and global fisheries. Conserv. Biol. 20, 163–169. doi: 10.1111/j.1523-1739.2006.00338.x
Reeves, R. R., Mcclellan, K., and Werner, T. B. (2013). Marine mammal bycatch in gillnet and other entangling net fisheries, 1990 to 2011. Endang. Spec. Res. 20, 71–97. doi: 10.3354/esr00481
Sequeira, A. M. M., Hays, G. C., Sims, D. W., Eguíluz, V. M., Rodríguez, J. P., Heupel, M. R., et al. (2019). Overhauling ocean spatial planning to improve marine megafauna conservation. Front. Mar. Sci. 6:639. doi: 10.3389/fmars.2019.00639
Shaughnessy, P., Kirkwood, R., Cawthorn, M., Kemper, C., and Pemberton, D. (2003). “Pinnipeds, cetaceans and fisheries in Australia: a review of operational interactions,” in Marine Mammals: Fisheries, Tourism and Management Issues, eds N. Gales, M. Hindell, and R. Kirkwood (Clayton, VIC: CSIRO Publishing), 136–152.
Sims, M., Cox, T., and Lewison, R. (2008). Modeling spatial patterns in fisheries bycatch: Improving bycatch maps to aid fisheries management. Ecol. Appl. 18, 649–661. doi: 10.1890/07-0685.1
Steer, M. A., Fowler, A. J., Rogers, P. J., Bailleul, F., Earl, J., Matthews, D., et al. (2020). Assessment of the South Australian Marine Scalefish Fishery in 2018. Report to PIRSA Fisheries and Aquaculture. South Australian Research and Development Institute (Aquatic Sciences), Adelaide. SARDI Publication No. F2017/000427-3. SARDI Research Report Series No. 1049. 214. Available online at: https://www.pir.sa.gov.au/__data/assets/pdf_file/0004/360589/Assessment_of_the_South_Australian_Marine_Scalefish_Fishery_in_2018._Report_to_PIRSA_Fisheries_and_Aquaculture.pdf (accessed September 15, 2021).
Sterling, J., and Ream, R. R. (2004). At-sea behavior of juvenile male northern fur seals (Callorhinus ursinus). Canad. J. Zool. 82, 1621–1637. doi: 10.1139/z04-136
Thorne, L. H., Baird, R. W., Webster, D. L., Stepanuk, J. E., and Read, A. J. (2019). Predicting fisheries bycatch: a case study and field test for pilot whales in a pelagic longline fishery. Diver. Distribut. 25, 909–923. doi: 10.1111/ddi.12912
Keywords: Australian sea lion, bycatch estimation, bycatch mitigation, bycatch management, gillnet fishery, South Australia
Citation: Goldsworthy SD, Page B, Hamer DJ, Lowther AD, Shaughnessy PD, Hindell MA, Burch P, Costa DP, Fowler SL, Peters K, McIntosh RR, Bailleul F, Mackay AI, Kirkwood R, Holman D and Bryars S (2022) Assessment of Australian Sea Lion Bycatch Mortality in a Gillnet Fishery, and Implementation and Evaluation of an Effective Mitigation Strategy. Front. Mar. Sci. 9:799102. doi: 10.3389/fmars.2022.799102
Received: 21 October 2021; Accepted: 12 January 2022;
Published: 16 February 2022.
Edited by:
Jeff Moore, Southwest Fisheries Science Center (NOAA), United StatesReviewed by:
Kimberly Murray, Northeast Fisheries Science Center (NOAA), United StatesMaritza Sepulveda, Universidad de Valparaiso, Chile
Copyright © 2022 Goldsworthy, Page, Hamer, Lowther, Shaughnessy, Hindell, Burch, Costa, Fowler, Peters, McIntosh, Bailleul, Mackay, Kirkwood, Holman and Bryars. This is an open-access article distributed under the terms of the Creative Commons Attribution License (CC BY). The use, distribution or reproduction in other forums is permitted, provided the original author(s) and the copyright owner(s) are credited and that the original publication in this journal is cited, in accordance with accepted academic practice. No use, distribution or reproduction is permitted which does not comply with these terms.
*Correspondence: Simon D. Goldsworthy, c2ltb24uZ29sZHN3b3J0aHlAc2EuZ292LmF1