 Fatimah Almulhim1
 Susann Rossbach2,3
 Abdul-Hamid Emwas4
 Najeh M. Kharbatia4Lukasz Jaremko1
 Mariusz Jaremko1,5*
 Carlos M. Duarte2*
- 1Biological and Environmental Science and Engineering (BESE), King Abdullah University of Science and Technology (KAUST), Thuwal, Saudi Arabia
- 2Red Sea Research Centre (RSRC) and Computational Bioscience Research Center (CBRC), Biological and Environmental Science and Engineering Division (BESE), King Abdullah University of Science and Technology (KAUST), Thuwal, Saudi Arabia
- 3The Red Sea Development Company, Department Environmental Sustainability, Riyadh, Saudi Arabia
- 4CoreLabs, King Abdullah University of Science and Technology (KAUST), Thuwal, Saudi Arabia
- 5Smart-Health Initiative (SHI) and Red Sea Research Center (RSRC), Division of Biological and Environmental Sciences and Engineering (BESE), King Abdullah University of Science and Technology (KAUST), Thuwal, Saudi Arabia
Metabolite profiling of marine invertebrates, such as bivalve mollusks, may not only provide insights into the health state of an individual holobiont, but also the pollution levels of their environment Here, we combined 1H nuclear magnetic responance (NMR) spectroscopy and mass spectrometry (MS)-based metabolomics techniques to investigate the organ-specific metabolomic profiles of Tridacna maxima giant clams. Clams were collected from across-shelf gradient in the Red Sea, from inshore to off-shore. We unequivocally profiled 306 metabolites and observed that the sampling location had minimal effects on metabolite composition. However, we observed significant differences in metabolite profiles among different organs (i.e., gills, mantle organ, and digestive system). Importantly, in addition to endogenous metabolites, we detected the presence of terephthalic acid and isophthalic acid, which likely originate from marine plastic ingestion. Collectively, our study opens opportunities for a deeper understanding of Tridacna maxima physiology through metabolomics, and illustrates the power of invertebrate metabolite profiling for monitoring plastic-related aquatic pollutants.
Highlights
- We analyzed organ-specific (i.e., outer mantle, gills and digestive system)metabolomes of Tridacna maxima giant clams from different Red Sea locations;
- Endogenous metabolite profiles do not depend on the location;
- Each sampled organ exhibits a unique metabolite profile;
- Polyethylene terephthalate (PET) degradation products are detected across all locations;
- Aquatic plastic-related pollutant terephthalic acid is detected only in the digestive system.
Introduction
Giant clams (subfamily Tridacninae) are among the largest marine bivalve mollusks. Their impressive growth is facilitated by the symbiotic relationship with unicellular photosynthetic algae from the Symbiodiniaceae family (Taylor, 1969; Yonge, 1975), leading to fast growth and calcification rates (Klumpp and Griffiths, 1994; Rossbach et al., 2019). Geographically and ecologically, giant clams are a significant component of tropical Indo-Pacific coral reef communities (Neo et al., 2015). As such, they provide numerous ecosystem services; for example, as they contribute to the carbonate production of the reef ecosystem, as a food source for scavengers and predators (Alcazar, 1986; Neo et al., 2015), as well as a substrate for epibiotic organisms (Vicentuan-Cabaitan et al., 2014), and as a shelter for commensal organisms (De Grave, 1999). In addition to their algae symbionts, giant clams also harbor a diverse and organ-specific bacterial microbiome (Rossbach et al., 2019) that can significantly influence the health status of the clam host (Guibert et al., 2020b). Hence, giant clams can be considered as a metaorganism (holobiont), a complex community of different species (Bosch and Miller, 2016), in which the microbial, symbiotic partners mediate biochemical transformations that can influence host performance and survival (McFall-Ngai et al., 2013). Although previous studies have assessed the diversity of their symbiotic partners (Rossbach et al., 2019; Guibert et al., 2020b; Rossbach et al., 2021), it remains unclear how these relationships can affect their physiology, health, nutritional and environmental well-being.
Metabolomic analyses, using chemical profiling technologies, including mass spectrometry (MS) and nuclear magnetic resonance (NMR) spectroscopy, can help to describe cellular pathways and differences in metabolite composition of holobionts (Meyer and Weis, 2012; Emwas et al., 2019). The detection, identification, and quantification of metabolites provides insights into the holobiont biochemistry, its health status, fitness, and nutritional assessment (Nicholson et al., 1999; Zivkovic and German, 2009; Ochsenkühn et al., 2018). Therefore, analyses of metabolites (Meyer and Weis, 2012; Cziesielski et al., 2018; Cleves et al., 2020) are crucially needed to understand the physiology of holobionts and their responses to ecological disturbances, such as different environmental conditions and pollutants (Li et al., 2016; Cui et al., 2019). While metabolomics is an emerging field of study it is already being applied to investigate different areas in, for instance on environmental stressors and disease monitoring (Emwas et al., 2013; Lankadurai et al., 2013; Marante, 2016; Bayona et al., 2022). Thus metabolomics are increasingly utilized to examine the interactions between an organism and its environment (Emwas et al., 2021; Bayona et al., 2022). For example, different metabolomic approaches have been applied to investigate different areas in the environmental sciences, including the assessment of pollutants exposure and other risks (De Marco et al., 2022), such as oil-polluted wastewater (Caliani et al., 2022), pesticides (Vignet et al., 2019), pharmaceuticals (Cappello et al., 2017), and so on.
Here, we conducted the first metabolomic analysis of the ‘small giant clam’, Tridacna maxima, the most common species of Tridacninae in the Red Sea. We used a combination of the one-dimensional proton nuclear magnetic resonance spectroscopy (1D 1H-NMR), gas chromatography-mass spectrometry (GC-MS) and high-performance liquid chromatography-mass spectrometry (HPLC-MS). We analyzed the metabolomes of specimens that were collected from three different reef locations in the central Red Sea, following a cross-shelf gradient from inshore to off-shore. Additionally, we conducted the analyses in an organ-specific manner by probing gills, outer mantle, and digestive system separately. Collectively, our study yielded a granular view of location- and organ-dependence of the metabolomes, and revealed presence of aquatic plastic pollutants in the T. maxima holobiont.
Materials And Methods
Organism Collection and Transportation to the Laboratory
A total of 18 T. maxima specimens (shell length of 15 ± 1 cm; mean ± SD) were collected at about 3 m depth at three different reef sites close to King Abdullah University of Science and Technology, central Red Sea (Supplemental Figure 1). Each six clams were sampled at an in-shore reef (Fsar, 22° 14’27” N, 39° 02’ 51” E, 1.8 km distance to the shore), a mid-shore reef (Al Fahal, 22° 15’ 2” N, 38° 57 ‘45” E, 12.5 km distance to the shore), and an off-shore reef (Shib Nizar, 22° 19’ 20” N, 38° 51 ‘26” E, 21.1 km distance to the shore). Transportation from the reef site to the laboratory took about 90m minutes. During this time, the clams were stored individually in seawater-filled plastic bags to avoid cross-contamination and placed in an insulated container, also filled with seawater.
Clam Dissection and Organ Homogenization
All the Tridacna specimens were collected and processed for metabolomics analyses according to the same protocol under identical conditions. Upon arrival in the laboratory the specimens were immediately cut open with a scalpel, and organ samples of three different compartments (gills, outer mantle, and digestive system) were collected. All samples were weighed to the nearest 1 mg. The organs were then homogenized for 20 s using an Ultra Turrax T18 homogenizer (IKA-Werke GmbH and Co. KG, Staufen, Germany) with 15 mL MilliQ water (which had been sterilized under UV light for one hour, and filtered through a 0.2 μm syringe filter). The homogenate was frozen at -80°C until further processing.
Chloroform/Methanol Extraction
The metabolite extraction was performed in glass vials (Borosilicate clear glass with black phenolic cap, Fisherbrand), and all steps were performed on ice. Metabolites were extracted from the homogenates by the addition of methanol, chloroform, and water in the proportions 2.0:2.0:1.8 by volume (Wu et al., 2008). Samples were then mixed in a shaker (MaxQ™ 8000 Incubated Stackable Shakers by Thermo Scientific) at 350 rpm for 10 minutes at 4°C. After that, additional amounts of chloroform and water in the proportions 1:1 (v/v) were added, and samples were centrifuged at 4000 rpm for 15 minutes at 4°C, until a biphasic system was observed, with a polar upper phase and a nonpolar lower phase. The polar phase was collected in 1.5 mL Eppendorf tubes and dry-evaporated at room temperature overnight, using a Labconco CentriVap SpeedVac Concentrator. The pellets were then stored at -80°C until further processing.
GC-MS Profiling
After the samples were thawed at room temperature, 50 µL of Methoxamine (MOX) Reagent. MOX reagent were added and mixed (Benchtop multi-Therm heat-shaker, Benchmark Scientific Inc.) at 37˚C and 1500 rpm for 90 minutes. All samples were left to cool down at room temperature, and 100 µL of N,O-Bis(trimethylsilyl)trifluoroacetamide (BSTFA), a derivatization agent, were added to each sample vial. The vials were vortexed again at 30˚C and 1500 rpm for 30 min and centrifuged for 5 min at 10K rpm. The clear solution of each sample was transferred to gas chromatography (GC) vial deactivated inserts and injected into the GC analyzer.
One microliter of the derivatized solution was analyzed using a single quadruple GC-MS system (Agilent 7890 GC/5975C MSD) equipped with an EI source with ionization energy of 70 eV. The temperature of the ion source and mass analyzer was set to 230°C and 150°C, respectively, and solvent delay of 8.0 min. The mass analyzer was auto-tuned according to the manufacturer’s manual, and the scan was set from 35 to 700 with a scan speed of 2 scans/s. Chromatography separation was performed using DB-5MS fused silica capillary column (30m x 0.25 mm I.D., 0.25 µm film thickness; Agilent J&W Scientific, Folsom, CA), chemically bonded with a 5% phenyl, 95% methylpolysiloxane cross-linked stationary phase. Helium was used as the carrier gas with a constant flow rate of 1.0 mL min-1. The initial oven temperature was held at 80˚C for 4 min, then gradually increased to 300˚C at a rate of 6.0˚C min-1, and held at 300˚C for 10 min. The temperature of the GC inlet port and the transfer line to the MS source was kept at 200˚C and 320˚C, respectively. One microliter of the derivatized solution of the sample was injected into a split/splitless inlet using an autosampler equipped with 10 µL syringe. The GC inlet was operated under splitless mode.
GC-MS Processing
All data were processed in the R environment using the package eRah (version 1.0.4) (Domingo-Almenara et al., 2016), performing the pre-processing, deconvolution, alignment, missing compound recovery and compound identification. The following parameters were used: min.peak.width = 1, avoid.processing.mz = c(35:69,73:75,147:149), min.spectra.cor = 0.90, max.time.dist = 3, mz.range = 70:600. A minimum criterion of 6 samples was applied for the missing compound recovery step. For the first identification of the compound, the MassBank (Horai et al., 2010) repository was used.
HPLC-MS Parameters and Profiling
The dried pellet from the polar phase was dissolved in 100 µL of the internal standard solvent “CUDA”, prepared by mixing 8:1:1 (v/v/v) of acetonitrile, methanol, and HPLC-MS grade water. Additional 40 µL of HPLC-MS grade water was added to fully dissolve the pellet, followed by vortexing. For monitoring the precision of the HPLC-MS, quality control (QC) samples were prepared by mixing equal volumes of each sample. As the final step prior to HPLC, 50 µL of each sample and the pooled samples were transferred into 1.5 mL HPLC vials. The Liquid Chromatography Quadrupole Time of Flight Mass Spectrometry (LC-QTOF-MS/MS) was equipped with electrospray source ionization (ESI) mode. All samples were analyzed in positive and negative mode separately to detect a maximum number of metabolites. The temperature of the ESI source was set at 220°C, dry gas at 9.0 l/min, and nebulizer pressure at 1.8 Bar. The capillary voltage was set at 4500 V, end plate offset 500V. The full scan range was set from 50 to 1300 Da with auto MS/MS using instrument manufacturer default settings for small molecules. The auto MS/MS threshold per 1000 sum was set to 400 counts with 3X number of precursors and exclusion after 3 spectra. The spectral rate was set at 12 Hz with a fixed MS/MS acquisition rate of 2 Hz. The QTOF instrument was calibrated before starting the experiment by directly infusing 10mM of sodium formate solution. In addition, during every sample analysis in both positive and negative mode, the instrument was calibrated externally by using the same sodium formate solution at the beginning of each sample injection and internally by using a mixture of three lock mass compounds infused directly into the MS from the source reservoir C5H4N4, C12H18F12N3O6P3, C18H19O6N3P3F24 with the accurate mass of 121.043, 621.022 and 921.002, respectively. The instrument was found to be accurate to less than 0.5ppm. Samples were separated using a 1.7 μm 2.1x100 mm Acquity UPLC CSH C18 column (Waters, USA) with 5 μl volume injection in a UPLC system (UltiMate 3000, Thermo Scientific, Germany). The separation was performed at a constant mobile phase flow rate of 0.4 mL/min, and the gradient program was as follows: 0% of solvent B at 0.01 min, ramped to 100% B in 10min then reduced to 0% B at 12 min, and the column equilibrated with 0% B to 14 min. The column temperature was set at 40°C, and the temperature of the autosampler was kept at 4°C.
HPLC-MS Data Analysis
MetaboScape 4.0 software (Bruker, Bremen, Germany) was used to automatically analyze the raw MS and MS/MS data. Additionally, for simultaneously searching and grouping all forms of the classical adducts for positive ([M+H]+, [M+Na]+, [M+K]+, [M-H2O+H]+, [M+H2O+H]+, [M+NH4]+, [M-NH3+H]+, [M+CH3OH+H]+, [M+C2H3N+H]+, [M+2Na-H]+) and for negative screening ([M-H]-, [M+Cl]-, [M-H-H2O]-, [M+HCOO]-, [M+K-2H]-, [M+Na-2H]-, [2M+FA-H]-, [2M-H]-), a threshold value of 0.8 was used for the co-elution coefficient factor. The metabolites were annotated according to the exact mass of the molecules, their molecular formula, and their patterns of tandem mass spectrometry (MS/MS) fragmentation regarding available libraries, such as Bruker Plant Metabolites and Mona Export LC-MS-MS positive and negative mode. For the annotation, the analyst sources, Human Metabolome Database (HMDB) (Wishart et al., 2007) metabolites, Bruker Sumner MetaboBASE® Plant Libraries (Fine et al., 2015) with 0.5 ppm selected compounds were manually annotated by matching the observed accurate masses (within 5 ppm) to plant metabolite databases.
1H NMR Experiments and Processing
Samples were prepared by dissolving the pellets in 600 μl of D2O in 1.5 mL Eppendorf tube, and the sample was vortexed until the sample dissolved completely, then 500 μl was transferred into the 5 mm NMR tube. A Bruker 700 MHz AVANACE NEO NMR spectrometer equipped with Bruker TCI (1H/13C/15N) cryogenic probe (BrukerBioSpin, Rheinstetten, Germany) was used to record all NMR spectra at 298 K. The 1H NMR spectrum was recorded by collecting 256 scans using zgesgp pulse program from the Bruker pulse library with reported parameters (Chandra et al., 2021a; Chandra et al., 2021b). Transformed spectra were corrected for phase and baseline distortions using Topspin 4.0.7 (Bruker BioSpin) and then automatically calibrated to the anomeric proton signal of α-glucose at 5.23 ppm. Identification of metabolites was carried out using Chenomx NMR Suite 8.6 (Chenomx Inc., Edmonton, Canada) and available assignments in the literature (Wishart et al., 2007; Wishart et al., 2018). The peaks of the identified metabolites were fitted by a combination of a local baseline and Voigt functions based on the multiplicity of the 1H NMR signal. In few cases, the quantification of 1H NMR signals was not possible due to the absence of the signal or overlap with other signals. If the 1H NMR signal was absent, zero value was assigned to the quantification.
Statistical and Data Analysis
Probabilistic Quotient Normalization (Dieterle et al., 2006) was performed to normalize data due to dilution effects in the extraction procedure using the function normalization in the R package KnOwledge Discovery by Accuracy Maximization (KODAMA) (Cacciatore et al., 2016). Pairwise comparisons were made using the Mann–Whitney test for independent data. Comparisons among organs were made using the non-parametric Kruskal-Wallis rank-sum test. Spearman’s correlation (rho) was used to correlate each metabolite with the distance of the sample collection (i.e., in-shore, mid-shore, off-shore). Pearson’s correlation (r) was used to correlate the intensity of different signals. Metabolite set enrichment analysis (MSEA) was carried out using the Gene Set Enrichment Analysis (GSEA) algorithm (Subramanian et al., 2005) using the R package fgsea v1.16 (Korotkevich et al., 2019). The metabolite sets were built using the substituents characterization provided by the Human Metabolome Database (Wishart et al., 2007; Wishart et al., 2018). The ranking in the MSEA was performed by using the correlation coefficient calculated using Spearman’s correlation. An enrichment score (ES) and normalized (NES) were calculated for each metabolite set using a weighted Kolmogorov‐Smirnoff statistic, and the top ranked metabolites contributing to the ES were identified as the leading-edge subset (Subramanian et al., 2005). To account for multiple testing, a false discovery rate (FDR) was calculated using the q conversion algorithm in multiple comparisons (Benjamini and Hochberg, 1995). The threshold for significance was p-value < 0.05 and FDR < 0.10 for all tests. Before conducting the multivariate analysis, missing values were imputed using the k-nearest neighbor (kNN) algorithm (Troyanskaya et al., 2001), with k = 5, then data were mean-centred and unit-variance scaled. Principal Component Analysis (PCA) and KODAMA (Cacciatore et al., 2014) were used to visualize the metabolomic data. Lastly, the metabolites were classified according to the information reported by the Human Metabolome Database (Wishart et al., 2007; Wishart et al., 2018).
Results
Comprehensive Analysis of the T. maxima Metabolome
To assess the metabolome of Red Sea T. maxima clams as comprehensively as possible, we combined the state-of-the-art 1D 1H NMR, GC- and HPLC-MS-based techniques with available metabolic databases that are routinely used for metabolite identification (see Materials and Methods for details). This allowed us to unequivocally define a set of 306 metabolites (Figure 1 and Supplementary Table 1). The reproducibility of identification was excellent across the collected samples and the metabolites, with over 98% of all assigned metabolites found in each of the six specimens collected at the same reef location (i.e., at the in-shore, mid-shore, or off-shore reef site; Supplementary Figure 1). Therefore, only these metabolites are reported here. In terms of overall performance, 1H NMR spectroscopy identified 24 metabolites (excluding the derivatives) (Figure 1 and Supplementary Tables 2–4), GC-MS identified 258 (Figure 1 and Supplementary Tables 5A–C), and HPLC-MS identified 61 metabolites (Figure 1 and Supplementary Table 6). As shown in Figure 1, 6 metabolites were detected by all three techniques, whereas 8, 230, and 38 were detected exclusively by 1H NMR spectroscopy, GC-MS, and HPLC-MS, respectively. The identified metabolites predominantly represent amino acids, carbohydrates and carboxylic acids (Figure 1). Taken together, we demonstrated that the combined use of multiple techniques for the metabolite analysis yielded a more comprehensive coverage of the metabolome than each of the methods alone. Moreover, we showed that this approach may allow the identification of metabolites, which has important implications as pollutants on the marine species such as plastic pollution impact on T. maxima giant clams.
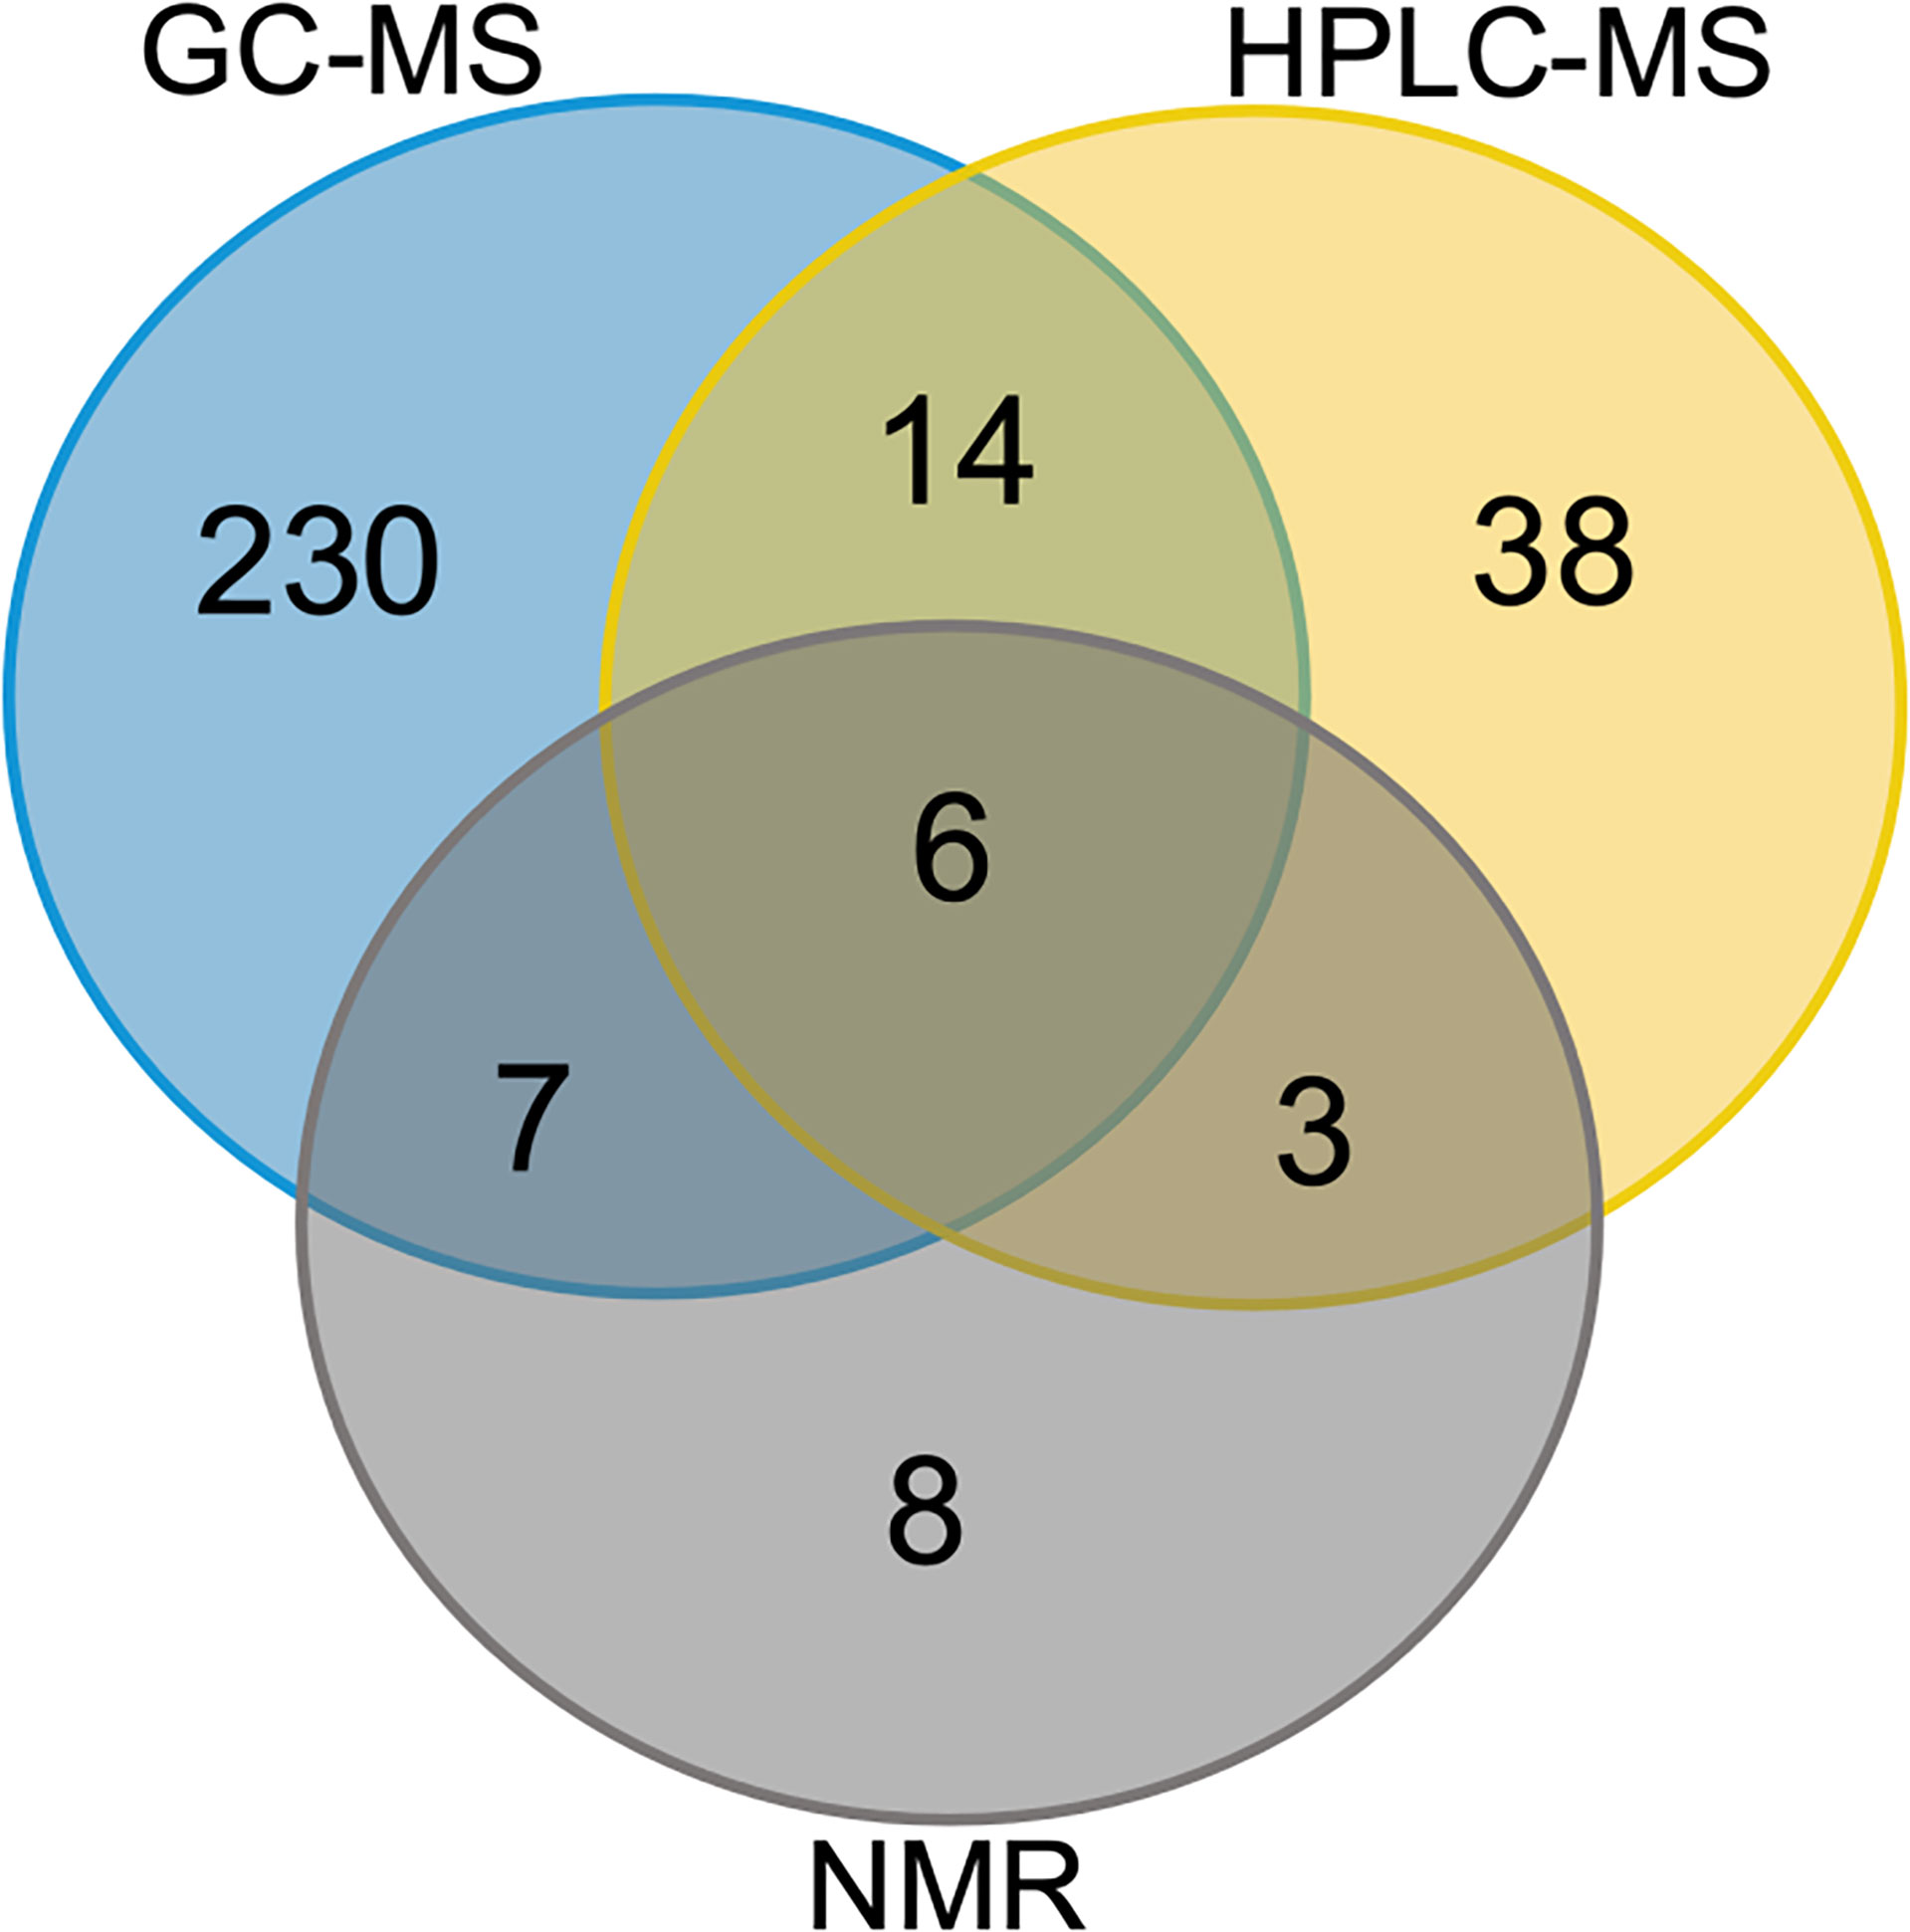
Figure 1 Organ-specific and common metabolites. Venn diagram showing the number of metabolites identified separately and co-identified by different techniques. Common in all three T. maxima organs and metabolites detected specifically in each organ: GC-MS (blue), HPLC-MS (yellow), NMR (grey).
Metabolomic Profiles Are Independent of Distance From Shore
To examine the distance to the shore as a factor, that could potentially affect the metabolomic profiles of T. maxima, we assessed the metabolite composition of three different organs (i.e., gills, outer mantle, and digestive system) from T. maxima specimens collected from different reef sites (in-shore, mid-shore, and off-shore reef sites, Supplemental Figure 1). The Principal component analysis (PCA) of combined NMR and MS-based metabolomic datasets demonstrated no apparent association between specific metabolite profiles and the distance to the shore (Figure 2). The metabolite profiles of the same organ type across various reef sites were nearly identical. Most of the endogenous metabolites show no significant variations among the reef sites (p > 0.05), including dimethyl-sulfoniopropionate (DMSP) in gills and digestive system and succinic acid in all organ samples (Figure 3). Although the metabolite profiles did not exhibit significant variation for a given organ as the distance to the shore, the Metabolite Set Enrichment Analysis (MSEA) (Xia and Wishart, 2010) (Table 1) showed clear trends that the concentrations of amino acids and fatty acids in gills and the sugar content in the outer mantle decrease with the increasing distance to the shore. In contrast, the sugars in gills and amino acids in the outer mantle increased with increasing the shore distance (Figure 4 and Table 1). Collectively, these results highlight that distance to the shore (up to 21.1 km distance to the shore) does not seem to affect global metabolome composition of T. maxima, although some more subtle trends of variability between different metabolite classes were observed.
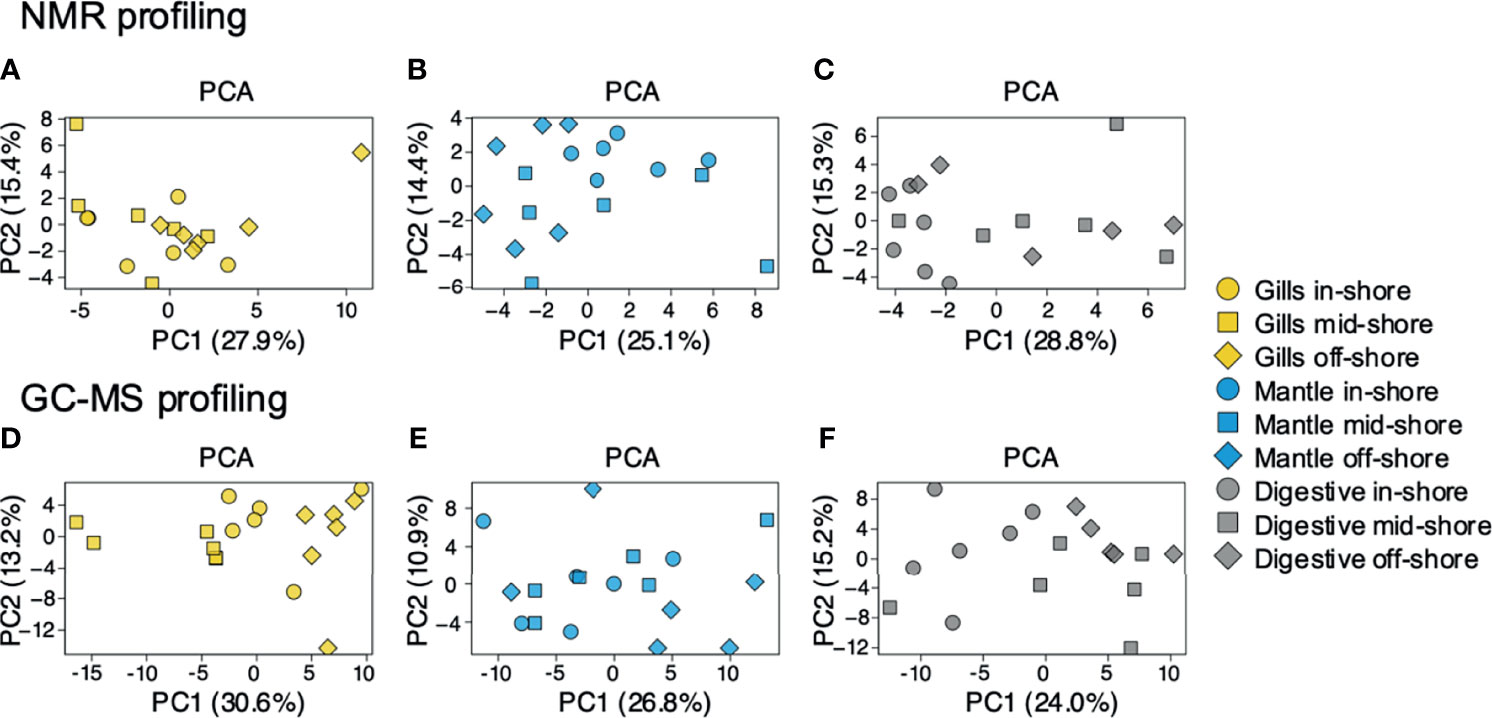
Figure 2 PCA for metabolites identified by 1H NMR spectroscopy and GC-MS. Blue (mantle), yellow (gills), and grey (digestive system). Inshore (●),mid-shore (■), off-shore (◆). (A–C) represent the samples detected by 1H NMR. (D–F) represent the samples detected by GC-MS. All PCAs show a relatively random distribution (PC1 vs. PC2) among the three sampled organs.
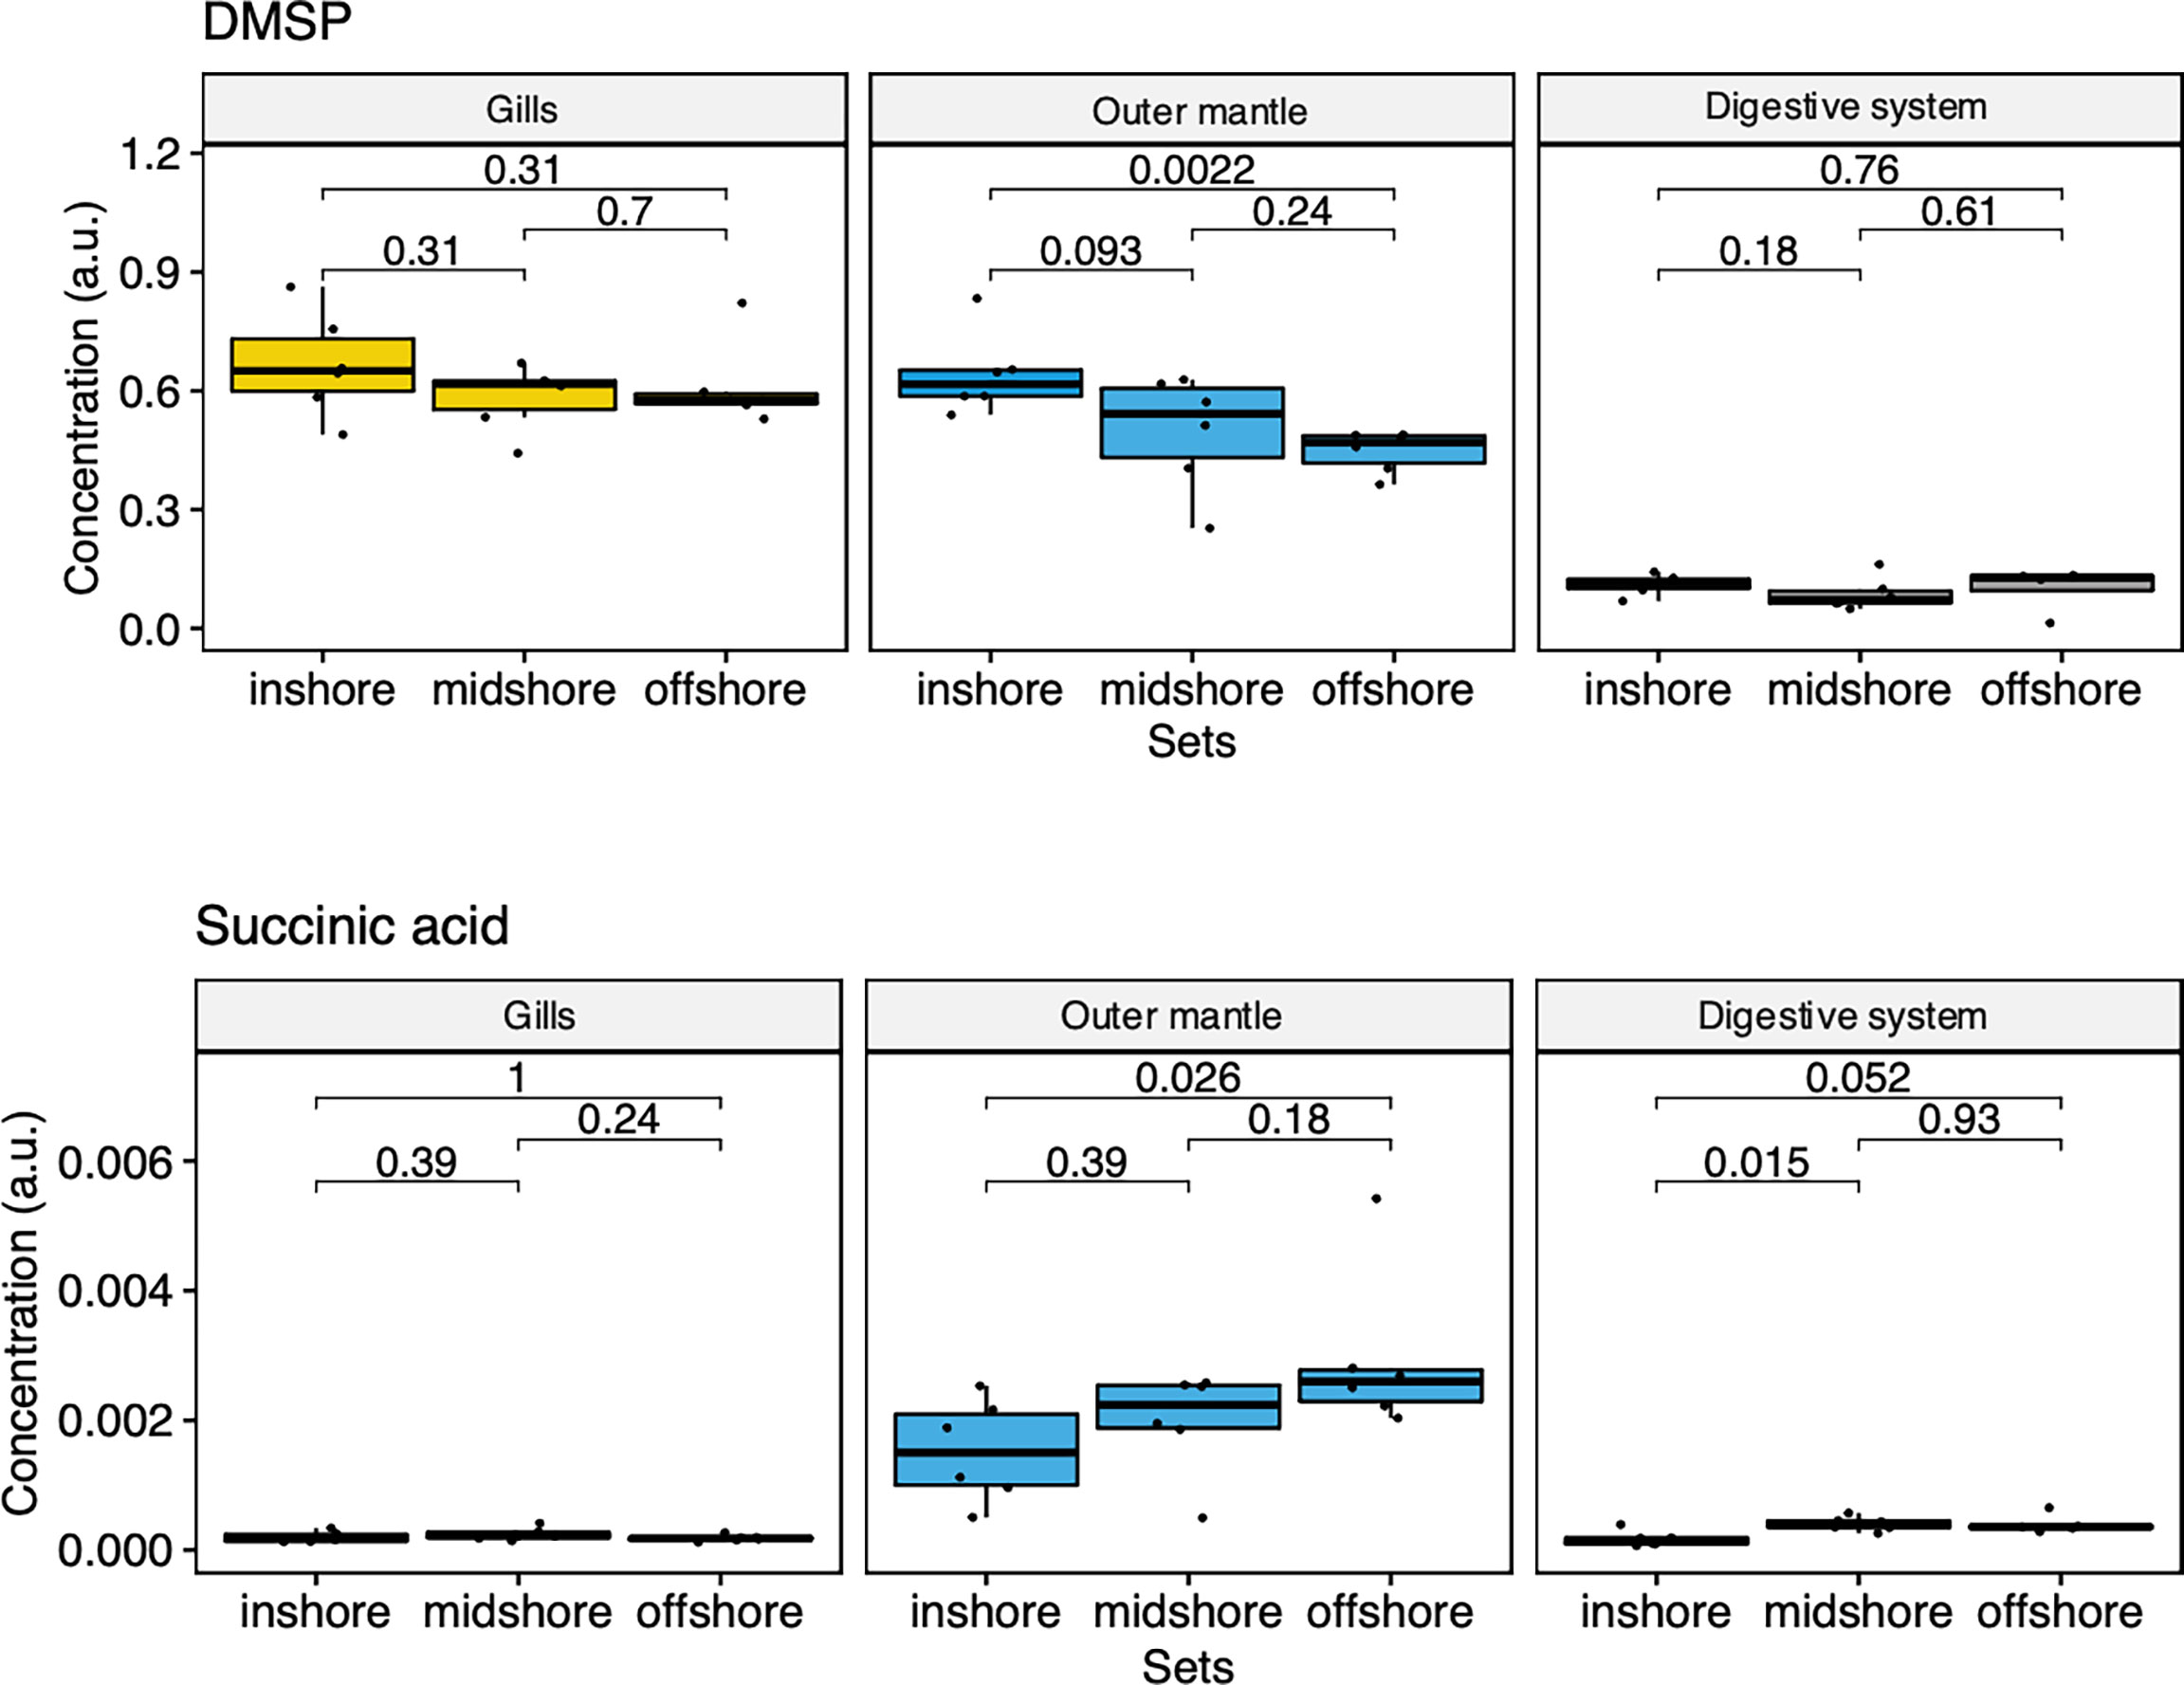
Figure 3 Box-and-whisker plots showing the relative abundance of biologically important metabolites of the three organ types (Gill, outer mantle, and digestive system) across the reef shores (in-shore, mid-shore, off-shore).
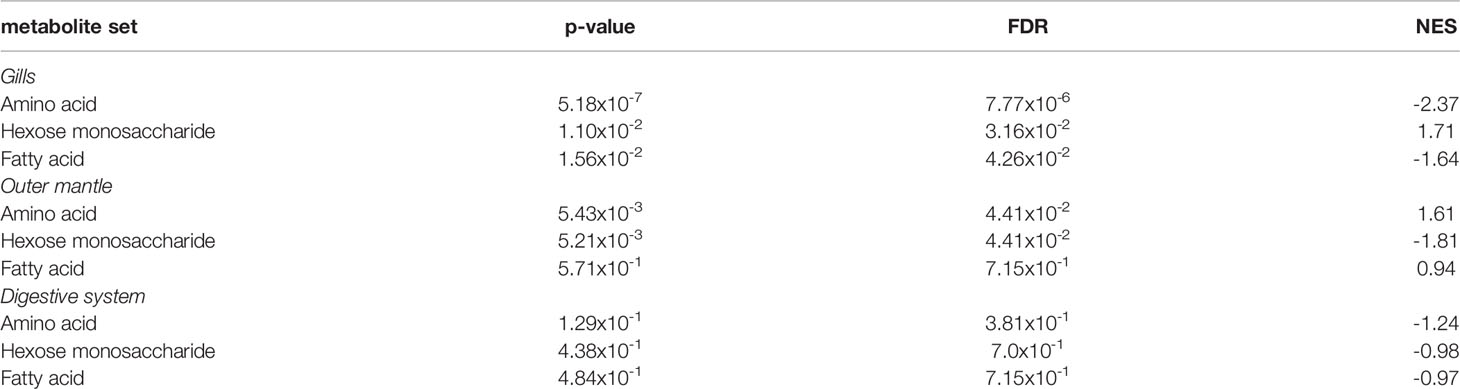
Table 1 MSEA of amino acids, hexose monosaccharide, and fatty acids among the three organ types (gills, outer mantle, and digestive system).
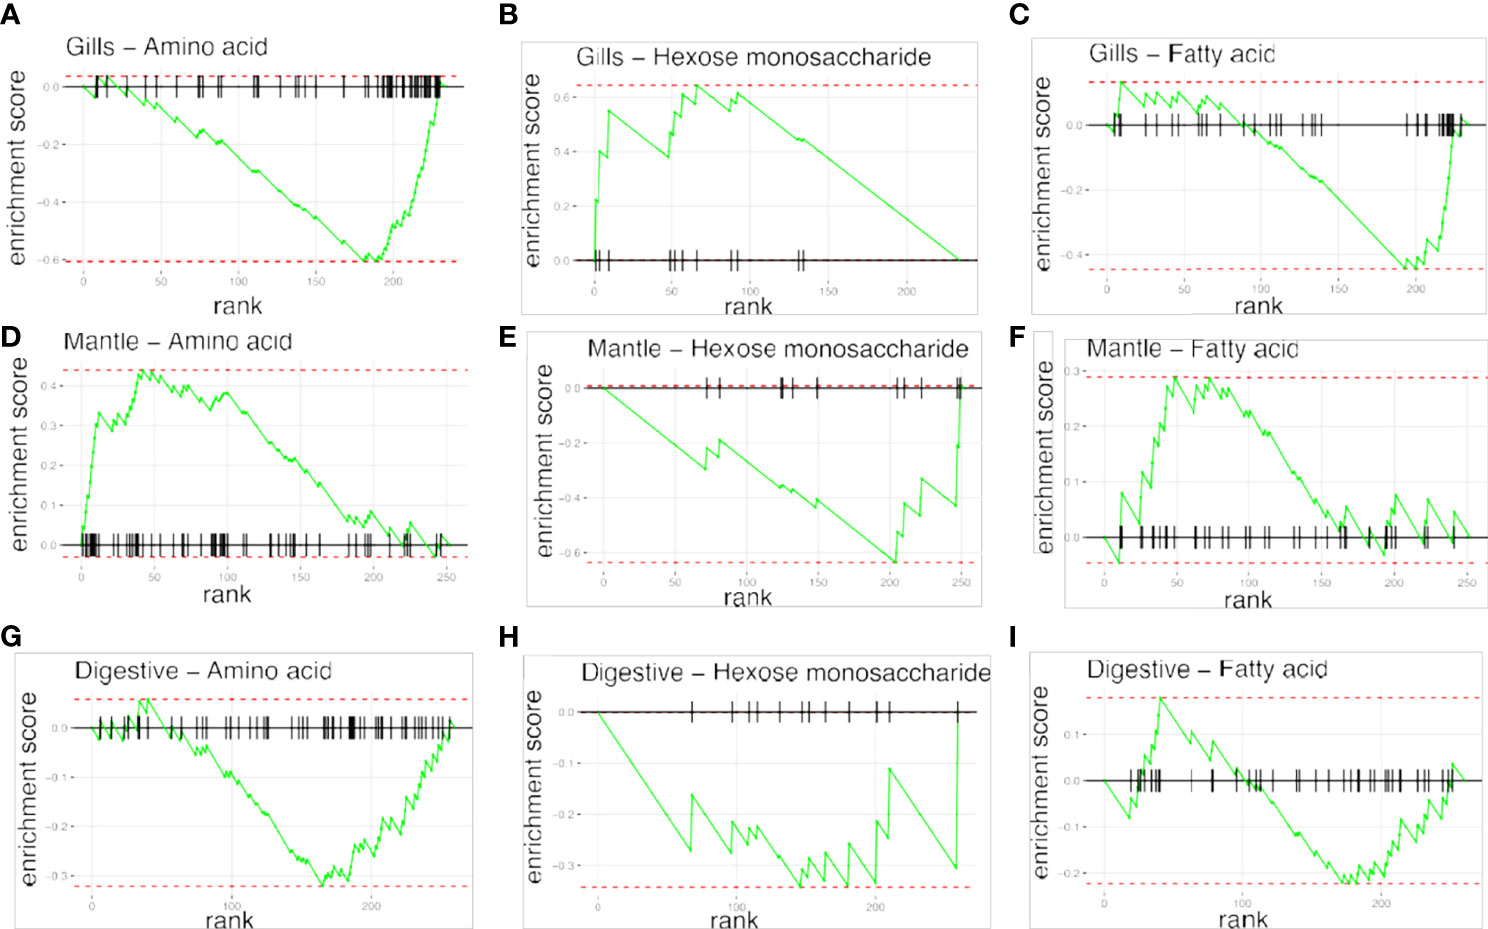
Figure 4 Metabolite Set Enrichment Analysis (MSEA) plots, showing the patterns of metabolites concentrations changes across reef sites. Plots in raws represent the organ type; (A–C) gills organ, (D–F) mantle organs, (G–I) digestive organs. Plots on columns represent different classes of compounds: amino acids, hexoses monosaccherides, and fatty acids.
Metabolic Profiles of T. maxima Are Organ-Specific
To assess organ-specific differences in metabolic profiles, we compared the metabolomes of gills, outer mantle, and digestive system samples from clams harvested in different locations. We used PCA of the combined NMR and MS-derived data sets and observed that different organs of T. maxima display significant differences (Figure 5A). The first component accounted for 36.7% of the total variance in the data set, with a further 19.0% explained by the second component and separated the metabolomes of different organs. Unsupervised KODAMA analysis confirmed that the main difference among samples is represented by the organ type (Figure 5B). Overall, metabolites in the outer mantle, gills, and digestive system represent 156 unique metabolites common in all organs. In total, 213 metabolites were quantified in more than one organ type, of which 18 were shared on the outer mantle and digestive system, 23 on the outer mantle and gills, 16 on the gills and digestive system. Both, the outer mantle and the digestive system showed the same number of unique metabolites, with a total of 40 each. We noted that the gills metabolome seemed less distinct, with only 13 unique metabolites (Figure 6, Table 2 and Supplemental Table 7). Overall, metabolomic profiles exhibit some organ-specificity, which mirrors our previous observations related to the composition and distribution of the microbiome (Rossbach et al., 2019).
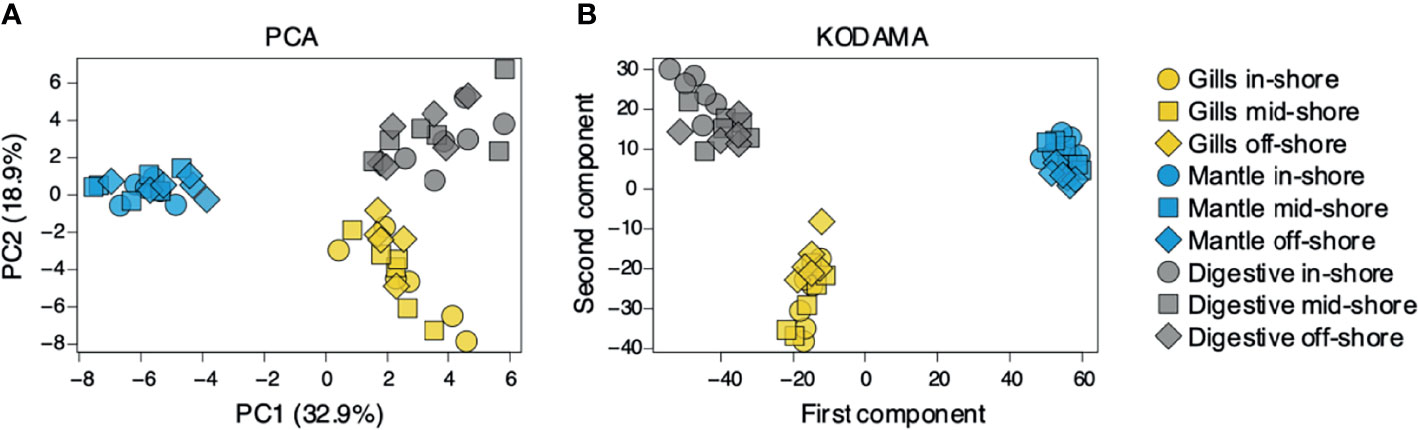
Figure 5 Metabolite’s comparison of T. maxima organ compartments (gill, outer mantle, and digestive system) across three reef sites (inshore, midshore, offshore). Inshore (●), mid-shore (■), off-shore (◆). (A) The score plot of PCA and (B) KODAMA. Each data point represents an individual sample.
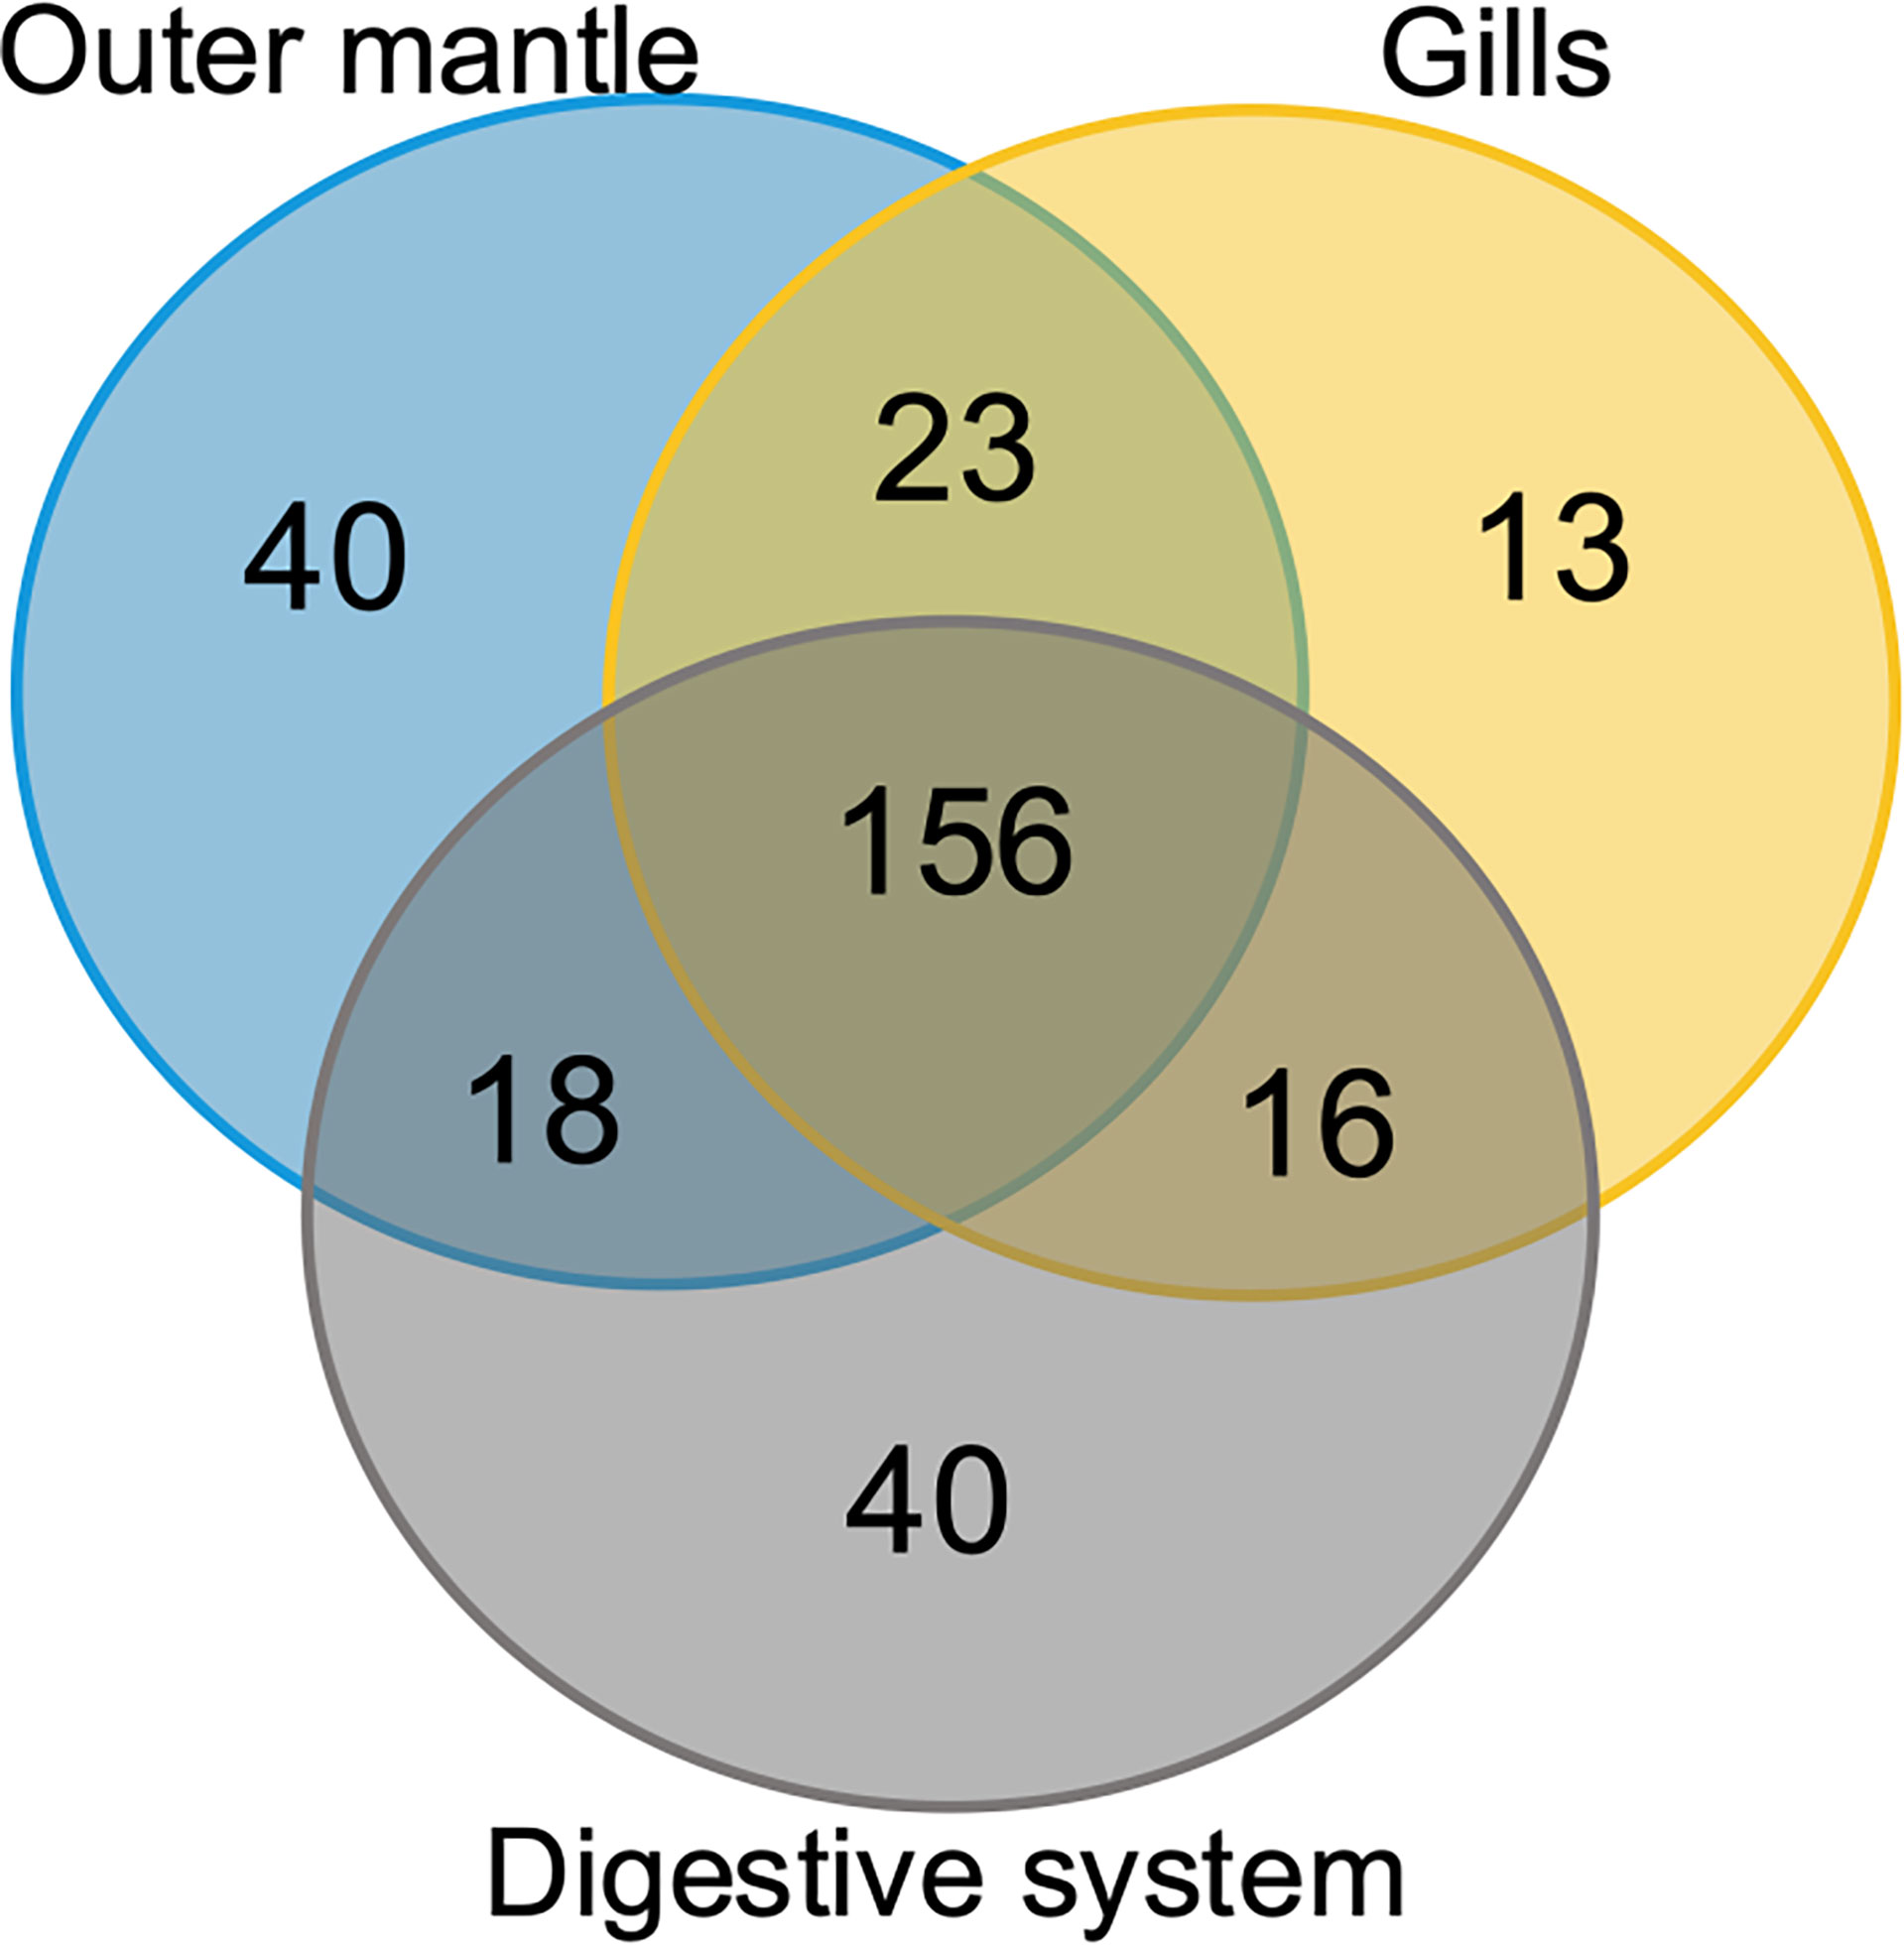
Figure 6 Organ-specific and common metabolites. Venn diagram showing the number of metabolites common in all three T. maxima organs and metabolites detected specifically in each organ.
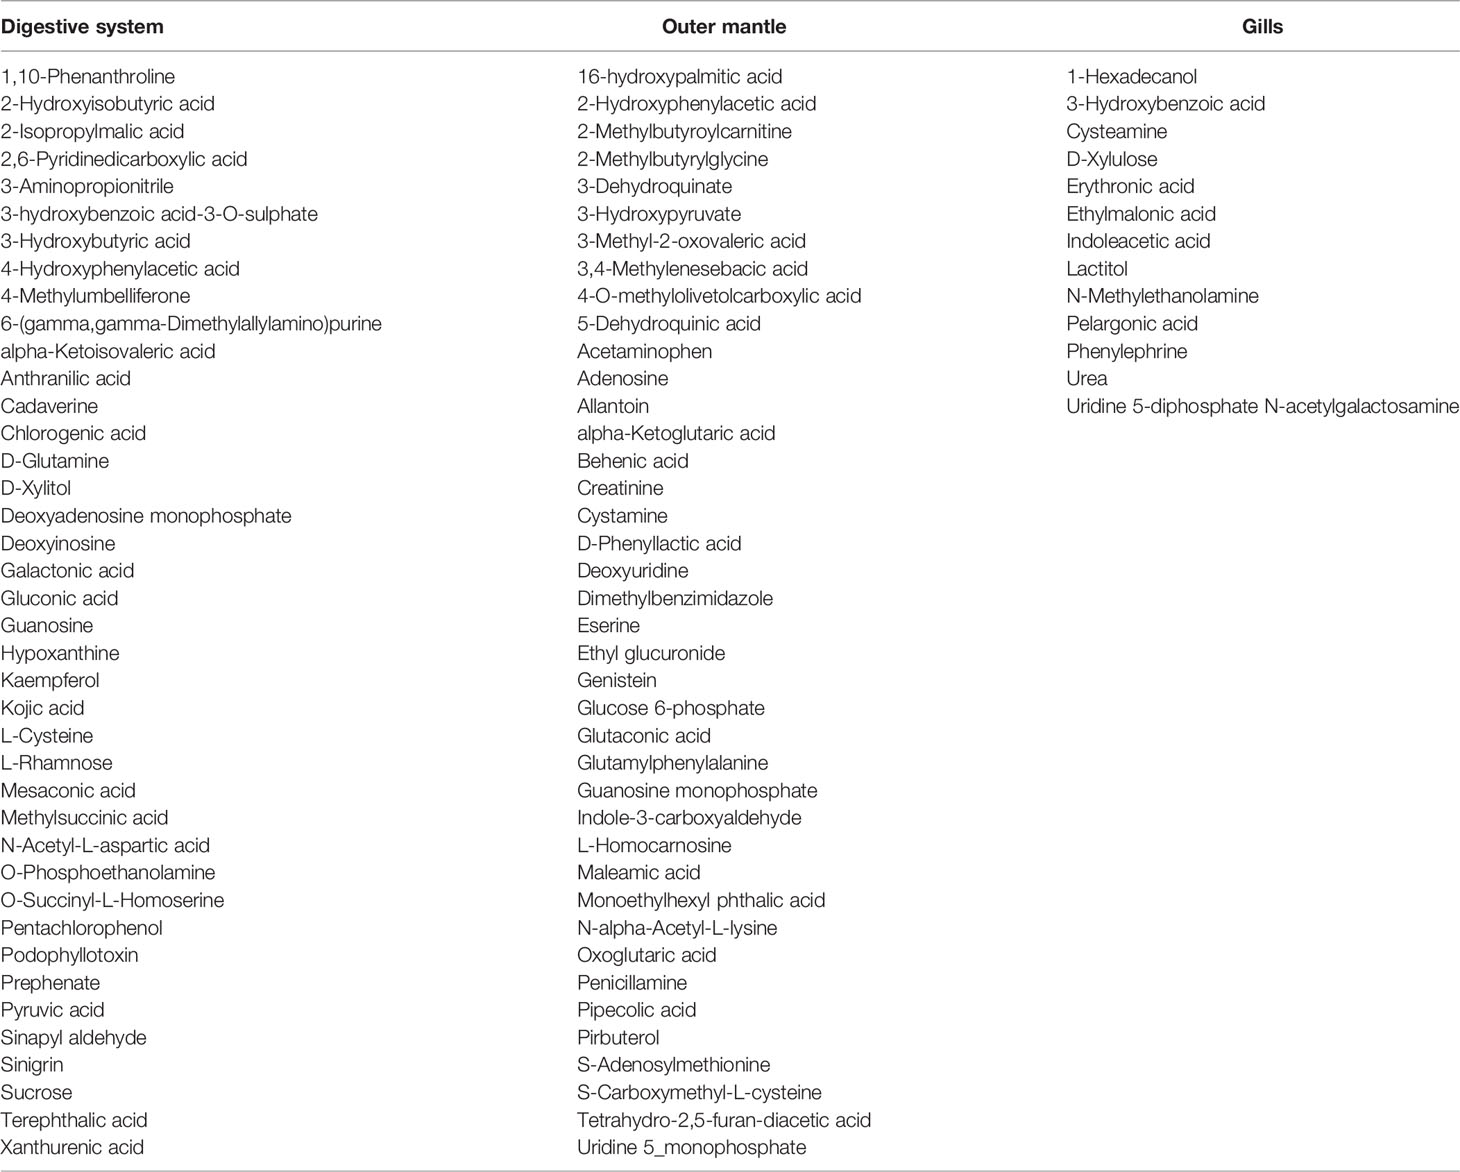
Table 2 Organ-dependent metabolites of the three organs (digestive system, outer mantle, and gills).
Detection of Aquatic Plastic-Related Pollutants
Our comprehensive metabolomic analysis revealed the presence of exogenous metabolites (Figure 7). We observed strong signals of two exogenous compounds in every sampled specimen and at every sampling location (i.e., from the in-shore, mid-shore and off-shore reef). Specifically, we detected terephthalic acid and isophthalic acid, two compounds that are likely derived from marine microplastics as terephthalic acid [also known as Purified Terephthalic Acid (PTA)] and its isomeric form [an isophthalic acid (IPA)]. They are two primary components of polyester polyethylene terephthalate (PET) (also abbreviated PETE). The GC-MS results showed that terephthalic acid is found only in the digestive system, with highly similar amounts among all reef sites (Figure 7). The second identified plastic-related compound is isophthalic acid (IPA). Our GC-MS analysis showed the presence of IPA in all organs, with a slightly increasing trend with distance off-shore in the mantle organ while decreasing in the digestive system with distance to the shore (Figure 7). These results unequivocally demonstrate that metabolomics is a powerful strategy to analyze and map aquatic plastic pollution. Yet, it remains to be determined whether the presence of these metabolites perturbs the endogenous physiology of the clam in any way.
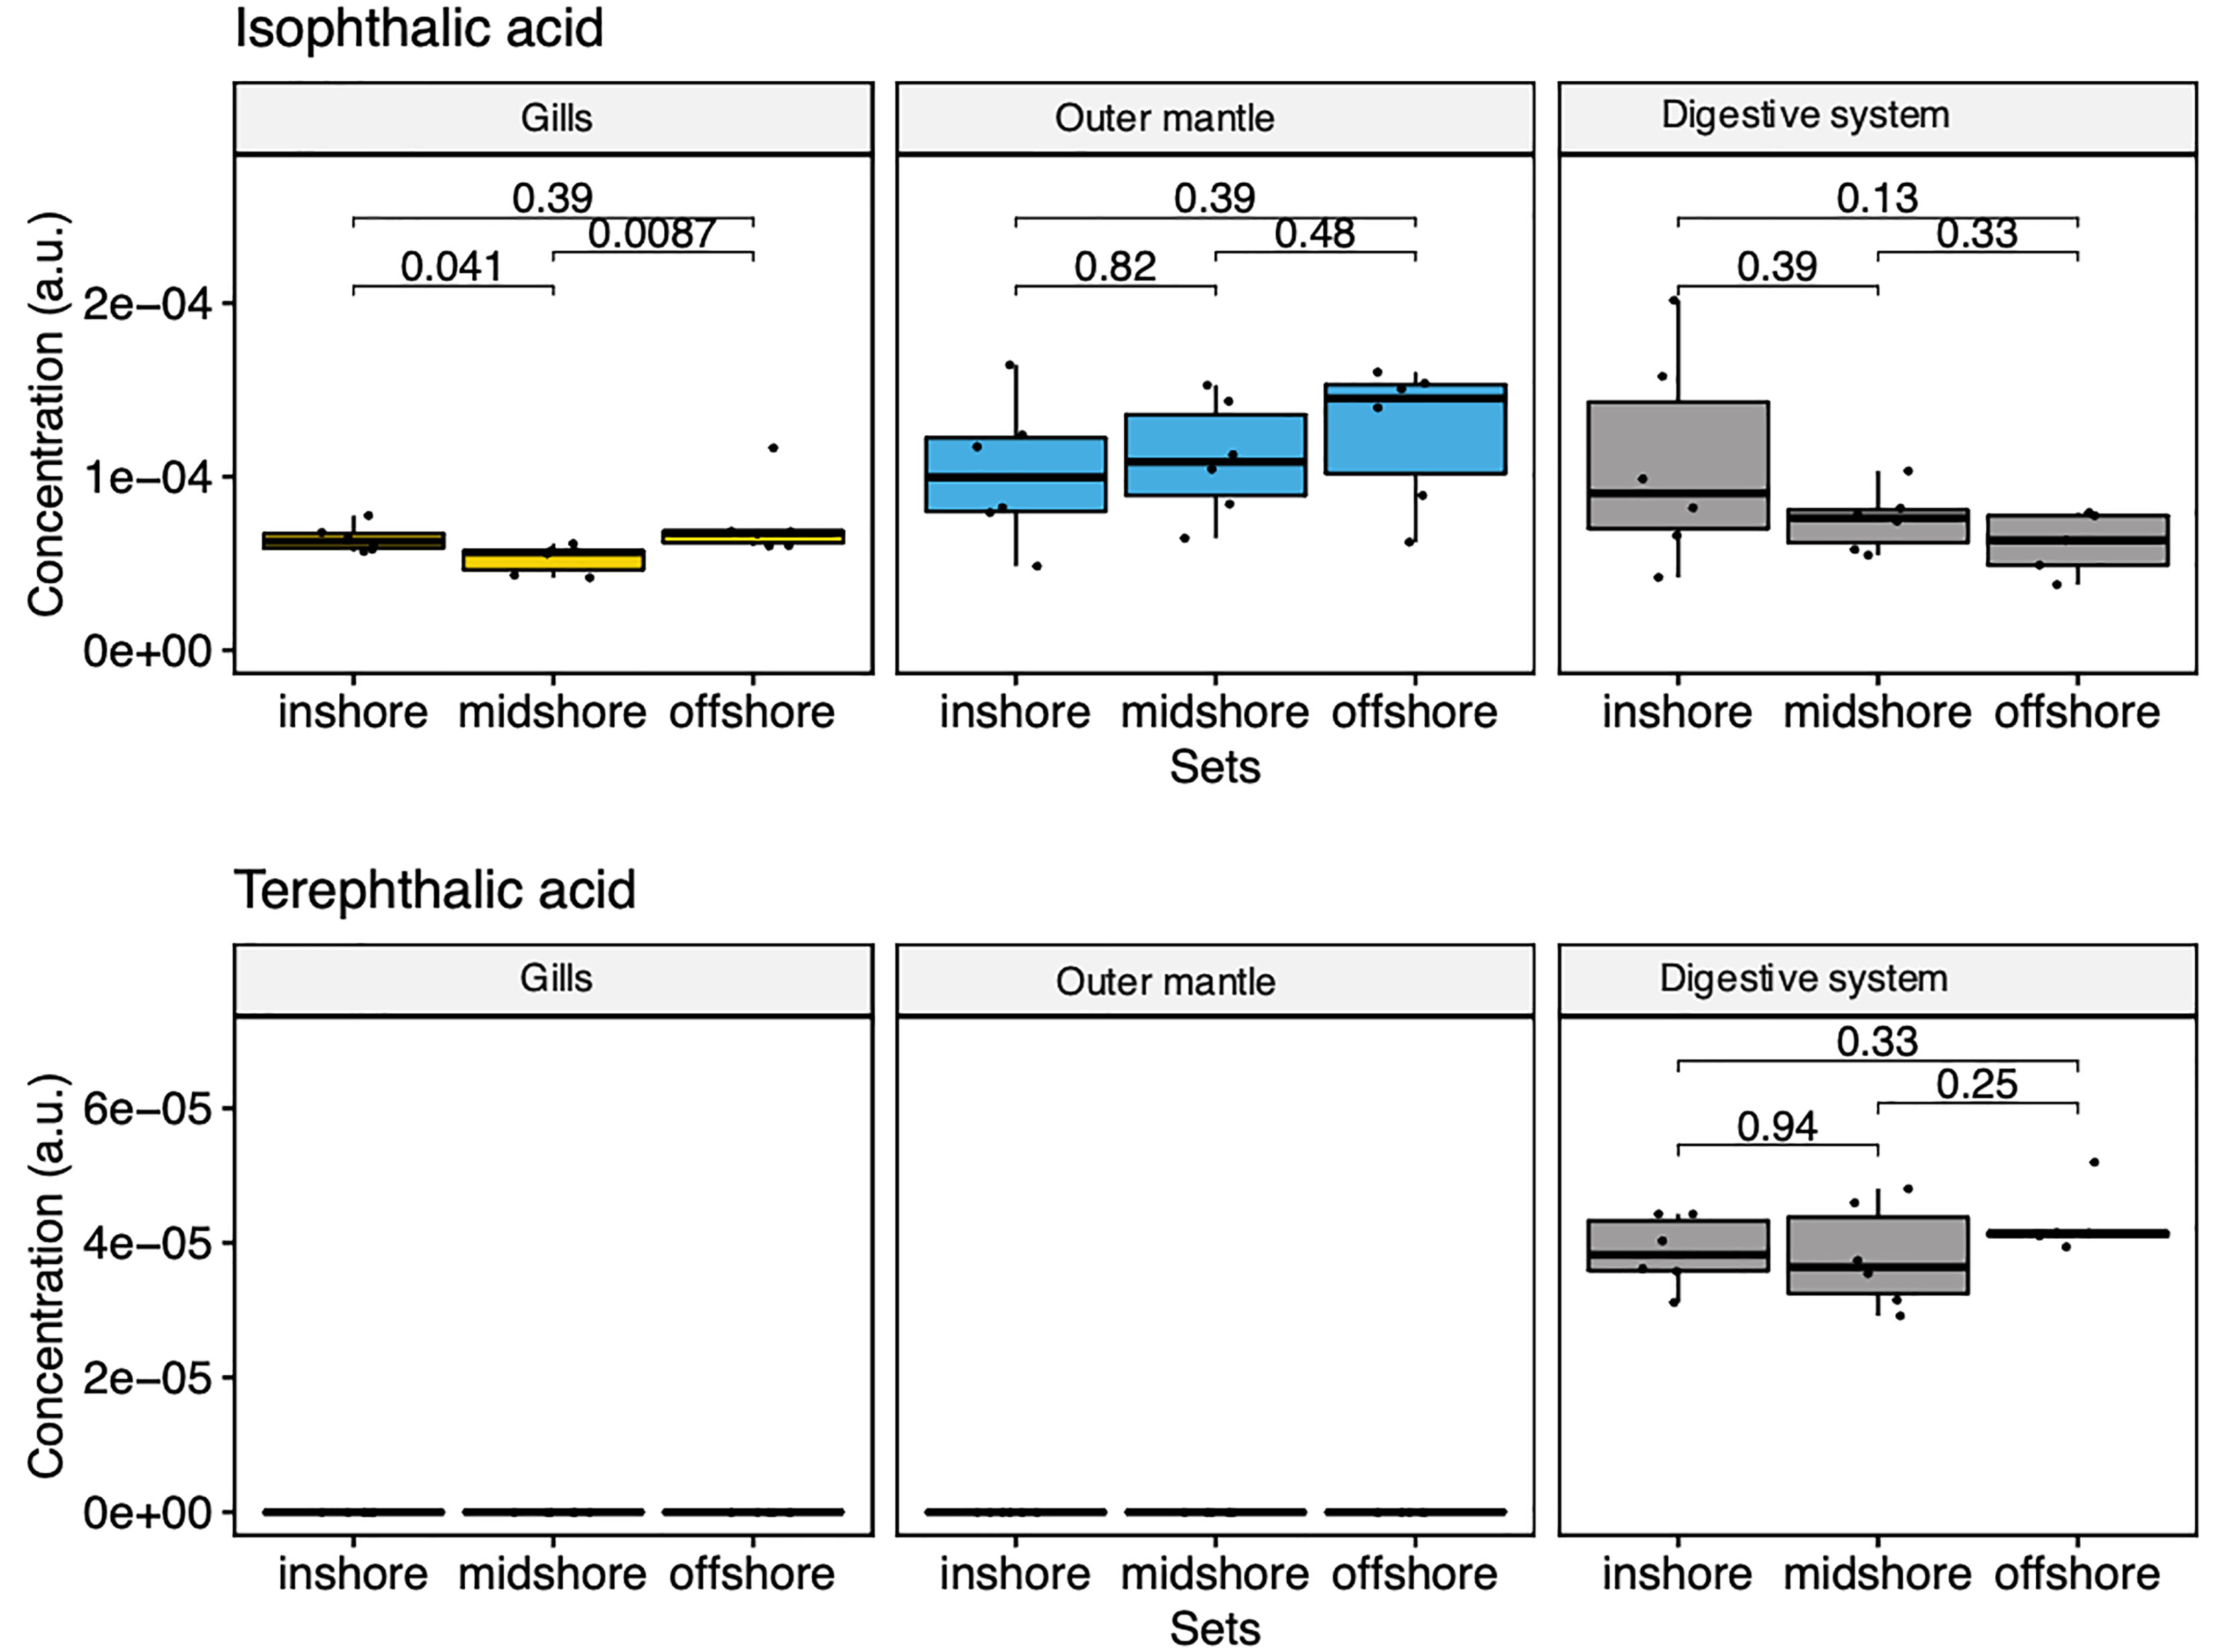
Figure 7 Box-and-whisker plots showing the relative abundance of compounds derived from marine microplastics of the three organ types (Gill, mantle, and digestive system) across the reef shores (in-shore, mid-shore, off-shore).
Discussion
This study provides the first comprehensive metabolomics analysis of T. maxima giant clams from the Red Sea, and reveals that the metabolome diversity of these bivalves exhibits organ-specific character. The identified endogenous metabolites belong to various chemical classes, such as amino acids, alkaloids, monosaccharides, and fatty acids, As such, they are expected to play varied important roles as shown for other organisms. However, we identified 306 unique metabolites, which is less than expected from the combined use of NMR and MS-based techniques for an organism of this size and holobiont complexity. We suggest that the main factor for this discrepancy is the incompleteness of the existing reference databases used for the experimental data sets interpretation and metabolite identification. We expect that with further identification of the marine natural products and optimization of the metabolic reference data for use with marine metabolomes, the number of identified metabolites will be expanded.
In terms of factors that could affect the composition of the metabolome, we examined the effect of the shore distance and the organ specificity. Our results did not show location-dependent metabolites differences. Therefore, our metabolic analysis suggest that the general metabolism of T.maxima is likely not affected by the distance to the shore of the reefs they inhabit which is in agreement with previous study showing no differential trends in bacterial profiles across the exact locations (Rossbach et al., 2019). This might be the result of the homogenization of the coral reefs throughout the Red Sea (Riegl et al., 2012), which increases resilience of T. maxima’s metabolism to environmental fluctuations (DiBattista et al., 2016).
We observed some level of organ specificity of metabolites (see Table 2), which is not surprising given the functional physiological differences between the sampled tissues (i.e., mantle, gills and digestive system). However, about 70% of the identified metabolites were either shared between two, or all three sampled organs (i.e., mantle, gills and digestive system), showing that in fact rather the concentrations of these metabolites in the specific tissue plays a key role, as it has been previously shown for other bivalves, for instance in Mytilus galloprovincialis mussels (Cappello et al., 2018), but also in fish (De Marco et al., 2022).
Several marine microorganisms, including, algae and bacteria, have been shown to live in a symbiotic association with T. maxima (Rossbach et al., 2019; Rossbach et al., 2021). Here, we have identified several metabolites that are possibly associated with microorganisms that live within T. maxima holobiont. For example, glycine, tryptophan, and phenylalanine, all metabolites that have been linked to Symbiodiniaceae (Beedessee et al., 2019). In addition, we also identified D-phenyllactic acid and indole-3-carboxaldehyde, two additional metabolites of likely bacterial origin. D-Phenyllactic acid is produced by lactic acid bacteria (LAB), such as Lactobacillus and Leuconostoc, and indole-3-carboxaldehyde was found in pseudomonad bacterium (Ramkissoon et al., 2020). All these species are consistent with the bacterial community of T. maxima identified previously (Rossbach et al., 2019), therefore supporting the bacterial origin of these metabolites.
In general, metabolites produced by the symbiotic microorganisms play a wide range of important roles, crucial for the survival of marine species, including bivalves (Matthews et al., 2020; Modolon et al., 2020). These metabolites regulate many biological functions, such as nutrient uptake, defense against predators, intracellular osmolyte systems, and others (Pang et al., 1977; Yancey et al., 1982; Carroll et al., 2020). The osmoregulation process is essential for the protection of T. maxima against fluctuations of the extracellular environment. Widely known osmolytes include different amino acids and their derivatives. We identified many metabolite-based amino acids and their derivatives, such as glycine, alanine, proline, betaine, taurine, and glutamic acid, which are known to be involved in the osmolyte system. These results are in good agreement with previous osmolyte system studies in marine organisms (Pang et al., 1977; Yancey et al., 1982). Moreover, we identified the presence of DMSP, one of the key compounds in the sulfur cycle and osmoregulation in marine species (Carroll et al., 2020). This compound is primarily produced by phytoplankton (Keller, 1989), thus DMSP is likely to be a product of the Tridacna’s Symbiodiniaceae (Hill et al., 2000; Guibert et al., 2020a). We also detected urea, one of the major intracellular osmolytes and an important product of nitrogen metabolism (Yancey et al., 1982), within the gills organ only, which is in agreement with their role as the primary site of urea absorption in clams (Chan et al., 2018) and observations made in mytilid bivalves and marine elasmobranchs (Pang et al., 1977; Thomsen et al., 2016). Overall, our results are aligned with the known aspects of the physiology of the giant clam holobiont (Wilkerson and Trench, 1986; Rees et al., 1994; Hiong et al., 2016; Chan et al., 2018). This is the first glimpse of the metabolic fingerprints of Red Sea Tridacna maxima giant clams and their molecular phenotype, as a direct manifestation of the inseparable genotype biodiversity and the environmental factors interplay.
Although most of the detected metabolites are compounds produced by the holobiont, some are likely to be exogenous, originating from pollutants. A number of studies have proven the ingestion of microplastics by aquatic organisms, especially invertebrates (Missawi et al., 2021; Cappello et al., 2021). More specifically, marine organisms, including T. maxima (Arossa et al., 2019), have been previously reported to ingest microplastics (Lebreton et al., 2017; Haward, 2018). Our metabolomics analysis provides further support for this, as both TPA and IPA we identified are likely derived from marine microplastic ingestion. More specifically, the main source of TPA in the Red Sea of the West coast of Saudi Arabia is the degradation of PET from anthropogenic plastic pollution, given that this region does not have plastic industry that contributes to significant levels of PET in sea water in other areas (Stanica-Ezeanu and Matei, 2021). Several studies have found that different types of microorganisms, such as bacteria and fungi, can mediate the degradation of PET into TPA in marine environments (Carr et al., 2020). Given the high diversity of the internal microbial community in the T. maxima holobiont (Rossbach et al., 2019), we propose that the holobiont itself degrades PET. This remains to be further tested, and our results that show the preferential presence of TPA in the digestive system suggest that special attention should be given to the microbiome associated with the digestive system. Ultimately, endogenous compounds may affect the holobiont’s health and interact with the endogenous metabolome, highlighting the importance of further studies in this area. Moreover, whereas the exogenous origins of the plastic-associated compounds we identified are clear, elucidating autochthonous vs. environmental sources of the metabolome components adds further challenges to the interpretation of the metabolomic data.
Conclusions
According the UN there is about 300 millions tons of different types of plastics produced in the all over the globe every year. Out of this global amount of plastics totally produced 14 millions of tons end up in the oceans and seas yearly constituting as estimated 80% of the total marine debris. This is one of the main source of serious disturbances of the marine ecosystems of all seas, and oceans. Therefore, the reduction of the plastics wastes production reminds a challenge for the years to come that needs to be successfully faced in order to safe a fragile equilibria of marine ecosystems.
In this study, we provide the first comprehensive metabolomic analysis of the giant clam Tridacna maxima holobiont and the effects of environmental pollutants in their metabolic fingerprint. As discussed, the metabolites we detected may originate from the microbial communities, endosymbiotic microalgae (Symbiodiniaceae), or the giant clam host itself. Although the origin of many metabolites remains to be determined, we were able to link several metabolites with metabolic paths specific for bacteria, the Symbiodinaceae, or the host.
In terms of the factors that affect the metabolome composition of the T. maxima holobiont, we showed that the metabolomes are organ-specific, whereas distance to shore of the reefs does not seem to have an impact. We conclude that the environmental differences among these reefs are probably not high enough to affect the metabolism of T. maxima. However, it is worth pointing out that the oceanographic conditions (e.g., salinity, temperature, nutrients concentration) of the Red Sea vary substantially with the seasons (Raitsos et al., 2013; Roik et al., 2016; Chaidez et al., 2017; Pearman et al., 2017). Therefore, analyzing the metabolite composition of these organisms during different times of the year would be of high interest.
Importantly, we provide the first experimental evidence that the giant clam T. maxima is ingesting pollutants derived from plastics, as we detected TPA and IPA in all the organs we analyzed. Given that these compounds were found in clams regardless of the reef, we conclude that the plastic contamination is uniformly spread in the region between 1.8 km to 21.1 km from the shore. Future research is needed to evaluate the impact of different levels of these plastic-derived compounds in the metabolic performance T. maxima, and examine whether these compounds are present in other reef organisms. Overall, we argue that metabolomic analysis can yield important insights into the physiological and ecological impact of plastic pollution.
Data Availability Statement
The original contributions presented in the study are included in the article/Supplementary Material. Further inquiries can be directed to the corresponding authors.
Author Contributions
FA: Investigation, Writing - Original Draft, Formal analysis. SR: Sample collection, Sample Processing, Writing - Original Draft, Resources. A-HE: Investigation. NK: Investigation. LJ: Investigation, Funding acquisition, Writing - Review & Editing. MJ: Supervision, Funding acquisition, Project administration, Resources, Writing - Original Draft, Writing - Review & Editing. CD: Supervision, Resources, Funding acquisition, Project administration, Writing - Review and Editing. All authors contributed to the article and approved the submitted version.
Funding
Authors want to acknowledge the funding support from the KAUST Smart Health Initiative (SHI) seed grants (LJ and MJ) and baseline funds (LJ, MJ, and CD).
Conflict of Interest
The authors declare that the research was conducted in the absence of any commercial or financial relationships that could be construed as a potential conflict of interest.
Publisher’s Note
All claims expressed in this article are solely those of the authors and do not necessarily represent those of their affiliated organizations, or those of the publisher, the editors and the reviewers. Any product that may be evaluated in this article, or claim that may be made by its manufacturer, is not guaranteed or endorsed by the publisher.
Supplementary Material
The Supplementary Material for this article can be found online at: https://www.frontiersin.org/articles/10.3389/fmars.2022.813404/full#supplementary-material
References
Alcazar S. N. (1986). Observations on Predators of Giant Clams (Bivalvia: Family Tridacnidae). Silliman J. 33 (1-4), 54–57.
Arossa S., Martin C., Rossbach S., Duarte C. M. (2019). Microplastic Removal by Red Sea Giant Clam (Tridacna Maxima). Environ. Pollut. 252 (Pt B), 1257–1266. doi: 10.1016/j.envpol.2019.05.149
Bayona L. M., de Voogd N. J., Choi Y. H. (2022). Metabolomics on the Study of Marine Organisms. Metabolomics 18 (3), 1–24. doi: 10.1007/s11306-022-01874-y
Beedessee G., Hisata K., Roy M. C., Van Dolah F. M., Satoh N., Shoguchi E. (2019). Diversified Secondary Metabolite Biosynthesis Gene Repertoire Revealed in Symbiotic Dinoflagellates. Sci. Rep. 9 (1), 1–24. doi: 10.1038/s41598-018-37792-0
Benjamini Y., Hochberg Y. (1995). Controlling the False Discovery Rate: A Practical and Powerful Approach to Multiple Testing. J. R. Stat. Soc Ser. B (Methodol) 57 (1), 289–300. doi: 10.1111/j.2517-6161.1995.tb02031.x
Cacciatore S., Luchinat C., Tenori L. (2014). Knowledge Discovery by Accuracy Maximization. Proc. Natl. Acad. Sci. 111 (14), 5117–5122. doi: 10.1073/pnas.1220873111
Cacciatore S., Tenori L., Luchinat C., Bennett P. R., MacIntyre D. A. (2016). KODAMA: An R Package for Knowledge Discovery and Data Mining. Bioinformatics 33 (4), 621–623. doi: 10.1093/bioinformatics/btw705
Caliani I., De Marco G., Cappello T., Giannetto A., Mancini G., Ancora S., et al. (2022). Assessment of the Effectiveness of a Novel Biofilm-Membrane Bioreactor Oil-Polluted Wastewater Treatment Technology by Applying Biomarkers in the Mussel Mytilus Galloprovincialis. Aquat. Toxicol. 243, 106059. doi: 10.1016/j.aquatox.2021.106059
Cappello T., De Marco G., Oliveri Conti G., Giannetto A., Ferrante M., Mauceri A., et al. (2021). Time-Dependent Metabolic Disorders Induced by Short-Term Exposure to Polystyrene Microplastics in the Mediterranean Mussel Mytilus Galloprovincialis. Ecotoxicol Environ. Saf. 209, 111780. doi: 10.1016/j.ecoenv.2020.111780
Cappello T., Fernandes D., Maisano M., Casano A., Bonastre M., Bebianno M. J., et al. (2017). Sex Steroids and Metabolic Responses in Mussels Mytilus Galloprovincialis Exposed to Drospirenone. Ecotoxicol Environ. Saf. 143, 166–172. doi: 10.1016/j.ecoenv.2017.05.031
Cappello T., Giannetto A., Parrino V., Maisano M., Oliva S., De Marco G., et al. (2018). Baseline Levels of Metabolites in Different Tissues of Mussel Mytilus Galloprovincialis (Bivalvia: Mytilidae). Comp. Biochem. Physiol. Part D: Genomics Proteomics 26, 32–39. doi: 10.1016/j.cbd.2018.03.005
Carr C. M., Clarke D. J., Dobson A. D. W. (2020). Microbial Polyethylene Terephthalate Hydrolases: Current and Future Perspectives. Front. Microbiol. 11. doi: 10.3389/fmicb.2020.571265
Carroll A. R., Copp B. R., Davis R. A., Keyzers R. A., Prinsep M. R. (2020). Marine Natural Products. Natural Product Rep. 37 (2), 175–223. doi: 10.1039/c9np00069k
Chaidez V., Dreano D., Agusti S., Duarte C. M., Hoteit I. (2017). Decadal Trends in Red Sea Maximum Surface Temperature. Sci. Rep. 7, 1–8. doi: 10.1038/s41598-017-08146-z
Chandra K., Al-Harthi S., Almulhim F., Emwas A. H., Jaremko L., Jaremko M. (2021a). The Robust NMR Toolbox for Metabolomics. Mol. Omics. 17 (5), 719–724 doi: 10.1039/d1mo00118c
Chandra K., Al-Harthi S., Sukumaran S., Almulhim F., Emwas A. H., Atreya H. S., et al. (2021b). NMR-Based Metabolomics With Enhanced Sensitivity. Rsc Adv. 11 (15), 8694–8700. doi: 10.1039/d1ra01103k
Chan C. Y. L., Hiong K. C., Boo M. V., Choo C. Y. L., Wong W. P., Chew S. F., et al. (2018). Light Exposure Enhances Urea Absorption in the Fluted Giant Clam, Tridacna Squamosa, and Up-Regulates the Protein Abundance of a Light-Dependent Urea Active Transporter, DUR3-Like, in its Ctenidium. J. Exp. Biol. 221 (8), 1–11. doi: 10.1242/jeb.176313
Cleves P. A., Shumaker A., Lee J., Putnam H. M., Bhattacharya D. (2020). Unknown to Known: Advancing Knowledge of Coral Gene Function. Trends Genet. 36 (2), 93–104. doi: 10.1016/j.tig.2019.11.001
Cui G. X., Liew Y. J., Li Y., Kharbatia N., Zahran N. I., Emwas A. H., et al. (2019). Host-Dependent Nitrogen Recycling as a Mechanism of Symbiont Control in Aiptasia. PloS Genet. 15 (6), 1–19. doi: 10.1371/journal.pgen.1008189
Cziesielski M. J., Liew Y. J., Cui G., Schmidt-Roach S., Campana S., Marondedze C., et al. (2018). Multi-Omics Analysis of Thermal Stress Response in a Zooxanthellate Cnidarian Reveals the Importance of Associating With Thermotolerant Symbionts. Proc. Biol. Sci. 285 (1877), 1–10. doi: 10.1098/rspb.2017.2654
De Grave S. (1999). Pontoniinae (Crustacea: Decapoda: Palaemonidae) Associated With Bivalve Molluscs From Hansa Bay, Papua New Guinea. Bull. l’Inst R. Des. Sci. Naturelles Belgique Biol 69, 125–141.
De Marco G., Brandão F., Pereira P., Pacheco M., Cappello T. (2022). Organ-Specific Metabolome Deciphering Cell Pathways to Cope With Mercury in Wild Fish (Golden Grey Mullet Chelon Auratus). Animals 12 (1), 79. doi: 10.3390/ani12010079
DiBattista J. D., Roberts M. B., Bouwmeester J., Bowen B. W., Coker D. J., Lozano-Cortés D. F., et al. (2016). A Review of Contemporary Patterns of Endemism for Shallow Water Reef Fauna in the Red Sea. J. Biogeogr 43 (3), 423–439. doi: 10.1111/jbi.12649
Dieterle F., Ross A., Schlotterbeck G., Senn H. (2006). Probabilistic Quotient Normalization as Robust Method to Account for Dilution of Complex Biological Mixtures. Application in 1H NMR Metabonomics. Anal. Chem. 78 (13), 4281–4290. doi: 10.1021/ac051632c
Domingo-Almenara X., Brezmes J., Vinaixa M., Samino S., Ramirez N., Ramon-Krauel M., et al. (2016). Erah: A Computational Tool Integrating Spectral Deconvolution and Alignment With Quantification and Identification of Metabolites in GC/MS-Based Metabolomics. Anal. Chem. 88 (19), 9821–9829. doi: 10.1021/acs.analchem.6b02927
Emwas A. H., Roy R., McKay R. T., Tenori L., Saccenti E., Gowda G. A. N., et al. (2019). NMR Spectroscopy for Metabolomics Research. Metabolites 9 (7), 1–39. doi: 10.3390/metabo9070123
Emwas A.-H. M., Salek R. M., Griffin J. L., Merzaban J. (2013). NMR-Based Metabolomics in Human Disease Diagnosis: Applications, Limitations, and Recommendations. Metabolomics. 9 (5), 1048–1072. doi: 10.1007/s11306-013-0524-y
Emwas A.-H., Szczepski K. T., McKay R., Asfour H., Chang C., Lachowicz J., et al. (2021). Pharmacometabolomics: A New Horizon in Personalized Medicine. Metabolomics - Methodology and Applications in Medical Sciences and Life Sciences [Working Title]. doi: 10.5772/intechopen.98911
Fine D., Wherritt D., Sumner L. W. (2015). Bruker-Sumner Metabobase Plant Libraries 1.0.2015. Available online: https://www.bruker.com/service/support-upgrades/software-downloads/mass-spectrometry.html.
Guibert I., Bourdreux F., Bonnard I., Pochon X., Dubousquet V., Raharivelomanana P., et al. (2020a). Dimethylsulfoniopropionate Concentration in Coral Reef Invertebrates Varies According to Species Assemblages. Sci. Rep. 10 (1), 1–10. doi: 10.1038/s41598-020-66290-5
Guibert I., Lecellier G., Torda G., Pochon X., Berteaux-Lecellier V. (2020b). Metabarcoding Reveals Distinct Microbiotypes in the Giant Clam Tridacna Maxima. Microbiome 8 (1), 1–57. doi: 10.1186/s40168-020-00835-8
Haward M. (2018). Plastic Pollution of the World's Seas and Oceans as a Contemporary Challenge in Ocean Governance. Nat. Commun. 9 (1), 667. doi: 10.1038/s41467-018-03104-3
Hill R. W., Dacey J. W. H., Edward A. (2000). Dimethylsulfoniopropionate in Giant Clams (Tridacnidae). Biol. Bull. 199 (2), 108–115. doi: 10.2307/1542870
Hiong K., Choo C. Y. L., Boo M. V., Ching B., Wong W. P., Chew S., et al. (2016). A Light-Dependent Ammonia-Assimilating Mechanism in the Ctenidia of a Giant Clam. Coral Reefs 36, 311–323. doi: 10.1007/s00338-016-1502-4
Horai H., Arita M., Kanaya S., Nihei Y., Ikeda T., Suwa K., et al. (2010). MassBank: A Public Repository for Sharing Mass Spectral Data for Life Sciences. J. Mass Spectrom 45 (7), 703–714. doi: 10.1002/jms.1777
Keller M. D., Bellows W. K., Guillard R. R. (1989). Dimethyl Sulfide Production in Marine Phytoplankton. ACS Symposium Series 167–182. doi: 10.1021/bk-1989-0393.ch011
Klumpp D. W., Griffiths C. L. (1994). Contributions of Phototrophic and Heterotrophic Nutrition to the Metabolic and Growth Requirements of Four Species of Giant Clam (Tridacnidae). Marine Ecol. Prog. Ser. 115 (1/2), 103–115. doi: 10.3354/meps115103
Korotkevich G., Sukhov V., Sergushichev A. (2019). Fast Gene Set Enrichment Analysis. bioRxiv 060012, 1–40. doi: 10.1101/060012
Lankadurai B. P., Nagato E. G., Simpson M. J. (2013). Environmental Metabolomics: An Emerging Approach to Study Organism Responses to Environmental Stressors. Environ. Rev. 21 (3), 180–205. doi: 10.1139/er-2013-0011
Lebreton L. C. M., van der Zwet J., Damsteeg J.-W., Slat B., Andrady A., Reisser J. (2017). River Plastic Emissions to the World’s Oceans. Nat. Commun. 8 (1), 15611. doi: 10.1038/ncomms15611
Li S., Winters H., Jeong S., Emwas A.-H., Vigneswaran S., Amy G. L. (2016). Marine Bacterial Transparent Exopolymer Particles (TEP) and TEP Precursors: Characterization and RO Fouling Potential. Desalination 379, 68–74. doi: 10.1016/j.desal.2015.10.005
Marante F. J. T. (2016). Chapter: Marine Environmental Metabolomics (Alabama, USA: InTech). p. 3–17. Available at: https://www.intechopen.com/chapters/52982.
Matthews J. L., Raina J. B., Kahlke T., Seymour J. R., van Oppen M. J. H., Suggett D. J. (2020). Symbiodiniaceae-Bacteria Interactions: Rethinking Metabolite Exchange in Reef-Building Corals as Multi-Partner Metabolic Networks. Environ. Microbiol. 22 (5), 1675–1687. doi: 10.1111/1462-2920.14918
McFall-Ngai M., Hadfield M. G., Bosch T. C. G., Carey H. V., Domazet-Lošo T., Douglas A. E., et al. (2013). Animals in a Bacterial World, a New Imperative for the Life Sciences. Proc. Natl. Acad. Sci. 110 (9), 3229–3236. doi: 10.1073/pnas.1218525110
Meyer E., Weis V. M. (2012). Study of Cnidarian-Algal Symbiosis in the "Omics" Age. Biol. Bull. 223 (1), 44–65. doi: 10.1086/BBLv223n1p44
Missawi O., Bousserrhine N., Zitouni N., Maisano M., Boughattas I., De Marco G., et al. (2021). Uptake, Accumulation and Associated Cellular Alterations of Environmental Samples of Microplastics in the Seaworm Hediste Diversicolor. J. Hazardous Materials 406, 124287. doi: 10.1016/j.jhazmat.2020.124287
Modolon F., Barno A. R., Villela H. D. M., Peixoto R. S. (2020). Ecological and Biotechnological Importance of Secondary Metabolites Produced by Coral-Associated Bacteria. J. Appl. Microbiol. 129 (6), 1441–1457. doi: 10.1111/jam.14766
Neo M. L., Eckman W., Vicentuan K., Teo S. L. M., Todd P. A. (2015). The Ecological Significance of Giant Clams in Coral Reef Ecosystems. Biol. Conserv. 181, 111–123. doi: 10.1016/j.biocon.2014.11.004
Nicholson J. K., Lindon J. C., Holmes E. (1999). 'Metabonomics': Understanding the Metabolic Responses of Living Systems to Pathophysiological Stimuli via Multivariate Statistical Analysis of Biological NMR Spectroscopic Data. Xenobiotica 29 (11), 1181–1189. doi: 10.1080/004982599238047
Ochsenkühn M. A., Schmitt-Kopplin P., Harir M., Amin S. A. (2018). Coral Metabolite Gradients Affect Microbial Community Structures and Act as a Disease Cue. Commun. Biol. 1 (1), 184. doi: 10.1038/s42003-018-0189-1
Pang P. K. T., Griffith R. W., Atz J. W. (1977). Osmoregulation in Elasmobranchs. Am. Zool 17 (2), 365–377. doi: 10.1093/icb/17.2.365
Pearman J. K., Ellis J., Irigoien X., Sarma Y. V. B., Jones B. H., Carvalho S. (2017). Microbial Planktonic Communities in the Red Sea: High Levels of Spatial and Temporal Variability Shaped by Nutrient Availability and Turbulence. Sci. Rep. 7, 1–14. doi: 10.1038/s41598-017-06928-z
Raitsos D. E., Pradhan Y., Brewin R. J. W., Stenchikov G., Hoteit I. (2013). Remote Sensing the Phytoplankton Seasonal Succession of the Red Sea. PloS One 8 (6), 1–9. doi: 10.1371/journal.pone.0064909
Ramkissoon A., Seepersaud M., Maxwell A., Jayaraman J., Ramsubhag A. (2020). Isolation and Antibacterial Activity of Indole Alkaloids From Pseudomonas Aeruginosa UWI-1. Molecules (Basel Switzerland) 25 (16), 3744. doi: 10.3390/molecules25163744
Rees T. A. V., Fitt W. K., Yellowlees D. (1994). Host Glutamine-Synthetase Activities in the Giant Clam Zooxanthellae Symbiosis - Effects of Clam Size, Elevated Ammonia and Continuous Darkness. Marine Biol. 118 (4), 681–685. doi: 10.1007/Bf00347516
Riegl B. M., Bruckner A. W., Rowlands G. P., Purkis S. J., Renaud P. (2012). Red Sea Coral Reef Trajectories Over 2 Decades Suggest Increasing Community Homogenization and Decline in Coral Size. PloS One 7 (5), e38396. doi: 10.1371/journal.pone.0038396
Roik A., Rothig T., Roder C., Ziegler M., Kremb S. G., Voolstra C. R. (2016). Year-Long Monitoring of Physico-Chemical and Biological Variables Provide a Comparative Baseline of Coral Reef Functioning in the Central Red Sea. PloS One 11 (11), 1–34. doi: 10.1371/journal.pone.0163939
Rossbach S., Cardenas A., Perna G., Duarte C. M., Voolstra C. R. (2019). Tissue-Specific Microbiomes of the Red Sea Giant Clam Tridacna Maxima Highlight Differential Abundance of Endozoicomonadaceae. Front. Microbiol. 10. doi: 10.3389/fmicb.2019.02661
Rossbach S., Hume B. C. C., Cardenas A., Perna G., Voolstra C. R., Duarte C. M. (2021). Flexibility in Red Sea Tridacna Maxima-Symbiodiniaceae Associations Supports Environmental Niche Adaptation. Ecol. Evol. 11 (7), 3393–3406. doi: 10.1002/ece3.7299
Stanica-Ezeanu D., Matei D. (2021). Natural Depolymerization of Waste Poly(Ethylene Terephthalate) by Neutral Hydrolysis in Marine Water. Sci. Rep. 11 (1), 4431. doi: 10.1038/s41598-021-83659-2
Subramanian A., Tamayo P., Mootha V. K., Mukherjee S., Ebert B. L., Gillette M. A., et al. (2005). Gene Set Enrichment Analysis: A Knowledge-Based Approach for Interpreting Genome-Wide Expression Profiles. Proc. Natl. Acad. Sci. U.S.A. 102 (43), 15545–15550. doi: 10.1073/pnas.0506580102
Taylor D. L. (1969). Identity of Zooxanthellae Isolated From Some Pacific Tridacnidae. J. Phycol 5 (4), 336. doi: 10.1111/j.1529-8817.1969.tb02623.x
Thomsen J., Himmerkus N., Holland N., Sartoris F. J., Bleich M., Tresguerres M. (2016). Ammonia Excretion in Mytilid Mussels is Facilitated by Ciliary Beating. J. Exp. Biol. 219 (15), 2300–2310. doi: 10.1242/jeb.139550
Troyanskaya O., Cantor M., Sherlock G., Brown P., Hastie T., Tibshirani R., et al. (2001). Missing Value Estimation Methods for DNA Microarrays. Bioinformatics 17 (6), 520–525. doi: 10.1093/bioinformatics/17.6.520
Vicentuan-Cabaitan K., Neo M. L., Eckman W., Teo S. L. M., Todd P. A. (2014). Giant Clam Shells Host a Multitude of Epibionts. Bull. Marine Sci. 90 (3), 795–796. doi: 10.5343/bms.2014.1010
Vignet C., Cappello T., Fu Q., Lajoie K., De Marco G., Clérandeau C., et al. (2019). Imidacloprid Induces Adverse Effects on Fish Early Life Stages That are More Severe in Japanese Medaka (Oryzias Latipes) Than in Zebrafish (Danio Rerio). Chemosphere 225, 470–478. doi: 10.1016/j.chemosphere.2019.03.002
Wilkerson F. P., Trench R. K. (1986). Uptake of Dissolved Inorganic Nitrogen by the Symbiotic Clam Tridacna-Gigas and the Coral Acropora Sp. Marine Biol. 93 (2), 237–246. doi: 10.1007/Bf00508261
Wishart D. S., Feunang Y. D., Marcu A., Guo A. C., Liang K., Vazquez-Fresno R., et al. (2018). HMDB 4.0: The Human Metabolome Database for 2018. Nucleic Acids Res. 46 (D1), D608–D617. doi: 10.1093/nar/gkx1089
Wishart D. S., Tzur D., Knox C., Eisner R., Guo A. C., Young N., et al. (2007). HMDB: The Human Metabolome Database. Nucleic Acids Res. 35 (Database issue), D521–D526. doi: 10.1093/nar/gkl923
Wu H., Southam A. D., Hines A., Viant M. R. (2008). High-Throughput Tissue Extraction Protocol for NMR- and MS-Based Metabolomics. Anal. Biochem. 372 (2), 204–212. doi: 10.1016/j.ab.2007.10.002
Xia J. G., Wishart D. S. (2010). MSEA: A Web-Based Tool to Identify Biologically Meaningful Patterns in Quantitative Metabolomic Data. Nucleic Acids Res. 38, W71–W77. doi: 10.1093/nar/gkq329
Yancey P. H., Clark M. E., Hand S. C., Bowlus R. D., Somero G. N. (1982). Living With Water-Stress - Evolution of Osmolyte Systems. Science 217 (4566), 1214–1222. doi: 10.1126/science.7112124
Keywords: Tridacninae, giant clam, exogenous and endogenous metabolites, 1H NMR, GC-MS, HPLC-MS, marine microplastic investigation
Citation: Almulhim F, Rossbach S, Emwas A-H, Kharbatia NM, Jaremko L, Jaremko M and Duarte CM (2022) Metabolomic Study on Tridacna maxima Giant Clams Reveals Metabolic Fingerprint of Environmental Pollutants. Front. Mar. Sci. 9:813404. doi: 10.3389/fmars.2022.813404
Received: 11 November 2021; Accepted: 15 March 2022;
Published: 22 April 2022.
Edited by:
Punyasloke Bhadury, Indian Institute of Science Education and Research Kolkata, IndiaReviewed by:
Prasun Goswami, National Institute of Ocean Technology, IndiaThane Militz, University of the Sunshine Coast, Australia
Tiziana Cappello, University of Messina, Italy
Copyright © 2022 Almulhim, Rossbach, Emwas, Kharbatia, Jaremko, Jaremko and Duarte. This is an open-access article distributed under the terms of the Creative Commons Attribution License (CC BY). The use, distribution or reproduction in other forums is permitted, provided the original author(s) and the copyright owner(s) are credited and that the original publication in this journal is cited, in accordance with accepted academic practice. No use, distribution or reproduction is permitted which does not comply with these terms.
*Correspondence: Mariusz Jaremko, bWFyaXVzei5qYXJlbWtvQGthdXN0LmVkdS5zYQ==; Carlos M. Duarte, Y2FybG9zLmR1YXJ0ZUBrYXVzdC5lZHUuc2E=