 Emily L. Hague1*
 Carol E. Sparling2
 Ceri Morris3
 Duncan Vaughan4
 Rebecca Walker4
 Ross M. Culloch5
 Alastair R. Lyndon1
 Teresa F. Fernandes1
 Lauren H. McWhinnie1,6
- 1Centre for Marine Biodiversity and Biotechnology, Institute of Life and Earth Sciences, Heriot-Watt University, Edinburgh, United Kingdom
- 2Sea Mammal Research Unit, Scottish Oceans Institute, University of St Andrews, St Andrews, United Kingdom
- 3Natural Resources Wales, Bangor, United Kingdom
- 4Natural England, County Hall, Worcester, United Kingdom
- 5School of Natural and Built Environment, Queen’s University Belfast, Belfast, United Kingdom
- 6Department of Geography, University of Victoria, Victoria, BC, Canada
Marine mammals are vulnerable to a variety of acute and chronic anthropogenic stressors, potentially experiencing these in isolation, successively and/or simultaneously. Formal assessment of the likely impact(s) of the cumulative effects of multiple stressors on a defined population is carried out through a Cumulative Effects Assessment (CEA), which is a mandatory component of the Environmental Impact Assessment (EIA) process in many countries. However, for marine mammals, the information required to feed into CEA, such as thresholds for disturbance, frequency of multiple (and simultaneous) exposures, interactions between stressors, and individual variation in response, is extremely limited, though our understanding is slowly improving. The gaps in knowledge make it challenging to effectively quantify and subsequently assess the risk of individual and population consequences of multiple disturbances in the form of a CEA. To assess the current state of practice for assessing cumulative effects on marine mammals within UK waters, 93 CEAs were reviewed across eleven maritime industries. An objective framework of thirteen evaluative criteria was used to score each assessment on a scale of 13-52 (weak - strong). Scores varied significantly by industry. On average, the aquaculture industry produced the lowest scoring CEAs, whilst the large offshore windfarm industry (≥ 20 turbines) scored highest, according to the scoring criteria used. There was a significant increase in scores over the sample period (2009-2019), though this was mostly attributed to five industries (cable, large and small offshore wind farms, tidal and wave energy). There was inconsistency in the language used to define and describe cumulative effects and a lack of routinely applied methodology. We use the findings presented here, along with a wider review of the literature, to provide recommendations and discussion points aimed at supporting the standardisation and improvement of CEA practice. Although this research focused on how marine mammals were considered within UK CEAs, recommendations made are broadly applicable to assessments conducted for other receptors, countries and/or environments. Adoption of these proposals would help to ensure a more consistent approach, and would aid decision-makers and practitioners in mitigating any potential impacts, to ensure conservation objectives of marine mammal populations are not compromised.
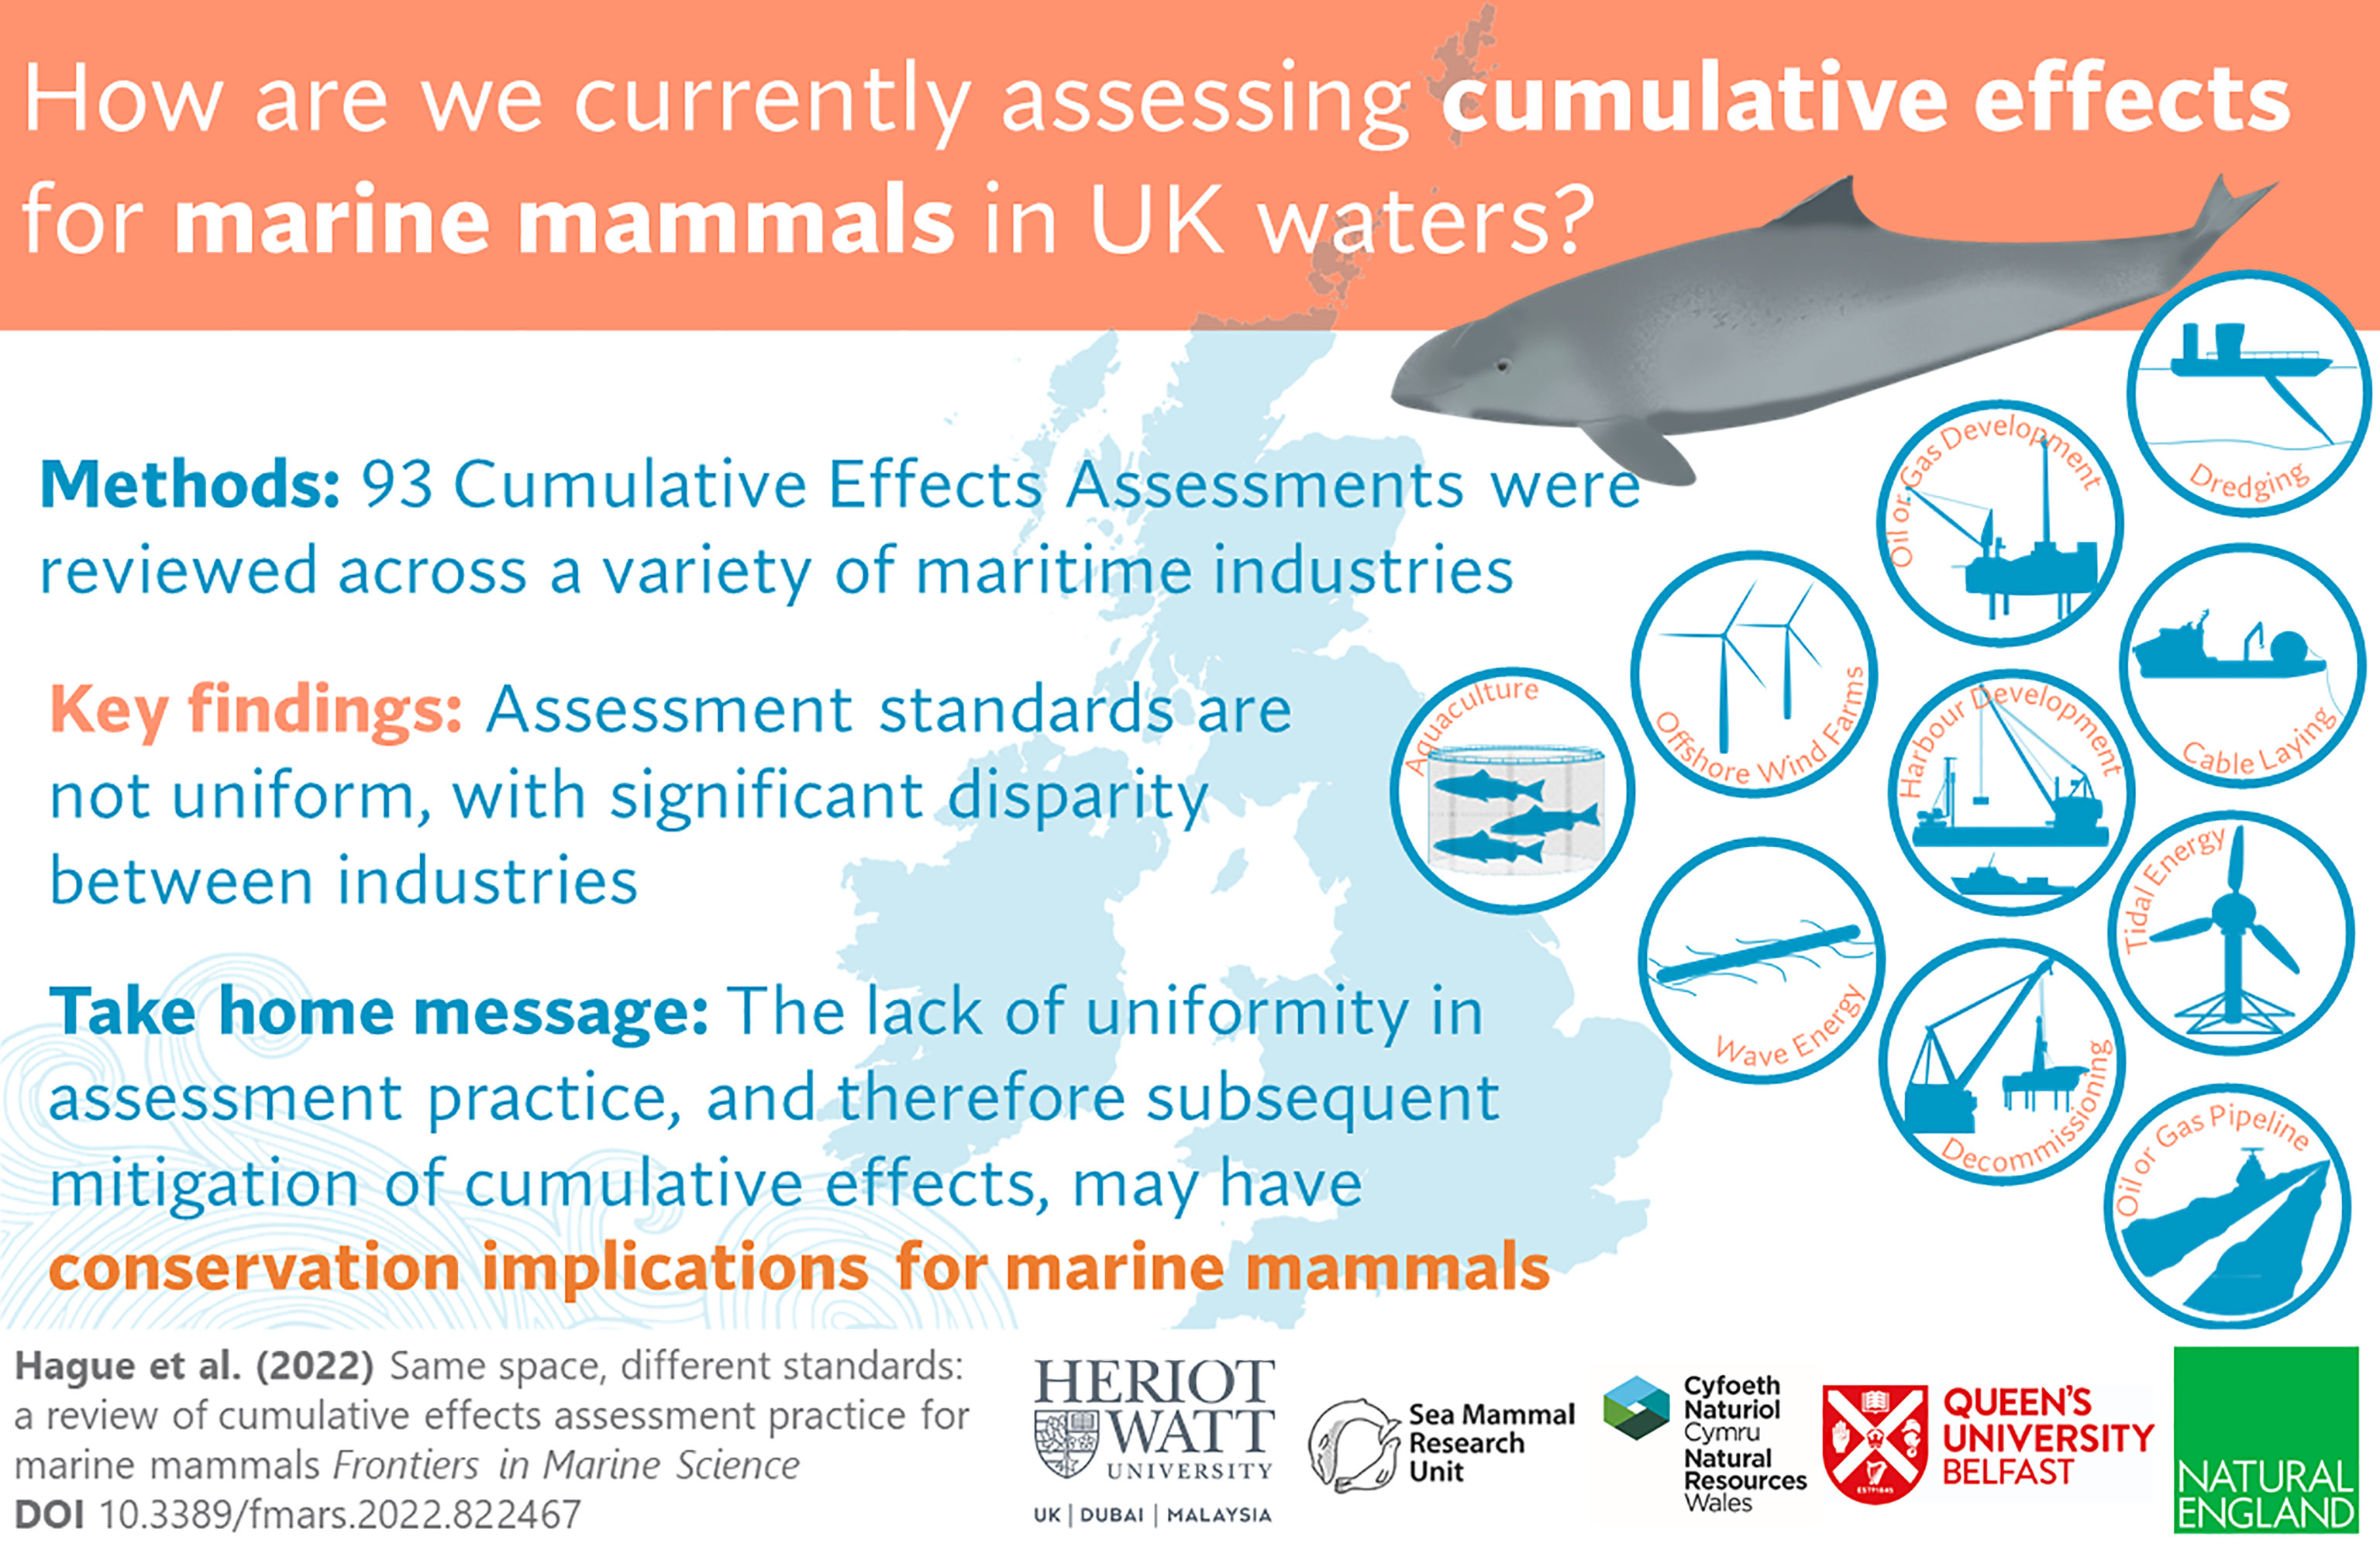
Graphical Abstract How are we currently assessing cumulative effects for marine mammals in UK waters? A graphical abstract for Hague et al. (2022).
1 Introduction
In a global survey of more than 2000 scientists, understanding the individual and interactive effects of cumulative stressors was the top ranked research priority out of a possible sixty-seven distinctive research questions, whilst developing approaches for monitoring cumulative effects was ranked the fourth highest priority (Rudd, 2014). The ongoing question of how to address the complexity of multiple stressors has even been described as one of the ‘holy grails’ of modern conservation (Simmonds, 2018).
Cumulative Effects Assessment (CEA) and Cumulative Impact Assessment (CIA) (hereafter collectively referred to as CEA) are examples of methodical procedures that attempt to address identify, predict and evaluate the significance of multiple effects, or impacts, from one or multiple activities on a specified receptor (Judd et al., 2015). The receptor considered could be a species (e.g. harbour porpoise), group of species (e.g. marine mammals) or habitat (e.g. benthic environment). These assessments are usually completed as part of an Environmental Impact Assessment (EIA), which is one of the main tools utilised by regulatory agencies to ensure that the environment, and the receptors it supports, are adequately protected (Hawkins et al., 2020). The assessments should identify the potential for stressors to individually and cumulatively have significant effects on a receptor, and if so, should make suggestions for appropriate mitigation in order to ultimately reduce or prevent impacts (Judd et al., 2015). In doing so, these assessments should ultimately make human activities more sustainable (Duinker et al., 2013). In this way, a CEA is regarded as having the potential to deliver the most meaningful component of the EIA, in terms of providing a more complete understanding of the overall consequences of the development or activity (Cooper and Sheate, 2002).
In the UK, completing an EIA and an associated CEA is mandatory for a number of specific project types and activities. Whilst the regulations pertaining to EIA vary by the industry that the project falls under (Figure 1), and in some instances by devolved administration (Scotland, Wales and Northern Island), the policy wording that outlines the information required to be included in an EIA, including for the consideration of cumulative effects, is identical across the regulations (for example, 123456). This states the requirement for; ‘a description of the likely significant effects of the project and the regulated activity on the environment resulting from … the cumulation of effects with other existing or approved projects, taking into account any existing environmental problems relating to areas of particular environmental importance likely to be affected; … and the descriptions of the likely significant effects on the factors … must cover the direct effects and any … cumulative … effects of the project and the regulated activity. This description must take into account the environmental protection objectives established at EU or at national level which are relevant to the project and the regulated activity.’
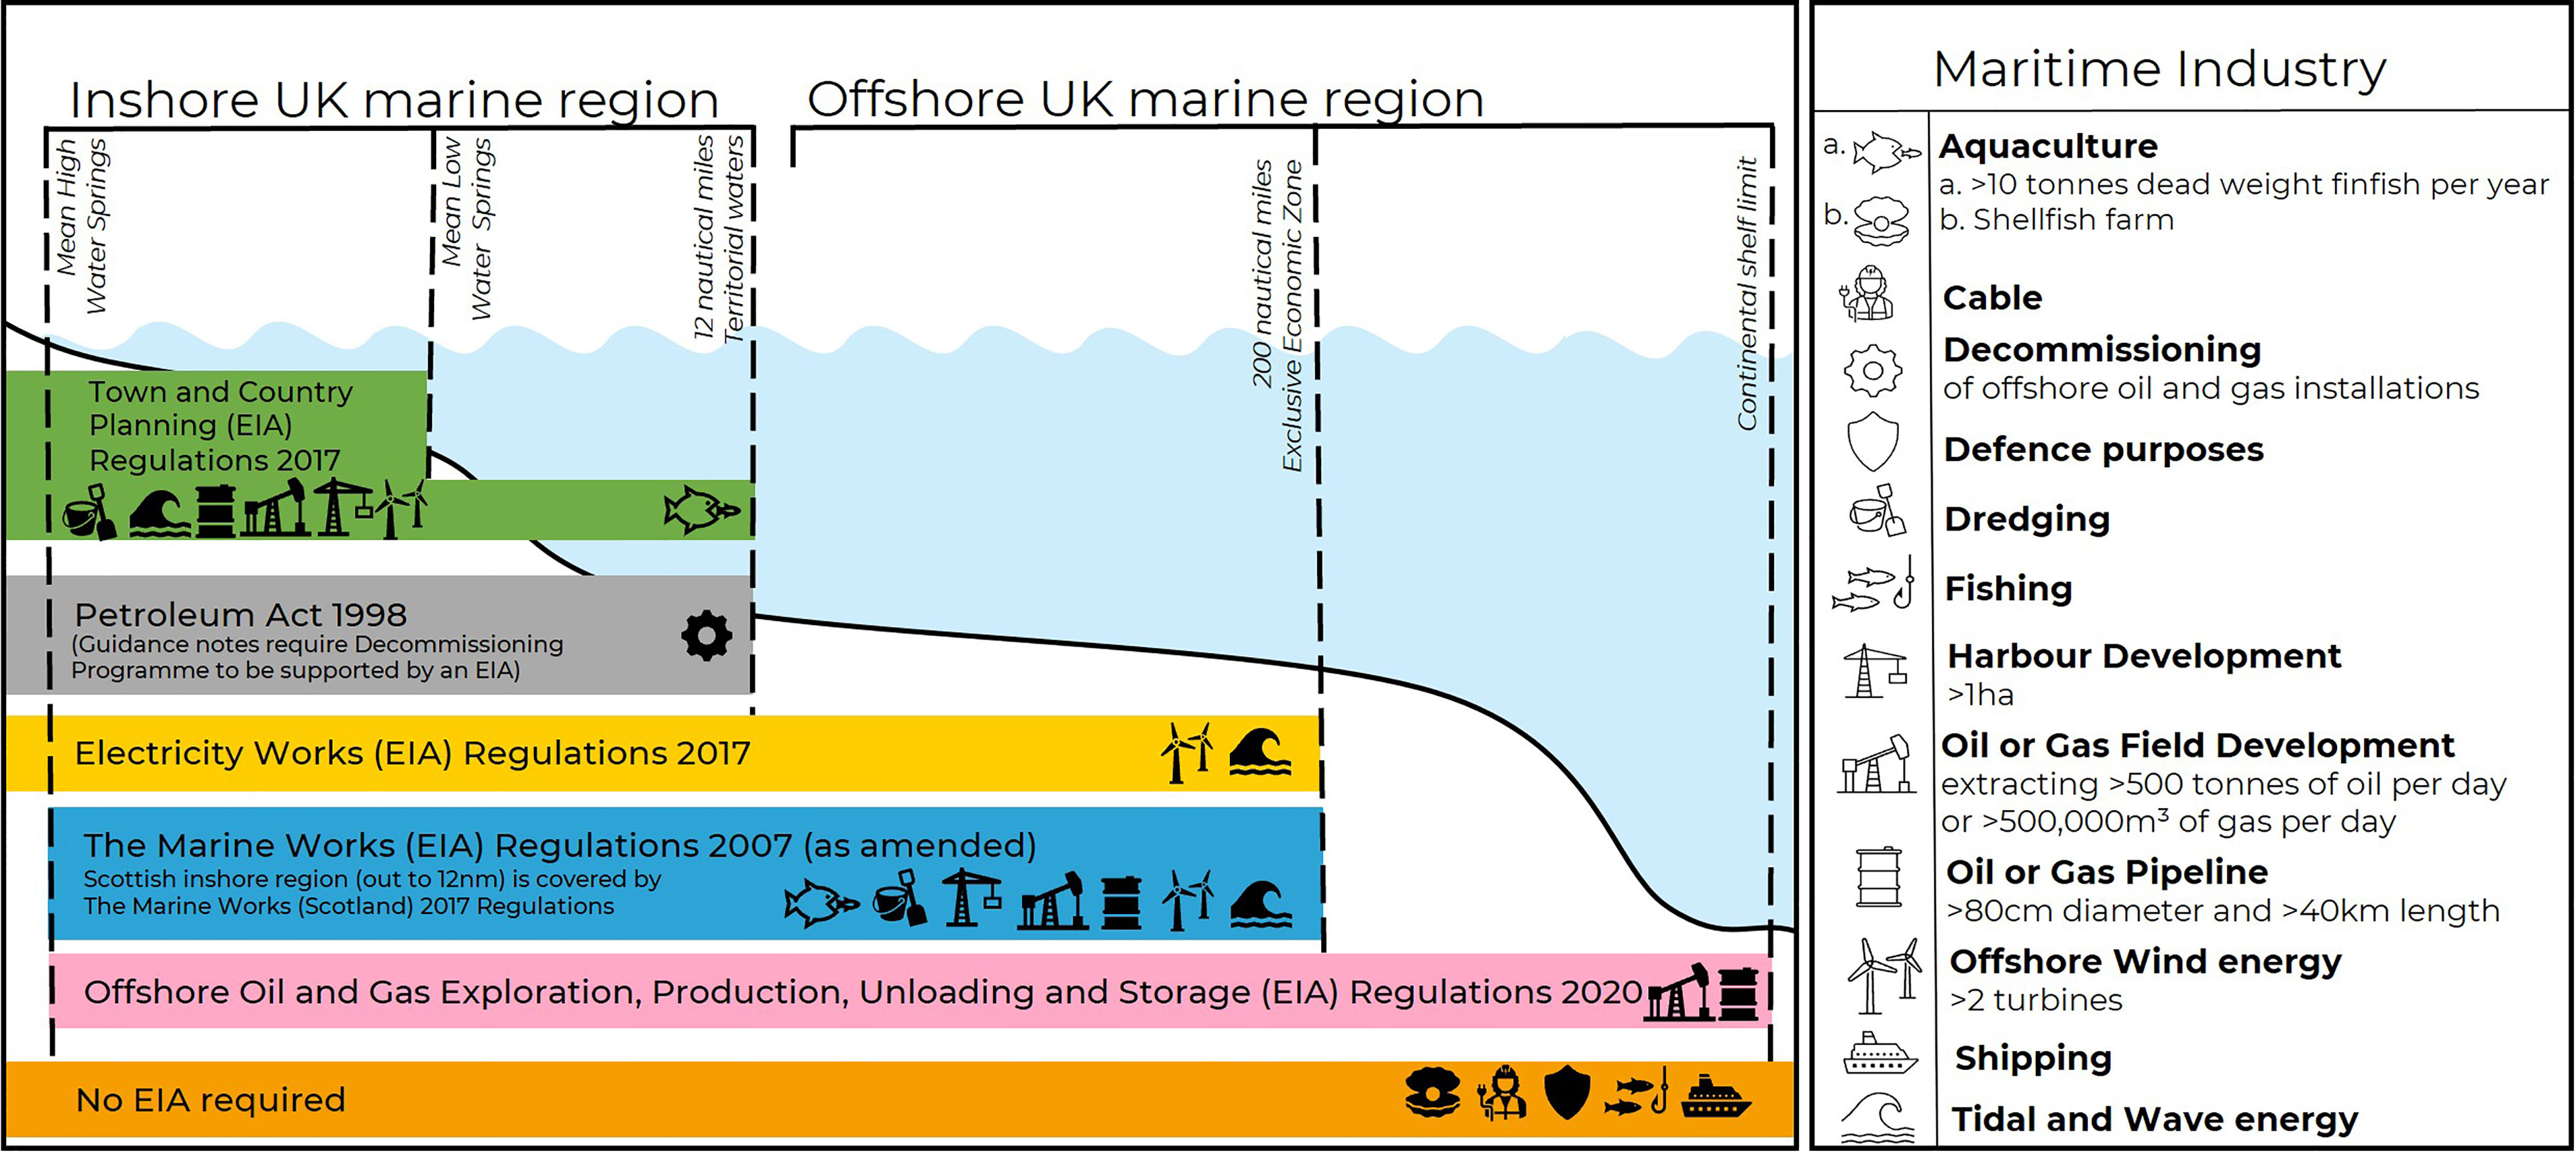
Figure 1 Legislative regimes pertaining to the requirement for an EIA, and associated CEA, for various maritime industries within UK waters. Note, there are nuances in regulatory regimes and EIA requirements across devolved UK nations which are not captured within this figure. Thresholds for requirement of an EIA are also nuanced, and may vary subject to screening, for example if the proposed project is in a ‘sensitive’ area. This figure is presented for high level illustrative purposes only. Adapted from MMO Marine Licencing (2020)7.
These requirements cover a number of different types of activity and projects. Some categories, known as Schedule A1 (or ‘1’) projects, always require completion of an EIA and associated CEA. Examples include projects that plan to extract over 500 tonnes per day of petroleum, or to construct an oil or gas pipeline that is over 40 km long and over 800 mm in diameter. A second category of project, Schedule A2 (or ‘2’), may first submit optional screening documents to the appropriate authority, giving brief details of plans and potential impacts. The authority will consider whether it seems likely that the size, nature or location of the project will mean it is likely to have significant environmental effects. If so, then an EIA and associated CEA will be required. Example of Schedule A2 projects include installation of a wind farm consisting of more than two turbines, or an intensive fish farm that intends to produce more than 10 tonnes of fish per year.
Whilst the policy requirements may be similar or identical across industries and their respective sectors, each sector is managed by a sector-specific regulator, which may also differ by administration, and in turn may also have a different body from which they seek advice, for example, a specific Statutory Nature Conservation Body (SNCB). Regulators can provide support, publish associated guidance to aid completion of EIAs and CEAs, and ultimately may steer the requirements and standards of such assessments. However, despite the regulations and regulatory support, CEAs are a long-recognised area of weakness within the EIA process (Burris and Canter, 1997; Cooper and Sheate, 2002; Gunn and Noble, 2011; Duinker et al., 2013; Judd et al., 2015; Willsteed et al., 2018; Durning and Broderick, 2019), with CEA practice recently described as ‘woefully deficient or simply absent’ (Sinclair et al., 2017). Whilst standards and practice of CEA may vary by practitioner experience, specific expertise, geography and role (Kågström, 2016; Foley et al., 2017), assessing potential impacts of multiple stressors is, in itself, an inherently difficult task. This is exacerbated, in most cases, by a limited understanding of how receptors respond to various stressors, and the associated thresholds for response. Whether or not some, or all, of this information is available dictates where on the spectrum of quantitative to qualitative a CEA can be, and how much expert judgement has been relied upon in the absence of empirical evidence. This ultimately may have implications on the associated confidence, uncertainty and reproducibility of the assessment. Furthermore, it is also largely unknown whether stressors interact in an additive manner, to be greater than the sum of their parts (synergistic) or in a diminishing manner to be less than the sum of their parts (antagonistic) (Cocklin et al., 1992; Crain et al., 2008). The approach has therefore often been to assess the impact of each stressor separately assuming either no interaction and/or that pressure-effect relationships are linear, which likely over- or under-estimates impacts (Judd et al., 2015), rather than considering multiple stressors together. However, in the context of the definition of CEA, it is evident that evaluating stressors separately does not constitute a true assessment of cumulative effects.
1.1 Marine Mammals and Multiple Stressors
Marine mammals are widespread in UK waters (Reid et al., 2003; Hammond et al., 2013; Hammond et al., 2017), with all species being vulnerable to acute and chronic anthropogenic disturbances (Avila et al., 2018). Stressors are often not experienced in isolation (either spatially or temporally), and instead an individual or group may be simultaneously exposed to a number of stressors, from one multi-stressor activity and/or from multiple activities occurring simultaneously or consecutively. Responses to disturbance can be reflected as temporary (Kyhn et al., 2015) or permanent avoidance (Morton and Symonds, 2002), changes in behaviour [e.g. reduction in foraging vocalisations (Pirotta et al., 2015a)], and in the longer term may result in a change in population size, fecundity or health (Pirotta et al., 2018). In more serious cases, the consequences of anthropogenic disturbance may be fatal (Fernández et al., 2005). The effects of experiencing multiple stressors at the same time, either acute or chronic, are largely unknown for marine mammals, mainly due to a paucity of data as marine mammals are inherently difficult to study (Simmonds, 2018).
Currently, few quantitative tools exist to assist practitioners in the assessment of potential impacts to marine mammals. Sparling et al. (2017) detail and evaluate the sensitivities and utility of common approaches to population level assessment. This review identified two principal approaches: rule-based methods and predictive population modelling. An example of a rule-based methods, is Potential Biological Removal (PBR), which calculates the number of deaths a population could sustain while ensuring the population size remains at or above the ‘optimal sustainable population size’ (e.g. Williams et al., 2016). Predictive models, attempt to quantify the magnitude of impacts on a population trajectory. Examples of predictive models specifically designed for marine mammals include the interim Population Consequences of Disturbance model (iPCoD) (King et al., 2015) and the harbour porpoise (Phocoena phocoena) specific Disturbance Effects on the Harbour Porpoise Population in the North Sea8 (DEPONS) model. iPCOD is based on a Leslie-matrix population model with the impacts explicitly modelled in terms of their effect on the population’s vital rates (fecundity and stage-specific survival). DEPONS is an individual- or agent-based model where the population consequences emerge from the results of simulations of the effects of the impact on the behaviour and energy balance of many individuals. Predictive models require a considerable amount of information, including population demographics, energetics parameters and estimates of disturbance response (e.g. the iPCOD model requires an estimate of the relationship between days of disturbance and individual survival and reproduction rates). This requirement has limited satisfactory parameterisation of such models for many marine mammal species (Harwood et al., 2016). However, predictive models have been parametrised with combinations of empirical information and knowledge acquired through expert elicitation processes and implemented for some of the species recorded within UK waters, including harbour porpoise (Nabe-Nielsen et al., 2018; Cervin et al., 2020), grey seal (Halichoerus grypus) (Silva et al., 2020), harbour seal (Phoca vitulina) (Thompson et al., 2013), bottlenose dolphin (Tursiops truncatus) (Pirotta et al., 2015b; Schwacke et al., 2017), minke whale (Balaenoptera acutorostrata) (Christiansen and Lusseau, 2015), long-finned pilot whale (Globicephala melas) (Hin et al., 2019), sperm whale (Physeter macrocephalus) (Farmer et al., 2018) and humpback whale (Megaptera novaeangliae) (Costa et al., 2016). For many other species data limitations preclude such assessments.
Marine mammals are highly protected under a range of international and national legislation, enabling protection at the individual, population, species and site level. Furthermore, the status of cetaceans and seals are key indicators used to assess progress towards achieving Good Environmental Status, as part of the UK Marine Strategy9. This strategy also outlines both the need to evaluate potential cumulative impacts of anthropogenic pressures on marine mammals, and to improve the overall evaluation process of cumulative impacts (HM Government, 2012; Government, 2019).
The aim of this study was to review the current state of practice for assessing cumulative effects on marine mammals within UK waters, comparing practice between 2009 – 2019 across eleven maritime industries.
Following a review of CEA practice, we highlight examples of best practice, as well as ongoing challenges and limitations of conducting a CEA. From this, we provide recommendations to improve future assessment practice broadly relevant to receptors beyond marine mammals, and to other geographic regions. We use marine mammals as the receptor of interest due to their high conservation value and degree of legal protection, their vulnerability to a variety of anthropogenic disturbances which occur in UK waters (Avila et al., 2018), the identified knowledge gap of the consequences of cumulative effects to marine mammals (Nelms et al., 2021) and the strong correlation between their distribution and areas of human impact (Pompa et al., 2011). The UK borders one of the busiest maritime areas worldwide, the North Sea, an area that is recognised as having many countries carrying out marine activities in the region, and therefore an area where cumulative effects are already a significant concern (Gușatu et al., 2021). It is therefore imperative to ensure such effects are being considered, managed and mitigated in a broader, holistic manner. CEA is mandatory for many, but not all, industries within UK waters (Figure 1), and therefore this work utilises current CEA practice to act as a knowledge provider for other marine industries and countries that are yet to adopt CEA as part of their sustainable management strategies.
2 Methods
2.1 Scope of the Review
We collated Environmental Impact Assessments (EIAs), Environmental Statements (ESs), Environmental Appraisals (EAs) (hereafter, collectively referred to as EIAs) and any associated documentation covering marine developments in UK waters, published between 2009 and 2019. We did not exclude any industries from the collation or review process, and instead attempted to find EIAs and associated CEAs for as many maritime industries as possible.
The devolved administrations hold and make available records of such documents in different ways. For England and Wales, the majority of these documents were available on the National Infrastructure Planning (NIP) website10, an online repository that holds applications for Nationally Significant Infrastructure Projects (NSIPs). However, five years after a project receives a decision from the Secretary of State, the associated documents are removed from the NIP website, and so the process to obtain these documents is more challenging. For EIAs within Scottish and Welsh waters, we used the Marine Scotland Information11 search engine and the Natural Resources Wales public register12, respectively. There appears to be no publicly available equivalent database for Northern Ireland, consequently obtaining the appropriate documents was more challenging, which is reflected in the number of CEAs reviewed from Northern Ireland. EIAs were also collated from developer websites, Tethys13, the Marine Management Organisation Marine Case Management System14, The Crown Estate’s Marine Data Exchange15 and the 4C Offshore Winds Database16.
Within the Department for Business, Energy & Industrial Strategy (BEIS)17, the Offshore Petroleum Regulator for Environment & Decommissioning (OPRED)18 make available recently submitted EIAs related to oil and gas field development on a dedicated webpage19, though after a short period of time the documents are removed and replaced by a 1-4 page document that summarises the reviewed EIA20. The latter summary documents were not sufficient for the purpose of this review, and so an online search was required to attempt to find the full EIA. Where an online search was not successful, the relevant authority (BEIS) was contacted to request missing documentation, who directed the author to contact individual oil and gas operators in the first instance, though individual requests were not feasible within the timeframe of the review.
Oil and gas field decommissioning EIAs were downloaded from OPRED21, which makes such EIAs accessible whilst the associated ‘Decommissioning Programme’ is under consideration. Once a decommissioning programme has been approved by OPRED, the EIA document is removed from the website, again making the process to obtain these documents more challenging.
Gaps in the repository were filled, where possible, by the authors’ own resources, by further online searches (using terms such as ‘Project Title + EIA’), or through direct requests to colleagues. Whilst every effort was made to build a comprehensive repository, we acknowledge that there are some EIAs that may be missing from this analysis. The search resulted in a total of 93 project EIAs and their associated CEAs, from eleven marine industries.
2.2 Critical Evaluation Criteria
To ensure each CEA could be compared quantitatively, we scored each CEA based on evaluation criteria developed and outlined in Table 2 of Willsteed et al. (2018). The criteria within the framework were developed following a review of legislative documents where the assessment of cumulative effects is explicitly or implicitly required, and a review of key cumulative effects and marine ecosystem management literature and theory [for further detail, refer to Willsteed et al. (2018)]. This framework separates four categories (Procedure, Space and Time, Pathways and Receptors and Cumulative Effects) into twenty-one attributes used for evaluation. We discounted the attributes that were not relevant for the purposes of our specific aim (reviewing the current state of practice for assessing cumulative effects on marine mammals), as these attributes related to the scoping process rather than the CEA itself (Attributes 6, 8, 12-15), or to effects in isolation (Attributes 6, 8), to the future condition of receptors (Attribute 16), or to the assessment of cumulative effects on ecological connectivity overall (Attribute 19). This resulted in final grading of the 13 remaining attributes (Supplementary Materials; Table 1). Attributes were scored on a linear scoring system, where the minimum score awarded was 1 (very weak), and thus the lowest a CEA could score was 13. The highest an attribute could be graded was 4 (very strong), and thus the highest a CEA could score was 52. The primary reviewer (lead author) assessed all CEAs (n = 93). To ensure scoring bias was negligible, 36 CEAs were reviewed by at least one additional reviewer (a co-author). All reviewers are experienced in writing and/or reviewing EIAs and associated documents, and are professionals associated with policy and/or marine mammal science. No reviewers scored CEAs where there was any potential conflict of interest (e.g. reviewer had been involved in writing or providing advice to the regulator). To ensure a baseline understanding of the Willsteed et al. (2018) framework, all reviewers discussed how each attribute should be interpreted and this helped ensure continuity when implementing scoring criteria. The average difference between the primary and secondary reviewers total score was 3.8 (SD = 3.7, IQR = 4.4), with no bias towards higher or lower scoring by the primary reviewer identified (the secondary reviewers total score was higher for 53.3% of reviewed CEAs, whereas the primary reviewer scored higher or the same as the secondary reviewers on 44.4% and 2.2% of occasions, respectively). Therefore, we are satisfied that the CEAs that were not double reviewed will also be representative and any scoring bias will be negligible. Where a CEA had been scored by more than one reviewer, the average of the scores was taken forward for the final analysis.
Alongside scoring each CEA according to the Willsteed et al. (2018) framework, reviewers also collected information from each CEA which would further the understanding of the state of assessment practice, including the age of the CEA, data sources used, guidelines followed and assessment methodology.
2.3 Statistical Analysis
A Kruskal-Wallis Test was used to check for differences in quality scores between industries. This non-parametric test was selected as the total scores were not normally distributed (Shapiro-Wilk test; W = 0.92, p <0.005), with variance not equal across industry groups (Levene’s test; F (10, 82) = 2.73, p = 0.005).
To check for changes in score over the ten-year study period, we used a multiple linear regression model, where the ‘total CEA score’ was the response variable and ‘Year’ and ‘Industry’ were the predictor variables. The total scores were log-transformed, as the scores were non-parametric with a moderately right skew (skewness score: 0.53). The transformation improved the skewness of the total score data (skewness score: 0.08), and the linear model then fitted the assumption of homoscedasticity, and the residuals were normally distributed. As n=1 for two of the industries (dredging and oil or gas pipeline), their respective data were excluded from the multiple linear regression analysis, as it would not be possible to document trends based on only one data point. For all other industries, n ≥5.
Analysis was undertaken in R (R Core Team, 2020), using packages ‘moments’ (Komsta and Novomestky, 2015), ‘rstatix’ (Kassambara, 2021), and figures were created using packages ‘ggplot2’ (Wickham, 2016) and ‘tidyverse’ (Wickham et al., 2019).
3 Results
We reviewed 93 marine mammal CEAs, completed between 2009 and 2019, covering 11 maritime industries [aquaculture (n = 7), cable (n = 9), oil and gas decommissioning (n = 10), dredging (n = 1), harbour development (n = 8), oil or gas field development (n = 10), oil or gas pipeline (n = 1), offshore wind farm (OWF) large (≥ 20 turbines, n = 22), OWF - small (≤ 19 turbines, n = 9), tidal (n = 11), wave (n = 5)]. For clarity, the total score each CEA received from the grading of the thirteen Willsteed et al. (2018) attributes is simply referred to as the ‘score’. CEAs scoring between 13 and 22.5 were categorised as ‘very weak’, 23-32.5 ‘weak’, 33-42.5, ‘strong’ and 43-52 ‘very strong’ (Supplementary Materials; Table 1).
The results of the review are separated into four parts: Overall Score, Assessment Procedure, Spatial and Temporal Scale, and Cumulative Effects. The latter three correspond with the three attribute categories of the Willsteed et al. (2018) evaluative framework.
3.1 Overall Score
The average CEA score across the 93 CEAs was ‘weak’ (average = 24.9; range = 13 - 48) (Table 1). Overall, 75% (n = 70) of the individual CEAs were ‘weak’ or ‘very weak’, whilst only 4% (n = 4) were ‘very strong’, all of which were large OWF CEAs.
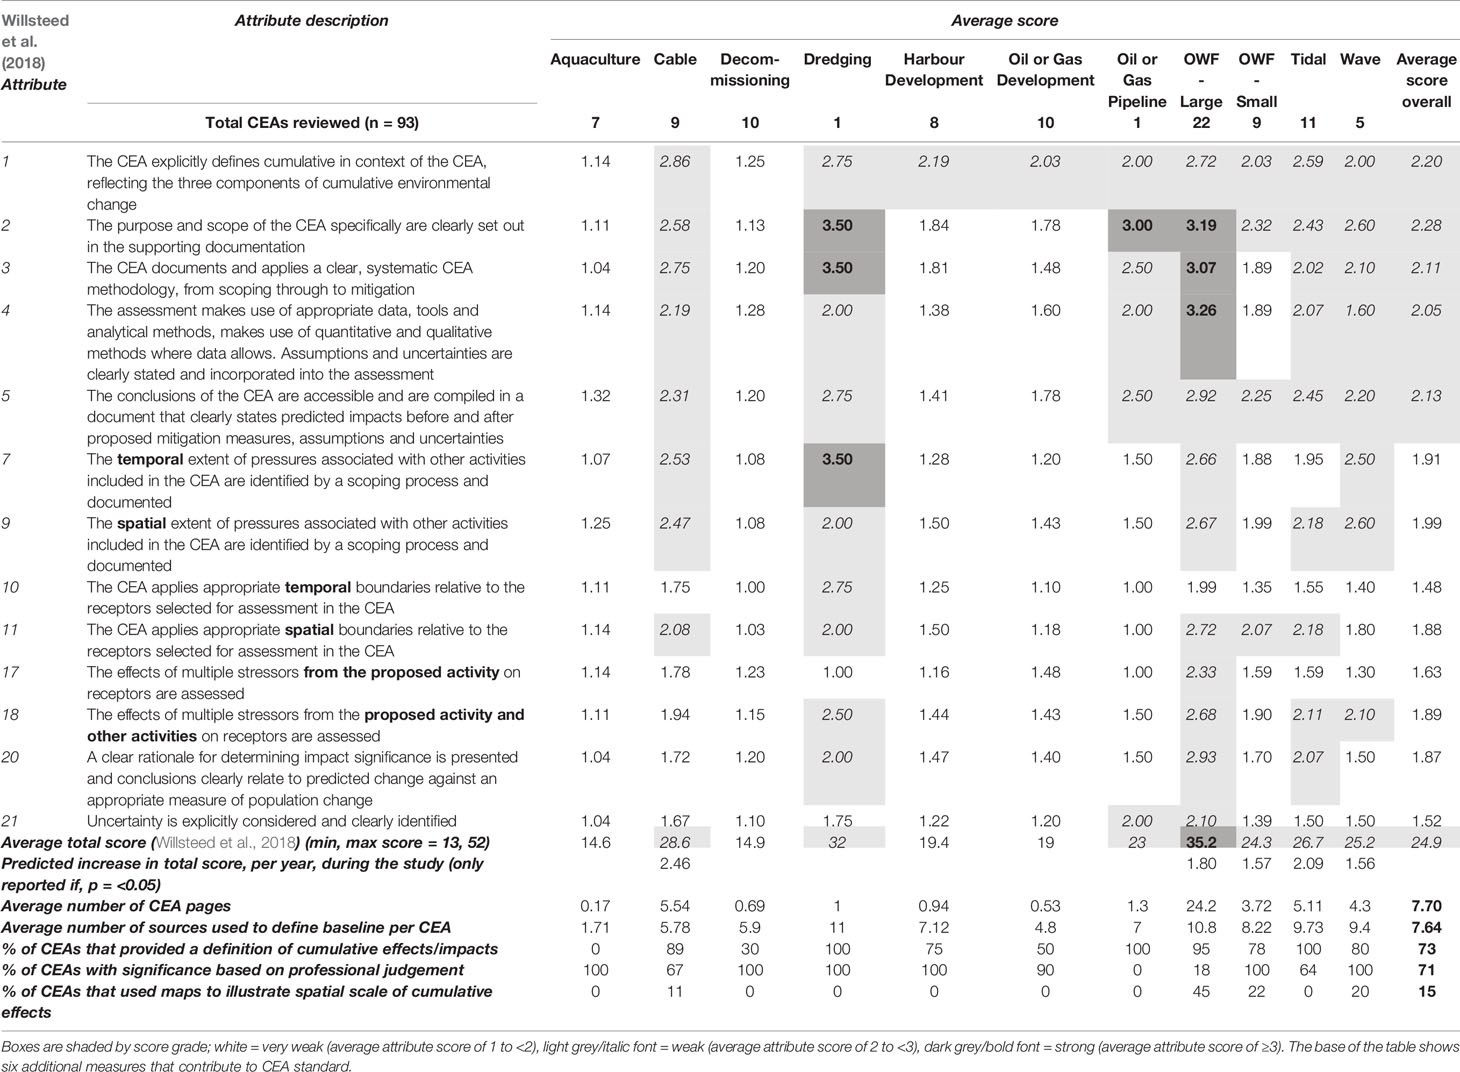
Table 1 Average score for the thirteen attributes used to grade each Cumulative Effects Assessment (CEA), by industry (from Willsteed et al., 2018).
3.1.1 Variation by Maritime Industry
Score varied significantly by industry (Kruskal-Wallis test: χ2 (10) = 54.4, p = <0.005, n = 93) (Figure 2; Table 1). The effect size was very large (as indexed by eta2[H] = 0.54), indicating 54% of the variance in score was explained by which industry the CEA was attributed to. On average, the aquaculture industry produced the lowest scoring CEAs (mean = 14.6; range = 13 - 18.75; n = 7), whilst large OWF produced on average the highest scoring CEAs (mean = 35.2; range = 17 - 48; n = 22) (Figure 2 and Table 1).
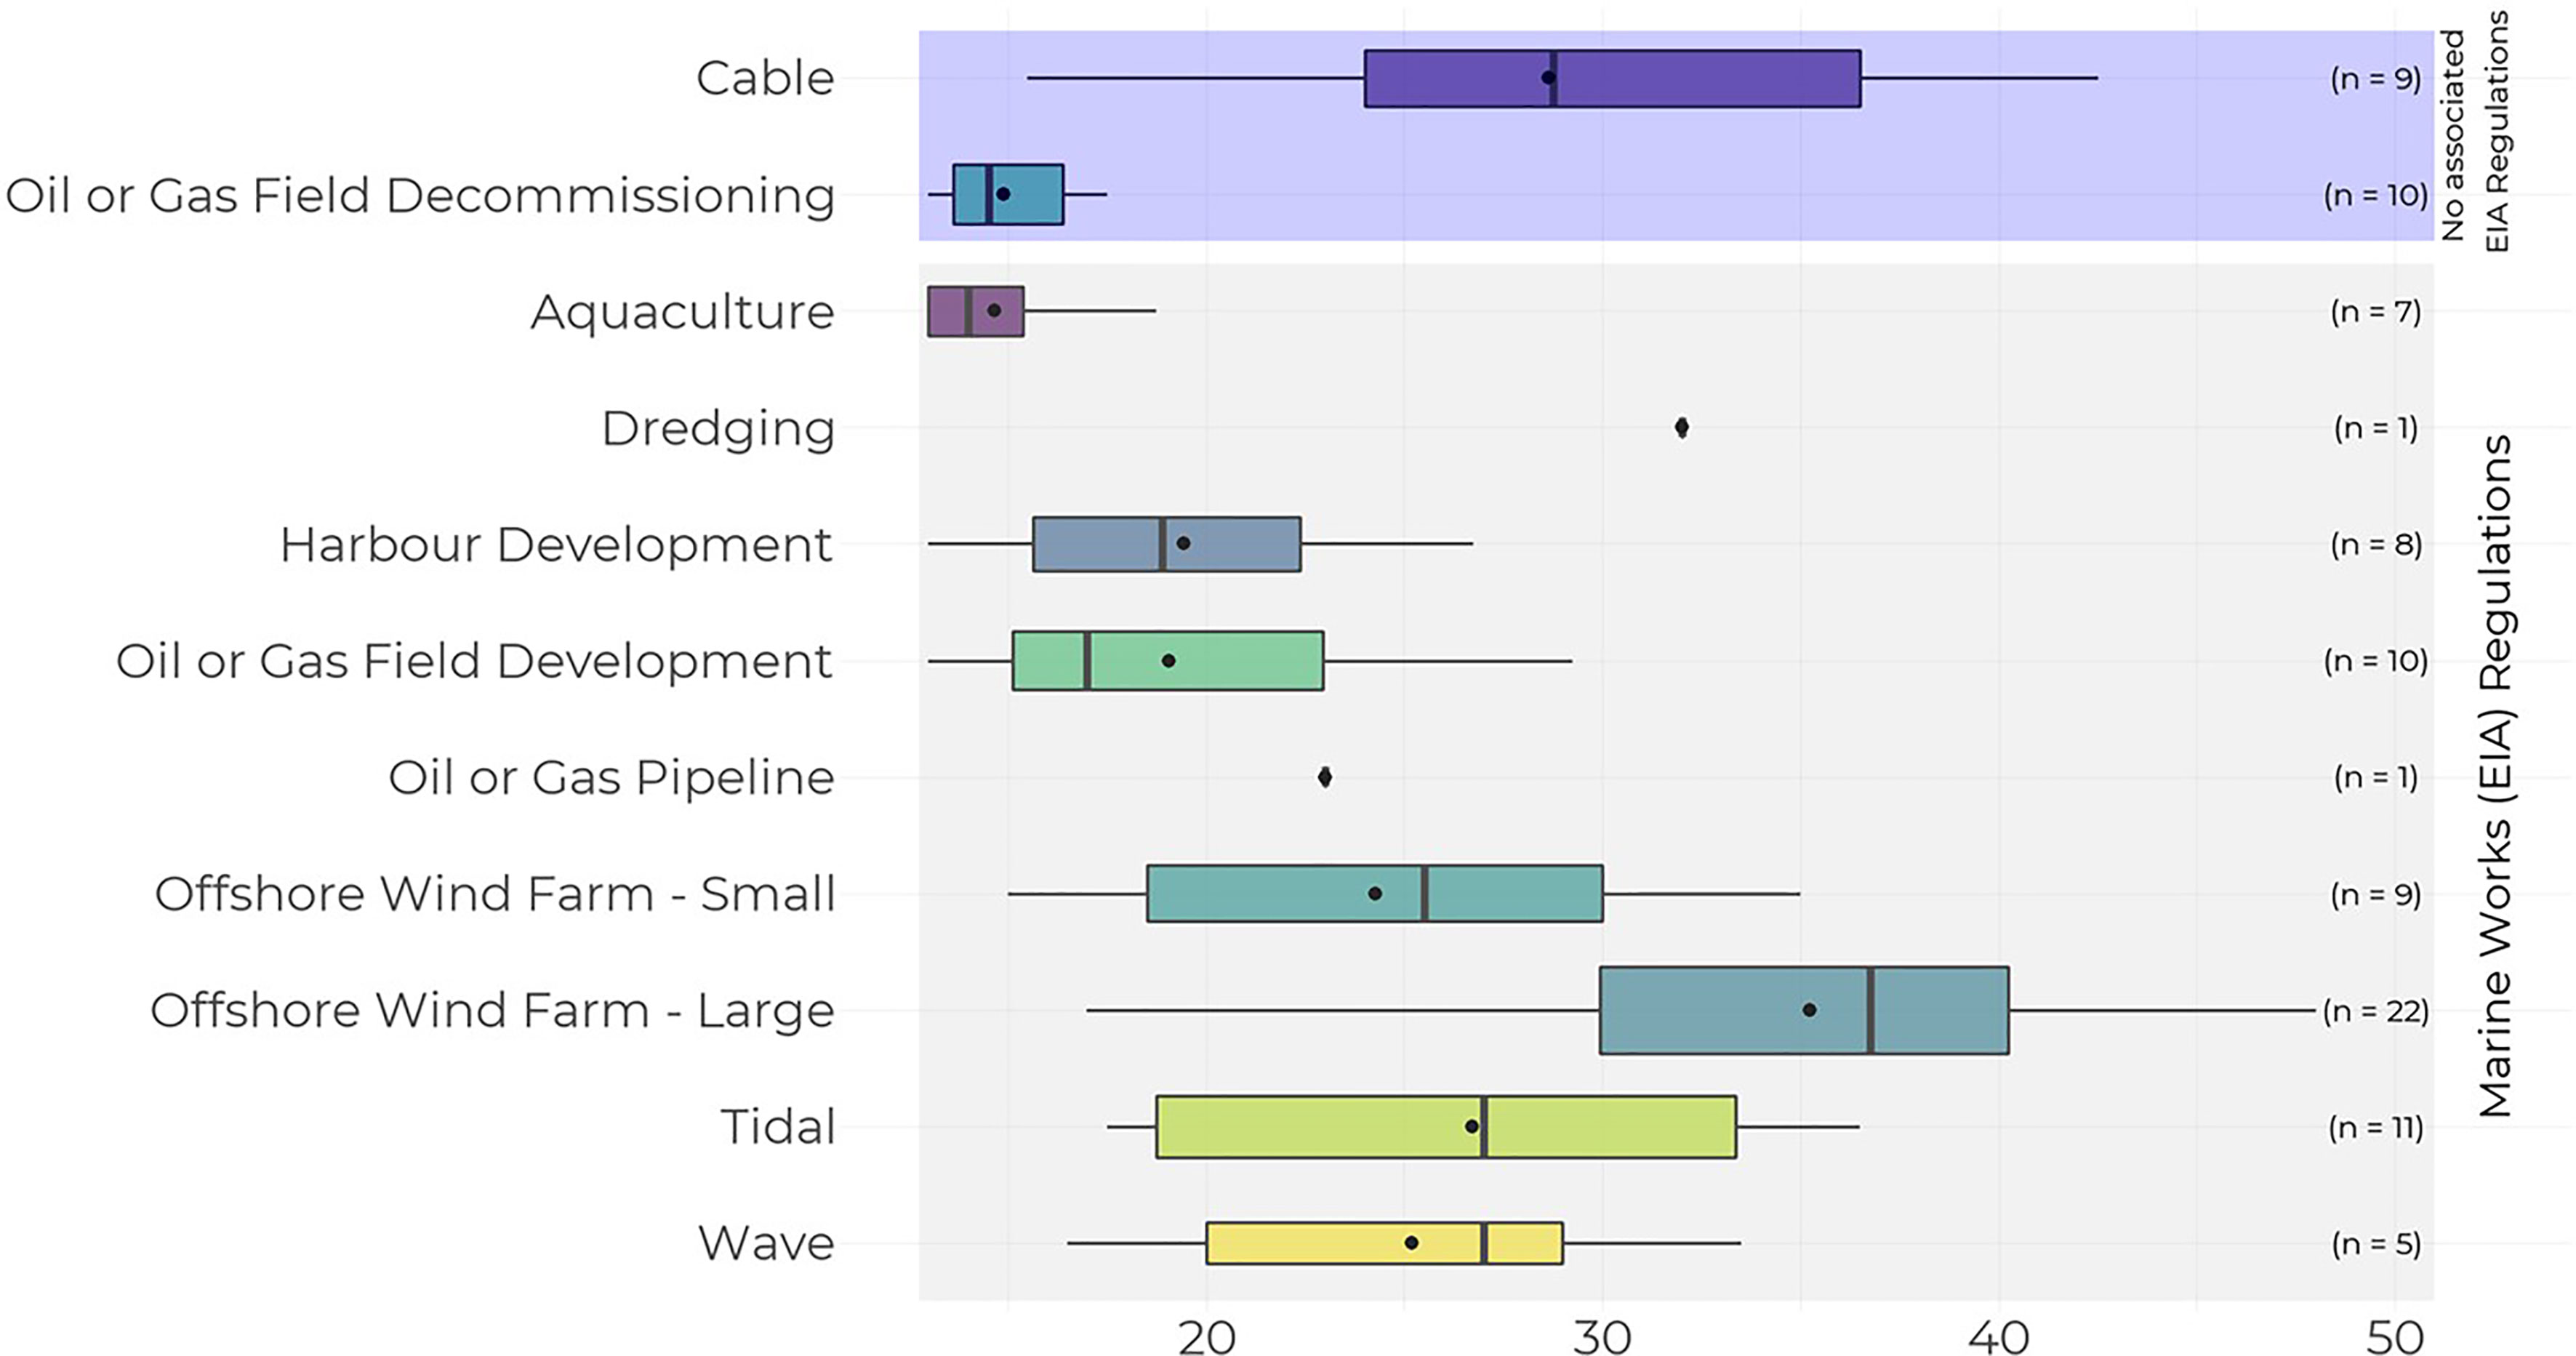
Figure 2 Mean and median scores of marine mammal Cumulative Effects Assessments (CEAs) across maritime industries. Industries are grouped based on the regulations associated with the required EIA and CEA (for more detail, see Figure 1). The industries that fall under the Marine Works (EIA) Regulations 2017 commonly also fall under the remit of other EIA Regulations, though the policy wording via other regulations is identical, hence only presenting the Marine Works (EIA) Regulations here for clarity. The boxplot shows the median (line through box), mean (dot), and lower and upper hinges (first and third quartile). Widths of boxes are proportional to the square-roots of the number of observations (CEAs reviewed) in the groups.
The higher the ranking of the CEA, the higher the average number of pages the assessment (Table 1) (F-value (1,92) = 89.66, r2 = 0.48, p=<0.005). Furthermore, the average number of pages of each CEA varied by industry (Table 1); large OWFs had on average the lengthiest CEAs (mean = 24.2 pages; range = 0.5 - 53), whilst aquaculture CEAs were on average the shortest (mean = 0.17 pages; range = 0 - 0.5).
3.1.2 CEA Scores Over Time
Overall, CEA scores improved significantly over time (F (9, 81) = 26.12, residual s.e. = 0.09, adjusted r2 = 0.71, df = 81, p = <0.005). The best model to explain this change included industry as an explanatory variable, which found that for five industries, scores significantly improved over the study period. For cable, large and small OWF, tidal and wave industries, CEA total scores increased per year by 2.46, 1.80, 1.57, 2.09 and 1.56 points, respectively, over the study period (all p = <0.005) (Table 1 and Figure 3). The scores of CEAs from four industries did not significantly change over time (aquaculture, decommissioning, harbour development, oil or gas field development: all p = >0.05). Two industries (dredging and oil or gas pipeline) could not be assessed for change in score over time, as n=1.
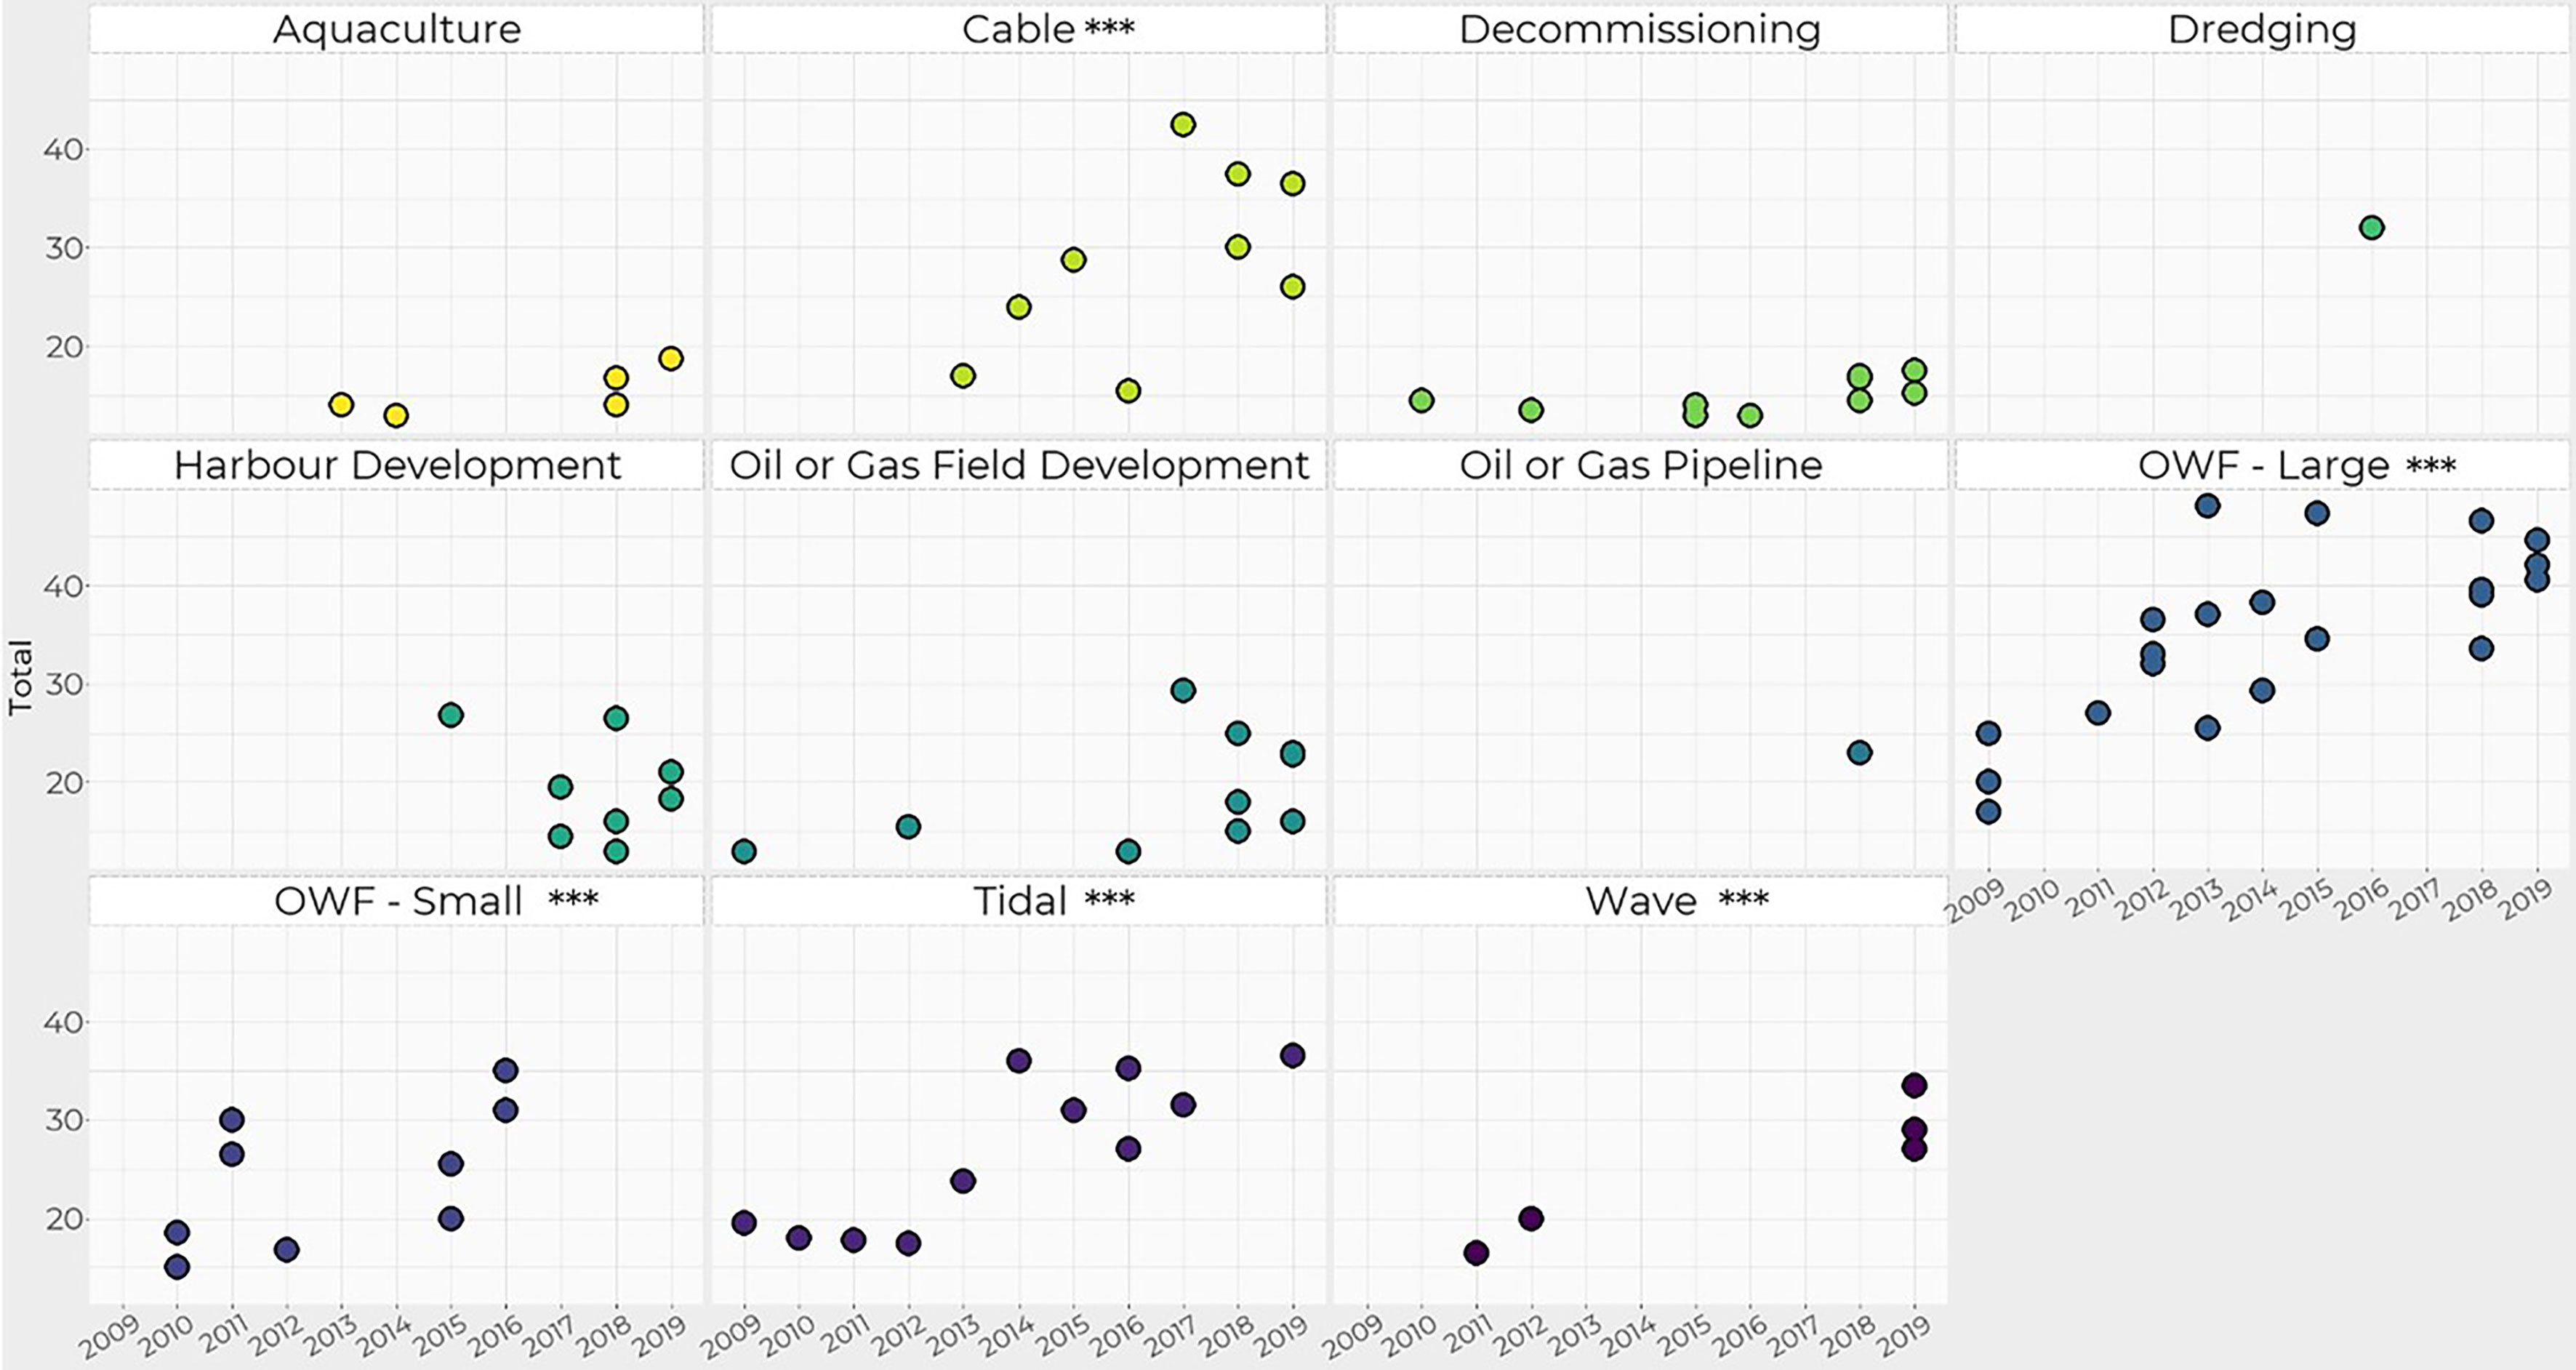
Figure 3 Total score of each Cumulative Effects Assessment (CEA) over the 10-year study period, by maritime industry. Asterisks*** next to industry name are displayed where change over time was significant, indicated by a multiple linear regression model, where p = <0.05.
3.2 Assessment Procedure
3.2.1 Definition, Methodology and Guidelines
Definition 26% (n = 24) of the CEAs provided no definition for cumulative impacts or effects, a further 9% (n = 8) only provided vague definitions. The most frequently used or para-phrased definition was provided via the European Commission guidelines (Hyder, 1999); “Cumulative impacts are impacts that result from incremental changes caused by other past, present or reasonably foreseeable actions together with the project”, which was presented in 41% (n = 38) of CEAs that did provide a definition.
Methodology Setting out the purpose and scope of the CEA was on average the highest scoring attribute out of all the thirteen Willsteed et al. (2018) attributes that were assessed, with three industries (dredging, oil or gas pipeline and large OWF) all scoring ‘strongly’ (indicated by the scoring of Att. 2).
Guidelines 70% (n = 65) of the CEAs referenced some type of guidelines or documentation to guide the CEA process, with the Chartered Institute of Ecology and Environmental Management (CIEEM, previously IEEM) and the Institute of Environmental Management and Assessment (IEMA) guidelines referenced 47 and 29 times, respectively.
3.2.2 Sources for Baseline Characterisation
Marine mammal baseline data The average number of sources provided to characterise the baseline environment (i.e. marine mammal presence, abundance and distribution) for the CEA was 7.64, with dredging, large OWF and tidal CEAs on average citing the highest number of sources (11.0, 10.8, 9.73 sources, respectively). In contrast, CEAs from the aquaculture industry provided on average only 1.71 sources. ‘Very strong’ and ‘strong’ CEAs provided on average ≥11.7 sources of baseline information, whilst ‘very weak’ CEAs provided on average 5 sources, and so the overall CEA score did appear to be reflective of the number of sources used to characterise the baseline environment. 3% (n= 3) of CEAs cited zero sources and did not provide any information on what their assessment considered as a baseline.
3.2.3 Effects Considered
Construction activity noise was the most frequently included type of stressor within the assessed CEAs (45%; n = 42), followed by vessel noise (29%; n=27). Often, there was an initial qualitative discussion with regards to the likelihood of occurrence of a number of potential sources of disturbance, and subsequent justification as to which impacts were taken forward into a more formal cumulative assessment. In this way, of the 426 times that potential sources of disturbance were considered in the 93 CEAs, they were scoped out of further assessment on 213 occasions (50%), whilst 213 were formally assessed in some way. Further assessment then consisted of either qualitative discussion, a quantitative analysis, or a mixture of both approaches (see 3.4.6 Quantitative vs. Qualitative). Potential sources of disturbance may have been scoped out of inclusion in the CEA due to, for example, potential effects being deemed insignificant when experienced in isolation, or, lack of data or knowledge precluding assessment.
3.3 Spatial and Temporal Scale
Spatial scale The two Willsteed et al. (2018) attributes that directly considered the spatial scale of the CEA both scored ‘very weak’ (Att. 9: mean = 1.99; Att. 11: mean = 1.88) (Table 1). 43% (n = 40) of CEAs did not explicitly state the spatial scale of the assessment. 14% (n = 13) of CEAs based their spatial boundary of pressures on a threshold relevant to the marine mammal(s) included in the assessment, using a defined boundary such as the reference population or management unit (MU) extent (e.g. 13 CEAs used the IAMMWG (2015) MU boundaries). Alternatively, 13% (n = 12) of CEAs defined the spatial scale of the assessment based on a set distance from the project itself, ranging from 0.5 km to 100 km.
15% (n=14) of CEAs presented a map to demonstrate the spatial scale of the project and to put into context the location of the proposed activity in relation to other projects or developments, and/or marine mammal distribution.
Temporal scale The two Willsteed et al. (2018) attributes that directly considered the temporal scale of the CEA on average both scored ‘very weak’ (Att. 7: mean = 1.91; Att. 10: mean = 1.48) (Table 1). 63% (n = 59) of CEAs did not explicitly state the temporal scale of the CEA. 20% (n = 19) used the duration of the project as the temporal scale for the CEA, some also with the addition of a number of years post-project. Three CEAs used a defined scale of 5, 6 or 7 years in advance, whilst 5% (n = 5) of CEAs used the ‘reasonably foreseeable future’ as a temporal scale.
3.4 Assessment of Cumulative Effects
The conclusions of 25% (n = 23) of CEAs were accessible and compiled clearly, with supporting assumptions partially or fully addressed (indicated by scoring ≥3 for Att. 5). In contrast, 75% (n = 70) of CEAs had conclusions which were scattered, difficult to access, with the conclusions unclear (indicated by a score of ≤2.9 for Att. 5).
Uncertainty Att. 21 considered whether ‘uncertainty is explicitly considered and clearly identified’, and on average scored ‘very weak’ (mean = 1.5). For 68% (n = 63) of CEAs, uncertainty was not explicitly considered (indicated by a score of ≤1.9 for Att. 21), and for a further 27% (n = 25) uncertainty was referenced in the methodology without being defined or formally considered within the assessment itself (indicated by a score of >2 but ≤2.9 for Att. 21). Only five CEAs clearly considered uncertainty within the assessment (scored ≥3 for Att. 21), all were from large OWFs.
3.4.1 Considered Effects of Multiple Stressors
85% (n = 79) of CEAs considered only like-for-like stressors together (i.e. construction noise together with vessel noise, rather than construction noise together with vessel collision risk). 49% (n = 46) of CEAs did not consider the effects of their activity combined with other activities (indicated by score of <2 for Att. 18) (Table 1). No CEAs for aquaculture, oil or gas pipeline and decommissioning industries considered multiple stressors of their activity combined with other activities. Of the 51% (n = 47) of CEAs that did consider the effects of multiple stressors from the project in question and other activities, 14 of those provided a clear rationale for selection of stressors with reference to marine mammals.
Interactions 16% (n = 15) of CEAs discussed the potential for multiple impacts to interact (i.e. additive, synergistic, multiplicative, compensatory or antagonistic), however this was not formally assessed within any CEA.
3.4.2 Quantitative vs. Qualitative
The method to determine impact significance was qualitative, based solely on professional judgement, for 71% of CEAs (n = 66). Only 6% (n = 6) of CEAs determined impact significance based on wholly quantitative methods, all these were from large OWFs. 23% (n = 21) used a combination, using quantitative analysis where feasible, supported by professional judgement where quantification was not possible. 100% of CEAs from aquaculture, decommissioning, dredging, harbour development, small OWF and wave were solely qualitative (Table 1). All CEAs that were categorised as ‘very weak’ were qualitative assessments. Only four of the 93 CEAs (4%) scored a ‘very strong’ overall score, and of these, one used solely quantitative methods, whilst three used a combination of qualitative and quantitative methods.
77% (n = 72) of CEAs used no quantitative model to predict the magnitude of effects. 21% (n = 20) of CEAs modelled cumulative exposure to underwater noise, most frequently using either the INSPIRE ‘fleeing animal’22
4 Discussion
In the UK, CEA has been a required part of EIA practice for a number of decades, with current understanding and ability to assess cumulative impacts evolving substantially since assessment practice began to gain traction in the 1970s (Hodgson and Halpern, 2018). However, this review found differences in approach and varying standards of CEAs between industries and over time (2009-2019), according to the adopted scoring metrics. Before providing a thorough discussion of these findings, it is important to highlight the inherently difficult nature of completing a CEA. In some cases, the challenges are industry specific (e.g. more/less data for impacts relevant only to certain industries), whilst other challenges are reflected across industries, receptors and CEA practice (e.g. lack of knowledge on how stressors interact). It is therefore important to bear such challenges in mind when considering the findings of this review.
A caveat that we were not able to properly account for, but should be considered when interpreting the results, is that the level of detail required by the regulator for a CEA is usually proportionate to the size of the project (Lonsdale et al., 2017). For example, smaller scale projects may require less thorough CEAs. In some cases this could be due to smaller predicted impact footprints, or more localised activities (e.g. harbour maintenance and development), meaning, proportionate to the predicted risk, the regulator may only require a qualitative CEA, for example. This proportionality may be reflected in a lower score, according to our scoring criteria, though the CEA may in fact have fulfilled the regulatory requirements. We were only able to account for this, in part, for the OWF industry through categorisation of ‘small’ versus ‘large’ offshore wind farms. Comparatively, CEAs from smaller OWFs did score less than larger OWFs, on average, and were also shorter in terms of number of pages (Table 1). The review also found higher ranking CEAs had on average a higher number of pages. Previous work has struggled to confirm a clear relationship between project spatial scale and EIA length (Fernández et al., 2018), though Bond et al. (2014) found good practice had been eroded through recent streamlining of impact assessments themselves.
Further limitations to the review process itself are discussed in Section 4.2.
4.1 Variation in Cumulative Effects Assessment
4.1.1 Between Industries
To our knowledge, this review provides the first comparison of CEAs across industries, and has highlighted a lack of standardisation within UK practice when assessing potential cumulative effects to marine mammals. The legislative wording with regards to the requirements for an EIA and associated CEA is identical or extremely similar for all but two (cable and decommissioning) of the eleven industries considered in this review (refer to Section 1 and Figure 1 for an overview of the associated legislative regimes), yet there is a considerable variation in average CEA score between industries. The renewables industry (OWF, tidal and wave energy) scored the highest, whilst CEAs from the aquaculture, decommissioning, oil or gas field development, and harbour development industries scored lowest. The disparity in scoring across industries may to some degree be explained by differing interpretations of this legislation by regulators and practitioners, with similar disparities in interpretation and understanding reported within Swedish cumulative effects practice (Wärnbäck and Hilding-Rydevik, 2009). In the UK, the regulatory bodies who are responsible for the implementation of the associated legal requirements differ across industries and administrations. As such, the application of the legislation, including the production of associated guidance and support to improve practice, may also vary between regulators. To ensure the interpretation and application of the legislation is uniform across industries, we recommend that regulators should publish guidance, in conjunction with SNCBs, to support the production of CEAs in the marine environment, which should be applicable and adaptable to support the assessment process across relevant industries. The guidance should be designed to achieve the legislative requirements, whilst being adaptable enough to allow practice to evolve with new knowledge and best available science, and should aim to achieve effective cross-industry cumulative assessment.
The siloed approach between industries to the regulation and completion of these assessments has no doubt meant that industries have missed opportunities to share best practice and lessons learned. It is important to note that additional to the lack of synergy between industries, there are long standing disparities in the interpretation and approach to cumulative effects between scientists and practitioners (Hodgson et al., 2019). For example, scientific evaluations more commonly focus on the effects of environmental pressures on species or ecosystems and track this back to human activities, whilst policy-based CEA interpretation considers the effects of activities, projects or plans (Judd et al., 2015; Hodgson and Halpern, 2018). This disparity in interpretation may have led to incompatibility in emerging methodologies (Judd et al., 2015), with latest scientific evidence or tools not necessarily suitable to support practical CEA requirements or aid improvement of practice. The formation of a collective cumulative effects community across science, policy and practice could work to address the disjuncture identified across these fields, fostering an improved and more holistic understanding for all. Hodgson et al. (2019) suggest cumulative effects research be formalised as a subdiscipline, with the development of a community of practice, active conversations and support opportunities such as workshops and conferences. Such synergies could provide an ideal platform for innovative and applied research questions to be addressed, with research led by practitioner requirements. Examples of the success of this approach are evidenced by the development of tools such as iPCoD (King et al., 2015).
To accompany and support a more standardised approach across industries, the development of a systematic database used as a source and archive for CEA associated guidance, data, evidence and good practice would be highly beneficial (Clarke Murray et al., 2014; Foley et al., 2017; Dibo et al., 2018; Durning and Broderick, 2019; Hodgson et al., 2019; Caine, 2020). This would provide a standard platform of activities and their associated effects to be recorded, and when required, incorporated within baseline characterisations and CEAs, encouraging a more collaborative overall ‘CEA mindset’ (Sinclair et al., 2017; Gușatu et al., 2021). This would likely be more cost effective than the current disjointed approach, where data are not readily shared due to being commercially sensitive and expensive to collect (Connelly, 2011). Further, sharing of data with subsequent dissemination of long-term pre-, during- and post-construction monitoring data would allow industries to learn from past developments and improve the collective knowledge of the true cumulative effects and consequent impacts of consented projects (Masden et al., 2010; Hawkins et al., 2017; Dibo et al., 2018; Caine, 2020).
Parallel to industry-level support through a cumulative effects community, it is important that cumulative effects are also addressed over the broader scale. The adoption of a more ‘integrated ocean management’ approach could provide a wider holistic solution to the currently fragmented approaches between industries and administrations (for a further discussion, see Winther et al., 2020). If effective measures and an integrated approach spanning all marine industries is in place at a wider strategic scale then adverse cumulative environmental change at an individual project level may be avoided (Gunn and Noble, 2011). Such approaches would capture the incremental effects from smaller projects and activities that are not subject to EIA (Cooper and Sheate, 2004), which are unlikely to be captured by project-level CEAs. Further, a strategic ocean management approach may somewhat alleviate the, in some cases, disproportionate expectations for individual projects to complete comprehensive CEAs. This is especially important, as all industries considered in this review exploit similar or directly adjacent areas of the marine environment (Van den Burg et al., 2019), yet we document a great disparity in their assessment of the potential impacts of multiple stressors to marine mammals. A lack of standardisation is a notable limitation of current management and conservation efforts. Activities which may impact the same receptors and marine space, either individually or cumulatively, should be subject to the same rigour and standards when it comes to proportionately assessing their potential impacts; long-term sustainability can only be achieved if best practice is applied across all industries (Winther et al., 2020).
4.1.2 Over Time
Notably, there was an increase in CEA scores over the sample period, though this improvement was attributable to only five industries [cable and renewables (large and small OWFs, tidal and wave energy)], with four industries exhibiting no significant improvement (aquaculture, decommissioning, harbour and oil or gas field development). This may be a reflection on differing levels of pressure imposed on each industry to improve and evolve practice. For example, ‘newer’ industries (such as marine renewables) have worked together to develop specific renewable-focused guidelines to support the assessment of environmental effects (e.g. RenewableUK, 2013), with parallel academic research feeding into the evolving understanding of industry impacts (e.g. Sparling et al., 2018; Whyte et al., 2020). In contrast, this pressure and collective effort to improve practice may not be imposed on ‘older’ industries, hence not showing an improvement over time, according to our scoring metrics.
4.1.3 Terminology
Previous research has found how (and if) practitioners initially define ‘cumulative effects’ and ‘impacts’ to be one of the main pre-cursors to subsequent inconsistency in practice (Cooper and Sheate, 2002; Duinker et al., 2013; Foley et al., 2017). 26% and 9% of the CEAs reviewed here provided either no definition or a vague definition, respectively. This may be due to an uncertainty by practitioners as to what cumulative effects are, and/or due to a lack of universally utilised precise working definition (Baxter et al., 2001; Cooper and Sheate, 2004; Duinker and Greig, 2006; Gunn and Noble, 2011; Judd et al., 2015). Furthermore, historic earlier definitions are now being recognised as insufficient (Duinker et al., 2013), and so we support the persistent calls for the establishment and widespread adoption of a consistent, comprehensive, definition of impact and of cumulative effects, based on best available science (Cooper and Sheate, 2002; Canter and Ross, 2010; Judd et al., 2015; Foley et al., 2017), which is complex enough to guide practice and scientific work (Duinker et al., 2013), for example adoption of the definitions and concepts outlined by Judd et al. (2015). It should be clear which effects could contribute to cumulative impacts, and should be standard practice to state which effects, impacts, pressures, sources and receptors are investigated, in order to reduce the present ambiguity (Cooper and Sheate, 2002; Foley et al., 2017; Hodgson et al., 2019; Elliott et al., 2020).
4.1.4 Baseline Characterisation
Characterising the baseline using appropriate data and background information is an essential part of the CEA process, as it not only describes the level at which potential negative effects are being assessed against, it also has implications for how significance is evaluated (Clarke Murray et al., 2014). Ideally, the baseline should describe species presence, including information on abundance, distribution and seasonality, and should acknowledge existing and potential stressors in the surrounding area.
Choosing a point in time at which to define the baseline is challenging. Whilst using a historic non-affected environment would be ideal (Masden et al., 2010; Clarke Murray et al., 2014; Foley et al., 2017; Dibo et al., 2018), in practice this is extremely challenging, with a survey of CEA practitioners across the Pacific Rim finding that past conditions only tended to be included in the baseline definition by more experienced CEA consultants (Foley et al., 2017). Instead, it is common practice to use current conditions as the baseline (Bérubé, 2007; Clarke Murray et al., 2014; Foley et al., 2017), despite this approach not taking into account ‘shifting baseline syndrome’. This is the phenomenon where each new generation of scientists or practitioners uses the current environment during their career as a baseline against which to evaluate changes, which results in a gradual shift in baseline over time, as each successive generation may use a more disturbed benchmark than the last (Pauly, 1995). In terms of UK practice, the regulations relevant to CEA and EIA in the UK (outlined in Figure 1) suggest using the present environment as the baseline, stating the explicit requirement for a description of the current environmental state, along with an outline of how this may evolve in future without the project. The regulations also state that this should be based on relevant information and scientific knowledge, though anecdotally the present review found the most up-to-date and/or appropriate data and sources were not always utilised (taking into account when the CEA was undertaken), with 3 of the reviewed CEAs not providing any information on what their assessment considered as baseline. For marine mammals around the UK, there are a number of data sources that can aid in characterising the baseline environment, these range from wider scale survey data [e.g. SCANS surveys (Hammond et al., 2013; Hammond et al., 2017)], to finer scale local data. Future practice should aim to ensure the most appropriate sources are utilised.
4.1.5 Effects Considered
Impacts included in CEAs tended to be limited, focusing on similar projects (e.g. an OWF only including other co-occurring OWF in their CEA), or including only projects or stressors where there was high confidence in the data available. Furthermore, many of the CEAs reviewed only carried forward impacts that were deemed significant in isolation into the CEA itself, similar to the findings of Baxter et al. (2001) and Olagunju and Gunn (2013). Only including impacts that the assessment deemed significant in isolation does not take into account that two or more potential impacts concluded as non-significant in isolation could result in significant cumulative impacts (Clarke Murray et al., 2014). There is a growing body of literature documenting how cumulative exposure to individual stressors that were deemed non-significant, when considered cumulatively result in biologically significant consequences for marine mammals [e.g. bioaccumulation of organochlorines in prey impacting reproductive health of NE Atlantic bottlenose dolphins and killer whales (Orcinus orca) (Jepson et al., 2016)]. Furthermore, this review found potential sources of disturbance may be scoped out from inclusion within the a CEA due to lack of data or knowledge, limiting further assessment of potential cumulative effects. However, only including stressors with sufficient information, or indeed only similar projects, does not truly reflect the real-world scenarios that marine mammals are experiencing (e.g. chemical pollution), and so has implications for the robustness of the assessment. Despite this being common practice, 90% of surveyed practitioners agreed that all disturbances should be considered when evaluating baseline conditions (Dibo et al., 2018).
4.1.6 Spatial and Temporal Scale
It is essential to define the extent of the focal area to determine the scope of the assessment, and which activities and pressures to include within the assessment (Judd et al., 2015). However choosing the appropriate scale, spatially, temporally and in terms of level of detail, is one of the key challenges to effective assessment of cumulative effects (Therivel and Ross, 2007; Clarke Murray et al., 2014), particularly for highly mobile species such as marine mammals (Gușatu et al., 2021). Scale can be difficult to define, for example, stressors at a global scale (e.g. climate change) will impact on receptors at a local scale (Clarke Murray et al., 2014). Similarly, the frequency and duration of pressure(s) will influence the nature and scale of response by the receptor (Judd et al., 2015). Within this review 63% and 43% of CEAs did not explicitly state the temporal or spatial scale of their assessment, respectively, meaning it was unclear how other projects, stressors or activities were selected for inclusion within the CEA in terms of their spatial and temporal proximity.
The appropriate spatial scale of a CEA is context specific and so should be tailored to each project and to each source of disturbance, as some impacts may be better suited to being considered at a defined radius whereas some impacts may require consideration at an ecological scale. For the latter, this could correspond with the receptor’s range (Clarke Murray et al., 2014), or be defined by receptor-specific ecological boundaries (Dibo et al., 2018), though only 14% of CEAs reviewed defined spatial boundaries with relevance to marine mammals [e.g. marine mammal management units (IAMMWG, 2015) or seal management units]. In contrast, 13% of CEAs assessed defined a spatial parameter based on a set figure, e.g. a 5 km radius from the project. This approach is more appropriate for certain activities where a radius of disturbance can be defined (e.g. piling noise), though may still not necessarily be appropriate for mobile species. It is most common for spatial scale to be defined using the footprint of expected impact or activity across all CEA receptors (Foley et al., 2017), although in some cases this may be more suitable for sedentary receptors or benthic habitats rather than highly mobile or migratory species like marine mammals or seabirds, therefore consideration to the ecology and behaviour of the receptor is required.
In practical terms, the temporal scale of a CEA should ideally accommodate the complete life cycle of all elements of the project: exploration, construction, operation and decommissioning (Lonsdale et al., 2017). In fact, surveyed CEA professionals suggested a CEA should consider impacts beyond the life cycle of a project itself (Dibo et al., 2018), as project duration may not adequately consider that behaviour may change over time in response to the action, and that this change may be lagged (Masden et al., 2010). The consideration of only high impact, short-term pressures (e.g. impact pile driving) with the preclusion of the effects from persistent long-term pressures does not represent the reality of the cumulative pressures imposed on receptors. Nevertheless, the majority of professional practice tends to scale their analysis based on the duration of the proposed activity or impact only (Foley et al., 2017). In the present review, it was found that when a temporal scale was defined, project duration was the most used temporal limit (20%). This approach may be appropriate at a single project level when there is evidence that the effect of the stressor associated with the activity is alleviated when the activity ceases [e.g. harbour seals re-distributed as per non-piling within two hours of cessation of pile-driving activity (Russell et al., 2016)]. However, where effects of stressors persist long after an activity (e.g. permanent decline in gray whale habitat use following an increase in human-induced disturbances from fishing and other shipping activity; Findley and Vidal, 2002) then this approach is not suitable. It is recommended, where possible, that the best approach in defining a temporal scale for a CEA should incorporate the length of time required for the ecological components to recover (Masden et al., 2010; Foley et al., 2015; Foley et al., 2017). The challenge here is that receptors whose response is lagged to certain stressors may mean the temporal boundary of the assessment extends beyond the operational timeline of a project.
4.1.7 True Assessment of Multiple Stressors?
CEAs tend to consider cumulative effects in one of two ways; either as multiple stressors from a single activity, or as single stressors from multiple activities (like for like) (Clarke Murray et al., 2014). Consideration of multiple stressors from multiple activities is rare (Clarke Murray et al., 2014); indeed of the CEAs reviewed 49% never considered multiple stressors from multiple activities. Notably, this was completely absent in CEAs from the aquaculture, decommissioning, and oil or gas pipeline industries. 85% of all CEAs reviewed considered only like for like stressors together (e.g. construction noise together with vessel noise, rather than construction noise together with vessel collision risk). However, for marine mammals and other receptors, it is unlikely that stressors are only experienced in this way, and so this approach may not be representative of the impacts on ecological components (Clarke Murray et al., 2014).
Only 16% of the CEAs discussed the potential for impacts to interact, with the surrounding uncertainty associated with these interactions never expressly considered. In practice it is often necessary to assume effects interact only additively (or do not interact at all), however it is important to acknowledge this assumption, and the consequent potential for under- or over-estimation of impacts which further affects the effectiveness of any management or mitigation measures (Judd et al., 2015; Singh et al., 2020). To address this knowledge gap, further empirical research is required to identify and distinguish effects of single vs multiple disturbances, and to build an understanding of how stressors interact (whether additive, synergistic, multiplicative, compensatory or antagonistic) in order for this aspect of the CEA process to improve (Clarke Murray et al., 2014).
4.1.8 Methodology: Qualitative Versus Quantitative
There are some quantitative methods and tools being developed, or already available, to assist the practitioner when assessing cumulative effects on marine mammals, for example, the iPCoD model (King et al., 2015; Booth et al., 2020), and other stepwise quantitative approaches [e.g. Piet et al., 2021) (refer to Section 1.1 for further examples]. However, few CEAs reviewed used wholly quantitative methods to determine significance (6%, all from large OWFs), and instead 71% relied on professional judgement or did not describe how significance was determined. All CEAs from aquaculture, decommissioning, dredging, harbour development, small OWF and wave energy industries were solely based on professional judgement. This is a higher proportion than other reviews of CEA, one of which documented 26% of CEAs described cumulative effects qualitatively, whilst another documented 66% of CEAs relied solely on expert judgement (Cooper and Sheate, 2002; Korpinen and Andersen, 2016). Professional judgement has historically been relied upon by necessity, due to the absence of established thresholds of response or tools to aid the assessment process (Cooper and Sheate, 2002; Connelly, 2011; Clarke Murray et al., 2014; Lonsdale et al., 2017; Singh et al., 2020). For CEAs to be robust, reliable and transparent, the onus is on practitioners to support their judgements with the best available science.
Predictive models are a potential additional or alternative method to professional judgement, and can be used as a tool to simulate and predict the potential for significant impacts (Duinker et al., 2013). Geographic Information Systems (GIS) are another tool that can be extremely useful in facilitating the CEA process (e.g. Lonsdale et al., 2020; Gușatu et al., 2021), but again, only 15% of the reviewed CEAs presented a map as part of the marine mammal CEA. Maps can be used to superimpose the spatial extent of projects, activities and stressors with receptor presence, to aid interpretation of potential impacts, in addition to the quantitative analysis or qualitative assessment (e.g. Halpern et al., 2008; Batista et al., 2014), and have been used to map potential cumulative impacts on four marine mammal species in the California Current (Maxwell et al., 2013) and cumulative impacts on Hong Kong’s pink dolphins (Marcotte et al., 2015).
Uncertainty It is important that CEAs acknowledge the limitations of their chosen approach, and are transparent in how this contributes to the uncertainty and consequent interpretation of the CEA outputs (Judd et al., 2015). In the UK, including ‘details of difficulties (for example, technical deficiencies or lack of knowledge) encountered compiling the required information and the main uncertainties involved’ is specifically outlined in the Marine Works (EIA) Regulations 20071 as a requirement to be included within the EIA and associated CEA. Yet, only 5% of the CEAs reviewed explicitly considered uncertainty (all from large OWFs). Considering the high level of uncertainty surrounding marine mammal individual and population responses to disturbance, and often the uncertainty surrounding the stressor itself (e.g. definite construction period), identifying and making decision-makers aware of the degree of uncertainty associated with these assessments is essential.
4.2 Limitations
While every effort was made to ensure this review was conducted in a robust manner, there are some important caveats that should be understood when considering the findings of this study. First and foremost, we were not able to ascertain whether the scores given as part of this review correlated with effectiveness of the assessment themselves, though it is plausible that this is the case. CEAs were scored using a framework developed by Willsteed et al. (2018), to allow comparison of scores across industries and through time. The attributes of the framework were designed based around UK legal obligations for CEA, principles of marine ecosystem approaches to management and key principles of assessing cumulative effects, and were trialled by Willsteed et al. (2018) to score benthic and fish and shellfish ecology CEA chapters from the marine renewable energy industry. As those same legislative requirements span nine of the eleven industries reviewed, there may be a degree of bias in the scoring criteria towards those, with bias against the decommissioning and cable industries. However, it was felt that the attributes were broad enough to represent a number of features that all CEAs should include to be satisfactory (e.g. definition, quantitative methods, clear methodology, uncertainty acknowledged) and as such we do not expect this has significant implications on our findings.
This review assessed documents from all marine industries that legally require CEA completion, and so we therefore expect these findings to accurately reflect the state of CEA practice within UK seas. However, there were differing levels of accessibility associated with the documents reviewed across sectors, as has been noted by other studies (Ball et al., 2013; Lees et al., 2016). Only one CEA was found for the dredging and the oil or gas pipeline industries, despite a thorough search. This may be a reflection of the rarity within that industry to complete a CEA, or it may be a problem of access, but without review of further CEAs from those industries it is not possible to confirm whether the scores here are representative of their respective industries practice. EIAs and their associated CEAs are, in principle, public documents, and are inherently useful when looking at how to improve future practice and address knowledge gaps, and so we recommend accessibility to such documentation is improved (Lees et al., 2016). Furthermore, where practical, supporting documentation and data should be made available, as simply reviewing completed CEAs is not always enough to determine the methods and tools practitioners have undertaken (Foley et al., 2017). This may have led to an underscoring in the present review, as the final document is often a summarised version of a long, nuanced and complex process.
Finally, the scores of the reviewed CEAs do not account for the scoping advice received from the regulator or statutory advisors, or for the influence of practitioner expertise or experience, which has previously been identified as a factor that may influence CEA standards and practice within other countries (Wärnbäck and Hilding-Rydevik, 2009; Kågström and Richardson, 2015; Kågström, 2016; Foley et al., 2017). In some cases, practitioners may be employed by project proponents, which may lead to potential bias and/or conflicts of interest (Duinker and Greig, 2006). Whilst we again could not consider this in the present review, standardising practice through sharing of guidance and minimum standards of approaches would potentially somewhat alleviate this influence on CEA practice.
5 Conclusion
Cumulative Effects Assessment serves as a tool to estimate the overall expected impact on a receptor of interest (Judd et al., 2015). The aim of a CEA should be to provide decision-makers with sufficient information to support consenting decisions which ensure the sustainable development of marine spaces in parallel with conservation of the receptors considered. Inadequate or inclusive assessment of potential impacts can lead to the consenting of developments and projects that put significantly underestimated levels of stress on local marine environments (e.g. King and Pushchak, 2008). The robustness and validity of these assessments therefore plays a pivotal role in the protection of marine mammals, and any other receptors, from anthropogenic impacts.
We document a disparity in how cumulative effects are being considered across the same marine space, with considerable discrepancies in the efficacy of CEAs across maritime industries, with some (aquaculture, harbour development, decommissioning and oil or gas field development) not showing any signs of improvement over the study period. Considering the findings of this review and a wider consideration of the scholarly literature, we offer recommendations (summarised in Table 2) which may go some way to ensuring cumulative effects are considered in a consistent manner, and appropriately mitigated for, across the marine environment. In providing these recommendations, we acknowledge the very significant challenges to doing CEA well, and that a ‘one size fits all’ approach is not always appropriate. Despite this, it is expected that these findings, and recommendations, are broadly applicable to global CEA practice, including industries and receptors within both the terrestrial and marine environment. This is timely considering reviews of CEA practice elsewhere have also found CEA implementation to be less than satisfactory, with similar challenges to those identified in the present review also reported elsewhere [e.g. in Canada (Baxter et al., 2001; Duinker and Greig, 2006; Sinclair et al., 2017), the United States (Ma et al., 2012; Schultz, 2012), Sweden (Wärnbäck and Hilding-Rydevik, 2009), in the Brazilian Amazon (Athayde et al., 2019) and in the Arctic (Kirkfeldt et al., 2017)].
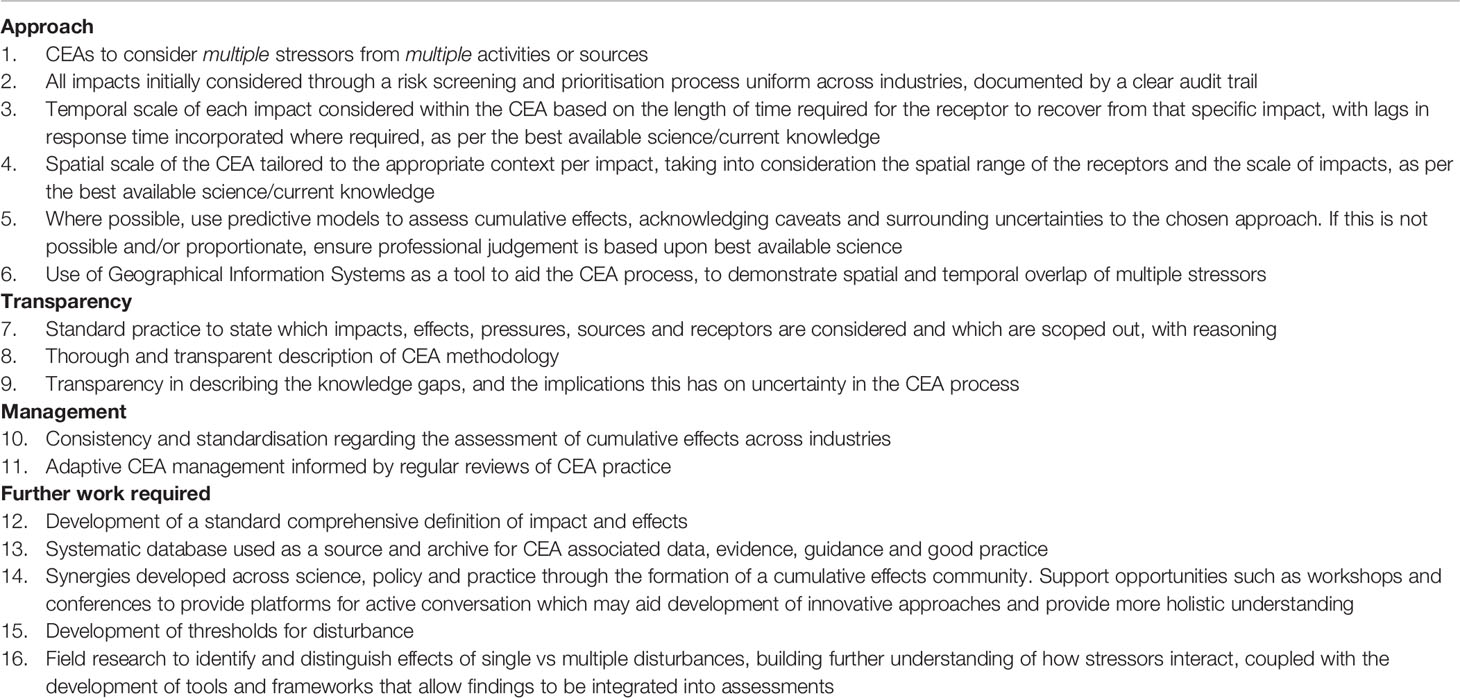
Table 2 Recommendations to improve and standardise Cumulative Effects Assessment practice.
This work highlights a siloed, sector by sector, non-uniform approach to assessing cumulative impacts on marine mammals. Future work could explore whether the variation in practice highlighted here has in fact resulted in sustainable development being non-uniform across UK industries and waters. Long-term sustainability of the marine environment can only be achieved if all industries work to the same standards in terms of protecting the environment from significant harm (Winther et al., 2020), and so we suggest the development of a cumulative effects community approach in order to facilitate standardisation in approaches and sharing of best practice. Adoption of a more holistic, rather than fragmented, approach would help to ensure the continued development of the marine environment does not compromise the conservation of marine mammals, and indeed other species and habitats.
Data Availability Statement
The raw data supporting the conclusions of this article will be made available by the authors, without undue reservation.
Author Contributions
EH and LM contributed to the conception and design of the study. EH, AL, CS, CM, DV, RW, RC and LM reviewed and scored the CEAs. EH organised the resulting database, performed the statistical analysis and wrote the first draft of the manuscript. All authors contributed to further manuscript drafting and revision, and read and approved the submitted version.
Funding
The lead author is a PhD student, whose stipend during the undertaking of this work was provided by a James Watt scholarship (Heriot-Watt University). Financial support enabling the open access publication of this research was provided by Natural England - the government’s adviser for the natural environment in England.
Conflict of Interest
The authors declare that the research was conducted in the absence of any commercial or financial relationships that could be construed as a potential conflict of interest.
Publisher’s Note
All claims expressed in this article are solely those of the authors and do not necessarily represent those of their affiliated organizations, or those of the publisher, the editors and the reviewers. Any product that may be evaluated in this article, or claim that may be made by its manufacturer, is not guaranteed or endorsed by the publisher.
Acknowledgments
We gratefully acknowledge Rachael Sinclair, Margaret Tierney, Alex Brown and Sally Rouse whom all provided documents that aided this review. We also thank Ed Willsteed for taking the time to provide valuable and considered advice on how best to use the framework he initially conceived. We are grateful to the reviewers for carefully considered comments, which improved this work.
Supplementary Material
The Supplementary Material for this article can be found online at: https://www.frontiersin.org/articles/10.3389/fmars.2022.822467/full#supplementary-material
Footnotes
- ^ The Marine Works (Environmental Impact Assessment) Regulations 2007, The Marine Works (Environmental Impact Assessment) (Amendment) Regulations 2017 and The Marine Works (Environmental Impact Assessment) (Scotland) Regulations 2017.
- ^ The Offshore Petroleum Production and Pipelines (Assessment of Environmental Effects) Regulations 1999 (as amended) – replaced by the 2020 EIA Regulations: The Offshore Oil and Gas Exploration, Production, Unloading and Storage (Environmental Impact Assessment) Regulations 2020.
- ^ The Offshore Petroleum Production and Pipelines (EIA and other Miscellaneous Provisions) 2017.
- ^ Town and Country Planning (EIA) Regulations 2017, and The Town and Country Planning (Environmental Impact Assessment) (Wales) Regulations 2017 and The Town and Country Planning (Environmental Impact Assessment) (Scotland) Regulations 2017.
- ^ The Electricity Works (EIA) (England and Wales) Regulations 2017 and The Electricity Works (EIA) (Scotland) Regulations 2017.
- ^ The Environmental Impact Assessment (Miscellaneous Amendments Relating to Harbours, Highways and Transport) Regulations 2017.
- ^ https://www.gov.uk/guidance/do-i-need-a-marine-licence
- ^ https://depons.eu/
- ^ https://moat.cefas.co.uk/introduction-to-uk-marine-strategy/
- ^ https://infrastructure.planninginspectorate.gov.uk/
- ^ marine.gov.scot
- ^ publicregister.naturalresources.wales
- ^ https://tethys.pnnl.gov/
- ^ https://marinelicensing.marinemanagement.org.uk/
- ^ https://www.marinedataexchange.co.uk/
- ^ http://www.4coffshore.com/offshorewind/
- ^ https://www.gov.uk/government/organisations/department-for-business-energy-and-industrial-strategy
- ^ https://www.gov.uk/government/organisations/offshore-petroleum-regulator-for-environment-and-decommissioning
- ^ https://www.gov.uk/government/collections/eia-submissions-and-decisions-2021
- ^ https://www.gov.uk/guidance/oil-and-gas-environmental-statements-reviewed
- ^ https://www.gov.uk/guidance/oil-and-gas-decommissioning-of-offshore-installations-and-pipelines#approved-decommissioning-programmes
References
Athayde S., Duarte C. G., Gallardo A. L., Moretto E. M., Sangoi L. A., Dibo A. P. A., et al. (2019). Improving Policies and Instruments to Address Cumulative Impacts of Small Hydropower in the Amazon. Energy Policy. 132, 265–271. doi: 10.1016/j.enpol.2019.05.003
Avila I. C., Kaschner K., Dormann C. F. (2018). Current Global Risks to Marine Mammals: Taking Stock of the Threats. Biol. Conserv. 221, 44–58. doi: 10.1016/j.biocon.2018.02.021
Ball M. A., Noble B. F., Dubé M. G. (2013). Valued Ecosystem Components for Watershed Cumulative Effects: An Analysis of Environmental Impact Assessments in the South Saskatchewan River Watershed, Canada. Integr. Environ. Assess. Manage. 9 (3), 469–479. doi: 10.1002/ieam.1333
Batista M. I., Henriques S., Pais M. P., Cabral H. N. (2014). Assessment of Cumulative Human Pressures on a Coastal Area: Integrating Information for MPA Planning and Management. Ocean Coast. Manage. 102, 248–257. doi: 10.1016/j.ocecoaman.2014.09.020
Baxter W., Ross W. A., Spaling H. (2001). Improving the Practice of Cumulative Effects Assessment in Canada. Impact Assess. Proj. Apprais. 19:4, 253–262. doi: 10.3152/147154601781766916
Bérubé M. (2007). Cumulative Effects Assessments at Hydro-Québec: What Have We Learned? Impact Assess. Proj. Apprais. 25:2, 101–109. doi: 10.3152/146155107X197913
Bond A., Pope J., Morrison-Saunders A., Retief F., Gunn J. A. (2014). Impact Assessment: Eroding Benefits Through Streamlining? Environ. Impact Assess. Rev. 45, 46–53. doi: 10.1016/j.eiar.2013.12.002
Booth C. G., Sinclair R. R., Harwood J. (2020). Methods for Monitoring for the Population Consequences of Disturbance in Marine Mammals: A Review. Front. Mar. Sci. 7, 115. doi: 10.3389/fmars.2020.00115
Burris R. K., Canter L. W. (1997). Cumulative Impacts are Not Properly Addressed in Environmental Assessments. Environ. Impact Assess. Rev. 17 (1), 5–18. doi: 10.1016/S0195-9255(96)00082-0
Caine C. A. (2020). The Race to the Water for Offshore Renewable Energy: Assessing Cumulative and in-Combination Impacts for Offshore Renewable Energy Developments. J. Environ. Law. 32 (1), 83–109. doi: 10.1093/jel/eqz031
Canter L., Ross B. (2010). State of Practice of Cumulative Effects Assessment and Management: The Good, the Bad and the Ugly. Impact Assess. Proj. Apprais. 28:4, 261–268. doi: 10.3152/146155110X12838715793200
Cervin L., Harkonen T., Harding K. C. (2020). Multiple Stressors and Data Deficient Populations; a Comparative Life-History Approach Sheds New Light on the Extinction Risk of the Highly Vulnerable Baltic Harbour Porpoises (Phocoena Phocoena). Enviro. Int. 144, p.106076. doi: 10.1016/j.envint.2020.106076
Christiansen F., Lusseau D. (2015). Linking Behavior to Vital Rates to Measure the Effects of Non-Lethal Disturbance on Wildlife. Conserv. Lett. 8 (6), 424–431. doi: 10.1111/conl.12166
Cocklin C., Parker S., Hay J. (1992). Notes on Cumulative Environmental Change I: Concepts and Issues. J. Environ. Manage. 35 (1), 31–49. doi: 10.1016/S0301-4797(05)80126-4
Connelly R. B. (2011). Canadian and International EIA Frameworks as They Apply to Cumulative Effects. Environ. Impact Assess. Rev. 31, 453–456. doi: 10.1016/j.eiar.2011.01.007
Cooper L. M., Sheate W. R. (2002). Cumulative Effects Assessment: A Review of UK Environmental Impact Statements. Environ. Impact Assess. Rev. 22 (4), 415–439. doi: 10.1016/S0195-9255(02)00010-0
Cooper L. M., Sheate W. R. (2004). Integrating Cumulative Effects Assessment Into UK Strategic Planning: Implications of the European Union SEA Directive. Impact Assess. Proj. Apprais. 22 (1), 5–16. doi: 10.3152/147154604781766067
Costa D. P., Hückstädt L. A., Schwarz L. K., Friedlaender A. S., Mate B. R., Zerbini A. N., et al. (2016). Assessing the Exposure of Animals to Acoustic Disturbance: Towards an Understanding of the Population Consequences of Disturbance. JASA 27, p.010027. doi: 10.1121/2.0000298
Crain C. M., Kroeker K., Halpern B. S. (2008). Interactive and Cumulative Effects of Multiple Human Stressors in Marine Systems. Ecol. Lett. 11 (12), 1304–1315. doi: 10.1111/j.1461-0248.2008.01253.x
Dibo A. P. A., Noble B. F., Sánchez L. E. (2018). Perspectives on Driving Changes in Project-Based Cumulative Effects Assessment for Biodiversity: Lessons From the Canadian Experience. Environ. Manage. 62, 929–941. doi: 10.1007/s00267-018-1086-6
Donovan C. R., Harris C., Harwood J., Milazzo L. (2012). A Simulation-Based Method for Quantifying and Mitigating the Effects of Anthropogenic Sound on Marine Mammals. Proc. Mtgs. Acoust. 17, 070043. doi: 10.1121/1.4772738
Duinker P. N., Burbidge E. L., Boardley S. R., Greig L. A. (2013). Scientific Dimensions of Cumulative Effects Assessment: Toward Improvements in Guidance for Practice. Environ. Rev. 21 (1), 40–52. doi: 10.1139/er-2012-0035
Duinker P. N., Greig L. A. (2006). The Impotence of Cumulative Effects Assessment in Canada: Ailments and Ideas for Redeployment. Environ. Manage. 37 (2), 153–161. doi: 10.1007/s00267-004-0240-5
Durning B., Broderick M. (2019). Development of Cumulative Impact Assessment Guidelines for Offshore Wind Farms and Evaluation of Use in Project Making. Impact Assess. Proj. Apprais. 37 (2), 124–138. doi: 10.1080/14615517.2018.1498186
Elliott M., Borja A., Cormier R. (2020). Activity-Footprints, Pressures-Footprints and Effects-Footprints – Walking the Pathway to Determining and Managing Human Impacts in the Sea. Mar. Pollut. Bull. 155, 111201. doi: 10.1016/j.marpolbul.2020.111201
Farmer N. A., Noren D. P., Fougères E. M., Machernis A., Baker K. (2018). Resilience of the Endangered Sperm Whale Physeter Macrocephalus to Foraging Disturbance in the Gulf of Mexico, USA: A Bioenergetic Approach. Mar. Ecol. Prog. Ser. 589, 241–261. doi: 10.3354/meps12457
Fernández G. M. R., de Brito L. L. A., Fonseca A. (2018). Does Size Matter? An Evaluation of Length and Proportion of Information in Environmental Impact Statements. Environ. Impact Assess. Rev. 73, 114–121. doi: 10.1016/j.eiar.2018.08.002
Fernández A., Edwards J. F., Rodriguez F., De Los Monteros A. E., Herraez P., Castro P., et al. (2005). “Gas and Fat Embolic Syndrome” Involving a Mass Stranding of Beaked Whales (Family Ziphiidae) Exposed to Anthropogenic Sonar Signals. Vet. Pathol. 42 (4), 446–457. doi: 10.1354/vp.42-4-446
Findley L. T., Vidal O. (2002). The Gray Whale, Eschrichtius Robustus, at Calving Sites in the Gulf of California, México. J. Cetacean Res. Manage. 4 (1), 27–40.
Foley M. M., Martone R. G., Fox M. D., Kappel C. V., Mease L. A., Erickson A. L., et al. (2015). Using Ecological Thresholds to Inform Resource Management: Current Options and Future Possibilities. Front. Mar. Sci. 2, 95. doi: 10.3389/fmars.2015.00095
Foley M. M., Mease L. A., Martone R. G., Prahler E. E., Morrison T. H., Murray C. C., et al. (2017). The Challenges and Opportunities in Cumulative Effects Assessment. Environ. Impact Assess. Rev. 62, 122–134. doi: 10.1016/j.eiar.2016.06.008
Government H. M. (2012). Marine Strategy Part One: UK Initial Assessment and Good Environmental Status. Available at: https://assets.publishing.service.gov.uk/government/uploads/system/uploads/attachment_data/file/69632/pb13860-marine-strategy-part1-20121220.pdf.
Government H. M. (2019). Marine Strategy Part One: UK Updated Assessment and Good Environmental Status. Available at: https://assets.publishing.service.gov.uk/government/uploads/system/uploads/attachment_data/file/921262/marine-strategy-part1-october19.pdf.
Gușatu L. F., Menegon S., Depellegrin D., Zuidema C., Faaij A., Yamu C. (2021). Spatial and Temporal Analysis of Cumulative Environmental Effects of Offshore Wind Farms in the North Sea Basin. Sci. Rep. 11 (1), 1–18. doi: 10.1038/s41598-021-89537-1
Gunn J., Noble B. F. (2011). Conceptual and Methodological Challenges to Integrating SEA and Cumulative Effects Assessment. Environ. Impact Assess. Rev. 31 (2), 154–160. doi: 10.1016/j.eiar.2009.12.003
Halpern B. S., Walbridge S., Selkoe K. A., Kappel C. V., Micheli F., D'Agrosa C., et al. (2008). A Global Map of Human Impact on Marine Ecosystems. Sci. 319 (5865), 948–952. doi: 10.1126/science.1149345
Hammond P. S., Lacey C., Gilles A., Viquerat S., Börjesson P., Herr H., et al. (2017). “Estimates of Cetacean Abundance in European Atlantic Waters in Summer 2016 From the SCANS-III Aerial and Shipboard Surveys”. in: SCANS-III Project Report 1 (New York, NY: Chapman and Hall/CRC). 1–40 pp. Available at: https://synergy.st-andrews.ac.uk/scans3/files/2017/04/SCANS-III-design-based-estimates-2017-04-28-final.pdf.
Hammond P. S., Macleod K., Berggren P., Borchers D. L., Burt L., Cañadas A., et al. (2013). Cetacean Abundance and Distribution in European Atlantic Shelf Waters to Inform Conservation and Management. Biol. Conserv. 164, 107–122. doi: 10.1016/j.biocon.2013.04.010
Harwood J., King S., Booth C., Donovan C., Schick R. S., Thomas L., et al. (2016). “Understanding the Population Consequences of Acoustic Disturbance for Marine Mammals”,l in The Effects of Noise on Aquatic Life II. Advances in Experimental Medicine and Biology, vol. 875. Eds. Popper A., Hawkins A. (New York, NY: Springer). doi: 10.1007/978-1-4939-2981-8_49
Hawkins E. R., Harcourt R., Bejder L., Brooks L. O., Grech A., Christiansen F., et al. (2017). Best Practice Framework and Principles for Monitoring the Effect of Coastal Development on Marine Mammals. Front. Mar. Sci. 4, 59. doi: 10.3389/fmars.2017.00059
Hawkins A. D., Johnson C., Popper A. N. (2020). How to Set Sound Exposure Criteria for Fishes. JASA 147 (3), 1762–1777. doi: 10.1121/10.0000907
Hin V., Harwood J., De Roos A. M. (2019). Bio-Energetic Modeling of Medium-Sized Cetaceans Shows High Sensitivity to Disturbance in Seasons of Low Resource Supply. Ecol. Appl. 29, e01903. doi: 10.1002/eap.1903
Hodgson E. E., Halpern B. S. (2018). Investigating Cumulative Effects Across Ecological Scales. Conserv. Biol. 33 (1), 22–32. doi: 10.1111/cobi.13125
Hodgson E. E., Halpern B. S., Essington T. E. (2019). Moving Beyond Silos in Cumulative Effects Assessment. Front. Ecol. Evol. 7, 211. doi: 10.3389/fevo.2019.00211
Hyder P. L. C. (1999). Guidelines for the Assessment of Indirect and Cumulative Impacts as Well as Impact Interactions. European Commission. EC DGX1 Environment (Brussels: Nuclear Safety and Civil Protection).
IAMMWG. (2015). Management Units for Cetaceans in UK Waters. JNCC Report No. 547, JNCC (Peterborough). Available at: https://hub.jncc.gov.uk/assets/f07fe770-e9a3-418d-af2c-44002a3f2872.
Jepson P. D., Deaville R., Barber J. L., Aguilar À., Borrell A., Murphy S., et al. (2016). PCB Pollution Continues to Impact Populations of Orcas and Other Dolphins in European Waters. Sci. Rep. 6 (1), 1–17. doi: 10.1038/srep18573
Judd A. D., Backhaus T., Goodsir F. (2015). An Effective Set of Principles for Practical Implementation of Marine Cumulative Effects Assessments. Environ. Sci. Policy. 54, 254–262. doi: 10.1016/j.envsci.2015.07.008
Kågström M. (2016). Between ‘Best’ and ‘Good Enough’: How Consultants Guide Quality in Environmental Assessment. Environ. Impact Assess. Rev. 60, 169–175. doi: 10.1016/j.eiar.2016.05.003
Kågström M., Richardson T. (2015). Space for Action: How Practitioners Influence Environmental Assessment. Environ. Impact Assess. Rev. 54, 110–118. doi: 10.1016/j.eiar.2015.06.003
Kassambara A. (2021). Rstatix: Pipe-Friendly Framework for Basic Statistical Tests. R Package Version 0.7.0. Available at: https://CRAN.R-project.org/package=rstatix.
King S. C., Pushchak R. (2008). Incorporating Cumulative Effects Into Environmental Assessments of Mariculture: Limitations and Failures of Current Siting Methods. Environ. Impact Assess. Rev. 28 (8), 572–586. doi: 10.1016/j.eiar.2007.12.002
King S. L., Schick R. S., Donovan C., Booth C. G., Burgman M., Thomas L., et al. (2015). An Interim Framework for Assessing the Population Consequences of Disturbance. Methods Ecol. Evol. 6 (10), 1150–1158. doi: 10.1111/2041-210X.12411
Kirkfeldt T. S., Hansen A. M., Olesen P., Mortensen L., Hristova K., Welsch A. (2017). Why Cumulative Impacts Assessments of Hydrocarbon Activities in the Arctic Fail to Meet Their Purpose. Reg. Enviro. Change. 17 (3), 725–737. doi: 10.1007/s10113-016-1059-3
Komsta L., Novomestky F. (2015). Moments: Moments, Cumulants, Skewness, Kurtosis and Related Tests. R Package Version 0.14. Available at: https://CRAN.R-project.org/package=moments.
Korpinen S., Andersen J. H. (2016). A Global Review of Cumulative Pressure and Impact Assessments in Marine Environments. Front. Mar. Sci. 3, 153. doi: 10.3389/fmars.2016.00153
Kyhn L. A., Jørgensen P. B., Carstensen J., Bech N. I., Tougaard J., Dabelsteen T., et al. (2015). Pingers Cause Temporary Habitat Displacement in the Harbour Porpoise Phocoena Phocoena. Mar. Ecol. Prog. Ser. 526, 253–265. doi: 10.3354/meps11181
Lees J., Jaeger J. A., Gunn J. A., Noble B. F. (2016). Analysis of Uncertainty Consideration in Environmental Assessment: An Empirical Study of Canadian EA Practice. J. Environ. Plann. Man. 59:11, 2024–2044. doi: 10.1080/09640568.2015.1116980
Lonsdale J. A., Nicholson R., Judd A., Elliott M., Clarke C. (2020). A Novel Approach for Cumulative Impacts Assessment for Marine Spatial Planning. Environ. Sci. Pol. 106, 125–135. doi: 10.1016/j.envsci.2020.01.011
Lonsdale J., Weston K., Blake S., Edwards R., Elliott M. (2017). The Amended European Environmental Impact Assessment Directive: UK Marine Experience and Recommendations. Ocean Coast. Manage. 148, 131–142. doi: 10.1016/j.ocecoaman.2017.07.021
Ma Z., Becker D. R., Kilgore M. A. (2012). Barriers to and Opportunities for Effective Cumulative Impact Assessment Within State-Level Environmental Review Frameworks in the United States. J. Environ. Plann. Man. 55 (7), 961–978. doi: 10.1080/09640568.2011.635013
Marcotte D., Hung S. K., Caquard S. (2015). Mapping Cumulative Impacts on Hong Kong's Pink Dolphin Population. Ocean Coast. Manage. 109, 51–63. doi: 10.1016/j.ocecoaman.2015.02.002
Masden E. A., Fox A. D., Furness R. W., Bullman R., Haydon D. T. (2010). Cumulative Impact Assessments and Bird/Wind Farm Interactions: Developing a Conceptual Framework. Environ. Impact Assess. Rev. 30, 1–7. doi: 10.1016/j.eiar.2009.05.002
Maxwell S. M., Hazen E. L., Bograd S. J., Halpern B. S., Breed G. A., Nickel B., et al. (2013). Cumulative Human Impacts on Marine Predators. Nat. Commun. 42688:1–9. doi: 10.1038/ncomms3688
Morton A. B., Symonds H. K. (2002). Displacement of Orcinus Orca (L.) by High Amplitude Sound in British Columbia, Canada. ICES J. Mar. Sci. 59 (1), 71–80. doi: 10.1006/jmsc.2001.1136
Murray C. C., Mach M., Martone R. G. (2014). Cumulative Effects in Marine Ecosystems: Scientific Perspectives on Its Challenges and Solutions (New York, NY: WWF-Canada and Center For Ocean Solutions). 60 pp. doi: 10.13140/2.1.5010.5123
Nabe-Nielsen J., van Beest F. M., Grimm V., Sibly R. M., Teilmann J., Thompson P. M. (2018). Predicting the Impacts of Anthropogenic Disturbances on Marine Populations. Conserv. Lett. 11 (5), e12563. doi: 10.1111/conl.12563
Nelms S. E., Alfaro-Shigueto J., Arnould J. P., Avila I. C., Nash S. B., Campbell E., et al. (2021). Marine Mammal Conservation: Over the Horizon. Endang. Species Res. 44, 291–325. doi: 10.3354/esr01115
Olagunju A., Gunn J. (2013). What Influences Valued Ecosystem Component Selection for Cumulative Effects in Impact Assessment? J. Environ. Assess. Policy Manage. 15 (04), 1350022. doi: 10.1142/S1464333213500221
Pauly D. (1995). Anecdotes and the Shifting Baseline Syndrome of Fisheries. Trends Ecol. Evol. 10, 430. doi: 10.1016/S0169-5347(00)89171-5
Piet G. J., Tamis J. E., Volwater J., de Vries P., van der Wal J. T., Jongbloed R. H. (2021). A Roadmap Towards Quantitative Cumulative Impact Assessments: Every Step of the Way. Sci. Total Environ. 784, 146847. doi: 10.1016/j.scitotenv.2021.146847
Pirotta E., Booth C. G., Costa D. P., Fleishman E., Kraus S. D., Lusseau D., et al. (2018). Understanding the Population Consequences of Disturbance. Ecol. Evol. 8 (19), 9934–9946. doi: 10.1002/ece3.4458
Pirotta E., Harwood J., Thompson P. M., New L., Cheney B., Arso M., et al. (2015b). Predicting the Effects of Human Developments on Individual Dolphins to Understand Potential Long-Term Population Consequences. Proc. R. Soc B. 282 (1818), p.20152109. doi: 10.1098/rspb.2015.2109
Pirotta E., Merchant N. D., Thompson P. M., Barton T. R., Lusseau D. (2015a). Quantifying the Effect of Boat Disturbance on Bottlenose Dolphin Foraging Activity. Biol. Conserv. 181, 82–89. doi: 10.1016/j.biocon.2014.11.003
Pompa S., Ehrlich P. R., Ceballos G. (2011). Global Distribution and Conservation of Marine Mammals. Proc. Natl. Acad. Sci. U. S. A. 108 (33), 13600–13605. doi: 10.1073/pnas.1101525108
R Core Team. (2020). “R: A Language and Environment for Statistical Computing,” in R Foundation for Statistical Computing (Vienna, Austria). Available at: https://www.R-project.org/.
Reid J. B., Evans P. G. H., Northridge S. P. (2003). “Atlas of Cetacean Distribution in North-West European Waters,” in JNCC (Peterborough). Available at: https://hub.jncc.gov.uk/assets/a5a51895-50a1-4cd8-8f9d-8e2512345adf.
RenewableUK. (2013). Cumulative Impact Assessment Guidelines: Guiding Principles for Cumulative Impacts Assessment in Offshore Wind Farms. Available at: http://www.renewableuk.com/en/publications/index.cfm/cumulative-impact-assessment-guidelines.
Rudd M. A. (2014). Scientists' Perspectives on Global Ocean Research Priorities. Front. Mar. Sci. 1, 36. doi: 10.3389/fmars.2014.00036
Russell D. J., Hastie G. D., Thompson D., Janik V. M., Hammond P. S., Scott-Hayward L. A., et al. (2016). Avoidance of Wind Farms by Harbour Seals Is Limited to Pile Driving Activities. J. Appl. Ecol. 53 (6), 1642–1652. doi: 10.1111/1365-2664.12678
Schultz C. A. (2012). The US Forest Service's Analysis of Cumulative Effects to Wildlife: A Study of Legal Standards, Current Practice, and Ongoing Challenges on a National Forest. Environ. Impact Assess. Rev. 32 (1), 74–81. doi: 10.1016/j.eiar.2011.03.003
Schwacke L. H., Thomas L., Wells R. S., McFee W. E., Hohn A. A., Mullin K. D., et al. (2017). Quantifying Injury to Common Bottlenose Dolphins From the Deepwater Horizon Oil Spill Using an Age-, Sex-and Class-Structured Population Model. Endanger. Species Res. 33, 265–279. doi: 10.3354/esr00777
Silva W. T., Harding K. C., Marques G. M., Bäcklin B. M., Sonne C., Dietz R., et al. (2020). Life Cycle Bioenergetics of the Gray Seal (Halichoerus Grypus) in the Baltic Sea: Population Response to Environmental Stress. Environ. Int. 145, 106145. doi: 10.1016/j.envint.2020.106145
Simmonds M. P. (2018). “Chapter 17 - Marine Mammals and Multiple Stressors: Implications for Conservation and Policy”, in Marine Mammal Ecotoxicology. Eds. Fossi M. C., Panti C. (Cambridge, Massachusetts: Academic Press), 459–470. doi: 10.1016/B978-0-12-812144-3.00017-6
Sinclair A. J., Doelle M., Duinker P. N. (2017). Looking Up, Down, and Sideways: Reconceiving Cumulative Effects Assessment as a Mindset. Environ. Impact Assess. Rev. 62, 183–194. doi: 10.1016/j.eiar.2016.04.007
Singh G. G., Lerner J., Mach M., Murray C. C., Ranieri B., St-Laurent G. P., et al. (2020). Scientific Shortcomings in Environmental Impact Statements Internationally. People. Nat. 2 (2), 369–379. doi: 10.1002/pan3.10081
Sparling C., Lonergan M., McConnell B. (2018). Harbour Seals (Phoca Vitulina) Around an Operational Tidal Turbine in Strangford Narrows: No Barrier Effect But Small Changes in Transit Behaviour. Aquat. Conserv. 28, 194–204. doi: 10.1002/aqc.2790
Sparling C. E., Thompson D., Booth C. G. (2017). Guide to Population Models Used in Marine Mammal Impact Assessment (Peterborough: JNCC Report No. 607. JNCC).
Therivel R., Ross B. (2007). Cumulative Effects Assessment: Does Scale Matter? Environ. Impact Assess. Rev. 27 (5), 365–385. doi: 10.1016/j.eiar.2007.02.001
Thompson P. M., Hastie G. D., Nedwell J., Barham R., Brookes K. L., Cordes L. S., et al. (2013). Framework for Assessing Impacts of Pile-Driving Noise From Offshore Wind Farm Construction on a Harbour Seal Population. Environ. Impact Assess. Rev. 43, 73–85. doi: 10.1016/j.eiar.2013.06.005
Van den Burg S. W., Aguilar-Manjarrez J., Jenness J., Torrie M. (2019). Assessment of the Geographical Potential for Co-Use of Marine Space, Based on Operational Boundaries for Blue Growth Sectors. Mar. Policy. 100, 43–57. doi: 10.1016/j.marpol.2018.10.050
Wärnbäck A., Hilding-Rydevik T. (2009). Cumulative Effects in Swedish EIA Practice – Difficulties and Obstacles. Environ. Impact Assess. Rev. 29, 107–115. doi: 10.1016/j.eiar.2008.05.001
Whyte K. F., Russell D. J., Sparling C. E., Binnerts B., Hastie G. D. (2020). Estimating the Effects of Pile Driving Sounds on Seals: Pitfalls and Possibilities. JASA 147 (6), 3948–3958. doi: 10.1121/10.0001408
Wickham H., Averick M., Bryan J., Chang W., McGowan L. D. A., François R., et al. (2019). Welcome to the Tidyverse. J. Open Source Software 4 (43), 1686. doi: 10.21105/joss.01686
Williams R., Thomas L., Ashe E., Clark C. W., Hammond P. S. (2016). Gauging Allowable Harm Limits to Cumulative, Sub-Lethal Effects of Human Activities on Wildlife: A Case-Study Approach Using Two Whale Populations. Mar. Policy. 70, 58–64. doi: 10.1016/j.marpol.2016.04.023
Willsteed E. A., Jude S., Gill A. B., Birchenough S. N. R. (2018). Obligations and Aspirations: A Critical Evaluation of Offshore Wind Farm Cumulative Impact Assessments. Renew. Sust. Energ. Rev. 82 (3), 2332–2345. doi: 10.1016/j.rser.2017.08.079
Keywords: cumulative effects assessment (CEA), cumulative impact assessment (CIA), anthropogenic activities, management policy and practice, marine mammals, maritime industry
Citation: Hague EL, Sparling CE, Morris C, Vaughan D, Walker R, Culloch RM, Lyndon AR, Fernandes TF and McWhinnie LH (2022) Same Space, Different Standards: A Review of Cumulative Effects Assessment Practice for Marine Mammals. Front. Mar. Sci. 9:822467. doi: 10.3389/fmars.2022.822467
Received: 25 November 2021; Accepted: 02 March 2022;
Published: 25 March 2022.
Edited by:
Di Jin, Woods Hole Oceanographic Institution, United StatesReviewed by:
Ciara Willis, Massachusetts Institute of Technology, United StatesJemma Lonsdale, Centre for Environment, Fisheries and Aquaculture Science, Fisheries and Aquaculture Science (CEFAS), United Kingdom
Copyright © 2022 Hague, Sparling, Morris, Vaughan, Walker, Culloch, Lyndon, Fernandes and McWhinnie. This is an open-access article distributed under the terms of the Creative Commons Attribution License (CC BY). The use, distribution or reproduction in other forums is permitted, provided the original author(s) and the copyright owner(s) are credited and that the original publication in this journal is cited, in accordance with accepted academic practice. No use, distribution or reproduction is permitted which does not comply with these terms.
*Correspondence: Emily L. Hague, ZWxoMjAwMUBody5hYy51aw==