 Qingfeng Zhang
 Michael Kühl
 Kasper Elgetti Brodersen
- Marine Biological Section, Department of Biology, University of Copenhagen, Helsingør, Denmark
Epiphytic biofilms on seagrass leaves can lead to extreme microenvironmental conditions for the encapsulated leaf limiting both its photosynthesis and respiration. Yet, little is known about how the biological activity of the biofilm itself changes the seagrass phyllosphere microenvironment and dynamics. We used microsensors to measure O2 concentrations and pH gradients and calculate fluxes of O2, CO2 and bicarbonate around seagrass leaves (Z. marina L.) covered with artificial, inactive biofilms and natural epiphytic biofilms. A sterilized seawater-agar matrix was used to make an artificial “inactive” biofilm on seagrass leaves with the same thickness as the natural leaf epiphytic biofilm, which impeded turbulent exchange of gases but did not have microbial activity. We compared the concentration profiles and fluxes of O2 and inorganic carbon of the “active” and “inactive” biofilm to investigate the effect of microbial activity and molecular diffusion in seagrass leaf biofilms. In light, the O2 flux of leaves with inactive biofilm was only 31% of the leaves with active biofilm, indicating that the photosynthesis of the microbial community in the biofilm makes up the majority of O2 production in the leaf microenvironment. During darkness, the O2 concentration profiles and O2 fluxes were almost identical in the “active” and “inactive” biofilms. The pH profiles showed the same trend with an increase in pH of ~1.0 in the “active” biofilms and ~0.3 pH units in the “inactive” biofilms in the light, and both showing a decrease of ~0.3 pH units in darkness compared to the bulk seawater. Our measurements thus demonstrate strong photosynthesis in the epiphyte layer driving phyllosphere basification and inorganic carbon limitation. The calculated CO2 concentration on the leaf surface decreased to 0.09 μmol L-1 in the epiphytic biofilm in the light compared to leaf surface CO2 concentrations of 13.8 μmol L-1 on bare seagrass leaves, and the CO2 influxes were only 3.0% and 5.4% of O2 effluxes for leaves with “active” and “inactive” biofilm, respectively. Calculations also showed that influxes in light accounted for 91-97% of the total inorganic carbon influx to the seagrass leaf, although the utilization via CO2 concentration mechanisms is energy-consuming. Besides increasing mass transfer impedance, leaf epiphytic biofilm activity thus strongly affects the seagrass leaf microenvironment in the light by inducing higher O2 concentration and pH, increasing CO2 limitation and reducing the leaf photosynthetic efficiency.
Introduction
Seagrass meadows are important ecosystems in aquatic environments (Terrados and Borum, 2004). They are found along temperate and tropical coastlines on all continents besides Antarctica, with a documented areal cover of ~125.000 km2 globally and an estimated cover of >160.000 km2 with moderate or high confidence (Unsworth and Cullen-Unsworth, 2017; McKenzie et al., 2020). Seagrass meadows are highly productive habitats that maintain high biological diversity of invertebrates, fish and marine mammals, and represent important nursery grounds for juvenile fish (Terrados and Borum, 2004). Seagrass meadows filter terrestrial runoff, reducing pollution and exceeding nutrients (Short and Short, 1984; Lemmens et al., 1996). As a rooted plant, seagrass decreases turbidity and hinders sediment erosion or suspension (Short and Short, 1984) and store substantial amounts of carbon into the sediment (Duarte et al., 2005; Fourqurean et al., 2012). Therefore, seagrass meadows are a considerable carbon sink and play an important role in mitigating climate change (Cullen-Unsworth and Unsworth, 2018). Since 1980, seagrass meadows have been disappearing worldwide at a rate of ~110 km2 yr-1 mainly due to coastal development, poor water quality and climate change as the main threats (Waycott et al., 2009). Protection of seagrass meadows and better understanding of seagrass ecology are key to reversing this decreasing trend.
Coastal eutrophication is a major threat to seagrass ecosystems (Sand-Jensen, 1977; Borum, 1985; Drake et al., 2003). It stimulates epiphyte overgrowth on seagrass leaves affecting the leaf microenvironment, leading to extreme leaf physicochemical conditions for the plant (Ruesink, 2016; Brodersen et al., 2020a; Brodersen et al., 2020b). The epiphytic biofilm microenvironment can e.g., become hyperoxic and basified in the light and turn hypoxic or even anoxic in the dark (Noisette et al., 2020; Brodersen et al., 2020a; Brodersen et al., 2020b). Thick epiphytic biofilms can attenuate more than 50% of the incident photon irradiance of photosynthetically active radiation (PAR; 400–700 nm) and induce leaf surface warming of about 0.6°C, i.e., three times higher than bare leaves without epiphytes in the light (Noisette et al., 2020). Such dramatic microenvironmental changes in the leaf phyllosphere impact the seagrass function and fitness, as well as, the microbial metabolism of the biofilm (Sand-Jensen, 1977; Brodersen et al., 2015a). In Danish waters, bacteria, diatoms and brown algae are commonly present in the epiphytic community with green algae mostly found in spring, and cyanobacteria and red algae mostly present in autumn (Wium-Andersen and Borum, 1984).
The activity of the microbial community in the epiphytic biofilm is an important factor for driving the dynamic nature of the seagrass phyllosphere, where epiphyte respiration and photosynthesis strongly affect the concentrations of essential solutes and gases within the seagrass leaf microenvironment, and microbes compete for dissolved inorganic carbon during the daytime and intensely consume oxygen at night, leading to an often negative relationship between the epiphyte biomass and seagrass photosynthesis (Drake et al., 2003; Brodersen et al., 2015a; Brodersen et al., 2020a; Brodersen et al., 2020b; Noisette et al., 2020). Furthermore, phytotoxic compounds such as nitric oxide (NO) can be produced in the epiphytic biofilm during phyllosphere anoxia via anaerobic biochemical processes that can be detrimental to the seagrass leaf and plant (Noisette et al., 2020).
Epiphytes can also obstruct the flow over the leaf surface, impede turbulent transport and slow down solute exchange between the seagrass leaf and the surrounding water via molecular diffusion (Koch, 1994). The epiphyte layer thickness together with the diffusive boundary layer (DBL) thickness above the epiphyte/seawater interface constitutes the total diffusion distance (TDD) (Jørgensen and Revsbech, 1985; Jørgensen and Des Marais, 1990). The TDD on leaves with epiphytes is much larger (often up to 10 times thicker) than on bare leaves, and therefore extends the molecular diffusion time and restricts nutrients and gas exchange between seagrass leaves and the surrounding water (Koch, 1994; Noisette et al., 2020). The limited molecular transport impedes the supplement of substrates and metabolic products accumulate within the biofilm, which exacerbate the negative impact of the epiphytic microbiota. In the light, high pH and O2 levels in the leaf microenvironment reduce the leaf photosynthetic efficiency due to carbon limitation and enhanced photorespiration, which negatively affects the fitness of the seagrass plant (Brodersen et al., 2020a; Brodersen et al., 2020b). Within the basified epiphytic biofilm, CO2 is rapidly consumed due to abiotic (e.g., high-pH induced change in the carbon speciation towards and ) and biotic (e.g., photosynthetic DIC assimilation) factors, and the carbonate species mostly exist in the form of (Brodersen et al., 2020a). Most seagrass are able to utilize as an inorganic carbon source for leaf photosynthesis by using CO2 concentration mechanisms (CCM), such as facilitated by carbonic anhydrase (CA). However, CCMs are energy-consuming processes that reduce the leaf photosynthetic efficiency (Koch et al., 2013). Furthermore, high O2 and low CO2 levels enhance RuBisCO oxygenase activity promoting photorespiration, which further reduces the photosynthetic efficiency of seagrass leaves (Brodersen et al., 2020a). However, to which extent the biological activity of the epiphytic biofilm contributes to the phyllosphere dynamics and affects photosynthesis and inorganic carbon availability for the seagrass leaf remains largely unknown.
In this study, we used a pre-sterilized agar matrix to simulate an “inactive” epiphytic biofilm on seagrass leaves, which impeded mass transfer but did not have microbial activity. We compared the natural “active” and artificial “inactive” biofilm of similar thickness to distinguish between effects of epiphytic microbial activity and mass transfer impedance on seagrass leaf photosynthesis and respiration, as well as the inorganic carbon availability. We also performed comparative measurements on bare seagrass leaves and leaves with the epiphytic biofilm removed.
Materials and Methods
Seagrass Sampling
Specimens of Zostera marina L. with and without epiphytic biofilms on leaves were collected from shallow coastal waters (<2m depth) at Julebæk, North Zealand, Denmark (56°03’29.2”N; 12°34’40.7”E) during spring (March – May, 2021). The seagrass and the sediment around the roots were transported to the laboratory at the nearby Marine Biological Section (Helsingør, University of Copenhagen, Denmark) and were kept in reservoirs with constantly aerated water (20°C; salinity = 18) under a 12h:12h light/dark cycle (at a photon irradiance of ~200 µmol photons m-2 s-1 provided by metal-halide lamps, PAR=400-700 nm).
Experimental Procedures and Leaf Encapsulation in Agar Matrix
Seagrass leaf fragments (~8 cm long, cut near the tip from healthy seagrass leaves of similar age with no signs of deterioration) were bend into a slight U-shape, where the ends were mounted on black glass slides with black electrical tape. Microsensor measurements were conducted on the upper side of the leaf fragments (Figures 1A, B). Microprofiles of O2 concentration and pH were first measured (see below) on leaves with epiphytes. Then the epiphytic community was carefully removed with a surgical razorblade, and gradients were measured on the epiphyte-removed (epi-removed) leaves. After these initial measurements, the leaves were briefly placed into a melting agar solution (1.5% w/w, 40°) using filter-sterilized seawater (0.2 µm, with a salinity of 18) to have the agar matrix covering the leaf surface. Briefly, this was done in a custom-made mold with removable glass slides as side walls, which controlled the volume of agar solution to precisely adjust the thickness of the agar matrix (Figure 1C). Small screws were positioned beneath both ends of the bare seagrass leaf fragments to bend the leaf slightly (Figure 1C), which create a small range of distance from the surface of the agar to the leaf surface, allowing us to perform measurements precisely where the agar encapsulation and thereby the TDD was as thick as the former epiphytic community. The outer limit of the DBL was determined as where the linear O2 concentration gradient intercepts with the extrapolated bulk water O2 concentration, and the TDD as the distance between the outer limit of the DBL and the seagrass leaf tissue surface. The depth profiles of O2 concentration and pH were also measured on bare leaves without visible biofilm growing on the surface. The O2 concentration and pH gradients were measured on each sample in darkness (i.e., 0 μmol photons m -2 s-1) and in light (230 μmol photons m -2 s-1). Before measuring each profile, leaf samples were exposed to dark/light conditions for more than 30 minutes until the pH or O2 concentration at the leaf surface kept constant for minimum 5 minutes; to ensure steady state conditions while microprofiling. The natural epiphytic biofilm was defined as “active” and the artificial biofilm as “inactive” due to the sterilization processes (i.e., using filter-sterilized seawater and boiling the agarose solution) during the casting procedure.
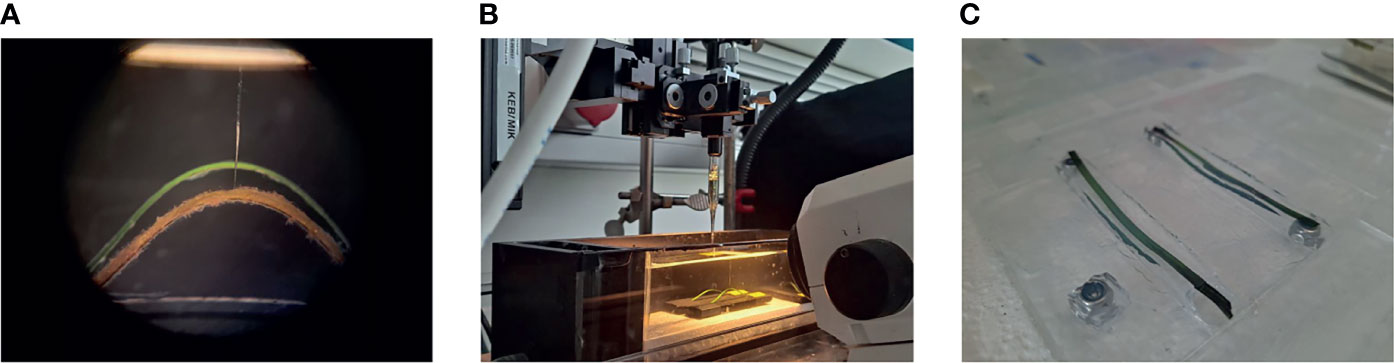
Figure 1 Experimental setup. Example of the bare seagrass leaf (green) and leaf with epiphytes (brown) fixed on the microscope glass slides (A). Leaf fragments in the flow chamber in front of the stereo microscope, and with a microsensor mounted on the motorized micromanipulator above the seagrass leaf samples (B). Bare seagrass leaves and epiphyte-removed leaves in the custom-made mold made by glass slides to shape and determine the volume/height of the agar encapsulation (C).
Microsensor Calibration and Measurements
We used O2 and pH microsensors to measure concentration gradients and calculate chemical fluxes around the seagrass leaves. A Clark-type O2 microsensor with a tip size of ~25 µm (OX-25, Unisense A/S, Denmark) was linearly calibrated from signal readings in 100% air saturated seawater and anoxic water (using an alkaline ascorbate solution) at experimental temperature and salinity. A pH microelectrode with a tip size of ~100 µm (pH-100, Unisense A/S, Denmark) was calibrated using sensor potential readings against a reference electrode (REF-RM; Unisense A/S, Denmark) in commercial pH buffer solutions (pH 4, pH 7 and pH 10; Hach.com), at experimental salinity and temperature. The length of the sensitive pH glass in pH-100 is 150-250 µm, which limits the spatial resolution in the vertical direction to about 150-250 µm.
The microsensors and the reference electrode were connected to a multichannel microsensor meter (Unisense A/S, Denmark), and the microsensors were mounted on a motorized micromanipulator system (Unisense A/S, Denmark). Both the multichannel microsensor system and the micromanipulator were connected to a PC, where data acquisition and sensor positioning was controlled via software (SensorSuite Profiler v3.2, Unisense A/S, Denmark). Microsensor positioning was relative to the seagrass leaf surface, as determined by manually handling the micromanipulator while observing the leaf surface and microsensor tip via a stereo microscope.
All microsensor measurement were performed on seagrass leaf fragments fixed onto black glass slides in a flow-chamber supplied with a constant flow (~1 cm s-1) of aerated seawater (at 18° and a salinity of 18) pumped from a supporting aquarium tank beneath the flow chamber (Figure 1B). Further information on the experimental setup and procedure can be found in Brodersen et al. (2014) and Noisette et al. (2020). Three or more technical replicates were measured at nearby position on each leaf fragment originating from 5 seagrass plants with natural epiphytic biofilm on the leaves and 4 seagrass plants without epiphytic biofilm; i.e., bare leaves (n = 12-15).
Total Inorganic Carbon Measurements
We used a calibrated total organic carbon analyzer (TOC-L; Shimadzu, Japan) to measure the total dissolved inorganic carbon concentration (DIC) in the bulk seawater around the seagrass leaves during the experiment (n=3). Samples were acidified and sparged to convert DIC into gaseous CO2 that was quantified with a non-dispersive infrared detector (NDIR).
Microsensor Data Calculations
Assuming that the carbonate system was in equilibrium and thus that pH and the calculated CO2 and profiles represent steady-state concentrations (De Beer et al., 1997; De Beer et al., 2000; Brodersen et al., 2020a), concentration profiles of CO2 and were calculated from the measured pH microprofiles and the measured DIC in the seawater (Dickson and Millero, 1987; Millero, 2010):
where k1 is the equilibrium constant of CO2 hydrolysis to bicarbonate and k2 is the equilibrium constant of bicarbonate to carbonate conversion at experimental temperature and salinity taken from Mehrbach et al. (1973), Dickson and Millero (1987), and Dickson (2010) (k1 = 9.952·10-7, k2 = 5.482·10-10, temperature of 18°, salinity=18).
Fluxes of chemical species were calculated according to Fick’s first law of diffusion:
where D is the diffusion coefficient of either O2, CO2 and in seawater at experimental temperature and salinity (tabulated values available at www.unisense.com), and is the slope of the linear concentration gradient in the DBL.
Data Analysis
We conducted statistical analyses in SPSS (IBM SPSS Statistics 28.0.0). We used independent sample t-tests to assess (1) the differences of O2 fluxes among the four treatments (i.e., leaf with epiphytes, epiphytes removed, leaf with agar encapsulation and bare leaf) and (2) the difference of carbon fluxes (i.e., CO2 fluxes and fluxes) of seagrass leaves with natural epiphytic biofilms and agar coatings (n=15). Furthermore, the confidence interval of the 95% confidence level was calculated using Student’s t-distribution to describe the range of our results.
Result and Discussion
Our experiments demonstrated that the presence and activity of epiphytic biofilms on seagrass leaves can induce major changes in the leaf phyllosphere microenvironment during daytime, inducing hyperoxia and increased pH that limited CO2 availability and reduced the photosynthetic activity and efficiency of the seagrass leaf.
Phyllosphere Diffusion Distance, O2 and pH Dynamics
The total diffusion distance (TDD = DBL + biofilm thickness) on leaves with epiphytes was 710 ± 91 µm, as compared to 105 ± 9 µm after removing the natural “active” epiphytic biofilm. The thickness of the agar matrix encapsulation and thus the TDD was the same as the thickness of the former epiphytic biofilm covered seagrass leaf. The DBL of bare leaves was 90 ± 6 µm thick. The biological variation in the TDDs and DBLs between the same type of leaf samples were mainly due to the respective thickness of the natural epiphytic biofilm and the surface roughness, respectively (Hurd, 2000; Brodersen et al., 2015a).
Oxygen Dynamics
Oxygen concentration profiles measurements on leaves with epiphytes showed that the oxygen concentration increased from 265 μmol L-1 in the bulk 100% air saturated water to 552 μmol L-1 at the leaf surface in the light, and decreased to 110 μmol L-1 in the dark (Figure 2A and Table 1; n=5 biological replicates). Similar measurements on seagrass leaves covered with agar (i.e., “inactive” biofilm) showed a similar decrease in darkness, while the increase in oxygen concentration was much less in the light reaching 363 μmol L-1 (Figure 2A and Table 1). A much smaller shift in oxygen concentration between dark and light conditions was measured on the surface of bare leaves and leaves with removed epiphytes surface (Figure 2B). The oxygen fluxes from the leaf surface into the active biofilm and from bare leaves to bulk water (i.e., 260 and 233 nmol cm-2 h-1, respectively) was 1.7 to 3.2-fold higher than fluxes from leaves after removal of epiphytes and bare seagrass leaves with agar in the light (Figure 6A; Tables 1 and 2). The oxygen uptake in the dark of bare leaves and leaves after removal of epiphytes was 1.3 to 1.6-fold higher in the dark (231 and 218 nmol cm-2 h-1, respectively), as compared to leaves with active or inactive epiphytic biofilms (Figure 6A; Tables 1 and 2). Such extreme diel changes in the leaf O2 microenvironment induced by epiphytic biofilm are similar to findings in recent studies (Brodersen et al., 2020a; Noisette et al., 2020).
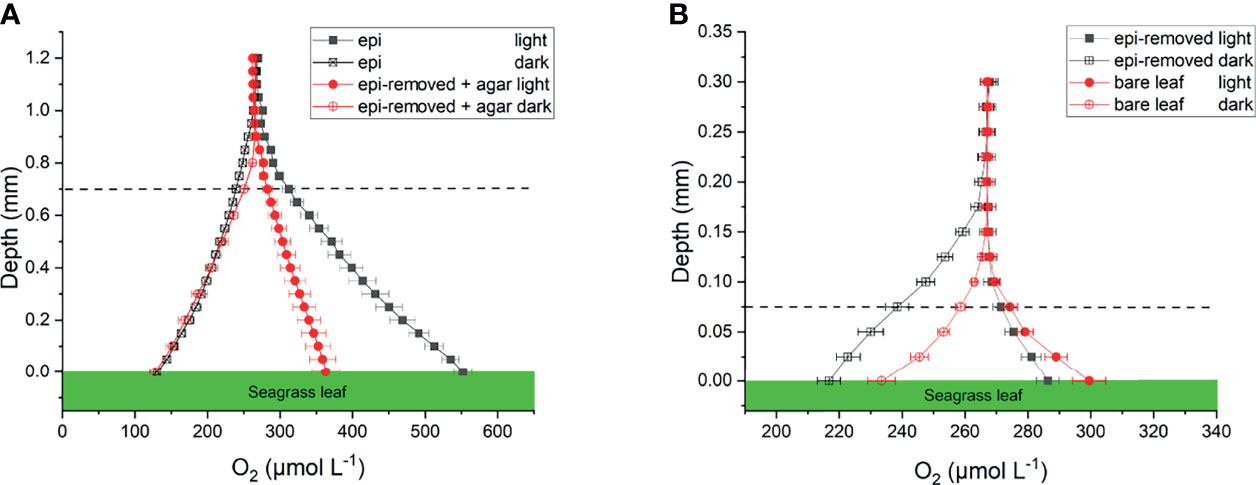
Figure 2 Oxygen concentration profiles measured on seagrass leaves with epiphytes (epi) and leaves where epiphytes were removed (epi-removed) and covered with agar (A), as well as on bare leaves and leaves where epiphytes were removed (B) in darkness (0 μmol photons m -2 s-1) and light (230 μmol photons m -2 s-1). The error bars indicate standard error of mean (SEM); n =15 (replicates with epi, epi-removed and epi-removed + agar), n =12 (bare leaves). Note the different scale on the x- and y-axis between the panels. Dashed line indicates the total diffusion distance (i.e., the surface of the leaf, biofilm or ager + the diffusive boundary layer).
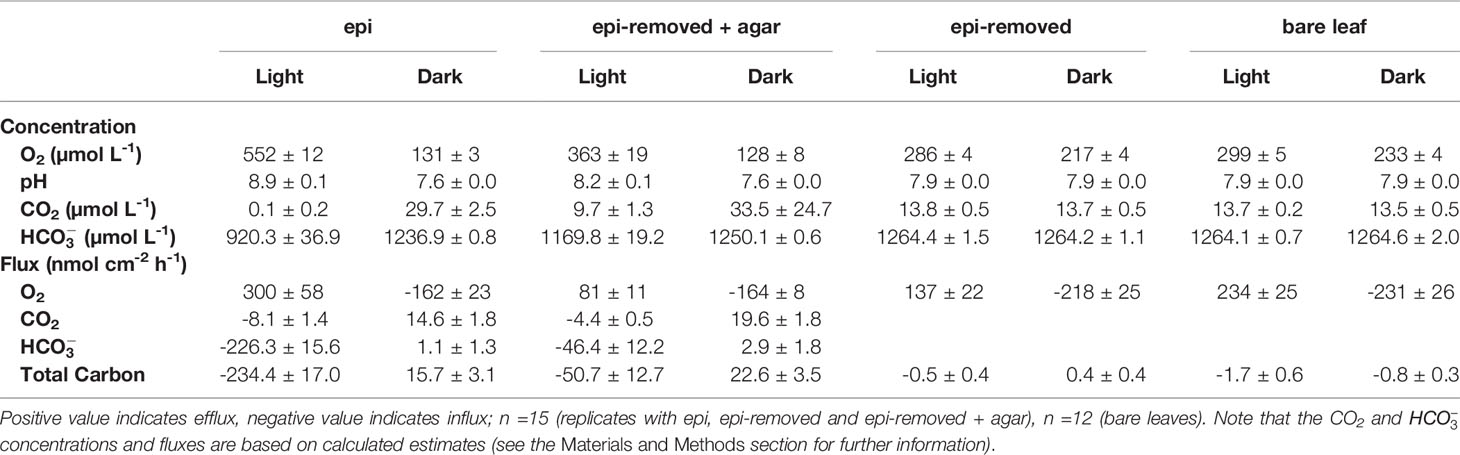
Table 1 O2, CO2, concentrations and pH on the seagrass leaf surface, and O2, CO2, and total carbon flux (mean ± SEM) from leaf surfaces into active (i.e., epi) or inactive biofilm (i.e., epi-removed + agar).
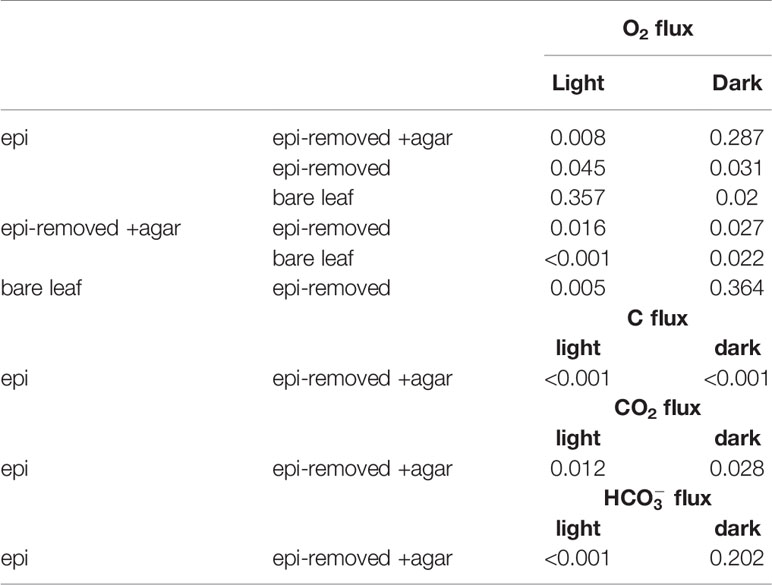
Table 2 Results of the independent sample t-tests (p-value) on O2 fluxes among our four treatments (i.e., leaves with epiphytes, epiphytes removed, leaves with agar encapsulation and bare leaves) and carbon fluxes (i.e., CO2 fluxes and fluxes) on leaves with epiphytes and leaves with agar encapsulation.
pH Dynamics
The pH gradients in the active and inactive epiphytic biofilms on seagrass leaves were caused by the balance between photosynthetic CO2 uptake and respiratory CO2 production, as well as the proton transport. The pH of the bulk seawater was 7.9, and increased towards the leaf surface in light reaching a pH maximum of pH 8.9 and 8.2 at the surface of seagrass leaves with an active and inactive biofilm, respectively, while pH decreased to a pH 7.6 in the dark (Figure 3A and Table 1). Such marked phyllosphere basification in the epiphytic biofilm micro-understory is similar to previous studies (Brodersen et al., 2020a). We found no significant changes in pH on bare seagrass leaves and leaves after removal of their epiphytes (Figure 3B). This can to some extent be explained by the spatial resolution of the pH microsensor, which is about 150-250 µm and thus larger than the thickness of the DBL on bare leaves. This also strongly limited our CO2 and calculations for these leaf types (see below).
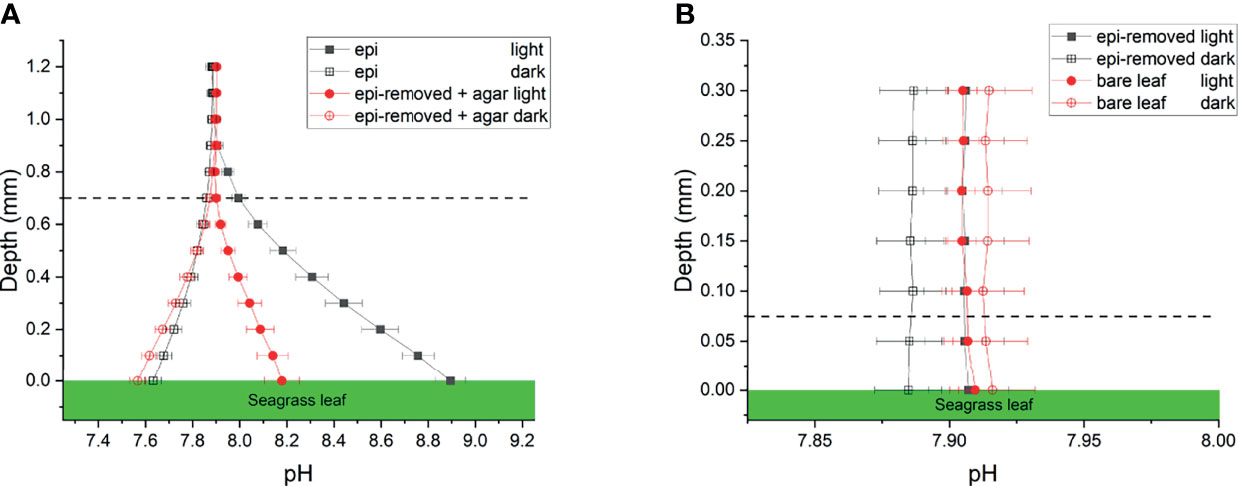
Figure 3 pH profiles measured on seagrass leaves with epiphytes (epi) and leaves where epiphytes were removed (epi-removed) and covered with agar (A), as well as on bare leaves and leaves where epiphytes were removed (B) in darkness (0 μmol photons m -2 s-1) and light (230 μmol photons m -2 s-1). The error bars indicate SEM; n =15 (replicates with epi, epi-removed and epi-removed + agar), n =12 (bare leaves). Note the different scale of the x- and y-axis between panels. Dashed line indicates the total diffusion distance (i.e., the surface of the leaf, biofilm or ager + the diffusive boundary layer).
Effect of Epiphytes on Dissolved Inorganic Carbon Availability
We calculated CO2 and concentrations from measured pH microprofiles and the total concentration of dissolved inorganic carbon (DIC) in the seawater (Figures 4A and 5A). The total DIC in the seawater was 15.1 ± 0.4 mg L-1 (or 1257.2 ± 35 µmol L-1). The CO2 concentration decreased from 14.8 to 0.1 µmol L-1 at the leaf surface under the natural epiphytic biofilm in the light (Figure 4A), as compared to leaf surface CO2 concentrations of 9.7 μmol L-1 and 13.8 μmol L-1 on leaves with inactive biofilm and on epiphyte-removed leaves, respectively (Figure 4 and Table 1). Compared to the leaves without biofilms, the relatively low CO2 concentration at the leaf surface under inactive and active biofilms (i.e., 9.7 and 0.1 µmol L-1, respectively) indicate a limited CO2 availability and supply for the seagrass leaves (Figure 4A and Table 1). In the inactive biofilm, the thicker TDD reduced the CO2 availability by 29.9%, whereas in the active biofilm the CO2 availability was reduced by 99.3% in the light (Figure 4A). Moreover, the contribution of CO2 to the total inorganic carbon influx to the seagrass/epiphyte community also decreased from 12.6% at the epiphyte/water interface (i.e., active biofilm surface), to 8.6% at the leaf/agar interface (i.e., the leaf surface under inactive biofilm), to only 3.3% at the leaf/epiphyte interface (i.e., the leaf surface under the active biofilm). Thus, indicating strong CO2 consumption by the epiphytic biofilm community markedly reducing the CO2 availability for the underlying seagrass leaf. The low CO2 availability at the seagrass leaf surface is thus likely a combined effect of (1) a high-pH induced change in the phyllosphere carbonate system speciation towards bicarbonate, (2) diffusion-limited CO2 supply to the leaf surface due to thick total diffusion pathways induced by the epiphytic layer, and (3) CO2 fixation by the photosynthetic organisms within the leaf epiphytic biofilm itself.
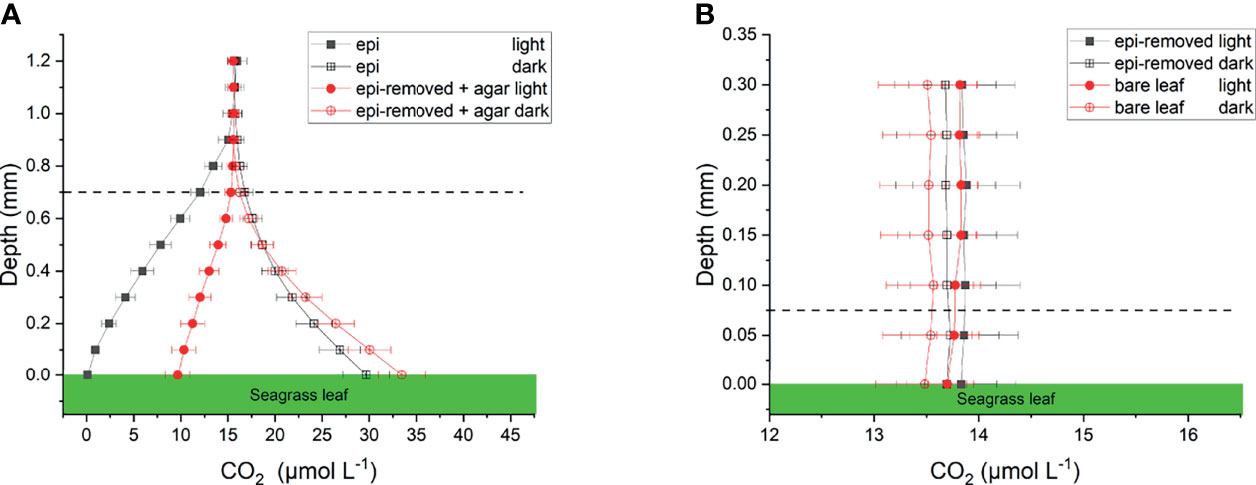
Figure 4 Calculated CO2 profiles over seagrass leaves with epiphytes (epi) and leaves where epiphytes were removed (epi-removed) and covered with agar (A), as well as on bare leaves and leaves where epiphytes were removed (B) in darkness (0 μmol photons m -2 s-1) and light (230 μmol photons m -2 s-1). The error bars indicate SEM; n =15 (replicates with epi, epi-removed and epi-removed + agar), n =12 (bare leaves). Calculated based on measured pH microprofiles and total DIC measurements in seawater. Note the different scale on the x- and y-axis between panels. Dashed line indicates the total diffusion distance (i.e., the surface of the leaf, biofilm or ager + the diffusive boundary layer).
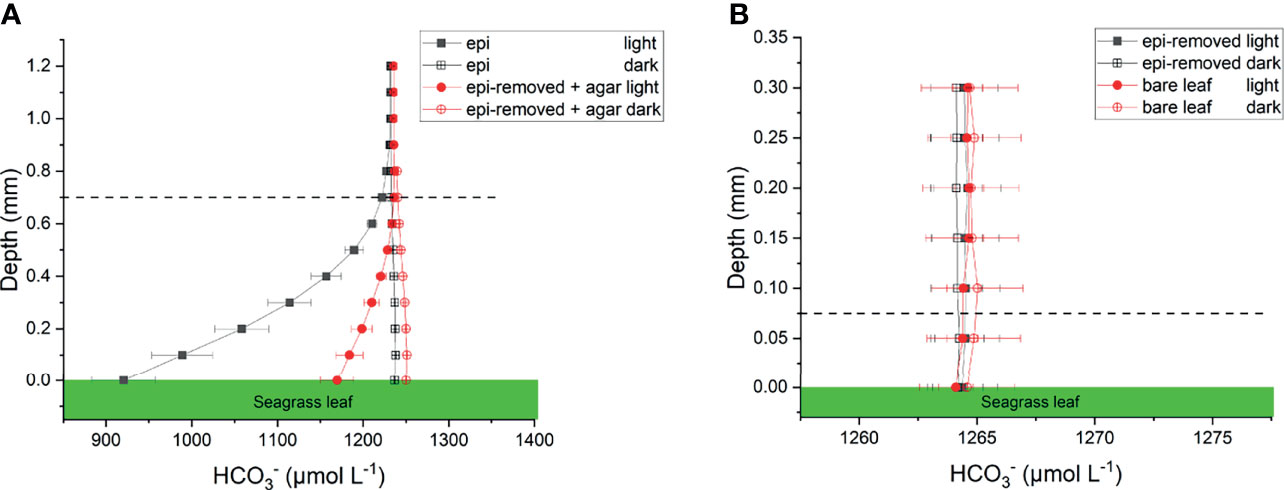
Figure 5 Calculated profiles on seagrass leaves with epiphytes (epi) and leaves where epiphytes were removed (epi-removed) and covered with agar (A), as well as on bare leaves and leaves where epiphytes were, removed (B) in darkness (0 μmol photons m -2 s-1) and light (230 μmol photons m -2 s-1). The error bars indicate SEM; n =15 (replicates with epi, epi-removed and epi-removed + agar), n =12 (bare leaves). Calculated based on measured pH microprofiles and total DIC measurements in seawater. Note the different scale on the x- and y-axis between panels. Dashed line indicates the total diffusion distance (i.e., the surface of the leaf, biofilm or ager + the diffusive boundary layer).
The concentration decreased from 1235 ± 35 to 920 ± 37 μmol L-1 through the active epiphytic biofilm in the light, as compared to a leaf surface concentration of 1170 ± 19 μmol L-1 under the inactive biofilm and 1264 ± 2 umol L-1 on the bare leaf surface (Figure 5 and Table 1). The accounted for 91.4 and 96.7% of the total inorganic carbon flux into the seagrass leaf under the artificial inactive biofilm and active epiphytic biofilm, respectively (Figures 6B, D and Table 1). Furthermore, the total inorganic carbon flux (i.e., the sum of CO2 and fluxes) was 234 ± 8 nmol cm-2 h-1 on leaves with epiphytes, which was 4.6-fold higher compared to the flux on leaves with artificial inactive biofilm (p<0.001), and was consistent with the influx was 4.9-fold higher than in leaves with inactive biofilm (p<0.001, Figures 6C, D and Tables 1, 2).
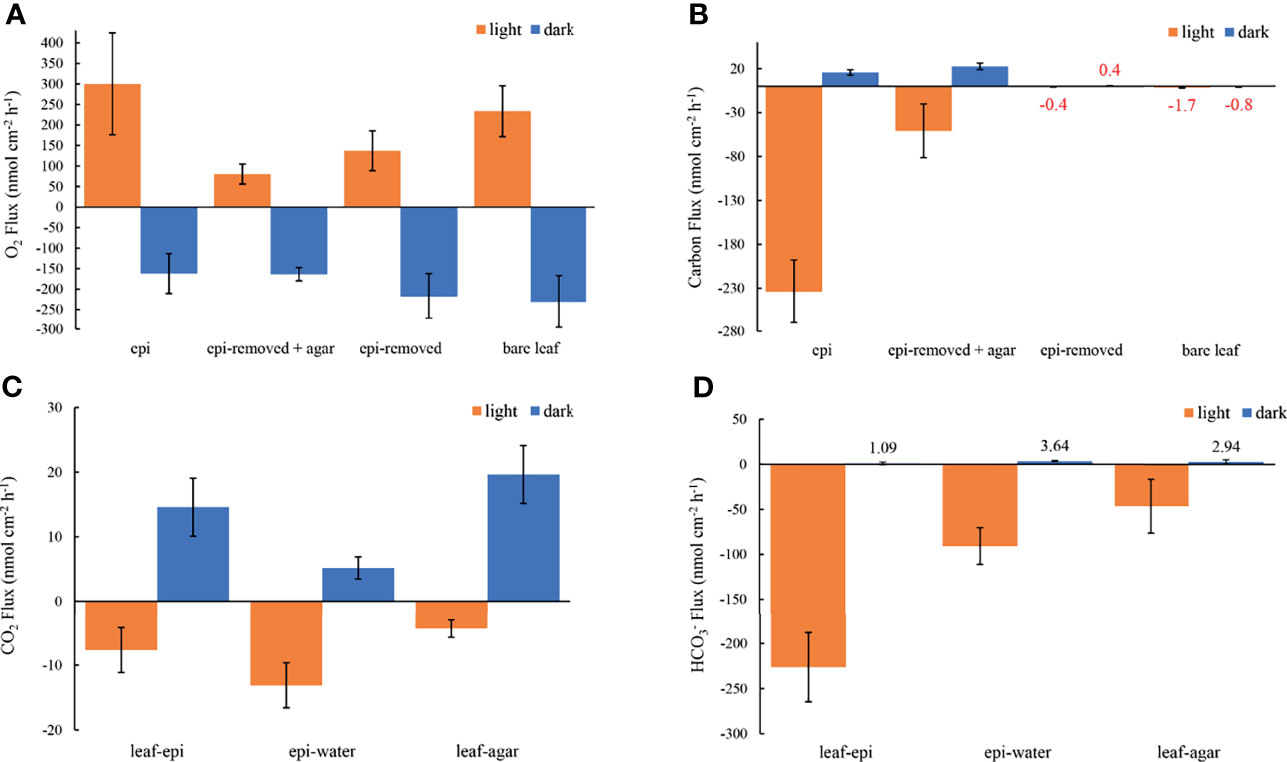
Figure 6 Measured O2 fluxes at seagrass leaf surfaces (A), the estimated carbon fluxes as the sum of CO2 and fluxes at leaf surfaces (B), the estimated CO2 fluxes and fluxes from leaf to epiphyte, from epiphyte to water and from leaf to agar (C, D, respectively) in darkness (0 μmol photons m -2 s-1, blue) and light (230 μmol photons m -2 s-1, orange). The error bars indicate the confidence interval of 95% confidence level according to the Student’s t distribution; n =15 (replicates with epi, epi-removed and epi-removed + agar), n =12 (bare leaves). Positive values denote efflux and negative values denote influx across the respective interface. Note in panel b, that it was not really possible to calculate the total carbon flux for leaves with the epiphytes removed and for the bare leaves, both with very thin DBLs, due to the limited spatial resolution of the pH microsensor (mean values are marked with red color code).
For the CO2 and calculation, we assumed a constant DIC concentration and that the carbonate system was in equilibrium within the biofilm/ager. However, as the CO2 was rapidly produced or consumed and the equilibrium between CO2 and is slow, the carbonate system may be out of equilibrium in the steep gradient along the biofilm (because of different diffusivities of CO2 and ; i.e., diffusion coefficient of 1.5274·10-5 cm2 s-1 for CO2 and 0.9689·10-5 cm2 s-1 for at experimental temperature and salinity), which could induce an error to the calculations (De Beer et al., 1997). Therefore, the pH measurements were first conducted when the pH signal was stable to minimize this uncertainty (e.g., De Beer et al., 2000; Brodersen et al., 2020a).
Epiphytic Microenvironment and Leaf Photosynthesis
The leaf epiphyte community showed higher net photosynthetic rates as compared to leaves with inactive biofilm, where the oxygen flux of leaves with inactive biofilm was 31% of the leaf with active biofilm (p=0.008; Figure 6A and Tables 1, 2). The photosynthesis of the microbial community thus composed most of the oxygen production in the seagrass leaf microenvironment (about 69%); which might actually be underestimated as the epiphyte micro-understory is receiving less light of lower quality owing to shading effects and predominantly blue and red light absorption in the uppermost part of the natural epiphytic biofilm (Brodersen et al., 2015a; Brodersen and Kühl, 2022). The oxygen concentration profiles and oxygen flux were almost the same in active and inactive biofilm during darkness (p=0.287; Figures 2A, 6A and Tables 1, 2), indicating that the activity of the microbial community in the epiphytic biofilm contributed little to the respiration of the combined leaf/epiphyte community. The oxygen concentration gradient was thus mainly formed because of the effect of the TDD on molecular diffusion in our experiments. The apparent low dark respiration in the natural biofilm could be due to low bacterial biomass and/or that dark respiration often only accounts for ~10% of photosynthesis rates at light-saturation in microalgae (Geider & Osborne, 1989), and we note that other epiphytic biofilms might show a stronger effect on O2 availability for the seagrass leaf in darkness due to higher respiration rates.
The total inorganic carbon influxes across the seagrass leaves were of similar magnitude as the corresponding oxygen effluxes for leaves with epiphytes and leaves with inactive biofilm in the light (i.e., CO2/O2 flux ratios of about 0.90 and 0.63, respectively) (Figures 6A, B and Table 1). However, the CO2 influxes were only 3.0% and 5.4% of oxygen effluxes for leaves with active epiphytic biofilm and leaves with inactive biofilm, respectively (Figures 6A, C and Table 1); i.e., similar to findings in a previous study on Z. marina leaves with epiphytic biofilms (Brodersen et al., 2020a) and other marine organisms like symbiont-bearing foraminifera (Köhler-Rink and Kühl, 2005) and corals (De Beer et al., 2000). Some of this discrepancy can be explained by (1) that O2 acts as an alternative electron acceptor to CO2 in photosynthesis via photorespiration in Z. marina plants (Buapet and Björk, 2016), and/or (2) that the O2/CO2 ratio at the site of RuBisCo differs from the leaf surface concentrations and fluxes due to internal carbon concentration mechanisms involving enhanced local enzymatic dehydration of to CO2 facilitated by CA, (Köhler-Rink and Kühl, 2005; De Beer et al., 2000), as well as CO2 supply mechanism likely involving the aerenchyma. The leaf or leaf/epiphytes community thus consumed CO2 rapidly in light, and especially the natural active biofilm strongly impeded CO2 supply from the bulk seawater to the underlying leaf, causing low CO2 concentration and low CO2 influxes into seagrass leaves with epiphytes. Such DIC competition between plants and epiphytic biofilms is similar to other aquatic plants (e.g., Jones et al., 2002; Wijewardene et al., 2022) and makes seagrass highly dependent onutilization. The low CO2 availability limits seagrass leaf photosynthesis (Figure 6A) when comparing the O2 production of epiphyte-removed leaves and the epiphyte-removed and agar encapsulated (i.e., inactive biofilm) leaves, which both excluded microbial activity. Here, the O2 efflux on epiphyte-removed leaves was 1.7-fold higher than from the leaves with inactive biofilms (p=0.016; Figure 6A and Tables 1, 2), which can be attributed to the reduced-CO2 leaf microenvironment. Furthermore, the O2 efflux of epiphyte-removed leaves was only 58% compared to natural bare leaves (p=0.005; Figure 6A and Tables 1, 2) indicating that leaves under epiphytic biofilms were of lower fitness and health; although the respiration was of similar order of magnitude (p=0.364; Figure 6A and Tables 1, 2).
The activity of epiphytic biofilm thus results in dramatic changes in the seagrass leaf microenvironment, as O2 concentration and pH increased in light, and most DIC (73.2-98.2%) facilitated by CA existed in the form of within the basified phyllosphere. Most seagrasses including Zostera marina L. are able to utilizeas source of inorganic carbon in photosynthesis (Koch et al., 2013), and our results showed that the influx was 29.5-fold higher than the CO2 influx in light, accounting for 96.7% of the total inorganic carbon influx to the leaf surface under the active biofilm (Figures 6B, C and Table 1). However, the direct uptake of and intracellular conversion of to CO2 or extracellular conversion by extracellular carbonic anhydrase are all energy-consuming CO2 concentration mechanisms (CCM), reducing the efficiency of carbon assimilation and energy storage (Lucas, 1985; Larkum et al., 1989; Larsson and Axelsson, 1999; Hellblom et al., 2001; Beer et al., 2002; Hellblom and Axelsson, 2003). Another energy-expensive potential CCM is using proton pumps to locally acidify the leaf surface, which for seagrasses have been suggested several times in previous studies (e.g., Beer et al., 2002; Borum et al., 2016). Here, the hypothesis is that acid zones on the leaf surface of marine plants increase the CO2 availability for photosynthesis-driven carbon fixation through local stimulation of CO2 formation, via low-pH driven conversion of to CO2, within the leaf diffusive boundary layers by proton (H+) extrusion (Beer et al., 2002). However, our detailed pH measurements in high spatiotemporal resolution (~0.1 mm) within the leaf DBL did not show any indications of a general acidification of the seagrass leaf DBL as a possible CO2 concentration mechanism (Figure 3); even not in the pH measurements on leaves with agar that artificially increased the TDD and thereby allowed for several point measurements with the pH microsensor within the artificially increased proton diffusion pathway. However, if such leaf surface acidification mechanism, exists, as indicated by utilizing pH buffers in previous studies (Larkum et al., 2017), it must be very localized within separated leaf micro-acid zones. In darkness, the respiration of seagrass leaves and epiphytic biofilm lead to hypoxic conditions on the leaf surface driven by the DBL and TDD decreasing the diffusive O2 supply from the surrounding water to the plant. Such decreased availability of oxygen makes seagrass more susceptible to suffocation and H2S intrusion from the surrounding sediment due to restricted intra-diffusional O2 transport to below-ground tissues via the aerenchyma (Brodersen et al., 2015b). Under global warming, such inadequate internal tissue and rhizosphere aeration may be further aggravated owing to temperature-induced enhanced epiphyte and leaf respiration.
In a previous study of epiphytic biofilms on Z. marina L., the pH reached 9.6 in a very dense and thick epiphytic biofilm (1.2 mm) in the light (300 μmol photons m -2 s-1), and CO2 microsensor measurements showed that the CO2 concentration decreased to 0 μmol L-1 ~0.2 mm above the leaf surface, which is consistent with our measurements and calculations (Brodersen et al., 2020a). High O2 and low CO2 concentrations on the leaf surface reduce the O2 efflux and CO2 influx, causing O2 accumulation intracellularly and low intracellular CO2 concentrations, which impede leaf photosynthesis and enhance photorespiration (Mass et al., 2010), thus representing a threat to seagrass photosynthetic performance and overall health (Sand‐Jensen et al., 1992; Raven et al., 2014; Buapet and Björk, 2016). Furthermore, a previous study demonstrated reduced seagrass gross photosynthetic rates at high pH, high O2 and low DIC seawater, with a maximum decrease in gross photosynthetic rate of 75% detected in Zostera marina; thus, further supporting our finding that the basified leaf microenvironment induced by epiphytic biofilms in the light has strong negative impacts on seagrass leaf photosynthesis (Buapet et al., 2013). Combined with increased respiration under global warming, such epiphyte-induced reduced leaf photosynthesis may lead to a negative oxygen and carbon balance in exposed seagrass plants; putting key ecosystem services at risk of ceasing. Eutrophication stimulates epiphytic biofilm overgrowth of seagrass leaves (Borum, 1985), where a previous study has shown 3 to 5-fold higher epiphyte biomass in nitrogen and phosphorus-enriched seawater compared to ambient seawater (Jaschinski and Sommer, 2008). Coastal eutrophication is therefore likely to put more stress on exposed seagrass meadows. However, it is important to mention that epiphytes can also be beneficial to the plant hosts. Microorganisms, can e.g., facilitate uptake of dissolved organic nitrogen by seagrass leaves (Tarquinio et al., 2018).
In conclusion, we found that microbial activity in epiphytic biofilms mostly affected the seagrass leaf chemical microenvironment in the light: causing (1) high O2 and pH conditions and (2) strong consumption of inorganic carbon, which leads to low carbon availability for the seagrass plant. Furthermore, leaves with the epiphytes removed produced less oxygen than the bare leaf and thus exhibited lower photosynthetic capacity. In the basified phyllosphere, the relatively low CO2 concentration and thus intensified demand for energy-requiringutilization limited leaf photosynthesis, and the high O2 and low CO2 concentration in the cell will increase photorespiration and further reduce the photosynthetic efficiency. In eutrophic coastal waters, the overgrowth of seagrass leaves with epiphytic biofilm resulting in thicker TDD and strong microbial activity can thus lead to intense diurnal changes in the seagrass leaf chemical microenvironment that can have negative impacts on seagrass performance and therefore is a potential hazard for seagrass fitness and vital ecosystem function.
Data Availability Statement
The original contributions presented in the study are included in the article/supplementary material. Further inquiries can be directed to the corresponding author.
Author Contributions
KB and MK designed experiments and provided essential infrastructure. QZ performed the experiments and analyzed the data (supervised by KB). QZ wrote the manuscript with editorial help from all co-authors. All authors have given approval to the final version of the manuscript.
Funding
This research project was funded by grants from the Villum Foundation (KB; 00028156) and the Independent Research Fund Denmark (MK; DFF-8021-00308B).
Conflict of Interest
The authors declare that the research was conducted in the absence of any commercial or financial relationships that could be construed as a potential conflict of interest.
Publisher’s Note
All claims expressed in this article are solely those of the authors and do not necessarily represent those of their affiliated organizations, or those of the publisher, the editors and the reviewers. Any product that may be evaluated in this article, or claim that may be made by its manufacturer, is not guaranteed or endorsed by the publisher.
Acknowledgments
We thank Nikola Medic, Victoria Thuesen, Mary Gonzales and Cecilie Appeldorff (UCPH) for technical assistance.
References
Beer S., Bjork M., Hellblom F., Axelsson L. (2002). Inorganic Carbon Utilization in Marine Angiosperms (Seagrasses). Funct. Plant Biol. 29, 349–354. doi: 10.1071/PP01185
Borum J. (1985). Development of Epiphytic Communities on Eelgrass (Zostera Marina) Along a Nutrient Gradient in a Danish Estuary. Mar. Biol. 87 (2), 211–218. doi: 10.1007/BF00539431
Borum J., Pedersen O., Kotula L., Fraser M. W., Statton J., Colmer T. D., et al. (2016). Photosynthetic Response to Globally Increasing CO2 of Co-Occurring Temperate Seagrass Species. Plant Cell Environ. 39 (6), 1240–1250. doi: 10.1111/pce.12658
Brodersen K. E., Koren K., Revsbech N. P., Kühl M. (2020a). Strong Leaf Surface Basification and CO2 Limitation of Seagrass Induced by Epiphytic Biofilm Microenvironments. Plant Cell Environ. 43 (1), 174–187. doi: 10.1111/pce.13645
Brodersen K. E., Kühl M. (2022). Effects of Epiphytes on the Seagrass Phyllosphere. Front. Mar. Sci. 9, 821614. doi: 10.3389/fmars.2022.821614
Brodersen K. E., Kühl M., Trampe E., Koren K. (2020b). Imaging O2 Dynamics and Microenvironments in the Seagrass Leaf Phyllosphere With Magnetic Optical Sensor Nanoparticles. Plant J. 104 (6), 1504–1519. doi: 10.1111/tpj.15017
Brodersen K. E., Lichtenberg M., Paz L. C., Kühl M. (2015a). Epiphyte-Cover on Seagrass (Zostera Marina L.) Leaves Impedes Plant Performance and Radial O2 Loss From the Below-Ground Tissue. Front. Mar. Sci. 2, 58. doi: 10.3389/fmars.2015.00058
Brodersen K. E., Nielsen D. A., Ralph P. J., Kühl M. (2014). A Split Flow Chamber With Artificial Sediment to Examine the Below-Ground Microenvironment of Aquatic Macrophytes. Mar. Biol. 161 (12), 2921–2930. doi: 10.1007/s00227-014-2542-3
Brodersen K. E., Nielsen D. A., Ralph P. J., Kühl M. (2015b). Oxic Microshield and Local P H Enhancement Protects Zostera Muelleri From Sediment Derived Hydrogen Sulphide. N. Phytol. 205 (3), 1264–1276. doi: 10.1111/nph.13124
Buapet P., Björk M. (2016). The Role of O2 as an Electron Acceptor Alternative to CO2 in Photosynthesis of the Common Marine Angiosperm Zostera Marina L. Photosynth. Res. 129 (1), 59–69. doi: 10.1007/s11120-016-0268-4
Buapet P., Rasmusson L. M., Gullström M., Björk M. (2013). Photorespiration and Carbon Limitation Determine Productivity in Temperate Seagrasses. PloS. One. 8 (12), e83804. doi: 10.1371/journal.pone.0083804
Cullen-Unsworth L. C., Unsworth R. (2018). A Call for Seagrass Protection. Science 361 (6401), 446–448. doi: 10.1126/science.aat7318
De Beer D., Glud A., Epping E., Kûhl M. (1997). A Fast-Responding CO2 Microelectrode for Profiling Sediments, Microbial Mats, and Biofilms. Limnol. Oceanogr. 42 (7), 1590–1600. doi: 10.4319/lo.1997.42.7.1590
De Beer D., Kühl M., Stambler N., Vaki L. (2000). A Microsensor Study of Light Enhanced Uptake and Photosynthesis in the Reef-Building Hermatypic Coral Favia sp. Mar. Ecol. Prog. Ser. 194, 75–85. doi: 10.3354/meps194075
Dickson A. G. (2010). The Carbon Dioxide System in Seawater: Equilibrium Chemistry and Measurements. Guide to Best Practices for Ocean Acidification Research and Data Reporting. (Luxembourg: Publications Office of the European Union). 1, 17–40. doi: 10.1016/0198-0149(87)90021-5
Dickson A. G., Millero F. J. (1987). A Comparison of the Equilibrium Constants for the Dissociation of Carbonic Acid in Seawater Media. Deep Sea Res. Part A Oceanogr. Res. Pap. 34 (10), 1733–1743. doi: 10.1016/0198-0149(87)90021-5
Drake L. A., Dobbs F. C., Zimmerman R. C. (2003). Effects of Epiphyte Load on Optical Properties and Photosynthetic Potential of the Seagrasses Thalassia testudinum Banks Ex König and Zostera marina L. Limnol. Oceanogr. 48 (1part2), 456–463. doi: 10.4319/lo.2003.48.1_part_2.0456
Duarte C. M., Middelburg J., Caraco N. (2005). Major Role of Marine Vegetation on the Oceanic Carbon Cycle. Biogeosciences 2, 1–8. doi: 10.5194/bg-2-1-2005
Fourqurean J. W., Duarte C. M., Kennedy H., Marba N., Holmer M., Mateo M. A., et al. (2012). Seagrass Ecosystems as a Globally Significant Carbon Stock. Nat. Geosci. 5 (7), 505–509. doi: 10.1038/ngeo1477
Geider R. J., Osborne B. A. (1989). Respiration and Microalgal Growth: A Review of the Quantitative Relationship Between Dark Respiration and Growth. N. Phytol. 112 (3), 327–341. doi: 10.1111/j.1469-8137.1989.tb00321.x
Hellblom F., Axelsson L. (2003). External Dehydration Maintained by Acid Zones in the Plasma Membrane Is An Important Component of the Photosynthetic Carbon Uptake in Ruppia cirrhosa. Photosynth. Res. 77, 173–181. doi: 10.1023/A:1025809415048
Hellblom F., Beer S., Björk M., Axelsson L. (2001). A Buffer Sensitive Inorganic Carbon Utilization System in Zostera marina. Aquat. Bot. 69, 55–62. doi: 10.1016/S0304-3770(00)00132-7
Hurd C. L. (2000). Water Motion, Marine Macroalgal Physiology, and Production. J. Phycol. 36 (3), 453–472. doi: 10.1046/j.1529-8817.2000.99139.x
Jørgensen B. B., Des Marais D. J. (1990). The Diffusive Boundary Layer of Sediments: Oxygen Microgradients Over a Microbial Mat. Limnol. Oceanogr. 35 (6), 1343–1355. doi: 10.4319/lo.1990.35.6.1343
Jørgensen B. B., Revsbech N. P. (1985). Diffusive Boundary Layers and the Oxygen Uptake of Sediments and Detritus 1. Limnol. Oceanogr. 30 (1), 111–122. doi: 10.4319/lo.1985.30.1.0111
Jaschinski S., Sommer U. (2008). Top-Down and Bottom-Up Control in an Eelgrass–Epiphyte System. Oikos 117 (5), 754–762. doi: 10.1111/j.0030-1299.2008.16455.x
Jones J. I., Young J. O., Eaton J. W., Moss B. (2002). The Influence of Nutrient Loading, Dissolved Inorganic Carbon and Higher Trophic Levels on the Interaction Between Submerged Plants and Periphyton. J. Ecol. 90 (1), 12–24. doi: 10.1046/j.0022-0477.2001.00620.x
Koch E. (1994). Hydrodynamics, Diffusion-Boundary Layers and Photosynthesis of the Seagrasses Thalassia Testudinum and Cymodocea Nodosa. Mar. Biol. 118 (4), 767–776. doi: 10.1007/BF00347527
Koch M., Bowes G., Ross C., Zhang X. H. (2013). Climate Change and Ocean Acidification Effects on Seagrasses and Marine Macroalgae. Global Change Biol. 19, 103–132. doi: 10.1111/j.1365-2486.2012.02791.x
Köhler-Rink S., Kühl M. (2005). The Chemical Microenvironment of the Symbiotic Planktonic Foraminifer Orbulina Universa. Mar. Biol. Res. 1 (1), 68–78. doi: 10.1080/17451000510019015
Larkum A. W. D., Davey P. A., Kuo J., Ralph P. J., Raven J. A. (2017). Carbon-Concentrating Mechanisms in Seagrasses. J. Exp. Bot. 68 (14), 3773–3784. doi: 10.1093/jxb/erx206
Larkum A. W. D., Roberts G., Kuo J., Strother S. (1989). “Gaseous Movement in Seagrasses,” in Biology of Seagrasses. A Treatise on the Biology of Seagrasses with Special Reference to the Australian Region (Amsterdam: Elsevier Science Publishers BV), 686–722.
Larsson C., Axelsson L. (1999). Bicarbonate Uptake and Utilization in Marine Macroalgae. Eur. J. Phycol. 34, 79–86. doi: 10.1080/09670269910001736112
Lemmens J. W. T. J., Clapin G., Lavery P., Cary J. (1996). Filtering Capacity of Seagrass Meadows and Other Habitats of Cockburn Sound, Western Australia. Mar. Ecol. Prog. Ser. 143, 187–200. doi: 10.3354/meps143187
Lucas W. J., Berry J. A. (1985). Inorganic Carbon Uptake by Aquatic Photosynthetic Organisms Physiol. Plant. 65 (1985), 539–543. doi: 10.1111/j.1399-3054.1985.tb08687.x
Mass T., Genin A., Shavit U., Grinstein M., Tchernov D. (2010). Flow Enhances Photosynthesis in Marine Benthic Autotrophs by Increasing the Efflux of Oxygen From the Organism to the Water. Proc. Natl. Acad. Sci. 107 (6), 2527–2531. doi: 10.1073/pnas.0912348107
McKenzie L. J., Nordlund L. M., Jones B. L., Cullen-Unsworth L. C., Roelfsema C., Unsworth R. K. (2020). The Global Distribution of Seagrass Meadows. Environ. Res. Lett. 15 (7), 074041. doi: 10.1088/1748-9326/ab7d06
Mehrbach C., Culberson C. H., Hawley J. E., Pytkowicx R. M. (1973). Measurement of the Apparent Dissociation Constants of Carbonic Acid In Seawater at Atmospheric Pressure. Limno.Oceanogr 18 (6), 897–907. doi: 10.4319/lo.1973.18.6.0897
Millero F. J. (2010). Carbonate Constants for Estuarine Waters. Mar. Freshw. Res. 61 (2), 139–142. doi: 10.1071/MF09254
Noisette F., Depetris A., Kühl M., Brodersen K. E. (2020). Flow and Epiphyte Growth Effects on the Thermal, Optical and Chemical Microenvironment in the Leaf Phyllosphere of Seagrass (Zostera Marina). J. R. Soc. Inter. 17 (171), 20200485. doi: 10.1098/rsif.2020.0485
Raven J. A., Beardall J., Giordano M. (2014). Energy Costs of Carbon Dioxide Concentrating Mechanisms in Aquatic Organisms. Photosynth. Res. 121, 111–124. doi: 10.1007/s11120-013-9962-7
Ruesink J. L. (2016). Epiphyte Load and Seagrass Performance are Decoupled in an Estuary With Low Eutrophication Risk. J. Exp. Mar. Biol. Ecol. 481, 1–8. doi: 10.1016/j.jembe.2016.03.022
Sand-Jensen K. A. J. (1977). Effect of Epiphytes on Eelgrass Photosynthesis. Aquat. Bot. 3, 55–63. doi: 10.1016/0304-3770(77)90004-3
Sand-Jensen K. A. J., Pedersen M. F., Nielsen S. L. (1992). Photosynthetic Use of Inorganic Carbon Among Primary and Secondary Water Plants in Streams. Freshw. Biol. 27 (2), 283–293. doi: 10.1111/j.1365-2427.1992.tb00540.x
Short F. T., Short C. A. (1984). “The Seagrass Filter: Purification of Estuarine and Coastal Waters,” in The Estuary as a Filter (Cambridge, Massachusetts: Academic Press), p. 395–413.
Tarquinio F., Bourgoure J., Koenders A., Laverock B., Säwström C., Hyndes G. A. (2018). Microorganisms Facilitate Uptake of Dissolved Organic Nitrogen by Seagrass Leaves. ISME J. 12 (11), 2796–2800. doi: 10.1038/s41396-018-0218-6
Terrados J., Borum J. (2004). “Why are Seagrasses Important? Goods and Services Provided by Seagrass Meadows,” in European Seagrasses (The M&MS Project), p. 8–10.
Unsworth R. K., Cullen-Unsworth L. C. (2017). Seagrass Meadows. Curr. Biol. 27 (11), R443–R445. doi: 10.1016/j.cub.2017.01.021
Waycott M., Duarte C. M., Carruthers T. J., Orth R. J., Dennison W. C., Olyarnik S., et al. (2009). Accelerating Loss of Seagrasses Across the Globe Threatens Coastal Ecosystems. Proc. Natl. Acad. Sci. 106 (30), 12377–12381. doi: 10.1073/pnas.0905620106
Wijewardene L., Wu N., Fohrer N., Riis T. (2022). Epiphytic Biofilms in Freshwater and Interactions With Macrophytes: Current Understanding and Future Directions. Aquat. Bot. 176, 103467. doi: 10.1016/j.aquabot.2021.103467
Keywords: biofilm, carbon, pH, photosynthesis, seagrass
Citation: Zhang Q, Kühl M and Brodersen KE (2022) Effects of Epiphytic Biofilm Activity on the Photosynthetic Activity, pH and Inorganic Carbon Microenvironment of Seagrass Leaves (Zostera marina L.). Front. Mar. Sci. 9:835381. doi: 10.3389/fmars.2022.835381
Received: 14 December 2021; Accepted: 14 March 2022;
Published: 10 May 2022.
Edited by:
Tilmann Harder, University of Bremen, GermanyReviewed by:
Christina C. Roggatz, University of Hull, United KingdomPimchanok Buapet, Prince of Songkla University, Thailand
Copyright © 2022 Zhang, Kühl and Brodersen. This is an open-access article distributed under the terms of the Creative Commons Attribution License (CC BY). The use, distribution or reproduction in other forums is permitted, provided the original author(s) and the copyright owner(s) are credited and that the original publication in this journal is cited, in accordance with accepted academic practice. No use, distribution or reproduction is permitted which does not comply with these terms.
*Correspondence: Kasper Elgetti Brodersen, a2FzcGVyLmVsZ2V0dGkuYnJvZGVyc2VuQGJpby5rdS5kaw==