 Kasper Hancke
 Svein Kristiansen
 Lars Chresten Lund-Hansen
- 1Section for Marine Biology, Norwegian Institute for Water Research, Oslo, Norway
- 2Department of Arctic and Marine Biology, UiT - The Arctic University of Norway, Tromsø, Norway
- 3Arctic Research Center & Aquatic Biology, Department of Biology, Aarhus University, Aarhus, Denmark
Arctic summer sea ice extent is decreasing and thinning, forming melt ponds that cover more than 50% of the sea ice area during the peak of the melting season. Despite of this, ice algal communities in melt ponds are understudied and so are their contribution to the Arctic Ocean primary production and carbon turnover. While melt ponds have been considered as low productive, recent studies suggest that accumulated ice algal potentially facilitate high and yet overlooked rates of carbon turnover. Here we report on ice algal communities forming dense mats not previously described, collected from melt ponds in the northern Barents Sea in July. We document on distinct layered and brown colored mats with high carbon assimilation and net primary production rates compared to ice algal communities and aggregates, in fact comparable to benthic microalgae at temperate tidal flats. Rates of gross and net primary production, as well as community respiration rates were obtained from oxygen micro profiling, and carbon assimilation calculations were supported by 14C incubations, pigment analysis and light microscopy examinations. The melt pond algal mats consisted of distinct colored layers and differed from aggregates with a consisted layered structure. We accordingly propose the term melt pond algal mats, and further speculate that these dense ice algal mats may provide an important yet overlooked source of organic carbon in the Arctic food-web. A foodweb component likely very sensitive to climate driven changes in the Arctic Ocean and pan-Arctic seas.
Introduction
Ice algae residing at the bottom of the sea ice and in brine channels contribute about 10% of the total marine-produced organic carbon in the Arctic Ocean (Arrigo, 2017). In the permanently ice covered central Arctic Ocean, their relative contribution is likely much higher and have been reported to 57% of the entire primary production (water column and sea ice, Gosselin et al., 1997). The total primary production in the central Arctic Ocean was in 1997 estimated to 15 g C m−2 year−1, a value upgraded more than 10 times relative to previously reports (English, 1961; Gosselin et al., 1997). More recently, the central Arctic primary production and net carbon fixation rates have been suggested to range from 1 to 25 g C m–2 year–1 comprising phytoplankton and sympagic ice algae productivity in and underneath the sea ice (Boetius et al., 2013). The contribution of ice algae is, however, not well constrained ranging from 0 to 80% (Boetius et al., 2013) and showing large variability (Campbell et al., 2022).
Timing of the ice algae production is crucial to the food web as being a key organic carbon source for higher trophic levels in permanently ice-covered regions and during ice-covered periods in early spring, when the pelagic productivity is low (Leu et al., 2015). For instance, it has been shown that 70 to 100% of polar bears’ (Ursus maritimus) carbon intake relied on sympagic production (Brown et al., 2018), stressing the importance of ice algae in sustaining the Arctic ecosystem. This production is generally located at or near the bottom of the sea ice (Arrigo, 2017), where ice algae have adapted to extreme low light conditions (Hancke et al., 2018). Also, ice algae have been demonstrated an important carbon source for the benthic food web in the deep-sea (Tamelander et al., 2009; Boetius et al., 2013; Lalande et al., 2019). In recent years, there has been an enhanced research focus on ice algae communities and algae aggregates (Katlein et al., 2015) which float below the sea ice (Assmy et al., 2013), in leads (Fernández-Méndez et al., 2014), and in melt ponds (Lee et al., 2011). The aggregates consist generally of agglutinated diatoms of the common Arctic diatom Melosira sp. and show comparatively high carbon production rates (Assmy et al., 2013).
Arctic marine ecosystems are experiencing dramatic environmental changes (Babin, 2020), including warming at rates two to four times faster than the global average (Meredith et al., 2019). This leads to thinning and loss of sea ice in the Arctic Ocean (Cavalieri and Parkinson, 2012; Wunderling et al., 2020), with pronounced consequences for ice algal productivity, carbon turnover, and the Arctic food web (Leu et al., 2015). Warming is also accelerating the formation of melt ponds, that have been estimated to cover more than 50-60% of the sea ice area during peak of the melting season (Lee et al., 2020). Despite of this, ice algae communities in melt ponds are understudied and so is their contribution to Arctic primary production and carbon turnover.
Here we report on ice algae mat-like communities not previously described in the Arctic, with the objective to quantify the rate of carbon assimilation and net primary production. The mats were collected from melt ponds in the northern Barents Sea in July, and observations are compared with published data on microalgal productivity. We speculate that these melt pond algal mats constitute an unexplored carbon source that could be important for the biogeochemical cycling in the Arctic Ocean.
Materials and Methods
Study Area, Sampling, and Experimental Setup
Clearly layered mats of dense microalgae communities, hereafter referred to as melt pond algal mats, were collected from sea ice melt ponds at N 82° 24.9 and E 30° 26.2 during a cruise in the Barents Sea in July 2004 (Figures 1A, B) as part of a large Arctic ecosystem research project (CABANERA, Wassman et al., 2008). The mats were initially between 3 and 10 cm wide but broke up in smaller pieces (1-3 cm across) during sampling even at gentle handling. The mats were 3.5 to 4 mm thick with distinct and coherent layers stacked in visually recognized brown colored layers (Figure 1C). The sea ice melt ponds from where the mats were sampled were open at the bottom, i.e. there was a free flow of water between the melt pond and the ocean below. The melt pond was located near the center of the ice floe characterized as pack ice due to the occurrence of ridges and hummocks, and ice thickness varied from 1 to 1.5 m. During the available time on the ice we collected 10 to 15 algal mats from five melt ponds on the same ice flow, that were subsequently brought back to the onboard lab. The mats was gently sampled in cleaned polyethylene containers with in situ water from the melt pond, having a salinity of 34.0 and a temperature of ~0°C. The sampling location is further described in Wassmann et al. (2008).
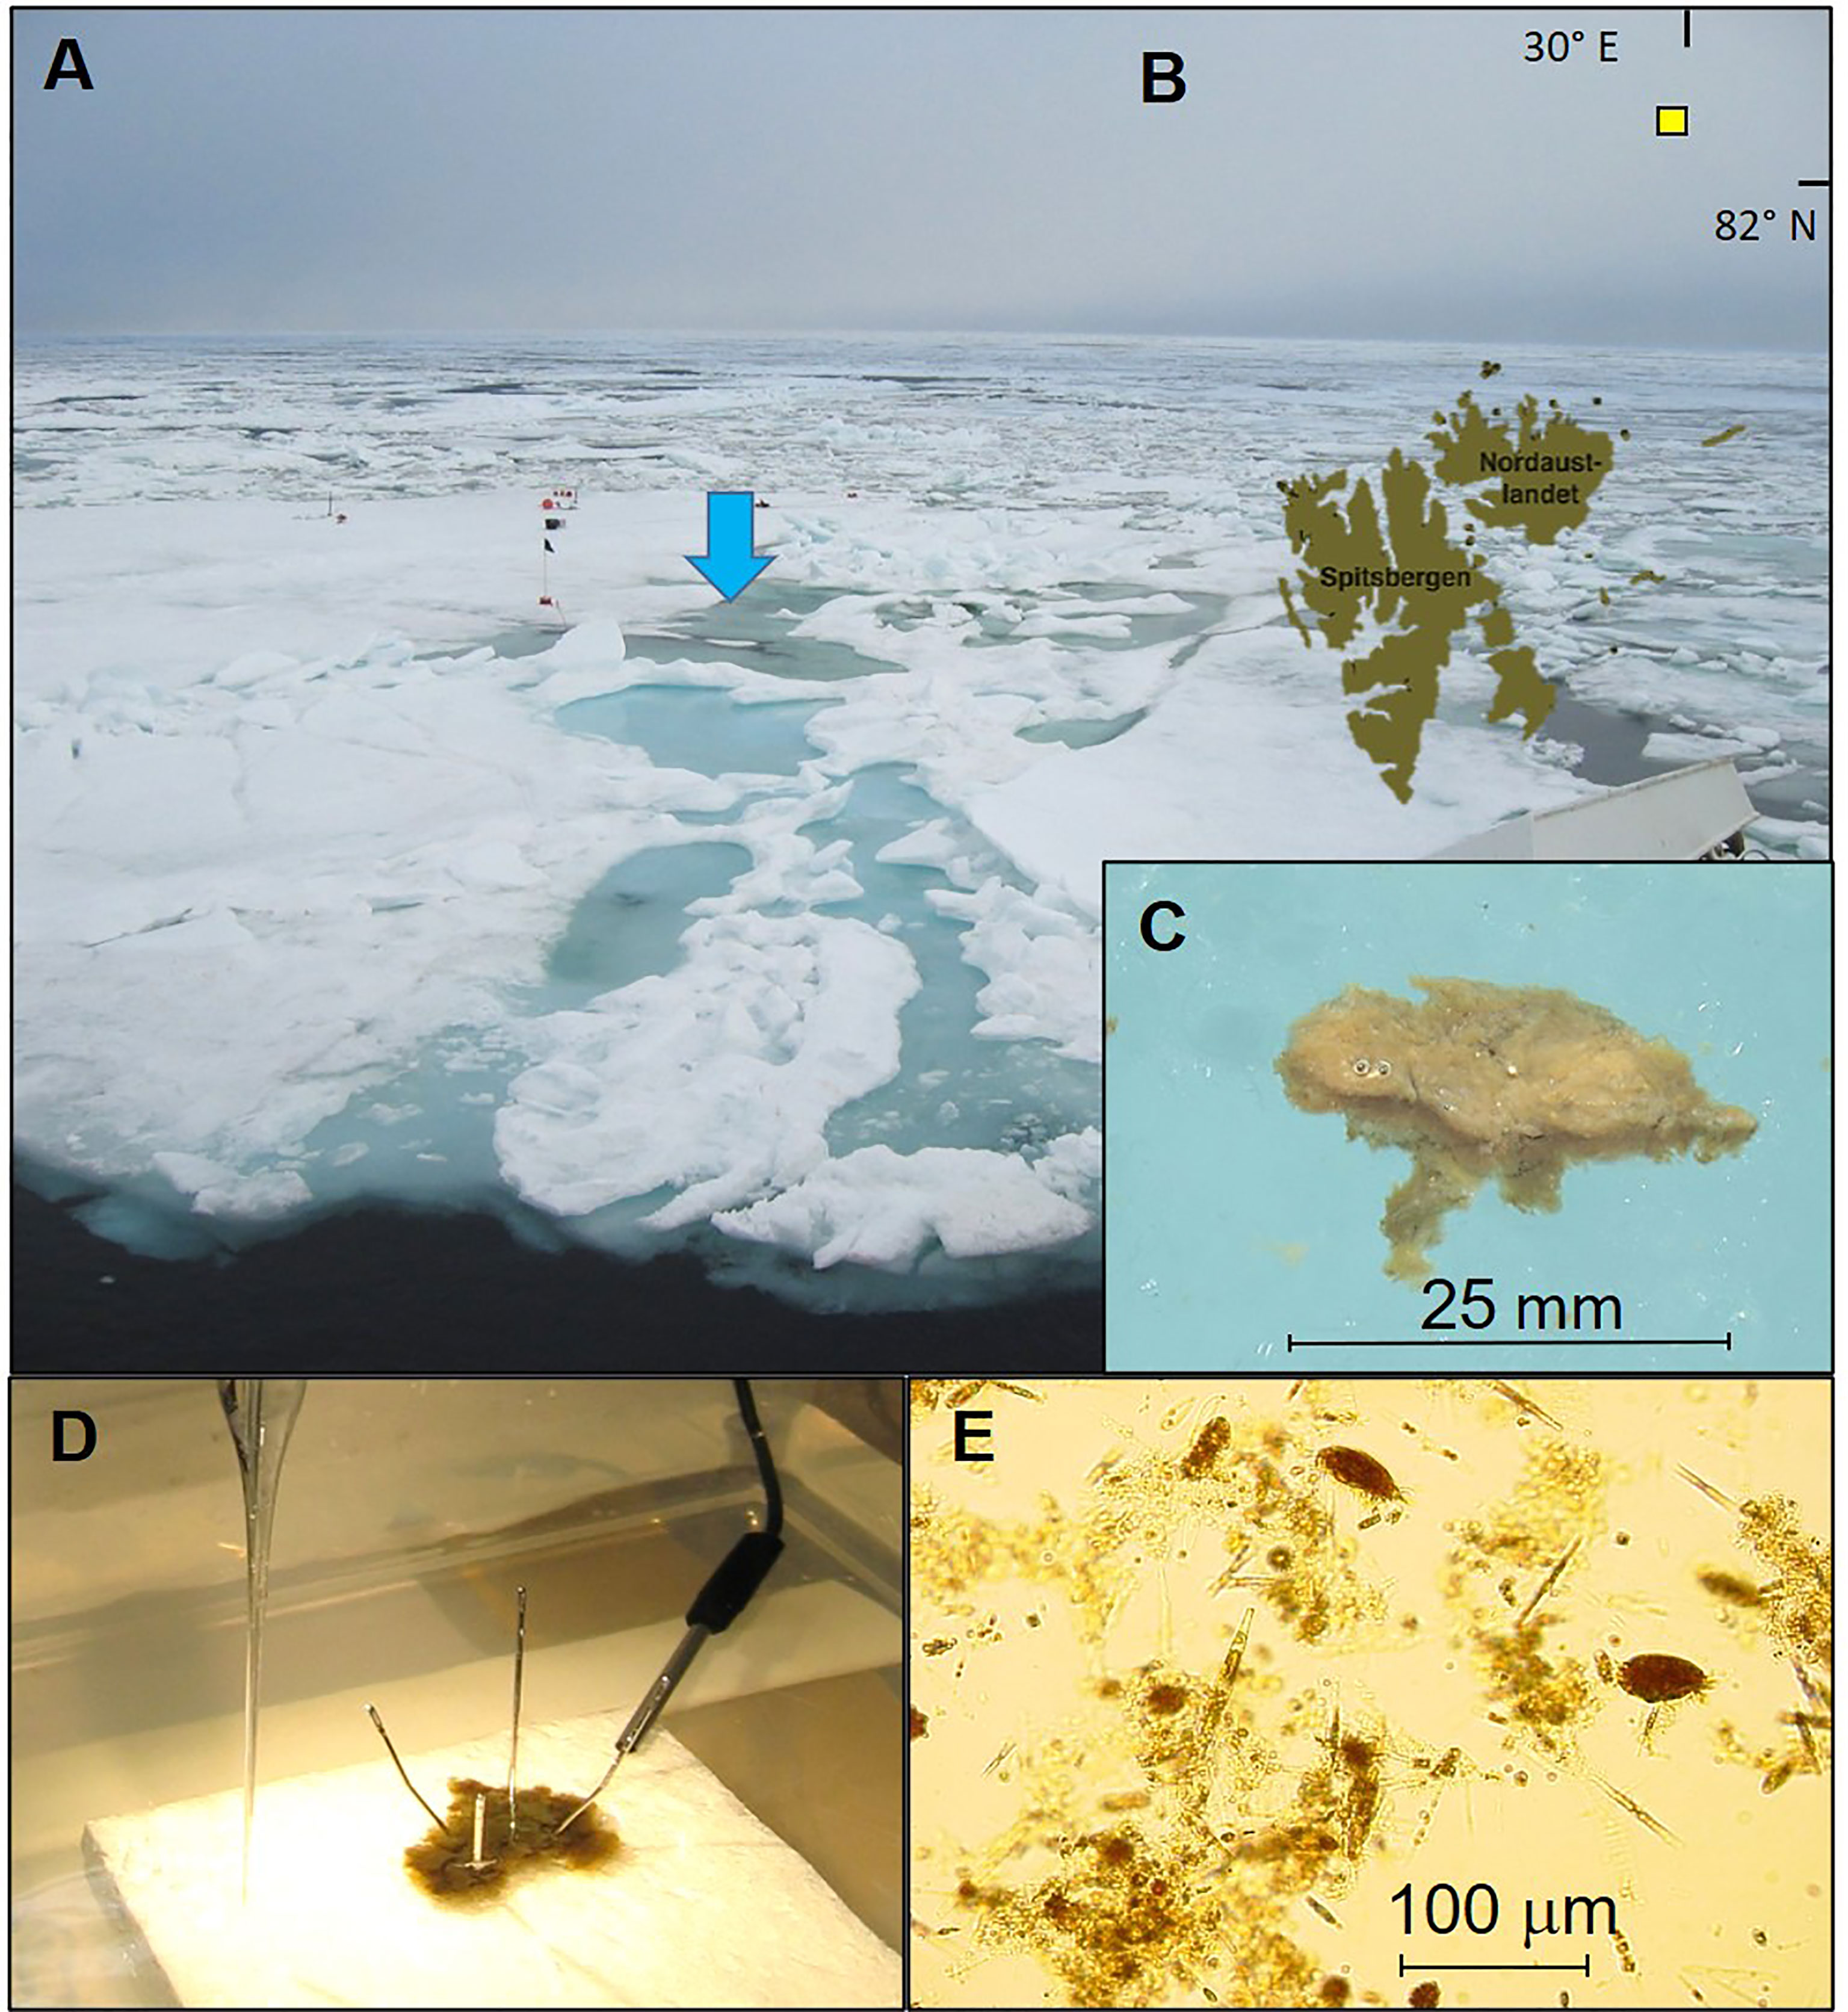
Figure 1 Ice floe at the sampling site where the ice algal mats were collected (marked with blue arrow) with open and closed melt ponds (A), and the sampling position at N 82° 24.9 marked with a yellow square in (B) to the NE of Svalbard. Close up of the sampled algal material that was recognized as brown-colored coherent mats with a clearly layered structure (C). The mats were initially between 3 and 10 cm wide but broke up in smaller pieces (1-3 cm across) during sampling and transport to the lab onboard the research vessel. An experimental setup with controlled temperature and light conditions were established to measure gross and net O2 production in the mats (D), that consisted of a complex community of microalgae and diverse grazers including ciliates (E). Photos by the authors (K. Hancke).
Photosynthesis and respiration rates were measured after installing intact pieces of the algal mat in a microcosm that mimicked the in situ conditions within half an hour after sampling (Figure 1D). Three mats were sequentially installed and measured in the microcosm. The microcosmos was established inside a cold room (2.0°C) on board the research vessel and the microcosms temperature was secured at 0°C using an additional cooling device, in a setup equivalent to what was used by Hancke and Glud (2004). The algal mat was carefully pinned to a white styrofoam plate submerged in the microcosms that mimicked the light reflection properties of sea ice and kept the mat in a fixed position during measurements. Flushing gently with an air pump ensured both a stable diffusive boundary layer (DBL) of 300 to 500 μm over the mat and keeping the oxygen (O2) concentration of the water at atmospheric saturation level. The mat surface was exposed to a photosynthetically active radiation (PAR) of 400 µmol photons m–2 s–1 during photosynthesis measurements by a halogen lamp with an optical fiber (Schott KL 1500). The irradiance was chosen to represent average light conditions in the melt ponds based on measured ambient light, which diel variations between 200 and 1200 µmol photons m–2 s–1 and an average of ~400 µmol photons m–2 s–1 at sampling time in July. Incident PAR was measured with a LiCor cosine-corrected quantum sensor and logger (LiCor LI-190SA, LiCor LI-1000, LiCor, US.).
Oxygen Production and Consumption
Oxygen micro profiles were measured using electrochemical O2 microsensors with a guard cathode (Revsbech, 1989) provided by RN Glud’s laboratory (University of Southern Denmark, DK). Gross and net photosynthesis, and dark community respiration were estimated from profiles measured using electrodes with tip diameters <15 μm, stirring sensitivity <1% and a 90% response time <0.5 s. Electrodes were calibrated by a 2-point calibration performed in both anoxic and air-saturated samples at ambient temperature. See Glud et al. (2000) and Hancke and Glud (2004) for additional details of the microsensor setup.
Gross photosynthesis was measured by the light-dark shift method (Revsbech and Jorgensen, 1983; Glud et al., 1992), by estimating the gross O2 production from the initial concentration decline after a sudden eclipse of light (triplicates, with 3 min intervals). Total gross photosynthesis of the mat was calculated from integrating stepwise measurements down through the mat. Gross O2 production was eventually converted to gross C fixation by multiplying with the molecular weight for C (12), the photosynthetic coefficient (1.4), and assuming 24h of daylight.
Rates of community net photosynthesis and dark respiration were calculated from the derived slope coefficient of the oxygen concentration profiles across the diffusive boundary layer and the top layer of the algal mat during light and dark, respectively (Jørgensen and Revsbech, 1985, Figure 2). Net photosynthesis equaled the flux of O2 out of the illuminated mat, while respiration equaled influx during darkness. The community net photosynthesis and respiration rates were calculated from the sum of the upward and downward flux rates, derived from the linear concentration gradient during steady-state conditions, using Fick’s first law of diffusion (Jørgensen and Revsbech, 1985). Rates were corrected for the molecular diffusion coefficient according to Broecker and Peng (1974) and for temperature and salinity (Li and Gregory, 1974). Oxygen profiles varied little laterally across several investigated mats pieces and all derived rates were obtained from triplicated profiling. Flux rate calculations and the underlying principles are further described in Jørgensen and Revsbech (1985); Kühl et al. (1996); Glud et al. (2002) and Hancke and Glud (2004).
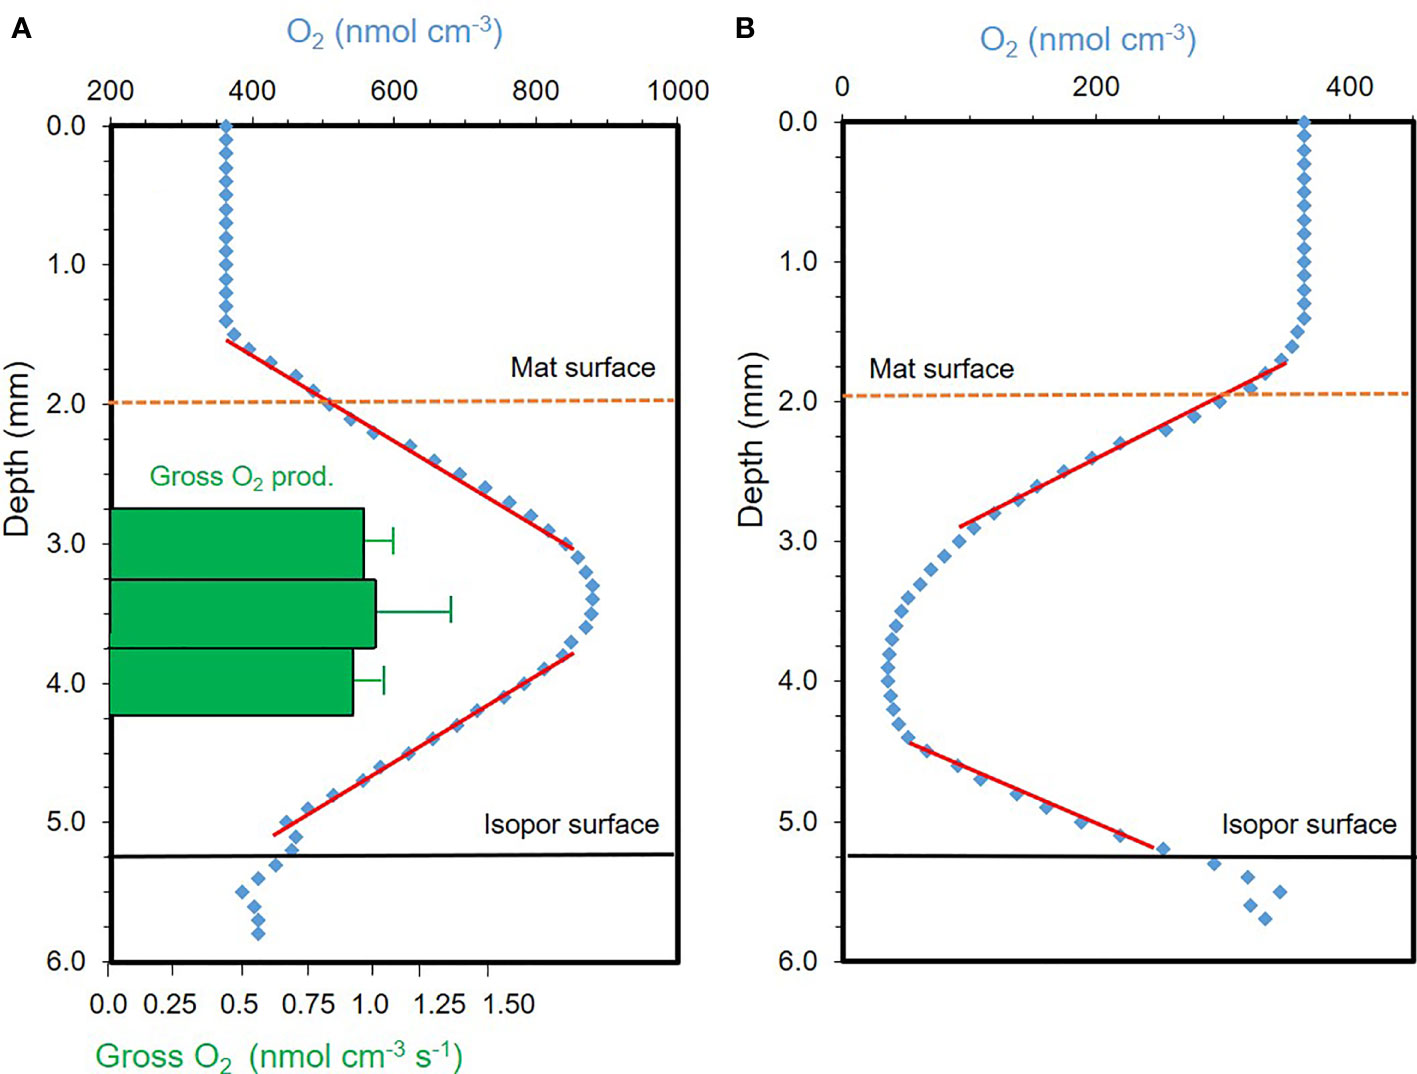
Figure 2 Steady state oxygen concentration profiles through melt pond algal mats (blue dots) collected from Arctic sea ice melt ponds in (A) light (400 µmol photons m–2 s–1), and (B) darkness, respectively. Net O2 production in the light, and dark O2 consumption was calculated from the derived slope coefficients (red lines), respectively. Green bars in (A) represent the depth-resolved gross oxygen production derived independently from the net production, by the light-dark method (see M&M). The oxygen concentration profiles demonstrated a pronounced oxygen consumption in the dark that was surpassed by the oxygen production in light, driven by the exceeding gross production.
14C Assimilation
Gross 14C fixation was measured using the benchmark 14C method (Stemann-Nielsen, 1952). Subsamples of the three mats were incubated for four hours in pre-filtered (GF/F microfiber filters, Whatman, US) in situ water in light (400 μmol photons m–2 s–1) and in dark polycarbonate bottles positioned in the microcosms, with a final concentration of 0.0125 μCi mL–1. Samples were subsequently filtered and immediately frozen onboard. Within 2 months filters were thawed, fumed with HCl acid for 8 hours, and 10 mL of Ultima GoldTM XP (Packard) were added before counting on a liquid scintillation analyzer with quench correction (PerkinElmer Tri-Carb 2900TR). The dark bottle values were subtracted from the light bottle values. The method is described in detail in Hodal and Kristiansen (2008), and the gross carbon fixation rate was corrected for total inorganic carbon based on Kivimae (2007).
Chlorophyll a, Carbon, and Nitrogen
Subsamples were taken by cutting cross sections from top to bottom of the mat and thus collecting pieces with known surface area and ensuring that the complete mat-structure was represented, and subsequently filtered on GF/F filters. Chlorophyll a (Chl a) was calculated from three subsamples extracted in MeOH (6h, 5°C, darkness) and measured absorbance at 665 nm, subtracting the absorbance at 750 nm, and using an extinction coefficient of 74.5 L g–1 cm–1 (Mackinney, 1941). The procedure is further described in Hancke et al. (2008). Likewise was particulate organic carbon (POC) analyzed following standard procedures after treatment of the samples with hydrochloric acid to remove the inorganic fraction using a Carlo Erba Elemental Analyzer (Model Na; Carlo Erba, Italy). Particulate organic nitrogen (PON) was analyzed according to Grasshoff et al. (1999) using a Scalar autoanalyzer (Scan Plus System, Netherlands). Mat wet and dry weights (dried in oven for >12h at 80°C) were determined to provide uniform measures and convert from areal to carbon units for gross photosynthesis measures.
Photosynthetic Pigments and Light Microscope Analysis
Pigment samples were stored at -80°C until analyzed using a Hewlett-Packard HPLC 1100 Series system, equipped with a quaternary pump system and diode array detector. Mat subsamples were extracted in MeOH overnight at –20°C, and pigments were separated in Waters Symmetry C8 column (150 × 4.6 mm, 3.5 μm particle size) according to Zapata et al. (2000) and modified by Rodriguez et al. (2006). The extract was re-filtered (Millipore 0.2 μm) to remove debris. Chlorophylls and carotenoids were quantified according to their absorbance (350-750 nm). Identification of pigments and specific extinction coefficients for quantification followed Jeffrey et al. (1999). Light microscope analysis was used to identify dominant algal groups and species along with characterizing the community of grazers in the mat, before and after addition of Lugol (Tomas, 1997).
Results
Dark Respiration, Net and Gross Photosynthesis in the Algal Mat
Steady state O2 concentration profiles through the mat showed distinct gradients from the water above to the center of the algal mat, which was almost mirrored from the mat center and downward to below the mat. In the light (Figure 2A), O2 concentration increased with depth until the center of the mat which indicated a photosynthetically active algal community with a high O2 production, that by far exceeded the respiratory O2 demand. At 400 µmol photons m–2 s–1, steady state O2 profiles showed concentrations of >800 nmol O2 cm-3 (equivalent to μmol O2 L–1) in the mat center, a more than doubled O2 concentration relative to the ambient level. In the dark (Figure 2B), the O2 concentration decreased from atmospheric saturation in the above water (363 nmol O2 cm-3) to <40 nmol O2 cm-3 at the center of the mat, about 1.5 to 2 mm into the mat. The steep decrease in the O2 concentration reflected a pronounced O2 consumption in the mat during darkness.
The mat net community production of O2 in light was 0.077 ± 0.008 nmol O2 cm–2 s–1 (n=3), equivalent to 798 ± 83.0 mg C m–2 d–1 (assuming a molar ratio for O2:C of 1:1 and a 24h day period equivalent to midnight sun, Figure 3). Algal mat community O2 consumption in the dark was 0.067 ± 0.0054 nmol O2 cm–2 s–1 (n=3), equivalent to 695 ± 55.6 mg C m–2 d–1. The photosynthetic gross O2 production was 0.101 ± 0.016 nmol O2 cm–2 s–1 (n=3), equal to 1467 ± 246 mg C m–2 d–1 (24h daylight, Figure 3). This measure was derived from the light-dark shift method and integrated over the center 1 mm thick photosynthetic zone in the mat (Figure 2A). The measure is independent of the net photosynthetic rate (Figure 3). Gross photosynthesis was in addition measured as the rate of gross 14C fixation in intact subsamples of the mat of a known area (~1.5 cm2) and weight. Gross 14C fixation equaled 2627 ± 305 mg C m–2 d–1 (n= 3). The 14C method showed gross carbon fixation rates more than twice as high as the measured gross O2 production, which demonstrates a highly productive photosynthetic community. The method is, however, sensitive to the precision of the determined area, in contrast to the microsensor results.
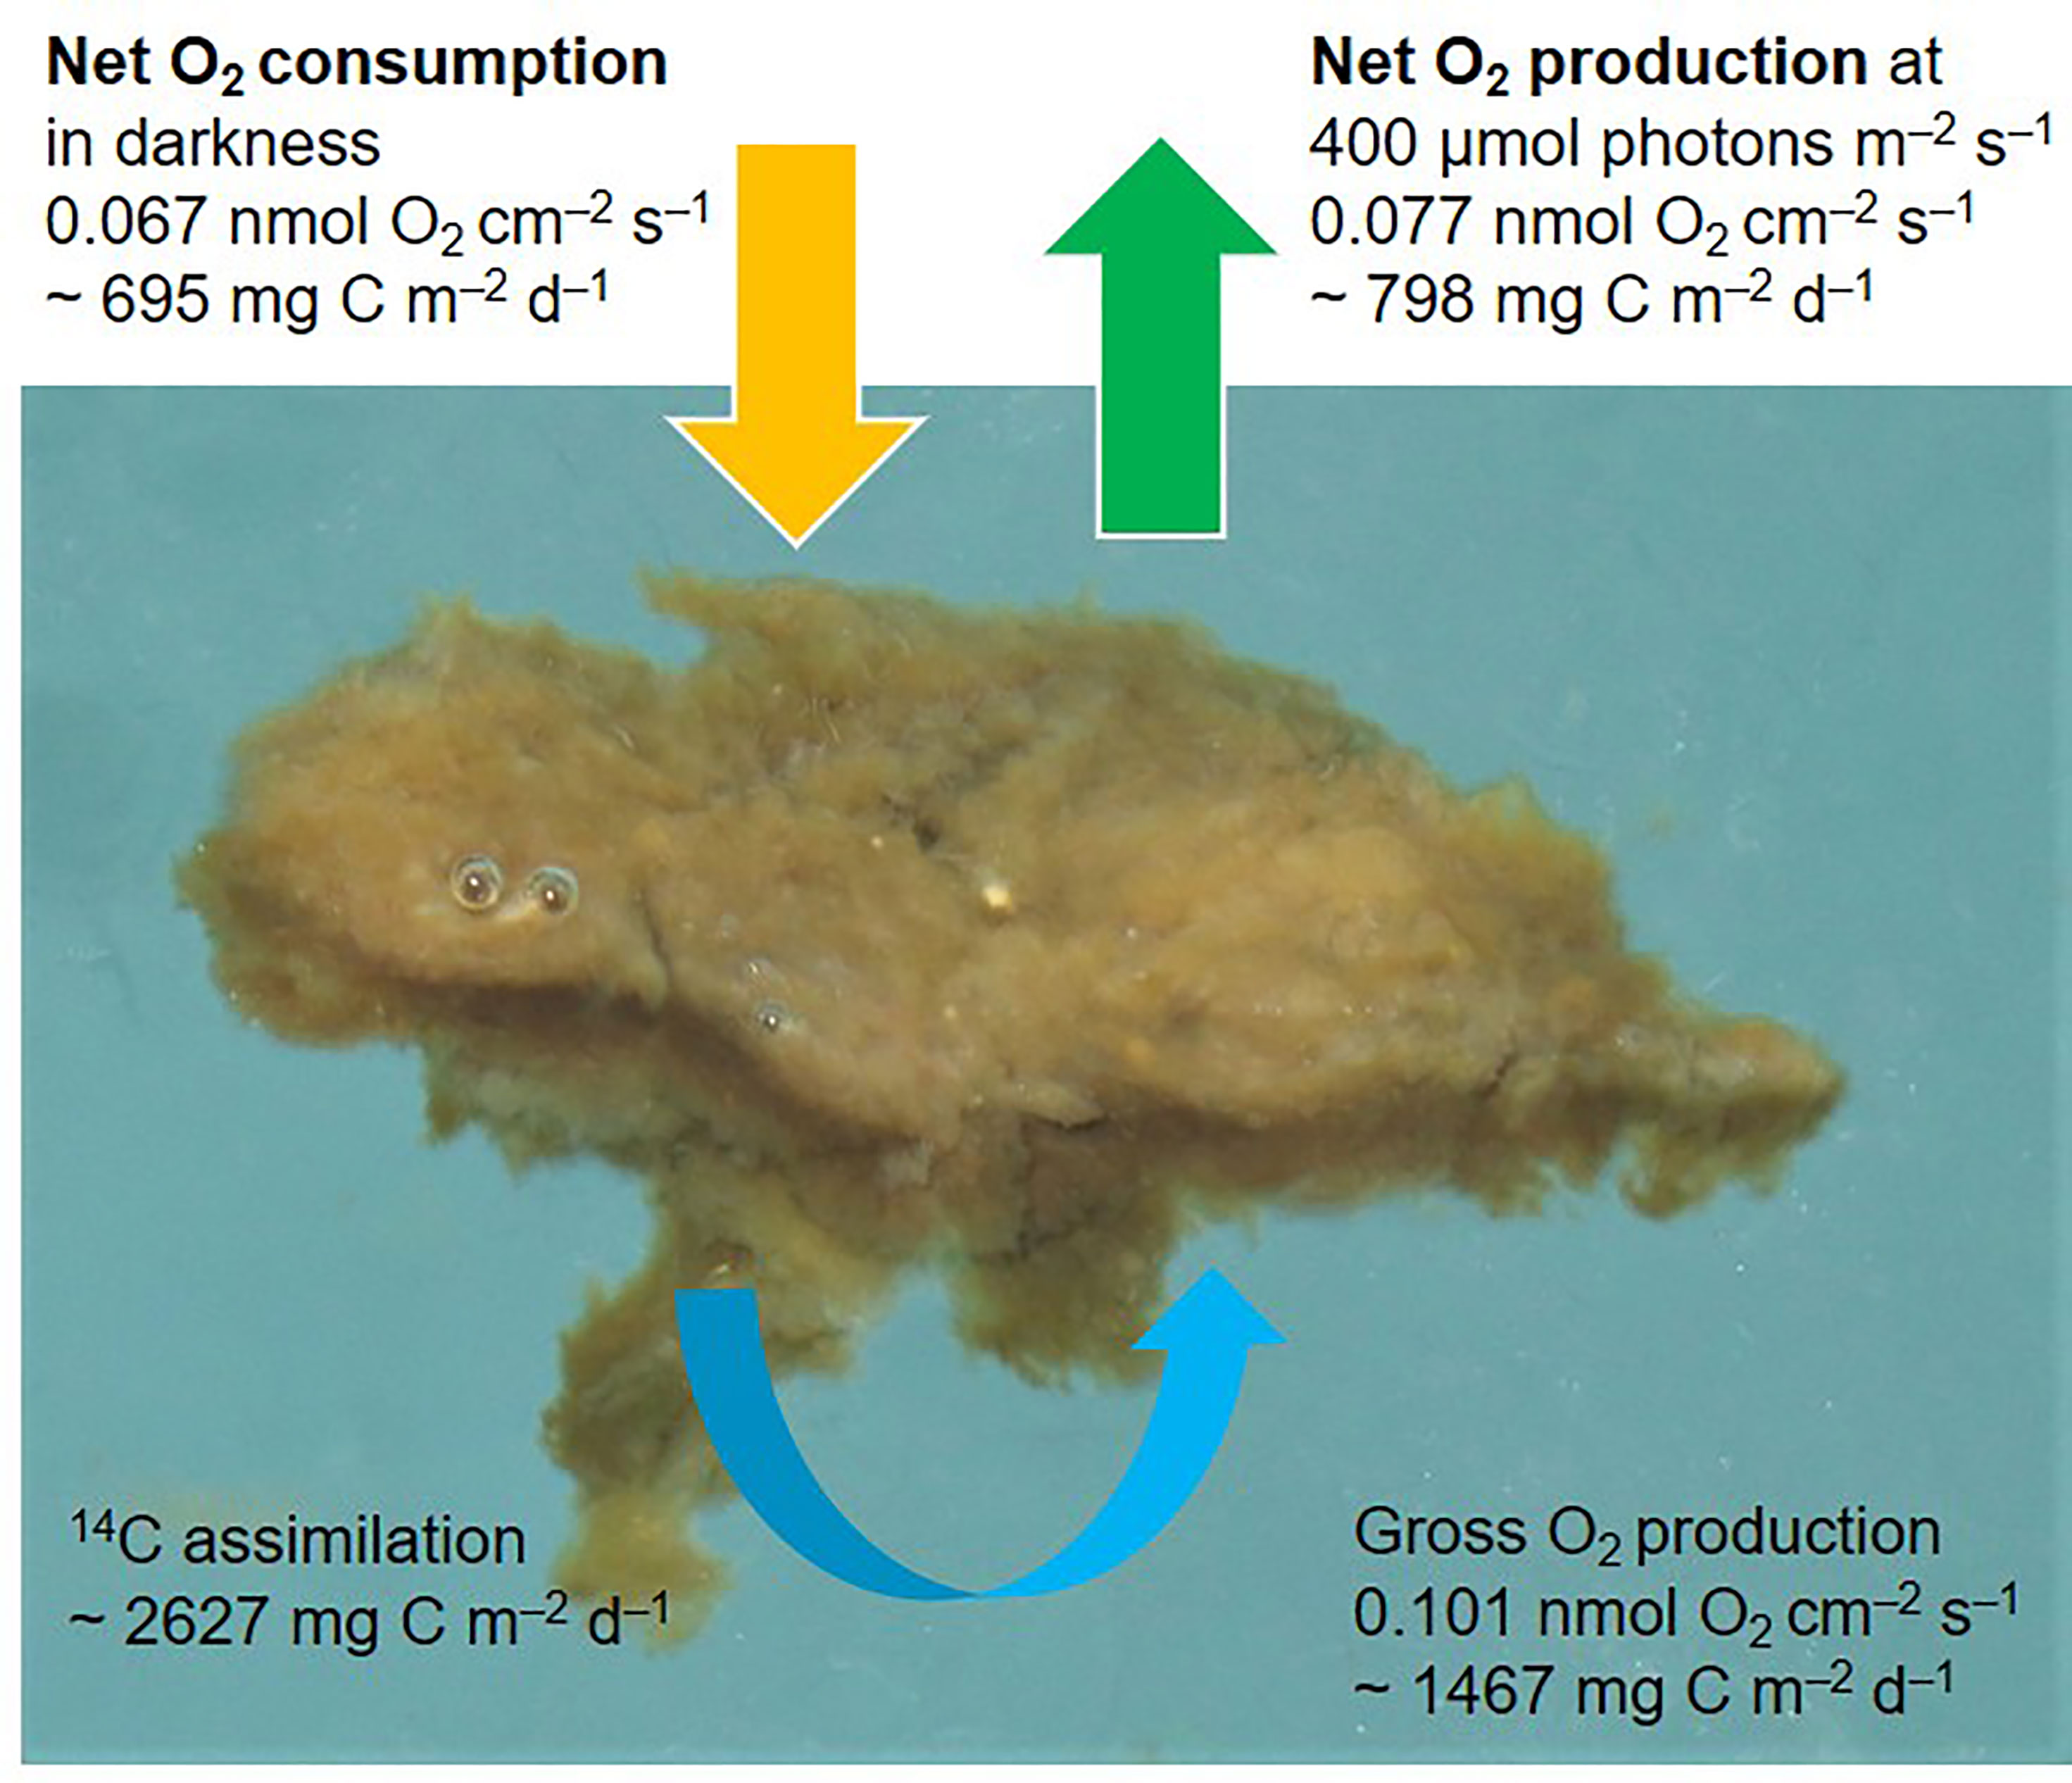
Figure 3 Rates of dark oxygen respiration (yellow arrow), net community production (green arrow), and gross oxygen production (blue arrow) in a melt pond algal mat, derived from oxygen concentration profiles and 14C-assimilations. Units per surface area of the mat in nmol O2 cm–2 s–1 and the equivalent in mg C m–2 d–1, assuming a O2:C ratio of 1.0 for net rates and 1.4 for gross production, under 24h sunlight (midnight sun). Note the small bubbles of oxygen on the mat surface to the left, which originate from O2 supersaturation and indicate a high net community O2 production within the mat. Photo by K. Hancke.
Chl a, C, and Photosynthetic Pigments
The Chl a concentration in the mat was 46.9 ± 6.7 mg Chl a m–2, the POC content 3412 ± 686 mg C m–2, and the PON content 406 ± 92.8 mg N m–2. This corresponded to ratios of C:Chl a = 75.1 ± 25.7, and of C:N = 9.8 ± 0.5 (Table 1). HPLC analyses showed a fucoxanthin content of 60% and a diadinoxanthin content (typical sunscreen pigment) of 30% of the Chl a concentration. The ratio of total photoprotective versus photosynthetic pigments were 0.18 ± 0.004 (n=3).
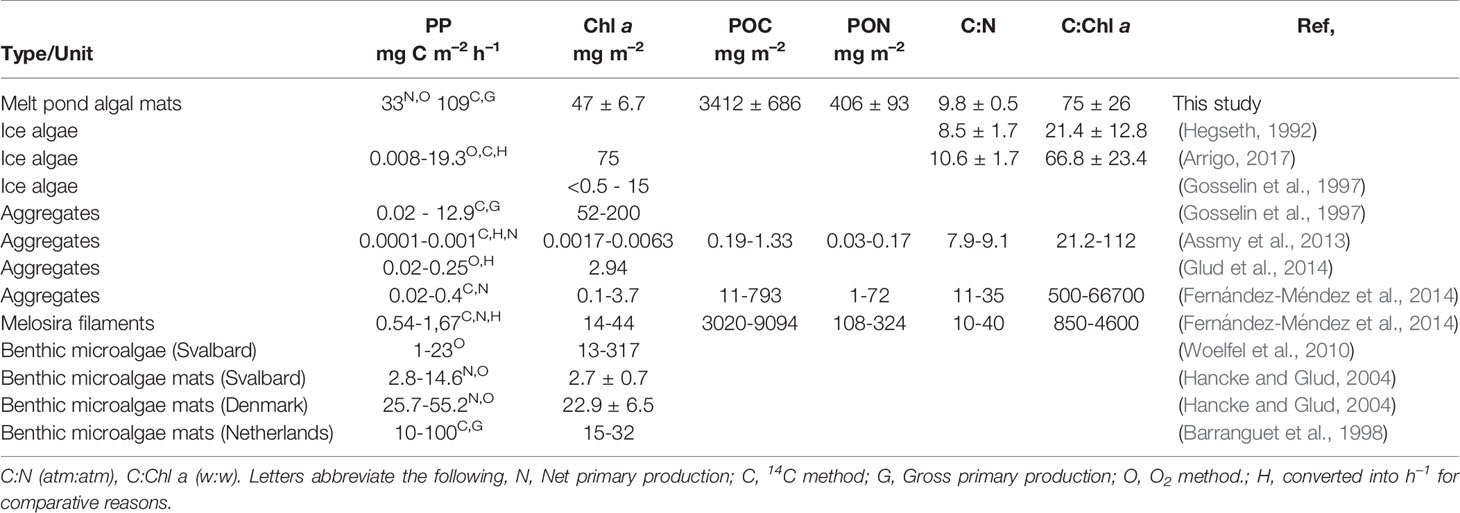
Table 1 Primary production rates (gross or net), concentrations of Chl a, particulate organic carbon (POC) and nitrogen (PON), and ratios of C:N and C:Chl a in the present melt pond algae mat and previous reports for sea ice algae, ice algae aggregates, benthic algae, and microbial mats.
Light Microscope Analysis
Light microscope analyses showed a dominance of the following algal genera Nitzschia spp., Navicula spp., Amphiprora spp., Entomoneis spp., and Pleurosigma spp. Also, a high representation of grazers including ciliate species were observed in the mats (Figure 1E), corresponding to previous observations of melt pond algal mats (Sørensen et al., 2017). Species composition of the grazer community was not further investigated.
Discussion
Melt Pond Ice Algal Mat Structure and Formation
The sampled ice algal mats were evidently different in physical structure and form than what has been reported previously of ice algal communities and accumulations beneath sea ice, including Melosira aggregates (Boetius et al., 2013) and floating aggregates (Fernández-Méndez et al., 2014). In their physical structure, they also differed from free-floating spherical algal accumulations observed in leads and below sea ice (Assmy et al., 2013). The species composition were, on the other hand, similar to previously observed floating algae aggregates and typical ice algae communities (Hegseth, 1992; Assmy et al., 2013).This indicate, that the melt pond algal mats may have a common point of origin with the spherical algal aggregates reported by Assmy et al. (2013). The observed melt pond algal mats were elongated, 3-5 mm thick with alternating light to dark brown layers (Figure 1C), with clear vertical layers in resemblance to other microbial and benthic mats (Franks and Stolz, 2009; Glud et al., 2009), which occur in a variety of environments as tidal flats (Barranguet et al., 1998), sublittoral soft-bottom sediments in the photic zone (Glud et al., 2002; Hancke and Glud, 2004; Woelfel et al., 2010), and in polar lakes and rivers (Quesada et al., 2008).
We speculate that the reported melt pond mats have formed at the bottom of melt ponds as a result of inflow of water and algae into open melt ponds (Fernández-Méndez et al., 2014) where the change from low light below the sea ice (<20 µmol photons m–2 s–1, Lund-Hansen et al., 2015) to high light in the pond (200 to 1200 µmol photons m–2 s–1) sparked the development of these dense microbial mat communities. This pair with the observations of a microalgal community that appear high-light acclimated, from the presence of the photoprotective pigment diadinoxanthin and the ratio of photoprotective versus photosynthetic pigments (Joy-Warren et al., 2019; Lund-Hansen et al., 2020). While Lee et al. (2011) reports about a new ice algal habitat formed by holes in the progressing thinning Arctic sea ice, they describe the formation and aggregation of ice algae to form long strands extending into the water below. This contrasts with our observations of distinct algal mats that have physical characteristics as benthic microphyte mats. Moreover, Lee et al. reports a dominance of Melosira arctica (>95%) with Nitzschia and Navicula species contributing the remaining. To our knowledge there is no previous reports on ice algal mats as we describe them here.
We do not know, over how much time the melt pond algal mats developed. The melt ponds were open upon sampling (free connection to the under-ice water), which we speculate is a precursor for the mat formation, and enables a continuous supply of nutrient rich water from below, as closed melt ponds typically hold low nutrient concentrations (Lee et al., 2011; Sørensen et al., 2017). The open melt ponds are regarded as the last development stage of the sea ice before freezing over in early autumn (Lee et al., 2011). This leaves a proposed window for the development of these melt pond algal mats of about one month around July-August before freezing and snowfall in late August/early September.
The Chl a concentration in the melt pond algal mats (46.9 ± 6.7 mg m–2) was higher than most reports of ice algal communities in the Arctic when scaled up to a common areal unit, including aggregated ice algae (Assmy et al., 2013; Fernández-Méndez et al., 2014; Glud et al., 2014), and under-ice algal communities (Gosselin et al., 1997, Table 1). Even when compared to microphytobenthic mats in arctic and temperate environments with dense and photosynthetic active algal communities (Barranguet et al., 1998; Glud et al., 2002; Hancke and Glud, 2004; Woelfel et al., 2010). Nevertheless, higher concentrations of Chl a have been reported for ice algae in both Arctic and Antarctica than we observed here (Vincent et al., 1993; Arrigo, 2017). See Leu et al. (2015) for a pan-Arctic review of ice algal abundances.
Primary Production and Carbon Turnover
In general, melt ponds of the Arctic Ocean are considered as low productive however empirical evidence is sparse and scattered (Lee et al., 2015; Sørensen et al., 2017). The rapidly warming Arctic favors first year ice over multiyear ice, which again is leading to an increase in melt pond formation and coverage (Polashenski et al., 2012). Warming has also been suggested to decrease ice algal primary production throughout the Arctic due to a shorter growth season (Leu et al., 2015), at the same time the contribution to primary production and carbon turnover by melt pond algal might increase due to the increase in areal coverage.
We here report on highly productive melt pond algal mat with a gross carbon production (2627 mg C m–2 d–1) that largely exceeded the dark consumption (695 mg C m–2 d–1), and thus resulted in a high net community production. The net community production was approximate two times higher when calculated from gross 14C fixation (minus the dark C consumption, as conventionally done) than when estimated independently from the O2 steady state profiles (Figure 3). This was however anticipated, as 14C-samples were incubated in suspension which decreased the degree of self-shading between algae and thus can lead to overestimation of the gross carbon fixation (Stemann-Nielsen, 1952). Contrasting, the O2 electrode method likely underestimates true gross O2 production as it only includes photosynthetic production from the core of the mat (green bars in Figure 2) excluding peripherical algae photosynthesis (Glud et al., 1999). Nevertheless, the ice algal mat community demonstrated the highest net production rate of Arctic ice algal communities reported (Table 1). In fact, the present melt pond algal mat rates were approximately 3 times higher compared to measured rates from benthic algal microbial mats on temperate tidal flats.
Largely, ice algae are reported to sustain a low primary production in the Arctic, but large variations have been observed between regions, ice types, and habitats (Hegseth, 1992; Gosselin et al., 1997; Assmy et al., 2013; Glud et al., 2014; Arrigo, 2017; Lund-Hansen et al., 2018; Campbell et al., 2022). Low productivity of ice algal and aggregate communities is often associated with snow and ice cover and consequently often is light-limited (Woelfel et al., 2010; Leu et al., 2015; Hancke et al., 2018; Lund-Hansen et al., 2020b; Lund-Hansen et al., 2020a). In contrast, temperate benthic algal mats and the here described melt pond mats are both exposed to high light. In this case, it is reasonable to assume, that high primary production rates were supported by high light conditions prevailing at the bottom of melt ponds in combination with access to nutrient rich water from below the ice. This compares well with high rates of biological activity reported for floating ice-algal aggregates when scaled to the individual aggregate size published by Assmy et al. (2013), leading the authors to suggest that algae aggregates may provide a concentrated food source for ice-associated fauna during the oligotrophic Arctic summer months.
The fraction of melt ponds covering the sea ice in the Arctic Ocean in July is reported to be as high as 50 to 60% (Lee et al., 2020) but carbon fixation often low, estimated to <1% of the carbon production (Lee et al., 2012), with rates around 1.0 mg C m–2 d–1 (Sørensen et al., 2017). The net rate of 798 mg C m–2 d–1 measured in the algal mat demonstrates that melt pond algal mats may represent a significant carbon source for grazing and benthic organisms, as also suggested by Boetius et al. (2013), but how prevalent these mats are is still unanswered. Considering the research focus on ice algae, melt ponds and aggregates during the last two decades it is remarkable that mats similar to what we report here, have not been published even after we made our observations in 2004, which might imply that the mats have a low prevalence. Thus, their overall contribution to the Arctic Ocean carbon turnover is uncertain. However, our results suggest that melt pond algal mats might contribute to the Arctic Ocean carbon and energy flow at least on local and possible on regional scales. In addition, one might speculate that summer ‘blooms’ of algal mats in melt ponds could add an unpreceded supply of carbon to the Arctic food web late in the season. Additional measures of primary productivity and carbon turnover in melt pond algal mats alongside with quantification of their abundance and distribution are needed. Not least to understand the impact of increased warming on Arctic carbon pathways. Possibly, modern remote sensing techniques such as flying drones with high resolution imaging sensors (typical >1000 times better resolution than satellites) might provide tools to disclose the abundance and distribution of ice algal mats in melt ponds in the future.
Data Availability Statement
The original contributions presented in the study are included in the article/supplementary material. Further inquiries can be directed to the corresponding author.
Ethics Statement
Sampling and handling of samples followed general and acknowledged practices.
Author Contributions
KH designed the study and conducted the fieldwork and laboratory analysis with support from SK. KH and LL-H complied the data and wrote the manuscript. All authors contributed to manuscript revision, read, and approved the submitted version.
Funding
Data and material collection were carried out as part of the CABANERA project - Carbon flux and ecosystem feedback in the northern Barents Sea in an era of climate change (2003-2006) - funded by the Research Council of Norway (project number 155936/700). Writing of the manuscript was supported to KH by the Norwegian Institute for Water Research (NIVA), and to LCLH by FACE-IT (The Future of Arctic Coastal Ecosystems – Identifying Transitions in Fjord Systems and Adjacent Coastal Areas). FACE-IT has received funding from the European Union’s Horizon 2020 research and innovation program under grant agreement No. 869154.
Conflict of Interest
The authors declare that the research was conducted in the absence of any commercial or financial relationships that could be construed as a potential conflict of interest.
Publisher’s Note
All claims expressed in this article are solely those of the authors and do not necessarily represent those of their affiliated organizations, or those of the publisher, the editors and the reviewers. Any product that may be evaluated in this article, or claim that may be made by its manufacturer, is not guaranteed or endorsed by the publisher.
Acknowledgments
Captain, crew, and colleague’s onboard R/S Jan Mayen (now R/V Helmer Hanssen) are acknowledged for support during sampling and carrying out of the experiments on board the research vessel. A Glud and RN Glud are acknowledged for providing oxygen electrodes and K Andresen for HPLC analyses. G Johnsen and E Sakshaug are acknowledged for scientific discussions at an early stage of the work.
References
Arrigo K. R. (2017). “Sea Ice as a Habitat for Primary Producers,”. Ed. Thomas D. N. (Sea Ice. Oxford: Wiley Blackwell. 3rd), pp. 352–369.
Assmy P., Ehn J., Fernández-Méndez M., Hop H., Katlein C., Sundfjord A., et al. (2013). Floating Ice-Algal Aggregates Below Melting Arctic Sea Ice. PloS One 8, e76599. doi: 10.1371/journal.pone.0076599
Babin M. (2020). Climate Change Tweaks Arctic Marine Ecosystems. Science 369, 137–138. doi: 10.1126/science.abd1231
Barranguet C., Kromkamp J., Peene J. (1998). Factors Controlling Primary Production and Photosynthetic Characteristics of Intertidal Microphytobenthos. Mar. Ecol. Prog. Ser. 173, 117–126. doi: 10.3354/meps173117
Boetius A., Albrecht S., Bakker S., Beinhold C., Felden J., Fernández-Méndez M., et al. (2013). Export of Algal Biomass From the Melting Arctic Sea Ice. Science 339, 1430–1432. doi: 10.1126/science.1231346
Broecker W. S., Peng T.-H. (1974). Gas Exchange Rates Between Air and Sea. Tellus 34, 21–35. doi: 10.1111/j.2153-3490.1974.tb01948.x
Brown T. A., Galicia M. P., Thiemann G. W., Belt S. T., Yurkowski D. J., Dyck M. G. (2018). High Contributions of Sea Ice Derived Carbon in Polar Bear (Ursus Maritimus) Tissue. PloS One 1, e0191631. doi: 10.1371/journal.pone.0191631
Campbell K., Matero I., Bellas C., Turpin-Jelfs T., Anhaus P., Graeve M., et al. (2022). Monitoring a Changing Arctic: Recent Advancements in the Study of Sea Ice Microbial Communities. Ambio 51 (2), 318–332. doi: 10.1007/s13280-021-01658-z
Cavalieri D. J., Parkinson C. L. (2012). Arctic Sea Ice Variability and Trends 1979-2010. Cryosphere. 6, 881–889. doi: 10.5194/tc-6-881-2012
English T. S. (1961). Some Biological Oceanographic Observations in the Central North Polar Sea Drift Station Alpha 1957-1958. Arctic. Inst. North Am. Res. Paper. 13, 1–80.
Fernández-Méndez M., Wenzhöfer F., Peeken I., Sørensen H. L., Glud R. N., Boetius A. (2014). Composition, Buoyancy Regulation and Fate of Ice Algal Aggregates in the Central Arctic Ocean. PloS One 9, e107452. doi: 10.1371/journal.pone.0107452
Franks J., Stolz J. F. (2009). Flat Laminated Microbial Mat Communities. Earth Sci. Rev. 96, 163–172. doi: 10.1016/j.earscirev.2008.10.004
Glud R. N., Gundersen J. K., Ramsing N. B. (2000). “Electrochemical and Optical Oxygen Microsensors for in Situ Measurements,” in In Situ Monitoring of Aquatic Systems—Chemical Analysis and Speciation. Eds. Buffle J., Horvai G. (Chichester: J Wiley & Sons).
Glud R. N., Kühl M., Kohls O., Ramsing N. B. (1999). Heterogeneity of Oxygen Production and Consumption in a Photosynthetic Microbial Mat as Studies by Planar Optodes. J. Phycol. 35, 270–279. doi: 10.1046/j.1529-8817.1999.3520270.x
Glud R. N., Kühl M., Wenzhofer F., Rysgaard S. (2002). Benthic Diatoms of a High Arctic Fjord (Young Sound, NE Greenland): Importance for Ecosystem Primary Production. Mar. Ecol. Prog. Ser. 238, 15–29. doi: 10.3354/meps238015
Glud R. N., Ramsing N. B., Revsbech N. P. (1992). Photosynthesis and Photosynthesis-Coupled Respiration in Natural Biofilms Quantified With Oxygen Microsensors. J. Phycol. 28 (1), 51–60. doi: 10.1111/j.0022-3646.1992.00051.x
Glud R. N., Rysgaard S., Turner G., McGinnis D. F., Leakey R. J. (2014). Biological- and Physical-Induced Oxygen Dynamics in Melting Sea Ice of the Fram Strait. Limnol. Ocean. 59, 1097–1111. doi: 10.4319/lo.2014.59.4.1097
Glud R. N., Woelfel J., Karsten U., Kühl M., Rysgaard S. (2009). Benthic Microalgal Production in the Arctic: Applied Methods and Status of the Current Database. Bot. Marin. 52, 559–571. doi: 10.1515/BOT.2009.074
Gosselin M., Levasseur M., Wheeler P. A., Horner R. A., Booth B. C. (1997). New Measurements of Phytoplankton and Ice Algal Production in the Arctic Ocean. Deep. Sea. Res. Part II. 44, 1623–1644. doi: 10.1016/S0967-0645(97)00054-4
Grasshoff K., Erhardt M., Kremling K. (Eds.) (1999). Methods of Seawater Analysis (London: Wiley), p. 632.
Hancke K., Glud R. N. (2004). Temperature Effects on Respiration and Photosynthesis in Three Diatom-Dominated Benthic Communities. Aquat. Micro. Biol. 37, 265–281. doi: 10.3354/ame037265
Hancke K., Hancke T. B., Olsen L. M., Johnsen G., Glud R. (2008). Temperature Effects on Microalgal Photosynthesis-Light Responses Measured by O2 Production, Pulse-Amplitude-Modulated Fluorescence, and C-14 Assimilation. J. Phycol. 44 (2), 501–514. doi: 10.1111/j.1529-8817.2008.00487.x
Hancke K., Lund-Hansen L. C., Pedersen S., King M. d., Andersen P., Sorrell B. K. (2018). Extreme Low Light Requirement for Algae Growth Underneath Sea Ice: A Case Study From Station Nord, NE Greenland. J. Geophys. Res. Oceans. 123, 985–1000. doi: 10.1002/2017JC013263
Hegseth E. N. (1992). Sub-Ice Assemblages of the Barents Sea: Spice Composition, Chemical Composition, and Growth Rates. Pol. Biol. 12, 485–496. doi: 10.1007/BF00238187
Hodal H., Kristiansen S. (2008). The Importance of Small-Celled Phytoplankton in Spring Blooms at the Marginal Ice Zone in the Northern Barents Sea. Deep-Sea. Res. Part II: Topical Studies Oceanograp. - DEEP-SEA. Res. PT. II-TOP. ST. OCE. 55, 2176–2185. doi: 10.1016/j.dsr2.2008.05.012
Jørgensen B. B., Revsbech N. P. (1985). Diffusive Boundary Layers and the Oxygen Uptake of Sediments and Detritus. Limnol. Ocean. 30, 111–122. doi: 10.4319/lo.1985.30.1.0111
Jeffrey S. W., Wright S. W., Zapata M. (1999). Recent Advances in HPLC Pigment Analysis of Phytoplankton. Mar. Freshw. Res. 50, 879–896. doi: 10.1071/MF99109
Joy-Warren H. L., van Dijken G. L., Alderkamp A. C., Leventer A., Lewis K. M., Selz V., et al. (2019). Light is the Primary Driver of Early Season Phytoplankton Production Along the Western Antarctic Peninsula. J. Geophys. Res. Oceans 124, 7375–7399. doi: 10.1029/2019JC015295
Katlein C., Fernández-Méndez M., Wenzhöfer F., Nicolaus M. (2015). Distribution of Algal Aggregates Under Summer Sea Ice in the Central Arctic. Pol. Biol. 38, 719–731. doi: 10.1007/s00300-014-1634-3
Kivimae C. (2007). Carbon and Oxygen Fluxes in the Barents and Norwegian Seas: Production, Air-Sea Exchange and Budget Calculations. Doctoral Thesis (University of Bergen, Bergen: Bergen Open Research Archive (uib.no).
Kühl M., Glud R. N., Ploug H., Ramsing N. B. (1996). Microenvironmental Control of Photosynthesis and Photosynthesis-Coupled Respiration in an Epilithic Cyanobacterial Biofilm. J. Phycol. 32, 799–812. doi: 10.1111/j.0022-3646.1996.00799.x
Lalande C., Nöthig E.-M., Fortier L. (2019). Algal Export in the Arctic Ocean in Times of Global Warming. Geophys. Res. Lett. 46, 5959–5967. doi: 10.1029/2019GL083167
Lee S. H., Kim B. K., J H.-T., Park J. W., Lee J. H., Joo H.-M., et al. (2015). Carbon Contribution of Sea Ice Floes in the Arctic Ocean. Deep-Sea. Res. II. 120, 35–42. doi: 10.1016/j.dsr2.2013.12.021
Lee S. H., McRoy P. C., Joo H. M., Gradinger R., Cui X., Yun M. S., et al. (2011). Holes in Progressively Thinning Arctic Sea Ice Lead to New Ice Algae Habitat. Oceanography 24 (3), 302–308. doi: 10.5670/oceanog.2011.81
Lee S. H., Stockwell D., Joo H.-M., Son Y. B., Kang C.-K., Whitledge T. (2012). Phytoplankton Production From Melting Ponds on Arctic Sea Ice. J. Geophys. Res. (Oceans) 117, 4030. doi: 10.1029/2011JC007717
Lee S., Stroeve J., Tsamados M., Khan A. L. (2020). Machine Learning Approaches to Retrieve Pan-Arctic Melt Ponds From Visible Satellite Imagery. Remote Sens. Environ. 247, 111919. doi: 10.1016/j.rse.2020.111919
Leu E., Mundy C. J., Assmy P., Campbell K., Gabrielsen T. M., Gosselin M., et al. (2015). Arctic Spring Awakening - Steering Principles Behind the Phenology of Vernal Ice Algal Blooms. Prog. Oceanograp. 139, 151–170. doi: 10.1016/j.pocean.2015.07.012
Li Y. H., Gregory S. (1974). Diffusion of Ions in Sea-Water and in Deep-Sea Sediments. Geochim. Et. Cosmochim. Acta 38 (5), 703–714. doi: 10.1016/0016-7037(74)90145-8
Lund-Hansen L. C., Hawes I., Hancke K., Salmansen N., Nielsen J. r., Balslev L., et al. (2020b). Effects of Increased Irradiance on Biomass, Photobiology, Nutritional Quality, and Pigment Composition of Arctic Sea Ice Algae. Mar. Ecol. Prog. Ser. 648, 95–110. doi: 10.3354/meps13411
Lund-Hansen L. C., Hawes I., Nielsen M. H., Dahllöf I., Sorrell B. (2018). Summer Meltwater and Spring Sea Ice Primary Production, Light Climate and Nutrients in an Arctic Estuary, Kangerlussuaq, West Greenland. Arctic. Antarctic. Alpine. Res. 50, e1414468-1-e1414468-11. doi: 10.1080/15230430.2017.1414468
Lund-Hansen L. C., Markager S., Hancke K., Stratmann T., Rysgaard S., Ramløv H., et al. (2015). Effects of Sea-Ice Light Attenuation and CDOM Absorption in the Water Below the Eurasian Sector of the Central Arctic Ocean. Pol. Res. 34, 23978. doi: 10.3402/polar.v34.23978
Lund-Hansen L. C., Søgaard D. H., Sorrell B. K., Gradinger R., Meiners K. (2020a). Arctic Sea Ice Ecology (Cham, Switzerland: Springer Polar Series. Springer). 10.1007/978-3-030-37472-3.
Mackinney G. (1941). Absorption of Light by Chlorophyll Solutions. J. Biol. Chem. 23, 315–322. doi: 10.1016/S0021-9258(18)51320-X
Meredith M., Sommerkorn M., Cassotta S., Derksen C., Ekaykin A., Hollowed A., et al. (2019). “Polar Regions,” in IPCC Special Report on the Ocean and Cryosphere in a Changing Climate. Eds Pörtner H.-O., Roberts D. C., Masson-Delmotte V., Zhai P., Tignor M., Poloczanska E., Mintenbeck K., Alegría A., Nicolai M., Okem A., Petzold J., Rama B., Weyer N. M. (Geneva, Switzerland: Intergovernmental Panel on Climate Change).
Polashenski C., Perovich D., Courville Z. (2012). The Mechanisms of Sea Ice Melt Pond Formation and Evolution. J. Geophys. Res. 117 (C1), C01001. doi: 10.1029/2011JC007231
Quesada A., Fernandez-Valiente E., Hawes I., Howard-Williams C. (2008). Benthic Primary Production in Polar Lakes and Rivers. In: Polar Lakes and Rivers: Limnology of Arctic and Antarctic Aquatic Ecosystems. Eds. Vincent W. F., Layborn-Parry J. (Oxford, UK: Oxford Scholarship Online). doi: 10.1093/acprof:oso/9780199213887.001.0001
Revsbech N. P. (1989). An Oxygen Microsensor With a Guard Cathode. Limnol. Ocean. 34, 474–478. doi: 10.4319/lo.1989.34.2.0474
Revsbech N. P., Jorgensen B. B. (1983). Photosynthesis of Benthic Microflora Measured With High Spatial-Resolution by the Oxygen Microprofile Method - Capabilities and Limitations of the Method. Limnol. Oceanograp. 28 (4), 749–756. doi: 10.4319/lo.1983.28.4.0749
Rodriguez F., Chauton M., Johnsen G., Andresen K., Olsen L. M., Zapata M. (2006). Photoacclimation in Phytoplankton: Implications for Biomass Estimates, Pigment Functionality and Chemotaxonomy. Mar. Biol. 148, 963–971. doi: 10.1007/s00227-005-0138-7
Sørensen H. L., Thamdrup B., Jeppesen E., Rysgaard S., Glud R. N. (2017). Nutrient Availability Limits Biological Production in Arctic Sea Ice Melt Ponds. Pol. Biol. 40, 1593–1606. doi: 10.1007/s00300-017-2082-7
Stemann-Nielsen E. (1952). The Use of Radio-Active Carbon (C14) for Measuring Organic Production in the Sea. ICES. J. Mar. Sci. 18, 117–140. doi: 10.1093/icesjms/18.2.117
Tamelander T., Reigstad M., Hop H., Ratkova T. (2009). Ice Algal Assemblages and the Vertical Export of Organic Matter From Sea Ice in the Barents Sea and Nansen Basin (Arctic Ocean). Pol. Biol. 32, 1261–1273. doi: 10.1007/s00300-009-0622-5
Vincent W. F., Downes M. T., Castenholz R. W., Howard-Williams C. (1993). Community Structure and Pigment Organisation of Cyanobacteria-Dominated Microbial Mats in Antarctica. Europ. J. Phycol. 28, 213–221. doi: 10.1080/09670269300650321
Wassmann P., Carroll J., Bellerby R. G. J. (2008). Carbon Flux and Ecosystem Feedback in the Northern Barents Sea in an Era of Climate Change: An Introduction. Deep. Sea. Res. Part II.: Top. Stud. Oceano. 55, 2143–2153. doi: 10.1016/j.dsr2.2008.05.025
Woelfel J., Schumann R., Peine F., Flohr A., Kruss A., Tegowski J., et al. (2010). Microphytobenthos of Arctic Kongsfjorden (Svalbard, Norway): Biomass and Potential Primary Production Along the Shoreline. Pol. Biol. 33, 1239–1253. doi: 10.1007/s00300-010-0813-0
Wunderling N., Willeit M., Donges J. F., Winkelmann R. (2020). Global Warming Due to Loss of Large Ice Masses and Arctic Summer Sea Ice. Nat. Commun. 11, 5177. doi: 10.1038/s41467-020-18934-3
Keywords: ice algae, melt ponds, oxygen production and consumption, photosynthesis, carbon turnover, Arctic Ocean
Citation: Hancke K, Kristiansen S and Lund-Hansen LC (2022) Highly Productive Ice Algal Mats in Arctic Melt Ponds: Primary Production and Carbon Turnover. Front. Mar. Sci. 9:841720. doi: 10.3389/fmars.2022.841720
Received: 22 December 2021; Accepted: 18 March 2022;
Published: 12 April 2022.
Edited by:
Koji Suzuki, Hokkaido University, JapanReviewed by:
Yuichi Nosaka, Tokai University, JapanPhilippe Massicotte, Laval University, Canada
Lisa C. Matthes, Laval University, Canada
Copyright © 2022 Hancke, Kristiansen and Lund-Hansen. This is an open-access article distributed under the terms of the Creative Commons Attribution License (CC BY). The use, distribution or reproduction in other forums is permitted, provided the original author(s) and the copyright owner(s) are credited and that the original publication in this journal is cited, in accordance with accepted academic practice. No use, distribution or reproduction is permitted which does not comply with these terms.
*Correspondence: Kasper Hancke, S2FzcGVyLmhhbmNrZUBuaXZhLm5v