 Mariana Cardoso-Andrade1,2,3*
 Henrique Queiroga1,2
 Mafalda Rangel3
 Inês Sousa3
 Adela Belackova3
 Luís Bentes3
 Frederico Oliveira3
 Pedro Monteiro3
 Nuno Sales Henriques3
 Carlos M. L. Afonso3
 Ana F. Silva4
 Bernardo R. Quintella4,5
 José L. Costa4,5
 Miguel P. Pais4,5
 Sofia Henriques4,5
 Marisa I. Batista4,6
 Gustavo Franco7
 Emanuel J. Gonçalves7
 Miguel Henriques8
 Teresa Leonardo8
 Paula Coelho9
 Robert Comas-González9
 Laura P. Fernández9
 Carla Quiles-Pons9
 André Costa9
 Cristina Espírito-Santo9
 João J. Castro9,10
 Francisco Arenas11
 Sandra Ramos11
 Vasco Ferreira12
 Jorge M. S. Gonçalves3
 Bárbara Horta e Costa3
- 1Centro de Estudos do Ambiente e do Mar (CESAM), Universidade de Aveiro, Aveiro, Portugal
- 2Departamento de Biologia, Universidade de Aveiro, Aveiro, Portugal
- 3Centro de Ciências do Mar do Algarve (CCMAR), Universidade do Algarve, Faro, Portugal
- 4Marine and Environmental Sciences Centre (MARE), Faculdade de Ciências, Universidade de Lisboa, Lisboa, Portugal
- 5Departamento de Biologia Animal, Faculdade de Ciências, Universidade de Lisboa, Lisboa, Portugal
- 6Liga para a Protecção da Natureza (LPN), Lisboa, Portugal
- 7Marine and Environmental Sciences Centre (MARE), ISPA - Instituto Universitário, Lisboa, Portugal
- 8Instituto da Conservação da Natureza e das Florestas (ICNF), Lisboa, Portugal
- 9Marine and Environmental Sciences Centre (MARE), Laboratório de Ciências do Mar, Universidade de Évora, Sines, Portugal
- 10 Departamento de Biologia, Escola de Ciências e Tecnologia, Universidade de Évora, Évora, Portugal
- 11Centro Interdisciplinar de Investigação Marinha e Ambiental (CIIMAR), Universidade do Porto, Matosinhos, Portugal
- 12Município de Esposende, Esposende, Portugal
Marine Protected Areas (MPAs) require effective indicators to assess their performance, in compliance with the goals of relevant national and international commitments. Achieving and prioritizing shortlists of multidisciplinary indicators demands a significant effort from specialists to depict the multiple conservation and socioeconomic interests, and the large complexity of natural systems. The present paper describes a structured expert-based methodology (process and outputs) to co-define a list of multidisciplinary MPA performance indicators. This work was promoted by the management authority of coastal MPAs in mainland Portugal to gather a consensual and feasible list of indicators that would guide the design of a future national monitoring program. Hence, Portuguese coastal MPAs served as a case study to develop such a process between 2019 and 2020. In the end, participants (1) agreed on a shortlist of prioritized indicators (i.e., environmental, governance, and socioeconomic indicators) and (2) defined minimum monitoring frequencies for the indicators in this list, compatible with the potential replicability of the associated survey methods. The present approach recommends that management plans incorporate monitoring procedures and survey methods, with a validated list of indicators and associated monitoring periodicity, agreed among researchers, MPA managers and governance experts. The proposed methodology, and the lessons learned from it, can support future processes aiming to define and prioritize MPA performance indicators.
Introduction
Global marine and coastal ecosystems continue to deteriorate due to resource overexploitation, release of pollutants, habitat degradation and the impacts of climate change (IUCN-WCPA, 2008; Secretariat of the Convention on Biological Diversity, 2020; O’Hara et al., 2021). Strongly protected and implemented Marine Protected Areas (MPAs) can achieve long-term marine conservation goals (Day et al., 2012; Grorud-Colvert et al., 2021). To this end, effective management and adequate monitoring planning, in light of MPA goals and objectives, are vital for MPA success (Kelleher, 1999; Greathead et al., 2020). Guidelines adopted by regional conventions and directives advise contracting parties to undertake regular assessments of the ecological quality status of the marine environment and management measures, including in MPAs, and to publish their results. This is done namely by the Convention for the Protection of the Marine Environment of the North-East Atlantic (‘OSPAR Convention’, Art. 6), the Convention on the Protection of the Marine Environment of the Baltic Sea Area (‘HELCOM Convention’, Art. 16), the European Marine Strategy Framework Directive (EU MSFD), and the EU Birds (Council Directive 79/409/EEC) and Habitats Directives (Council Directive 92/43/EEC).
MPA effectiveness depends on adequate and sufficient performance indicators to assess the impact of conservation measures and evaluate whether MPA objectives are being fulfilled. MPA performance indicators should inform about 1) effects on the environmental state, 2) uses’ environmental impacts and socioeconomic conditions, and 3) management and governance response, to support adaptive management practices (IUCN-WCPA, 2008; Pelletier, 2011; Wu et al., 2017). Within the agreed commitments related to MPAs is also the promotion of ecological coherence, which is the scientific concept used to define synergy among various MPAs to achieve greater ecological benefits than those each MPA can individually provide (OSPAR Commission, 2007; Olsen et al., 2013). Hence, single MPAs’ performance assessment must also address ecological coherence for the implementation of true networks (Olsen et al., 2013; Pendred et al., 2016). Identification of main pressures, MPA objectives, regulations, and enforcement strategies to reduce pressures and achieve MPA goals, and a monitoring program to evaluate performance, are key components of management plans. Despite the critical role of management plans for MPA success, many are ineffective and insufficient (Álvarez-Fernández et al., 2017; WWF & Sky Ocean Rescue, 2019). Moreover, experts recognize that creating a standardized list of indicators is one of the most challenging steps in the design of management plans (Borja et al., 2019). The prioritization of MPA performance indicators also demands a great effort due to the multiple conservation and socioeconomic interests and the intrinsic complexity of natural systems (e.g., Dale & Beyeler, 2001; Okey, 2018). Nevertheless, the assemblage of a core list of indicators needs to be prioritized for the effective monitoring and management of MPAs, the rational application of MPA funds, and the integrated evaluation of MPAs’ performance (Pendred et al., 2016).
Given the multitude of dimensions potentially influenced by an MPA, it is reasonable to assume that a set of indicators that is built and agreed upon by different MPA stakeholders will ensure broader perspectives and a more integrated approach (e.g., Himes, 2007a; Pelletier, 2020) .
Different studies have performed collaborative work (expert-based or participatory processes) to co-design protected areas and evaluate their effectiveness, including co-defining lists of monitoring indicators (e.g., Heck et al., 2011; Izurieta et al., 2011; Garces et al., 2013; Day, 2017; Okey, 2018; Pelletier, 2020). Collaborative work is a widespread approach used by many entities seeking to attain the same goals and share responsibility for their fulfillment (Green & Johnson, 2015). Collaborative work promotes interaction between people from different circles, knowledge sharing and peer learning, thus contributing to the establishment of relationships and partnerships, and the development of innovative solutions (e.g., OECD, 2014; Green & Johnson, 2015). Thereby, defining consensual multidisciplinary lists of indicators is facilitated by this approach (e.g., Izurieta et al., 2011; Garces et al., 2013; Okey, 2018; Pelletier, 2020).
The composition of the stakeholder group participating in such processes, which depends on the purpose of the study and available resources, may affect results - for instance, the type of monitoring indicators selected and their number (e.g., Izurieta et al., 2011; Stacey et al., 2013; Pendred et al., 2016; Okey, 2018). The diversity in the stakeholder group will play an important role in the balance among monitoring themes (i.e., environmental, governance and socioeconomic) when developing and prioritizing lists of indicators (Himes, 2007a).
Several initiatives have been developed to create and implement methodologies for the selection and prioritization of viable and pragmatic sets of indicators, hoping to facilitate and enhance marine resources’ monitoring and management (Himes, 2007b; Pendred et al., 2016; Okey, 2018). These initiatives are often survey-based (online or face-to-face), which, if not combined with more resourceful and interactive working group approaches, can cause fatigue to participants and consequent loss of interest (Okey, 2018). Moreover, various authors have argued that the typical duration of research projects (2-4 years, following Pelletier, 2020) may be insufficient to build up and sustain a broad multidisciplinary consortium, which depends on reaching understanding and consensus among peers with different backgrounds (e.g., Chapman et al., 2017; Pelletier, 2020). Nevertheless, the development of short to medium-term approaches, with adjusted goals, is of the utmost importance when long-term participatory processes are unlikely.
The main goal of this study was to develop, test, and validate a structured expert-based methodology to co-define a list of multidisciplinary MPA performance indicators within a year. This work was promoted by Instituto da Conservação da Natureza e Florestas (ICNF), the management authority of coastal MPAs in mainland Portugal. ICNF invited member scientists from MPA-related projects to gather a consensual, feasible, and prioritized list of indicators that would guide the design of a future national monitoring program. To this end, a multidisciplinary group of MPA researchers and practitioners was engaged in face-to-face workshops and intersessional activities, organized and facilitated by the invited projects’ members. They searched, listed, evaluated, and prioritized the best performance indicators, addressing environmental, governance and socioeconomic features (Pomeroy et al., 2004).
The proposed methodology (process and outputs) addressed monitoring efficiency and capacity by defining first, second and third priority indicators, and acknowledging the sets of indicators that could be potentially monitored simultaneously, depending on the survey methods and their monitoring frequency. The present work can serve as an example for future expert-based processes aiming to define and prioritize MPA performance indicators. The resulting shortlist of prioritized indicators – based on important marine conservation goals set by international instruments (e.g., EU MSFD, Natura 2000 network, OSPAR Convention) – is prepared to be used in developing MPA monitoring programs, with specific adjustments on a case-by-case basis.
Materials and Methods
Overview
Four groups of researchers from different scientific backgrounds (mainly within natural sciences) and MPA monitoring practitioners (29 people; henceforth the organizing team) in mainland Portugal organized and held three one-day workshops between February 2019 and February 2020, to agree on a list of performance indicators for coastal MPAs. Besides the organizing team, workshop participants (identified through expert judgment) were scientists, managers and governance experts with in-depth knowledge of the MPAs that served as case studies (Andrade, et al. 2020). In total, 67 participants prepared and/or attended the face-to-face workshops and performed remote intersessional activities. Among the participants, 46 were researchers in natural sciences and monitoring practitioners of the marine environment and 21 had training and experience in social sciences, including the governance and management of MPAs. Managers were from the national management agency (ICNF). The number of participants and the representation of stakeholder groups varied through the different stages of the process. Participants at the workshops ranged from 28 to 44, and those who only participated remotely were 4 people. Some of the group representatives changed throughout the process, while others followed the entire process.
During the process, participants constructed and progressively refined a list of MPA performance indicators, to be regarded in a collaborative monitoring program for coastal MPAs (in Portuguese mainland territory) (Figure 1). To this end, MPA goals complying with national and international commitments (those of national MPA management plans and those agreed upon international conventions and directives) were considered in the selection and validation processes. As the success of indicators also relates to the survey methodologies (those widely used or those under experimentation), this study addressed methodology effectiveness and efficiency, considering the experts’ experience and the environmental and socioeconomic context of three MPAs along the Portuguese coast – Litoral Norte Natural Park (PNLN), Arrábida Natural Park (PNA), and Sudoeste Alentejano and Costa Vicentina Natural Park (PNSACV) - regarded as case studies. Natural Park is the predominant category of coastal MPAs in mainland Portugal, representing >80% of the total protected area in this context. The methodology addressed indicators’ specificity, measurability, achievability, relevance and time-bound to develop SMART indicators (Figure 1). In a nutshell, participants agreed on a final list of MPA performance indicators, grouped them by priority level, and defined their desirable monitoring/reporting frequencies, creating bases for sustainable and effective long-term management plans (Pomeroy et al., 2004). See the complete workflow of this expert-based process in Supplementary Figure 1.
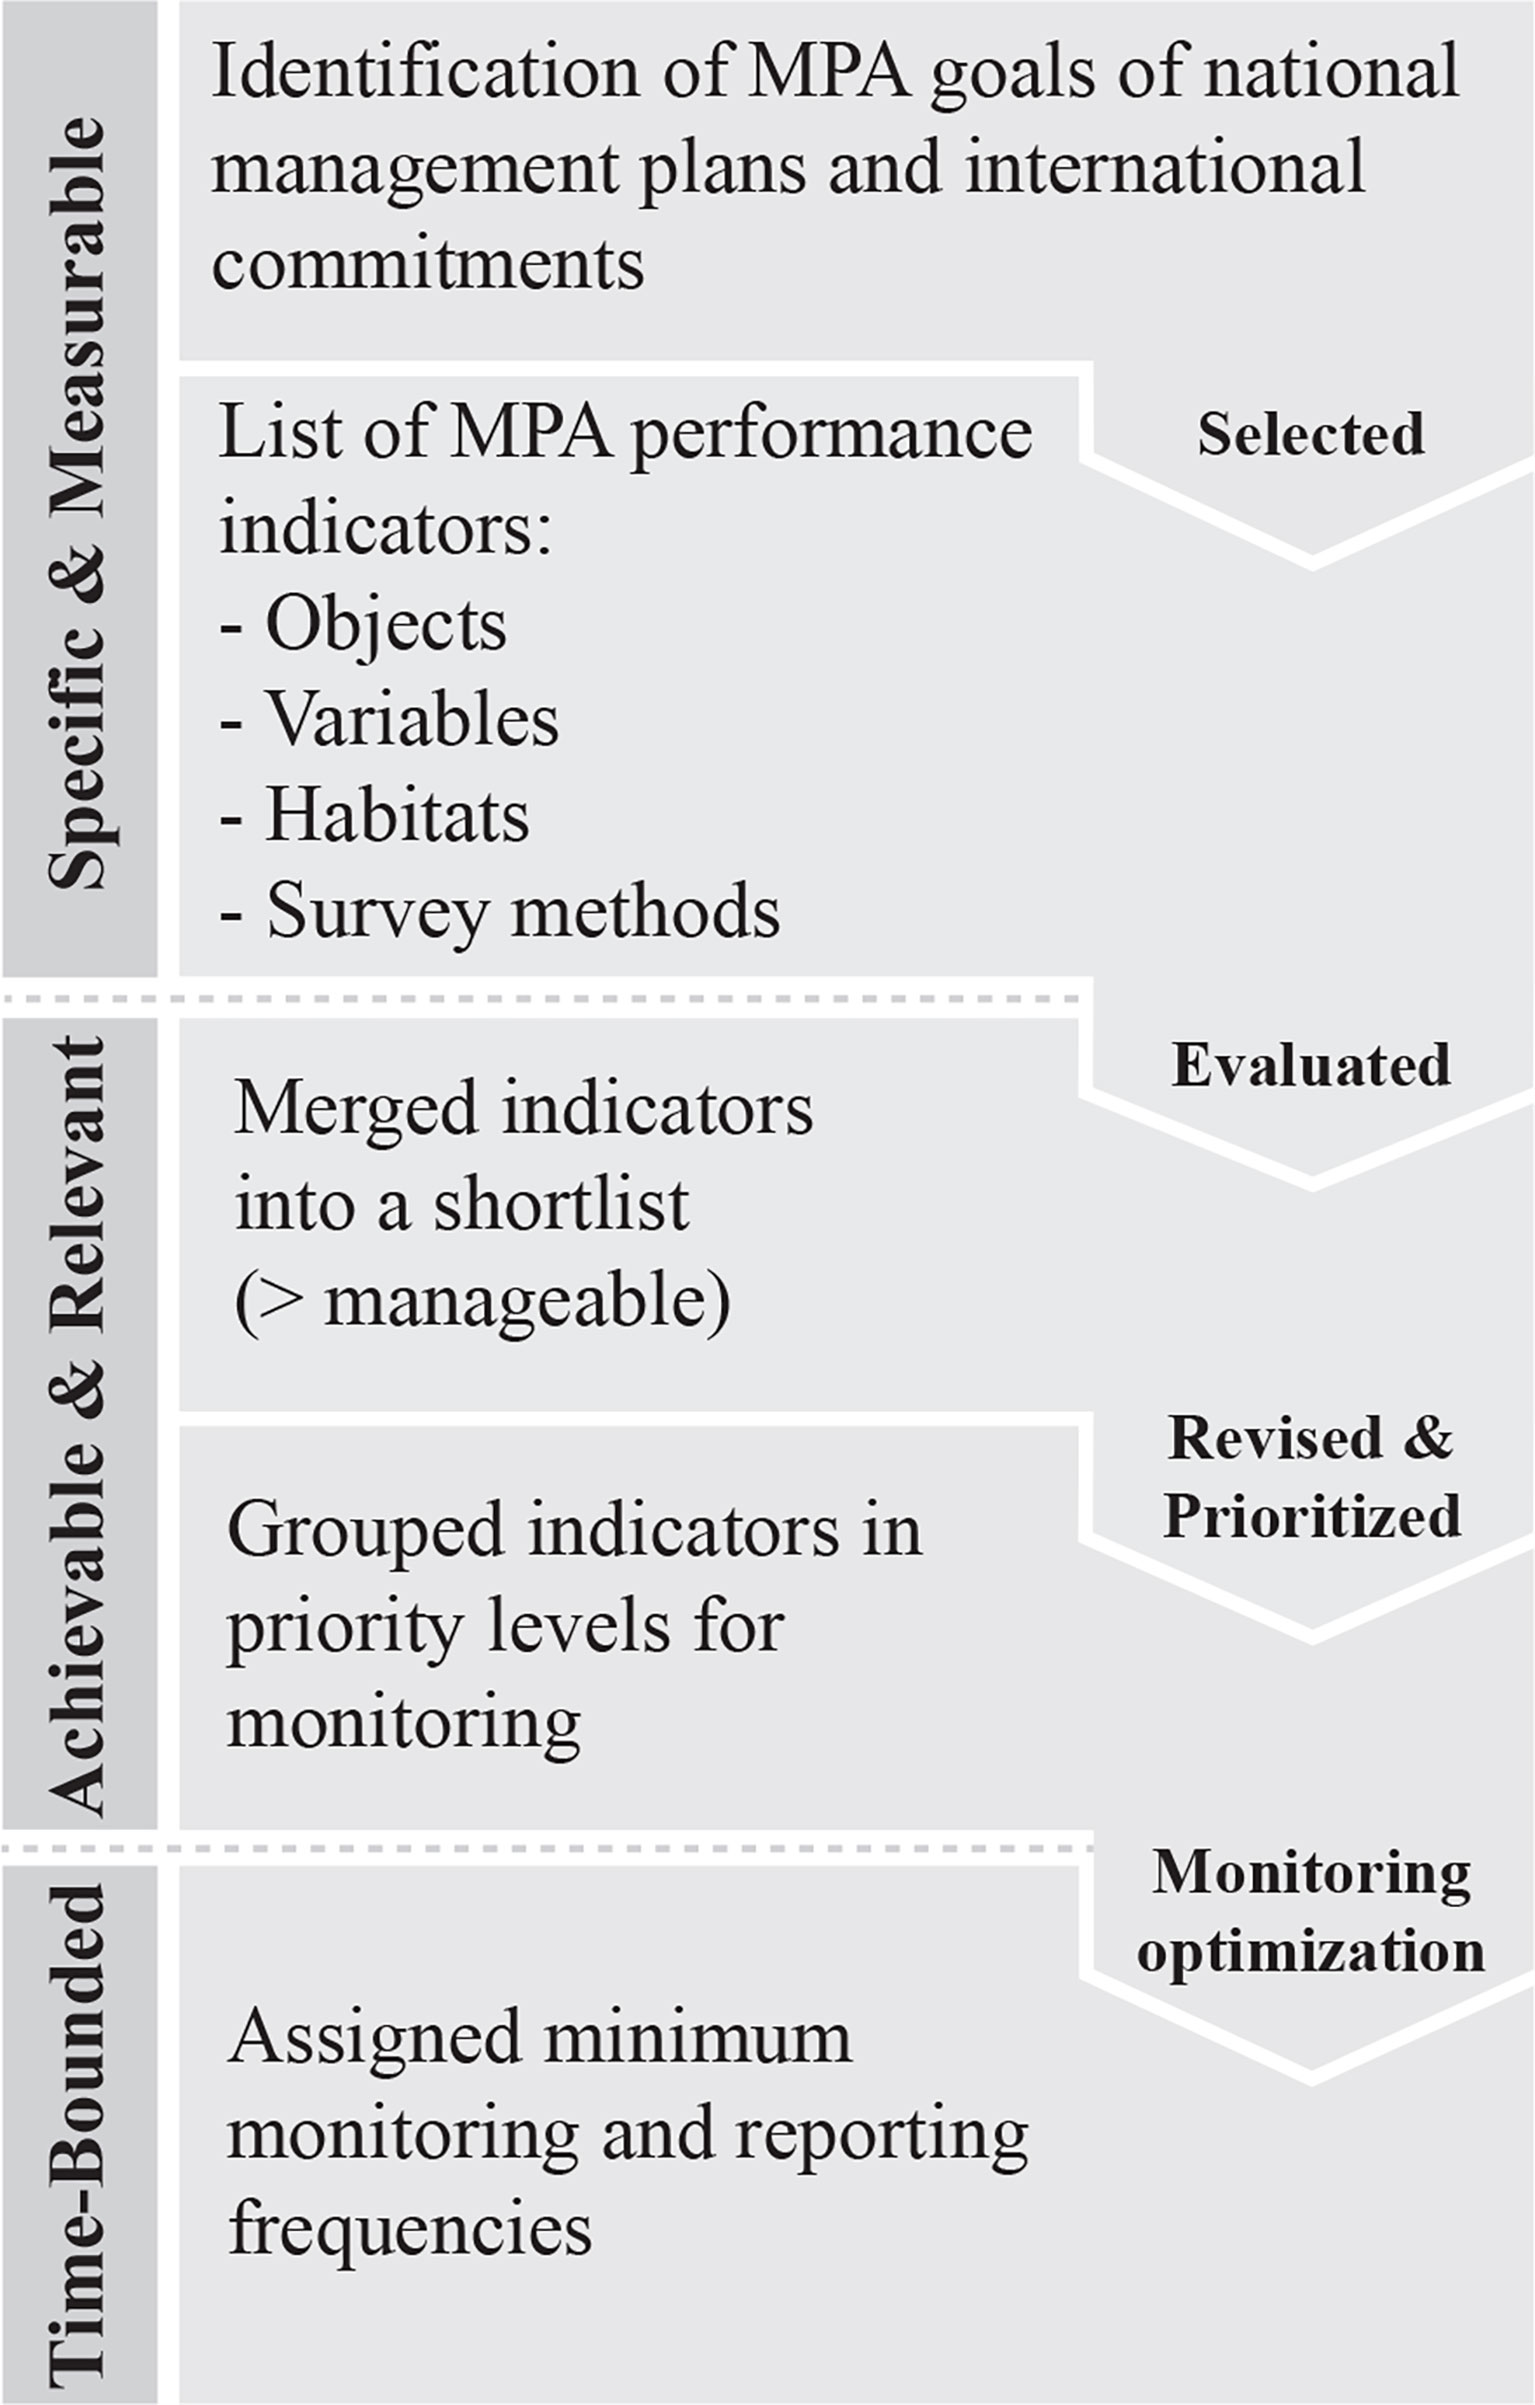
Figure 1 Workflow for developing a list of SMART MPA performance indicators.
Preliminary Work
To prepare the workshops, the organizing team first selected a detailed preliminary list of performance indicators and a preliminary set of indicator performance criteria, based on a thorough literature review (e.g., Dale & Beyeler, 2001; Ehler, 2003; Pomeroy et al., 2004; Heink & Kowarik, 2010; Beliaeff & Pelletier, 2011; Pelletier, 2011; Moffitt et al., 2013; Burrows et al., 2014; Roca et al., 2016; Bell et al., 2017) and expert knowledge.
The performance indicators responded to a set of collectively agreed objectives:
(1) report on the fulfillment of goals and objectives of each MPA, determined by national and international commitments;
(2) improve adaptive and integrated management among the Portuguese coastal MPA monitoring systems;
(3) contribute to an informed and adequate management and protection of marine ecosystems and resources;
(4) establish effective metrics for increased knowledge of protected species and habitats’ distribution and conservation status, including those encompassed by the Natura 2000 Network and existing management plans.
The selected performance indicators fell into the following categories: environmental (E), social (S; i.e., socioeconomic), and governance (G). Each indicator description included: object of measure (e.g., commercial fish), variable (e.g., abundance), habitat (e.g., pelagic), and survey method (e.g., acoustic sampling). Further information was added to the list about which indicators overlap with overarching goals adopted by the: (1) European Natura 2000 Network, (2) European Marine Strategy Framework Directive (EU MSFD), and (3) OSPAR Convention.
The selected set of indicator performance criteria would be used to score the list of performance indicators. It included criteria to assess the indicator’s scientific attributes (e.g., the existence of baseline monitoring/reference data, relevance to European Directives) and practical attributes (e.g., feasibility/replicability, cost of the method) in the MPAs’ context.
The preliminary list of performance indicators and the set of indicator performance criteria were sent to all participants for appreciation before the first face-to-face workshop.
Workshop I
The objectives of the first workshop were to discuss and validate (1) the matrix (structure and content) of the preliminary list of performance indicators and (2) the preliminary set of indicator performance criteria.
The event started with a brief explanation of the workshop’s proceedings and a short round of presentations by the organizing team and participants on the monitoring methodologies applied in different MPAs.
Afterward, participants were split into five small (6 to 7 people) heterogeneous groups, including at least one representative of the organizing team in each group, and invited to validate a sample of 11 indicators selected from the preliminary list of performance indicators, representing the different categories (i.e., environmental, socioeconomic and governance), and the preliminary set of indicator performance criteria. Participants were also asked to point out suggestions for improving these materials. In the closing plenary session, each group presented their observations and suggestions so that all participants could commit together to the best decisions. This discussion resulted in a set of guidelines for constructing a list of MPA performance indicators and defining their evaluation criteria, to be considered in this process and future ones.
Intersessional Activity
The intersessional activity that followed Workshop I had two purposes: (1) to score the list of 132 performance indicators and their survey methods validated in Workshop I (Supplementary Table 1), and (2) to merge indicators into a shorter and more manageable list. Guidelines provided in Workshop I were followed to perform these activities.
Intersessional Activity I
Before the scoring exercise, the preliminary list of indicators and the preliminary set of performance criteria were revised to integrate participants’ improvement suggestions resulting from Workshop I. The four groups that integrated the organizing team scored independently all 132 indicators and paired survey methods presented in the validated list (Supplementary Table 1): 93 environmental, 29 of governance, and 10 socioeconomic; using the validated indicator performance criteria (Table 1). Each variable was measured using a binary scale for the sake of simplicity. To assist the scoring process, the indicator performance criteria were divided into two groups: “indicator output criteria” and “survey methods criteria”; the first group to evaluate the indicator itself and the second to assess the associated survey method (Table 1).
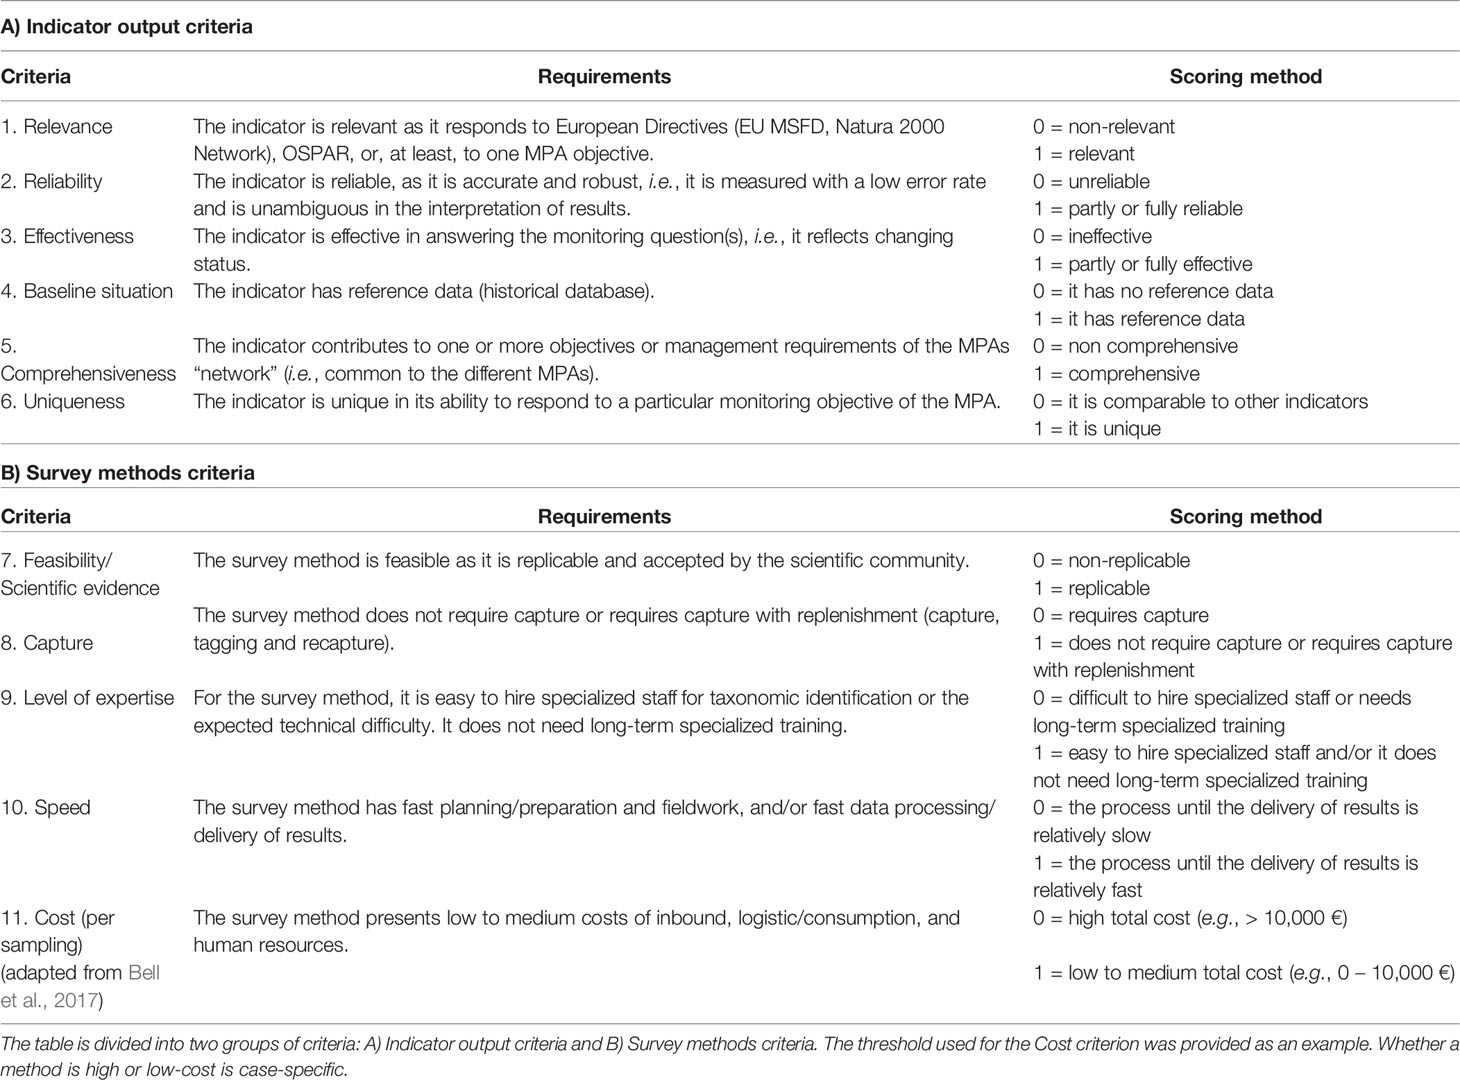
Table 1 Validated indicator performance criteria and the scoring method (binary).
One of the organizing team’s four groups was responsible for analyzing the scoring data (henceforth the data analysis group). The final score of each performance indicator was calculated as follows: first, the binary scores assigned by each group to each indicator output criteria assessing each performance indicator were summed; secondly, for each indicator output criteria, the ratio between the computed scores and the number of groups that had scored them were calculated (Equation 1); finally, the average of the ratios divided by all the six criteria were computed (Equation 2).
The exact process was repeated to score the indicators’ survey methods, using the five survey methods criteria (Table 1). The bottom third of all indicators and survey methods (with the lowest scores) were flagged for participants in Workshop II to decide whether to exclude or reintegrate them with the necessary adjustments.
Equation 1. Expression to determine the ratio of scores for the six criteria that assess each performance indicator.
Equation 2. Expression to determine the final score of each performance indicator.
Where:
xkis the binary score of the kth group of experts scoring the indicator.
n is the number of groups scoring the indicator (minimum 1, maximum 4).
zjis the score of the jth criterion.
yi is the final score of the ith indicator.
Intersessional Activity II
After scoring the full list, the purpose was to achieve a shorter and more manageable list (as suggested during Workshop I) to proceed with further classification and prioritization steps. For this purpose, the data analysis group merged indicators by (1) combining species/groups that are usually monitored simultaneously (e.g., the average size of commercial fish and invertebrates); and (2) grouping complementary metrics (e.g.1, density and frequency of occurrence are complementary metrics of abundance; e.g.2, the annual number of surveillance activities and the annual number of fines per surveillance activity both assess the existence of an efficient and adequate MPA surveillance strategy).
The resulting shortlist would be the subject of further validation and evaluation in the following workshop.
The group also integrated into the shortlist the Pressure-State-Response (PSR) framework developed by OECD (2003). The PSR framework identifies the purpose of each indicator: a) pressure indicators measure direct or indirect impacts inflicted by anthropogenic activities on the environment; b) state indicators diagnose environmental states; and c) response indicators assess society’s reaction to the changes exposed by state indicators, i.e., if it is acting preventively, mitigating or reversing the adverse effects, and adopting strategies for the preservation and conservation of the environment and the sustainable use of its natural resources (OECD, 2003; Pelletier, 2011). This approach would help in the next steps of the process by making the role of each indicator clear for all the members of the multidisciplinary group and highlighting the missing links between these three types of indicators (OECD, 2003).
Workshop II
The main goals of Workshop II were to (1) validate the proposed shortlist of indicators resulting from Intersessional activity II and (2) identify the indicators of higher relevance to establish priority levels. To allow for a more focused and optimized process (Okey, 2018), workshop participants were organized into groups and divided between two main monitoring themes: a) indicators of environmental state and pressure (researchers and MPA monitoring practitioners); b) indicators of governance response and socioeconomic pressure (researchers and managers). Each focus group assessed only the respective set of indicators.
The session included three exercises previously sent to all participants to get the contributions of the ones who were unable to attend the workshop. Each exercise was followed by a plenary session to discuss results and ensure a group conclusion. Survey methods were omitted from the shortlist to balance the influence of the participants’ working experience/familiarity with survey methods when they scored the indicators.
(1) The first exercise consisted of carefully reading the proposed shortlist of indicators (which incorporated the full list of evaluated indicators, merged according to the points explained above – Intersessional activity I). The low-scored indicators and survey methods from the previous scoring exercise (i.e., from the extensive list and merged now in the shortlist), were also discussed in plenary in this part of the session to determine if they should be eliminated or redefined.
(2) In the second exercise, using the shortlist of indicators, the organizing team asked participants to take three actions to their group of indicators (i.e., environmental or governance and socioeconomic) if necessary: a) to add if there were important omissions in the list, b) to edit when descriptions of indicators needed to be changed, c) to eliminate when indicators were found not to be relevant within the context of the shortlist. This represented the second round of review and allowed to validate and close the shortlist of performance indicators (Supplementary Table 2).
(3) The third exercise consisted of classifying the indicators from 1 (not relevant) to 5 (very relevant) to reach a final consensus between working groups of each indicator’s relevance and, most importantly, to assign each a priority level. While the first performance criteria-based scoring exercise allowed a structured evaluation of each indicator and associated survey method, the second scoring exercise was to rank the validated performance indicators in priority groups, based on the experts’ perceptions of each indicator’s relevance (this time without considering the survey methods or specific criteria). The final score of each indicator was the weighted average of the scores given by the working groups that attended Workshop II (weight = 75%) and by the people who have participated remotely (weight = 25%). After computing the final scores, the following priority groups were defined: Priority 1 (5 points, maximum classification), Priority 2 (from 4.99 to 4 points), Priority 3 (from 3.99 to 1.75).
Workshop III
Workshop III was dedicated to: (1) validate the priority groups resulting from Workshop II; (2) define minimum monitoring frequencies for each prioritized indicator (each semester, annual, or multi-annual); and (3) review the adequacy of survey methodologies previously considered for the indicators by matching indicators’ minimum monitoring frequencies with the survey methods’ possible implementation frequencies (i.e., using the existing resources).
This workshop’s structure was the same as Workshop II, with three exercises. Groups were divided into environmental, and governance/socioeconomic monitoring themes and practical exercises were followed by plenary sessions to validate results.
(1) In the first exercise, the organizing team invited participants to check the proposed priority groups resulting from Workshop II, and to suggest changes in their classification if necessary.
(2) The second exercise took place during the first plenary session. Minimum monitoring frequencies were suggested, registered, and cross-checked by all.
(3) In the third exercise, a list of the survey methods previously considered (in the extensive list) was presented for each prioritized indicator and participants were asked to edit and complete the list (if necessary) with overlooked survey methods that should be integrated into the monitoring program (Supplementary Table 3). Considering that the survey methods could be exclusive of one indicator or shared by other indicators, participants checked which indicators could potentially be monitored together and if the survey methods selected would be compatible with the minimum frequencies previously assigned to each indicator (i.e., participants verified the potential replicability of each method).
Validation of the List According to National and International Commitments
To validate the relevance of the final shortlist of prioritized indicators (Supplementary Table 2), the data analysis group overlapped it with the goals defined in:
(1) national law and MPA management plans - three mainland Portuguese coastal MPAs (Supplementary Table 4);
(2) international instruments and agreements relating to MPAs (Table 4):
- European Marine Strategy Framework Directive (EU MSFD),
- Natura 2000 Network,
- OSPAR Convention,
- Sustainable Development Goals (SDGs, 2030 Agenda),
- Aichi Biodiversity Targets of the Convention on Biological Diversity (CBD).
Note that MPAs management plans of mainland Portugal share similar structure and objectives (Horta e Costa et al., 2019). Prioritized indicators should represent all the relevant goals of these environmental conservation instruments (Table 2) when adapted to the context of MPAs.
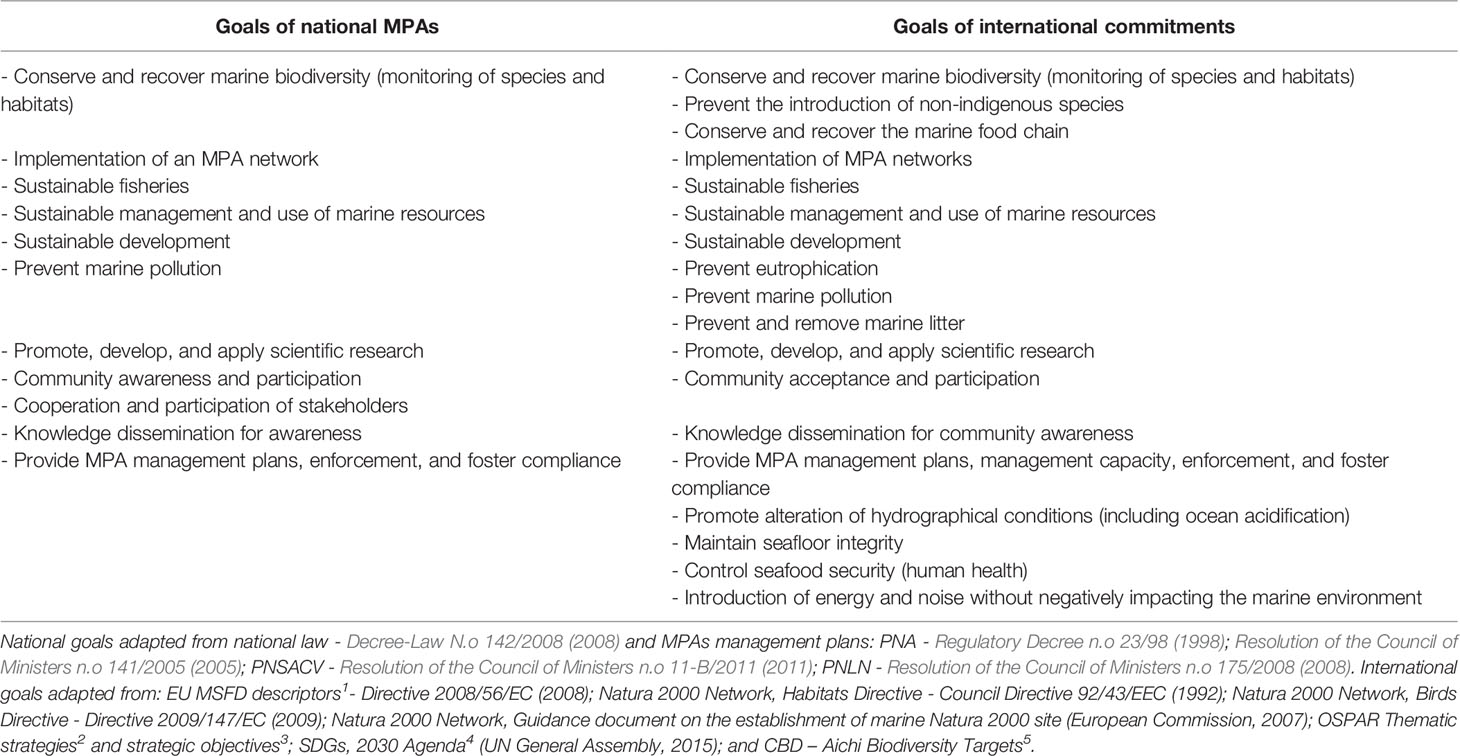
Table 2 General description of the goals of national MPAs and international commitments, adapted from their instruments.
Results
Guidelines for Lists of Indicators
In Workshop I, participants reached consensus on the following guidelines for constructing a list of MPA performance indicators and defining their evaluation criteria:
(1) Use clear, concise and consensual terms and sentences in the indicators’ description, and of the indicator performance criteria, to avoid misinterpretations;
(2) Organize the list of indicators according to specific MPA goals (e.g., restore and maintain fish biomass) and variables (e.g., diversity, biomass), rather than having them dispersed and not associated to an overall and common goal. This would facilitate the detection and elimination of redundant indicators and also the identification of overlooked indicators;
(3) Simplify and reduce the list of indicators by eliminating undue unfolding of objects, variables, habitats and survey methods, and grouping them as suggested in (2);
(4) Choose quantifiable indicators as often as possible, including governance and socioeconomic ones. For instance, use indicators quantifying material and human resources allocated to MPA management (e.g., number of surveillance events per year), rather than indicators with ambiguous descriptions (e.g., comprehensive surveillance);
(5) Keep indicators measuring unique features in the list, even if low-scored after the criteria-based evaluation. They are measuring specific effects, and thus are needed in the list;
(6) Keep track of extractive methods to replace them with less destructive methods when possible;
(7) Use indicator performance criteria to assess whether the indicators can be tailored to the national context (i.e., can serve the national MPA network rather than only single MPAs), and their relevance to the goals and objectives of European Directives and Conventions;
(8) Develop unambiguous and objective criteria to evaluate indicators’ survey methods to allow coherence and comparison among assessments, e.g., some of the raised questions during the workshop: “The indicator performance criterion speed refers to fieldwork execution speed, data processing speed, or both?”, “Which range of values defines a high or low cost to monitoring?”, “The level of expertise required for the indicator’s implementation is to be assessed in theoretical (taxonomy) or technical/operational aspects?”.
The Final Shortlist of Prioritized Indicators
After three workshops, with the selection, validation, and scoring of 132 MPA performance indicators, participants defined a shortlist of 37 indicators for coastal MPAs (Supplementary Table 2): 24 environmental indicators (E), 11 on governance and two socioeconomic indicators (GS). Table 3 presents the final shortlist organized by priority groups, with the suggested minimum monitoring frequencies: the top priority group (Priority 1 group) with 13 environmental, three governance and two socioeconomic indicators (18 in total); Priority 2 group with eight environmental and eight governance indicators (16 indicators); and Priority 3 group with three environmental indicators. The socioeconomic indicators were considered top priority indicators, along with the indicators on governance measuring surveillance capacity (surveillance events and resources available) and legal framework adequacy. The remaining governance indicators, regarding articulation between MPA competent entities, scientific knowledge progress, sharing and application, and legitimacy of stakeholders, were included in the Priority 2 group.
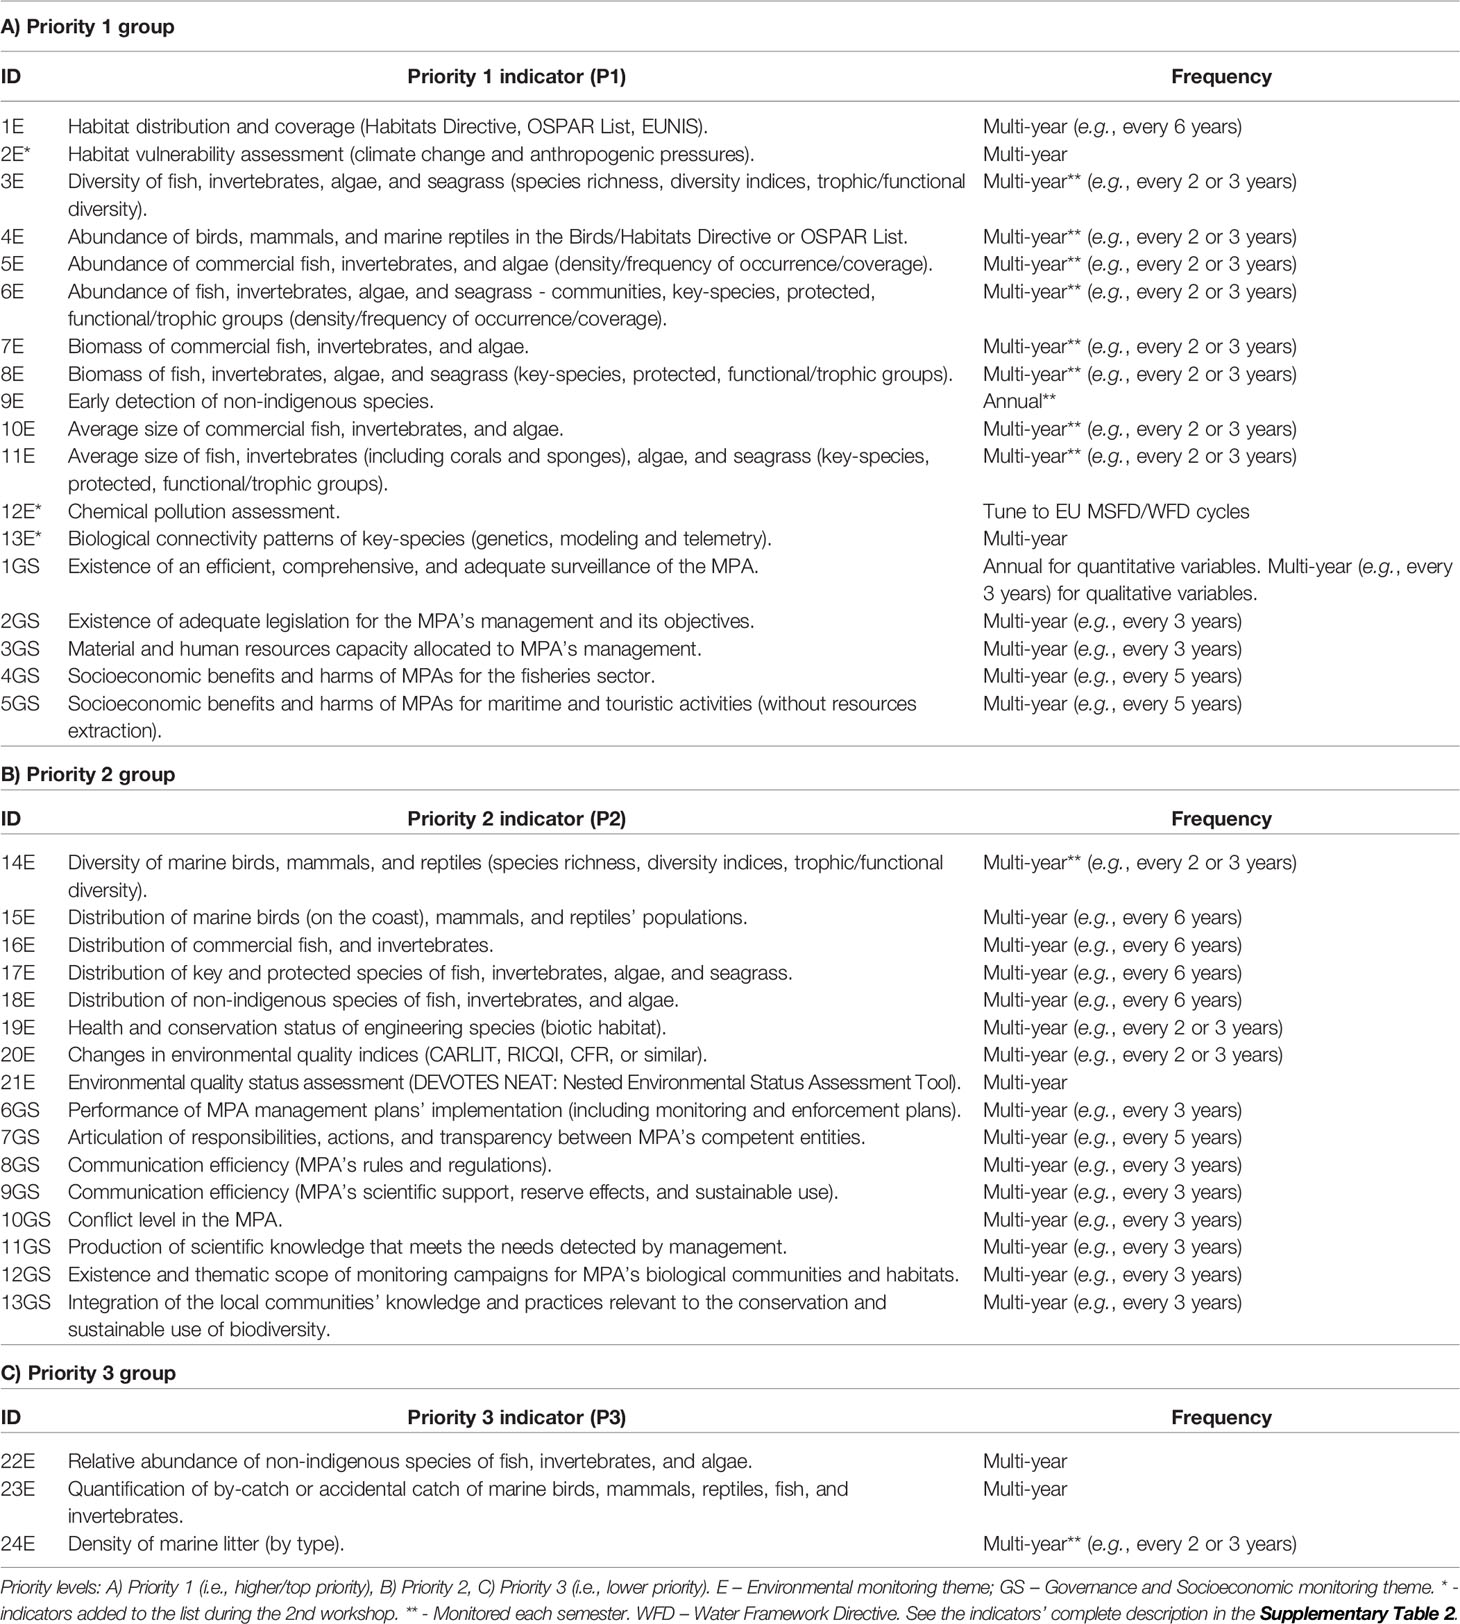
Table 3 Shortlist of performance indicators for Portuguese mainland MPAs grouped by priority level and their minimum monitoring frequencies or reporting frequencies for environmental, governance and socioeconomic indicators.
Despite the environmental indicators (monitoring theme E) being in greater number compared to the governance and socioeconomic indicators (monitoring theme GS) – which is justified by the inherent complexity of natural systems and the greater number of participants with background in natural sciences –, when scoring them independently (Workshop II), the group of participants considered both in the first priority group (Table 3). In Workshop III, participants widely accepted the priority groups (based on the relevance scores), with minor changes for both monitoring themes (in total, three out of 37 indicators changed the priority group).
Minimum monitoring frequencies were agreed for each indicator based on experts’ knowledge and practical experience (Table 3). Participants found it essential to coordinate monitoring cycles among indicators, as this allows for a better and more rationalized management of the resources allocated to monitoring activities. Indicators measuring abundance, diversity, biomass, and the average size of fish, invertebrates, algae, and seagrass should be monitored more frequently than others (monitored each semester every two or three years). Participants agreed that these indicators, which report on crucial variables of biological communities’ response to protection measures (abundance, diversity, biomass, and average size) could be monitored simultaneously with indicator 24E “Density of marine litter (by type)” (Priority 3 group). Thus, minimum monitoring frequencies were harmonized among them.
On the other hand, indicators reporting the distribution of habitats and species (i.e., mapping) require a much larger sampled area than the previous indicators. Therefore, the suggested minimum monitoring frequency is lower (every six years).
The ecosystem health status indicator 9E “Early detection of non-indigenous species”, assessed in port areas and marinas in the vicinity of MPAs, was agreed to be monitored each semester or annually, or in case of imminent threat. The indicator 12E “Chemical pollution assessment” should be monitored according to the monitoring periodicity to be defined in the national monitoring programs for descriptors 5 and 8 (EU MSFD). Thus, potentially derived from the minimum monitoring frequencies defined by the Member State based on the requirements laid down in (1) the water policy framework for Community action (European Directive 2000/60/EC), according to the established environmental quality standards, and (2) the Common Fisheries Policy (European Regulation 1380/2013).
The governance indicator “Existence of an efficient, comprehensive, and adequate enforcement of the MPA” has two variables that should be reported annually: “Location and extension of the enforcement area”, and “Number of events, or number of fines per surveillance event” (see the indicators’ complete description in Supplementary Table 2). The remaining governance indicators should be reported every three years, while socioeconomic indicators can be reported every five years.
Validation of the List According to National and International Commitments
At the end of the process, the final shortlist of prioritized indicators was validated by matching the indicators with the goals of (1) national MPAs (Supplementary Table 4), and (2) international commitments (EU MSFD, Natura 2000 network, OSPAR Convention, SDGs, and CBD, Table 4).
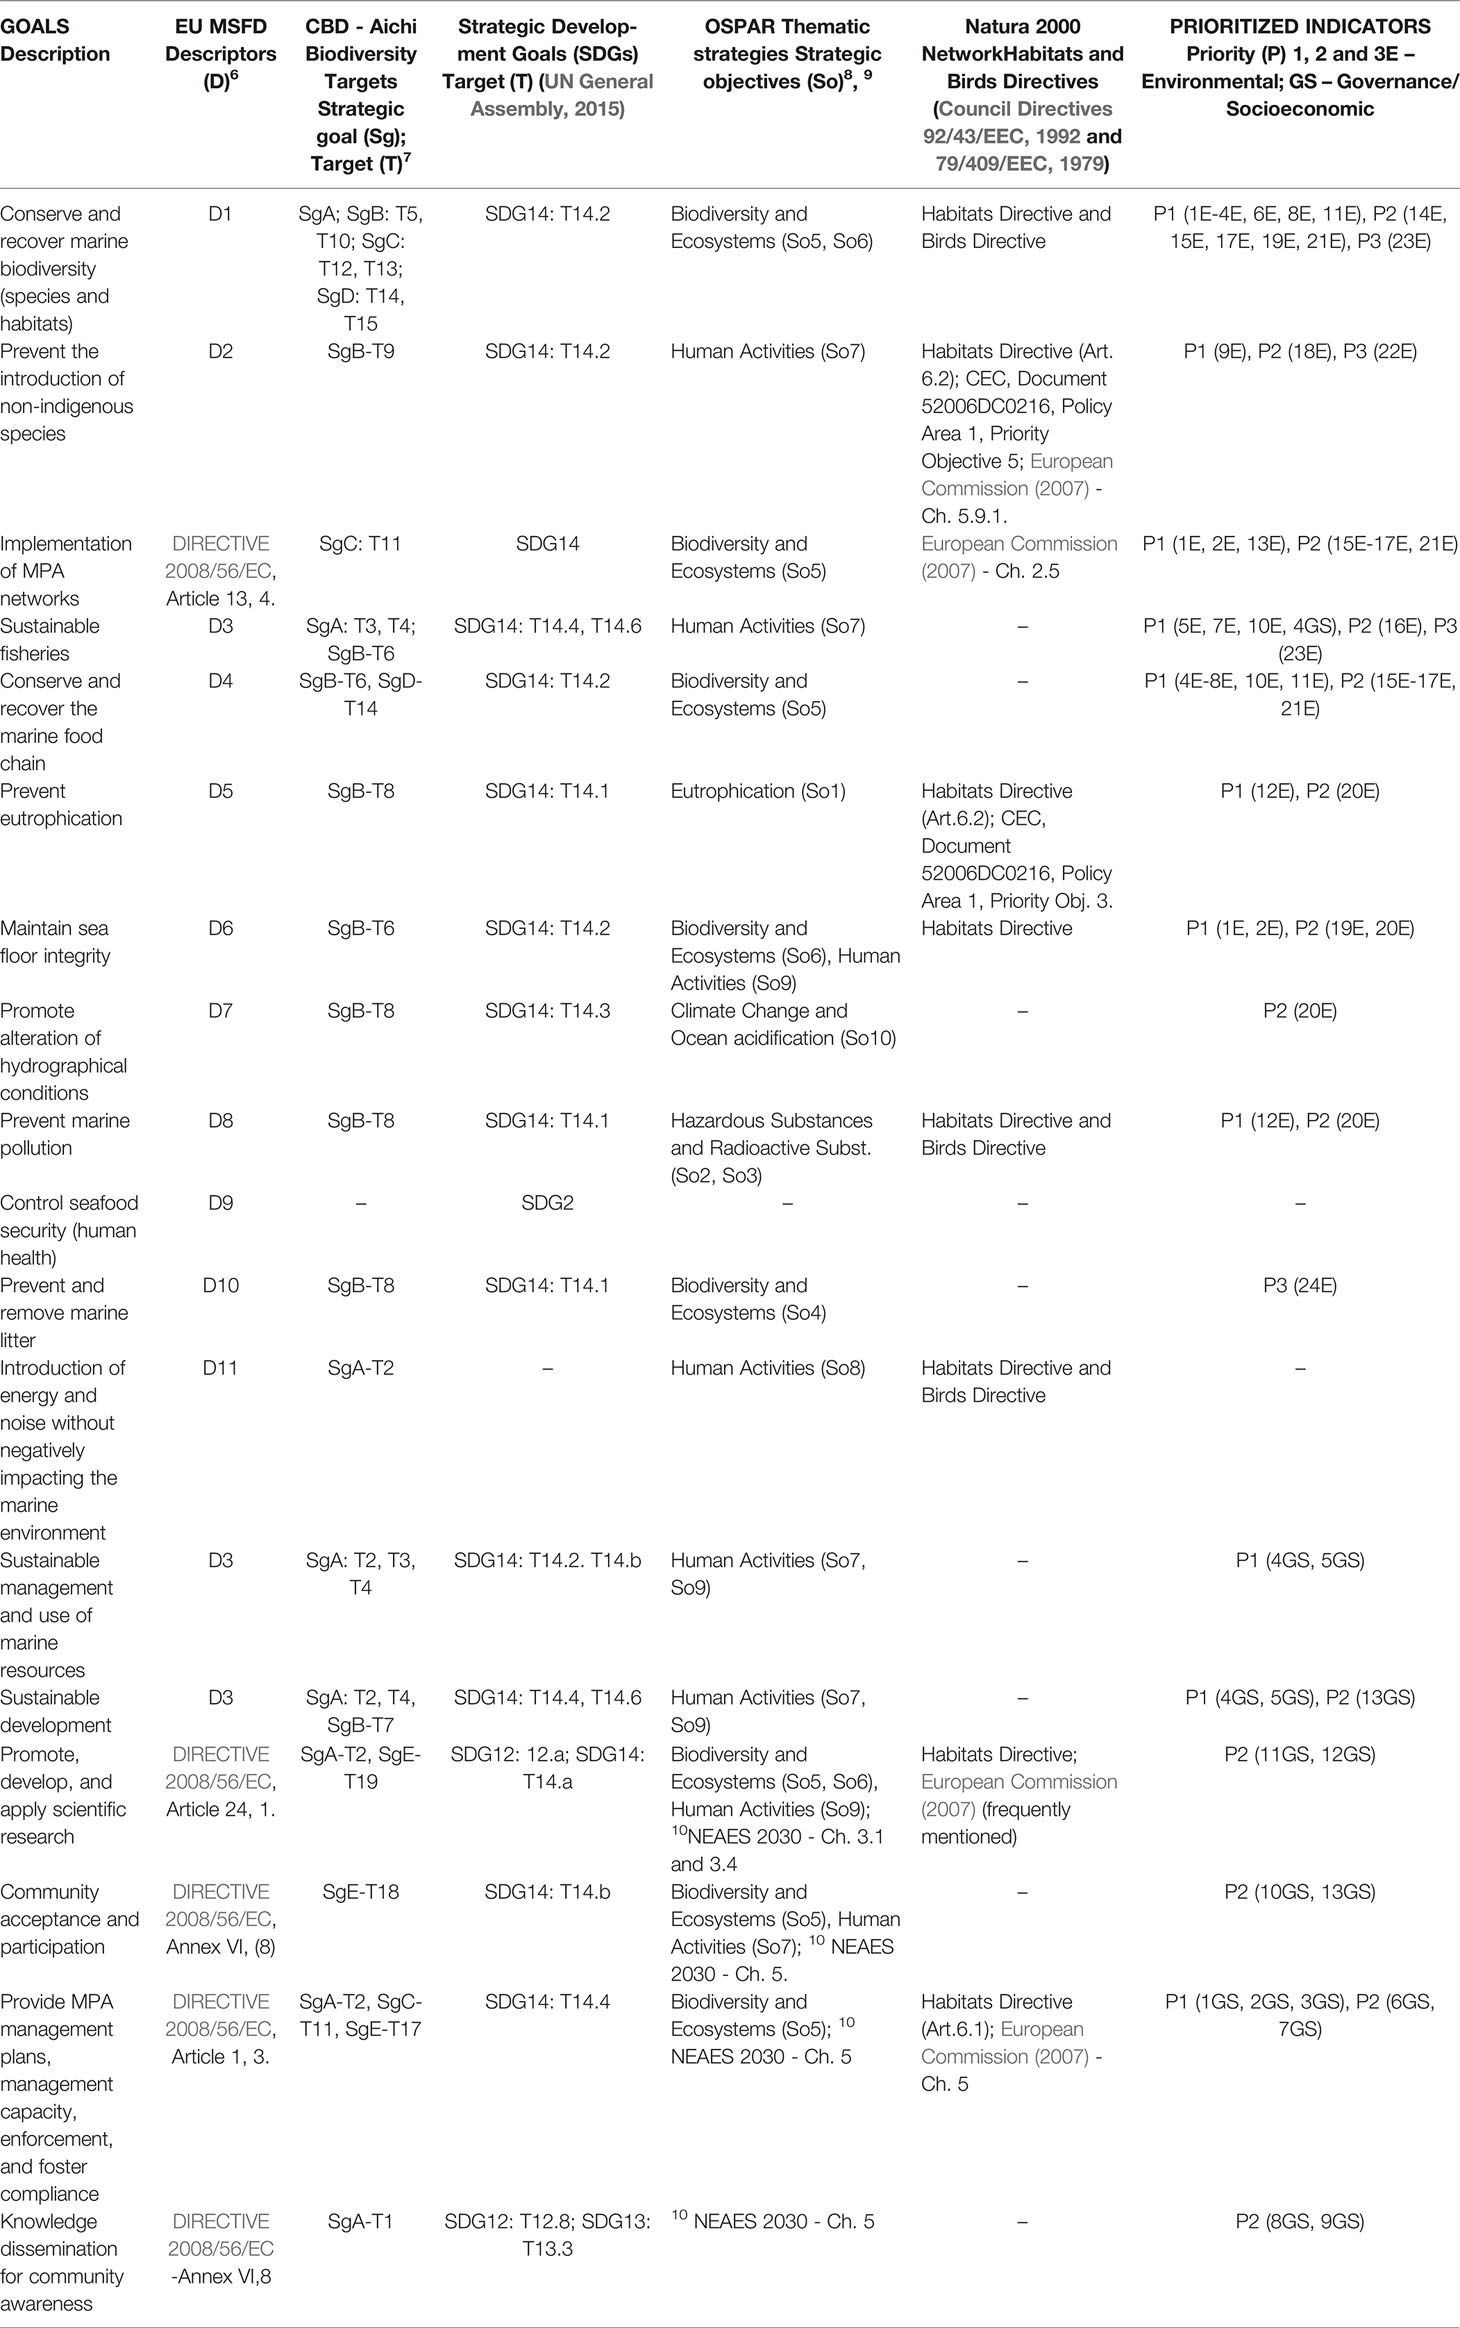
Table 4 Correspondence between the prioritized MPA performance indicators and the goals of international instruments that are relevant for the MPAs context.
MPA objectives oriented towards the goal “Conserve and recover marine biodiversity” were found to be the best represented by both the selected indicators and the international and national instruments.
Regarding the national goals (Figure 2), the shortlist of prioritized indicators serves all the 11 identified goals among the documents consulted (i.e., management plans of three coastal MPAs). Some of the indicators (e.g., 3GS: “Material and human resources capacity allocated to MPA’s management”), although not detailed in national MPA goals, were assumed as their enabling conditions. National MPA objectives were found to be mostly ambiguous and lack an operational dimension (i.e., measurability). The group assessed which national goals would not be met if it was not possible to monitor all the priority groups of indicators. In case of impossibility to monitor the Priority 3 group, all national goals would still be met. If only the Priority 1 group can be monitored, 4 out of 11 MPA goals would be left unassessed: “Promote, develop, and apply scientific research”; “Community awareness and participation”; “Cooperation and participation of stakeholders”; and “Knowledge dissemination for awareness”.
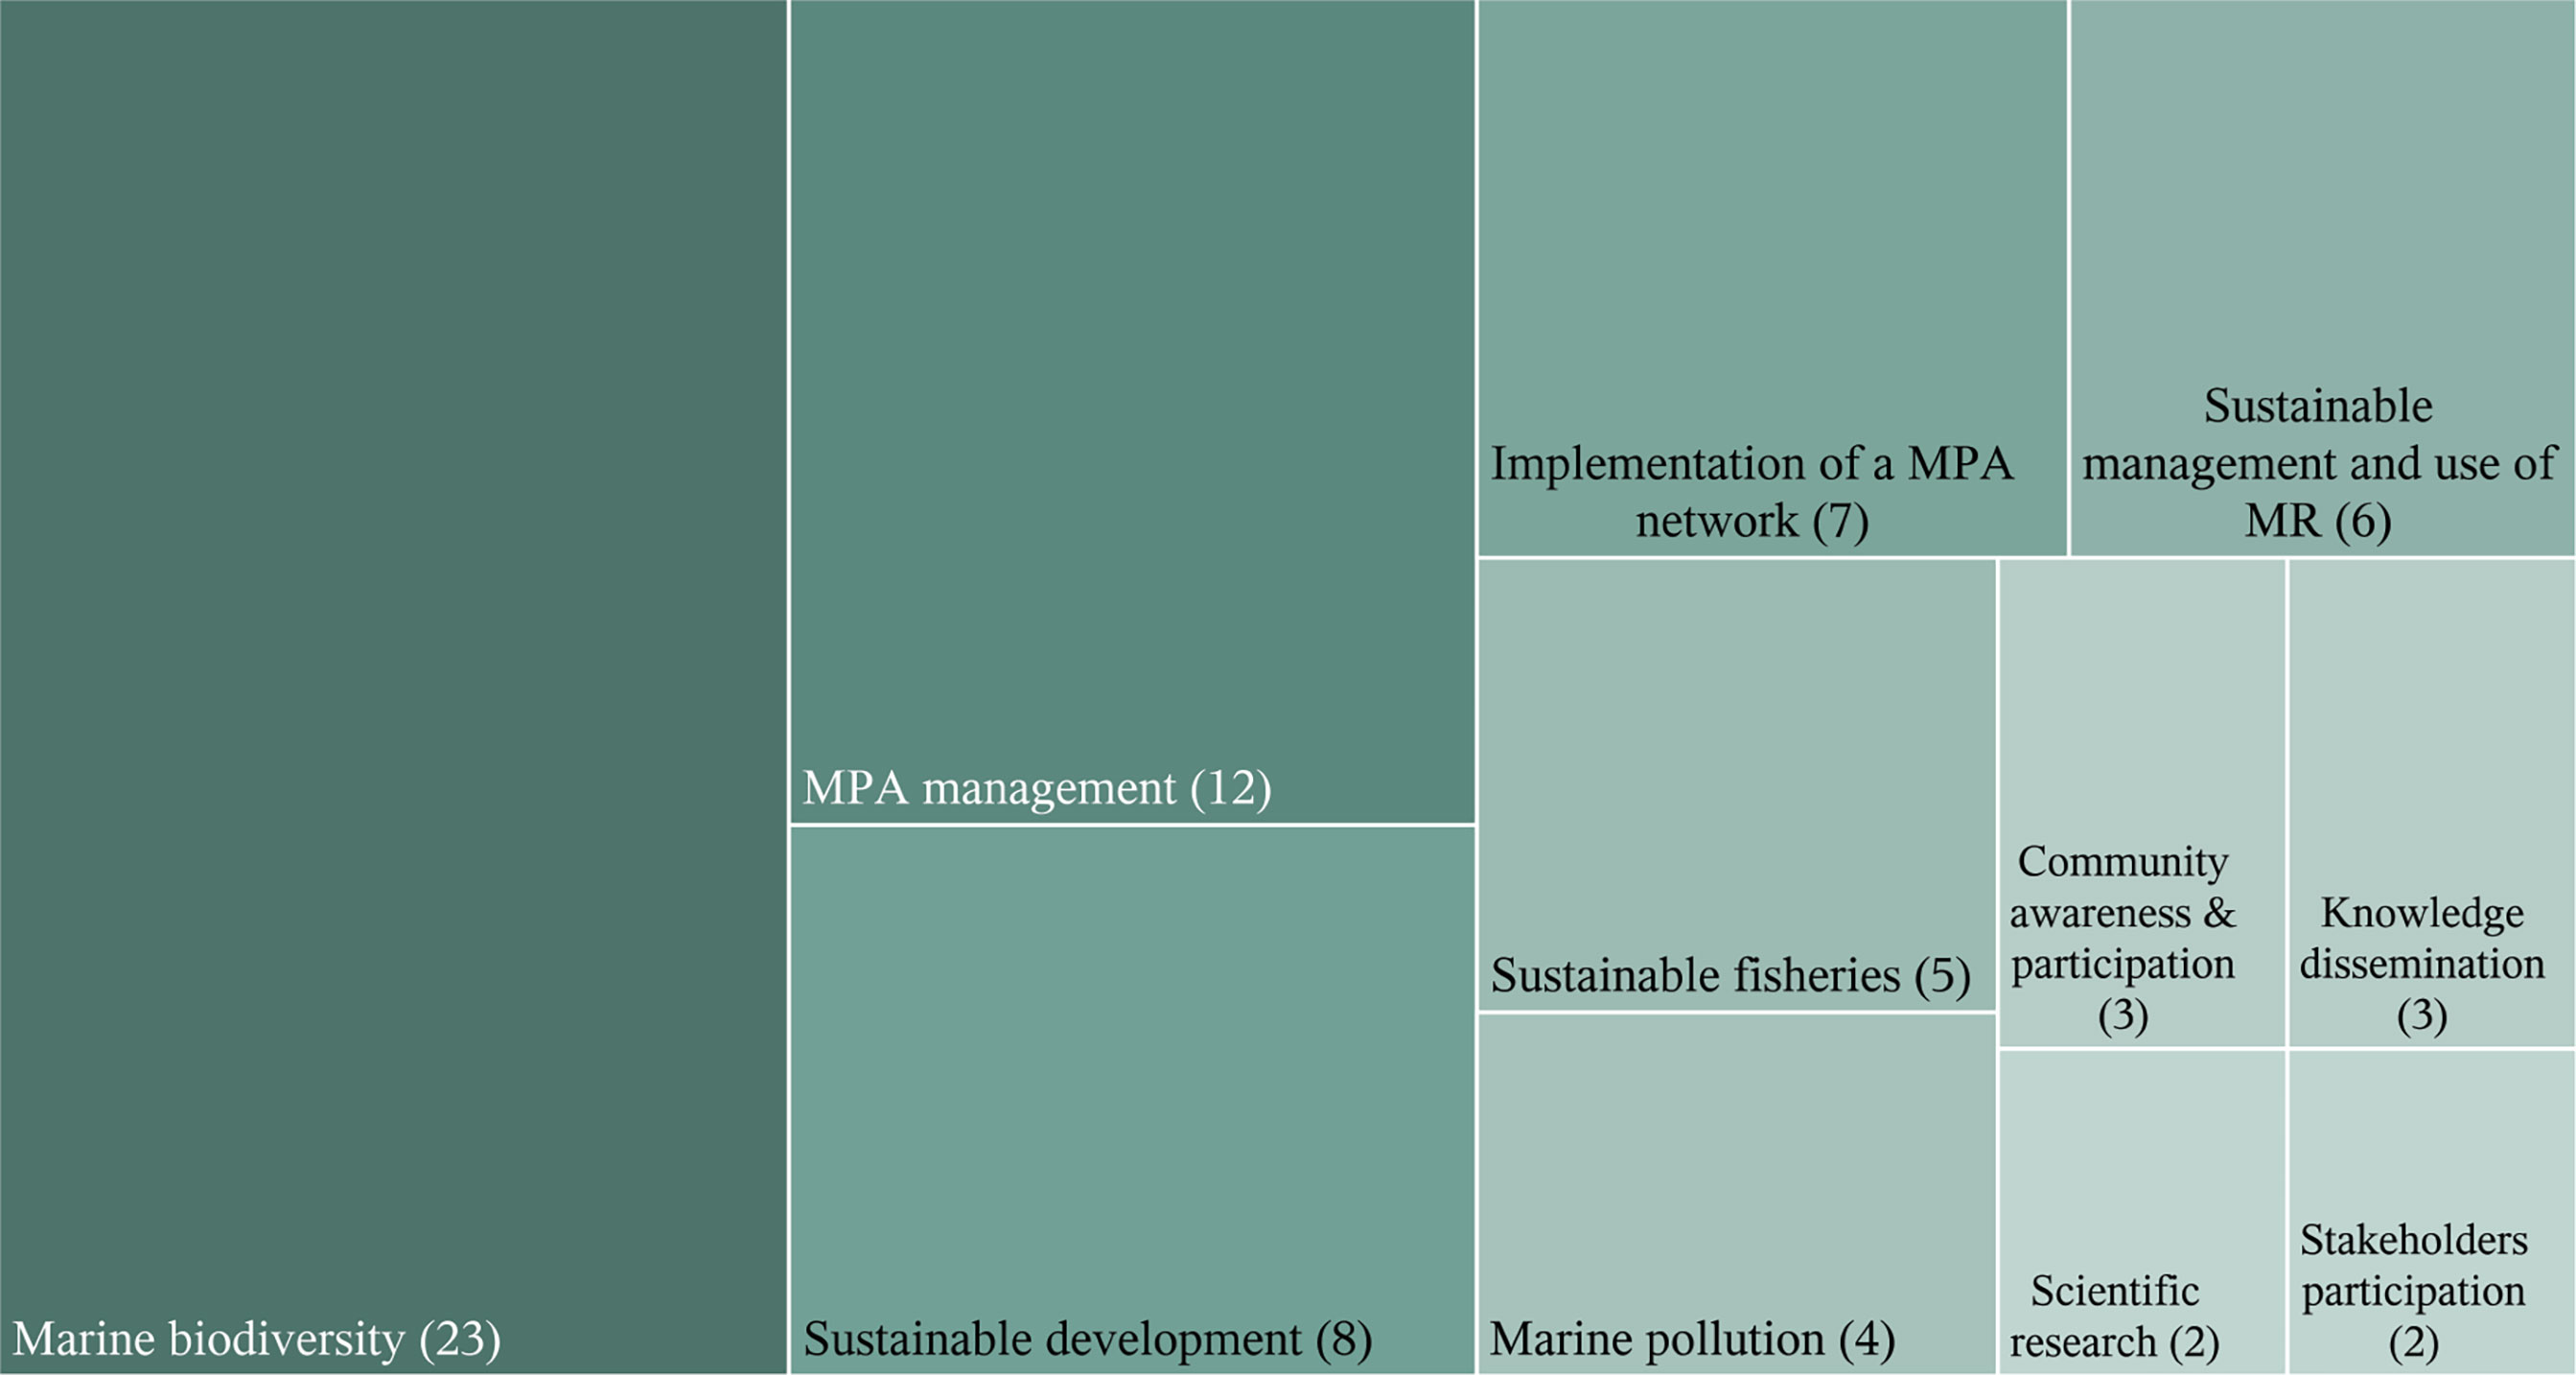
Figure 2 The comprehensiveness of the 37 prioritized indicators in relation to the identified national goals (from MPAs management plans; for further details see Supplementary Table 4). Goals are followed by the number of indicators serving them (in parenthesis). The area and shade of the polygons follow the number of indicators available for each identified goal. MR, Marine Resources.
Regarding the international goals (Figure 3 and Table 4), the shortlist of prioritized indicators serves 16 of the 18 goals identified in international instruments and agreements as compatible with the purposes of MPAs. The goals “Control seafood security” (related to human health), and “Introduction of energy and noise without negatively impacting the marine environment”, were not represented in the shortlist because they were not considered priority issues for coastal MPAs by the participants. Moreover, 8 of the 16 goals served by the prioritized indicators are transversal to all international commitments considered in this study. All cross-cutting goals were covered by top priority indicators (Priority 1 group), except one: “Promote, develop, and apply scientific research”; which was covered exclusively by Priority 2 indicators.
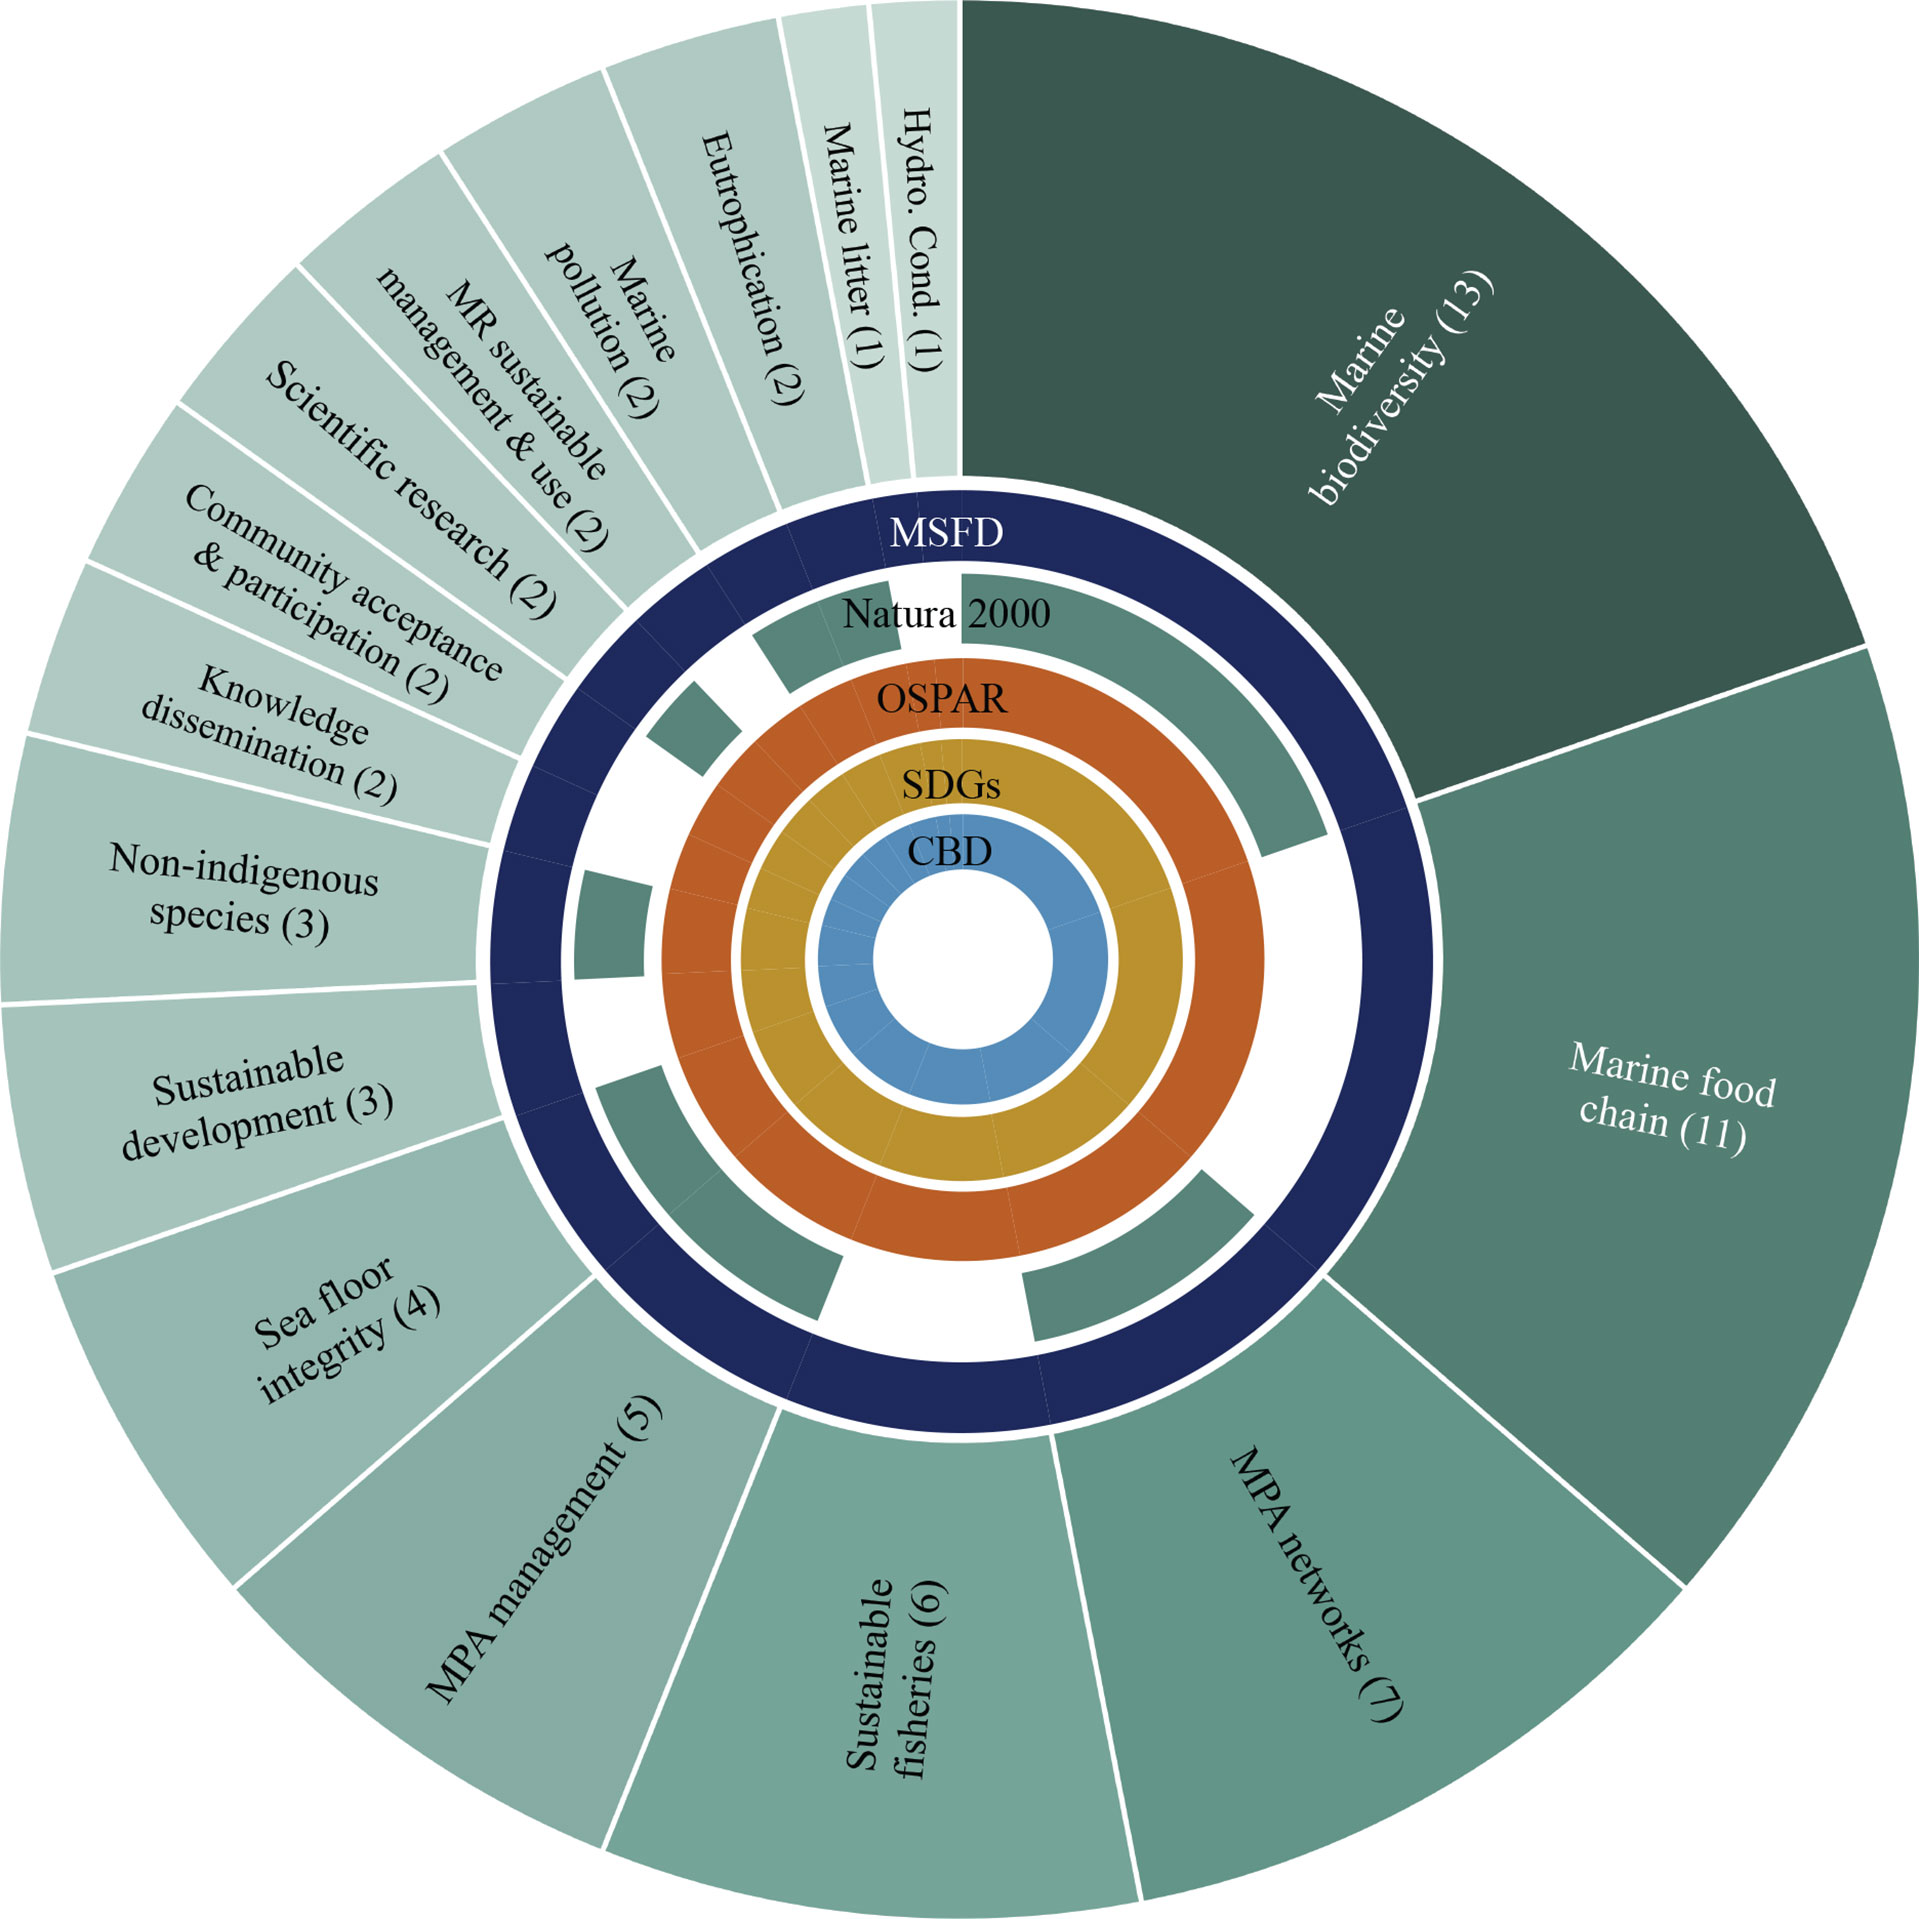
Figure 3 The comprehensiveness of the 37 prioritized indicators in relation to the identified international goals (from international instruments; for further details see Table 4). Goals are followed by the number of indicators serving them (in parenthesis). The area and shade of the pie chart’s slices follow the number of indicators available for each identified goal. The inner circles identify the international instruments to which the goals and indicators apply. The two goals not covered by the indicators are missing from this graph and were presented in Table 4. MR, Marine Resources; Hydro. Cond., Alteration of the hydrographical conditions.
The group also assessed which international goals (including those not covered by the Natura 2000) would not be met if it was not possible to monitor the three priority groups of indicators. In case it is only possible to monitor top priority indicators, 5 out of 18 MPA goals would be left unassessed: “Alteration of hydrographical conditions (including ocean acidification)”; “Prevent and remove marine litter”; “Promote, develop, and apply scientific research”; “Community acceptance and participation”; and “Knowledge dissemination for community awareness”. If Priority 1 and 2 groups are monitored, only the goal “Prevent and remove marine litter” would not be assessed (Table 4).
Survey Methods Observations
The results of the scoring process for the survey methods (Intersessional activity I) revealed a set of low-scoring methods (i.e., scored below the 33rd percentile) for several indicators (Table 5a). These methods obtained low scores for the following reasons: (1) high costs (multibeam/sonar scanning, ROV, remote sensing, dredges), (2) extractive methods (experimental fishing, dredges), (3) need to hire highly specialized staff, or to supply long-term specialized training (multibeam/sonar scanning, ROV, remote sensing, dredges), (4) slowness of the process (dredges). The method of by-catch analysis was also low-scored because it is associated with extractive methods. Nevertheless, these catches are not a direct consequence of the monitoring activity. This is an observational method of fishing activity. Hence, it was not flagged as a low-scoring survey method.
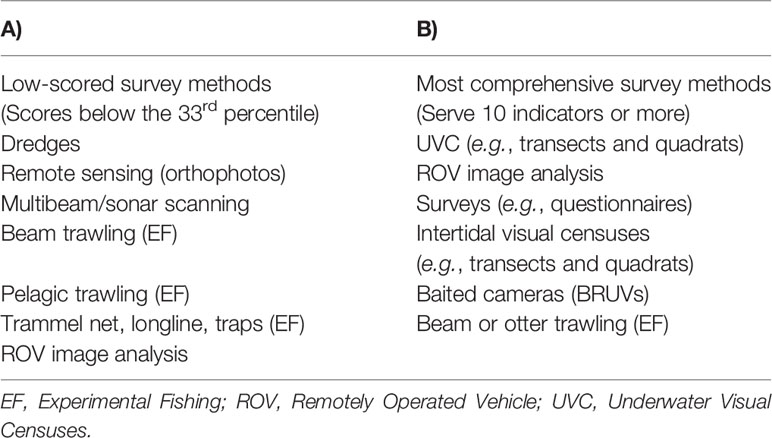
Table 5 Indicator’s survey methods A) with low scoring – sorted according to their scores in ascending order (data from Workshop II) and B) the most comprehensive – sorted according to the number of indicators they serve in descending order (data from Workshop III).
The low-scored survey methods were contrasted with the most comprehensive survey methods (i.e., those allowing to obtain a greater number of prioritized indicators) listed in the final exercise of Workshop III (Table 5B). The most comprehensive survey methods were visual censuses (UVC and intertidal), image analysis collected by ROV and baited cameras (BRUV), surveys (e.g., questionnaires), and experimental fishing (beam trawling or otter trawling). The most contested methods were some types of experimental fishing, namely beam trawling or otter trawling, due to their negative biophysical impact and ethical concerns, and acoustic sampling with multibeam/sonar scanning for pelagic species, as those species are less likely to benefit from conservation measures of small coastal MPAs as the ones in mainland Portugal.
As previously mentioned, the extensive list of performance indicators presented a complex pairing between objects, variables, habitats, and survey methodologies. Every time one indicator had more than one survey method that could be used, it was split and scored independently, i.e., for the same indicator multiple scores were obtained during Intersessional activity I, based on the number of methods they were associated with. In this sense, it was expected that these indicators would obtain similar scores across the indicator output criteria, and only differ by the last five criteria that evaluate the survey method. However, some indicators obtained different scorings for the indicator output criteria according to the different methods selected.
Participant groups decided unanimously that the monitoring protocol should tend to integrate modern non-invasive survey methods to replace traditional methods that require capture (e.g., experimental fishing), typically more accurate in terms of taxonomic identification and biometric measuring (abundance, weight, length, sex, maturation, age, etc.). This replacement is complex, as it requires the calibration of modern methods to achieve equally accurate and efficient quantitative and qualitative results, and because it may preclude temporal comparisons with data already gathered via traditional methods. Thereof, methods that require capture were suggested to be used only sporadically, alternating with other non-invasive methods, which are improving with the new technological developments (e.g., ROV, BRUV, AUV and UAV).
Discussion
This study describes in detail both the process and the outputs of an expert-based methodology designed to achieve a prioritized list of performance indicators for coastal MPAs.
For one year, a total of 67 experts worked together face-to-face in three one-day workshops, and remotely, to achieve a final shortlist of 37 prioritized indicators, their adequate survey methods, and minimum monitoring frequencies. This shows that, in a feasible approach, management plans can incorporate monitoring programs with co-designed and validated lists of indicators.
Among the 37 indicators selected, 18 are of top priority, 13 of which are environmental and 5 are governance and socioeconomic indicators. More than a decade of studies and reviews about MPA performance indicators show that the biological response indicators attributed to this study’s top priority group are the most frequently used in the assessment of MPA protection, as these respond directly to MPAs’ main conservation goals (i.e., protecting marine biodiversity, recovering of targeted species/groups) (Claudet et al., 2006; Lester et al., 2009; Grorud-Colvert et al., 2021). More recent studies, also highlight the role of resource capacity as one of the main predictors of MPA success (e.g., Gill et al., 2017).
Indicators were prioritized to face the possibility of insufficient resources to monitoring. Top priority indicators were considered the most relevant and the ones that should be guaranteed. Further, by assigning methods and monitoring frequencies to indicators, it was evidenced that most environmental indicators within the top priority group could be monitored together. These are the ones requiring high expertise and resources to conduct work at sea. The remaining social and governance indicators rely on less expensive methods (e.g., surveys, questionnaires), and some could be assessed in tandem as well. Monitoring programs are designed to guide efficient monitoring; these 18 concerted indicators are more likely to be achieved with monitoring programs than without these instruments. Here we recommend that future monitoring programs integrate the co-prioritization of selected indicators, thereby clarifying which monitoring components are considered the most relevant by experts and practitioners (and possibly by other stakeholders) for assessing MPAs’ performance efficiently. Note that, if MPA success depends on diverse goals, the same diversity must be regarded by the indicators chosen to assess it. The composition of priority groups shows that participants assigned environmental, governance and socioeconomic indicators to the top priority group. Our results differ from Pendred et al. (2016)‘s, who reported higher priority attributed to ecological indicators over socioeconomic and governance indicators in their case study. MPAs have been increasingly recognized as social-ecological systems whose success depends on effective management, engagement, compliance, and enforcement (e.g., Di Franco et al., 2016; Grorud-Colvert et al., 2021). Different studies reinforce this idea of a recent paradigm shift in MPA monitoring (e.g., Trimble & Plummer, 2018; Pelletier, 2020).
In this study, the number of governance and socioeconomic indicators may be found asymmetric when compared to the number of environmental indicators. Depending on the management context of MPAs (traditional or co-management) and evaluation approach used to assess management effectiveness (Trimble & Plummer, 2018), the type of indicators selected and prioritized will likely vary. In addition to the stakeholder group composition and process design, this asymmetry can be justified by the greater importance attributed to environmental conservation goals in some MPA management plans relatively to socioeconomic and governance goals (Heck et al., 2012; Pendred et al., 2016), and the great complexity of marine ecosystems (Dale & Beyeler, 2001; Dunham et al., 2020). MPAs are planned to achieve a diversity of ecological outcomes supporting human uses and ecosystem services (Gallacher et al., 2016; Grorud-Colvert et al., 2021). This study selected indicators according to an extensive literature review in MPA monitoring and expert judgment, and attempted to accommodate a diverse and widely accepted set of MPA performance indicators.
In the present work, each workshop session was timely planned and consistently sought to solve pending issues and validate results from previous work. While developing and testing this methodological approach, some lessons were accrued and can be applied in the future (Box 1). This will allow starting the process at a more advanced and undemanding stage (e.g., merging indicators commonly monitored together before scoring them). A more straightforward and synthetic worktool (the shortlist) would avoid fatigue in criteria-based scoring exercises (e.g., Okey, 2018). The organizing team addressed this issue by splitting the list of indicators by heterogeneous groups and then revising and discussing each group sub-list of indicators at a plenary session (Box 1). Lessons learned also highlight the must-do steps contributing to the success of the process (e.g., a progressive approach, in which the outcomes of each exercise are validated in plenary sessions before moving forward to the following steps).
Box 1. Lessons learned through the process.
Efficiency lessons
✓ Extensive lists of indicators. To avoid overly extensive lists of indicators and possible redundancies from the start: a) The list should be organized by specific MPA goals to obtain the desired monitoring outcomes and avoid mutually redundant information; b) If reasonable, species or group of species that are usually monitored together, using similar variables and survey methods, should be merged into the same indicators.
✓ Group dynamics. The evaluation of lists of indicators is more efficient if the work is divided by small groups of experts and then discussed and consolidated in plenary sessions by all participants. Though, some redundancies between groups’ indicators may be desirable to address experts’ heterogeneous perceptions.
Effectiveness lessons
✓ A progressive participatory methodology. To review and validate each session’s results consistently, with sequential exercises validated in plenary sessions. This progressive approach facilitates the reach of consensus among peers and consolidates decision-making.
✓ A thoughtful partnership. Similar participatory approaches are likely to succeed when institutions that share responsibility for MPAs’ success (especially their management authority) are committed to the entire process.
✓ A diverse working group. Engaging a multidisciplinary group of experts (from academic institutions, public and administrative authorities, and environmental NGOs) to develop a list of prioritized MPA performance indicators, may not completely address the interests and values of non-experts in MPA management. Beyond the expert-based approach, a consultation with interest groups, such as local community representatives and other MPA users, or the development of a participatory process, could contribute to the diversity of indicators in the final list.
After determining adequate survey methods for each indicator, the group stressed that selecting and prioritizing the most cost-efficient monitoring methods for MPAs is still needed, and that non-intrusive forms should be privileged. Some indicators that could be measured with different survey methods obtained distinct scorings for the indicator output criteria (Intersessional activity I). This suggests that it was difficult to dissociate the indicators from the associated survey methodologies. One of the main factors that affects the quality of the indicator is the survey method used (Pomeroy et al., 2004), which, in turn, is dependent on the available resources (monetary, human and time resources; Pelletier, 2011), technical difficulty, the existence of comparable reference data, and even the knowledge or the experience that one has about its implementation in the context of MPA’s monitoring. This study posits that indicators’ relevance, in addition to varying according to different conservation goals, target species/groups or habitats, also varies with the assessors’ perception about the effectiveness, complexity and affordability of different survey methods and designs for each indicator. An important future step is to select and standardize the best methods for future national monitoring plans. This will avoid discrepancies in the survey methods used between monitoring teams within and between MPA networks (Pomeroy et al., 2004).
Participants also underlined the need to construct stable connectivity and climate change indicators to interpret cause-effect changes observed within MPAs (Zandvoort et al., 2017; Tittensor et al., 2019). Despite their recognized importance in this process (both were considered in the top priority group), participants struggled in defining complete indicators for them (Supplementary Table 2). The definition of connectivity indicators relies on overcoming important information gaps, some not easy to obtain at the MPA scale. These include marine species life history, large-scale spillover and larval dispersal, requiring clear indicators used at proper spatial scales, and the adequate transfer of this knowledge to managers (Olsen et al., 2013; Balbar & Metaxas, 2019). Moreover, MPA mitigation and adaptation strategies to climate change need to be informed by in situ empirical knowledge, i.e., they must be supported by monitoring data trends of a given region, and thus they need proper indicators with suitable time scales (Kay & Butenschön, 2018; Wilson et al., 2020; O’Regan et al., 2021). Following a recent review by Wilson et al. (2020), “lack of scientific information” (e.g., monitoring data at scales relevant to management) and “governance structure” (e.g., lack of clear MPA objectives) are main limitations for adapting MPA planning to climate change. These shortcomings are commonly referenced for connectivity and habitat vulnerability assessment indicators (Balbar & Metaxas, 2019; Stratoudakis et al., 2019; Willaert et al., 2019; Lausche et al., 2021).
Halfway through this process, an independent process took place, in which the Portuguese government approved strategic guidelines and recommendations for the implementation of a National Network of MPAs (Resolution of the Council of Ministers n.o 143/2019, 2019). This study’s shortlist of prioritized indicators is to report on single MPAs’ performance and should be regarded as a complementary tool to this instrument when evaluating network success. Indeed, network success is dependent on single MPAs’ success and their ecological coherence (Green et al., 2011).
The proposed shortlist of prioritized indicators is thematically comprehensive, addressing most of the EU MSFD GES Descriptors (except for the monitoring of food safety and underwater noise) and other important goals set out in relevant international commitments (i.e., Natura 2000 network, OSPAR Convention, CBD Aichi Biodiversity Targets and the SDGs 2030 Agenda). Thus, it can serve as a tool to carry out useful comparisons with other lists developed for MPA monitoring programs of different countries and regions. As the instruments supporting effective implementation and management of MPAs and their networks are being developed and refined, lists of indicators should guide national agencies on their pursue to fulfilling these international MPA-related commitments. Furthermore, by overlapping the shortlist of prioritized indicators with the goals set out in the management plans of the national coastal MPAs, we found that the proposed indicators are more detailed than the objectives, which are mostly ambiguous and non-operational. The report by WWF & Sky Ocean Rescue (2019) stated that numerous MPA management plans failed to define clear and measurable objectives. In this regard, several authors stressed the importance of clearly defining MPA objectives and quantifiable indicators and thresholds (O’Regan et al., 2021). In this sense, future management plans for national MPAs or the review of existing ones should address comprehensively the goals of national and international commitments. This requires defining clear objectives accompanied by measurable indicators, and thresholds, that allow assessing whether MPA and MPA network objectives are being achieved.
Further work is necessary to develop a complete MPA evaluation process. MPA monitoring programs benefit from more inclusive approaches, such as participatory processes, as recommended by several authors (e.g., Pomeroy et al., 2004; Trimble & Plummer, 2018), aiming at better representing the values and interests of non-experts. For instance, a consultation with local community representatives and other MPA users could add to the selection of socioeconomic indicators. This study also suggests the recognition of expert-based and participatory processes as complementary approaches, in order to build increasingly effective and feasible management tools.
The expert-based approach adopted in this work provides an example of how to define and prioritize a mutually agreed list of MPA performance indicators through structured collaborative work. The level of interaction promoted through group exercises followed by face-to-face discussions of their results, allowed effective communication, as it provided several opportunities for optimized debates. Groups of experts from different disciplines (from the natural and social sciences), and in MPA monitoring, management, and governance worked together to meet the goals of this process, i.e., to create a valuable MPA monitoring tool. Most importantly, this expert-based methodology can guide MPA managers, monitoring teams and policymakers on how to design multidisciplinary lists of MPA performance indicators for effective monitoring programs. It also synthesizes the lessons learned, allowing fruitful future adaptations of the proposed approach.
Data Availability Statement
The original contributions presented in the study are included in the article/Supplementary Material. Further inquiries can be directed to the corresponding author.
Author Contributions
MC-A, BH, and JG conceived and designed the study. MC-A wrote the manuscript with BH, JG, and HQ. All authors participated in all stages of the participatory process and contributed to the discussion of results and manuscript review. All authors approved the manuscript.
Funding
The authors would like to acknowledge the PO SEUR program (Operational Program for Sustainability and Efficient Use of Resources; Portugal 2020 Strategy) as the main financial supporter of OMARE (POSEUR-03-2215-FC-000045), MARSW (POSEUR-03-2215-FC-000046), and INFORBIOMARES (POSEUR-03-2215-FC-000047) projects. The authors wish to acknowledge the financial support of the Municipality of Esposende to the OMARE project (POSEUR-03-2215-FC-000045), and the Municipalities of Aljezur, Vila do Bispo, and Odemira, and Fundo Ambiental to the MARSW project (POSEUR-03-2215-FC-000046).The Portuguese Foundation for Science and Technology (FCT) and the Ministério da Ciência, Tecnologia e Ensino Superior (MCTES) financed: CESAM through projects UIDP/50017/2020, UIDB/50017/2020 and LA/P/0094/2020; CCMAR through projects UIDB/04326/2020, UIDP/04326/2020 and LA/P/0101/2020; MARE through projects UID/MAR/04292/2019, UIDB/04292/2020 and UIDP/04292/2020; and CIIMAR through projects UIDB/04423/2020 and UIDP/04423/2020. This study also had the support of FCT through PTDC/BIA-ECO/28687/2017 (ReefNets). Several researchers were supported by national funds from FCT: AB through a doctoral grant (UI/BD/151307/2021); AFS through a doctoral grant (SFRH/BD/131868/2017); BHC through a research contract (DL57/2016/CP1361/CT0038) in agreement with the University of Algarve and in the scope of Norma Transitória; BRQ through a research contract (2020.02413.CEECIND); GF through a doctoral grant (PD/BD/128172/2016); MCA through a doctoral grant (PD/BD/143087/2018); MR through a post-doctoral grant (SFRH/BPD/116307/2016); NSH through a doctoral grant (2020.05583.BD); SH and MP through a research contract (DL57/2016/CP1479/CT0021 and DL57/2016/CP1479/CT0020, respectively); S.R. through a research contract (DL 57/2016/CP1344/CT0020). FO was supported by project HABMAR (grant no. MAR-01.04.02-FEAMP-0018) and co-financed by the European Maritime and Fisheries Fund (EMFF) of the Operational Program MAR 2020 for Portugal (Portugal 2020).
Conflict of Interest
The authors declare that the research was conducted in the absence of any commercial or financial relationships that could be construed as a potential conflict of interest.
Publisher’s Note
All claims expressed in this article are solely those of the authors and do not necessarily represent those of their affiliated organizations, or those of the publisher, the editors and the reviewers. Any product that may be evaluated in this article, or claim that may be made by its manufacturer, is not guaranteed or endorsed by the publisher.
Acknowledgments
We thank the scientific coordination and the projects’ execution teams: MARSW (POSEUR-03-2215-FC-000046), INFORBIOMARES (POSEUR-03-2215-FC-000047), and OMARE (POSEUR-03-2215-FC-000045), for making this process and work possible. We thank the CCMAR, MARE-ULisboa, MARE-UÉvora, MARE-ISPA, MARE-UCoimbra and CIIMAR teams involved in the latest mentioned projects for their support in the proposed activities and sessions, and for their participation in the process. CCMAR: Diogo Paulo, Ester A. Serrão, João Pontes, João T. Tavares, Jorge Assis, Karim Erzini, Rita C. Abecasis, Rui Santos; MARE-ISPA: Maria Jiménez, Noélia Rios; MARE-UCoimbra: João Neto, Tiago Verdelhos; CIIMAR: Joana Xavier, João Franco; Henrique N. Cabral (INRAE, France). We thank Cristina Pita (UAveiro), Graça Jorge (Ministry of the Sea), Inês Trigo (DGPM, Directorate-General for Marine Policy) and Rita Sá (ANP|WWF) for their enlightening contribution provided during the intersessional activities. We thank the promoter Liga para a Proteção da Natureza (LPN), and its representative Gonçalo Prista, for his participation, fruitful interactions, and suggestions during the workshops. We thank Agência Portuguesa do Ambiente (APA), and its representative Paula Gaspar for her participation. We thank the Instituto da Conservação da Natureza e das Florestas (ICNF) for the opportunity to support decision-making in an innovative expert-based process. We thank Ana Margarida Magalhães, António Miranda, Carla Santos, Duarte Figueiredo, José Baptista, Luís Ferreira, Luísa Jorge, Mário Reis, Pedro Ivo and Valentina Calixto. We also thank José Pinto (LSTS FEUP), Keila Lima (LSTS FEUP), Marisa Pinheiro (UMinho), Eduardo Pereira (UMinho) Teresa Moura (IPMA) and Yorgos Stratoudakis (IPMA) for their participation and support during the process. The content of this manuscript appeared partially in a project report, in Portuguese.
Supplementary Material
The Supplementary Material for this article can be found online at: https://www.frontiersin.org/articles/10.3389/fmars.2022.848039/full#supplementary-material
Supplementary Data Sheet 1 | Process workflow.
Supplementary Table 1 | Extensive list of indicators.
Supplementary Table 2 | Shortlist of prioritized indicators.
Supplementary Table 3 | Indicators' survey methods.
Supplementary Table 4 | Correspondence between the prioritized indicators and national goals.
Footnotes
- ^ https://mcc.jrc.ec.europa.eu/main/index.py
- ^ https://oap.ospar.org/en/ospar-assessments/intermediate-assessment-2017/introduction/policy-context/
- ^ https://www.ospar.org/documents?v=46337/
- ^ https://unstats.un.org/sdgs/report/2020/goal-14/
- ^ https://www.cbd.int/sp/targets/
- ^ https://mcc.jrc.ec.europa.eu/main/index.py
- ^ https://www.cbd.int/sp/targets/
- ^ https://oap.ospar.org/en/ospar-assessments/intermediate-assessment-2017/introduction/policy-context/
- ^ https://www.ospar.org/documents?v=46337
- ^ https://www.ospar.org/documents?v=46337
References
Álvarez-Fernández I., Fernández N., Sánchez-Carnero N., Freire J. (2017). The Management Performance of Marine Protected Areas in the North-East Atlantic Ocean. Marine Policy. Mar Policy 76, 159–168. doi: 10.1016/j.marpol.2016.11.031
Andrade M., Gonçalves J. M. S., Rangel M., Sousa I., Belackova A., Bentes L., et al. (2020). Definição Da Lista De Indicadores De Monitorização Das Áreas Marinhas Protegidas Portuguesas. MARSW, INFORBIOMARES, OMARE. Lista De Indicadores do Estado De Conservação Dos Habitats E Espécies Sensíveis Com Interesse Comercial. III Relatório Técnico do Projeto MARSW. Faro, 26.
Balbar A. C., Metaxas A. (2019). The Current Application of Ecological Connectivity in the Design of Marine Protected Areas. Global Ecol. Conserv. 17, e00569. doi: 10.1016/j.gecco.2019.e00569
Beliaeff B., Pelletier D. (2011). A General Framework for Indicator Design and Use With Application to the Assessment of Coastal Water Quality and Marine Protected Area Management. Ocean. Coastal. Manage. 54 (1), 84–92. doi: 10.1016/j.ocecoaman.2010.10.037
Bell J. J., Biggerstaff A., Bates T., Bennett H., Marlow J., McGrath E., et al. (2017). Sponge Monitoring: Moving Beyond Diversity and Abundance Measures. Ecol. Indic. 78, 470–488. doi: 10.1016/j.ecolind.2017.03.001
Borja A., Garmendia J. M., Menchaca I., Uriarte A., Sagarmínaga Y. (2019). Yes, We Can! Large-Scale Integrative Assessment of European Regional Seas, Using Open Access Databases. Front. Mar. Sci. 6. doi: 10.3389/fmars.2019.00019
Burrows M. T., Mieszkowska N., Hawkins S. J. (2014). Marine Strategy Framework Directive Indicators for UK Rocky Shores. Part 1: Defining and Validating the Indicators JNCC Report, No. 522 (Peterborough, England: JNCC), 94 pp.
Chapman K., Boschetti F., Fulton E., Horwitz P., Jones T., Scherrer P., et al. (2017). Knowledge That Acts: Evaluating the Outcomes of a Knowledge Brokering Intervention in Western Australia’s Ningaloo Region. Environ. Manage. 60 (5), 896–907. doi: 10.1007/s00267-017-0917-1
Claudet J., Pelletier D., Jouvenel J. Y., Bachet F., Galzin R. (2006). Assessing the Effects of Marine Protected Area (MPA) on a Reef Fish Assemblage in a Northwestern Mediterranean Marine Reserve: Identifying Community-Based Indicators. Biol. Conserv. 130 (3), 349–369. doi: 10.1016/j.biocon.2005.12.030
Council Directive 79/409/EEC (1979). Of 2 April 1979 on the Conservation of Wild Birds, (European Council). Luxembourg, The Council of the European Communities.
Council Directive 92/43/EEC (1992). Of 21 May 1992 on the Conservation of Natural Habitats and of Wild Fauna and Flora, 206/7, (European Council). Brussels, Belgium, The Council of the European Communities
Dale V. H., Beyeler S. C. (2001). Challenges in the Development and Use of Ecological Indicators. Ecol. Indic. 1 (1), 3–10. doi: 10.1016/S1470-160X(01)00003-6
Day J. C. (2017). Effective Public Participation is Fundamental for Marine Conservation—Lessons From a Large-Scale MPA. Coastal. Manage. 45 (6), 470–>86. doi: 10.1080/08920753.2017.1373452
Day J., Dudley N., Hockings M., Holmes G., Laffoley D., Stolton S., et al. (2012). Guidelines for Applying the IUCN Protected Area Management Categories to Marine Protected Areas (Gland, Switzerland: IUCN), 36 pp.
Decree-Law N.o 142/2008 (2008). Series I of July 2008., 1(Portuguese Ministry of the Environment Land Use Planning and Regional Development).
Di Franco A., Thiriet P., Di Carlo G., Dimitriadis C., Francour P., Gutiérrez N. L., et al. (2016). Five Key Attributes can Increase Marine Protected Areas Performance for Small-Scale Fisheries Management. Sci. Rep. 6 (1), 1–9. doi: 10.1038/srep38135
Directive 2008/56/EC (2008). Of the European Parliament and of the Council of 17 June 2008 Establishing a Framework for Community Action in the Field of Marine Environmental Policy (Marine Strategy Framework Directive), (European Parliament & European Council). Strasbourg, France: The European Parliament and the Council of the European Union.
Directive 2009/147/EC (2009). Of the European Parliament and of the Council of 30 November 2009 on the Conservation of Wild Birds, 20/7, (testimony of European Parliament & European Council). Brussels, Belgium: The European Parliament and the Council of the European Union.
Dunham A., Dunham J. S., Rubidge E., Iacarella J. C., Metaxas A. (2020). Contextualizing Ecological Performance: Rethinking Monitoring in Marine Protected Areas. Aquat. Conserv.: Mar. Freshw. Ecosys. 30 (10), 2004–2011. doi: 10.1002/aqc.3381
Ehler C. N. (2003). Indicators to Measure Governance Performance in Integrated Coastal Management. Ocean. Coastal. Manage. 46 (3), 335–345. doi: 10.1016/S0964-5691(03)00020-6
European Commission. (2007) Guidelines for the Establishment of the Natura 2000 Network in the Marine Environment . Application of the Habitats and Birds Directives. Available at: https://ec.europa.eu/environment/nature/natura2000/marine/docs/marine_guidelines.pdf.
Gallacher J., Simmonds N., Fellowes H., Brown N., Gill N., Clark W., et al. (2016). Evaluating the Success of a Marine Protected Area: A Systematic Review Approach. J. Environ. Manage. 183, 280–93. doi: 10.1016/j.jenvman.2016.08.029
Garces L. R., Pido M. D., Tupper M. H., Silvestre G. T. (2013). Evaluating the Management Effectiveness of Three Marine Protected Areas in the Calamianes Islands, Palawan Province, Philippines: Process, Selected Results and Their Implications for Planning and Management. Ocean. Coastal. Manage. 81, 49–57. doi: 10.1016/j.ocecoaman.2012.07.014
Gill D. A., Mascia M. B., Ahmadia G. N., Glew L., Lester S. E., Barnes M., et al. (2017). Capacity Shortfalls Hinder the Performance of Marine Protected Areas Globally. Nature 543 (7647), 665–669. doi: 10.1038/nature21708
Greathead C., Magni P., Vanaverbeke J., Buhl-Mortensen L., Janas U., Blomqvist M., et al. (2020). A Generic Framework to Assess the Representation and Protection of Benthic Ecosystems in European Marine Protected Areas. Aquat. Conserv.: Mar. Freshw. Ecosys. 30 (7), 1253–1275. doi: 10.1002/aqc.3401
Green B. N., Johnson C. D. (2015). Interprofessional Collaboration in Research, Education, and Clinical Practice: Working Together for a Better Future. J. Chiropractic. Educ. 29 (1), 1–10. doi: 10.7899/jce-14-36
Green S. J., White A. T., Christie P., Kilarski S., Meneses A. B. T., Samonte-Tan G., et al. (2011). Emerging Marine Protected Area Networks in the Coral Triangle: Lessons and Way Forward. Conserv. Soc. 9 (3), 173–188. doi: 10.4103/0972-4923.86986
Grorud-Colvert K., Sullivan-Stack J., Roberts C., Constant V., Horta E Costa B., Pike E. P., et al. (2021). The MPA Guide: A Framework to Achieve Global Goals for the Ocean. Science 373 (6560), eabf0861. doi: 10.1126/science.abf0861
Heck N., Dearden P., McDonald A. (2011). Stakeholders’ Expectations Towards a Proposed Marine Protected Area: A Multi-Criteria Analysis of MPA Performance Criteria. Ocean. Coastal. Manage. 54 (9), 687–695. doi: 10.1016/j.ocecoaman.2011.07.003
Heck N., Dearden P., McDonald A. (2012). Insights Into Marine Conservation Efforts in Temperate Regions: Marine Protected Areas on Canada’s West Coast. OCEAN. COASTAL. Manage. 57, 10–20. doi: 10.1016/j.ocecoaman.2011.11.008
Heink U., Kowarik I. (2010). What are Indicators? On the Definition of Indicators in Ecology and Environmental Planning. Ecol. Indic. 10 (3), 584–593. doi: 10.1016/j.ecolind.2009.09.009
Himes A. H. (2007a). Performance Indicators in MPA Management: Using Questionnaires to Analyze Stakeholder Preferences. Ocean. Coastal. Manage. 50 (5), 329–351. doi: 10.1016/j.ocecoaman.2006.09.005
Himes A. H. (2007b). Performance Indicator Importance in MPA Management Using a Multi-Criteria Approach. Coastal. Manage. 35 (5), 601–618. doi: 10.1080/08920750701593436
Horta e Costa B., Gonçalves J. M., dos S., Franco G., Erzini K., Furtado R., et al. (2019). Categorizing Ocean Conservation Targets to Avoid a Potential False Sense of Protection to Society: Portugal as a Case-Study. Mar. Policy 108, 103553. doi: 10.1016/j.marpol.2019.103553
IUCN-WCPA. (2008). Establishing Marine Protected Area Networks—Making It Happen (Washington, D.C., USA: IUCN-WCPA), 118 pp.
Izurieta A., Sithole B., Stacey N., Hunter-Xenie H., Campbell B., Donohoe P., et al. (2011). Developing Indicators for Monitoring and Evaluating Joint Management Effectiveness in Protected Areas in the Northern Territory, Australia. Ecol. Soc. 16 (3), 9. doi: 10.5751/ES-04274-160309
Kay S., Butenschön M. (2018). Projections of Change in Key Ecosystem Indicators for Planning and Management of Marine Protected Areas: An Example Study for European Seas. Estuarine Coastal. Shelf Sci. 201, 172–184. doi: 10.1016/j.ecss.2016.03.003
Kelleher G. (1999). “Guidelines For Marine Protected Areas. Best Practice Protected Area Guidelines Series No. 3,” in Guidelines For Marine Protected Areas (Gland, Switzerland and Cambridge, UK: IUCN), xxiv +107 pp.
Lausche B., Laur A., Collins M. (2021). Marine Connectivity Conservation “Rules of Thumb” For MPA and MPA Network Design. Version 1.0 (IUCN WCPA Connectivity Conservation Specialist Group’s Marine Connectivity Working Group). doi: 10.53847/jxqa6585;
Lester S. E., Halpern B. S., Grorud-Colvert K., Lubchenco J., Ruttenberg B. I., Gaines S. D., et al. (2009). Biological Effects Within No-Take Marine Reserves: A Global Synthesis. Mar. Ecol. Prog. Ser. 384, 33–46 doi: 10.3354/meps08029
Moffitt E. A., White J. W., Botsford L. W. (2013). Accurate Assessment of Marine Protected Area Success Depends on Metric and Spatiotemporal Scale of Monitoring. Mar. Ecol. Prog. Ser. 489, 17–28. doi: 10.3354/meps10425
OECD, Organisation for Economic Co-operation and Development (2003). OECD Environmental Indicators - Development, Measurement and Use - Reference Paper (Paris, France: OECD), 37 pp.
O’Hara C., Frazier M., Halpern B. (2021). At-Risk Marine Biodiversity Faces Extensive, Expanding, and Intensifying Human Impacts. Science 372, 84–87. doi: 10.1126/science.abe6731
Okey T. A. (2018). Indicators of Marine Ecosystem Integrity for Canada’s Pacific: An Expert-Based Hierarchical Approach. Sci. Total Environ. 645, 1114–1125. doi: 10.1016/j.scitotenv.2018.07.184
Olsen E. M., Johnson D., Weaver P., Goñi R., Ribeiro M. C., Rabaut M., et al. (2013). Achieving Ecologically Coherent MPA Networks in Europe: Science Needs and Priorities. Marine Board Position Paper 18. Eds. Larkin K. E., McDonough N. (Ostend, Belgium: European Marine Board).
O’Regan S. M., Archer S. K., Friesen S. K., Hunter K. L. (2021). A Global Assessment of Climate Change Adaptation in Marine Protected Area Management Plans. Front. Mar. Sci. 8 (711085). doi: 10.3389/fmars.2021.711085
OSPAR Commission. (2007). Background Document to Support the Assessment of Whether the OSPAR Network of Marine Protected Areas is Ecologically Coherent. Vilnius, Lithuania: Helsinki Commission
Pelletier D. (2011). “INDICATORS – Constructing and Validating Indicators of the Effectiveness of Marine Protected Areas,” in Marine Protected Areas: A Multidisciplinary Approach. Ed. Joachim C. (Cambridge: Cambridge University Press), (pp. 247–290). doi: 10.1017/CBO9781139049382.014
Pelletier D. (2020). Assessing the Effectiveness of Coastal Marine Protected Area Management: Four Learned Lessons for Science Uptake and Upscaling. Front. Mar. Sci. 7. doi: 10.3389/fmars.2020.545930
Pendred S., Fischer A., Fischer S. (2016). Improved Management Effectiveness of a Marine Protected Area Through Prioritizing Performance Indicators. Coastal. Manage. 44 (2), 93–115. doi: 10.1080/08920753.2016.1135272
Pomeroy R. S., Parks J. E., Watson L. M. (2004). How is Your MPA Doing? A Guidebook of Natural and Social Indicators for Evaluating Marine Protected Area Management Effectiveness (Gland, Switzerland and Cambridge, UK: IUCN), xvi + 216 pp.
Regulatory Decree n.o 23/98 (1998). Official Gazette N.O 237/1998, Series I-B of 14 October 1998, 5339, (Ministry of Environment). Lisbon, Portugal, Portuguese Ministry of the Environment Land Use Planning and Regional Development.
Resolution of the Council of Ministers n.o 11-B/2011 (2011). Official Gazette N.O 25/2011, 1st Supplement, Series I of 04 February 2011, 682, (Council of Ministers). Lisbon, Portugal: Portuguese Council of Ministers.
Resolution of the Council of Ministers n.o 141/2005 (2005). Official Gazette N.O 161/2005, Series I-B of 23 August 2005, 4857, (Council of Ministers). Lisbon, Portugal: Portuguese Council of Ministers.
Resolution of the Council of Ministers n.o 143/2019 (2019). Official Gazette N.O 165/2019, Series I of 29 August 2019, 37, (Council of Ministers). Lisbon, Portugal: Portuguese Council of Ministers.
Resolution of the Council of Ministers n.o 175/2008 (2008). Official Gazette N.O 228/2008, Series I of 24 November 2008, 4857, (Council of Ministers). Lisbon, Portugal: Portuguese Council of Ministers.
Roca G., Alcoverro T., Krause-Jensen D., Balsby T. J. S., Van Katwijk M. M., Marbà N., et al. (2016). Response of Seagrass Indicators to Shifts in Environmental Stressors: A Global Review and Management Synthesis. Ecol. Indic. 63, 310–323. doi: 10.1016/j.ecolind.2015.12.007
Secretariat of the Convention on Biological Diversity. (2020). Global Biodiversity Outlook 5 (Montreal, Canada: Secretariat of the Convention on Biological Diversity), 208 pp.
Stacey N., Izurieta A., Garnett S. T. (2013). Collaborative Measurement of Performance of Jointly Managed Protected Areas in Northern Australia. Ecol. Soc. 18 (1), 19. doi: 10.5751/ES-05273-180119
Stratoudakis Y., Hilário A., Ribeiro C., Abecasis D., Gonçalves E. J., Andrade F., et al. (2019). Environmental Representativity in Marine Protected Area Networks Over Large and Partly Unexplored Seascapes. Global Ecol. Conserv. 17, e00545. doi: 10.1016/j.gecco.2019.e00545
Tittensor D. P., Beger M., Boerder K., Boyce D. G., Cavanagh R. D., Cosandey-Godin A., et al. (2019). Integrating Climate Adaptation and Biodiversity Conservation in the Global Ocean. Sci. Adv. 5 (11), eaay9969. doi: 10.1126/sciadv.aay9969
Trimble M., Plummer R. (2018). Participatory Evaluation in Times of Governance Transition: The Case of Small-Scale Fisheries in Uruguay. Ocean. Coastal. Manage. 161, 74–83. doi: 10.1016/j.ocecoaman.2018.04.027
UN General Assembly. (2015). Resolution Adopted by the General Assembly on 25 September 2015. A/RES/70/1. Transforming Our World: The 2030 Agenda for Sustainable Development (New York: UN General Assembly).
Willaert T., García-Alegre A., Queiroga H., Cunha-e-Sá M. A., Lillebø A. I. (2019). Measuring Vulnerability of Marine and Coastal Habitats’ Potential to Deliver Ecosystem Services: Complex Atlantic Region as Case Study. Front. Mar. Sci.. 6 199, 199. doi: 10.3389/fmars.2019.00199
Wilson K. L., Tittensor D. P., Worm B., Lotze H. K. (2020). Incorporating Climate Change Adaptation Into Marine Protected Area Planning. Global Change Biol. 26 (6), 3251–3267. doi: 10.1111/gcb.15094
Wu W., Yan S., Feng R., Song D., Chen X. (2017). Development of an Environmental Performance Indicator Framework to Evaluate Management Effectiveness for Jiaozhou Bay Coastal Wetland Special Marine Protected Area, Qingdao, China. Ocean. Coastal. Manage. 142, 71–89. doi: 10.1016/j.ocecoaman.2017.03.021
WWF, & Sky Ocean Rescue. (2019). Protecting Our Ocean. Europe’s Challenges to Meet the 2020 Deadlines (Brussels, Belgium: WWF), 32 pp.
Zandvoort M., Campos I. S., Vizinho A., Penha-Lopes G., Lorencová E. K., van der Brugge R., et al. (2017). Adaptation Pathways in Planning for Uncertain Climate Change: Applications in Portugal, the Czech Republic and the Netherlands. Environ. Sci. Policy 78, 18–26. doi: 10.1016/j.envsci.2017.08.017
Keywords: marine protected area, MPA monitoring, marine and coastal management, performance indicators, marine conservation
Citation: Cardoso-Andrade M, Queiroga H, Rangel M, Sousa I, Belackova A, Bentes L, Oliveira F, Monteiro P, Sales Henriques N, Afonso CML, Silva AF, Quintella BR, Costa JL, Pais MP, Henriques S, Batista MI, Franco G, Gonçalves EJ, Henriques M, Leonardo T, Coelho P, Comas-González R, Fernández LP, Quiles-Pons C, Costa A, Espírito-Santo C, Castro JJ, Arenas F, Ramos S, Ferreira V, Gonçalves JMS and Horta e Costa B (2022) Setting Performance Indicators for Coastal Marine Protected Areas: An Expert-Based Methodology. Front. Mar. Sci. 9:848039. doi: 10.3389/fmars.2022.848039
Received: 03 January 2022; Accepted: 10 May 2022;
Published: 16 June 2022.
Edited by:
Romuald Lipcius, College of William & Mary, United StatesReviewed by:
Rafael Sarda, Spanish National Research Council (CSIC), SpainMicaela Trimble, South American Institute for Resilience and Sustainability Studies (SARAS), Uruguay
Copyright © 2022 Cardoso-Andrade, Queiroga, Rangel, Sousa, Belackova, Bentes, Oliveira, Monteiro, Sales Henriques, Afonso, Silva, Quintella, Costa, Pais, Henriques, Batista, Franco, Gonçalves, Henriques, Leonardo, Coelho, Comas-González, Fernández, Quiles-Pons, Costa, Espírito-Santo, Castro, Arenas, Ramos, Ferreira, Gonçalves and Horta e Costa. This is an open-access article distributed under the terms of the Creative Commons Attribution License (CC BY). The use, distribution or reproduction in other forums is permitted, provided the original author(s) and the copyright owner(s) are credited and that the original publication in this journal is cited, in accordance with accepted academic practice. No use, distribution or reproduction is permitted which does not comply with these terms.
*Correspondence: Mariana Cardoso-Andrade, bWFyaWFuYS5hbmRyYWRlQHVhLnB0