 Andrea M. Quattrini1,2*
 Santiago Herrera3
 J. Mike Adams2
 Jordi Grinyó4
 A. Louise Allcock5
 Andrew Shuler6
 Herman H. Wirshing1
 Erik E. Cordes7
 Catherine S. McFadden2
- 1Department of Invertebrate Zoology, National Museum of Natural History, Smithsonian Institution, Washington, DC, United States
- 2Department of Biology, Harvey Mudd College, Claremont, CA, United States
- 3Department of Biological Sciences, Lehigh University, Bethlehem, PA, United States
- 4Department of Ocean System Sciences, NIOZ Royal Netherlands Institute for Sea Research and Utrecht University, Den Burg, Netherlands
- 5Ryan Institute & School of Natural Sciences, NUI Galway, Galway, Ireland
- 6 CSS-Inc., Under Contract to NOAA NCCOS, Fairfax, VA, United States
- 7Department of Biology, Temple University, Philadelphia, PA, United States
The processes that control diversification and speciation in deep-sea species are poorly known. Here, we analyzed data produced by Restriction-Site Associated DNA Sequencing (RAD-Seq) of octocorals in the genus Paramuricea to elucidate diversification patterns and examine the role of environmental gradients in their evolution. The genus Paramuricea evolved around 8 MYA, with a high probability of a broad ancestral depth range from mesophotic depths to the deep sea. At around 1-2 MYA, the genus diversified across the continental slope of the deep North Atlantic, supporting the depth-differentiation hypothesis, with no invasions back into shallower depths (< 200 m). Diversification in the deep sea generally occurred from shallower, warmer waters to deeper, colder depths of the lower continental slope. We also found that the vertical structure of water masses was influential in shaping phylogeographic patterns across the North Atlantic Ocean, with clades found in either upper/intermediate or intermediate/deep water masses. Our data suggest that species diverged first because of environmental conditions, including depth, temperature, and/or water mass, and then diversified into different geographical regions multiple times. Our results highlight the role of the environment in driving the evolution and distribution of Paramuricea throughout the deep sea. Furthermore, our study supports prior work showing the utility of genomic approaches over the conventionally-used DNA barcodes in octocoral species delimitation.
Introduction
Contemporary and historical evolutionary processes that generate diversity in the deep sea (>200 m) remain poorly understood (Thistle, 2003), particularly as compared to shallow-water marine systems. Yet, diversity in the deep sea can be high in certain areas and depths (e.g., mid-bathyal region), and in some cases it rivals diversity estimates in shallow-water coastal habitats (Hessler and Sanders, 1967; Sanders, 1968; Grassle, 1989). While species turnover can rapidly occur across depth (see Rex and Etter, 2010), many deep-sea species have broad biogeographic ranges, often spanning entire ocean basins (see McClain and Hardy, 2010). Long planktonic larval durations (Hilário et al., 2015) and long-distance dispersal (Baco et al., 2016) combined with a lack of dispersal barriers in the deep sea seem to promote a high degree of connectivity across large spatial scales (Wilson and Hessler, 1987; McClain and Hardy, 2010). In addition, certain habitats might serve as ‘stepping stones’ to larval dispersal, increasing the degree of connectivity within a metapopulation (Smith et al., 1989; Van Dover et al., 2002; Breusing et al., 2016; Miller and Gunasekera, 2017). With seemingly no physical barriers to limit dispersal or promote reproductive isolation (see Wilson and Hessler, 1987; McClain and Hardy, 2010), the question remains as to what processes generate new species in this vast environment.
Several hypotheses have been suggested to explain how diversity is generated and maintained in the deep sea. One is the Depth-Differentiation hypothesis (sensu Rex and Etter, 2010), which suggests that most deep-sea biodiversity is generated on the continental slope due to habitat heterogeneity and different selective regimes. Other hypotheses have suggested that deep-sea diversity is maintained by immigration of populations (Radiation hypothesis, Holt, 1985) and expansion and diversification of lineages from shallow waters (Onshore-Offshore hypothesis, Jablonski et al., 1983; Bottjer and Jablonski, 1988) due to a variety of factors (e.g., anoxic events, biological interactions, disturbance events). These various hypotheses are likely not mutually exclusive but rather, together, can explain how diversity patterns are governed from the shelf break to the abyss.
In most cases, environmental conditions are key in helping to explain the maintenance and generation of diversity in the deep sea (e.g., Gooday, 2002; Smith et al., 2008; Rex and Etter, 2010). Contrary to historical views, the deep seafloor and the overlying water column can be quite heterogeneous in nature. The topography of the seafloor, particularly on the continental slope, is complex and can change across depth and geographic location on both large (e.g., seamounts, submarine canyons, cold seeps, coral-built mounds) and small (e.g., sediment burrows and waves, hardbottom type and extent) spatial scales, helping to shape diversity patterns in the deep sea (see Levin et al., 2010; Levin and Sibuet, 2012). In addition to topographic complexity, several environmental parameters including temperature, hydrostatic pressure, oxygen, pH, salinity, nutrients, and food supply can change with increasing water depth. Still, the rate of change of most variables (except for pressure) depends on geographic location. Several of these properties (e.g., temperature, salinity, oxygen) are linked directly to water mass structure, which has implications for controlling biogeographic patterns (see Auscavitch et al., 2020; Puerta et al., 2020; Roberts et al., 2021). For example, water masses that move across ocean basins might promote larval dispersal while the density interfaces between them might constrain dispersal (Miller et al., 2010; Quattrini et al., 2017; Bracco et al., 2019). Regional and biogeographic species models often list hydrographic regimes as important variables shaping the distribution of deep-sea benthic organisms (e.g., Kenchington et al., 2019; Puerta et al., 2020). If hydrographic, topographic, and other environmental conditions are important variables shaping ecological distributions of deep-sea benthic organisms, then these factors are also likely to have a strong influence on the evolution and diversification of species in the deep sea.
Deep-sea (cold-water) corals are ubiquitous throughout the world’s oceans. In particular, octocorals in the genus Paramuricea Kölliker, 1865 are common inhabitants of a variety of deep-sea habitats, where they occur in large aggregations on existing hard bottoms (e.g., seamounts, submarine canyons, and authigenic carbonates) (Thoma et al., 2009; Doughty et al., 2014; Quattrini et al., 2015a). Currently, there are 19 valid species in this genus (WoRMS Editorial Board, 2022) that occur worldwide down to depths of approx. 2400 m (NOAA Deep-Sea Coral Data Portal, 2022), with only one species known primarily in shallow waters (P. clavata, Linares et al., 2008). Like other octocorals, Paramuricea is ecologically important. Colonies can host mutualistic symbionts (e.g., Asteroschema spp., Girard et al., 2016) and serve as important habitat for fishes (Edinger et al., 2007; Husebø et al., 2002; Miller et al., 2012). Some Paramuricea species are also long-lived and slow-growing, with continuous life spans of over 600 years (Prouty et al., 2016). Species in this genus are thus highly susceptible to anthropogenic impacts. Indeed, thermal stress events and oil spills have resulted in mass mortalities in the Mediterranean Sea (Bavestrello et al., 1994; Linares et al., 2005) and Gulf of Mexico (White et al., 2012; Fisher et al., 2014), respectively, and regional efforts to restore habitat are ongoing. Determining the bathymetric and geographic distribution of evolutionary lineages, their physiological tolerances, phylogenetic diversity, and the potential for connectivity among depths and locations are important components for the effective restoration and conservation of this genus.
The distribution of genetic diversity across spatial scales and environmental parameters (i.e., seafloor and hydrographic features) has been investigated in Paramuricea from the North Atlantic and the Mediterranean Sea. In the Mediterranean Sea, two endemic species, P. clavata and P. macrospina, occur at depths down to 200 m (Bo et al., 2012; Grinyó et al., 2016). It has been hypothesized that these species arose from a vicariance event linked to the Messinian and Gelasian salinity crises (Poliseno et al., 2017). For P. clavata, populations are isolated by both depth and distance (Mokhtar-Jamaï et al., 2011; Pérez-Portela et al., 2016). In the broader North Atlantic, different Paramuricea genetic types (mtMutS, COI, and/or nuclear 28S rDNA) can be found on the same feature (i.e., seamount, Thoma et al., 2009) and across regions (Radice et al., 2016), but they can also segregate by depth within regions (Doughty et al., 2014). Doughty et al. (2014) suggested that either oceanographic conditions physically limit larval dispersal across depth, or alternatively, species have different physiological tolerances to depth-related environmental variables. Following Doughty et al. (2014), Radice et al. (2016) suggested that water masses are important conduits for promoting dispersal within depth bands while limiting dispersal across depth, a conclusion that is also supported by population genetic and larval dispersal studies of other North Atlantic species (e.g., Quattrini et al., 2015b; Bracco et al., 2019; Kenchington et al., 2019). More recently, seascape genomics (Galaska et al., 2021) and larval dispersal models (Liu et al., 2021) demonstrated that populations of Paramuricea in the Gulf of Mexico are structured across depth; however, this structuring was observed within the same water mass (i.e., primarily North Atlantic Deep Water, > 1000 m). Paramuricea is an exemplar system to understand how oceanographic and other environmental conditions, both past and present, have influenced the diversification and distribution of deep-sea corals.
Prior phylogenetic and phylogeographic studies on Paramuricea spp. have relied primarily on the commonly-used mitochondrial DNA (mtMutS+igr+COI) and 28S rDNA barcodes (Thoma et al., 2009; Doughty et al., 2014; Radice et al., 2016). These barcodes can be useful for delineating closely-related species within some genera, but they are slowly-evolving markers (Huang et al., 2008; Shearer & Coffroth, 2008) and do not accurately delimit species in all genera, especially those that are speciose and represent recent and rapid radiations (McFadden et al., 2011; McFadden et al., 2014; Pante et al., 2015; McFadden et al., 2017; Quattrini et al., 2019). Even when they work well to help delimit species, these markers often have no intraspecific variation, making them ineffective for phylogeographic studies. Thus, it is clear that other genetic markers are needed.
In this study, we used a Restriction-Site Associated DNA Sequencing (RAD-Seq) approach to construct a species tree of Paramuricea spp. and explore the origin and diversification of species inhabiting the deep North Atlantic Ocean. Numerous studies have shown the effectiveness of RAD-Seq in differentiating populations and species and resolving phylogenetic relationships among closely-related species that have recently and/or rapidly diverged (Reitzel et al., 2013; Herrera et al., 2015; Herrera and Shank, 2016; Bracco et al., 2019; Quattrini et al., 2019; Galaska et al., 2021). We then used divergence dating, ancestral state reconstruction, and a dispersal-extirpation-cladogenesis model to illuminate the biogeographic history of this genus. Specifically, we examined whether: 1) deep-sea species diversified from ancestors in shallower and/or warmer waters (onshore-offshore hypothesis) and 2) water masses shaped the depth (depth-differentiation hypothesis) and/or geographical range evolution of this genus across the North Atlantic Ocean. This dataset also allowed us to compare topologies produced from concatenated RAD-Seq data and a multispecies coalescent species tree with those generated from the conventionally-used mtMutS+28S rDNA barcodes.
Materials and Methods
Specimen Collection and Preparation
Sixty-nine samples were collected from multiple sources and locations throughout the North Atlantic and Mediterranean Sea at depths of 30 to 2,312 m (Figure 1 and Tables 1, S1). Most specimens used for sequencing were preserved onboard the ship in 95% EtOH and stored either at room temperature or frozen at -20°C (Table S1). However, the samples collected off Canada were frozen on board the ship at -20°C and then transferred to 100% EtOH and stored at room temperature (Table S1).
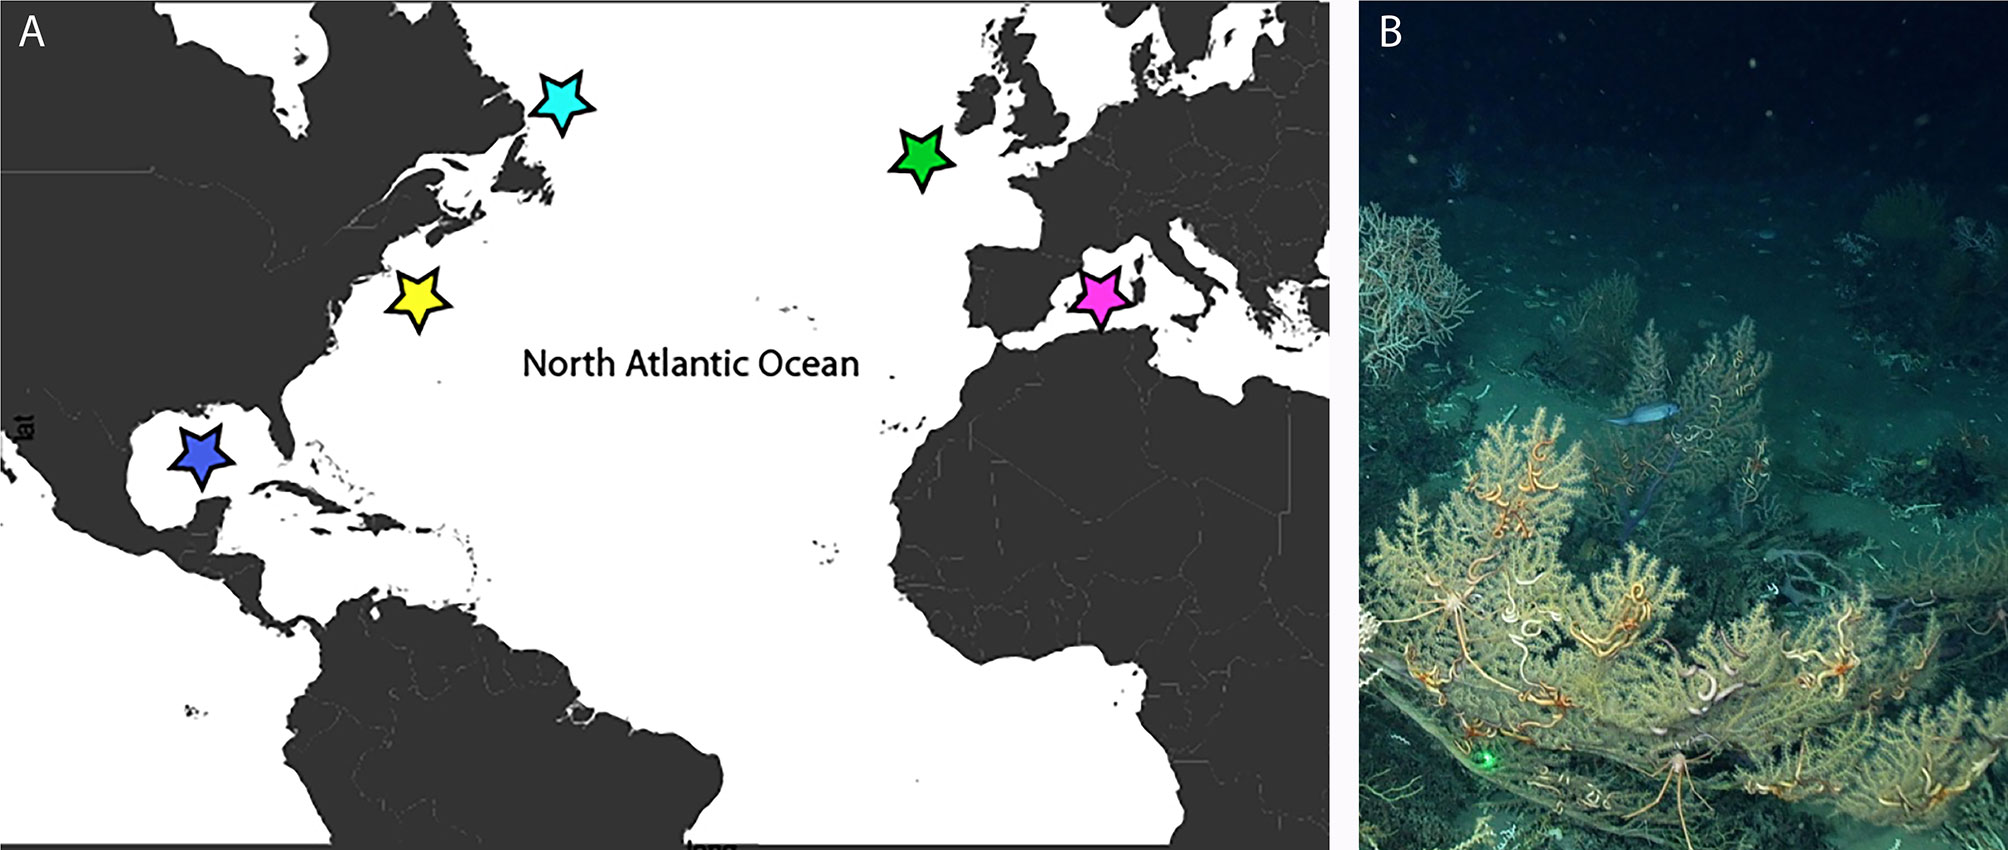
Figure 1 (A) Map of sampling locations. blue = Gulf of Mexico, yellow = NE United States, light blue = Canada, green = Ireland, pink = Mediterranean Sea. (B) Paramuricea sp. 3, with associated brittle stars and squat lobsters, in the Gulf of Mexico at 1050 m depth.
Table 1 Specimen collection information.
Small sections of the axis (1-2 polyps in length) were treated with an 8% sodium hypochlorite solution to dissolve organic matter, followed by one rinse with 3% hydrogen peroxide, one rinse of deionized water, and three rinses of 95% ethanol. Sclerites were then sorted using an ultrafine bristle paintbrush and assessed using a JEOL 5600LV Scanning Electron Microscope and a compound microscope (Supplemental File 1). Sclerite sizes were measured with JEOL visualization software. Specimens have been given tentative species names or designations based on morphological characters (Deichmann, 1936; Grasshoff, 1977; Table 2) combined with RAD-Seq results; however, we acknowledge that all await further taxonomic confirmation as a comparison to type material is essential. Therefore, we retained the use of cf. (to confer) or aff. (affinity to) for some of the morphospecies designations (Table 2).
Table 2 Morphological characters for putative species.
DNA was extracted using a Qiagen DNeasy kit following the manufacturer’s protocol. DNA concentration was assessed using a Qubit v 2.0 fluorometer with a Broad Range Assay Kit. Quality was assessed by running 100 ng of DNA for each sample on a 1% agarose gel and checked with a NanoDrop spectrophotometer. Normalized (20 ng per ul), high-quality (230/260 and 260/280 ratios >1.8) DNA was sent to Floragenex Inc (Eugene, OR) for RAD-Seq library preparation. Libraries were constructed for each of the 69 samples using the 6-cutter PstI enzyme. Due to some degradation of DNA, two libraries were constructed for a subset of the samples (n=47). Each library was sequenced (100 bp SE reads) on one and a quarter lanes of an Illumina HiSeq2500 (University of Oregon’s Genomics and Cell Characterization Core Facility lab).
Bioinformatics and Phylogenetic Analysis of Barcoding Data
In addition to RAD-Seq, two gene regions (mtMutS, 28S rDNA) used widely for barcoding in octocorals were PCR-amplified and Sanger-sequenced using published primers and protocols (McFadden et al., 2011; McFadden et al., 2014). mtMutS and 28S rDNA sequences of Paramuricea were aligned separately using the E-INS-i method in MAFFT (100PAM/k=2, gap open penalty 1.53, Katoh and Toh, 2008) and then concatenated. Additional, outgroup sequences from the octocoral families Acanthogorgiidae (Acanthogorgia), Gorgoniidae (Pacifigorgia), and other plexaurid genera (Thesea, Villogorgia, Muriceides, Bebryce, Plexaura) were downloaded from GenBank and included in the analyses to determine the relationship of sample LII-501 (an unidentified species in the family Plexauridae) to the other Paramuricea samples. Plexaura kuna was used as the outgroup, as this genus has been previously shown to fall outside of the other included taxa in larger datasets (Wirshing et al., 2005; McFadden et al., 2006).
MOTHUR v1.44 (Schloss et al., 2009) was used to delimit molecular operational taxonomic units (MOTUs) based on genetic distance thresholds applied to each gene separately and to the concatenated dataset of mtMutS+28S (e.g., McFadden et al., 2014; Quattrini et al., 2019). The distseq method was used to calculate uncorrected pairwise distances, counting a string of gaps as one (calc=onegap) without penalizing gaps at the ends (countends=F). Phylogenetic trees were constructed separately for mtMutS, 28S rDNA, and the concatenated dataset using maximum likelihood (IQTree; Nguyen et al., 2015) (Supplemental Figure S1). We used the built-in program ModelFinder (-m MFP+Merge, Kalyaanamoorthy et al., 2017) to identify the best partitioning scheme and models of evolution (Bayesian Information Criterion, BIC) to use in these analyses (mtMutS: K2P+R2; 28S rDNA: TPM2u+F+G4). Both ultrafast bootstrapping (-bb 1000, Hoang et al., 2018) and the Sh-like approximate likelihood ratio test (-alrt 1000, Guindon et al., 2010) were performed.
Bioinformatics and Phylogenetic Analysis of RAD-Seq Data
Sequence reads were de-multiplexed and trimmed for low quality using the process_radtags program in Stacks v 1.35 (Catchen et al., 2013). Illumina adapters and barcodes were excluded from reads, and lengths were truncated (-t) to 91bp. The rescue barcodes and RAD-tags options were enabled (-r). Reads with ambiguous bases (-c) and low-quality scores (-q, <10) were discarded. The default sliding window (-w 0.15) and average score (-s 10) for filtering were used. ipyrad v0.9.6 (Eaton and Overcast, 2020) was then used for additional filtering and clustering of sequences to identify homologous loci. ipyrad enables the identification of homologous loci across highly divergent samples by including indel variation in the clustering process (Eaton, 2014). Parameters were left at default values, based on recommendations in the ipyrad manual (https://ipyrad.readthedocs.io/). They included the maximum number of low-quality bases (phred quality score <20) per read of five, removal of low-quality reads (with more than five of bases with a phred quality score <20), short (< 35 bp) reads, and reads with more than five Ns, in addition to a strict filter for adapters. To detect potential paralogs, we changed the maximum number of heterozygous sites retained in a locus to 25% across samples to reduce the chances of clustering paralogs with fixed differences. We also used a clustering threshold of 85% based on previous RAD-Seq studies of octocorals (Pante et al., 2015; Herrera and Shank, 2016; Quattrini et al., 2019). Different datasets (Table 3) were generated in step seven of the ipyrad pipeline for analyses outlined below.
Table 3 Locus statistics from ipyrad output files for datasets used in different analyses.
A phylogeny of all taxa (n=69 individuals) was constructed using IQTree with a concatenated data matrix of no more than 25% missing taxa per locus (Table 3). The best fit model (-m MFP, Kalyaanamoorthy et al., 2017) was chosen (TVM+F+R5) using BIC followed by maximum likelihood analyses with ultrafast bootstrapping (-bb 1000, Hoang et al., 2018) and the Sh-like approximate likelihood ratio test (-alrt 1000, Guindon et al., 2010). RAxML v 8 (Stamatakis, 2006) was also used to construct a phylogeny using a GTR+G model and rapid bootstrapping; a total of 20 ML searches and 200 bootstrap replicates were performed. Trees were visualized with FigTree and rooted to the unidentified Plexauridae (sample LII-501) as this was an appropriate outgroup supported by our mtMutS and 28S results (Supplemental Figure S1).
Structure v2.3 (Pritchard et al., 2000) was used to define putative species of Paramuricea to help guide the coalescent-based SNAPP analyses (below). We used an unlinked SNP dataset (u.str file from ipyrad) with a maximum of 25% missing taxa per locus (Table 3) for the deep-sea (> 200 m depth) clade. Structure was run in parallel with StrAutoParallel v 1.0 (Chhatre and Emerson, 2017) using an admixture model with correlated allele frequencies. Burnin was set to 25,000 followed by 1,000,000 MCMC generations. The inferred number of populations (K) was set from 1 to 12, and 10 runs of each K were conducted. Because the commonly used ΔK method often finds only the uppermost genetic structure (Evanno et al., 2005; Janes et al., 2017), which is a likely scenario when examining several metapopulations, we chose three K values to plot based on the three increases apparent in ΔK values (Supplemental File 2) from Structure Harvester (Earl and Vonholdt 2012). The ten runs for each of those K values (K=4, 6, and 10) were aligned with CLUMPP v 1.2 (Jakobsson and Rosenberg, 2007), and the resulting indivq file was input into Distruct v. 1.1 (Rosenberg, 2004) for the graphical display of individual population assignments.
Coalescent-based SNAPP v 1.3 (Bryant et al., 2012) analysis was used to infer the species tree using unlinked SNPs (Table 3). Prior to SNAPP analysis, the full dataset was subsampled in ipyrad (step 7) to ≤ 3 individuals per population per putative species with no more than 10% missing taxa per locus (SNAPP_subset1 dataset). Using the unlinked_SNPs_to_nexus.py script (https://github.com/brunoasm/usnps_to_nexus written by B. deMedeiros), unlinked SNPs (usnps file from ipyrad) were converted into a binary nexus file. BEAUti v2.6 (Bouckaert et al., 2019) was used to create an xml file. Mutation rates (u=3.333, v=0.588) were set based on Quattrini et al. (2019), and the coalescent rate parameter was estimated during the MCMC. The Yule tree prior was set to a gamma distribution with default alpha (2.0) and beta (200) parameters, and the ancestral population sizes were set at the default gamma distribution priors. One run (MCMC=2M generations, samplefreq=1000) was performed in BEAST2 v2.6 (Bouckaert et al., 2019) using CIPRES (Miller et al., 2010). Convergence (effective sample size, ESS, values > 200) and mixing were checked in Tracer v. 1.7 (Rambaut et al., 2018). Tree topologies were drawn in DensiTree v2.2 (Bouckaert, 2010). A maximum clade credibility tree and posterior probabilities were generated with Tree Annotator v 2.3 (burnin=25%, mean heights, Bouckaert et al., 2014). We also repeated the SNAPP analysis with another subsampling of the dataset (SNAPP_subset2) to examine potential bias in subsampling.
Phylogeographic Analyses
Divergence dating estimation was conducted in SNAPP v 1.3 following the tutorial (https://github.com/ForBioPhylogenomics/tutorials/tree/main/divergence_time_estimation_with_snp_data) and based on the methods of Stange et al. (2018) to determine the timing of diversification of Paramuricea into deep water. The ruby script snapp_prep.rb was used to generate an xml file based on unlinked SNPs. The SNAPP maximum clade credibility tree was used as a topology constraint. Two relative dates were used based on 95% highest posterior density (HPD) node ages from Poliseno et al. (2017). We approximated these 95% HPD intervals for the ingroup and the clade containing P. clavata and P. grayi using lognormal distributions in real space. Lognormal distributions were centered around 7.7 and 4.2 MYA with standard deviations of 0.28 and 0.4 MYA for the ingroup (4.2-12.8 MYA 95% CI) and the clavata/grayi (1.8-8.5 MYA 95% CI) clades, respectively. A strict clock was also used, mutation rates were set as noted above, and the effective population sizes were unlinked. One run (MCMC=1M generations, samplefreq=1000) was performed in BEAST2 v2.6 (Bouckaert et al., 2019) using CIPRES (Miller et al., 2010). Convergence and ESS values > 200 were confirmed in Tracer v. 1.7. A maximum clade credibility tree with 95% HPD ages was generated with Tree Annotator v 2.3 (burnin=25%, mean heights).
To examine the ancestral depth ranges of Paramuricea, we used the Bayesian dispersal- extirpation-cladogenesis (DEC) model (Ree and Smith, 2008) implemented in RevBayes (Höhna et al., 2016). Ancestral ranges of shallow-mesophotic (10-200 m) and deep-sea (> 200 m) depths were estimated following the guidelines in the online tutorial on simple analysis of historical biogeography (https://revbayes.github.io/tutorials/biogeo/biogeo_simple.html). The ultrametric SNAPP tree constructed without the clock model, with the topology that matched the concatenated analyses (undated-SNAPP_subset1), was input into RevBayes. To estimate depth ranges for each putative species/population, we used the depths from sample collections supplemented by depth records in the literature (Deichmann, 1936; Grasshoff, 1977) in cases where we were confident about species identities. We also estimated the ancestral ranges of Paramuricea in particular water masses to determine whether water masses facilitated the dispersal of deep-sea species across the North Atlantic Ocean. Water masses that are most often found at particular depths in each of the regions (following Rivas et al., 2005; Townsend et al., 2015; Wilson et al., 2015; Georgian et al., 2016; Aldama-Campino and Döös, 2020; Liu and Tanhua, 2021) were used in analyses: Antarctic Intermediate Water (AAIW), Labrador Sea Water (LSW), North Atlantic Central Water (NACW), Mediterranean Overflow Water (MOW), and North Atlantic Deep Water (NADW) (see Figure 1). In RevBayes, the number of generations (MCMC) was set to 5000. The R package RevGadgets (Tribble et al., 2022) was then used to generate phylogenies with the 1st through 3rd most probable ancestral ranges shown (as pie charts) before and after cladogenic events.
We also modeled continuous trait evolution of temperature and depth ranges to further elucidate the ancestral states of the environment in the deep-sea clade. We used the contMap function in the R package phytools (Revell, 2012). This mapping approach uses a fast estimation of the most likely ancestral states at each node. For this analysis, we used the IQTree tree generated with concatenated data for all 69 individuals. Depth of collection was used as the depth data. Temperature data were taken from modal temperatures of water masses (following Rivas et al., 2005; Townsend et al., 2015; Wilson et al., 2015; Aldama-Campino and Döös, 2020; Liu and Tanhua, 2021) where those water masses occur in each region. We chose to use these water mass temperatures instead of temperatures taken at the time of collection because we expect that long-term temperatures, as reflected in water masses, are more important in the evolution of this genus than a “snapshot” that is captured during a single collection time.
Results
Morphological Data
Diagnostic sclerites were apparent for each shallow/mesophotic species and for the monophyletic groups/genetic clusters of individuals from deep waters as identified in RAD-Seq analysis (see below). Hereafter, we refer to these species as: P. clavata, P. grayi, P. macrospina, P. sp. 1- 4, P. cf. placomus, P. cf. biscaya, and P. aff. biscaya. All putative species exhibited differences in the morphology of the calicular thornscales and/or sclerites in the coenenchyme of the axis or calyx (Table 2, Supplemental File 1). P. aff. biscaya was similar to P. cf. biscaya, but P. aff. biscaya differed by the presence of lacinated plates with rounded projections in the coenenchyme. P. sp. 1 and 2 were also morphologically similar but differed in that P. sp. 2 had triangular projections in thornscales. P. sp. 3 contained unique branched spindles in the coenenchyme, which were not observed in the other clades. Two morphological variants for P. cf. placomus were observed, with differences in the size of the thornscale projection. However, genetics did not distinguish these as separate lineages (see below).
DNA Barcode Data
We obtained mtMutS and 28S rDNA sequences for 59 and 56 Paramuricea individuals, respectively. The mtMutS alignment was 735 bp, 28S was 652 bp, and the concatenated alignment was 1,387 bp. Although a monophyletic deep-sea (> 200 m) clade was recovered in all phylogenies, the topologies were largely incongruent with respect to the placement of the mesophotic species P. macrospina and several putative species within the deep-sea clade (Supplemental Figure 1). In addition, most nodes were poorly supported (< 90% b.s.) in each phylogeny, except the node for the entire Paramuricea clade.
Based on a 0.3% genetic distance threshold, the mtMutS barcode identified seven molecular operational taxonomic units (MOTUs): one MOTU each for the Plexauridae outgroup, P. clavata. P. grayi, P. macrospina; and three MOTUs in the deep-sea clade, but none was congruent with the RAD-Seq phylogeny or Structure analyses (Figure 2). For 28S, seven MOTUs were designated at a 0.3% genetic distance threshold: one MOTU each for Plexauridae, P. macrospina, P. clavata/grayi; and four MOTUs in the deep-sea clade. The MOTUs based on 28S for the deep-sea clade corresponded largely with monophyletic clades of the RAD-Seq phylogeny but did not correspond with groupings of the Structure analysis (Figure 2). Based on a 0.3% genetic threshold, the concatenated mtMutS+28S barcode designated nine MOTUs: one MOTU each for Plexauridae, P. macrospina, P. clavata, and P. grayi; and five MOTUs in the deep-sea clade, none of which were congruent with the RAD-Seq phylogeny or Structure analyses (Figure 2).
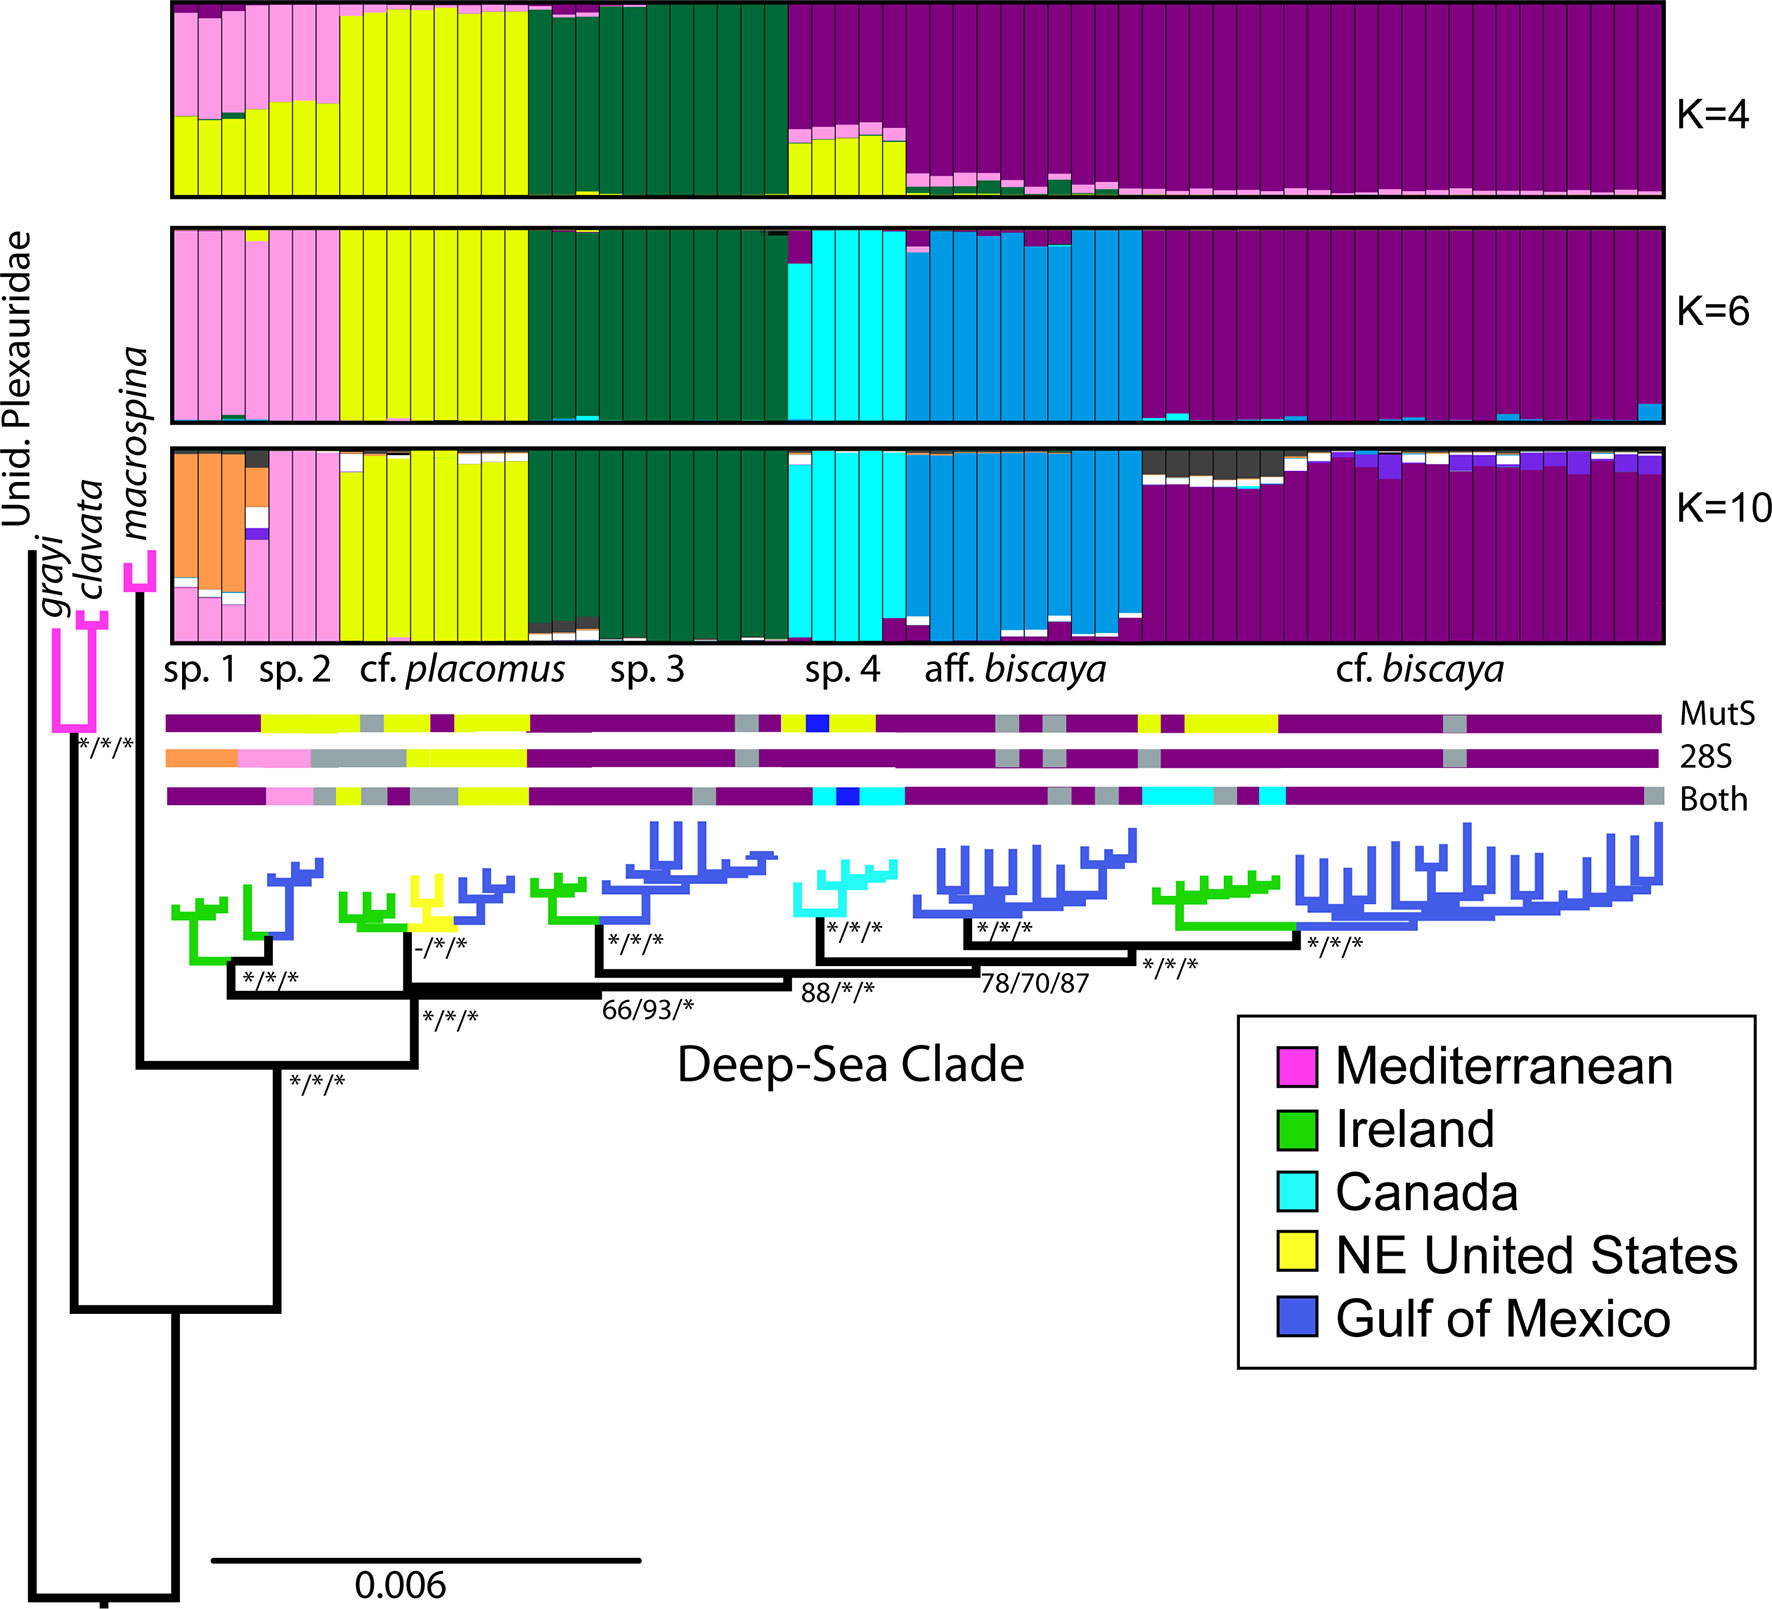
Figure 2 Maximum likelihood phylogeny from concatenated RAD-Seq data (2,861 loci, 249,438 SNPs) generated by IQTree. STRUCTURE membership of probability graphs (K=4, 6 and 10) for the deep-sea clade (3,821 unlinked SNPs) included. Molecular operational taxonomic units (MOTUs) assigned by Mothur analysis (color-coded, grey=unavailable) for mtMutS, 28S, and ‘Both’ genes. Branches are color-coded to sampling location. Node labels represent support values (*>95% support) from RAxML rapid bootstrapping/SH-like approximate likelihood ratio test/IQTree ultrafast bootstrapping for each putative species (see supplemental data for all support values in .tre file). The phylogeny is rooted to an unidentified species of Plexauridae.
RAD-Seq Data
After trimming and filtering in both stacks and ipyrad, 307M reads were retained for 69 Paramuricea individuals. On average, 13% of reads were removed due to unmatched RAD tags, low quality and unambiguous bases, and short reads. The mean number of reads retained per sample was 4,453,204 ± 3,589,920 SD. The dataset, allowing for 25% missing data per locus, included 2,266 ± 600 SD loci per sample. In total, 29,202 SNPs were obtained, and the alignment matrix consisted of 249,438 bp.
The phylogeny based on a concatenated RAD-Seq data alignment (249,438 bp) was well supported at most nodes, based on rapid and ultrafast bootstrapping and the Sh-like approximate likelihood ratio test implemented in IQTree (Figure 2). The RAxML and IQTree topologies were largely congruent. The only exceptions were the relationships among populations of P. cf. placomus. RAxML recovered a sister relationship between the Ireland and GoM samples and IQtree recovered a sister relationship between GoM and NE United States samples.
The undated-SNAPP_subset1 species tree (Figures 3A, B) inferred from 958 unlinked SNPs (Table 3) was strongly supported (> 95%) at only 50% of the nodes. Still, the recovered relationships largely matched those in the concatenated tree analyses. The only exception was that P. placomus clade was sister to P. sp. 1 and 2 in the SNAPP analysis with 100% support (Figures 3A, B). Relationships recovered in the undated-SNAPP_subset2 species tree, inferred from 802 SNPs and a different subset of individuals (Supplemental Figure S3), were incongruent with other topologies. Inferences from this dataset placed the unidentified plexaurid (LII-501) as sister to P. clavata/grayi (90% pp support) and P. aff. biscaya sister to P. sp. 3 (70% pp support, Supplemental Figure S3). The dated-SNAPP_subset1 and SNAPP_subset2 species trees also produced somewhat dissimilar topologies (Figure 3C and Supplemental Figure 3) from the undated analyses. In the dated-SNAPP_subset 1 tree, P. sp. 4 was sister to P. sp. 3 (68% pp support, Figure 3C) whereas the dated-SNAPP_subset2 tree matched the undated-SNAPP_subset2 tree (Supplemental Figure 3).
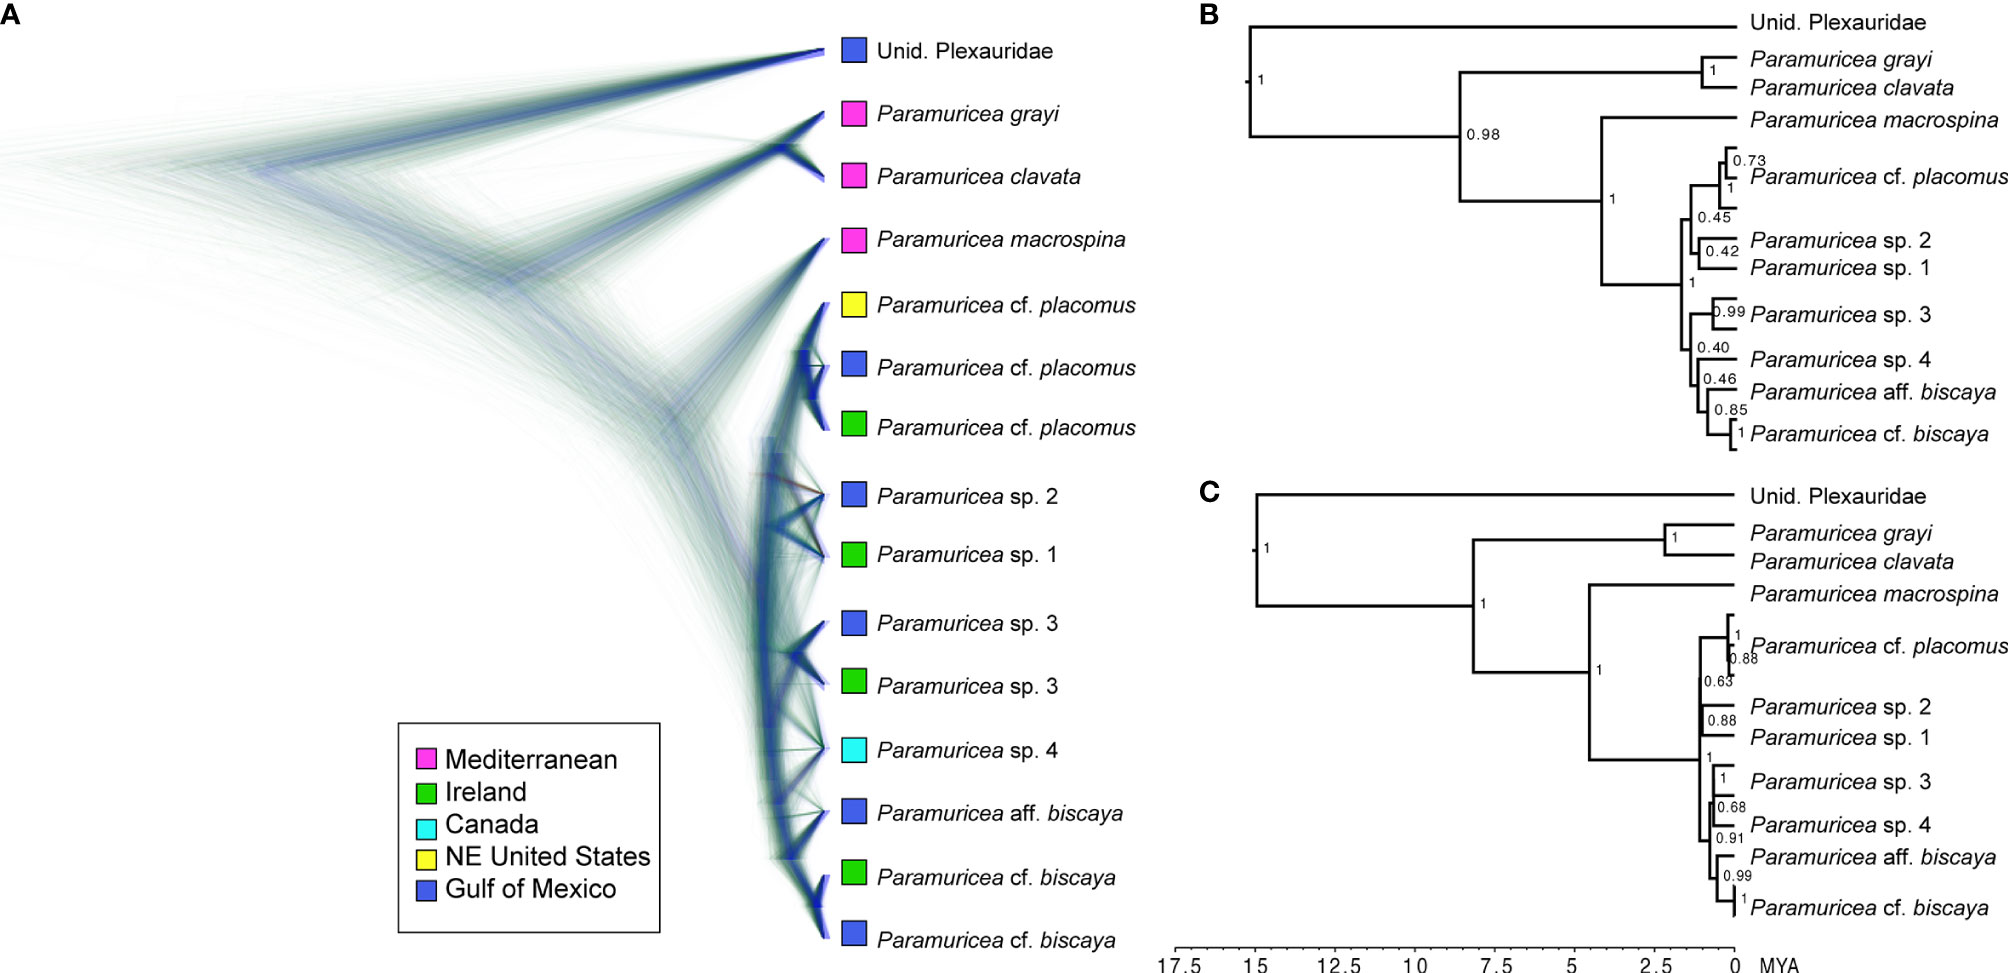
Figure 3 Species tree of Paramuricea using SNAPP_subset1 (958 unlinked, bi-allelic SNPs). (A) Cloudogram includes the undated maximum clade credibility (MCC) tree and congruent trees in blue and trees with different topologies in red and green. Tips are color-coded to sampling location. (B) Undated MCC tree with posterior probabilities at internal nodes. (C) Dated MCC Tree with posterior probabilities at internal nodes.
A monophyletic deep-sea (> 200 m) clade was recovered with strong support in all tree topologies inferred from RAD-Seq data (Figures 2, 3 and Supplemental Figure S1). The deep-sea samples formed seven well-supported monophyletic clades within the deep-sea clade, four of which contained individuals from multiple locations (i.e., Ireland and the GoM). However, these monophyletic clades were not recovered in the mtMutS+28S phylogeny (Supplemental Figure S1).
Structure analyses were conducted on the deep-sea clade (n=63 individuals) using 3,821 unlinked SNPs (Table 3 and Figure 2). The ΔK method of Evanno indicated that the most likely number of K groups was 4 (Supplemental Figure S2), corresponding to: 1) P. sp. 1 and 2, 2) P. cf. placomus, 3) P. sp. 3, and 4) a cluster of P. cf. biscaya, P. aff. biscaya, and P. sp. 4. However, because ΔK often finds only the uppermost structure in a hierarchical system, we plotted the membership probability for K=6 and 10 as indicated by the ΔK plot (Supplemental Figure S2). Both analyses further separated P. biscaya, P. aff. biscaya, and P. sp. 4 into three distinct clusters. K=6 indicated that P. sp. 1 and sp. 2 are grouped, whereas the K=10 and K=4 analysis indicated some differentiation between these two morphospecies. Thus, we chose the cluster designations as indicated in the K=10 Structure plot for subsequent analyses. These cluster designations also matched morphospecies designations.
Phylogeographic Analyses
Divergence dating of the SNAPP_subset1 and SNAPP_subset 2 species trees indicated that Paramuricea arose approximately 8 MYA (5-13 MYA 95% CI). Around 4.5 MYA (1.9-7.0 MYA 95% CI), P. macrospina and the deep-sea clade diverged from one another (Figure 3C). At about 2 MYA (1.0-3.3 MYA 95% CI), both Paramuricea clavata and P. grayi diverged from one another. The deep-sea clade diversified into the deep North Atlantic around 1 to 2 MYA (0.5-3.0 MYA 95% CI).
Several putative species within the deep-sea clade, supported by tree inferences from RAD-Seq data and the SNAPP species trees (Figures 2, 3 and Supplemental Figure 3), comprised specimens from different geographic locations across the North Atlantic. These results indicate broad distributions (from Ireland to the Gulf of Mexico) for at least three species (P. cf. biscaya, P. cf. placomus, P. sp 3). Furthermore, it appears that species diverged first across depth and/or temperature gradients (Figure 4), and then spread into different geographical regions multiple times. A strong pattern of diversification associated with depth and temperature was apparent across the phylogeny. This pattern suggests a general diversification trend from onshore to offshore and warmer to colder temperatures (Figure 4). Many species were restricted to relatively narrow modal temperature and/or depth ranges. The exceptions were P. sp. 3 and P. cf. placomus, found across wide depth ranges (800-1600 m and 230-1300 m, respectively) yet narrow temperature ranges (4-6°C and 8-10°C) (Figure 4).
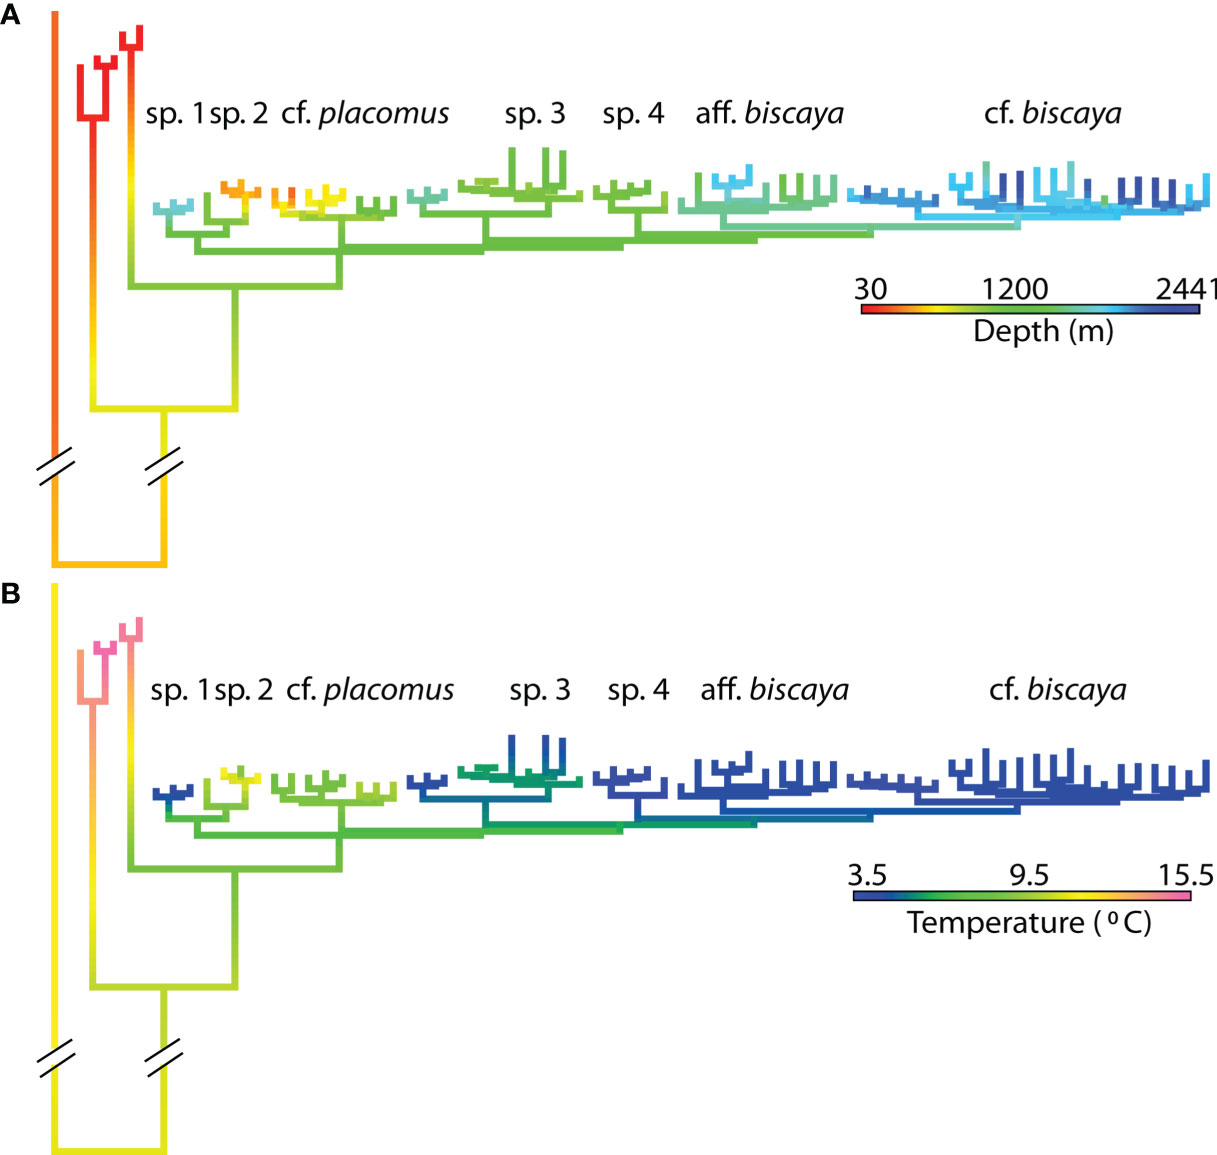
Figure 4 Ancestral state reconstructions of (A) depth and (B) temperature on the phylogeny from Figure 2.
The DEC model indicated that a likely vicariance event approx. 4.5 MYA drove the divergence between the mesophotic Mediterranean lineage of P. macrospina and the deep-sea clade (Figure 5A and Supplemental Figure 4). In addition, this divergence was likely from a common ancestor with a broad depth range and an estimated ancestral, optimal temperature state of about 10°C. In contrast, the divergence between P. clavata and P. grayi was likely in sympatry, with P. clavata diversifying in mesophotic depths of the Mediterranean Sea from an ancestor with a broad depth range. P. grayi retained its ancestral depth range (Figure 5A).
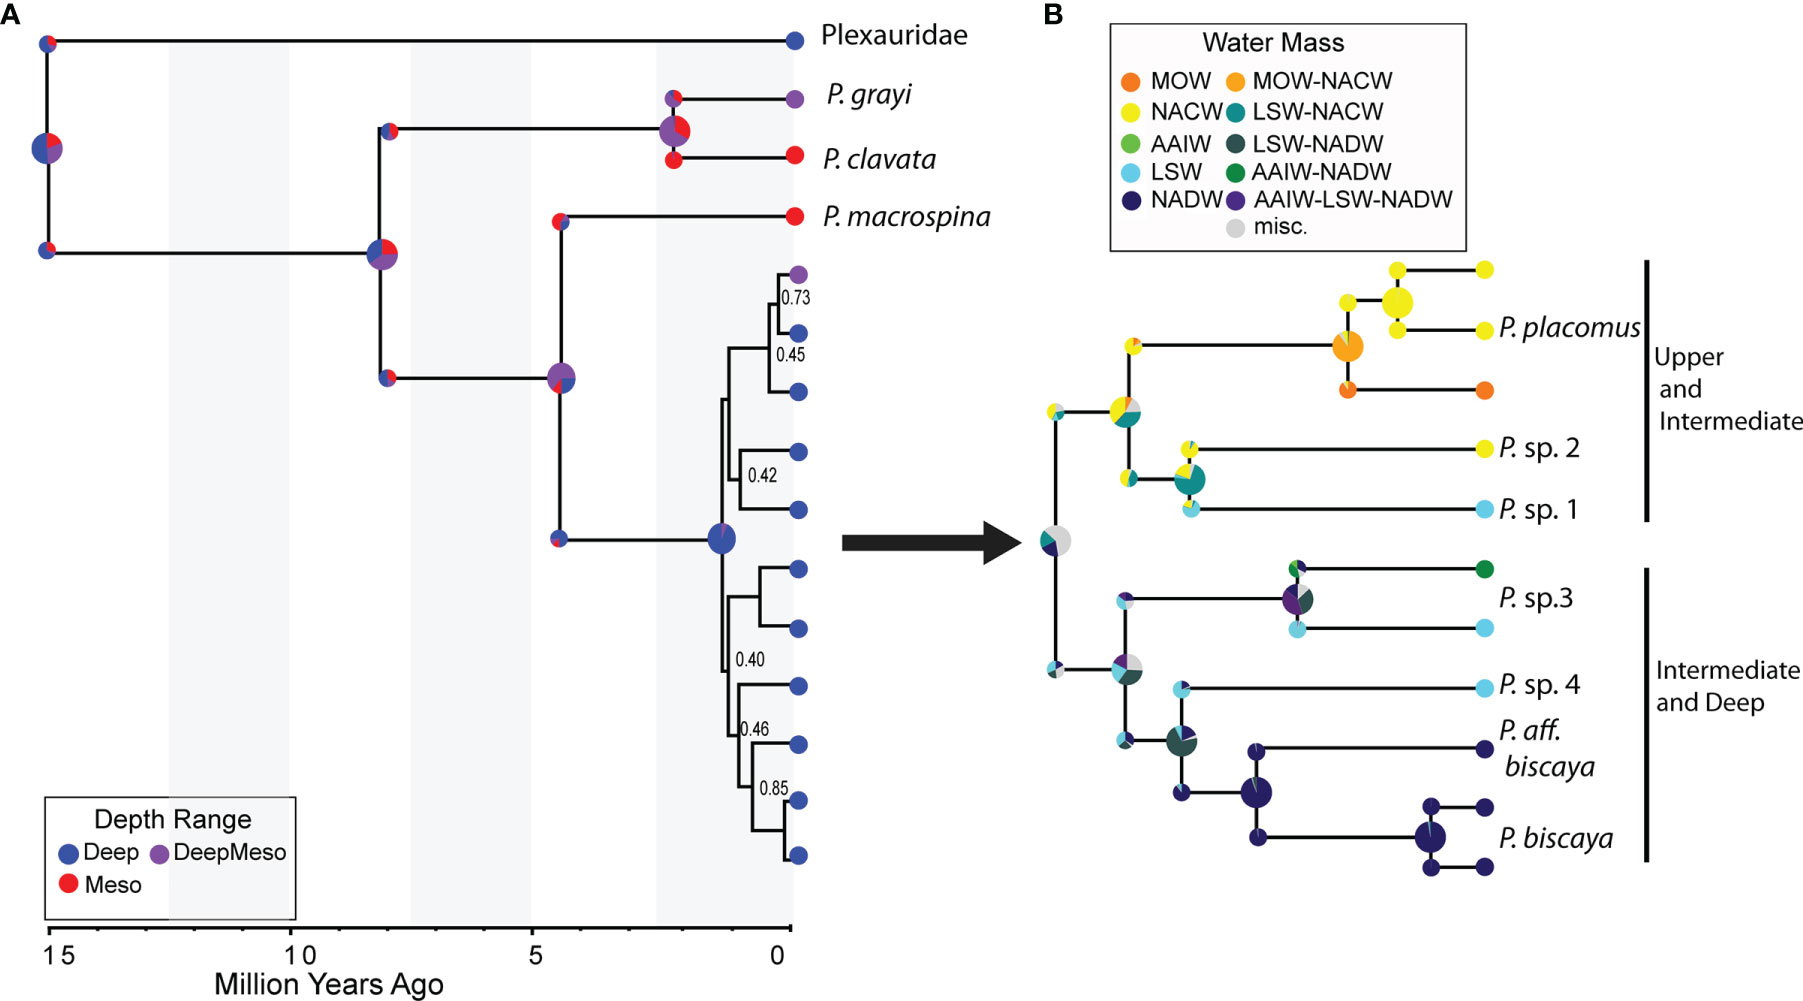
Figure 5 Ancestral range estimates of (A) depth and (B) water mass constructed using the Dispersal-Extirpation-Cladogenesis model in RevBayes overlain onto the SNAPP species tree (Figure 3). Water mass reconstructions shown are for the deep-sea (>200 m) clade only. Nodes are annotated with ancestral ranges (pie charts) before and after cladogenic events. Tips are annotated with contemporary distributions. Depth Range: Deep=>200 m, Meso=0-200 m; DeepMeso=0->200 m. Water Mass Range: MOW, Mediterranean Overflow Water; NACW, North Atlantic Central Water; AAIW, Antarctic Intermediate Water; LSW, Labrador Sea Water; NADW, North Atlantic Deep Water; misc, more than two states.
We further examined the evolution and distribution of the deep-sea clade with respect to contemporary water mass distributions using a DEC model and the SNAPP_subset1 trees. Two clades, which were reciprocally monophyletic in the SNAPP_subset 1 trees, occurred in either present-day upper (NACW, MOW) and intermediate water masses (LSW) or intermediate (AAIW, LSW) and lower water masses (NADW) (Figure 5B and Supplemental Figure S5). Five out of seven putative deep-sea species were found to occupy only one water mass, whereas P. cf. placomus and P. sp. 3 were found in two and three water masses, respectively. The DEC model suggested that P. cf. biscaya and P. aff. biscaya diverged in sympatry in NADW. The DEC model also indicated that P. sp. 4 and P. cf. biscaya/aff. biscaya diverged from a common ancestor with an ancestral range of LSW and NADW. This divergence was likely due to a vicariance event around 750K to 1 MYA. Also, at about 1 MYA, P. sp. 1 and 2 diverged from a common ancestor with an ancestral range consisting of LSW and NACW.
Discussion
Molecular Analyses
RAD-Seq was highly effective for reconstructing evolutionary relationships among Paramuricea. Most nodes were well supported, and reciprocally monophyletic clades that generally corresponded with morphospecies were recovered in the phylogenetic analyses. Furthermore, structure analysis indicated several clusters with little to no admixture between them. In general, each SNAPP species tree showed slight incongruence among relationships, all with lower node support, compared to the concatenated phylogenies. SNAPP can be sensitive to the number of samples and SNPs and the proportion of missing data. We set the maximum proportion of missing data in our datasets to 10%. This resulted in datasets with relatively few SNPs (< 1000), which likely explains the observed incongruences (Schmidt-Lebuhn et al., 2017; O’Connell and Smith, 2018). Regardless, most of our analyses converged on the same evolutionary relationships (Figures 2 and 3A, B, Supplemental Figure S3). Of note, many of the samples used in the analysis contained some amount of high molecular weight DNA, but most of them also had a high amount of degraded DNA. Yet, we still recovered 100s to 1000s of unlinked SNPs per sample. Thus, our results and others (Herrera and Shank, 2016; Quattrini et al., 2019) indicate the utility of RAD-Seq in octocorals that have some level of DNA degradation.
The monophyletic clades in the phylogenetic analysis and cluster designations from Structure analyses helped guide morphospecies designations and vice versa; and thus, conducting these analyses in concert resulted in higher confidence of putative species designations. In all but one case, morphological evaluation agreed with genetic clade designations. Two morphological variants for P. cf. placomus were found, but structure analysis across different values of K indicated that these are likely one species. In another case, P. sp. 1 and 2 were quite similar morphologically (Supplemental File 1), and there was some degree of admixture between them. Still, they formed well-supported monophyletic clades that diverged into different environments around 1-2 MYA. We remain conservative in assigning names to many of these putative species because comparison to and incorporation of type material in a systematic framework is essential. Our analyses included at least nine out of 19 valid species of Paramuricea, but we acknowledge that our current study is only a first step towards a robust systematic framework, which is essential to illuminate the systematics of this genus.
The need for robust species delimitation analyses is exemplified by a recent population genomic study of P. biscaya in the Gulf of Mexico, which utilized some of the same samples herein (Galaska et al., 2021). Based on >12K SNPs, Galaska et al. (2021) found two lineages of P. biscaya, lineage 1 and lineage 2, represented in our study as P. cf. biscaya and P. aff. biscaya, respectively. Lineage 1 was generally found deeper (mean depth 1,896 m) than lineage 2 (mean depth 1,454 m); however, these lineages co-occur at some intermediate-depth sites and 15% of assessed specimens had an admixed ancestry (see Figure 1 in Galaska et al., 2021). Interestingly, the morphology of the specimens examined in this study differs between these two lineages, with P. aff. biscaya containing plates with projecting, rounded spines in the calyx and P. cf. biscaya containing plates without the protruding spines. These findings raise several questions. First, are these lineages presently diverging in sympatry in the Gulf of Mexico, as the DEC model suggests? Or, did they diverge in allopatry and are now undergoing hybridization in secondary contact? On the other hand, it is curious that we found little to no admixture between these lineages in the present study, begging whether this is a result of SNP calling bias. In our study, SNPs called in the deep-sea clade were from a range of species that diverged over 1 to 2 MY. Therefore, we likely included SNPs associated with conserved regions. In contrast, Galaska et al. (2021) had three times as many SNPs from five times more specimens in just two sister lineages. Further investigation is needed to distinguish the degree of admixture from incomplete lineage sorting and elucidate the divergence process between these two groups.
Similar to other phylogenetic studies of octocorals (Pante et al., 2015; Herrera and Shank, 2016; Quattrini et al., 2019), our results suggest that the conventionally-used, single-locus barcodes are insufficient to reconstruct evolutionary relationships or delimit species within speciose genera and rapid and/or recent radiations of octocorals. Except for the shallow/mesophotic species, neither mtMutS or 28S rDNA alone nor in combination was sufficient to recover the well-supported, reciprocally-monophyletic clades inferred from RAD-Seq data. There was also no congruence between clusters denoted by Structure and MOTUs in the deep-sea group. In addition, morphospecies contained multiple MOTUs, yet the same MOTU could be found in several putative species. Radice et al. (2016) noted this pattern in mtMutS haplotypes in Paramuricea and concluded there were potentially several species off Canada due to several different mtMutS haplotypes. However, the data presented here support high mtMutS haplotype diversity in one species (P. sp. 4) off Canada. We also documented high haplotype diversity within species collected off Ireland. In contrast, some of those identical haplotypes found in P. sp. 4 or species off Ireland (e.g., type B, type A) were each found in a single species in the Gulf of Mexico. Similar levels of incongruence between mitochondrial COI and RAD-Seq results were also found in the two P. biscaya lineages (Galaska et al., 2021). This incongruence between RAD-Seq and single-locus barcodes is likely caused by incomplete lineage sorting of mitochondrial and nuclear rDNA genes. In conclusion, we suggest that neither mtMutS nor 28S should be used to guide species designations for deep-sea species of Paramuricea as it could lead to inaccurate and potentially confused species identities (also see Thoma, 2013), particularly without accompanying morphological data.
Phylogeography of Paramuricea
Our results provide a first survey of the phylogeography of a genus of octocoral common to the North Atlantic Ocean and Mediterranean Sea. Diversification of Paramuricea occurred throughout the Pliocene and Pleistocene geological epochs. Notably, the deep-sea clade of Paramuricea and the lineage of the mesophotic Mediterranean species P. macrospina diverged around 4.5 MYA from an ancestor common in both deep and mesophotic depths, as indicated by the DEC model. The DEC model indicated that this divergence occurred via a vicariance event, similar to the findings based on ancestral range models and mitochondrial genomes of Poliseno et al. (2017). In addition, the timing of this event is within the range inferred (5.9-3.3 MYA) by Poliseno et al. (2017), although the phylogenetic relationships differed between studies. A monophyletic deepwater clade was not inferred by Poliseno et al. (2017). Rather, it was split into two clades, with P. macrospina sister to one. Poliseno et al. (2017) postulated that the Messinian salinity crisis, which caused sea-level change and desiccation through evaporation in the Mediterranean Sea, was a likely driver of this divergence event. At the end of the Messinian salinity crisis, approximately 5.3 MYA, the Mediterranean Sea re-filled as the connection to the North Atlantic reopened. Shortly after that, around 4.5 MYA, the restriction of the Central American Seaway reached a critical threshold (Karas et al., 2017). Both events caused drastic changes in ocean circulation and climate (Roveri et al., 2014; Karas et al., 2017), including changes in water mass transport, and ventilation and formation of NADW in the North Atlantic (Steph et al., 2010). Together, these changes in ocean circulation might have caused population isolation and divergence of Paramuricea species across depth.
Two to three million years later, the deep-sea clade of Paramuricea diversified throughout the deep North Atlantic Ocean. Repeated glaciations marked this time in the Pleistocene (2.8 MYA to 11 KYA). During the Mid-Pleistocene Transition, around 1 MYA, a significant shift in the behavior of glacial cycles occurred. This transition period was marked by changes in deep water formation and ocean circulation (Pena and Goldstein, 2014; Poirier and Billups, 2014). In addition, there was increased warming at depth and outflow of Mediterranean Outflow Water from the Mediterranean Sea (Catunda et al., 2021). Changes in deep ocean circulation over the past 1 million years could have sparked the spread and diversification of Paramuricea throughout the deep North Atlantic. These results are consistent with the inferred timing of colonization and spread of Paragorgia arborea in the North Atlantic (Herrera et al., 2012), and thus may be indicative of a critical time for the establishment of modern deep-sea coral diversity.
The importance of the environment in the evolution of Paramuricea is clear from the DEC model and ancestral state reconstructions of depth and temperature. These analyses do not unequivocally support a shallow (< 200 m) origin for Paramuricea, as indicated by the estimated ancestral depth range from DEC analysis (Figure 5). However, the phytools analysis (Figure 4) suggested a general trend of diversification into deeper and colder depths, particularly in the deep-sea clade. This indicates a diversification into the deeper bathyal zone and lends support for the onshore-offshore hypothesis (Jablonski et al., 1983). Together, the high lineage diversity found in the bathyal region and the inferred divergence across depths and water masses followed by diversification into different regions, also constitute support for the depth-differentiation hypothesis (Rex and Etter, 2010).
In some cases, the DEC model indicated that divergence was due to vicariance events, so subsequent adaptations to environmental variables must have occurred following speciation. For example, the diversification of the deep-sea clade of Paramuricea in deep and relatively cold water must have subsequently led to biological adaptations that precluded invasion back into mesophotic depths. Changes in hydrostatic pressure and just a few degrees of temperature can elicit biochemical changes (Somero, 1992). In other instances, the DEC model suggested divergence in sympatry (i.e., P. aff. biscaya and P. biscaya), which could be driven by adaptive divergence to environmental variables that co-vary with depth. The latter is difficult to tease apart from secondary contact following allopatry without additional analyses. Nevertheless, species appear to have adaptations to living within relatively narrow temperature and/or depth ranges.
Although ocean circulation changed during the glacial and interglacial periods of the Pleistocene (e.g., Demenocal et al., 1992; Bell et al., 2015; Kim et al., 2021), the contemporary distributions of Paramuricea spp. in water mass type still show an evolutionary signal. In the SNAPP_subset1 species tree, the two reciprocally monophyletic clades of deep-sea Paramuricea were found in either upper/intermediate or deep/intermediate water masses. The common ancestor of Paramuricea sp. 4 and P. cf. biscaya/aff. biscaya had a likely distribution range in LSW-NADW. The DEC model suggested that a vicariance event led to the divergence of each species in either LSW or NADW masses following the Mid-Pleistocene Transition (Figures 5B, S4). Similarly, the ancestral range of the common ancestor of P. sp. 1 and 2 spanned both LSW and NACW, and diverged in allopatry into either LSW or NACW (Figures 5B, S4). Larval dispersal models of deep-sea corals that assume larvae behave as neutrally buoyant particles have indicated that larvae stay close to the depths at which they were spawned and rarely cross water mass density boundaries (Bracco et al., 2019; Liu et al., 2021). Without significant mixing between water masses, water mass boundaries could promote population isolation via physical barriers marked by density differences. When larvae successfully cross into a different water mass, larvae most likely have adaptations that allow their survival under those environmental conditions. Water masses could also connect distant populations as the species appear to occupy large geographic regions within the same water mass. These results collectively highlight the importance of water masses in shaping the evolution of corals throughout the deep North Atlantic Ocean.
Considerations for Future Work
We suggest a few considerations for future work on the systematics and biogeography of Paramuricea and octocorals in general. First, the systematics of this genus needs to be reevaluated in a robust species delimitation framework that includes both genomic and morphological data. In particular, type material needs to be imaged and incorporated into genomic studies to help accurately identify species. In this regard, target-capture of conserved elements (Quattrini et al., 2018; Erickson et al., 2021) is a promising method to obtain genomic-scale data from historical museum samples (Untiedt et al., 2021). Putting accurate binomens on individuals is critical for effective restoration and conservation, particularly for comprehensively documenting species’ distributions and population sources and sinks, and thus understanding the degree of population vulnerability to anthropogenic change.
Our analyses used the modal temperatures of the water masses from sites in which species were collected. We recognize there can be more temperature variability with short-term changes in ocean conditions through, for example, eddy formation or seasonal mixing of water masses at particular depths or locations (e.g., Houpert et al., 2016). However, by using modal temperatures of water masses, we could depict the temperature signal over a longer time scale. We expected to see a pattern across the phylogeny if these longer-term temperatures impacted the evolution of the genus. In addition, we gathered depth data from specimen location instead of from the literature or digital databases. This was partly because we were not confident of the accuracy of species identifications in those sources, and we are not yet confident in our determination of species without access to type material. We expect additional patterns to be revealed as the ability to discern Paramuricea species and our knowledge of their distribution improve.
Conclusions
The environment, particularly variables that co-vary with depth, is well known to shape patterns of deep-sea diversity, but it has rarely been explored in a robust phylogeographic framework. Here, we showed that a deep-sea (> 200 m) clade of Paramuricea diverged in allopatry around 4.5 MYA from ancestors that likely inhabited a broad depth range. Around 1 to 2 MYA the genus diversified throughout the deep sea with no subsequent invasions back into shallower depths (<200 m). Combined with the results of Herrera et al. (2016), our results suggest that this period appears to have been important for establishing extant deep-sea coral diversity in the North Atlantic. We showed that temperature and depth influence the contemporary distribution of Paramuricea spp. and the evolution within the genus. In addition, water masses are important in shaping phylogeographic patterns across the North Atlantic Ocean, with clades found in either upper/intermediate or intermediate/deep water masses. The divergence pattern across water mass, temperature, and depth followed by divergence into different regions further supports the importance of the environment in the evolution of deep-sea corals. Together, our results support the depth-differentiation hypothesis (Rex and Etter, 2010) with diversification driven by both allopatric and sympatric processes. Our results do not unequivocally support the onshore-offshore hypothesis (Jablonski et al., 1983) as the estimated ancestral depth range was not onshore. However, there was a general diversification trend into deeper, colder depths of the continental slope in the deep-sea clade. Finally, incongruence between phylogenies constructed from RAD-Seq data and the commonly used DNA barcoding markers, mtMutS and 28S, caution the sole use of these single-locus markers for species delimitation and phylogenetics in Paramuricea (also see Galaska et al., 2021). This cautionary note extends to other genera of deep-sea coral as well, including, but certainly not limited to, Chrysogorgia (Pante et al., 2015; Untiedt et al., 2021) and Paragorgia (Herrera et al., 2016).
Data Availability Statement
The datasets presented in this study can be found in online repositories. All code and files needed to complete analyses are on figshare: 10.6084/m9.figshare.17869097. Genbank Numbers are listed in Supplementary Material. Raw sequence data are accessible on NCBI’s SRA database https://www.ncbi.nlm.nih.gov/sra/PRJNA804429.
Author Contributions
AMQ, SH, and CSM conceived and designed the study. AMQ conducted analyses and wrote the manuscript. HHW conducted phylogenetic analyses of barcode data. AS conducted SEM work. AMQ, SH, and JMA conducted wet lab work. AMQ, SH, JG, AA, and EEC collected samples. All authors edited the manuscript and approved the final copy.
Funding
Funding was provided by the National Oceanic and Atmospheric Administration’s RESTORE Science Program award (NA17NOS4510096) to Lehigh University (SH and AQ co-PIs), BOEM and NOAA-OER (BOEM contract #M08PC20038) (EC, co-PI), the NSF RAPID Program (Award #1045079, EC co-PI), and the NOAA Damage Assessment, Response, and Restoration Program, and ECOGIG (EC, coPI). Samples from Ireland were obtained through funding by Ireland’s national Shiptime Programme AL, PI). Funding support for JA was provided by Howard Hughes Medical Institute Undergraduate Science Education Program award #52007544 to Harvey Mudd College. Library preparation and sequencing was funded through a Harvey Mudd College Hixon Center Rasmussen Award.
Conflict of Interest
Author AS was employed by CSS-Inc.
The remaining authors declare that the research was conducted in the absence of any commercial or financial relationships that could be construed as a potential conflict of interest.
Publisher’s Note
All claims expressed in this article are solely those of the authors and do not necessarily represent those of their affiliated organizations, or those of the publisher, the editors and the reviewers. Any product that may be evaluated in this article, or claim that may be made by its manufacturer, is not guaranteed or endorsed by the publisher.
Acknowledgments
The majority of samples were collected during expeditions on the MSV Ocean Project (SH, chief scientist), R/V Ron Brown, R/V Atlantis, and R/V Holiday Chouest (EC, C. Fisher, chief scientist), and the R/V Celtic Explorer (AL, chief scientist). We thank A. Gori, P. López-González, V. Wareham-Hayes, and S. France for providing a few additional samples and M. Galaska for some DNA extractions. P. Etnoyer, S. Morton supported the SEM work at NOAA NCCOS.
Supplementary Material
The Supplementary Material for this article can be found online at: https://www.frontiersin.org/articles/10.3389/fmars.2022.849402/full#supplementary-material
Supplemental File 1 | Scanning Electron Microscopy images of select specimens.
Supplemental File 2 | Supplemental Figures.
Supplemental File 3 | Supplemental Tables.
References
Aldama-Campino A., Döös K. (2020). Mediterranean Overflow Water in the North Atlantic and its Multidecadal Variability. Tellus A: Dynamic Meteorol. Oceanogr. 72 (1), 1–10. doi: 10.1080/16000870.2018.1565027
Auscavitch S. R., Lunden J. J., Barkman A., Quattrini A. M., Demopoulos A. W., Cordes E. E. (2020). Distribution of Deep-Water Scleractinian and Stylasterid Corals Across Abiotic Environmental Gradients on Three Seamounts in the Anegada Passage. PeerJ 8, e9523. doi: 10.7717/peerj.9523
Baco A. R., Etter R. J., Ribeiro P. A., Von der Heyden S., Beerli P., Kinlan B. P. (2016). A Synthesis of Genetic Connectivity in Deep-Sea Fauna and Implications for Marine Reserve Design. Mol. Ecol. 25 (14), 3276–3298. doi: 10.1111/mec.13689
Bavestrello G., Bertone S., Cattaneo-Vietti R., Cerrano C., Gaino E., Zanzi D. (1994). Mass Mortality of Paramuricea clavata (Anthozoa, Cnidaria) on Portofino Promontory Cliffs, Ligurian Sea, Mediterranean Sea. Mar. Life 4 (1), 15–19.
Bell D. B., Jung S. J., Kroon D., Hodell D. A., Lourens L. J., Raymo M. E. (2015). Atlantic Deep-Water Response to the Early Pliocene Shoaling of the Central American Seaway. Sci. Rep. 5 (1), 1–12. doi: 10.1038/srep12252
Bo M., Canese S., Spaggiari C., Pusceddu A., Bertolino M., Angiolillo M., et al. (2012). Deep Coral Oases in the South Tyrrhenian Sea. PloS One 7 (11), e49870. doi: 10.1371/journal.pone.0049870
Bottjer D. J., Jablonski D. (1988). Paleoenvironmental Patterns in the Evolution of Post-Paleozoic Benthic Marine Invertebrates. Palaios 3, 540–560. doi: 10.2307/3514444
Bouckaert R. R. (2010). DensiTree: Making Sense of Sets of Phylogenetic Trees. Bioinformatics 26 (10), 1372–1373. doi: 10.1093/bioinformatics/btq110
Bouckaert R., Heled J., Kühnert D., Vaughan T., Wu C. H., Xie D., et al. (2014). BEAST 2: A Software Platform for Bayesian Evolutionary Analysis. PloS Comput. Biol. 10 (4), e1003537. doi: 10.1371/journal.pcbi.1003537
Bouckaert R., Vaughan T. G., Barido-Sottani J., Duchêne S., Fourment M., Gavryushkina A., et al. (2019). BEAST 2.5: An Advanced Software Platform for Bayesian Evolutionary Analysis. PloS Comput. Biol. 15 (4), e1006650. doi: 10.1371/journal.pcbi.1006650
Bracco A., Liu G., Galaska M. P., Quattrini A. M., Herrera S. (2019). Integrating Physical Circulation Models and Genetic Approaches to Investigate Population Connectivity in Deep-Sea Corals. J. Mar. Syst. 198, 103189. doi: 10.1016/j.jmarsys.2019.103189
Breusing C., Biastoch A., Drews A., Metaxas A., Jollivet D., Vrijenhoek R. C., et al. (2016). Biophysical and Population Genetic Models Predict the Presence of “Phantom” Stepping Stones Connecting Mid-Atlantic Ridge Vent Ecosystems. Curr. Biol. 26 (17), 2257–2267. doi: 10.1016/j.cub.2016.06.062
Bryant D., Bouckaert R., Felsenstein J., Rosenberg N. A., RoyChoudhury A. (2012). Inferring Species Trees Directly From Biallelic Genetic Markers: Bypassing Gene Trees in a Full Coalescent Analysis. Mol. Biol. Evol. 29 (8), 1917–1932. doi: 10.1093/molbev/mss086
Catchen J., Hohenlohe P. A., Bassham S., Amores A., Cresko W. A. (2013). Stacks: An Analysis Tool Set for Population Genomics. Mol. Ecol. 22 (11), 3124–3140. doi: 10.1111/mec.12354
Catunda M. C. A., Bahr A., Kaboth-Bahr S., Zhang X., Foukal N. P., Friedrich O. (2021). Subsurface Heat Channel Drove Sea Surface Warming in the High-Latitude North Atlantic During the Mid-Pleistocene Transition. Geophys. Res. Lett. 48, e2020GL091899. doi: 10.1029/2020GL091899
Chhatre V. E., Emerson K. J. (2017). StrAuto: Automation and Parallelization of STRUCTURE Analysis. BMC Bioinf. 18 (1), 1–5. doi: 10.1186/s12859-017-1593-0
Deichmann E. (1936). “The Alcyonaria of the Western Part of the Atlantic Ocean,” in Memoirs of the Museum of Comparative Zoology at Harvard College. Deichmann; Harvard University, Cambridge MA, vol. 53, 1–317.
Demenocal P. B., Oppo D. W., Fairbanks R. G., Prell W. L. (1992). Pleistocene δ13c Variability of North Atlantic Intermediate Water. Paleoceanography 7 (2), 229–250. doi: 10.1029/92PA00420
Doughty C. L., Quattrini A. M., Cordes E. E. (2014). Insights Into the Population Dynamics of the Deep-Sea Coral Genus Paramuricea in the Gulf of Mexico. Deep Sea Res. Part II: Topical Stud. Oceanogr. 99, 71–82.
Earl D. A., VonHoldt B. M. (2012). STRUCTURE HARVESTER: A Website and Program for Visualizing STRUCTURE Output and Implementing the Evanno Method. Conservation Genetics Resources 4 (2), 359–361. doi: 10.1007/s12686-011-9548-7
Eaton D. A. (2014). PyRAD: Assembly of De Novo RADseq Loci for Phylogenetic Analyses. Bioinformatics 30 (13), 1844–1849. doi: 10.1093/bioinformatics/btu121
Eaton D. A., Overcast I. (2020). Ipyrad: Interactive Assembly and Analysis of RADseq Datasets. Bioinformatics 36 (8), 2592–2594. doi: 10.1093/bioinformatics/btz966
Edinger E. N., Wareham V. E., Haedrich R. L. (2007). Patterns of Groundfish Diversity and Abundance in Relation to Deep-Sea Coral Distributions in Newfoundland and Labrador Waters. Bull. Mar. Sci. 81 (3), 101–122.
Erickson K. L., Pentico A., Quattrini A. M., McFadden C. S. (2021). New Approaches to Species Delimitation and Population Structure of Anthozoans: Two Case Studies of Octocorals Using Ultraconserved Elements and Exons. Molecular Ecol. Resources 21 (1), 78–92. doi: 10.1111/1755-0998.13241
Evanno G., Regnaut S., Goudet J. (2005). Detecting the Number of Clusters of Individuals Using the Software STRUCTURE: A Simulation Study. Mol. Ecol. 14 (8), 2611–2620. doi: 10.1111/j.1365-294X.2005.02553.x
Fisher C. R., Hsing P. Y., Kaiser C. L., Yoerger D. R., Roberts H. H., Shedd W. W., et al. (2014). Footprint of Deepwater Horizon Blowout Impact to Deep-Water Coral Communities. Proc. Natl. Acad. Sci. 111 (32), 11744–11749. doi: 10.1073/pnas.1403492111
Galaska M. P., Liu G., West D., Erickson K., Quattrini A. M., Bracco A., et al. (2021). Seascape Genomics Reveals Metapopulation Connectivity Network of Paramuricea biscaya in the Northern Gulf of Mexico. Front. Mar. Sci. 8, 790929. doi: 10.3389/fmars.2021.790929
Georgian S. E., DeLeo D., Durkin A., Gomez C. E., Kurman M., Lunden J. J., Cordes E. E. (2016). Oceanographic Patterns and Carbonate Chemistry in the Vicinity of Cold-Water Coral Reefs in the Gulf of Mexico: Implications for Resilience in a Changing Ocean. Limnol. Oceanogr. 61 (2), 648–665. doi: 10.1002/lno.10242
Girard F., Fu B., Fisher C. R. (2016). Mutualistic Symbiosis With Ophiuroids Limited the Impact of the Deepwater Horizon Oil Spill on Deep-Sea Octocorals. Mar. Ecol. Prog. Ser. 549, 89–98. doi: 10.3354/meps11697
Gooday A. J. (2002). Biological Responses to Seasonally Varying Fluxes of Organic Matter to the Ocean Floor: A Review. J. Oceanogr. 58 (2), 305–332. doi: 10.1023/A:1015865826379
Grasshoff M. (1977). Die Gorgonarien Des Oestlichen Nordatlantik Und Des Mittelmeeres. Iii. Die Familie Paramuriceidae (Cnidaria, Anthozoa). Meteor Forschungsergeb. D, 27 (2017), pp. 5–76.
Grassle J. F. (1989). Species Diversity in Deep-Sea Communities. Trends Ecol. Evol. 4 (1), 12–15. doi: 10.1016/0169-5347(89)90007-4
Grinyó J., Gori A., Ambroso S., Purroy A., Calatayud C., Dominguez-Carrió C., et al. (2016). Diversity, Distribution and Population Size Structure of Deep Mediterranean Gorgonian Assemblages (Menorca Channel, Western Mediterranean Sea). Prog. Oceanogr. 145, 42–56. doi: 10.1016/j.pocean.2016.05.001
Guindon S., Dufayard J. F., Lefort V., Anisimova M., Hordijk W., Gascuel O. (2010). New Algorithms and Methods to Estimate Maximum-Likelihood Phylogenies: Assessing the Performance of PhyML 3.0. Syst. Biol. 59 (3), 307–321. doi: 10.1093/sysbio/syq010
Herrera S., Shank T. M. (2016). RAD Sequencing Enables Unprecedented Phylogenetic Resolution and Objective Species Delimitation in Recalcitrant Divergent Taxa. Mol. Phylogenet. Evol. 100, 70–79. doi: 10.1016/j.ympev.2016.03.010
Herrera S., Shank T. M., Sánchez J. A. (2012). Spatial and Temporal Patterns of Genetic Variation in the Widespread Antitropical Deep-Sea Coral Paragorgia arborea. Mol. Ecol. 21 (24), 6053–6067. doi: 10.1111/mec.12074
Herrera S., Watanabe H., Shank T. M. (2015). Evolutionary and Biogeographical Patterns of Barnacles From Deep-Sea Hydrothermal Vents. Mol. Ecol. 24 (3), 673–689. doi: 10.1111/mec.13054
Hessler R. R., Sanders H. L. (1967). “Faunal Diversity in the Deep-Sea,” In Deep Sea Research and Oceanographic Abstracts, (Elsevier). 14, 65–78.
Hilário A., Metaxas A., Gaudron S. M., Howell K. L., Mercier A., Mestre N. C., et al. (2015). Estimating Dispersal Distance in the Deep Sea: Challenges and Applications to Marine Reserves. Front. Mar. Sci. 2, 6. doi: 10.3389/fmars.2015.00006
Hoang D. T., Chernomor O., Von Haeseler A., Minh B. Q., Vinh L. S. (2018). UFBoot2: Improving the Ultrafast Bootstrap Approximation. Mol. Biol. Evol. 35 (2), 518–522. doi: 10.1093/molbev/msx281
Höhna S., Landis M. J., Heath T. A., Boussau B., Lartillot N., Moore B. R., et al. (2016). RevBayes: Bayesian Phylogenetic Inference Using Graphical Models and an Interactive Model-Specification Language. Systematic Biol. 65 (4), 726–736. doi: 10.1093/sysbio/syw021
Holt R. D. (1985). Population Dynamics in Two-Patch Environments: Some Anomalous Consequences of an Optimal Habitat Distribution. Theor. Popul. Biol. 28 (2), 181–208. doi: 10.1016/0040-5809(85)90027-9
Houpert L., Durrieu de Madron X., Testor P., Bosse A., d’Ortenzio F., Bouin M. N., et al. (2016). Observations of Open-Ocean Deep Convection in the Northwestern M Editerranean S Ea: Seasonal and Interannual Variability of Mixing and Deep Water Masses for the 2007-2013 Period. J. Geophys. Res.: Oceans 121 (11), 8139–8171. doi: 10.1002/2016JC011857
Huang D., Meier R., Todd P. A., Chou L. M. (2008). Slow Mitochondrial COI Sequence Evolution at the Base of the Metazoan Tree and Its Implications for DNA Barcoding. J. Mol. Evol. 66 (2), 167–174. doi: 10.1007/s00239-008-9069-5
Husebø Å., Nøttestad L., Fosså J. H., Furevik D. M., Jørgensen S. B. (2002). Distribution and Abundance of Fish in Deep-Sea Coral Habitats. Hydrobiologia 471 (1), 91–99. doi: 10.1023/A:1016549203368
Jablonski D., Sepkoski J. J., Bottjer D. J., Sheehan P. M. (1983). Onshore-Offshore Patterns in the Evolution of Phanerozoic Shelf Communities. Science 222 (4628), 1123–1125. doi: 10.1126/science.222.4628.1123
Jakobsson M., Rosenberg N. A. (2007). CLUMPP: A Cluster Matching and Permutation Program for Dealing With Label Switching and Multimodality in Analysis of Population Structure. Bioinformatics 23 (14), 1801–1806. doi: 10.1093/bioinformatics/btm233
Janes J. K., Miller J. M., Dupuis J. R., Malenfant R. M., Gorrell J. C., Cullingham C. I., et al. (2017). The K= 2 Conundrum. Mol. Ecol. 26 (14), 3594–3602. doi: 10.1111/mec.14187
Kalyaanamoorthy S., Minh B. Q., Wong T. K., Von Haeseler A., Jermiin L. S. (2017). ModelFinder: Fast Model Selection for Accurate Phylogenetic Estimates. Nat. Methods 14 (6), 587–589. doi: 10.1038/nmeth.4285
Karas C., Nürnberg D., Bahr A., Groeneveld J., Herrle J. O., Tiedemann R., et al. (2017). Pliocene Oceanic Seaways and Global Climate. Sci. Rep. 7 (1), 1–8. doi: 10.1038/srep39842
Katoh K., Toh H. (2008). Recent Developments in the MAFFT Multiple Sequence Alignment Program. Brief Bioinform. 9 (4), 286–298. doi: 10.1093/bib/bbn013
Kenchington E., Wang Z., Lirette C., Murillo F. J., Guijarro J., Yashayaev I., et al. (2019). Connectivity Modelling of Areas Closed to Protect Vulnerable Marine Ecosystems in the Northwest Atlantic. Deep Sea Res. Part I: Oceanogr. Res. Papers 143, 85–103. doi: 10.1016/j.dsr.2018.11.007
Kim J., Goldstein S. L., Pena L. D., Jaume-Seguí M., Knudson K. P., Yehudai M., et al. (2021). North Atlantic Deep Water During Pleistocene Interglacials and Glacials. Quat. Sci. Rev. 269, 107146. doi: 10.1016/j.quascirev.2021.107146
Levin L. A., Sibuet M., Gooday A. J., Smith C. R., Vanreusel A. (2010). The Roles of Habitat Heterogeneity in Generating and Maintaining Biodiversity on Continental Margins: An Introduction. Marine Ecology 31 (1), 1–5. doi: 10.1111/j.1439-0485.2009.00358.x
Levin L. A., Sibuet M. (2012). Understanding Continental Margin Biodiversity: A New Imperative. Ann. Rev. of Marine Sci. 4, 79–112. doi: 10.1146/annurev-marine-120709-142714
Linares C., Coma R., Diaz D., Zabala M., Hereu B., Dantart L. (2005). Immediate and Delayed Effects of a Mass Mortality Event on Gorgonian Population Dynamics and Benthic Community Structure in the NW Mediterranean Sea. Mar. Ecol. Prog. Ser. 305, 127–137. doi: 10.3354/meps305127
Linares C., Coma R., Garrabou J., Díaz D., Zabala M. (2008). Size Distribution, Density and Disturbance in Two Mediterranean Gorgonians: Paramuricea clavata and Eunicella singularis. J. Appl. Ecol. 45 (2), 688–699. doi: 10.1111/j.1365-2664.2007.01419.x
Liu G., Bracco A. B., Quattrini A. M., Herrera S. (2021). Kilometer-Scale Larval Dispersal Processes Predict Metapopulation Connectivity Pathways for Paramuricea biscaya in the Northern Gulf of Mexico. bioRxiv. doi: 10.3389/fmars.2021.790927
Liu M., Tanhua T. (2021). Water Masses in the Atlantic Ocean: Characteristics and Distributions. Ocean Sci. 17, 463–486. doi: 10.5194/os-17-463-2021
McClain C. R., Hardy S. M. (2010). The Dynamics of Biogeographic Ranges in the Deep Sea. Proc. R. Soc. B: Biol. Sci. 277 (1700), 3533–3546. doi: 10.1098/rspb.2010.1057
McFadden C. S., Benayahu Y., Pante E., Thoma J. N., Nevarez P. A., France S. C. (2011). Limitations of Mitochondrial Gene Barcoding in Octocorallia. Mol. Ecol. Resour. 11 (1), 19–31. doi: 10.1111/j.1755-0998.2010.02875.x
McFadden C. S., France S. C., Sánchez J. A., Alderslade P. (2006). A Molecular Phylogenetic Analysis of the Octocorallia (Cnidaria: Anthozoa) Based on Mitochondrial Protein-Coding Sequences. Mol. Phylogenet. Evol. 41 (3), 513–527. doi: 10.1016/j.ympev.2006.06.010
McFadden C. S., Haverkort-Yeh R., Reynolds A. M., Halàsz A., Quattrini A. M., Forsman Z. H., et al. (2017). Species Boundaries in the Absence of Morphological, Ecological or Geographical Differentiation in the Red Sea Octocoral Genus Ovabunda (Alcyonacea: Xeniidae). Mol. Phylogenet. Evol. 112, 174–184. doi: 10.1016/j.ympev.2017.04.025
McFadden C. S., Reynolds A. M., Janes M. P. (2014). DNA Barcoding of Xeniid Soft Corals (Octocorallia: Alcyonacea: Xeniidae) From Indonesia: Species Richness and Phylogenetic Relationships. System. Biodivers. 12 (2), 247–257. doi: 10.1080/14772000.2014.902866
Miller K. J., Gunasekera R. M. (2017). A Comparison of Genetic Connectivity in Two Deep Sea Corals to Examine Whether Seamounts are Isolated Islands or Stepping Stones for Dispersal. Sci. Rep. 7 (1), 1–14. doi: 10.1038/srep46103
Miller R. J., Hocevar J., Stone R. P., Fedorov D. V. (2012). Structure-Forming Corals and Sponges and Their Use as Fish Habitat in Bering Sea Submarine Canyons. PloS One 7 (3), e33885. doi: 10.1371/journal.pone.0033885
Miller M. A., Pfeiffer W., Schwartz T. (2010). “Creating the CIPRES Science Gateway for Inference of Large Phylogenetic Trees,” In Proceedings of the Gateway Computing Environments Workshop (GCE), New Orleans, LA, 14 Nov. 2010. 1–8.
Miller K., Williams A., Rowden A. A., Knowles C., Dunshea G. (2010). Conflicting Estimates of Connectivity Among Deep-Sea Coral Populations. Mar. Ecol. 31, 144–157. doi: 10.1111/j.1439-0485.2010.00380.x
Mokhtar-Jamaï K., Pascual M., Ledoux J. B., Coma R., Féral J. P., Garrabou J., et al. (2011). From Global to Local Genetic Structuring in the Red Gorgonian Paramuricea clavata: The Interplay Between Oceanographic Conditions and Limited Larval Dispersal. Mol. Ecol. 20 (16), 3291–3305. doi: 10.1111/j.1365-294X.2011.05176.x
Nguyen L. T., Schmidt H. A., Von Haeseler A., Minh B. Q. (2015). IQ-TREE: A Fast and Effective Stochastic Algorithm for Estimating Maximum-Likelihood Phylogenies. Mol. Biol. Evol. 32 (1), 268–274. doi: 10.1093/molbev/msu300
NOAA Deep-Sea Coral Data Portal (2022). Available at: https://deepseacoraldata.noaa.gov/about-us.
O’Connell K. A., Smith E. N. (2018). The Effect of Missing Data on Coalescent Species Delimitation and a Taxonomic Revision of Whipsnakes (Colubridae: Masticophis). Mol. Phylogenet. Evol. 127, 356–366. doi: 10.1016/j.ympev.2018.03.018
Pante E., Abdelkrim J., Viricel A., Gey D., France S. C., Boisselier M. C., et al. (2015). Use of RAD Sequencing for Delimiting Species. Heredity 114 (5), 450–459. doi: 10.1038/hdy.2014.105
Pena L. D., Goldstein S. L. (2014). Thermohaline Circulation Crisis and Impacts During the Mid-Pleistocene Transition. Science 345 (6194), 318–322. doi: 10.1126/science.1249770
Pérez-Portela R., Cerro-Gálvez E., Taboada S., Tidu C., Campillo-Campbell C., Mora J., et al. (2016). Lonely Populations in the Deep: Genetic Structure of Red Gorgonians at the Heads of Submarine Canyons in the North-Western Mediterranean Sea. Coral Reefs 35 (3), 1013–1026. doi: 10.1007/s00338-016-1431-2
Poirier R. K., Billups K. (2014). The Intensification of Northern Component Deepwater Formation During the Mid-Pleistocene Climate Transition. Paleoceanography 29 (11), 1046–1061. doi: 10.1002/2014PA002661
Poliseno A., Altuna A., Cerrano C., Wörheide G., Vargas S. (2017). Historical Biogeography and Mitogenomics of Two Endemic Mediterranean Gorgonians (Holaxonia, Plexauridae). Org. Diversity Evol. 17 (2), 365–373. doi: 10.1007/s13127-017-0322-x
Pritchard J. K., Stephens M., Donnelly P. (2000). Inference of Population Structure Using Multilocus Genotype Data. Genetics 155 (2), 945–959. doi: 10.1093/genetics/155.2.945
Prouty N. G., Fisher C. R., Demopoulos A. W., Druffel E. R. (2016). Growth Rates and Ages of Deep-Sea Corals Impacted by the Deepwater Horizon Oil Spill. Deep Sea Res. Part II: Topical Stud. Oceanogr. 129, 196–212. doi: 10.1016/j.dsr2.2014.10.021
Puerta P., Johnson C., Carreiro-Silva M., Henry L. A., Kenchington E., Morato T., et al. (2020). Influence of Water Masses on the Biodiversity and Biogeography of Deep-Sea Benthic Ecosystems in the North Atlantic. Front. Mar. Sci. 7, 239. doi: 10.3389/fmars.2020.00239
Quattrini A. M., Baums I. B., Shank T. M., Morrison C. L., Cordes E. E. (2015b). Testing the Depth-Differentiation Hypothesis in a Deepwater Octocoral. Proc. R. Soc. B: Biol. Sci. 282 (1807), 20150008. doi: 10.1098/rspb.2015.0008
Quattrini A. M., Faircloth B. C., Dueñas L. F., Bridge T. C., Brugler M. R., Calixto-Botía I. F., et al. (2018). Universal Target-Enrichment Baits for Anthozoan (Cnidaria) Phylogenomics: New Approaches to Long-Standing Problems. Mol. Ecol. Resour. 18 (2), 281–295. doi: 10.1111/1755-0998.12736
Quattrini A. M., Gómez C. E., Cordes E. E. (2017). Environmental Filtering and Neutral Processes Shape Octocoral Community Assembly in the Deep Sea. Oecologia 183 (1), 221–236. doi: 10.1007/s00442-016-3765-4
Quattrini A. M., Nizinski M. S., Chaytor J. D., Demopoulos A. W., Roark E. B., France S. C., et al. (2015a). Exploration of the Canyon-Incised Continental Margin of the Northeastern United States Reveals Dynamic Habitats and Diverse Communities. PloS One 10 (10), e0139904. doi: 10.1371/journal.pone.0139904
Quattrini A. M., Wu T., Soong K., Jeng M. S., Benayahu Y., McFadden C. S. (2019). A Next Generation Approach to Species Delimitation Reveals the Role of Hybridization in a Cryptic Species Complex of Corals. BMC Evol. Biol. 19 (1), 1–19. doi: 10.1186/s12862-019-1427-y
Radice V. Z., Quattrini A. M., Wareham V. E., Edinger E. N., Cordes E. E. (2016). Vertical Water Mass Structure in the North Atlantic Influences the Bathymetric Distribution of Species in the Deep-Sea Coral Genus Paramuricea. Deep Sea Res. Part I: Oceanogr. Res. Papers 116, 253–263. doi: 10.1016/j.dsr.2016.08.014
Rambaut A., Drummond A. J., Xie D., Baele G., Suchard M. A. (2018). Posterior Summarisation in Bayesian Phylogenetics Using Tracer 1.7. Syst. Biol. 67, syy032. doi: 10.1093/sysbio/syy032
Ree R. H., Smith S. A. (2008). Maximum Likelihood Inference of Geographic Range Evolution by Dispersal, Local Extinction, and Cladogenesis. Systematic Biol. 57 (1), 4–14. doi: 10.1080/10635150701883881
Reitzel A. M., Herrera S., Layden M. J., Martindale M. Q., Shank T. M. (2013). Going Where Traditional Markers Have Not Gone Before: Utility of and Promise for RAD Sequencing in Marine Invertebrate Phylogeography and Population Genomics. Mol. Ecol. 22 (11), 2953–2970. doi: 10.1111/mec.12228
Revell L. J. (2012). Phytools: An R Package for Phylogenetic Comparative Biology (and Other Things). Methods Ecol. Evol. 3 (2), 217–223. doi: 10.1111/j.2041-210X.2011.00169.x
Rivas D., Badan A., Ochoa J. (2005). The Ventilation of the Deep Gulf of Mexico. J. Phys. Oceanogr. 35 (10), 1763–1781. doi: 10.1175/JPO2786.1
Roberts E. M., Bowers D. G., Meyer H. K., Samuelsen A., Rapp H. T., Cárdenas P. (2021). Water Masses Constrain the Distribution of Deep-Sea Sponges in the North Atlantic Ocean and Nordic Seas. Mar. Ecol. Prog. Ser. 659, 75–96. doi: 10.3354/meps13570
Rosenberg N. A. (2004). DISTRUCT: A Program for the Graphical Display of Population Structure. Mol. Ecol. Notes 4 (1), 137–138. doi: 10.1046/j.1471-8286.2003.00566.x
Roveri M., Flecker R., Krijgsman W., Lofi J., Lugli S., Manzi V., et al. (2014). The Messinian Salinity Crisis: Past and Future of a Great Challenge for Marine Sciences. Mar. Geol. 352, 25–58. doi: 10.1016/j.margeo.2014.02.002
Sanders H. L. (1968). Marine Benthic Diversity: A Comparative Study. Am. Nat. 102 (925), 243–282. doi: 10.1086/282541
Schloss P. D., Westcott S. L., Ryabin T., Hall J. R., Hartmann M., Hollister E. B., et al. (2009). Introducing Mothur: Open-Source, Platform-Independent, Community-Supported Software for Describing and Comparing Microbial Communities. Appl. Environ. Microbiol. 75 (23), 7537–7541. doi: 10.1128/AEM.01541-09
Schmidt-Lebuhn A. N., Aitken N. C., Chuah A. (2017). Species Trees From Consensus Single Nucleotide Polymorphism (SNP) Data: Testing Phylogenetic Approaches With Simulated and Empirical Data. Mol. Phylogenet. Evol. 116, 192–201. doi: 10.1016/j.ympev.2017.07.018
Shearer T. L., Coffroth M. A. (2008). DNA BARCODING: Barcoding Corals: Limited by Interspecific Divergence, Not Intraspecific Variation. Mol. Ecol. Resour. 8 (2), 247–255. doi: 10.1111/j.1471-8286.2007.01996.x
Smith C. R., De Leo F. C., Bernardino A. F., Sweetman A. K., Arbizu P. M. (2008). Abyssal Food Limitation, Ecosystem Structure and Climate Change. Trends Ecol. Evol. 23 (9), 518–528. doi: 10.1016/j.tree.2008.05.002
Smith C. R., Kukert H., Wheatcroft R. A., Jumars P. A., Deming J. W. (1989). Vent Fauna on Whale Remains. Nature 341 (6237), 27–28. doi: 10.1038/341027a0
Somero G. N. (1992). Adaptations to High Hydrostatic Pressure. Annu. Rev. Physiol. 54 (1), 557–577. doi: 10.1146/annurev.ph.54.030192.003013
Stamatakis A. (2006). RAxML-VI-HPC: Maximum Likelihood-Based Phylogenetic Analyses With Thousands of Taxa and Mixed Models. Bioinformatics 22 (21), 2688–2690. doi: 10.1093/bioinformatics/btl446
Stange M., Sánchez-Villagra M. R., Salzburger W., Matschiner M. (2018). Bayesian Divergence-Time Estimation With Genome-Wide Single-Nucleotide Polymorphism Data of Sea Catfishes (Ariidae) Supports Miocene Closure of the Panamanian Isthmus. Syst. Biol. 67 (4), 681–699. doi: 10.1093/sysbio/syy006
Steph S., Tiedemann R., Prange M., Groeneveld J., Schulz M., Timmermann A., et al. (2010). Early Pliocene Increase in Thermohaline Overturning: A Precondition for the Development of the Modern Equatorial Pacific Cold Tongue. Paleoceanography 25 (2). doi: 10.1029/2008PA001645
Thistle D. (2003). The Deep-Sea Floor: An Overview. In: Ecosystems of the Deep Ocean,Ecosystems of the World, Tyler P. A., Ed. Amsterdam: Elsevier Science. pp. 5–38
Thoma J. N. (2013). Molecular and Morphological Diversity of Sea Fans With Emphasis on Deep-Sea Octocorals of the Order Alcyonacea Lamouroux (University of Louisiana Lafayette). PhD Dissertation.
Thoma J. N., Pante E., Brugler M. R., France S. C. (2009). Deep-Sea Octocorals and Antipatharians Show No Evidence of Seamount-Scale Endemism in the NW Atlantic. Mar. Ecol. Prog. Ser. 397, 25–35. doi: 10.3354/meps08318
Townsend D. W., Pettigrew N. R., Thomas M. A., Neary M. G., McGillicuddy D. J., O’Donnell J. (2015). Water Masses and Nutrient Sources to the Gulf of Maine. J. Mar. Res. 73 (3-4), 93–122. doi: 10.1357/002224015815848811
Tribble C. M., Freyman W. A., Landis M. J., Lim J. Y., Barido-Sottani J., Kopperud B. T, et al. (2022). RevGadgets: An R Package for Visualizing Bayesian Phylogenetic Analyses From RevBayes. Methods Ecol. Evol. 13 (2), 314–323. doi: 10.1101/2021.05.10.443470
Untiedt C., Quattrini A., Mcfadden C., Alderslade P., Pante E., Burridge C. (2021). Phylogenetic Relationships Within Chrysogorgia (Alcyonacea: Octocorallia), a Morphologically Diverse Genus of Octocoral, Revealed Using a Target Enrichment Approach. Front. Mar. Sci. 7. doi: 10.3389/fmars.2020.599984
Van Dover C. L., German C. R., Speer K. G., Parson L. M., Vrijenhoek R. C. (2002). Evolution and Biogeography of Deep-Sea Vent and Seep Invertebrates. Science 295 (5558), 1253–1257. doi: 10.1126/science.1067361
White H. K., Hsing P. Y., Cho W., Shank T. M., Cordes E. E., Quattrini A. M., et al. (2012). Impact of the Deepwater Horizon Oil Spill on a Deep-Water Coral Community in the Gulf of Mexico. Proc. Natl. Acad. Sci. 109 (50), 20303–20308. doi: 10.1073/pnas.1118029109
Wilson G. D., Hessler R. R. (1987). Speciation in the Deep Sea. Annu. Rev. Ecol. System. 18 (1), 185–207. doi: 10.1146/annurev.es.18.110187.001153
Wilson A. M., Raine R., Mohn C., White M. (2015). Nepheloid Layer Distribution in the Whittard Canyon, NE Atlantic Margin. Mar. Geol. 367, 130–142. doi: 10.1016/j.margeo.2015.06.002
Wirshing H. H., Messing C. G., Douady C. J., Reed J., Stanhope M. J., Shivji M. S. (2005). Molecular Evidence for Multiple Lineages in the Gorgonian Family Plexauridae (Anthozoa: Octocorallia). Mar. Biol. 147 (2), 497–508. doi: 10.1007/s00227-005-1592-y
WoRMS Editorial Board (2022) World Register of Marine Species (Accessed 2022-01-04). Available from https://www.marinespecies.org at VLIZ.
Keywords: systematics, RAD- seq, genomics, species delimitation, population genetics, biogeography
Citation: Quattrini AM, Herrera S, Adams JM, Grinyó J, Allcock AL, Shuler A, Wirshing HH, Cordes EE and McFadden CS (2022) Phylogeography of Paramuricea: The Role of Depth and Water Mass in the Evolution and Distribution of Deep-Sea Corals. Front. Mar. Sci. 9:849402. doi: 10.3389/fmars.2022.849402
Received: 06 January 2022; Accepted: 08 March 2022;
Published: 06 April 2022.
Edited by:
Mari Heggernes Eilertsen, University of Bergen, NorwayReviewed by:
Maria Belen Arias Mella, University of Essex, United KingdomGuadalupe Bribiesca-Contreras, Natural History Museum, United Kingdom
Copyright © 2022 Quattrini, Herrera, Adams, Grinyó, Allcock, Shuler, Wirshing, Cordes and McFadden. This is an open-access article distributed under the terms of the Creative Commons Attribution License (CC BY). The use, distribution or reproduction in other forums is permitted, provided the original author(s) and the copyright owner(s) are credited and that the original publication in this journal is cited, in accordance with accepted academic practice. No use, distribution or reproduction is permitted which does not comply with these terms.
*Correspondence: Andrea M. Quattrini, cXVhdHRyaW5pYUBzaS5lZHU=