 Shaun Fraser
 James J. Waggitt
- 1Shetland UHI, Scalloway Campus, Inverness, United Kingdom
- 2School of Ocean Sciences, Bangor University, Menai Bridge, United Kingdom
Persisting knowledge gaps relating to the ecological context and potential environmental impacts of marine renewable energy (MRE) devices continue to add substantial costs and uncertainty to MRE projects globally. Increasingly sophisticated technological approaches to environmental monitoring can have fundamental non-trivial shortcomings for environmental impact assessment (EIA), whilst substantial practical and financial costs of deployments can prevent their application. For the tidal stream energy (TSE) sector, there is a need for practical and cost-effective methods that can provide site-specific information on predator behavior and associated prey assemblages. Considering existing knowledge of animal communities in tidal channel environments, a proportional approach using shore-based observation and baited fish trap methods was developed. During April 2021, a trial of these methods was conducted in tidal channel environments in Shetland, UK. The practical application of the proposed approach is demonstrated here with results from three tidal channels including Bluemull Sound, the site of active TSE installations (the Shetland Tidal Array). Observation of predator behavior across the study sites are reported for great cormorant Phalacrocorax carbo and European shag Phalacrocorax aristotelis. Seabird diving data calculated from the shore-based observations provided metrics relevant to informing EIA and collision risk modelling including dive duration, dives per minute, and % time underwater. Fish trap deployments targeted the benthic and demersal prey of these predators in the three study sites and across a range of depths and hydrodynamic conditions. A variety of fish and invertebrate species known to be important components of benthic-foraging seabird diet were successfully captured by the traps, providing basic biological information on the prey assemblages observed in each site. The fish species observed in the highest abundance were saithe Pollachius virens and cod Gadus morhua. Benefits, limitations, and applications of this approach are discussed along with various factors relating to the performance of both methods. The shore-based observations rapidly identified relevant patterns in predator foraging activity which informed the targeted deployment of fish traps to provide complementary prey data. This novel combined approach has potential to reduce costs and uncertainty in EIA and for supporting the responsible development of the MRE industry.
1 Introduction
The development of the marine renewable energy (MRE) industry remains hindered by ecological knowledge gaps which substantially add to the costs and uncertainty associated with project consenting. The development of the tidal stream energy (TSE) sector is focused on highly energetic areas such as tidal channel environments where the available resource is concentrated. Tidal channel environments provide important habitats and foraging opportunities for a range of mobile species that are of concern to regulators, project developers, the public, and other industries such as fishing (Uda and Ishino, 1958; Zamon, 2003; Johnston et al., 2005; Benjamins et al., 2016). Fish are likely the main prey for marine mammals and seabirds that forage in MRE sites. However, empirical data relating to the abundance, distribution, and behavior of both prey and top predators in these sites are scarce (Martínez et al., 2021) and the link between them remain poorly understood (Benjamins et al., 2015).
Although the number of active TSE installations remain low, a few tidal channel environments now host expanding arrays of tidal stream turbines (Coles et al., 2021), for example at Bluemull Sound, Shetland, UK. The limited extent of these sites, and tendency for them to occur in remote communities, means that TSE sector mostly comprises of small companies aiming for low numbers of installation. Aside from the substantial challenge of designing and manufacturing turbines, smaller companies must also identify and mitigate negative impacts on the wildlife through site-specific environmental impact assessment (EIA). However, the dynamic conditions in tidal channels continues to present serious practical and analytical challenges for effective EIA (Hasselman et al., 2020; Isaksson et al., 2020). Proportional and cost-effective survey strategies which relate to the size of the MRE project and specific animals or habitats of concern are required to support the responsible development of the MRE industry (Copping et al., 2020).
It is believed that TSE installations could impact animals through underwater noise, habitat modification, attraction effects, and the potential for displacement (Copping, 2020). However, the potential for marine animals colliding with moving turbine components is often the main consenting concern for MRE projects (Hasselman et al., 2020). Assessing collision risk can be divided into identifying a population’s: (1) relative-use of habitats (1-10 km) earmarked for developments, (2) the relative-use of microhabitats (100s of m) suitable for installations and (3) diving behavior immediately around installations (Waggitt and Scott, 2014). Whilst components (1) and (2) can be addressed with longstanding methods including at-sea surveys and biologging, component (3) poses practical challenges and has received considered attention in the past decade. However, despite the large proportion of research effort expended on collision, the accurate estimate of risk remains elusive (Copping et al., 2020). Biologging efforts that provide detailed behavioral data (Johnston et al., 2021; Onoufriou et al., 2021) may not necessarily provide any coverage in the specific locations of interest (Isaksson et al., 2021). For example, it is unknown whether birds fitted with biologging devices will occupy or feed around locations for planned MRE installations, or places where animals can be captured may be absent on coastlines near the development site. Similarly, ambitious survey programs designed to inform risks to vulnerable seabirds or marine mammals have often failed to report simple behavioral data, such as dive duration, which are important parameters in collision risk modelling (Scottish Natural Heritage, 2016). Existing models often rely on measurements of diving behavior in less energetic environments which assumes diving behavior is consistent across sites (Robbins, 2017). However, foraging strategies are known to substantially vary between and among MRE sites (e.g., Waggitt et al., 2017) as predators adapt their search and pursuit strategies to the complex physical conditions (Benjamins et al., 2015) and the distribution of their prey (Elliott et al., 2008). Thus, to accurately constrain risk models and inform EIA there remains a need to provide targeted fine-scale and site-specific information on predator foraging behavior and associated prey assemblages.
In acknowledgement of these needs, a variety of sophisticated technological approaches have been developed in recent years (e.g., McCann and Bell, 2017; Polagye et al., 2020). Optical cameras have proved useful for monitoring very close to MRE devices in favorable conditions (Hammar et al., 2013; Broadhurst et al., 2014; Smith, 2021). However, the range and wider application of optical cameras for monitoring in MRE sites is extremely limited by visibility. Consequently, active acoustic instrumentation, which can be effective over much greater ranges than optical cameras, has been used in MRE sites worldwide to investigate animal distributions and behavior (Viehman and Zydlewski, 2017; Williamson et al., 2017; Scherelis et al., 2020). However, the data from such technologies are often confounded by interference relating to turbulence (Melvin and Cochrane, 2015; Fraser et al., 2017) and interpreted in the absence of even the most basic biological information such as species identity. Analysis from optical cameras and active acoustics typically focuses on fish which are the most abundant species group identified in MRE sites. However, biological ground truth data are particularly lacking for fish species, since the conventional fish sampling method of trawling is often considered to be unworkable or impractical in fast currents. Further, active acoustic instruments are often incapable of detecting fish in areas that they associate most with such as near the seabed, which is affected by blanking distances and nearfield effects in upward-facing systems, or interference and shadowing relating to the strong scattering at the seabed observed in downward facing systems. Thus, despite huge volumes of data collected by existing optical and acoustic systems, there remains a pressing need for basic information on fish, particularly near the bed, to provide ground truthing data and basic biological context such as species identification, length distributions, and age classes. Fish are also particularly relevant to MRE consenting as they may directly interact with moving turbine components and are the preferred prey of many key predators.
An alternative approach to risk assessment in tidal stream environments uses existing knowledge on the animal communities in these habitats to tailor practical methods to suit their ecology. For example, Cepphus sp. (black guillemot Cepphus grylle, pigeon guillemot Cepphus columba) and Phalacrocoridae (great cormorant Phalacrocorax carbo, European shag Phalacrocorax aristotelis) are synonymous with tidal channel environments (Furness et al., 2012; Benjamins et al., 2015). These species are primarily found inshore (Stone et al., 1995; Waggitt et al., 2020), diving to the seabed in pursuit of benthic fish and invertebrates (Wanless et al., 1991; Watanuki et al., 2008; Masden et al., 2013; Shoji et al., 2015). Because they are abundant in tidal channel environments and dive to the seabed, Cepphus sp. and Phalacrocoracidae are considered particularly vulnerable to impacts from TSE turbines (Furness et al., 2012). Therefore, in many TSE development sites the species of primary concern are almost certainly diving to the seabed and risk assessments need not focus on diving depth, but on other aspects of their ecology which indicate potential impacts from TSE turbines. For example, the likelihood of interactions with TSE turbines are indicated by dive duration, dives per minute, and the proportion of time underwater (Scottish Natural Heritage, 2016). Similarly, assessment of prey distributions should utilize methods that can sample benthic and demersal species most relevant to top-predator foraging activity.
In this project, we sought to develop practical methods that could provide data efficiently in a targeted and cost-effective manner and that would be reliable in realistic operating conditions. Shetland was selected as an ideal case study for this as there are numerous energetic tidal channel sites with a range of different environmental characteristic available (Bryden et al., 1995). Bluemull Sound, in the north of Shetland, is the location of one of the few active arrays of TSE turbines globally (Coles et al., 2021). With some previous knowledge of these sites and the potential vulnerable species present, we considered existing methods that could be adapted to suit the requirements above and that would also be practical in the vicinity of an active MRE project. We proposed a combined fish trap survey and shore-based observation approach to collect data on prey assemblages and predator behavior respectively. The use of baited fish traps (also referred to as “pots” or “creels”) for survey purposes has been identified before with the primary advantage that they can accurately sample prey assemblages at or near the seabed even in rough grounds (ICES, 2007; Smith et al., 2010) and close to existing marine infrastructure (e.g., Bagdonas et al., 2012). Similarly, shore-based observations can use conventional optical instruments to efficiently provide detailed behavior information of mobile predators, such as seabirds, which are often conveniently visible from vantage points nearby sites of interest (e.g. Heal et al., 2021).
The aims of this paper are to: 1) report on the development of a combined fish trap and shore-based observation method to collect relevant ecological data in tidal channel environments; 2) demonstrate the application of these methods in relevant marine environments including in the vicinity of a MRE project; and 3) provide an overview of the resulting data that provide preliminary insights on fish and seabirds’ use of these sites.
2 Material and Methods
2.1 Study Location
Shetland is a subarctic archipelago which forms the northernmost part of the UK (Figure 1). Shetland has long been recognized as attractive for MRE development due to the narrow tidal channels with high energy densities that are relatively sheltered and close to island energy consumption centers (Bryden et al., 1995). There are numerous sites in Shetland where flows are accelerated around headlands and between islands so that spring currents exceed 2.5 m/s. In particular, Yell Sound and Bluemull Sound (Figure 1) are recognized as particularly attractive for tidal energy extraction (Neill et al., 2017) and were both studied during this project. Yell Sound and Bluemull Sound connect the North Sea to the shelf sea region of the North Atlantic and are characterized by strongly bi-directional tides. Bluemull Sound hosts the Shetland Tidal Array installed by Nova Innovation Ltd, which at the time of this study was comprised of four turbines and plans by Nova Innovation Ltd to install a further two (Smith, 2021). A third site, the Sound of Papa (Figure 1), was also studied during this project and is more exposed and shallower than the previous sites, and consequently has had less interest from the MRE industry. Nonetheless, the Sound of Papa is well known locally for strong tidal flows and dynamic conditions, and so provides another useful test site for this trial. Benthic habitats in these study areas are not well resolved at fine scales but are likely characterized by a heterogenous mix of tidally swept bedrock and boulders, with patches of course sediment and seaweed habitat particularly in the relatively sheltered sublittoral margins.
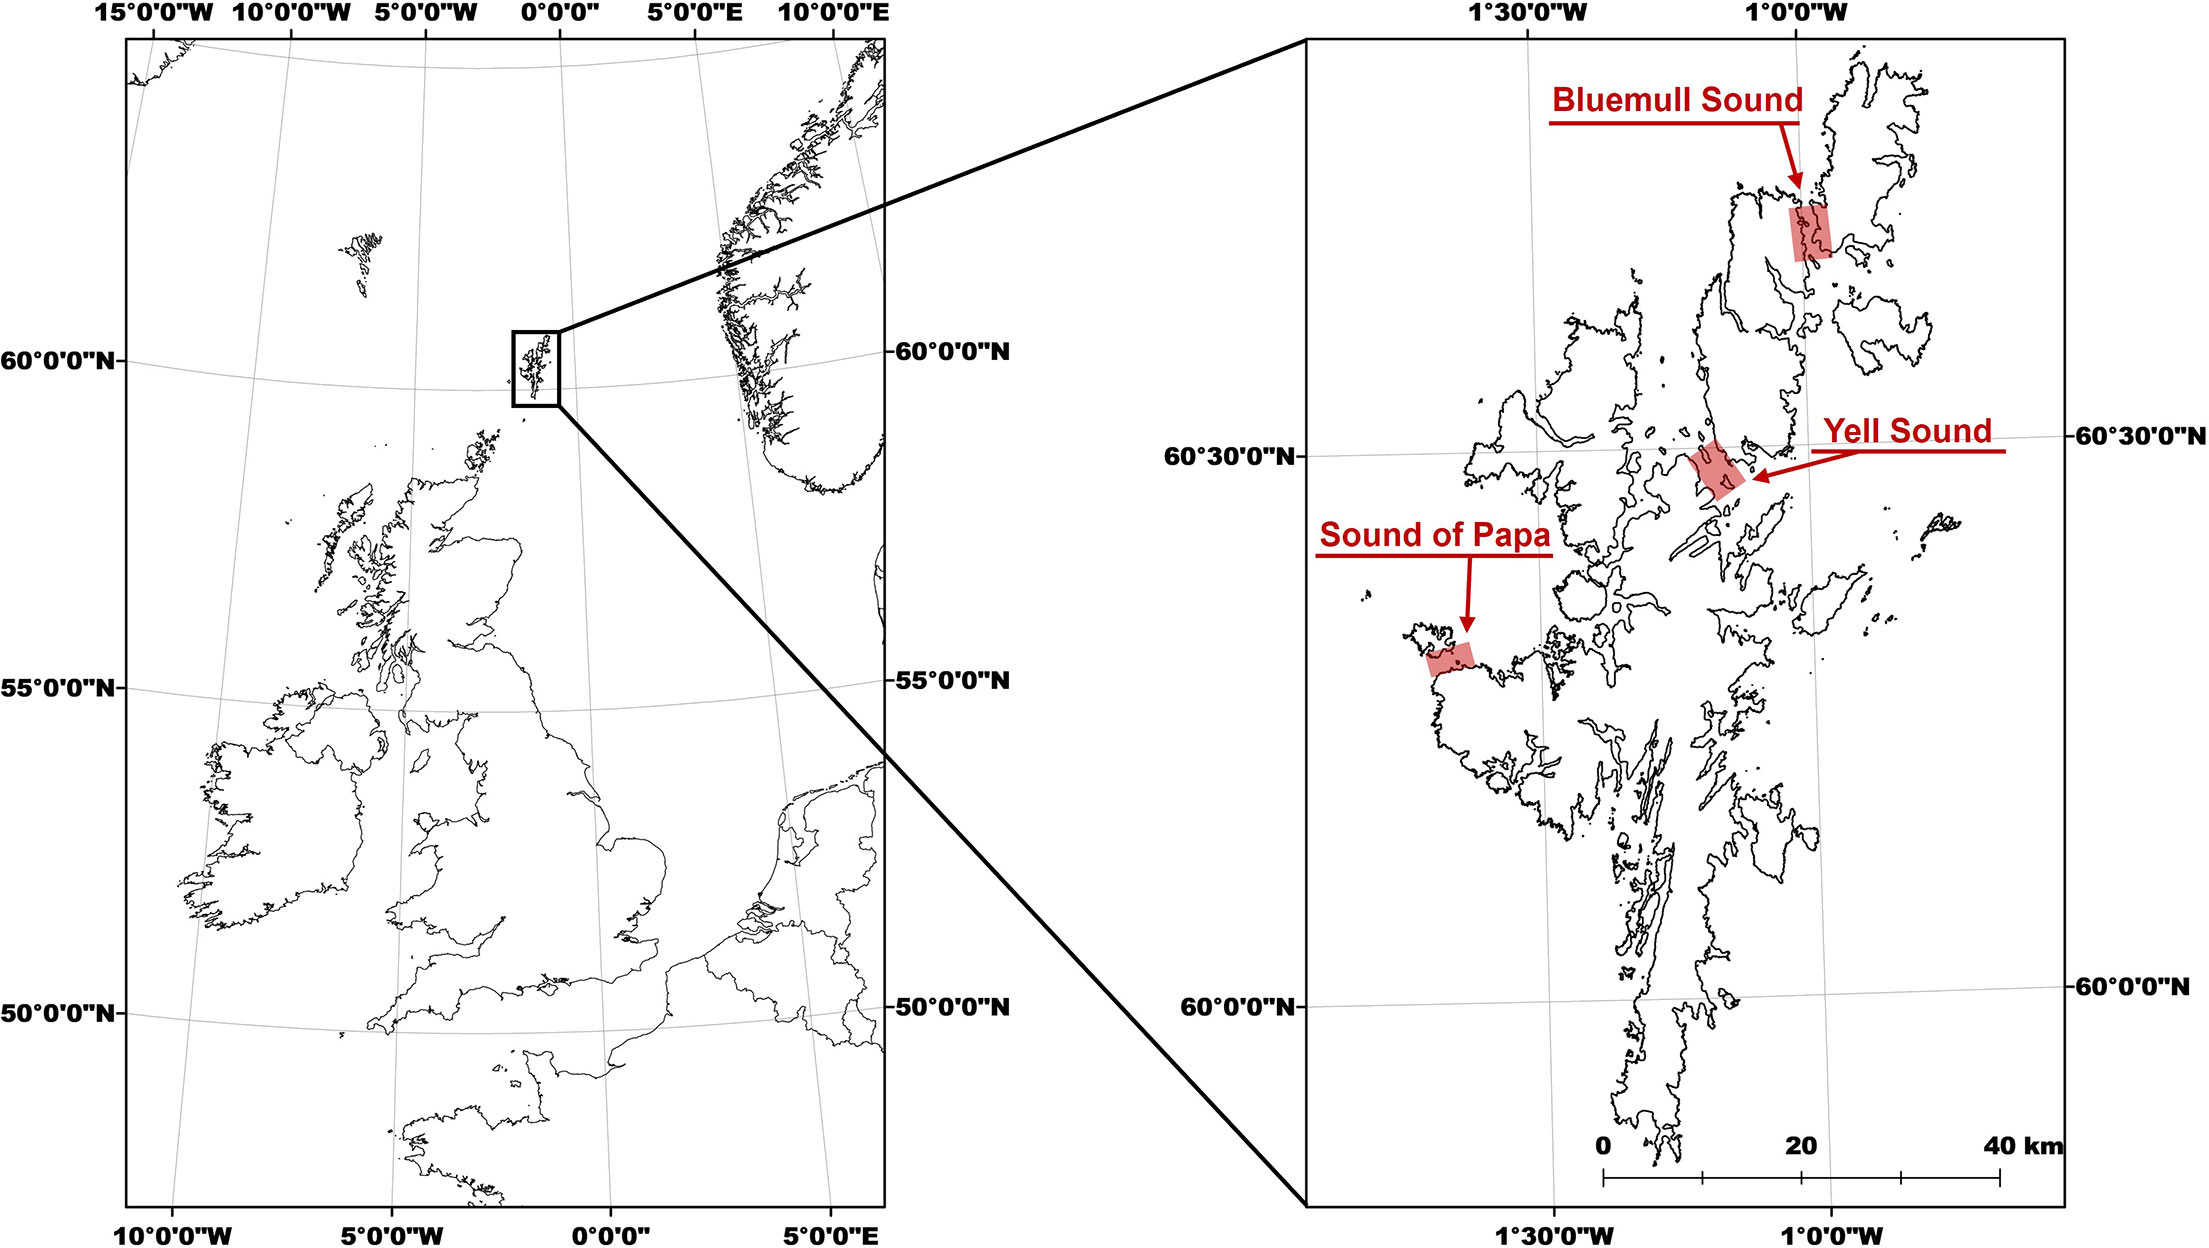
Figure 1 General overview maps of Shetland in UK context (left) and with study sites highlighted (expanded, right).
2.2 Seabird Behavior
2.2.1 Shore-Based Observation Equipment
The equipment used to record dive locations and behavior were an extension on those used by Heal et al. (2021) for recording identical information from Anglesey, UK. Heal et al. (2021) used rangefinder binoculars (Opticron™ Marine-2, 7×50) to estimate the distance (m) and compass bearing (°) between a known location on the coastline (hereafter, vantage point) and an animal on the water surface, allowing the approximate position of that animal to be calculated. These approaches to estimating positions of objects resemble those used by theodolites, which are commonly used to record movement of cetaceans (e.g., Johnston et al., 2005) and occasionally seabirds (Ronconi and Clair, 2002). Although they provide particularly accurate positions of objects (± 1 m), theodolites are considerably heavier and relatively cumbersome, limiting application in remote locations and reducing effectiveness at tracking animals at short-range in dynamic currents. Whilst successfully overcoming practical issues, ornithodolites are a particularly expensive and specialist solution, and are not available for general purchase (Cole et al., 2019). Despite providing less accurate positions of objects, it was considered that rangefinder binoculars provided a cost-effective and practical solution for recording information across a range of sites, being applicable in numerous scenarios and locations. However, whilst Heal et al. (2021) were broadly successful in collecting useful information, several improvements were noted by the authors at the time of publication, whilst other useful modifications were also noted after publication. These improvements and modifications were implemented here, although care was taken to retain the key benefits of the original approaches.
Firstly, distances to animals were estimated by measuring the tilt (° from horizontal) of the binoculars with a logger (HOBO Pendant®, UA-004-64) rather than a comparable measurement using reticles in the eyepiece. This logger provides measurements of tilt at 1 second and approximately 1.4° resolution. Whilst these techniques are fundamentally similar, the former does not need the horizon to be visible in the eyepiece and electronically stores these measurements, increasing the number of vantage points where this method can be used and removing the need for manual recording on paper. Secondly, the rangefinder binoculars were mounted on a tripod with a pan handle rather than being hand-held. The former allows steadier tracking of animals and reduces the likelihood of losing animals during observations. Finally, the use of a tripod also allowed a camcorder (Panasonic HDC-HS60) to be used alongside the rangefinder binoculars, providing concurrent footage of the animal alongside estimations of distance and compass bearings to the animal. The addition of the camcorder enabled bearings to be dictated rather than being manually recorded on paper, and allowed errors in the original observations (i.e., incorrect timings, species identification, switching between animals) to be identified and corrected or omitted. The rangefinder binoculars, logger, and camcorder were combined using a simple aluminum fitting which was attached onto the head of the tripod (Figure 2).
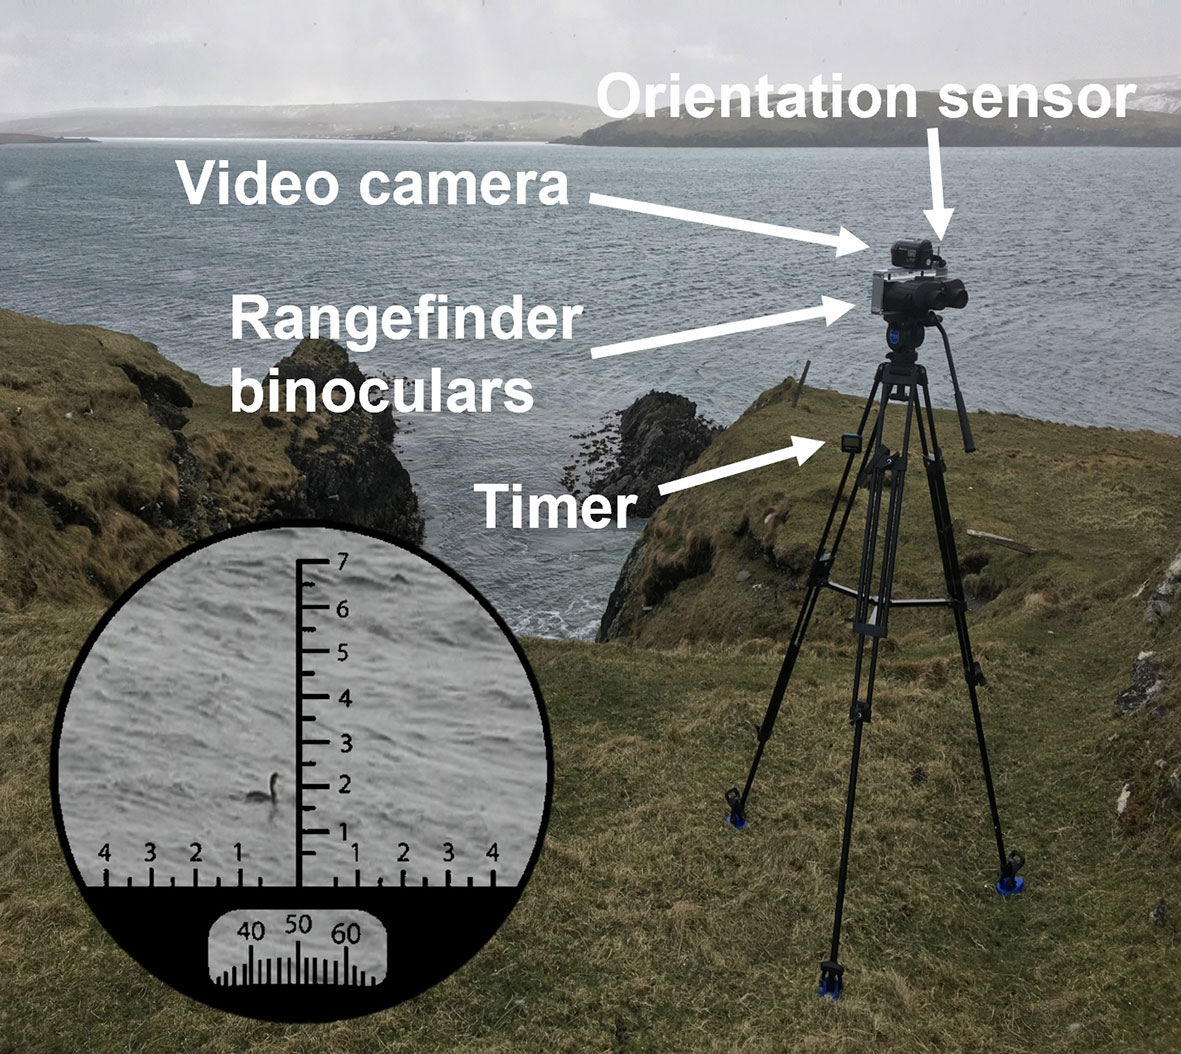
Figure 2 Photograph of the in-situ combination of rangefinder binoculars, camcorder, orientation sensor and digital timer used to record the locations and behavior of foraging animals in study sites. Also illustrated is the view through the eyepiece showing the reticles used to ensure that the animal was in the center of the eyepiece, maximizing the accuracy of distances to the animal calculated from the orientation sensor, and the compass used to measure the bearing (°) to the animal.
2.2.2 Shore-Based Data Collection
Observations of seabird behavior were undertaken from 2nd to 15th April 2021. The observation period represented the pre-breeding season of black guillemot, and early breeding season of great cormorant and European shag. Whilst changes in currents and depth can cause variation in foraging activities across tidal states (e.g., Waggitt et al., 2016), the present study focused on demonstrating how these approaches could collect useful measurements of diving behavior for risk assessment. Because of this methodological emphasis, survey regimes ensuring continuous and/or systematic surveys across tidal states were not enforced. Instead, a single observer performed discrete surveys of 1 - 4 h duration in duration, depending upon weather conditions and logistics. Nevertheless, attempts were made to cover several different tidal states at each site, and future studies using these data could address ecological questions concerning tidal states in further detail. To assist the development of approaches, measurements of seabird behavior focused exclusively on great cormorant and European shag because their large size (great cormorant = 80 - 100 cm length and 130 - 160 cm wingspan; European shag = 65 - 80 cm length and 90 - 105 cm wingspan; www.rspb.org.uk) and elongated necks made them relatively easy to track. However, there is no reason to believe that vulnerable species of smaller size (i.e., black guillemots = 30 - 32 cm length and 52 - 58 cm wingspan) would not be easy to track by an experienced observer.
Suitable vantage points were identified at each site which provided comprehensive views over microhabitats containing strong and/or turbulent currents (Figure 3). Given its importance as an active TSE site, three vantage points were selected at Bluemull Sound: one at Hoga Ness covering the southern parts of the channel (15 m altitude, 60° 41’ 02.91” N, 00° 58’ 51.78” W), and two at Cullivoe Ness covering the central (10 m altitude, 60° 41’ 56.60” N, 0° 59’ 18.10” W) and northern parts (10 m altitude, 60° 42’ 01.08” N, 00° 59’ 14.39” W) of the channel. A further vantage point was selected at Yell Sound by Mossbank (10 m altitude, 60° 27’ 41.03” N, 01° 10’ 51.41” W), and a final vantage point was selected at the Sound of Papa by Norby (30 m altitude, 60° 18’ 24.54” N, 01° 38’ 36.97” W). The resolution of distance estimates is determined by the altitude of the vantage point and the resolution of tilt measurements (approximately 1.4°). Resolution also varies with increasing distance from the vantage point, with positions beyond a certain threshold (< 1.4° from horizontal) undeterminable from tilt alone, i.e., calculated positions could occur anywhere upto the horizon. Because of issues with resolution at larger distances, observations were constrained to < 750, 600, 600 and 750 m at Hoga Ness, Mossbank, Ness of Cullivoe and Norby, respectively. This judgement was assisted by the coastal topography at Hoga Ness, the Ness of Cullivoe and Norby. At Mossbank, this judgement was based on observer experience of shore-based observations.
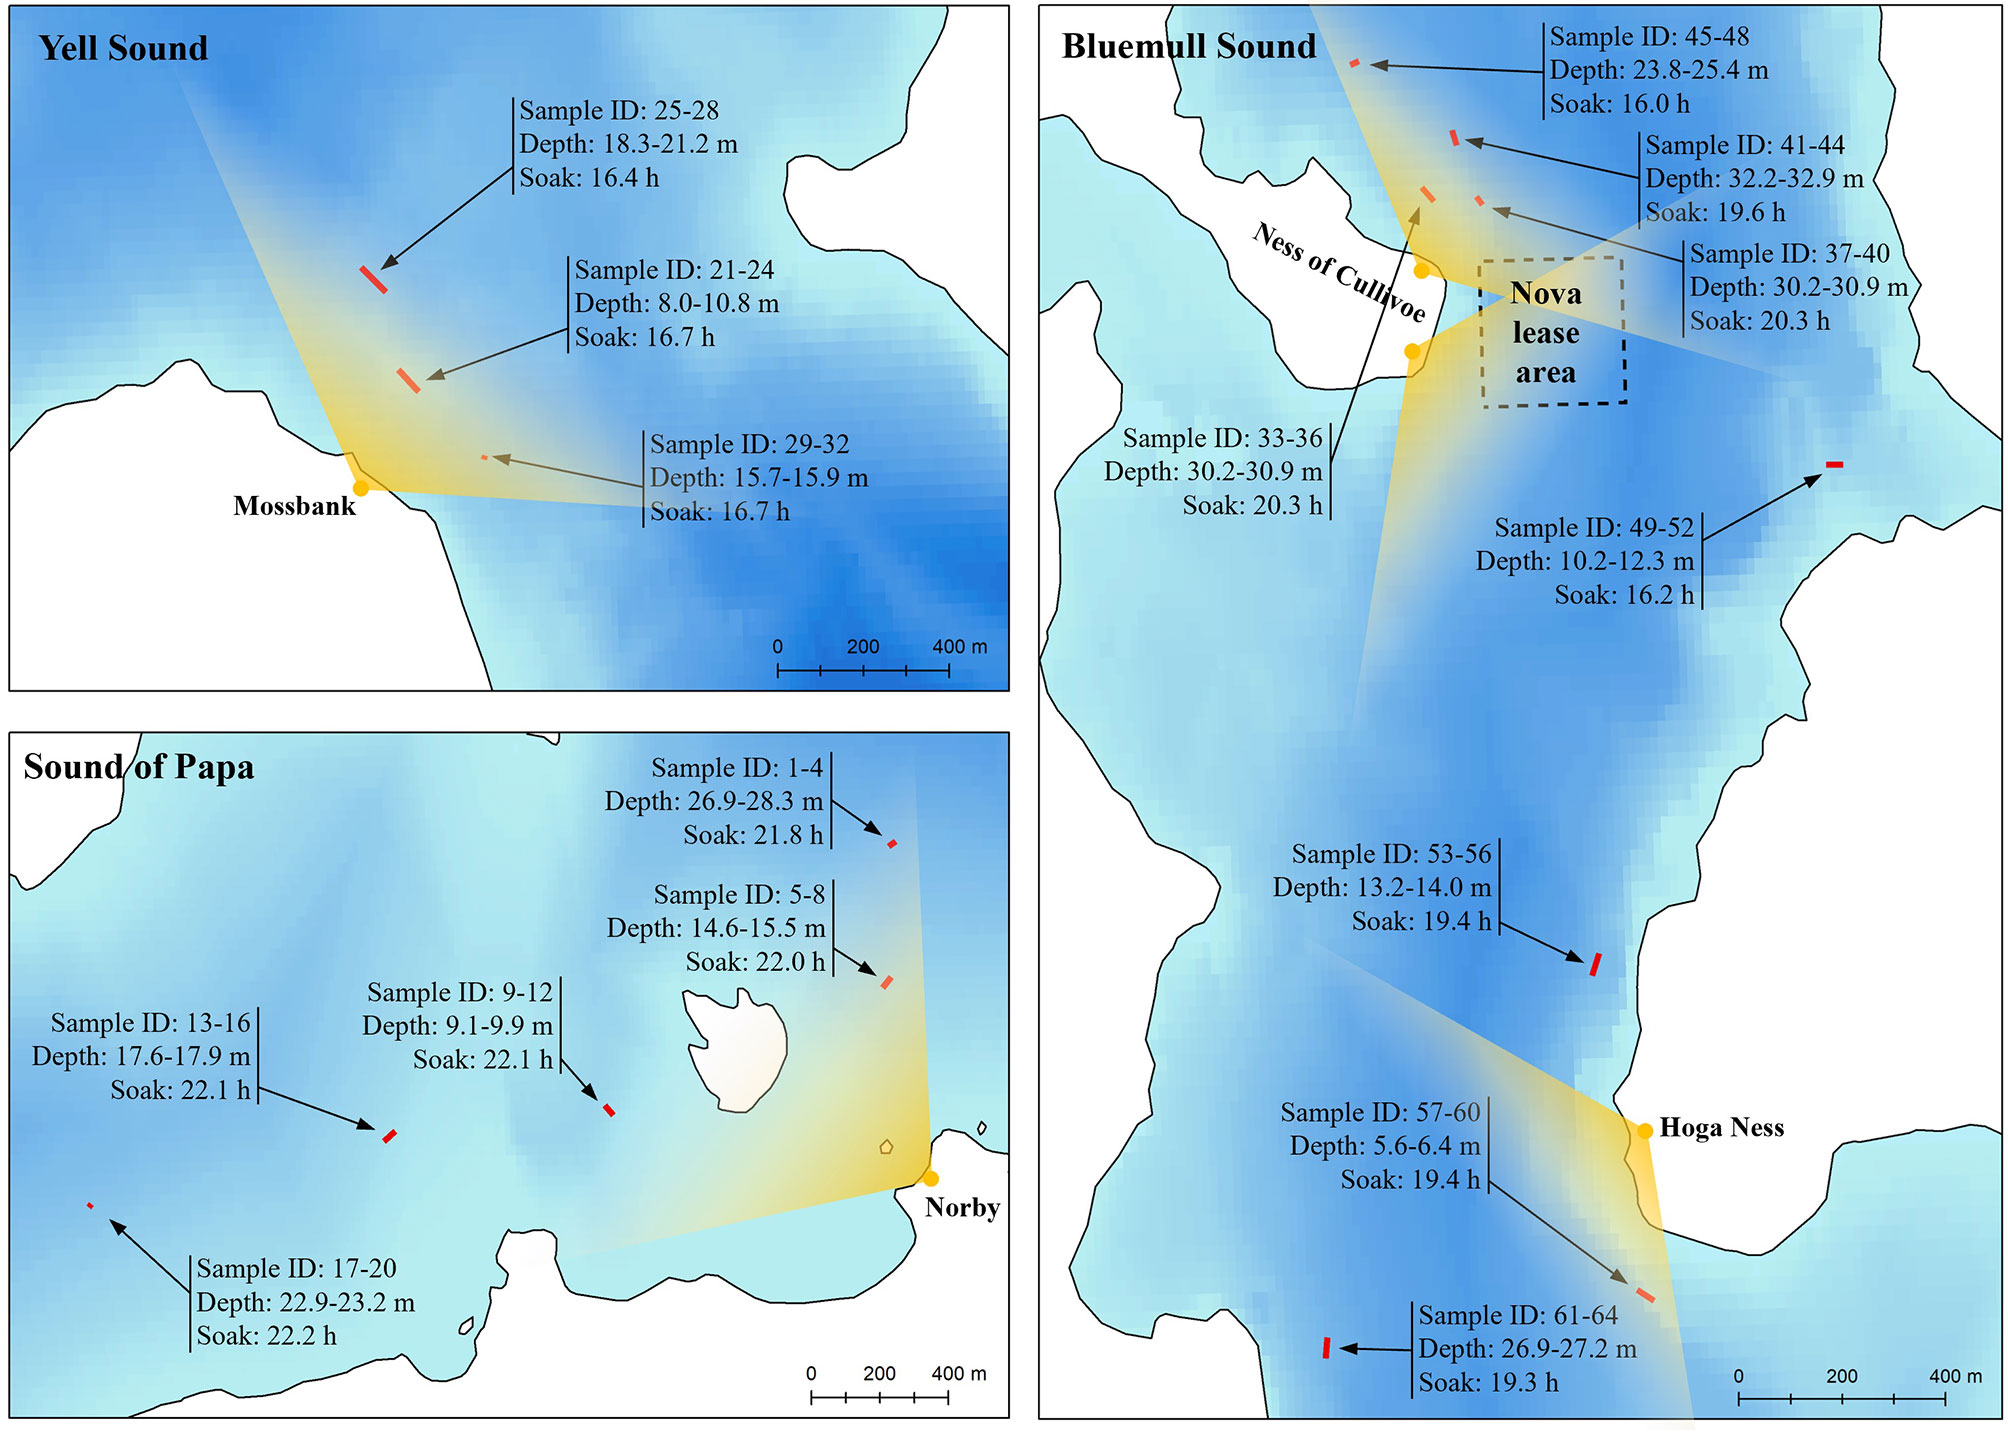
Figure 3 Site maps showing overall data collection strategy in the three tidal channel environments considered here: Bluemull Sound, Yell Sound, and the Sound of Papa. Vantage point locations are shown in yellow with an approximate field-of-view arc represented in each case. Fish trap string locations are shown in red with each string comprising four traps (two seabed and two floating traps) given sample IDs. The range of trap depths observed during deployment for each string is shown, along with soak time. The location of the Shetland Tidal Array is represented by the Nova lease area boundary coordinates at Bluemull Sound.
A standard routine was developed during preliminary surveys, allowing consistent and comparable data collection. On arriving at the site, all electronic equipment (logger, camcorder, digital timer, digital watch) were synchronized to the nearest second, ensuring that all measurements and video footage were directly comparable. On arriving at the vantage point, the tripod was setup at an appropriate height for the observer and weather conditions, providing a comfortable viewing position and reducing movement from wind. The observer then checked that the view in the rangefinder binocular eyepiece was aligned with that in the camcorder, ensuring that the image in the latter matched that in the former. The observer would then scan the sea surface using conventional binoculars looking for a suitable European shag or great cormorant. Suitable animals were those seemingly engaged in foraging activities, within the maximum distance (given previously), and discernable from others. When a suitable animal was located, the observer would focus the rangefinder binoculars on this animal, using the reticles and compass to position the animal in the center of the eyepiece, maximizing the accuracy of bearing and tilt measurements (Figure 2). At approximately the same time, the camcorder was started and zoomed in to an appropriate magnification, checking that the animal could be seen but maintaining a reasonable field-of-view. Bearings and tilt measurements were recorded for four events: the start of the track, the start of dives, the end of dives, and the end of the track. The bearings were dictated in the camcorder microphone, whereas the logger collected the tilt. To increase the number of animals watched whilst ensuring that their general behavior was adequately captured, the observer aimed to watch each animal for 10 minutes before searching for a new animal. The maximum time was based on previous experiences of similar approaches (Heal et al., 2021). As observers would follow animals in the eyepiece, they always saw the start of dives. However, because it was unknown where animals would re-emerge, observers needed to scan a wider area to see the end of dives. For ease, this scan was done with the naked-eye in the near-field (< 200 m) before relocating the animal in the eyepiece, but with the rangefinder binoculars in the far-field (> 200 m). In all instances, the end of a dive would be immediately dictated into the camcorder microphone to record the timings, before focusing in on the animal in the eyepiece to record the bearings and tilt, maximizing the accuracy of duration and location measurements.
2.2.3 Equipment Calibration
Whilst the use of aluminum would reduce interference from the mount on the rangefinder binocular compass, the logger and video-camera would have some interference on the latter, reducing the accuracy of the recorded bearings. To correct for interference from electronic equipment on the rangefinder binocular compass, a calibration was performed. During this calibration, an observer recorded bearings between a prominent vantage point at Eswick (20 m altitude, 60° 16’ 11.04” N, 01° 05’ 51.17” W) and landmarks. These landmarks were at reasonably regular intervals between 0° and 359°. The actual bearings between the vantage points and landmarks were calculated afterwards and compared to the recorded bearings from the rangefinder binoculars, enabling a clockwise-error measurement to be calculated based upon the absolute difference between these values. A negative clockwise error would indicate an anti-clockwise difference, whereas a positive clockwise error would indicate a clockwise difference, and values varied between -11° and 13°. Inspection of relationships between the recorded bearing and the clockwise error revealed a systematic and cyclical pattern. Therefore, a generalized additive model (GAM) with a gaussian distribution was used to model this pattern (Wood, 2006), enabling recorded bearings to be corrected to the actual bearings. The value of clockwise error was modelled as the response variable, and the corresponding value of actual bearing was modelled as a non-linear and cyclic explanatory variable.
When calculating the distance to the animal, it is assumed that the measurement of tilt from the logger is 0° when the rangefinder binoculars are focusing on the horizon. However, this assumption cannot be met if the logger itself is tilted when fitted onto the aluminum mount. Whilst care was taken to attach the logger completely flat on the mount, a small change in tilt can have a considerable effect on the estimated distance. Therefore, it is important that any tilt imposed on the logger when fitting it on the mount is offset when calculations of distance are performed. To calculate this offset, the mount was setup as it would be during a survey, with the rangefinder binoculars focused on the horizon for 1 minute. The tilt measurements downloaded from the logger revealed that the mount consistently increased the tilt measurement from 0° to 1.4°. Therefore, measurements of tilt from the logger were reduced by 1.4° before calculations of distance were performed.
2.2.4 Track Data Processing
All tracks were subjected to three quality assessments before analyses. The 1st assessment involved a manual inspection of video footage. Tracks were omitted from analyses when animals were not clearly visible in the image, possibly because the camera was not zoomed in enough and/or the animal was too far away. In other instances, tracks were also omitted because the animal was clearly beyond the maximum distance set for observation (see Shore-Based Data Collection). The 2nd assessment omitted tracks where complete dives (times/locations of the start and end of dives) were not recorded. This was primarily because animals flew-off before diving or were not seen emerging from a dive. Other reasons included the camera-battery running out, multiple birds being present, or animals simply not seen diving after several minutes of observation. The 3rd assessment involved quantitative inspection of tilt measurements from the logger. Tracks with modal tilt measurements of 0° were removed, as this would indicate tracks when animals were beyond the maximum distance set for observations but were not successfully identified as being beyond this range in the 1st assessment. The exception were instances where model tilt measurements of 0° occurred towards the end of track, occurring when animals had started within range and then drifted out of range. These animals were retained in analyses, but positions were not calculated at the end of the track.
2.2.5 Calculation of Dive Positions and Metrics
Positions were calculated for the start of each track, start and end of each dive, and the end of each track using the recorded distance and bearing between the animals and the vantage point. Measurements and calculations of positions were made using a UTM30N projection. The distance between animals and the vantage point (D) was calculated as D = A tan(θ) where A is the altitude of the vantage point in meters, and θ is the angle from vertical to the animal in degrees. Although inspection of tilt measurements collected by the logger during tracks showed that data were not particularly noisy, anomalous values were sometimes present. These anomalous values could occur if the observer momentarily slipped (e.g., gusts of wind) or may represent inherent variation in the measurement performance of the logger. Whilst inspection suggested that anomalous values were rare in the tilt measurements, calculations of positions would be incorrect if these erroneous values corresponded exactly with the timing of key events. To remove the influence of these erroneous values, modal tilt measurements between 0 and 10 seconds after the key event were used rather than absolute values at the second of the key event. The 10 seconds following the key event rather than the 10 seconds proceeding or around the key event were selected because the observer would have focused the rangefinder binoculars on the animal following its detection or emergence. Occasions where the variance of tilt measurements exceeded 2 were omitted from calculations of positions, as this suggests the unit was particularly unstable at the time. Combining the calculation of D with the measurement of the bearing between the animal and the vantage point (φ) allows the position of the animal (X2, Y2) to be estimated by X2 = X1 + D sin(φ) and Y2 = Y1 + D cos(φ) where X1 and Y1 are the vantage point eastings and northings respectively, in meters. Due to the relatively small tidal range (< 2 m) in Shetland and unavailability of fine-resolution hydrodynamic model data in all sites, calculations here did not consider changes in sea surface height across tidal state.
Several diving metrics were calculated for each track following Heal et al. (2021) which, in combination, provided complementary insights into collision risk. Mean dive duration (μ) indicates how long an animal could interact with an installation during a single foraging attempt. Dives per minute indicates how frequently an animal could interact with an installation. Repeatability in dive duration (R) indicates whether the likelihood of interactions is consistent amongst dives in a foraging bout and was represented using the coefficient of variation calculated as R = σ/μ where σ is the standard deviation of dive duration. The % time underwater indicates what proportion of time an animal is potentially exposed to installations during a foraging bout and is calculated as d/t where d is the cumulative dive duration and t the overall duration of diving activity, represented by the time between the start of the observation to the end of the final dive.
2.3 Prey Sampling
2.3.1 Trap Design and Rigging
Fish traps were adapted from commercially available wrasse trap designs available from Carapax Marine Group. The traps were of a double parlor design featuring a central entrance chamber fitted with two rigid oval eyes which separated two adjacent holding chambers connected via self-closable parlor entrances. The frame of the traps was made from 7 mm steel wire which was hot-dip galvanized, plastic-coated, and also wound with nylon twine for enhanced durability. The dimensions of the trap frames were: length = 980 mm, width = 400 mm, height = 280 mm. A small mesh size (12 mm) was selected to retain a wide catch variety, and knotless material was used to minimize damage to catches. Traps were baited with frozen Atlantic mackerel Scomber scombrus, shown in previous work to be an effective bait locally (Macdonald and Mair, 2017), which was inserted into a detachable bait bag located in the central chamber.
The weight of each unmodified trap was 5 kg in air and 3 kg in water. The traps were rigged in both seabed and floating configurations (Figure 4) in five strings of four traps each. Floating traps were fitted with five 6” (152 mm) seine net fishing floats which were tied to the corners and center of the upper side of the frame. Each floating trap was connected also to a 18 kg steel chain link by sufficient rope so that the bottom of the trap could float a maximum of 1 m from the seabed. Seabed traps were fitted with 15 kg of chain which was tied evenly along the outside edges of the lower side of the frame. Each trap was fitted with numbered identification tags and spaced equally along a 50 m main line in an alternating pattern of seabed and floating traps. The main line was attached at each end to a 20 kg steel chain link and a buoy rope for recovery. To minimize drag from tidal currents on the buoy ropes, relatively thin (8mm) but high strength “polysteel” leaded rope was used. To further reduce drag, buoy rope lengths were minimized and a 40 m length was set as this was approximately the maximum depth considered likely to be required during inspection of charts for the study areas.
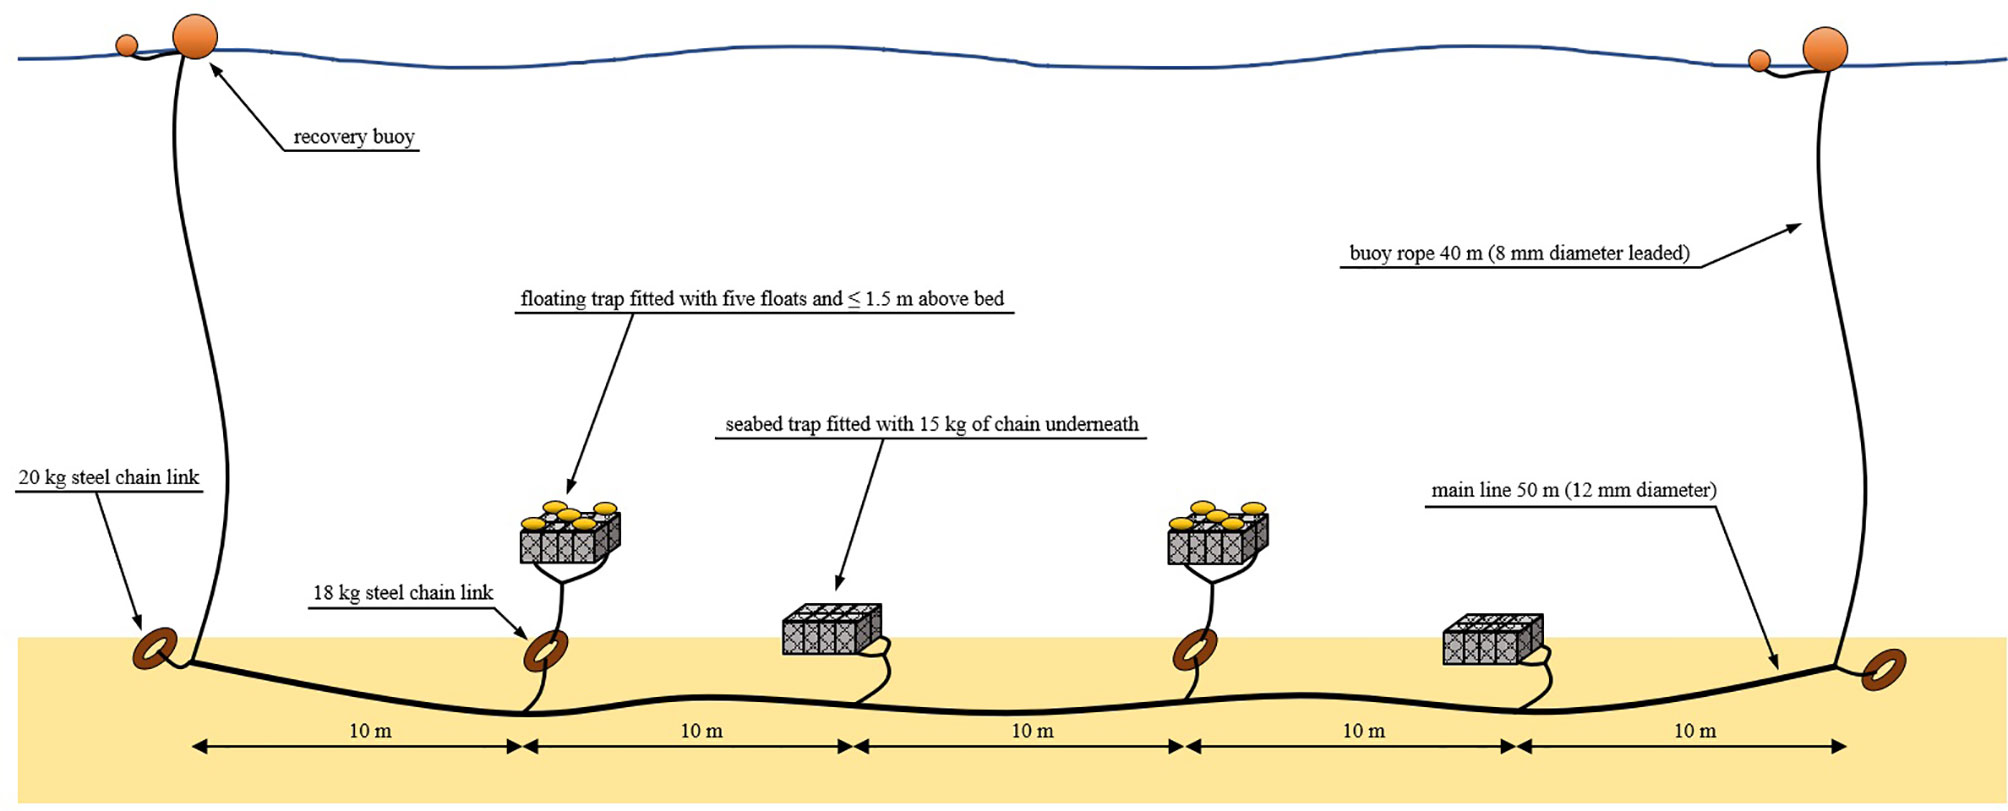
Figure 4 Gear configuration schematic showing rigging of a string of fish traps as deployed during this study.
2.3.2 Trap Deployment and Recovery
Fish trap deployment and recovery was during spring tidal conditions between 12th – 16th April 2021 aboard the MFV Atlantia II (LK 502), a 12m in length, 131kW (172 HP) main engine vessel fitted for this work with a hydraulic creel hauler. The gear was successfully deployed and recovered during the short operational time windows available during slack conditions. Hauling (i.e., recovering) the traps particularly required accurate timing as in some locations the recovery buoys were only visible at the surface during slack conditions and as flow speeds increased the strain on the gear also increased. Similarly, it was easier to accurately shoot (i.e., deploy) the traps during slack but we were also able to deploy the gear during strong flows when required. Although slack conditions were favored, on one occasion the gear was deployed in strong flows (6 knots, 3.1 m/s). However, it was noted that when shooting the traps in tidal flows the trap spacing was most consistent when maneuvering the vessel with the tide, as when shooting the gear against the tide the traps tended to bunch together. A string of traps was shot in as little as one minute and recovered the following day in as little as three minutes. As each individual trap was deployed the shot time (defined as when the trap hit the water) was recorded along with GPS location and depth (as indicated by onboard echosounder). In all cases the gear was “soaked” (i.e., deployed in the site) overnight. During recovery the haul time of each individual trap was also recorded so that soak time could be calculated. There were no losses of gear.
The deployment and recovery of fish traps followed the initial vantage point surveys at all sites (Figure 3). Locations for trap deployments were then selected to target locations of foraging activity observed between the 2nd and 15th April and to also provide coverage over a range of depths and hydrodynamic conditions. The first trap deployments were at the Sound of Papa, which was the least tidal of the selected sites and so offered a suitable starting point. Five strings were deployed on the 12th of April at the Sound of Papa and recovered on the 13th of April with soak times ranging from 21.6 to 22.2 h (mean 22.0 h) and deployment depths ranging from 9.1 m to 28.3 m (mean 18.7 m). Next, the vessel was relocated to Yell Sound where three strings were deployed on the 13th of April and recovered on the 14th of April with soak times ranging from 16.4 to 16.7 h (mean 16.6 h) and deployment depths ranging from 7.3 m to 21.2 m (mean 14.9 m). Following this, the vessel was relocated to Bluemull Sound and five strings were deployed on the 15th of April in northern areas of the channel and a further three strings on the 16th of April in southern areas of the channel. In both cases, all strings were recovered the following day at Bluemull Sound with soak times ranging from 15.9 h to 20.3 h (mean 18.3 h) and deployment depths ranging from 8.0 m to 32.9 m (mean 21.4 m).
2.3.3 Catch Data Recording and Analysis
During the gear recovery, the catches from each trap were extracted, placed into separate numbered sample buckets corresponding to the trap identification tags, and then were sorted by species (or to family in the case of brittle stars Ophiotrichidae). For all species the total number from each trap was recorded. For fish species, the total weight and individual lengths (rounded down to the nearest 5 mm) from each trap were also recorded. Further, reference photographs of the catches were also taken at sea. To investigate differences that the floating versus seabed trap configuration made to catch composition, the overall proportion per species caught in each type was calculated (Pfloat and Pbed respectively). For fish, length distribution data were also considered per species in terms of minimum (Lmin), mean (Lmean), and maximum (Lmax). Interpretation of age class for commercially significant fish species (e.g., cod) follows reference to preliminary age-length data from the Shetland area of the North Sea International Bottom Trawl Survey (IBTS) for the first quarter of 2021 available from the ICES Database of Trawl Surveys (DATRAS: http://datras.ices.dk).
3 Results
3.1 Seabird Behavior
In total, 17.75 h were spent across seven sessions and three vantage points in Bluemull Sound (1.67 – 4.00 h), 7.75 h across three sessions and one vantage point at the Sound of Papa (1.5 – 3.25 h, and 12 h across four sessions and one vantage point at Yell Sound (2.00 – 4.00 h). Observations of seabird behavior coincided with trap-deployments in one session at Bluemull Sound (4.00 h), one session at Yell Sound (3.00 h) and two sessions at Sound of Papa (6.25 h). 126 tracks were collected at Bluemull Sound, 27 tracks at the Sound of Papa, and 45 tracks at Yell Sound. Following manual inspection of videos, 55% (n=69), 74% (n=20) and 82% (n=37) of tracks were retained for analyses at Bluemull Sound, the Sound of Papa and Yell Sound, respectively. The most common reason for omission of tracks at Bluemull Sound was animals flying off before diving (25% of videos collected) or being lost after their initial dive (14%). At the Sound of Papa animals being lost was the primary reason (19%) whereas animals flying off (4%) or being lost were the main contributors (7%) at Yell Sound. Despite the target of 10 min, analyzed tracks had a mean of 5.46 ± 3.46 min (0.08 to 11 min). Mean length of tracks were similar at Bluemull Sound (5.23 ± 3.28 min), the Sound of Papa (5.47 ± 3.32 min) and Yell Sound (5.88 ± 3.90 min). Tracks were finished early because animals either flew-off after diving or were lost during a dive.
Particularly for risk assessment, it is important that dive metrics are an accurate representation of foraging behavior in the site, and that values are not biased by the observation method. Comparisons of dive metrics against track duration in Figure 5 showed large variance in % time underwater and dives per minute in shorter tracks. This is to be expected; for example, tracks of short duration may have captured animals just before a dive commenced, and the animal may have flown-off immediately after this dive finished. There was also larger variance in the R at lower track durations, presumably because fewer dives were performed, and reliable means cannot be obtained. Further inspection of Figure 5 suggests that variance in values tended to stabilize in tracks > 6 min long. To ensure that the observation method exerted no bias on dive metrics, analyses focused on tracks > 6 min long. This left 17% (n=22), 30% (n=8) and 40% (n=18) of tracks from Bluemull Sound, the Sound of Papa, and Yell Sound in analysis, respectively.
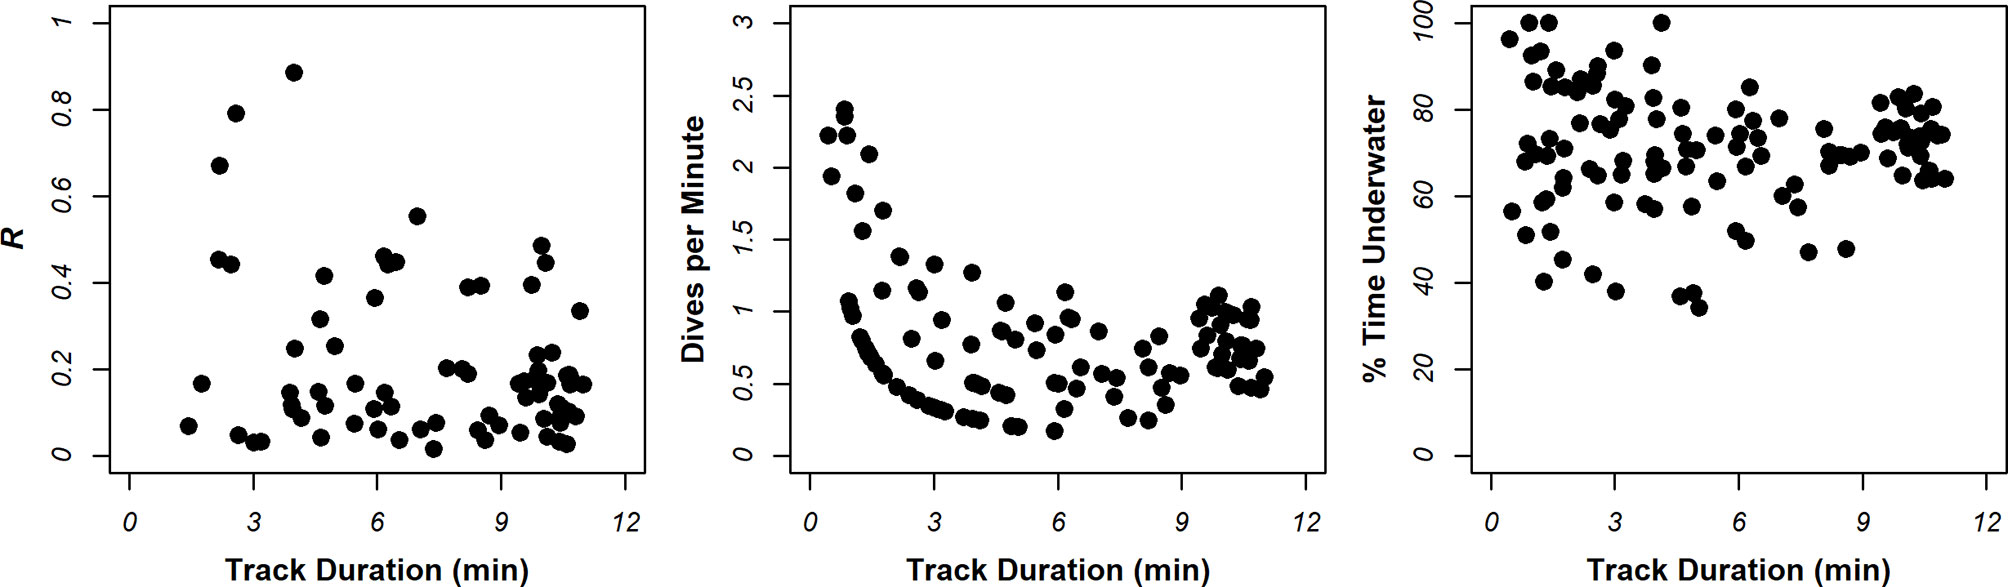
Figure 5 Summary of relationships between dive metrics characterizing foraging intensity and track duration.
The locations of dives in analyzed tracks is shown in Figure 6, whilst summaries of dive metrics are shown in Figure 7. On average, animals dived for 64.80 ± 16.64 s, spent between 70.85 ± 8.49% time underwater, performed around 0.71 ± 0.23 dives per minute, and were consistent in their dive duration (CV = 0.19 ± 0.17). However, inspection of dive metrics in Figure 7 indicates notable differences in behavior amongst locations. Longer mean dives were recorded in Bluemull Sound (73.45 ± 19.26 s) than the Sound of Papa (56.45 ± 9.29 s) or Yell Sound (57.94 ± 9.59 s); mean % time underwater and dives per minute were lower in Bluemull Sound (65.95 ± 8.8%, 0.58 + 0.24 dives), than the Sound of Papa (78.48 ± 3.78%, 0.92 ± 0.12 dives) or Yell Sound (73.45 ± 5.67%, 0.77 ± 0.18 dives). In combination, dive metrics suggest that animals performed infrequent and long dives at Bluemull Sound, moderately frequent and short dives at Yell Sound, and frequent and short dives at the Sound of Papa. The mean average consistency of dive duration was highest at Yell Sound (R = 0.14 ± 0.10), moderate at Bluemull Sound (0.19 ± 0.15) and lowest at the Sound of Papa (0.26 ± 0.18).
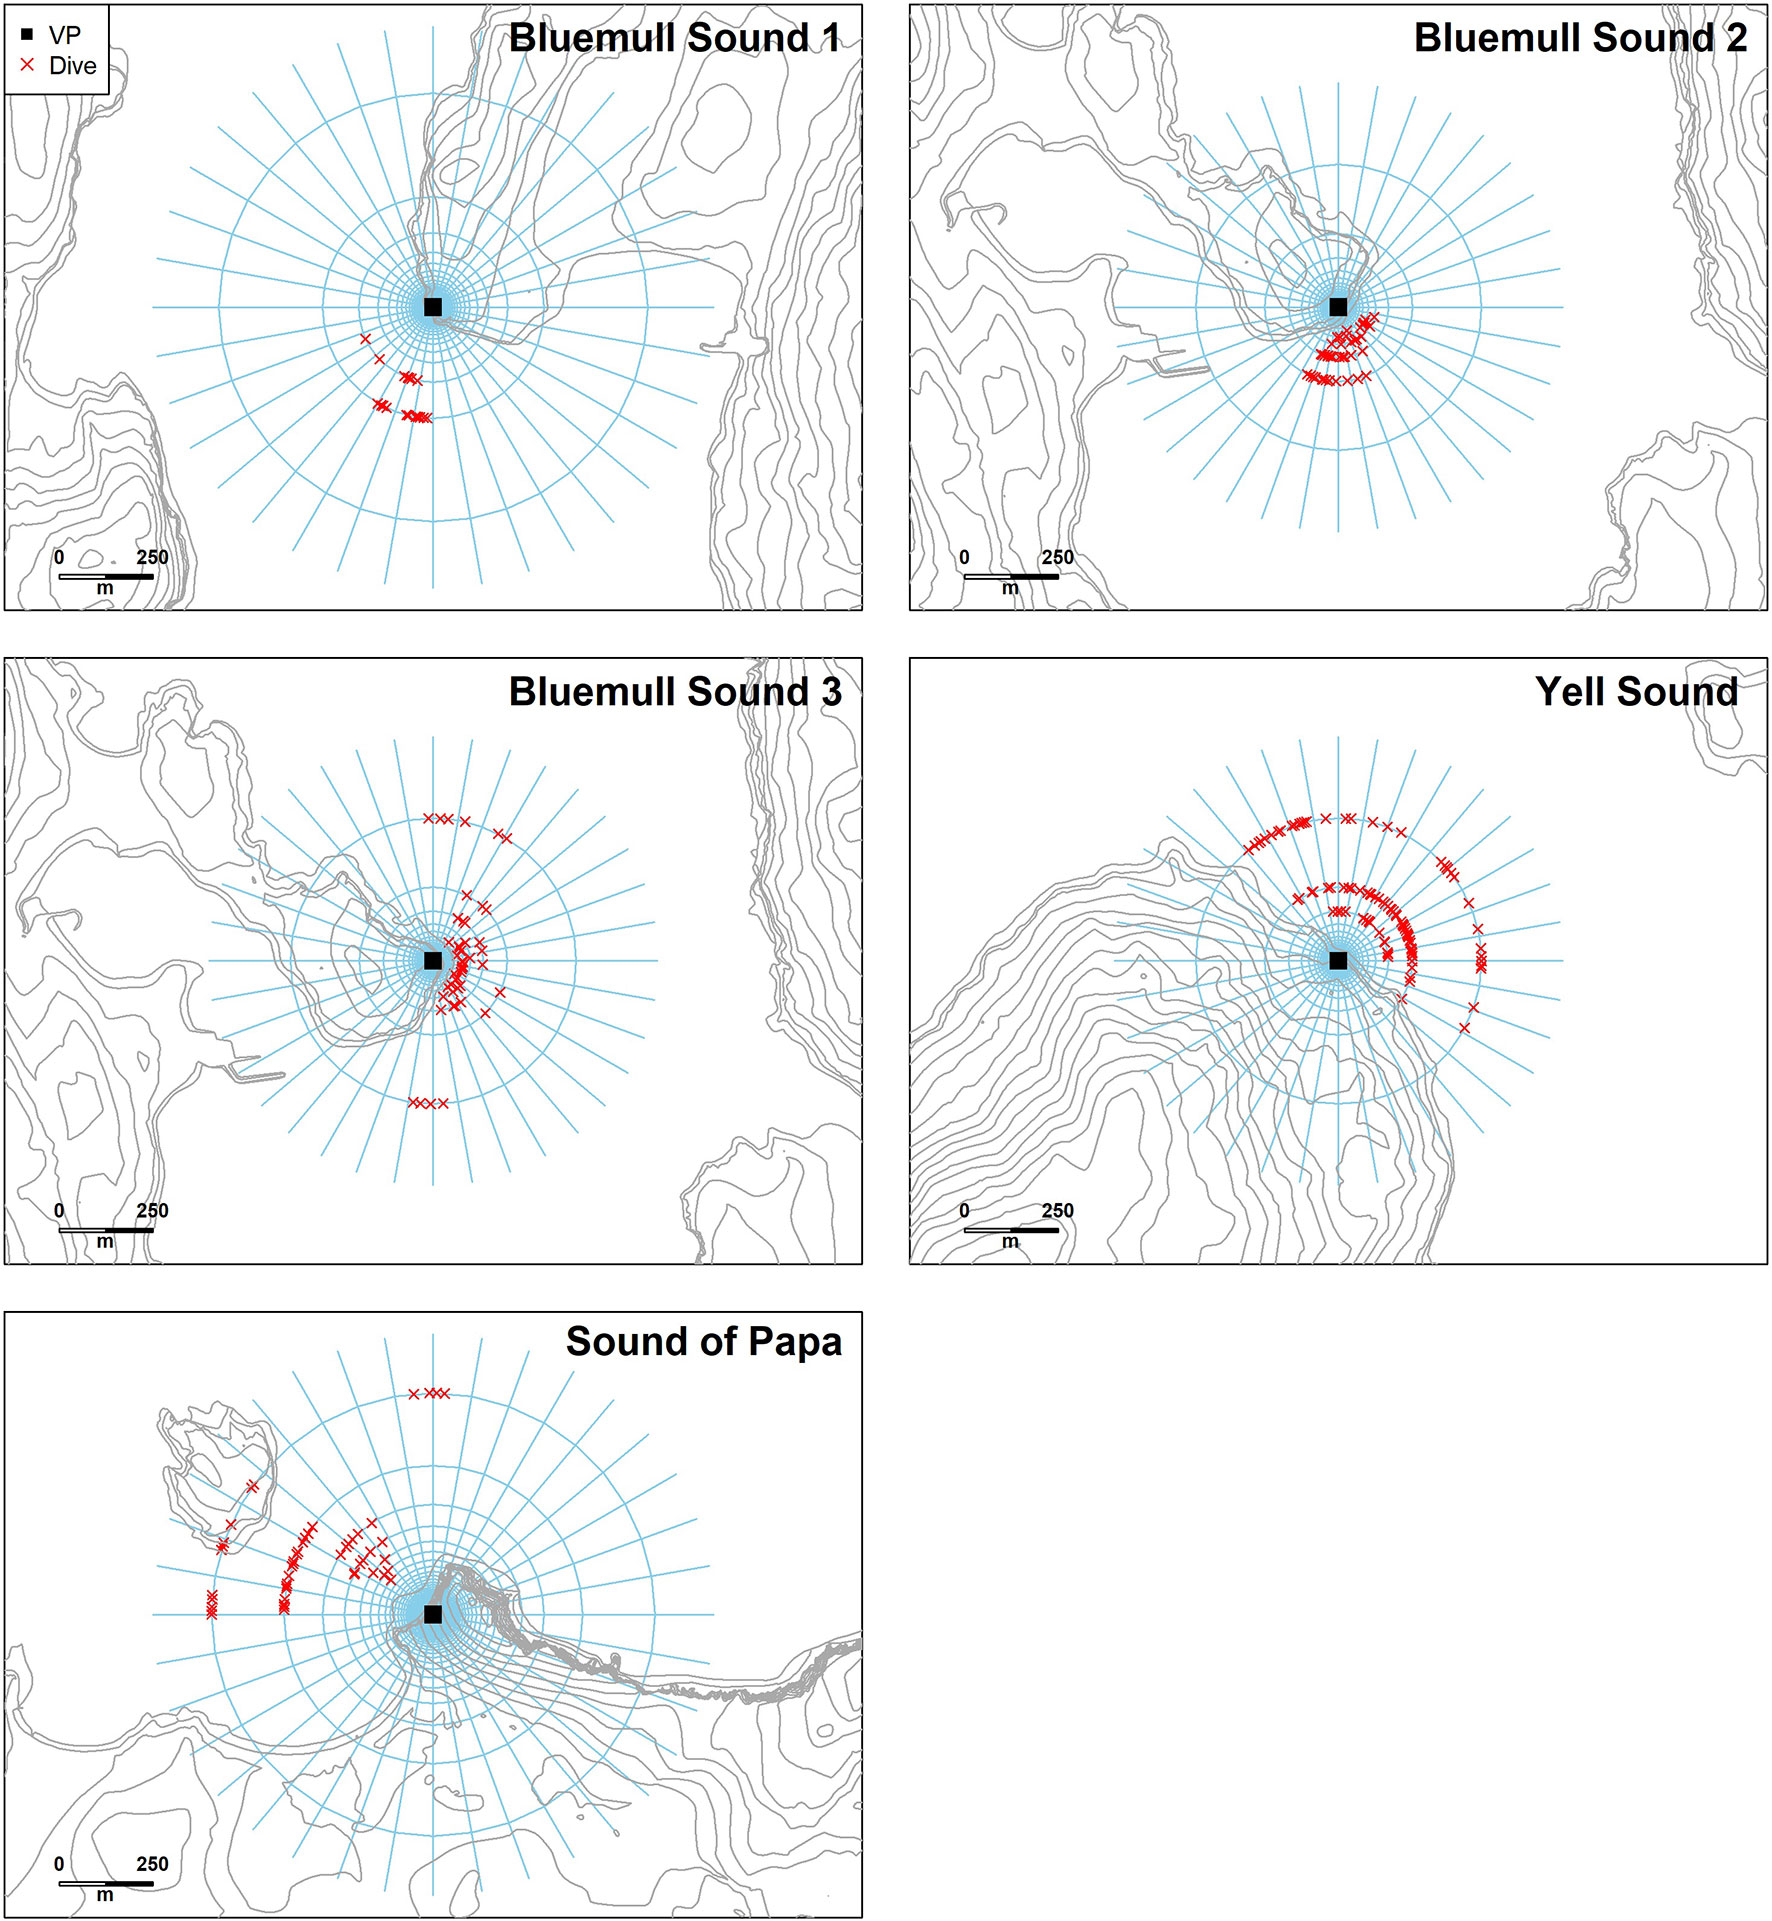
Figure 6 The estimated location of dives used in analysis at each vantage point. The differences in maximum ranges between sites were partially due to differences in the altitude of the vantage point and partly indicative of the area of interest. The presence of animals on land at the Sound of Papa is a consequence of the resolution of the estimated distances at this range, and these animals were present on the water surface to the southeast of the island.
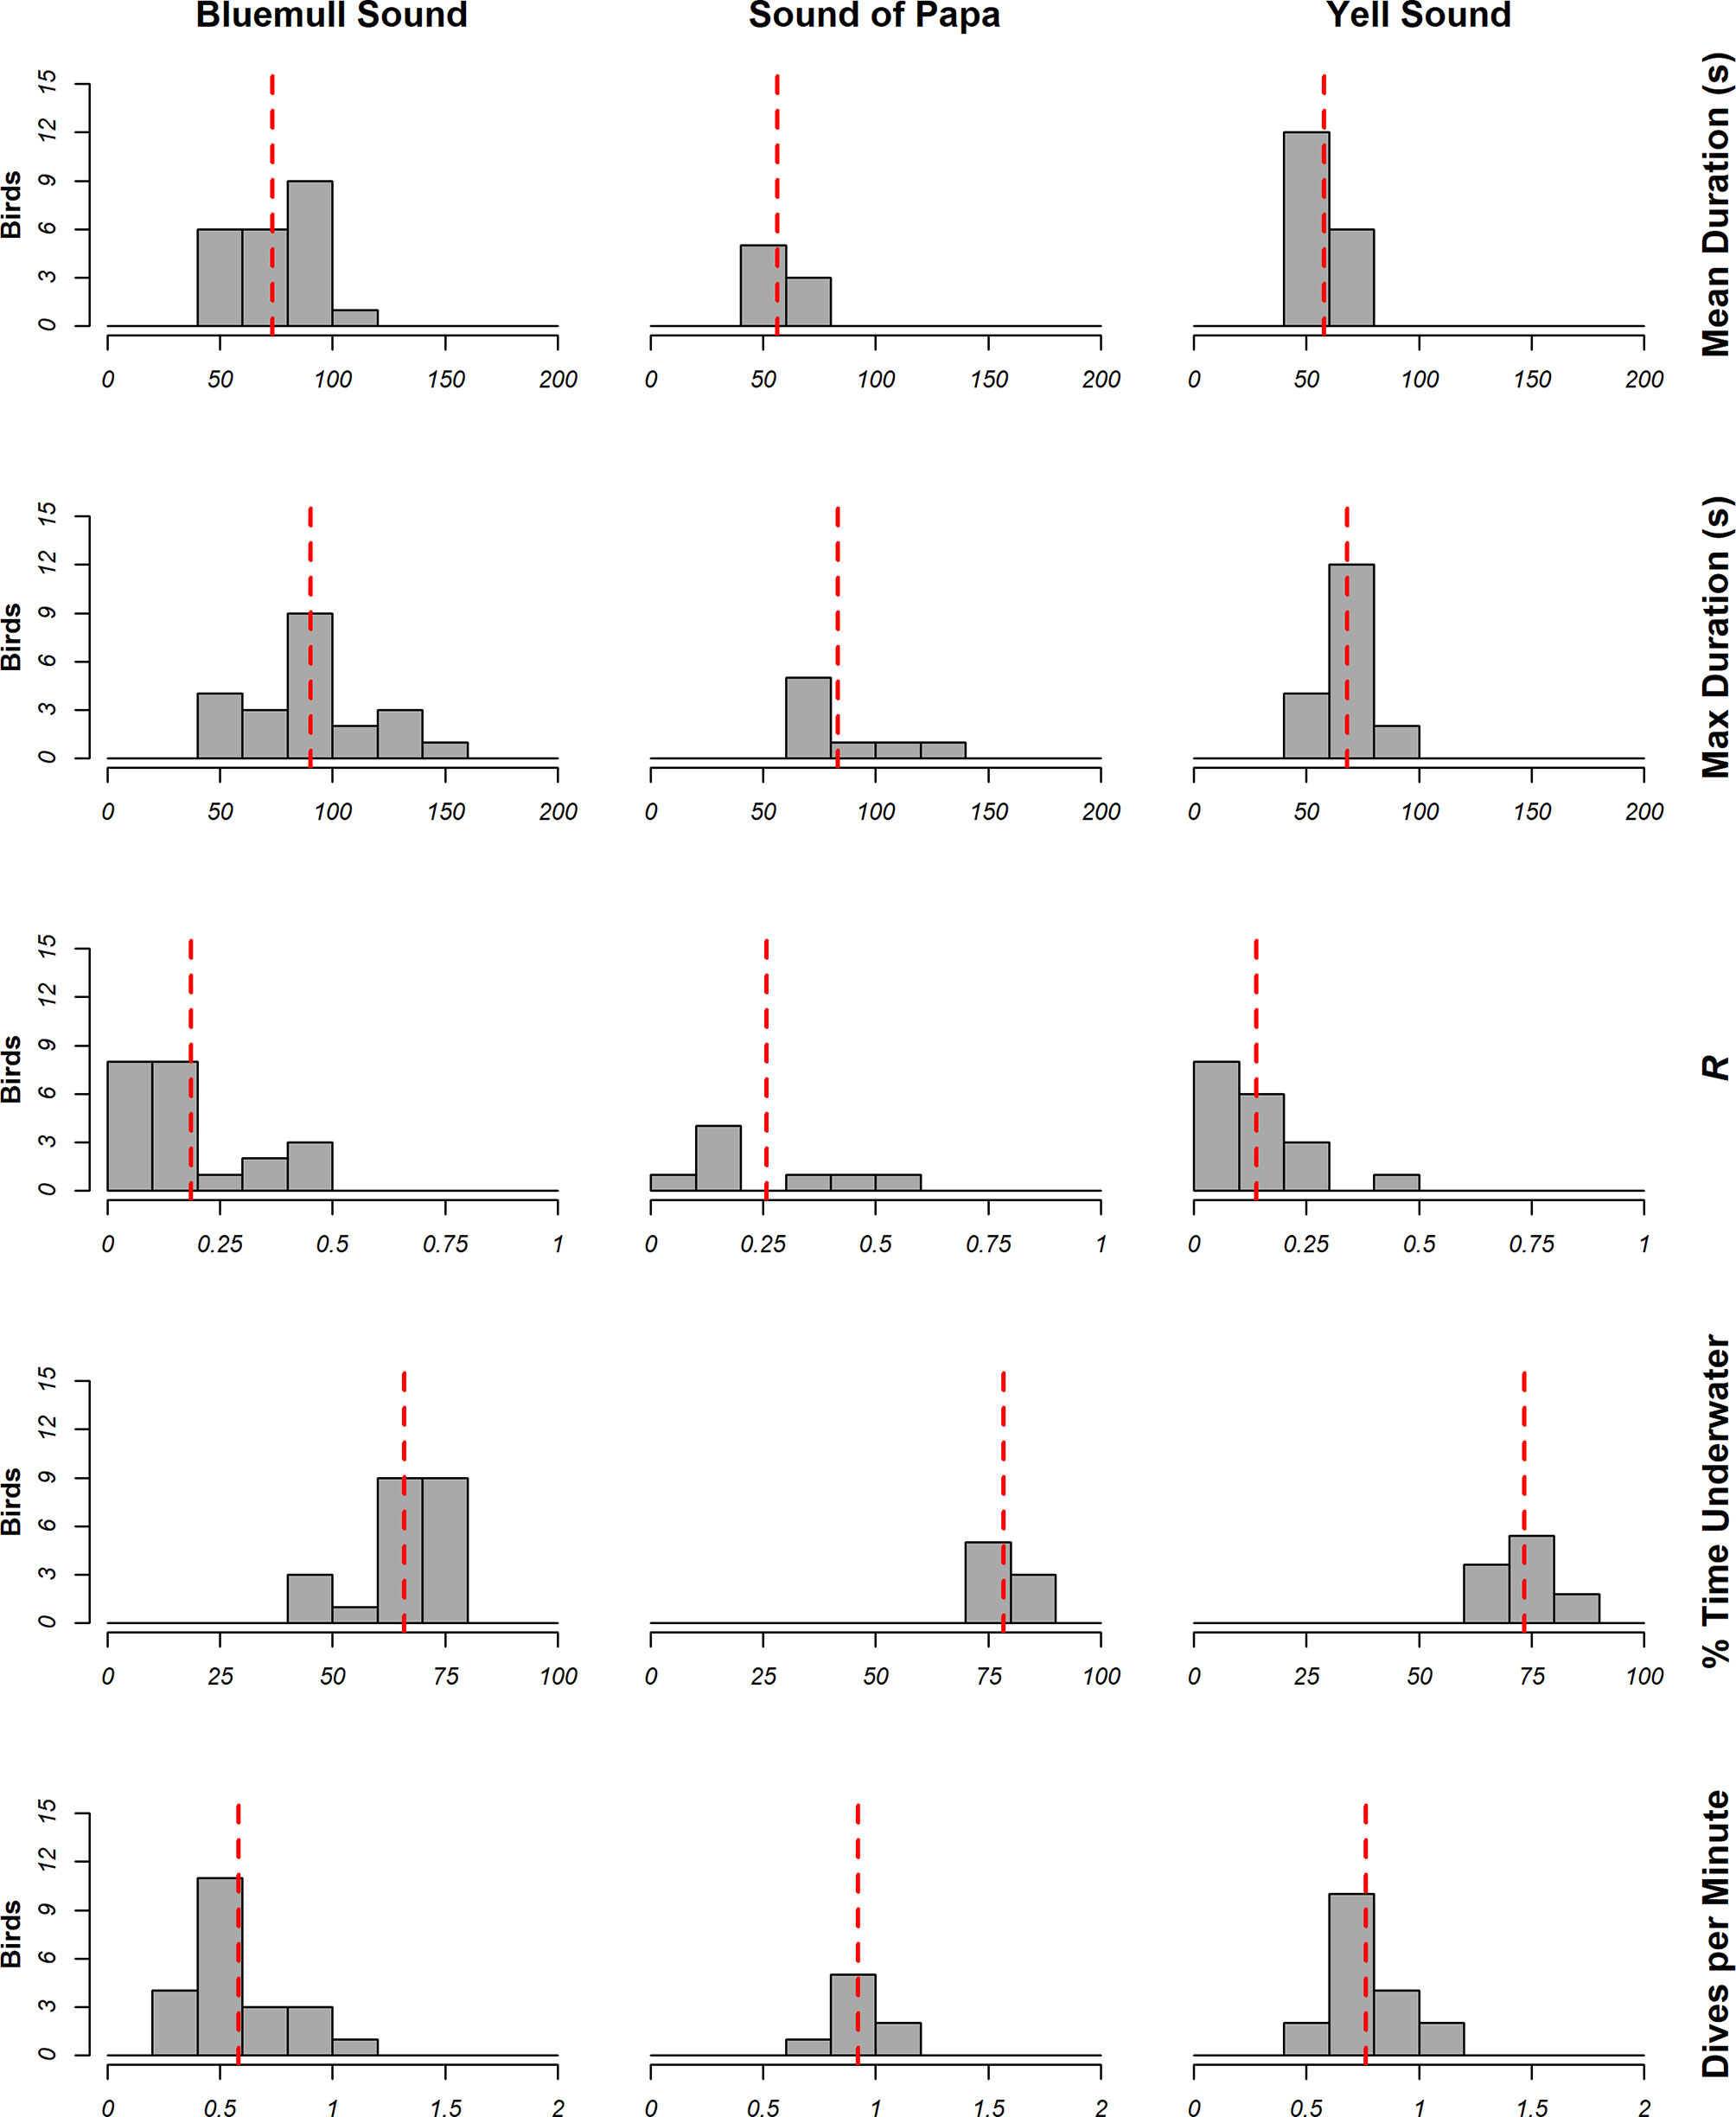
Figure 7 Summary of dive metrics calculated from measurements of animal behavior at Bluemull Sound (n=22), Sound of Papa (n=8) and Yell Sound (n=18). The red line illustrates the mean measurement at the study site.
3.2 Prey Assemblages
The emphasis here is on catches of fish species, however other catches are also reported for completeness. A total of 16 strings comprising 64 fish traps were deployed and recovered during the trial. A total of 259 specimens were retained in the fish traps (Table 1), of which: 151 were from the Sound of Papa; 19 were from Yell Sound; and 89 from Bluemull Sound.
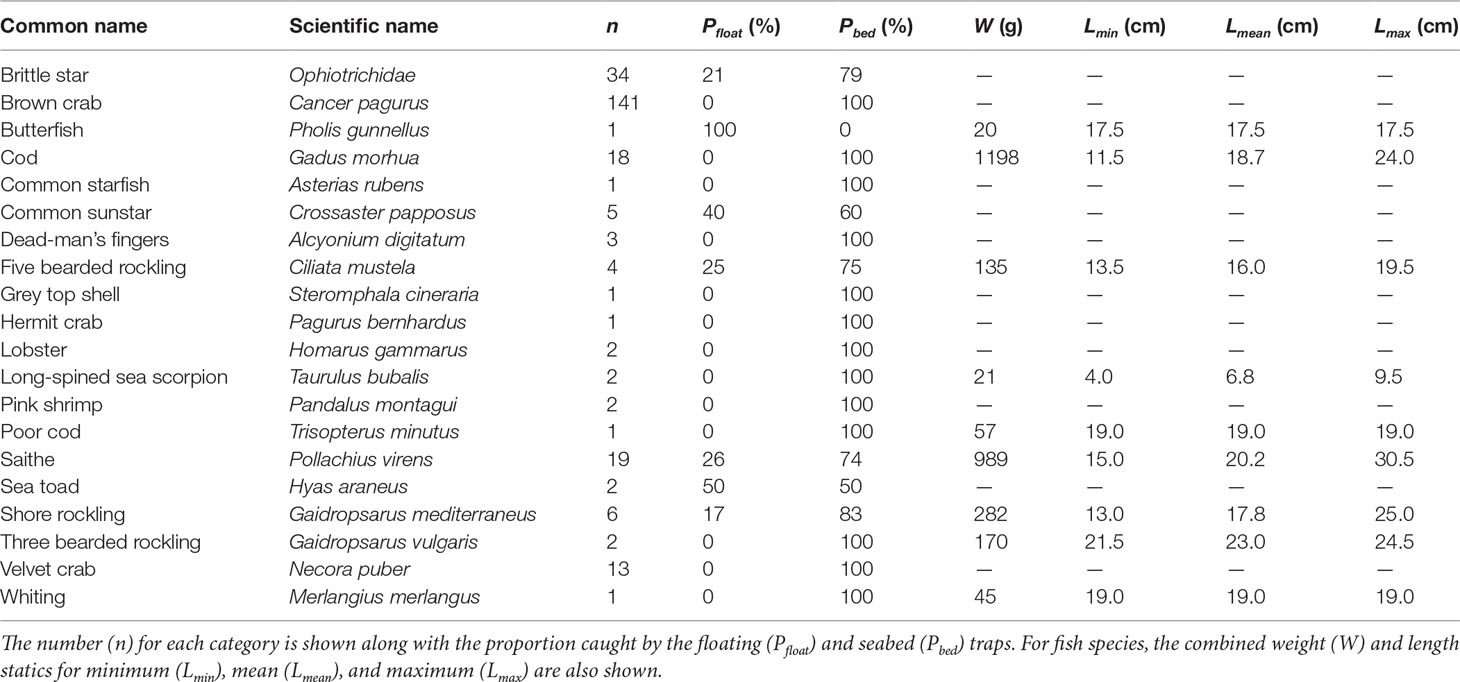
Table 1 Overall fish traps catches across Bluemull Sound (32 traps deployed), Yell Sound (12 traps deployed), and the Sound of Papa (20 traps deployed).
Across the three sites, 54 fish composed of nine species were captured and sampled. Three saithe Pollachius virens were noted to have been damaged by predation, all in the Sound of Papa, and most likely by brown crabs Cancer pagurus caught in high abundances in that area. Fish catches in Yell Sound were composed of cod Gadus morhua and five bearded rockling Ciliata mustela; fish catches in the Sound of Papa were composed of cod, five bearded rockling, shore rockling Gaidropsarus mediterraneus, poor cod Trisopterus minutus, and saithe; while fish catches at Bluemull Sound were composed of cod, five bearded rockling, shore rockling, saithe, long-spined sea scorpion Taurulus bubalis, butterfish Pholis gunnellus, and whiting Merlangius merlangus. The largest component of overall fish catches by weight was cod (41%) followed by saithe (33%). Saithe were caught in the greatest overall abundance and the largest specimen observed was a saithe caught in Bluemull Sound measuring 30.5 cm and weighing 145 g. The smallest fish caught was a long-spined sea scorpion measuring 4 cm. The length ranges observed for the commercial fish species (cod, saithe, whiting) most likely corresponds to age-1 individuals in all cases.
Invertebrate catches included various species of crustacean (brown crab, hermit crab Pagurus bernhardus, lobster Homarus gammarus, pink shrimp Pandalus montagui, sea toad Hyas araneus, and velvet crab Necora puber), several examples of echinoderms (brittle stars Ophiotrichidae, common starfish Asterias rubens, and common sunstar Crossaster papposus), a marine gastropod (grey top shell Steromphala cineraria), and the soft coral (dead-man’s fingers Alcyonium digitatum). Brown crab and brittle stars were caught in relatively high abundances, although these high catches were constrained mostly to the Sound of Papa for brown crab and entirely to Bluemull Sound for brittle stars.
Comparison of the proportion of catches in floating traps versus seabed traps (Table 1) shows that the majority of catches were from the seabed traps. Even among demersal fish species, the proportion of catches in the seabed traps were higher than in the floating traps. In the case of cod, 100% of catches were from the seabed traps and no cod were caught in floating traps. The most frequent catch in the floating traps was saithe, but still this only accounted for 26% of total saithe catches. As intended, 100% of commercial crustacean catches (brown crab, lobster, velvet crab) were caught in the seabed traps. There are occasional examples of other incidental catches in the floating traps, for example some common sunstar and brittle star.
4 Discussion
In this paper we have described the development of a fish trap and shored-based observation approach designed to collect relevant data in tidal channel environments to support environmental impact assessment. The practical application of this approach has been demonstrated by the successful trial across three dynamic tidal sites in Shetland, including in the vicinity of an active array of tidal stream turbines in Bluemull Sound. Although the two methods involved have separate considerations and applications of their own, their combined use may provide much needed additional ecological insights. Therefore, the two methods are discussed separately below first, followed by further discussion of their combined use.
4.1 Shore-Based Observations
A key component of risk assessment in MRE development sites is assessing the likelihood that benthic foraging seabirds interact with submerged installations (Waggitt and Scott, 2014). This study aimed to provide useful measurements using inexpensive and practical approaches (e.g., Wanless and Harris, 1991; Lea et al., 1996; Sponza et al., 2010) rather than the expensive and challenging approaches which have become commonplace yet rarely provide this information. With minimum expense and operations, this study produced dive metrics that could parameterize collision risk models for a specific installation site (Scottish Natural Heritage, 2016), removing the need for potentially unreliable extrapolation from other sites. In fact, the dive metrics in this study differed between sites, despite their geographical similarities, further highlighting caveats with applying information from one location to another (Waggitt et al., 2017). Whilst this study provided this information using rangefinder binoculars, fundamentally similar approaches including theodolites (Ronconi and Clair, 2002) and ornithodolites (Cole et al., 2019) could provide comparable information where applicable and/or available. Therefore, the general approaches described here allow the collection of animal behavior and position at a specific installation site without excessive cost or groundwork, enabling an economical and robust risk assessment to be made.
This study continued the development of approaches outlined in Heal et al. (2021) which aim to facilitate collection of dive metrics across a diverse range of locations and scenarios by removing constraints of expensive and/or cumbersome equipment. Without needing to record bearings and distances on paper, and being tripod-mounted rather than hand-held, animals could be followed easier during observations. The addition of a camcorder provided an invaluable record of observations for data validation, enabling event timings and species identification to be checked, and errors to be corrected or omitted post-observation. By providing a permanent record of observations, the camcorder also opens the way for additional analyses beyond the scope of this paper, including classification of prey captured and brought to the surface by animals, identification of hydrodynamic conditions during foraging bouts, and interactions between animals with above-surface human activities or structures. Using a logger rather than reticles to measure distance eliminated the need for the horizon to be visible and/or referred to. However, the resolution of the logger used (approximately 1.4°) limited the observational range and the accuracy of positions, whereas the need to transcribe and correct bearings makes them suspectable to error. Therefore, whilst broad-scale positions are always provided, fine-scale positions were not provided beyond the near-field range (<200m). It also prevented reasonable calculations of foraging area, which Heal et al. (2021) were able to provide. It is suggested that future modifications include loggers that provide higher resolution tilt and bearing measurements, improving the resolution of dive locations and range of dive metrics.
4.2 Fish Trap Catches
This study has shown that the baited trap method trialed can be an effective tool for sampling benthic and demersal species in strong tidal flows. The emphasis here is on fish species, since these are most relevant to MRE consenting as fish may directly interact with moving turbine components and are the preferred prey of many other key receptors. However, various crustaceans and echinoderms were also observed and are relevant to providing an inventory of potential prey assemblages. This initial trial presents a snapshot across specific areas in three sites and there is likely to be strong seasonal trends and significant habitat preferences among the species sampled here (Kruuk et al., 1988). By recovering samples alive and in good condition, this approach could provide opportunities for tagging or capture-mark-recapture studies in such areas that may provide further insights into the movement and population structure of prey species. The gear involved in this study is cheap, easily transportable, and could be operated cost-effectively from small vessels with one or two crew. In comparison to other potential sampling gears, baited traps have very low environmental impact (Chladek et al., 2021) which support the repeated use of such a method to assess trends in biodiversity and relative abundance. Repeated deployments could be a benefit for example in ecological monitoring through MRE device commissioning.
The most abundant fish species observed in this trial was saithe, which supports interpretation of data from Bluemull Sound which found that saith were the mobile species most frequently observed in the optical cameras fixed to the Shetland Tidal Array turbines (Smith, 2021). Saithe are also known to be a dominant component of shag diet in similar habitats, along with other gadoid species such as cod and poor cod also observed here, as interpreted from remains in regurgitated pellets (Hillersøy and Lorentsen, 2012). An advantage of the approach here is that direct biological analysis of the living specimens is possible, and here we found that length ranges observed for saithe, cod, and whiting were most likely to correspond to age-1 groups. Thus, for commercial gadoid species the results indicate that the coastal environments studied here may also provide habitats for juveniles, as has been observed in other nearshore areas in Shetland (Fraser et al., 2021). Further, direct inspection of fish specimens enables the differentiation of similar looking species which would be very difficult or impossible to identify from camera images or diet samples, for example some of the rockling species identified here were classified as unidentified bearded rockling in Hillersøy and Lorentsen (2012).
Traps were trialed in both seabed and floating configurations. Floating traps have been shown to eliminate crustacean bycatch when targeting fish (Furevik et al., 2008), and our results indicate that even in the highly tidal conditions studied here the floating traps indeed have greatly reduced non-fish catches. However, catches of fish were also less in the floating traps compared to the seabed traps, notably all catches of the demersal species cod were in the seabed traps which contrasts with previous studies (e.g., Furevik et al., 2008). Camera observations at the Shetland Tidal Array turbines showed that saithe were frequently observed milling at hub height (approximately 9 m from seabed) during periods of slack or low flow and that as tidal flow increased saithe were seen to move towards the seabed (Smith, 2021). Consequently, fish in these tidal sites may spend much of their time refuging very close to the seabed which could explain why even for saithe our results showed higher catches in the seabed traps.
Other characteristic of the traps may also be important in the efficiency, selectivity, and practicality of the gear. For example, previous work has shown the larger traps with more entrances resulted in greater catches (Furevik and Løkkeborg, 1994). Fish behavior around traps may also be affected by catch levels and saturation effects (Hedgärde et al., 2016) and so the two-parlor design used here was deemed to be the best compromise between trap volume and workability. A collapsible trap design would allow for higher numbers of traps to be stored on a small vessel; however, collapsible traps have been found to be less durable (Macdonald and Mair, 2017) and the efficiency of collapsible design have shown to be strongly affected by currents (Furevik and Løkkeborg, 1994). The orientation of trap entrances relative to current direction is also thought to be an important factor in catch efficiency (Furevik et al., 2008) and the traps used here featured two entrances on opposite sides of the traps to compensate for any effects relating to trap orientation in the flood-ebb cycle.
One of the challenges found in this study was the requirement to work within different slack times which varied across the sites. The practical difficulties of deploying and recovering gear is obvious to those familiar with such sites and requires efficient procedures and specific practical skills. There is also the potential for spatial conflict with other users, such as the fishing industry, who may also have static gear deployed nearby. Early communication with other local marine users ensured that there were no such difficulties encountered. In fact, survey planning benefitted greatly from the knowledge and input of creel fishermen working regularly in these sites. Another limiting factor was weather which limits the opportunity to deploy and recover gear with a small vessel. Deploying strings of traps very close to existing infrastructure or right in the middle of navigational channels presents an obvious risk of entanglement with the buoy ropes which could be mitigated by using an acoustic release system.
4.3 Physics-Predator-Prey Interaction
Recent work has shown the importance of prey distribution in driving habitat use by marine predators and the potential for information on the relative abundance and diversity of fish to improve model performance (Bennington et al., 2020). However, the great majority of studies investigating seabirds use of tidal stream environments focus entirely on associations between behavior/occupancy and physical conditions, notably hydrodynamic and seabed characteristics (Benjamins et al., 2015; Isaksson et al., 2020), despite the usefulness of understanding physics-prey-predator interactions in risk assessment (Scott et al., 2014). The combination of approaches in this study are a direct attempt to increase the understanding of these interactions in tidal stream environments. Specifically, this study sought to provide a snapshot of prey assemblage composition and benthic foraging seabird behavior at specific locations, providing the baseline information needed to investigate physics-prey-predator interactions further.
Saithe and cod were the most abundant fish species observed here which is noteworthy given that these species have been shown to be the primary components of shag and cormorant diet in similar habitats (Barrett et al., 1990; Lorentsen et al., 2004; Hillersøy and Lorentsen, 2012). The camera observations around the tidal turbines at Bluemull Sound also noted interactions between shag and saithe, with instances of saithe being actively pursued by shags causing a switch from shoaling to schooling behavior (Smith, 2021). The fish species observed in less abundance here, such as the rocklings, sea scorpion, and butterfish, have all also been previously identified as secondary components of shag and cormorant diet (Lilliendahl and Solmundsson, 2006; Hillersøy and Lorentsen, 2012). The data here could be used to ground truth dietary analyses, for example from regurgitated pellets at daytime roosts alongside feeding areas, to provide biological information on the prey and confirming relationships between fish and seabirds. Prey lengths estimated from cormorant and shag regurgitated otoliths demonstrate overlap with the prey data here and show high variability between sites and years (e.g., Barrett et al., 1990). Beyond seabirds, the fish species sampled here are also known to be important prey for other local marine predators, such as five bearded rockling in the case of otters Lutra lutra (Kruuk et al., 1991).
An obvious omission amongst prey considered to be important in the diet of European shag are sandeel (Ammodytes spp.). In fact, sandeel are almost the sole contributors to European shag diet in some scenarios (e.g. Velando and Freire, 1999; Lilliendahl and Solmundsson, 2006; Howells et al., 2017). It seems unlikely that sandeel formed a major component of the diet in the sites reported here, as animals exploiting sandeel usually do so in large and cohesive groups (Velando and Munilla, 2011; Watanuki et al., 2008) which were absent at Bluemull Sound, the Sound of Papa and Yell Sound. Therefore, scenarios where sandeel are almost exclusively taken may be recognizable without the need for sampling the prey community, suggesting that the approaches outlined here should target scenarios lacking these groups.
4.4 Applications
The development of the MRE industry requires pragmatic environmental survey approaches that can provide relevant site-specific information to reduce uncertainty in risk assessment. The approach here has shown that it is possible to provide such data using inexpensive and practical equipment. The functionality and survivability of this equipment has been demonstrated in several dynamic tidal channel environments including one site currently under commercial TSE development.
Narrow tidal channels targeted for TSE projects often have convenient vantage points which lends them to a shore-based observation approach. However, it is acknowledged that application to offshore site (i.e., > 1 km from shore) would require some other stable observation platform and that further modifications are needed to improve the resolution of distance measurements. Discrimination of European shag and great cormorant is possible from the video footage collected here, and identification of fine-resolution physical conditions is possible from dive positions and video footage. We have presented general summaries of behavior to illustrate the performance of the method and future analyses will investigate interspecific and intraspecific differences in diving behavior further.
The prey data collected here are also relevant to the interpretation of other data types collected in MRE monitoring programs. For example, interpretations of acoustic data on fish distributions is extremely limited without reliable independent information on species identity, and previously studies have highlighted for the need for ground-truthing (Fraser et al., 2018; Viehman et al., 2018). Furthermore, the baited trap method here provides data on species that associate closely with the seabed and are thus very difficult to observe by other means. Future analysis of these data will consider the results in more detail including links with predator behavior and further analysis of spatial trends in prey assemblage composition.
The combined use of these methods allows for an efficient and proportional ecological assessment of a site by first using shore-based observations to identify patterns in foraging activity which can then inform the targeted deployment of fish traps to provide complementary data on associated prey assemblages. Overall, this trial demonstrates that this approach could be considered as part of the “toolbox” of methods currently under development to reduce the uncertainties and costs associated with the permitting process of MRE projects.
Data Availability Statement
The raw data supporting the conclusions of this article will be made available by the authors, without undue reservation.
Ethics Statement
Ethical review and approval was not required for the animal study because of the passive methods used.
Author Contributions
Both authors devised the project and developed the methodologies. Both authors undertook data collection, analysis, and interpretation. The manuscript was initially conceived, first drafted, and finally edited by SF. Both authors contributed to the writing of the manuscript and gave final approval for publication.
Funding
This project was funded by the Engineering and Physical Sciences Research Council (EPSRC) via the Supergen ORE Hub ECR Research Fund Award.
Conflict of Interest
The authors declare that the research was conducted in the absence of any commercial or financial relationships that could be construed as a potential conflict of interest.
Publisher’s Note
All claims expressed in this article are solely those of the authors and do not necessarily represent those of their affiliated organizations, or those of the publisher, the editors and the reviewers. Any product that may be evaluated in this article, or claim that may be made by its manufacturer, is not guaranteed or endorsed by the publisher.
Acknowledgments
We would like to thank: Kenneth Pottinger (skipper) and Davie Riley (crew) for work aboard the Atlantia II; Kirsty Laurenson and Katie Brigden for contributions to fieldwork; Joseph Fraser and Donald Jefferies for fabrication support; Rob Evans for constructing the mounting unit; and Brandon Craven and Gemma Veneruso for early development of shore-based observation approaches.
References
Bagdonas K., Humborstad O. B., Løkkeborg S. (2012). Capture of Wild Saithe (Pollachius Virens) and Cod (Gadus Morhua) in the Vicinity of Salmon Farms: Three Pot Types Compared. Fisheries Res. 134, 1–5. doi: 10.1016/j.fishres.2012.06.020
Barrett R. T., Røv N., Loen J., Montevecchi W. A. (1990). Diets of Shags Phalacrocorax Aristotelis and Cormorants P. Carbo in Norway and Possible Implications for Gadoid Stock Recruitment. Mar. Ecol. Prog. Ser., 60, 205–218.
Benjamins S., Dale A. C., Hastie G., Waggitt J. J., Lea M. A., Scott B., et al. (2015). Confusion Reigns? A Review of Marine Megafauna Interactions With Tidal-Stream Environments. Oceanogr. Mar. Biol. 53, 1–54. doi: 10.1201/b18733-2
Benjamins S., Dale A., van Geel N., Wilson B. (2016). Riding the Tide: Use of a Moving Tidal-Stream Habitat by Harbour Porpoises. Mar. Ecol. Prog. Ser. 549, 275–288. doi: 10.3354/meps11677
Bennington S., Rayment W., Dawson S. (2020). Putting Prey Into the Picture: Improvements to Species Distribution Models for Bottlenose Dolphins in Doubtful Sound, New Zealand. Mar. Ecol. Prog. Ser. 653, 191–204. doi: 10.3354/meps13492
Broadhurst M., Barr S., Orme C. D. L. (2014). In-Situ Ecological Interactions With a Deployed Tidal Energy Device; an Observational Pilot Study. Ocean Coast. Manage. 99, 31–38. doi: 10.1016/j.ocecoaman.2014.06.008
Bryden I. G., Bullen C. R., Baine M. S., Paish O. (1995). An Assessment of Tidal Streams as Energy Sources in Orkney and Shetland. Underwater Technology-Journal Soc. Underwater Technol. 21 (2), 21–29. doi: 10.3723/175605495783326649
Chladek J., Stepputtis D., Hermann A., Kratzer I. M., Ljungberg P., Rodriguez-Tress P., et al. (2021). Using an Innovative Net-Pen-Based Observation Method to Assess and Compare Fish Pot-Entrance Catch Efficiency for Atlantic Cod (Gadus Morhua). Fisheries Res. 236, 105851. doi: 10.1016/j.fishres.2020.105851
Coles D., Angeloudis A., Greaves D., Hastie G., Lewis M., Mackie L., et al. (2021). A Review of the UK and British Channel Islands Practical Tidal Stream Energy Resource. Proc. R. Soc. A 477 (2255), 20210469. doi: 10.1098/rspa.2021.0469
Cole E. L., Waggitt J. J., Hedenstrom A., Piano M., Holton M. D., Börger L., et al. (2019). The Ornithodolite as a Tool to Quantify Animal Space Use and Habitat Selection: A Case Study With Birds Diving in Tidal Waters. Integr. zoology 14 (1), 4–16. doi: 10.1111/1749-4877.12327
Copping A. E. (2020). “Marine Renewable Energy: Environmental Effects and Monitoring Strategies,” in OES-Environmental 2020 State of the Science Report: Environmental Effects of Marine Renewable Energy Development Around the World. Report for Ocean Energy Systems (OES). Eds. Copping A. E., Hemery L. G., 18–26. doi: 10.2172/1632880
Copping A. E., Hemery L. G., Overhus D. M., Garavelli L., Freeman M. C., Whiting J. M., et al. (2020). Potential Environmental Effects of Marine Renewable Energy Development—the State of the Science. J. Mar. Sci. Eng. 8 (11), 879. doi:10.3390/jmse8110879
Elliott K. H., Woo K., Gaston A. J., Benvenuti S., Dall’Antonia L., Davoren G. K. (2008). Seabird Foraging Behaviour Indicates Prey Type. Mar. Ecol. Prog. Ser. 354, 289–303. doi: 10.3354/meps07221
Fraser S., Angus C. H., Wood C., McAllister M., Laurenson K. (2021). “Overview of Annual Shetland Inshore Fish Survey (SIFS) Data, (2011 - 2021): Catch Rates and Size Compositions of Commercial Demersal Fish Species,” in Shetland UHI Report, pp 19.
Fraser S., Nikora V., Williamson B. J., Scott B. E. (2017). Automatic Active Acoustic Target Detection in Turbulent Aquatic Environments. Limnol. Oceanogr.: Methods 15 (2), 184–199. doi: 10.1002/lom3.10155
Fraser S., Williamson B. J., Nikora V., Scott B. E. (2018). Fish Distributions in a Tidal Channel Indicate the Behavioural Impact of a Marine Renewable Energy Installation. Energy Rep. 4, 65–69. doi: 10.1016/j.egyr.2018.01.008
Furevik D. M., Humborstad O. B., Jørgensen T., Løkkeborg S. (2008). Floated Fish Pot Eliminates Bycatch of Red King Crab and Maintains Target Catch of Cod. Fisheries Res. 92 (1), 23–27. doi: 10.1016/j.fishres.2007.12.017
Furevik D. M., Løkkeborg S. (1994). Fishing Trials in Norway for Torsk (Brosme Brosme) and Cod (Gadus Morhua) Using Baited Commercial Pots. Fisheries Res. 19 (3-4), 219–229. doi: 10.1016/0165-7836(94)90040-X
Furness R. W., Wade H. M., Robbins A. M. C., Masden E. A. (2012). Assessing the Sensitivity of Seabird Populations to Adverse Effects From Tidal Stream Turbines and Wave Energy Devices. ICES J. MarineScience 69, 1466–1479. doi: 10.1093/icesjms/fss131
Hammar L., Andersson S., Eggertsen L., Haglund J., Gullström M., Ehnberg J., et al. (2013). Hydrokinetic Turbine Effects on Fish Swimming Behaviour. PloS One 8 (12), e84141. doi: 10.1371/journal.pone.0084141
Hasselman D. J., Barclay D. R., Cavagnaro R. J., Chandler C., Cotter E., Gillespie D. M., et al. (2020). “Environmental Monitoring Technologies and Techniques for Detecting Interactions of Marine Animals With Turbines,” in OES-Environmental 2020 State of the Science Report: Environmental Effects of Marine Renewable Energy Development Around the World. Report for Ocean Energy Systems (OES). Eds. Copping A. E., Hemery L. G., 176–212. doi: 10.2172/1633202
Heal M., Hoover B. A., Waggitt J. J. (2021). Using Rangefinder Binoculars to Measure the Behaviour and Movement of European Shags Phalacrocorax Aristotelis in Coastal Environments. Bird Study 68, 135–131. doi: 10.1080/00063657.2021.1960947
Hedgärde M., Willestofte Berg C., Kindt-Larsen L., Lunneryd S.-G., Königson S. (2016). Explaining the Catch Efficiency of Different Cod Pots Using Underwater Video to Observe Cod Entry and Exit Behaviour. J. Ocean Tech. 11 (4), 67–90.
Hillersøy G., Lorentsen S. H. (2012). Annual Variation in the Diet of Breeding European Shag (Phalacrocorax Aristotelis) in Central Norway. Waterbirds 35 (3), 420–429. doi: 10.1675/063.035.0306
Howells R. J., Burthe S. J., Green J. A., Harris M. P., Newell M. A., Butler A., et al. (2017). From Days to Decades: Short-and Long-Term Variation in Environmental Conditions Affect Offspring Diet Composition of a Marine Top Predator. Mar. Ecol. Prog. Ser. 583, 227–242. doi: 10.3354/meps12343
ICES (2007). “Report of the Study Group on the Development of Fish Pots for Commercial Fisheries and Survey Purposes (SGPOT),” in ICES CM 2007/FTC:02(Dublin, Ireland), p 17.
Isaksson N., Cleasby I. R., Owen E., Williamson B. J., Houghton J. D., Wilson J., et al. (2021). The Use of Animal-Borne Biologging and Telemetry Data to Quantify Spatial Overlap of Wildlife With Marine Renewables. J. Mar. Sci. Eng. 9 (3), 263. doi: 10.3390/jmse9030263
Isaksson N., Masden E. A., Williamson B. J., Costagliola-Ray M. M., Slingsby J., Houghton J. D., et al. (2020). Assessing the Effects of Tidal Stream Marine Renewable Energy on Seabirds: A Conceptual Framework. Mar. pollut. Bull. 157, 111314. doi: 10.1016/j.marpolbul.2020.111314
Johnston D. T., Furness R. W., Robbins A. M., Tyler G. A., McIlvenny J., Masden E. A. (2021). Tidal Stream Use by Black Guillemots Cepphus Grylle in Relation to a Marine Renewable Energy Development. Mar. Ecol. Prog. Ser. 669, 201–212. doi: 10.3354/meps13724
Johnston D. W., Thorne L. H., Read A. J. (2005). Fin Whales Balaenoptera Physalus and Minke Whales Balaenoptera Acutorostrata Exploit a Tidally Driven Island Wake Ecosystem in the Bay of Fundy. Mar. Ecol. Prog. Ser. 305, 287–295. doi: 10.3354/meps305287
Kruuk H., Conroy J. W. H., Moorhouse A. (1991). Recruitment to a Population of Otters (Lutra Lutra) in Shetland, in Relation to Fish Abundance. J. Appl. Ecol., 221 (4), 95–101. doi: 10.2307/2404116
Kruuk H., Nolet B., French D. (1988). Fluctuations in Numbers and Activity of Inshore Demersal Fishes in Shetland. J. Mar. Biol. Assoc. United Kingdom 68 (4), 601–617. doi: 10.1017/S0025315400028745
Lea S. E. G., Daley C., Boddington P. J. C., Morison V. (1996). Diving Patterns in Shags and Cormorants (Phalacorocorax): Tests of an Optimal Breathing Model. Ibis 138, 391–398. doi: 10.1111/j.1474-919X.1996.tb08056.x
Lilliendahl K., Solmundsson J. (2006). Feeding Ecology of Sympatric European Shags Phalacrocorax Aristotelis and Great Cormorants P. Carbo in Iceland. Mar. Biol. 149 (4), 979–990. doi: 10.1007/s00227-006-0259-7
Lorentsen S. H., Grémillet D., Nymoen G. H. (2004). Annual Variation in Diet of Breeding Great Cormorants: Does it Reflect Varying Recruitment of Gadoids? Waterbirds 27 (2), 161–169. doi: 10.1675/1524-4695(2004)027[0161:AVIDOB]2.0.CO;2
Macdonald P, Mair J(2017). An Investigation Into the Commercial Viability of Fish Traps and Jig Fishing in the Scottish Demersal Fishery. NAFC Marine Centre Report. p.27
Martínez M. L., Vázquez G., Pérez-Maqueo O., Silva R., Moreno-Casasola P., Mendoza-González G., et al. (2021). A Systemic View of Potential Environmental Impacts of Ocean Energy Production. Renewable Sustain. Energy Rev. 149, 111332. doi: 10.1016/j.rser.2021.111332
Masden E. A., Foster S., Jackson A. C. (2013). Diving Behaviour of Black Guillemots Cepphus Grylle in the Pentland Firth, UK: Potential for Interactions With Tidal Stream Energy Developments. Bird Study 60, 547–549. doi: 10.1080/00063657.2013.842538
McCann D. L., Bell P. S. (2017). Visualising the Aspect-Dependent Radar Cross Section of Seabirds Over a Tidal Energy Test Site Using a Commercial Marine Radar System. Int. J. Mar. Energy 17, 56–63. doi: 10.1016/j.ijome.2017.01.002
Melvin G. D., Cochrane N. A. (2015). Multibeam Acoustic Detection of Fish and Water Column Targets at High-Flow Sites. Estuaries coasts 38 (1), 227–240. doi: 10.1007/s12237-014-9828-z
Neill S. P., Vögler A., Goward-Brown A. J., Baston S., Lewis M. J., Gillibrand P. A., et al. (2017). The Wave and Tidal Resource of Scotland. Renewable Energy 114, 3–17. doi: 10.1016/j.renene.2017.03.027
Onoufriou J., Russell D. J., Thompson D., Moss S. E., Hastie G. D. (2021). Quantifying the Effects of Tidal Turbine Array Operations on the Distribution of Marine Mammals: Implications for Collision Risk. Renewable Energy 180, 157–165. doi: 10.1016/j.renene.2021.08.052
Polagye B., Joslin J., Murphy P., Cotter E., Scott M., Gibbs P., et al. (2020). Adaptable Monitoring Package Development and Deployment: Lessons Learned for Integrated Instrumentation at Marine Energy Sites. J. Mar. Sci. Eng. 8 (8), 553. doi: 10.3390/jmse8080553
Robbins A. M. C. (2017). “Seabird Ecology in High-Energy Environments: Approaches to Assessing Impacts of Marine Renewables,” in Doctoral Dissertation (University of Glasgow), p251.
Ronconi R. A., Clair C. C. S. (2002). Management Options to Reduce Boat Disturbance on Foraging Black Guillemots (Cepphus Grylle) in the Bay of Fundy. Biol. Conserv. 108 (3), 265–271. doi: 10.1016/S0006-3207(02)00126-X
Scherelis C., Penesis I., Hemer M. A., Cossu R., Wright J. T., Guihen D. (2020). Investigating Biophysical Linkages at Tidal Energy Candidate Sites: A Case Study for Combining Environmental Assessment and Resource Characterisation. Renewable Energy 159, 399–413. doi: 10.1016/j.renene.2020.05.109
Scottish Natural Heritage (2016). “Assessing Collision Risk Between Underwater Turbines and Marine Wildlife,” in SNH Guidance Note, p92.
Scott B. E., Langton R., Philpott E., Waggitt J. J. (2014). “Seabirds and Marine Renewables: Are We Asking the Right Questions?,” in Marine Renewable Energy Technology and Environmental Interactions (Dordrecht: Springer), 81–92.
Shoji A., Elliott K. H., Greenwood J. G., McClean L., Leonard K., Perrins C. M., et al. (2015). Diving Behaviour of Benthic Feeding Black Guillemots. Bird Study 62, 217–222. doi: 10.1080/00063657.2015.1017800
Smith, (2021). “Shetland Tidal Array Monitoring Report: Subsea Video Monitoring,” in EnFAIT-0364 Version 4.0, p38.
Smith P., Burrett I., Bailey D., Neat F., Donnan D., Dunlop K., et al. (2010). Shetland Tidal Array Monitoring Report: Subsea Video Monitoring. Sci. Industry Partnership Rep. 1–38 Aberdeen, UK.
Sponza S., Cimador B., Cosolo M., Ferrero E. (2010). Diving Costs and Benefits During Post-Breeding Movements of the Mediterranean Shag in the North Adriatic Sea. Mar. Biol. 157, 1203–1213. doi: 10.1007/s00227-010-1400-1
Stone C.J, Webb A, Barton C, Ratcliffe N, Reed T.C, Tasker M.L, Camphuysen C.J, Pienkowski M.W (1995).An Atlas of Seabird Distribution in North-West European Waters. Joint Nature Conservation CommitteePeterborough, UK
Uda M., Ishino M. (1958). Enrichment Patterns Resulting From Eddy Systems in Relation to Fishing Grounds. J. Tokyo Univ Fish 44, 105–129.
Velando A., Freire J. (1999). Intercolony and Seasonal Differences in the Breeding Diet of European Shags on the Galician Coast (NW Spain). Mar. Ecol. Prog. Ser. 188, 225–236. doi: 10.3354/meps188225
Velando A., Munilla I.(2011). Disturbance to a foraging seabird by sea-based tourism: Implications for reserve management in marine protected areas.Biological Conservation 144, 1167–1174. doi: 10.1016/j.biocon.2011.01.004
Viehman H., Boucher T., Redden A. (2018). “Winter and Summer Differences in Probability of Fish Encounter (Spatial Overlap) With MHK Devices,” in International Marine Energy Journal, vol. 1. , pp.9–pp18.
Viehman H. A., Zydlewski G. B. (2017). Multi-Scale Temporal Patterns in Fish Presence in a High-Velocity Tidal Channel. PloS One 12 (5), e0176405. doi: 10.1371/journal.pone.0176405
Waggitt J. J., Cazenave P. W., Torres R., Williamson B. J., Scott B. E. (2016). Predictable Hydrodynamic Conditions Explain Temporal Variations in the Density of Benthic Foraging Seabirds in a Tidal Stream Environment. ICES J. Mar. Sci. 73 (10), 2677–2686. doi: 10.1093/icesjms/fsw100
Waggitt J. J., Evans P. G. H., Andrade J., Banks A., Boisseau O., Bolton M., et al. (2020). Distribution Maps of Cetacean and Seabird Populations in the North-East Atlantic. J. Appl. Ecol. 57, 253–269. doi: 10.1111/1365-2664.13525
Waggitt J., Robbins A., Wade H., Masden E., Furness R., Jackson A., et al. (2017). Comparative Studies Reveal Variability in the Use of Tidal Stream Environments by Seabirds. Mar. Policy 81, 143–152. doi: 10.1016/j.marpol.2017.03.023
Waggitt J. J., Scott B. E. (2014). Using a Spatial Overlap Approach to Estimate the Risk of Collisions Between Deep Diving Seabirds and Tidal Stream Turbines: A Review of Potential Methods and Approaches. Mar. Policy 44, 90–97. doi: 10.1016/j.marpol.2013.07.007
Wanless S., Burger A. E., Harris M. P. (1991). Diving Depths of Shags Phalacrocorax Aristotelis Breeding on the Isle of May. Ibis 133, 37–42. doi: 10.1111/j.1474-919X.1991.tb04807.x
Wanless S., Harris M. P. (1991). Diving Patterns of Full-Grown and Juvenile Rock Shags. Condor 93, 44–48. doi: 10.2307/1368604
Watanuki Y., Daunt F., Takahashi A., Newell M., Wanless S., Sato K., et al. (2008). Microhabitat Use and Prey Capture of a Bottom-Feeding Top Predator, the European Shag, Shown by Camera Loggers. Mar. Ecol. Prog. Ser. 356, 283–293. doi: 10.3354/meps07266
Williamson B. J., Fraser S., Blondel P., Bell P. S., Waggitt J. J., Scott B. E. (2017). Multisensor Acoustic Tracking of Fish and Seabird Behavior Around Tidal Turbine Structures in Scotland. IEEE J. Oceanic Eng. 42 (4), 948–965. doi: 10.1109/JOE.2016.2637179
Wood S. N. (2006). Generalized Additive Models: An Introduction With R (Boca Raton, USA: Chapman and Hall/CRC).
Keywords: fish distribution, foraging behavior, marine renewable energy, tidal stream energy, environmental monitoring, baited fish trap, fish pot, rangefinder binoculars
Citation: Fraser S and Waggitt JJ (2022) Practical Approaches for Providing Empirical Data on Seabird Behavior and Prey Assemblages in Tidal Channels. Front. Mar. Sci. 9:851476. doi: 10.3389/fmars.2022.851476
Received: 09 January 2022; Accepted: 31 May 2022;
Published: 15 July 2022.
Edited by:
Daniel James Hasselman, Fundy Ocean Research Centre for Energy (FORCE), CanadaReviewed by:
Jan Marcin Weslawski, Institute of Oceanology (PAN), PolandSarah Wong, Environment and Climate Change Canada, Canada
Copyright © 2022 Fraser and Waggitt. This is an open-access article distributed under the terms of the Creative Commons Attribution License (CC BY). The use, distribution or reproduction in other forums is permitted, provided the original author(s) and the copyright owner(s) are credited and that the original publication in this journal is cited, in accordance with accepted academic practice. No use, distribution or reproduction is permitted which does not comply with these terms.
*Correspondence: Shaun Fraser, c2hhdW4uZnJhc2VyQHVoaS5hYy51aw==