 Shuangqiang Wang
 F. Javier Murillo†
 Ellen Kenchington
- Department of Fisheries and Oceans, Ocean Ecology Section, Bedford Institute of Oceanography, Dartmouth, NS, Canada
The large, habitat-forming bubblegum coral, Paragorgia arborea, is a vulnerable marine ecosystem indicator with an antitropical distribution. Dense aggregations of the species have been protected from bottom-contact fishing in the Scotian Shelf bioregion off Nova Scotia, Canada in the northwest Atlantic Ocean. Recently, basin-scale habitat suitability ensemble modeling has projected an alarming loss of 99% of suitable habitat for this species across the North Atlantic by 2100. Here, a regional reassessment of the predicted distribution of this species in the bioregion, using both machine learning (random forest) and generalized additive model (GAM) frameworks, including projection to 2046−2065, was undertaken. Extrapolation diagnostics were applied to determine the degree to which the models projected into novel covariate space (i.e., extrapolation) in order to avoid erroneous inferences. The best predictors of the species’ distribution were a suite of temporally-invariant terrain variables that identified suitable habitat along the upper continental slope. Additional predictors, projected to vary with future ocean climatologies, identified areas of the upper slope in the eastern portion of the study area that will remain within suitable ranges for P. arborea at least through to the mid-century. Additionally, 3-D Lagrangian particle tracking simulations indicated potential for both connectivity among known occurrence sites and existing protected areas, and for colonization of unsurveyed areas predicted to have suitable habitat, from locations of known occurrence. These results showed that extirpation of this iconic species from the Scotian Shelf bioregion is unlikely over the next decades. Potential climate refugia were identified and results presented in the context of protected area network design properties of representativity, connectivity, adequacy, viability and resilience.
1 Introduction
The large, fan-shaped gorgonian octocorals of the genus Paragorgia Milne Edwards, 1857, known as ‘bubblegum corals’ (Figure 1), form ecologically significant habitats on hard substrates along the continental margins of eastern North America (Gass, 2002; Metaxas and Giffin, 2004; Mortensen and Buhl-Mortensen, 2004; Buhl-Mortensen and Mortensen, 2005; Gass and Willison, 2005; Leverette and Metaxas, 2005; Metaxas and Davis, 2005; Watling and Auster, 2005; Quattrini et al., 2015; Kenchington et al., 2019a), and elsewhere (Sánchez, 2005; Herrera et al., 2012; De Clippele et al., 2015; Morato et al., 2021). Of the 18 accepted species in the genus (Cordeiro et al., 2021), P. arborea (Linnaeus, 1758) and P. johnsoni Gray, 1862 are found on the continental slope off Nova Scotia, Canada, with P. arborea being the more frequently recorded (Cogswell et al., 2009; Strychar et al., 2011). In this region, both Paragorgia species are long-lived and slow-growing, attaining colony heights of 240 cm, and forming dense aggregations (Sherwood and Edinger, 2009; Watanabe et al., 2009). They are considered to be indicators of vulnerable marine ecosystems (ICES, 2021; NAFO, 2021), and are thereby linked to international conservation efforts advanced by the United Nations (FAO, 2016).
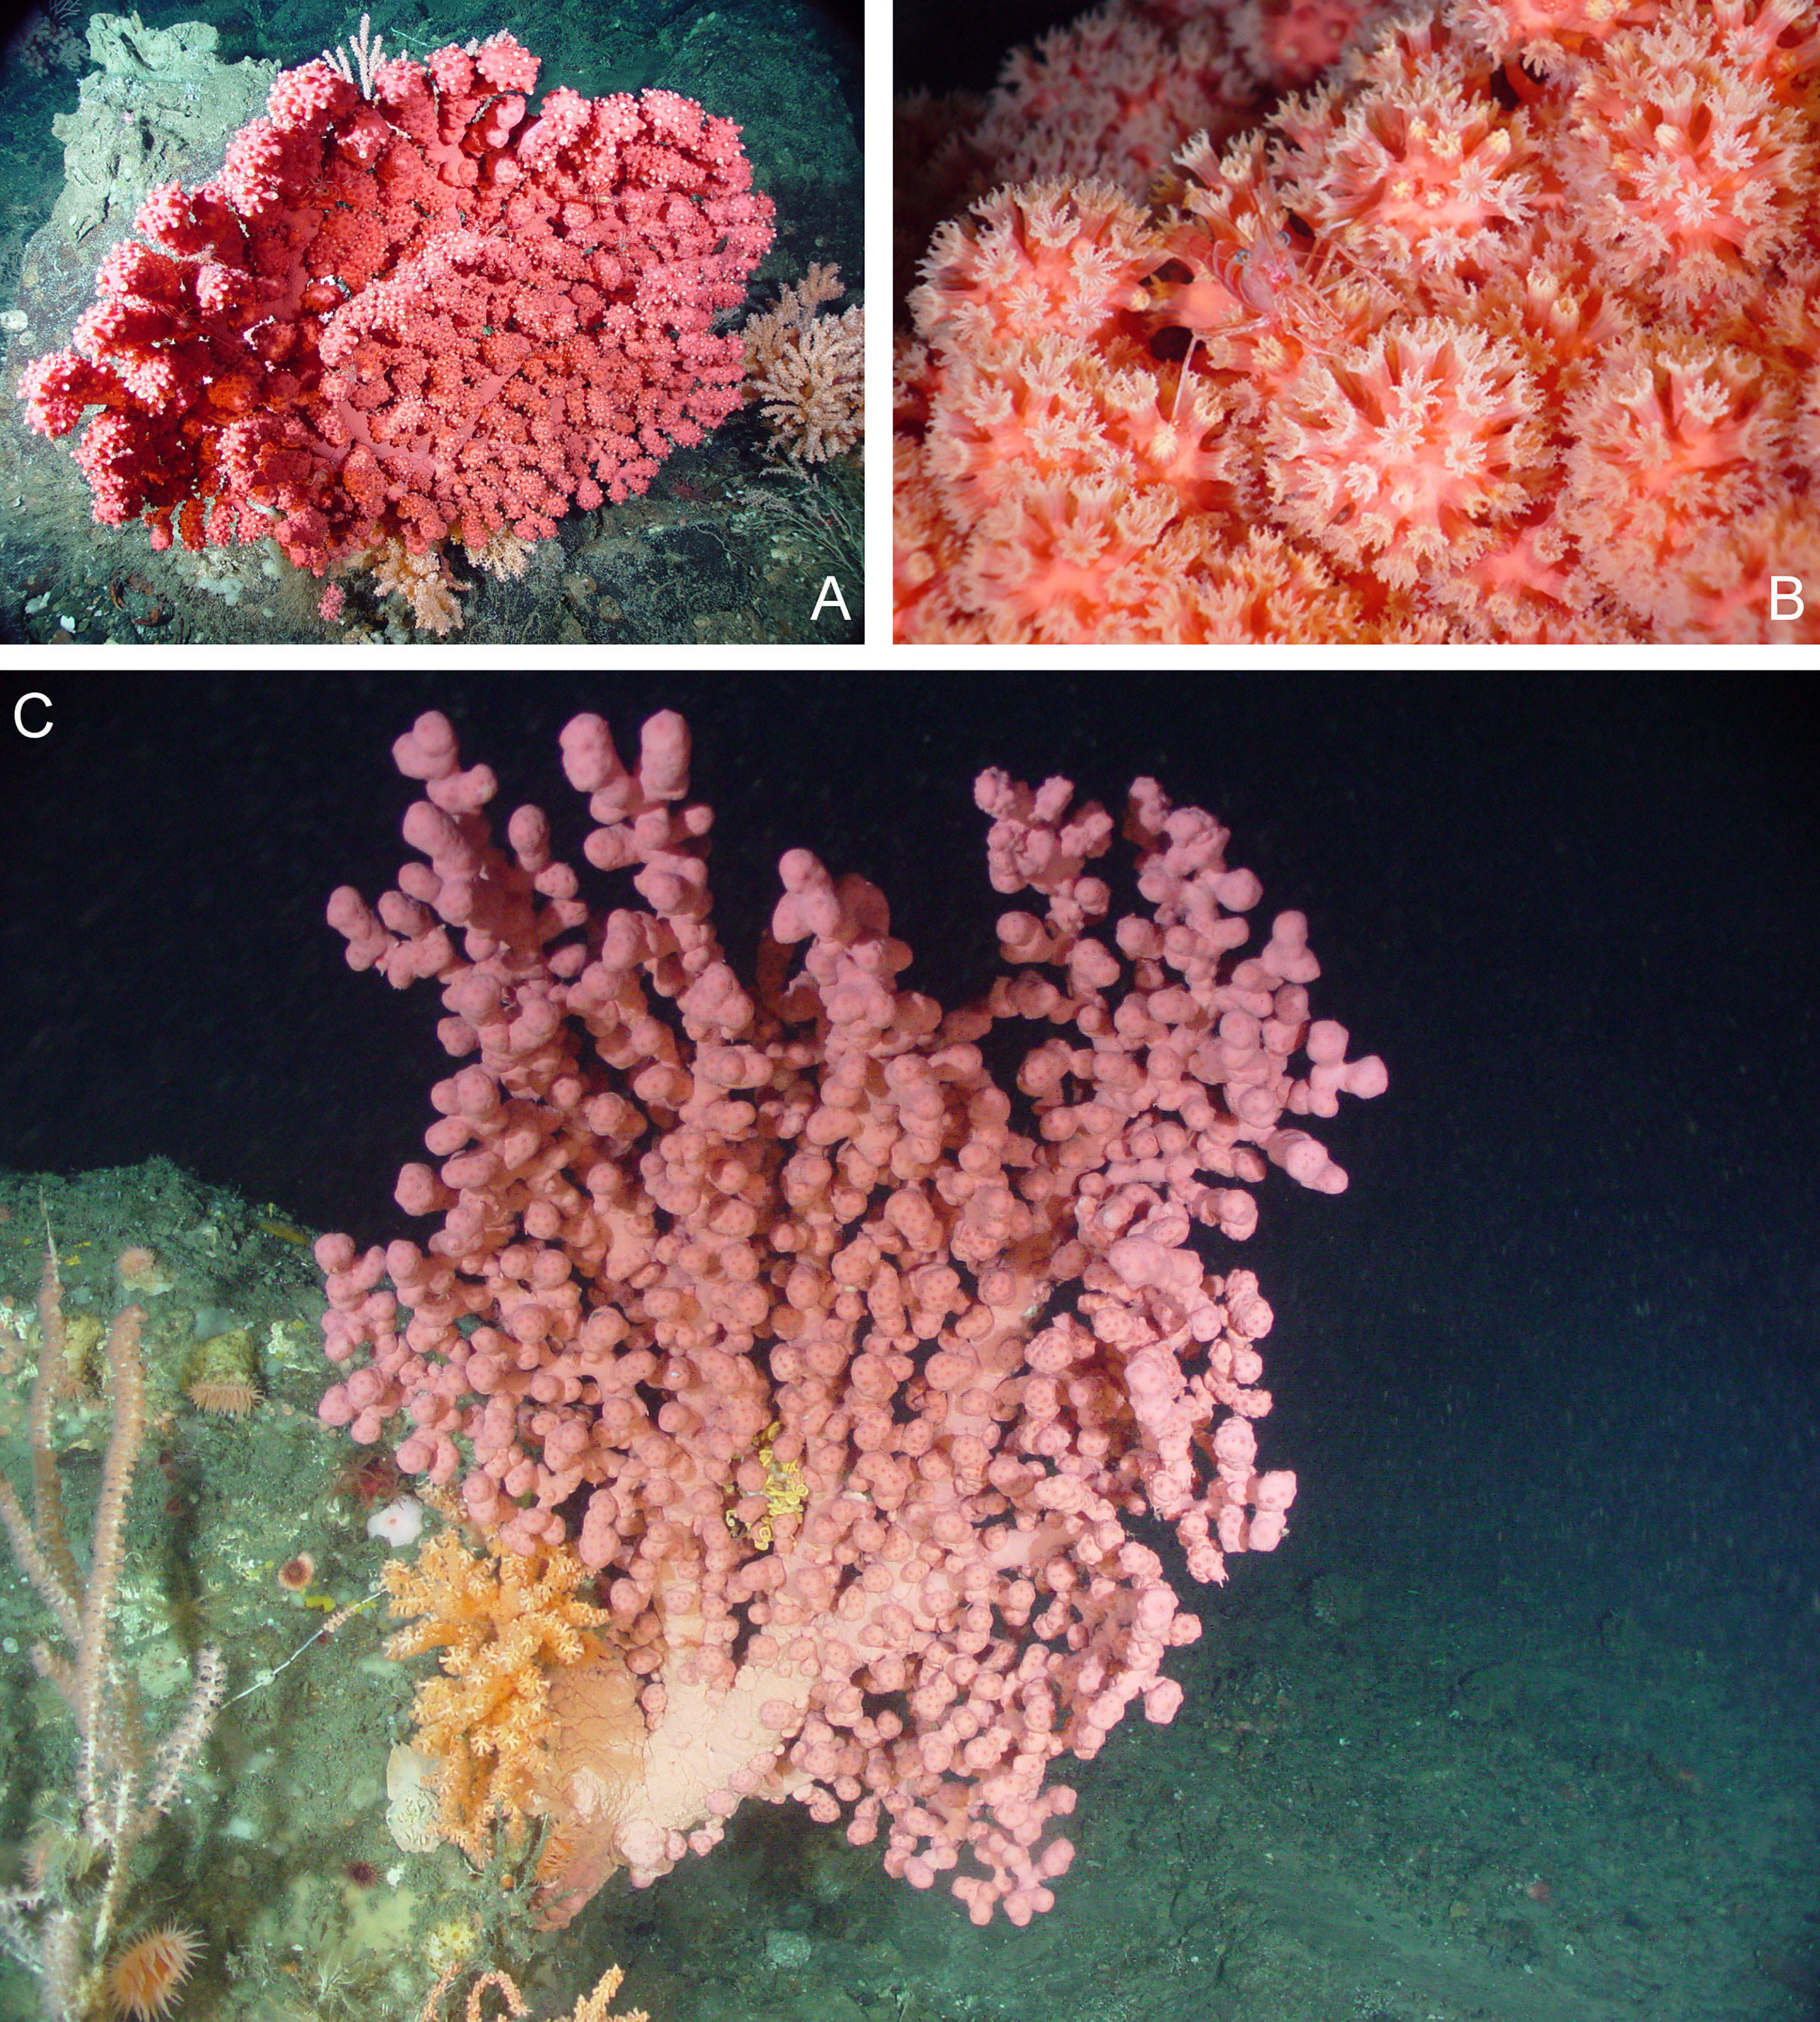
Figure 1 In situ images of Paragorgia arborea from the Northeast Channel Coral Conservation Area. (A) Intact colony growing on bedrock; (B) Close up of polyps open for feeding; (C) Intact colony growing on a boulder.
Thirteen bioregions, sub-divided into planning areas, have been delineated in Canadian waters to inform MPA network development (DFO, 2009; DFO, 2014). These biogeographic zones were delineated based primarily on a common set of ecological, oceanographic and bathymetric similarities (DFO, 2009). Among those, Paragorgia spp. are found in the Scotian Shelf bioregion within which is embedded the “Offshore Scotian Shelf” planning area, defined as extending from the 12-nautical mile limit of Canada’s Territorial Sea to the 200-mile limit of its Exclusive Economic Zone (Figure 2), including parts of the Scotian Shelf itself, as well as portions of Georges Bank and the Gulf of Maine (DFO, 2014). A series of canyons incise the continental slope in that planning area, and provide habitat for bubblegum corals (Watanabe et al., 2009), some of which is subject to specific coral-protection measures. In 2002, Fisheries and Oceans Canada (DFO) established the Northeast Channel Coral Conservation Area to protect some of the region’s largest aggregations of octocorals from the impacts of bottom-contact fishing gears (DFO, 2019). Smaller aggregations of Paragorgia spp. are similarly protected in the Corsair and Georges Canyons Conservation Area (Metaxas et al., 2019), in the Gully Marine Protected Area (Breeze and Fenton, 2007), and the Lophelia Coral Conservation Area, at the mouth of the Laurentian Channel (Beazley et al., 2021a).
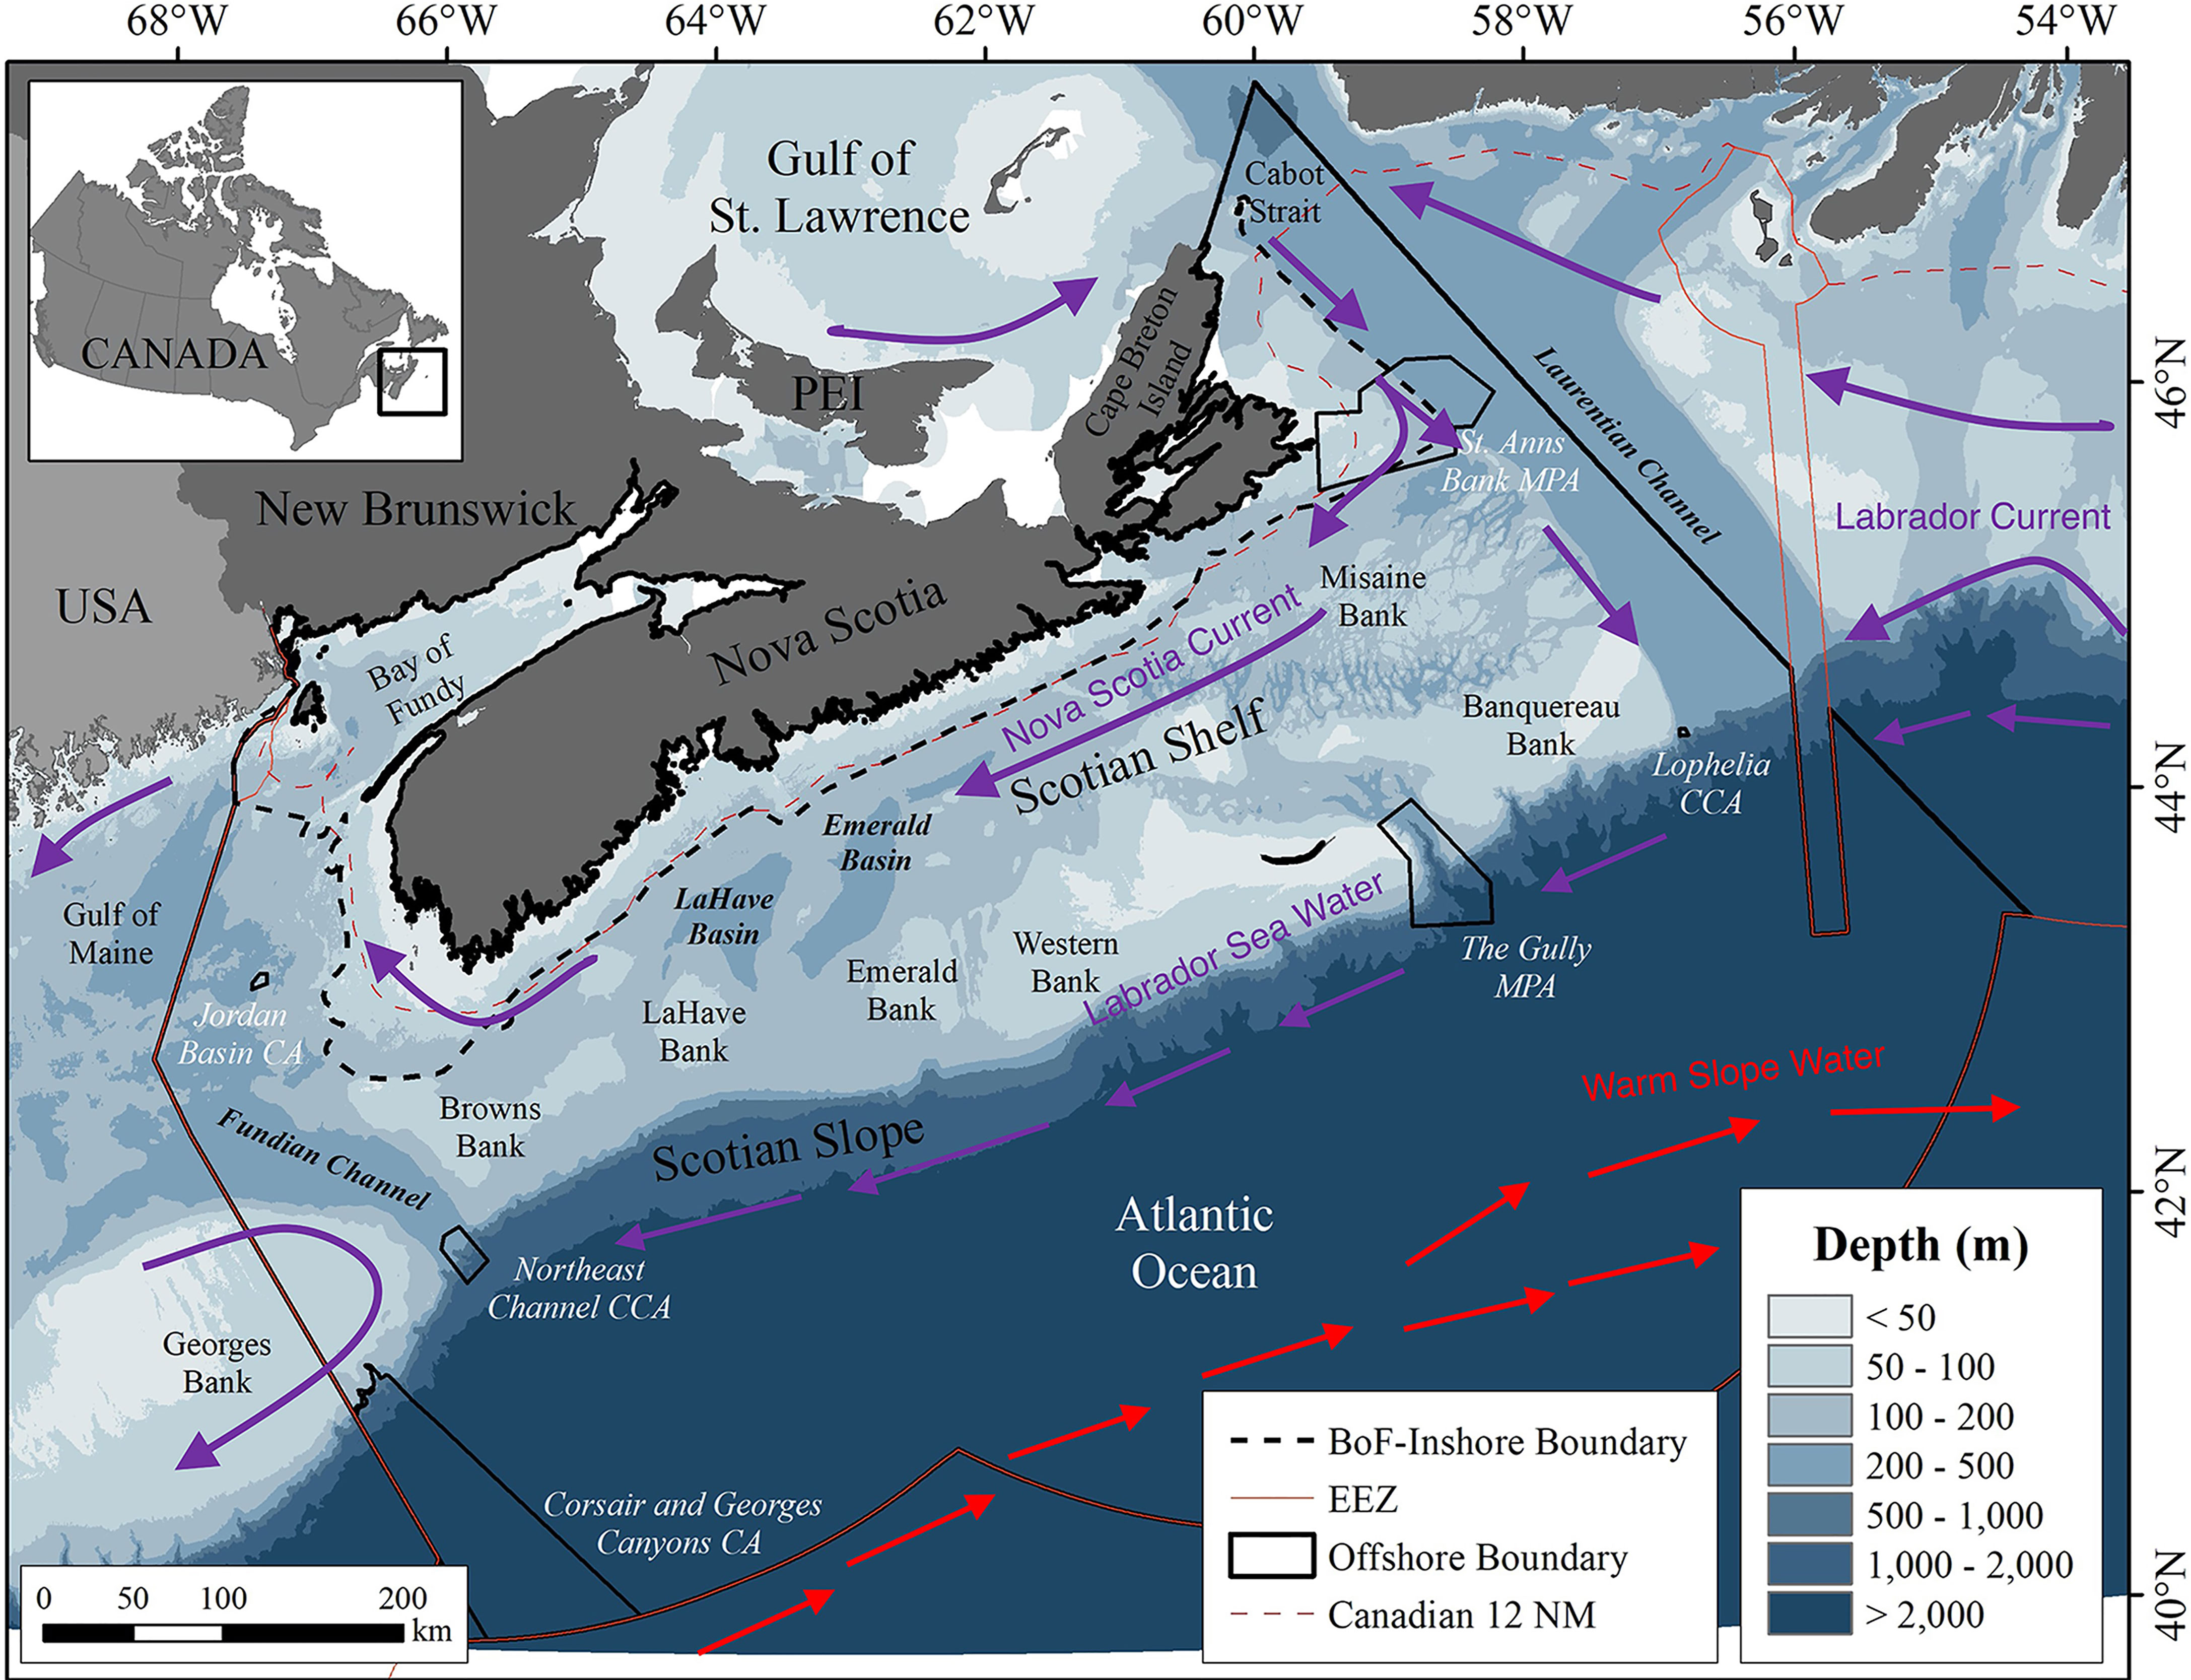
Figure 2 Place names and locations of features in the Scotian Shelf bioregion study area (black perimeter). The six conservation areas within the study area but outside the 12 nm Territorial Sea (dashed line) are shown in black outline with their names in white lettering. The general location of currents and water masses influencing the region are indicated. CA, Conservation Area; CCA, Coral Conservation Area; MPA, Marine Protected Area.
Those protection areas were adopted independently, as aggregations were discovered and described. With the need to develop a network of protected areas in response to domestic (Oceans Act Section 35 (2)), and international (UN Convention on Biological Diversity, UN Sustainable Development Goals) policies, network properties such as representativity, connectivity, adequacy and viability must be considered (DFO, 2010; Garcia et al., 2021). Furthermore, with changing climatic conditions there is a need to consider climate resiliency in protected area network design (Brock et al., 2012; Simard et al., 2016).
Predictive models of species distributions, when presented with associated levels of uncertainty, enable managers to make informed decisions on the trade-offs implicit in marine spatial planning (Lester et al., 2013; Grorud-Colvert et al., 2014; Carr, 2019; Metaxas et al., 2019), while insight into the impacts of climate change on the size and configuration of suitable habitat, can improve network design (Santos et al., 2020). Meanwhile, Lagrangian particle tracking (LPT) models are valuable for assessing connectivity (e.g., Bracco et al., 2019; Kenchington et al., 2019b; Metaxas et al., 2019; Zeng et al., 2019; Wang et al., 2020; Wang et al., 2021), and can provide independent support for the evaluation of species distribution models (Kenchington et al., 2019b; Wang et al., 2021). In LPT models, virtual “particles” are advected by flow fields derived from numerical ocean models. Vertical behaviours can also be modeled through particle releases at different depths, and by incorporating vertical velocities into the tracking algorithms, such that the particles can mimic active drifters, enabling predictions of biophysical connectivity.
Recently, basin-scale distribution modeling of P. arborea habitat under present-day (1951–2000) and future (2081–2100) environmental conditions (the latter modeled as Intergovermental Panel on Climate Change (IPCC) Representative Concentration Pathway (RCP) 8.5, a “business-as-usual” scenario), projected an alarming loss of 99% of suitable habitat across the North Atlantic, including in the Offshore Scotian Shelf planning area (Morato et al., 2020). Consequently, a review of existing protections for this species and of the properties required for a protected area network is needed, to support effective conservation efforts. That review must necessarily consider whether the results of basin-scale modeling of P. arborea habitat can be validly applied at the scale of the planning area.
Modeling of future ocean climate typically relies on low-resolution models designed to capture large-scale open-ocean properties (IPCC, 2013), the resulting products often being subsequently down-scaled for use in species distribution modeling. Such low-resolution models are inappropriate for capturing shelf-scale processes or for regions with sharp oceanographic boundaries, such as the Canadian Atlantic, where a higher native resolution is required to simulate ocean processes accurately, including under future projections (Stock et al., 2011; Brickman et al., 2016). Modeling over large spatial scales also increases the likelihood of both spatial autocorrelations in species-environmental relationships and the extrapolation of those relationships to non-analogous environments, which can lead to poorly-specified species distribution models with limited transferability to generate predictions for novel, including future, environments (Miller, 2012; Sequeira et al., 2018; Yates et al., 2018; Mannocci et al., 2020). In some situations, predicted distribution models are improved when they are calibrated within areas with a similar climate (Morán-Ordóñez et al., 2017; Qiao et al., 2018). For Paragorgia spp. in particular, heterogeneity in species/environment relationships over basin scales is indicated by the differences in relative importance of variables among studies by Bryan and Metaxas (2007), in the northwest Atlantic, and Sundahl et al. (2020), in the northeast. There are also regional differences in genetic composition of P. arborea within the North Atlantic (Herrera et al., 2012), potentially indicating differing environmental niches.
Metaxas et al. (2019) applied LPT hindcast models parameterized to the known biological traits of P. arborea and Primnoa resedaeformis to examine transborder connectivity among the canyons in the Corsair Canyon region along the slope of Georges Bank. A Finite-Volume Community Ocean Model (FVCOM) was used to generate velocity fields built across the Gulf of Maine. FVCOM models can have poor model accuracy in areas of steep slope (Feng et al., 2022), and the canyons in this region were poorly resolved (Metaxas et al., 2019). Nevertheless, there was evidence for connectivity to Corsair Canyon from the south, particularly from the two closest canyons, Georges in Canadian waters, and Heezen Canyon in US waters. Limited connectivity from the Northeast Channel Coral Conservation Area was observed in winter and spring, and it was suggested that future work should entail forward-tracking modeling to test hypotheses of dispersal trajectories emanating from Corsair Canyon and the Northeast Channel, specifically. In this study a similar approach was taken over a larger spatial extent, building on the demonstrated utility of applying LPT models to address issues of connectivity in P. arborea.
Here, a regional reassessment of both present-day and future distributions of P. arborea habitat in the Offshore Scotian Shelf planning area was undertaken, integrating the results of various species distribution and LPT models to evaluate the properties of representativity, connectivity, adequacy, viability and resiliency in relation to protected area network design (Supplementary Table 1). Models of the present-day distribution filled data gaps and supported evaluation of representativity. Climate resiliency was examined with additional models of the distributions of P. arborea habitat under climate projections for 2046−2065, assessed against a model built on the same variables but under 1990−2015 reference conditions, to allow examination of dynamic relationships among sites in time and space. Areas with projected conditions analogous to those of the reference period, representing potential climate refugia for long-lived Paragorgia spp., were identified.
The transferability of the species distribution models (Sequeira et al., 2018; Yates et al., 2018; Liu et al., 2020) was evaluated to determine their reliability (Mesgaran et al., 2014). For areas where suitable habitat was predicted but for which no presence records were available, the potential for larvae to colonize the areas from known populations using the LPT models was evaluated.
2 Materials and Methods
2.1 Study Area
The study area, the Scotian Shelf bioregion (Figure 2), encompasses the marine waters of DFO’s Maritimes Region, an administrative unit that includes the Bay of Fundy, parts of the Gulf of Maine, Georges Bank and the Laurentian Channel, plus the entire Scotian Shelf, the adjacent continental slope, rise and a portion of the abyssal plain, delimited to the southeast by the boundary of Canada’s Exclusive Economic Zone. Within that area, a 5 km buffer drawn around all land was excluded from the analyses. The study area thus contains the Offshore Scotian Shelf planning area which informs marine planning exercises such as MPA network development.
The major current and water mass systems that influence the area occupied by P. arborea in the Scotian Shelf bioregion have been well-characterized. The Gulf Stream transports warm, saline water from the south and contributes to the formation of a warm and saline water mass, the Warm Slope Water (WSW) (Figure 2). This water mass extends from the surface to 400 m depth, bringing high nutrient concentrations below the surface (Townsend et al., 2015), and flows northeast between the shelf break and the north wall of the Gulf Stream to round Grand Bank (Csanady and Hamilton, 1988; Fratantoni and Pickart, 2007). South of Nova Scotia, WSW intermittently floods the area between two offshore banks, Emerald and LaHave (Figure 2), filling the depths of Emerald Basin with warm, saline water (Drinkwater et al., 2003).
The waters of the continental shelf originate in the Gulf of St. Lawrence, where a very cold, low-salinity Cold Intermediate Layer and, in summer, a warm surface layer, cross the shallow banks of the eastern Scotian Shelf (Han and Loder, 2003), flowing southwestwards with the Nova Scotia Current (Figure 2). These waters over the Scotian Shelf flow into the Gulf of Maine, which also receives a deep inflow of WSW through the Northeast Channel (Townsend et al., 2015). Another branch of the Gulf of St. Lawrence outflow merges with cold, low salinity water from the north carried by the Labrador Current flowing southwestwards along the edge of the Scotian Shelf as a Shelf-Break Current (Han et al., 1999). This cold, less saline Labrador Sea Water is carried along the upper continental slope off Nova Scotia (Figure 2).
2.2 Species Distribution Modeling
Two fundamentally different modeling approaches were used to predict the probability of occurrence of P. arborea: random forest (RF), a non-parametric machine learning technique in which numerous regression or classification trees are built using random subsets of the data (Breiman, 2001), and generalized additive modeling (GAM), which uses smoothing functions applied to the input data to estimate non-linear effects of the covariates on the dependent variables (Wood, 2006; Conn et al., 2015). RF works well with high-dimensional data, including situations where the number of observations is much less than that of predictor variables, and is relatively insensitive to correlations among those variables (Díaz-Uriarte and Alvarez de Andrés, 2006; Biau, 2012; Biau and Scornet, 2016). GAMs are well-suited for capturing species-environment relationships and detecting trends in the data, however they are sensitive to nonlinear dependence, or concurvity, of the predictor variables (Amodio et al., 2014), and hence were used with a smaller number of poorly correlated predictors.
RF models were built in R version 4.0.4 (R Development Core Team, 2020) using the ‘randomForest’ package (Liaw and Wiener, 2002), with default parameter values, and the default 500 trees constructed for each model. The predictors were assessed using the ‘importance’ function of ‘randomForest’, which calculates the mean decrease in Gini index, or Gini impurity, for each variable. Probability of occurrence across environmental gradients was evaluated using functional response curves (Lopes et al., 2019). The probability of occurrence and the value of each environmental predictor for each raster cell were extracted and smoothed, using the loess method with span = 0.6 applied to each curve.
The GAMs were built with the ‘mgcv’ package (Wood, 2006) in R, and were based on the binomial error distribution. Model selection followed a backward, stepwise variable-selection approach. Preliminary analysis showed two different relationships between the response data and some environmental variables. The default number of knots (10) was used to capture this pattern.
2.2.1 Modeling Scenarios
A number of scenarios were modeled to address different aspects of the study (Supplementary Table 1). RF models, were constructed using both presence and assumed absence data, and initially with 47 environmental predictor variables representing contemporary conditions. The resulting prediction surfaces presented modeled distributions that were extrapolated over large areas, as a consequence of non-analogous conditions in some water-column variables. Following Mesgaran et al. (2014), those variables were removed and an alternative RF model was built using only the top 6 predictors from the first model, all of which were terrain variables. The outputs from those two models were used in assessing the representativity of the closures currently in place.
Examination of changes in the predicted distribution of P. arborea habitat across time required models constructed for each of two climate projections for 2046−2065. A subset of 8 projected predictors was available (see below) and was used in both RF modeling and GAMs. Models built under 1990−2015 reference conditions were used to project the future distributions using the same predictors.
2.2.2 Response Variables
Paragorgia spp. presence and absence records were obtained from various sources: DFO research-vessel bottom-trawl surveys conducted in the Maritimes Region during 2002–2019, DFO and Natural Resources Canada optical (camera/video) benthic surveys in 1967 and during 1997–2019, and a NOAA Okeanos Explorer ROV survey conducted in 2019 under the ‘Deep Connections 2019: Exploring Atlantic Canyons and Seamounts of the United States and Canada’ mission. Presence and assumed absence records (n=11 and 2982, respectively) were drawn from the trawl surveys, while only presence records (n=2366) were obtained from the other surveys. The trawl surveys followed a stratified-random sampling design (Halliday and Kohler, 1971), with fishing standardized as 30-minute tows at 3.5 knots using Western II-A bottom trawls (Tremblay et al., 2007). The starting position of each tow was used as its location, whereas Paragorgia spp. records from the benthic imagery were given their individual recorded locations. A 1 × 1 km grid was placed over the study area and the data reduced to recorded presence or assumed absence in each cell (3154 cells with data). In all, 115 of those cells had presence records, for a prevalence of 0.036 (Figure 3).
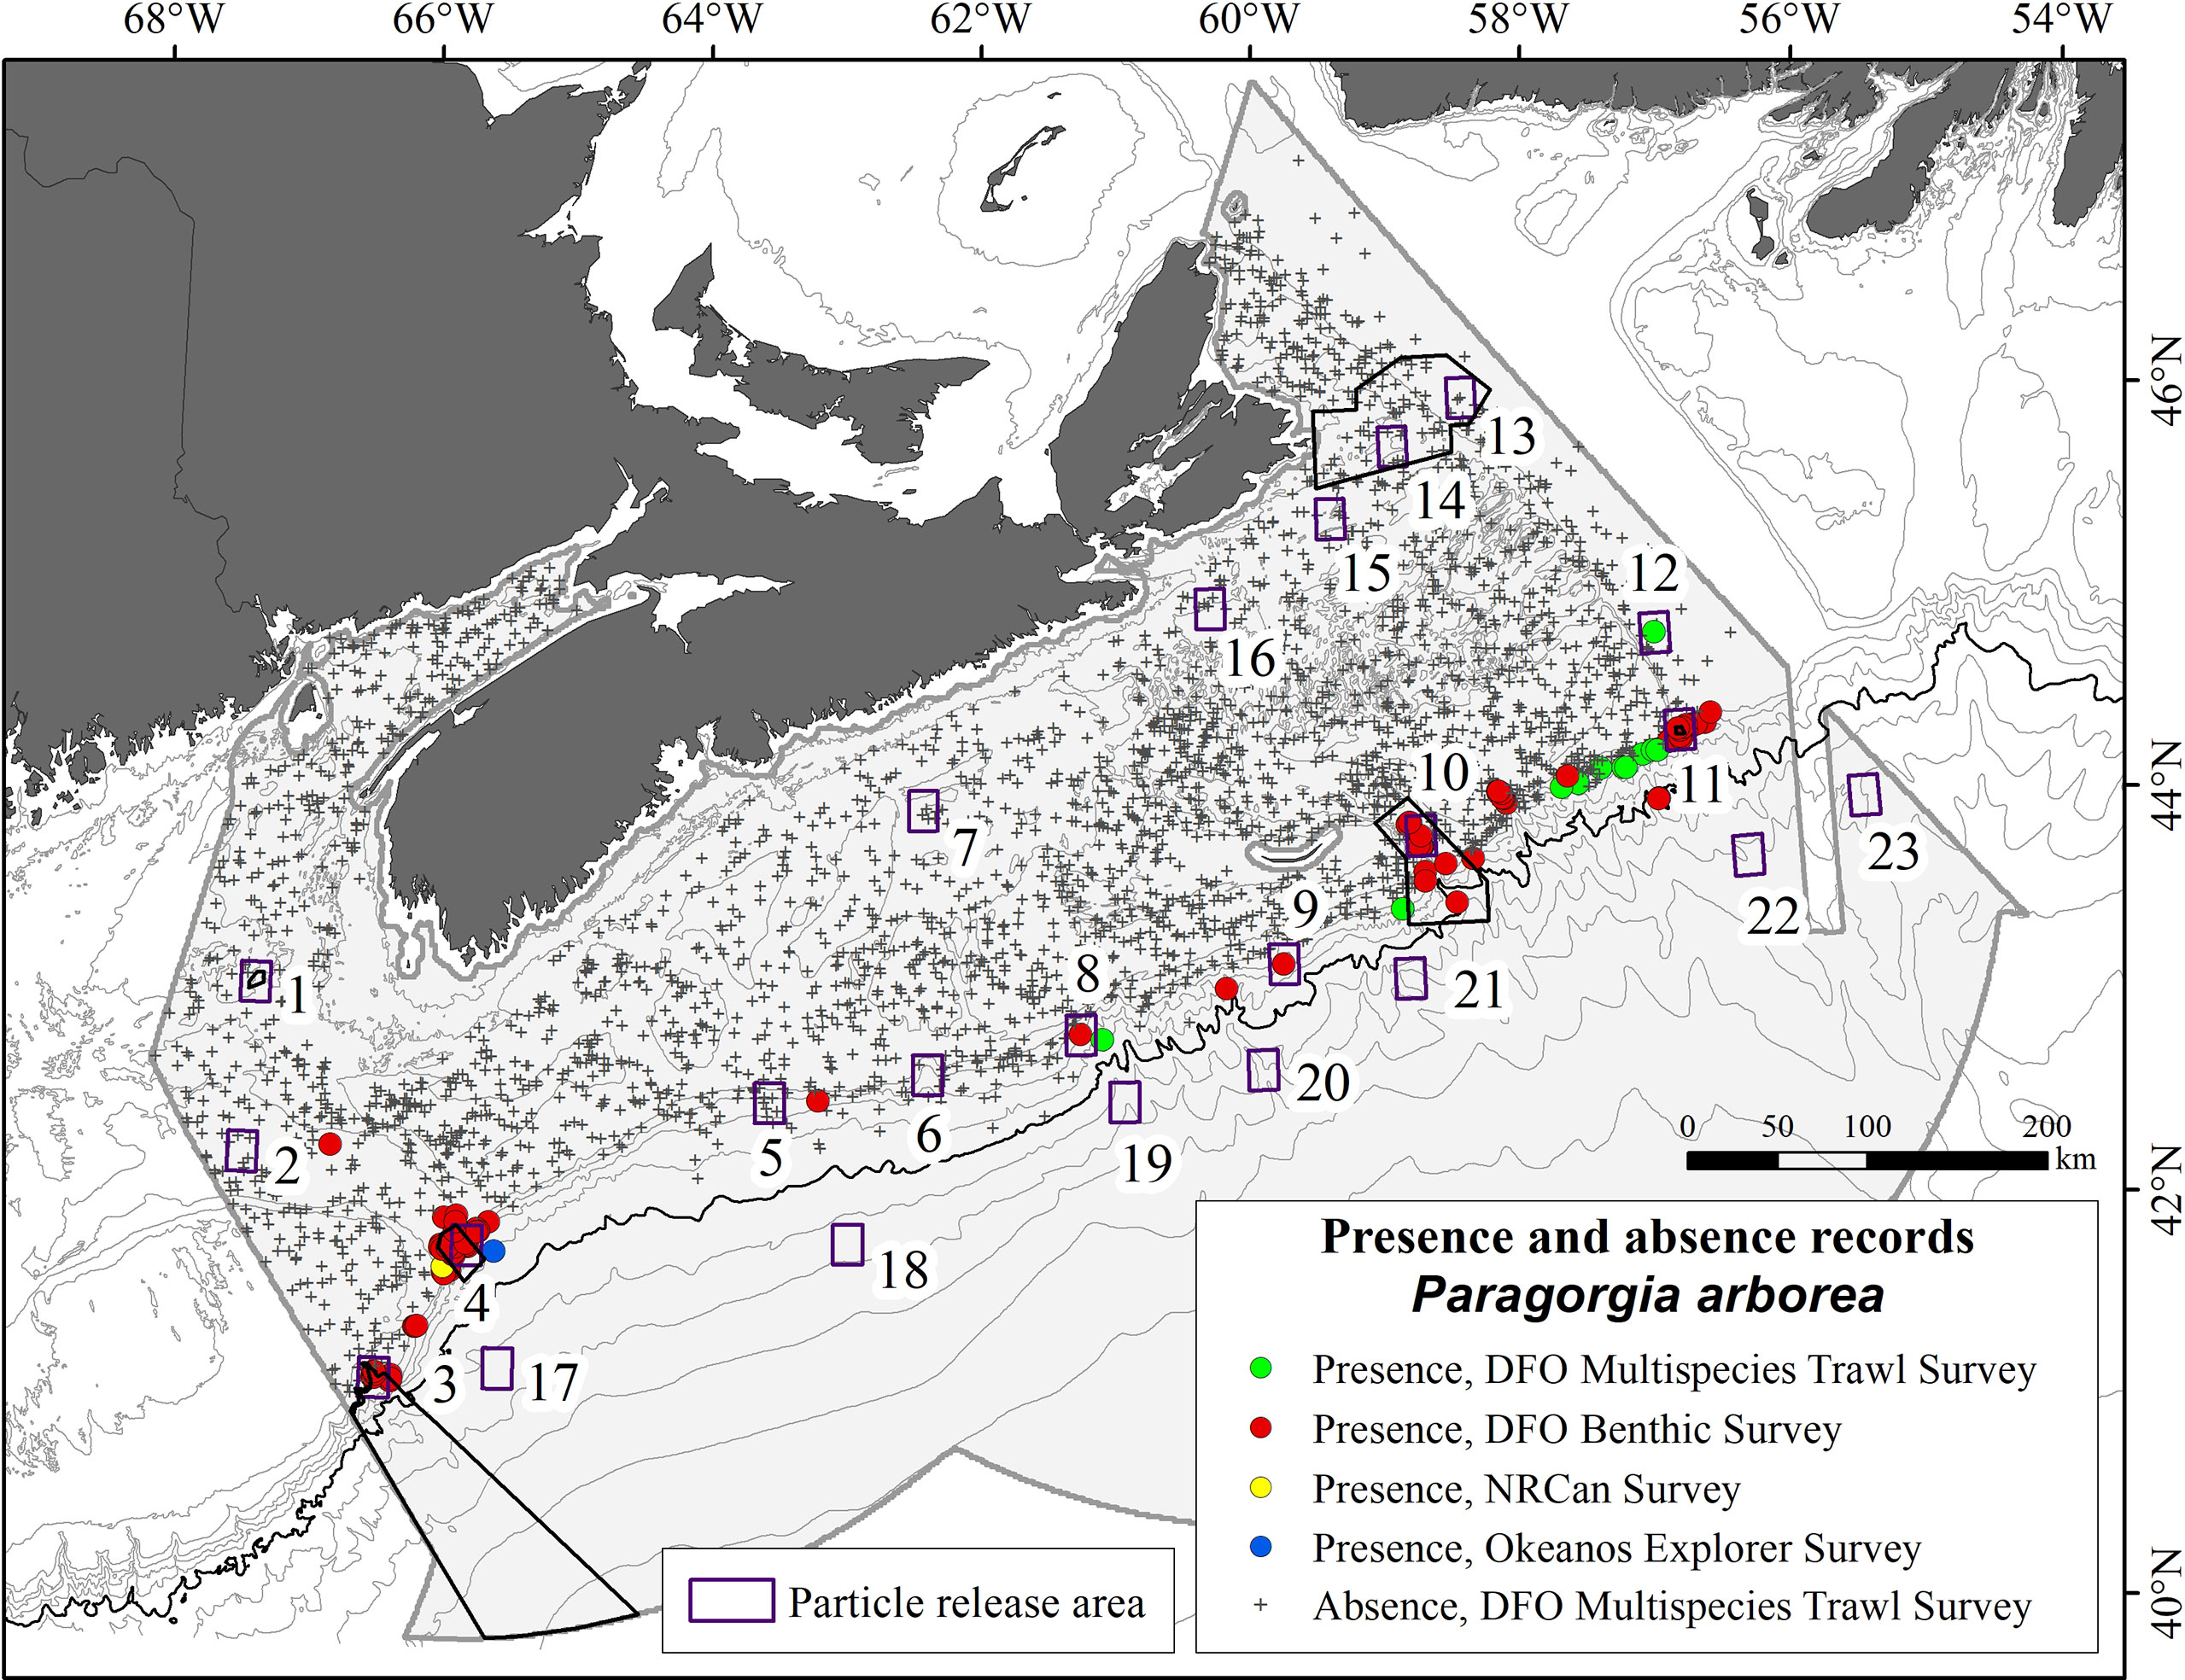
Figure 3 Map of the study area showing the distribution of confirmed records of Paragorgia arborea presence and absence, and the locations of the source boxes used in LPT modeling (numbered). Bathymetric contours are shown at 50, 100, 200, and 500 m, and at 500 m below, with the 2000 m contour emphasized. The six conservation areas within the offshore extent of the study area are shown in black outline (see Figure 2 for place names).
The two species of the genus found in the study area can co-occur (Cogswell et al., 2009), and can be difficult to identify in imagery. Of the 2377 presence records, 2124 were designated P. arborea, 11 were P. johnsoni, while the remainder could not be identified to species. All records identified as P. johnsoni fell within 2 grid cells, each of which also had P. arborea. Of the 242 records not identified to species, 14 were located in one cell which also had records of P. arborea. The remainder came from a single survey and fell within 4 cells, each less than 2 km from a P. arborea record. Therefore, with the dominance of P. arborea and the apparent overlapping environmental preferences of the two species, all presence records lacking species identifications are here treated as P. arborea.
Assessing accuracy and reliability of prediction models ideally requires data not used in model calibration (Liu et al., 2020). There are 94 records of P. arborea from the study area collected prior to 2002 that were not included in the response data for the models. Some were provided by fishermen and lacked either an exact location or confirmed species identification (Gass, 2002). Others were obtained from the Ocean Biodiversity Information System (OBIS: Supplementary Figure 1). Records from each of those sources were judged too uncertain for use in the modeling, but they were utilized in post-hoc evaluation of model performance. They documented presence only.
The presence and pseudo-absence data from the Scotian Shelf bioregion study area portion of the basin-scale study that were analyzed by Morato et al. (2020), were provided by Drs. T. Morato and J.-M. González-Irusta, and used in comparisons of the results of the two studies.
2.2.3 Environmental Predictor Variables
2.2.3.1 Contemporary Data
A suite of 35 environmental variables developed for modeling the distribution of the glass sponge Vazella pourtalesii, another deep-sea, sessile, filter-feeding species, on the Scotian Shelf (Beazley et al., 2018; Beazley et al., 2019; Beazley et al., 2021b; Beazley et al., 2021c) was used in representing contemporary environments. It included biologically-relevant measures associated with water masses and currents, food supply and fishing effort, and was supplemented with 13 additional terrain variables (Supplementary Table 2). Fishing effort may have shaped the distribution of P. arborea and could help to explain the observed patterns in the models, whereas terrain variables capture aspects of the canyon-channel systems that indent the Scotian Slope and were expected to have a strong influence on the distribution of P. arborea. Bathymetric Position Index (BPI) at fine- and broad-scale, eastness, northness and ruggedness were calculated using the ArcGIS Benthic Terrain Modeler (Wright et al., 2012; Walbridge et al., 2018), whereas SAGA (Conrad et al., 2015) was used to generate channel network base level, channel network distance, valley depth, relative slope position, LS-factor, positive and negative openness and the wind exposition index, following Kenchington et al. (2019a). (See Supplementary Text 2.1 for further explanation of those terrain predictors.) Data on the physical-oceanographic predictors were drawn from the Bedford Institute of Oceanography North Atlantic Model (BNAM: Wang et al., 2018), an eddy resolving model of the North Atlantic based on Nucleus for European Modelling of the Ocean (NEMO) 2.3, with a nominal resolution of 1/12° (approximately 6 by 9 km in the study area). BNAM allows for a maximum of 50 depth layers, while a partial cell is introduced for the bottom layer, improving its representation. Biological and physical oceanographic variables (Supplementary Table 2) were spatially interpolated across the study area using ordinary kriging in ArcMap 10.2.2 software (ESRI, 2011) to create continuous data surfaces with a ~1 km grid size (more details in Beazley et al., 2017).
Biochemical variables, such as oxygen or nutrient concentrations, were not used because of very poor spatial coverage of the underlying source point data in the study area (Beazley et al., 2017). Other variables, such as depth, were considered but, following the approached of Beazley et al. (2018), were screened out because of high correlations with more biologically relevant alternatives. Amongst the original 35 predictors, bottom temperature range proved to be highly correlated with channel network base level and hence was excluded.
Long-term averages were used to reflect conditions across the lifespan of Paragorgia spp. The reference period for the physical-oceanographic predictors was 1990–2015. Data availability constrained the periods for other variables. For the biological oceanographic predictors, it was 2002–2012, except that primary-production data were only available from 2006–2010. The reference period for the fishing-effort predictor was 2005–2014. It included only effort using mobile, bottom-tending gears.
The resulting 47 environmental layers were displayed in raster format with geographic coordinates using a WGS 1984 datum and had a cell size ~0.012° cell size (approximately equal to 1 km horizontal resolution). In addition, summary statistics (mean ± standard deviation) were created for each variable, based on their value in each of the 115 grid cells with confirmed P. arborea presence.
2.2.3.2 Data for Climate Change Projections
Modeling of the distribution of P. arborea under alternative climate scenarios (Supplementary Table 1) was restricted by data availability to the subset of the dynamic environmental variables used by Beazley et al. (2021b). These were mean temperatures, salinities and current speeds for both surface and seabed, plus mean maximum mixed-layer depth and seabed slope (data available at Beazley et al., 2021c). Most of the temporally invariant terrain variables were excluded as uninformative for projection purposes. Slope (Supplementary Text 2.1) was retained as it is expected to interact with bottom currents, has been shown to be very important in explaining the distribution of Paragorgia (Bryan and Metaxas, 2007; Sundahl et al., 2020), and as a static variable, it is expected to improve model predictive ability (Stanton et al., 2012).
Maximum mixed layer depth (MLD), the depth at which surface vertical mixing dissipates, is a near universal feature of the open ocean (de Boyer Montégut et al., 2004). Within this mixed layer, salinity, temperature, or density are nearly uniform, a phenomenon caused by surface forcing, lateral advection, and internal wave processes that vary on diurnal, intra-seasonal, seasonal, and inter-annual scales (de Boyer Montégut et al., 2004). The depth of this mixed zone can show large spatial variability, ranging from less than 20 m in the summer, to more than 500 m in the winter at subpolar latitudes (de Boyer Montégut et al., 2004). The MLD has a significant influence on primary production in the surface waters. As MLD increases it entrains nutrients from deeper waters below, supplying additional nutrients for primary production (Polovina et al., 1995; Carstensen et al., 2002). As data for the primary production variables used in the contemporary analyses were not available for assessing climate projections, MLD was used as a proxy variable.
A version of BNAM was developed (Brickman et al., 2016) to simulate climatology for 2046−2065, under IPCC (2013) RCP 4.5, an emission-stabilizing scenario, and RCP 8.5, a high-emission scenario in which radiative forcing increases through to 2100 (Moss et al., 2010; van Vuuren et al., 2011). Averaged annual anomalies for each of the dynamic variables noted above, representing the difference between present-day and future conditions, were extracted from those BNAM simulations and applied to the averaged contemporary climatology layers.
2.2.3.3 Environmental Variables Use in Previously Published Basin-Scale Study
Following collinearity analyses, Morato et al. (2020) used five variables (slope, BPI, particulate organic carbon (POC) flux to the seabed, seabed temperature and calcite saturation state) in their species distribution models for P. arborea at a cell size resolution of 3 × 3 km. To explore differences between basin-scale and regional models of P. arborea distribution, the same five variables were obtained for analyses in this study. Three of their variables had been made public through the PANGAEA data publisher portal (https://doi.org/10.1594/PANGAEA.911117), that is, POC flux, seabed temperature and calcite saturation state. Basin-scale rasters of BPI and depth were obtained directly from Drs. T. Morato and J.-M. González-Irusta, and slope was generated from their depth raster. Variables were available for both contemporary and 2100 RCP 8.5 climates. The five variables were subsequently masked to the spatial extent of the study area and rescaled to match our cell size resolution.
2.2.4 Model Performance
Model performance was assessed through three approaches: 1) 10-fold random cross-validation, 2) 5-fold spatial block cross-validation (recommended for spatially autocorrelated data: Roberts et al., 2017), and 3) evaluation of the accuracy of model predictions using data not used in model calibration (Liu et al., 2020). The spatial cross-validation was calculated with the ‘spatialBlock’ and ‘spatialAutoRange’ functions in the R package ‘blockCV’ (Valavi et al., 2019), with three measures of accuracy: sensitivity (the proportion of accurately predicted presences), specificity (the proportion of accurately predicted absences), and Area under the Receiver Operating Characteristic Curve (AUC). Sensitivity and specificity were derived by summing the predicted outcomes across the 2 × 2 confusion matrices generated for each of the model cross-validation runs, whereas AUC was calculated for each cross-validation run. The True Skill Statistic (TSS) was determined from sensitivity and specificity. From those measures, the overall accuracy of the model prediction in geographic space was considered to be good when AUC > 0.9 and TSS > 0.6 (Landis and Koch, 1977; Jones et al., 2010).
Because the response dataset for P. arborea has a high number of absences relative to presences, a threshold based on species prevalence was used to define which class probability was considered a presence when converting them into binary predicted outcomes, that were then summarized in the 2 × 2 confusion matrices. That approach has been shown to produce constant error rates and optimal model accuracy measures compared to alternatives (Liu et al., 2005; Hanberry and He, 2013). The AUC is considered threshold-independent (Fawcett, 2006).
For the GAMs, Pearson residuals were plotted against both the fitted values and each covariate included in the model, and the spatial autocorrelation of those residuals assessed. The most parsimonious GAM was selected, following the Akaike information criterion (AIC).
2.2.5 Identification of Non-Analogous Environments
In common with other tree-based models, the reliability of predictions from RF modeling rapidly decreases in areas of extrapolation outside of the domain of the environmental predictors (Liu et al., 2020), though the emergence of non-analogous environments is highly informative, both for evaluating the reliability of models of present-day distributions and for interpreting climate projections (Mahony et al., 2017). The Extrapolation Detection (ExDet) tool, based on Euclidean and Mahalanobis distances was used, as implemented in the ‘dsmextra’ R package (Bouchet et al., 2020), to characterize both univariate and combinatorial extrapolation of the environmental data sets used here (Mesgaran et al., 2014), and also to assess the transferability of the model projections (Yates et al., 2018). Cells with non-analogous environments are novel because they are outside the range of individual covariates (univariate) or they are within the univariate range but constitute novel combinations between covariates not found in the reference data set (see Figure 2 in Mesgaran et al., 2014). Cells that are both outside the univariate range and forming novel combinations are included in the former. In univariate extrapolation if more than one variable lies outside of the range, the covariate that has the greatest univariate distance is identified as the most influential covariate for the cell. Identification of covariates contributing most to the new combinatorial environments is made by quantifying the covariate that when omitted (while retaining all others) makes the largest reduction in the Mahalanobis distance to the centroid of the reference data (Bouchet et al., 2020). The number of cells and their percentage are tabulated for each type of environment (analogous, non-analogous (univariate, combinatorial)) and the most influential covariate in each of the non-analogous classes identified. Extrapolation diagnostics in the ‘dsmextra’ package include maps of ‘% Nearby’ (the percentage of data nearby) which draw on Gower’s distance to calculate the proportion of reference data lying within a given radius of any prediction point in the multivariate environmental space (Bouchet et al., 2020). Following Mannocci et al. (2018) the neighbourhood for % Nearby was defined as a radius of one geometric mean Gower’s distance.
These extrapolation diagnostics were applied using two types of response data for determining environmental envelopes: 1) presence and absence data (N=3154); 2) presence-only data (N=115). Presence and absence data were used to identify areas of extrapolation in the RF and GAM species distribution models under present-day and future climate conditions (Supplementary Table 1), and to inform variable elimination in RF models (Mannocci et al., 2018). The presence-only data was used to identify climate refugia (see Section 2.2.5.1).
The same diagnostics were applied to the variables used by Morato et al. (2020) at both the basin- and regional-scales under present-day and future (2100; RCP 8.5) environmental conditions to explore the reasons for differences in model outputs between the basin-scale study and the regional-scale study presented herein (Supplementary Table 1).
2.2.5.1 Identification of Climate Refugia
The extrapolation diagnostics were also applied to the 8 environmental covariates in the 115 grid cells containing P. arborea, to conservatively characterize their present-day environments. The outcome was used to identify which of those cells are expected to still experience similar conditions under the RCP 4.5 2046−2065 climate projections and that, therefore, represent climate refugia for P. arborea. Grid cells having projected future environmental conditions analogous to those currently experienced in occupied grid cells anywhere in the study area were identified, but also, and separately, those expected to have conditions similar to current ones either east or west of 60°W.
2.3 Lagrangian Particle Tracking
Three-dimensional passive-particle tracking experiments (Supplementary Tables 1, 3 and 4), extending across the study area and surrounding region, were prepared using the Parcels framework version 2.2 (Lange and van Sebille, 2017; Delandmeter and van Sebille, 2019) with current velocities extracted from the BNAM ocean model (Wang et al., 2018; see Supplementary Text 2.2 for the selection of the ocean model). For the principal experiments, the LPT models were run in forward-tracking mode.
The spawning season for Paragorgia spp. is unknown (see literature review of relevant biological traits for LPT modeling of gorgonian corals in Kenchington et al., 2019b). Hence, experiments were performed using monthly-averaged currents within each of: Winter (January, February, March); Spring (April, May, June); Summer (July, August, September); Autumn (October, November, December), extending the examination of seasonality in LPT models for P. arborea reported in Metaxas et al. (2019) to include the autumn period.
Pelagic larval duration (PLD) is also unknown for Paragorgia spp. (Kenchington et al., 2019b). Experiments were therefore run for 2 weeks, 1 month and 3 months (Wang et al., 2020) to encompass all likely durations. Hilario et al. (2015) report a range of maximum PLD for five alcyonacean corals, including one gorgonian species, of 7 to 90 days, consistent with this selection of time frames. Metaxas et al. (2019) chose an intermediate 60 day PLD for their hindcast LPT models of P. arborea. Modeled particles were released from the seafloor to mimic natural release depth. However, as larval vertical migration, buoyancy and swimming ability are unknown for Paragorgia spp., particles were also released in mid-water and at the surface, to represent active vertical ascent from seabed release.
Random horizontal particle movement was modeled by a horizontal diffusivity constant, Kh, based on Okubo’s (1971) 4/3 power law relationship:
where Kα and l are in units of cm2 s-1 and cm, respectively. l, the scale of diffusion, depends on the spatial resolution of the ocean model. For BNAM on the Scotian Shelf:
In each experiment, model particles were seeded in 23 ‘source boxes’, each 0.1° × 0.1° in extent, with some of them selected within the known or predicted distributions of P. arborea, and others positioned where needed to examine various connectivity hypotheses (Figure 3 and Supplementary Table 4). Source Boxes 1, 3, 4, 10, 11, and 13 and 14, were placed in, respectively, the Jordan Basin, Corsair and Georges Canyons, and Northeast Channel Coral Conservation Areas, the Gully MPA, the Lophelia Coral Conservation Area, and the St. Anns Bank MPA. In each model day, 121 particles were released in each source box, seeded uniformly across its area. Each seasonal model had 90 daily releases for a total of 10,890 particles per source box. Following Le Corre et al. (2020), the proportion of particles passing over or terminating in another source box was presented as a connectivity matrix for each model run. Shading on the major diagonal of the matrices was separately calculated and indicates the proportion of particles in the source box at the end of the PLD.
In addition to the principal experiments, potential source populations outside the eastern boundary of the study area were investigated through additional simulations, run in hindcast mode from single particle releases in each of Source Boxes 11, 13 and 14. Those used only monthly-averaged water movements for the spring season.
To examine inter-annual variability in connectivity, two individual years were selected, and the modeling repeated for each, for comparison of outputs with those generated from 1990–2015 averages (Supplementary Table 3). The selected years, 1993 and 2015, were chosen for their expression of particular features (Wang et al., 2021): 1993 fell during a period when the winter North Atlantic Oscillation (NAO) index was high and the influence of the Atlantic Meridional Overturning Circulation (AMOC) strong; 2015 saw high values of the winter NAO index, and the AMOC was weaker than in 1993.
3 Results
3.1 Regional-Scale Modeling of Contemporary Distributions
3.1.1 Representations of Contemporary Distribution
All RF models achieved ‘good’ performance by the AUC and TSS criteria. In the RF model with all 47 environmental predictors, sensitivity and specificity were 0.99 and 0.95 respectively (TSS = 0.94), and the AUC was 0.99 ± 0.02 (SD). The high sensitivity indicates that the mean values of each of the 47 predictor variables in the 115 grid cells where P. arborea presence has been confirmed (Supplementary Table 5) provide a good description of the species’ habitat within the study area (Supplementary Figure 2). The seven most influential of them, in terms of mean decrease in Gini value, concerned terrain morphology (Supplementary Figures 3, 4). They were followed by maximum surface temperature and minimum bottom salinity, then an array of lesser variables.
The most important variable in the model was ruggedness, a measure of bathymetric complexity in a rectangle of approximately 46 km2 around each point for which it was quantified, the probability of presence of P. arborea increasing rapidly with even small positive values. Ruggedness was high in the canyon areas along the continental slope (Supplementary Text 2.1). It was followed by positive topographic openness, for which higher probabilities of presence were associated with values of openness < 1.50, representing upward slopes of at least 15° from the quantified point, hence such topographies as gully bottoms or walls. The probability of presence was likewise high where negative topographic openness was < 1.50, meaning where there were downward slopes of at least 15°, hence on ridges and steep slopes. Both openness indices indicated very low probability of presence on extensive horizontal seabeds. Higher probabilities of presence were also associated with slopes of > 5°, with longer and steeper gradients, and in valleys with depths (below adjacent ridges) of > 200 m (Supplementary Text 2.1).
The RF model with 47 predictors produced a high probability of presence across a broad swath, extrapolated across the continental rise and abyssal plain (Supplementary Figures 2A, B). Extrapolation diagnostics showed that the area of univariate extrapolation was 49.78%, while combinatorial extrapolation was only 0.01%, indicating that nearly half of the spatial extent fell outside the range of one of the covariates found in the reference data. The area of that extrapolation was largest over the deeper water, and in an area along the coast off southwest Nova Scotia (Supplementary Figure 2). Channel network base level and the water column covariates contributed most to the extrapolation extent, with the first, the most important covariate in 34% of the cells with non-analogue conditions, followed by maximum surface temperature in 11%. The alternative RF model (Figure 4), using only the top 6 environmental prediction layers, reduced the area of extrapolation to 0.31% of the cells, leaving analogous conditions over 99.69% of the spatial extent, indicating that the input data for the RF models sampled the range of terrain predictors found in the study area. Model performance was only slightly reduced: sensitivity and specificity were each 0.90 (TSS = 0.80), and the AUC was 0.96 ± 0.02 (SD). The order of importance of the variables was the same, except for LS-factor taking second importance over positive topographic openness, which fell to third position. The elimination of variables contributing to the extrapolation prior to running the alternative RF models allowed for reliable predictions in deeper parts of the study area, revealing extensive unsuitable habitat, likely mischaracterized by the extrapolation in the model with 47 variables.
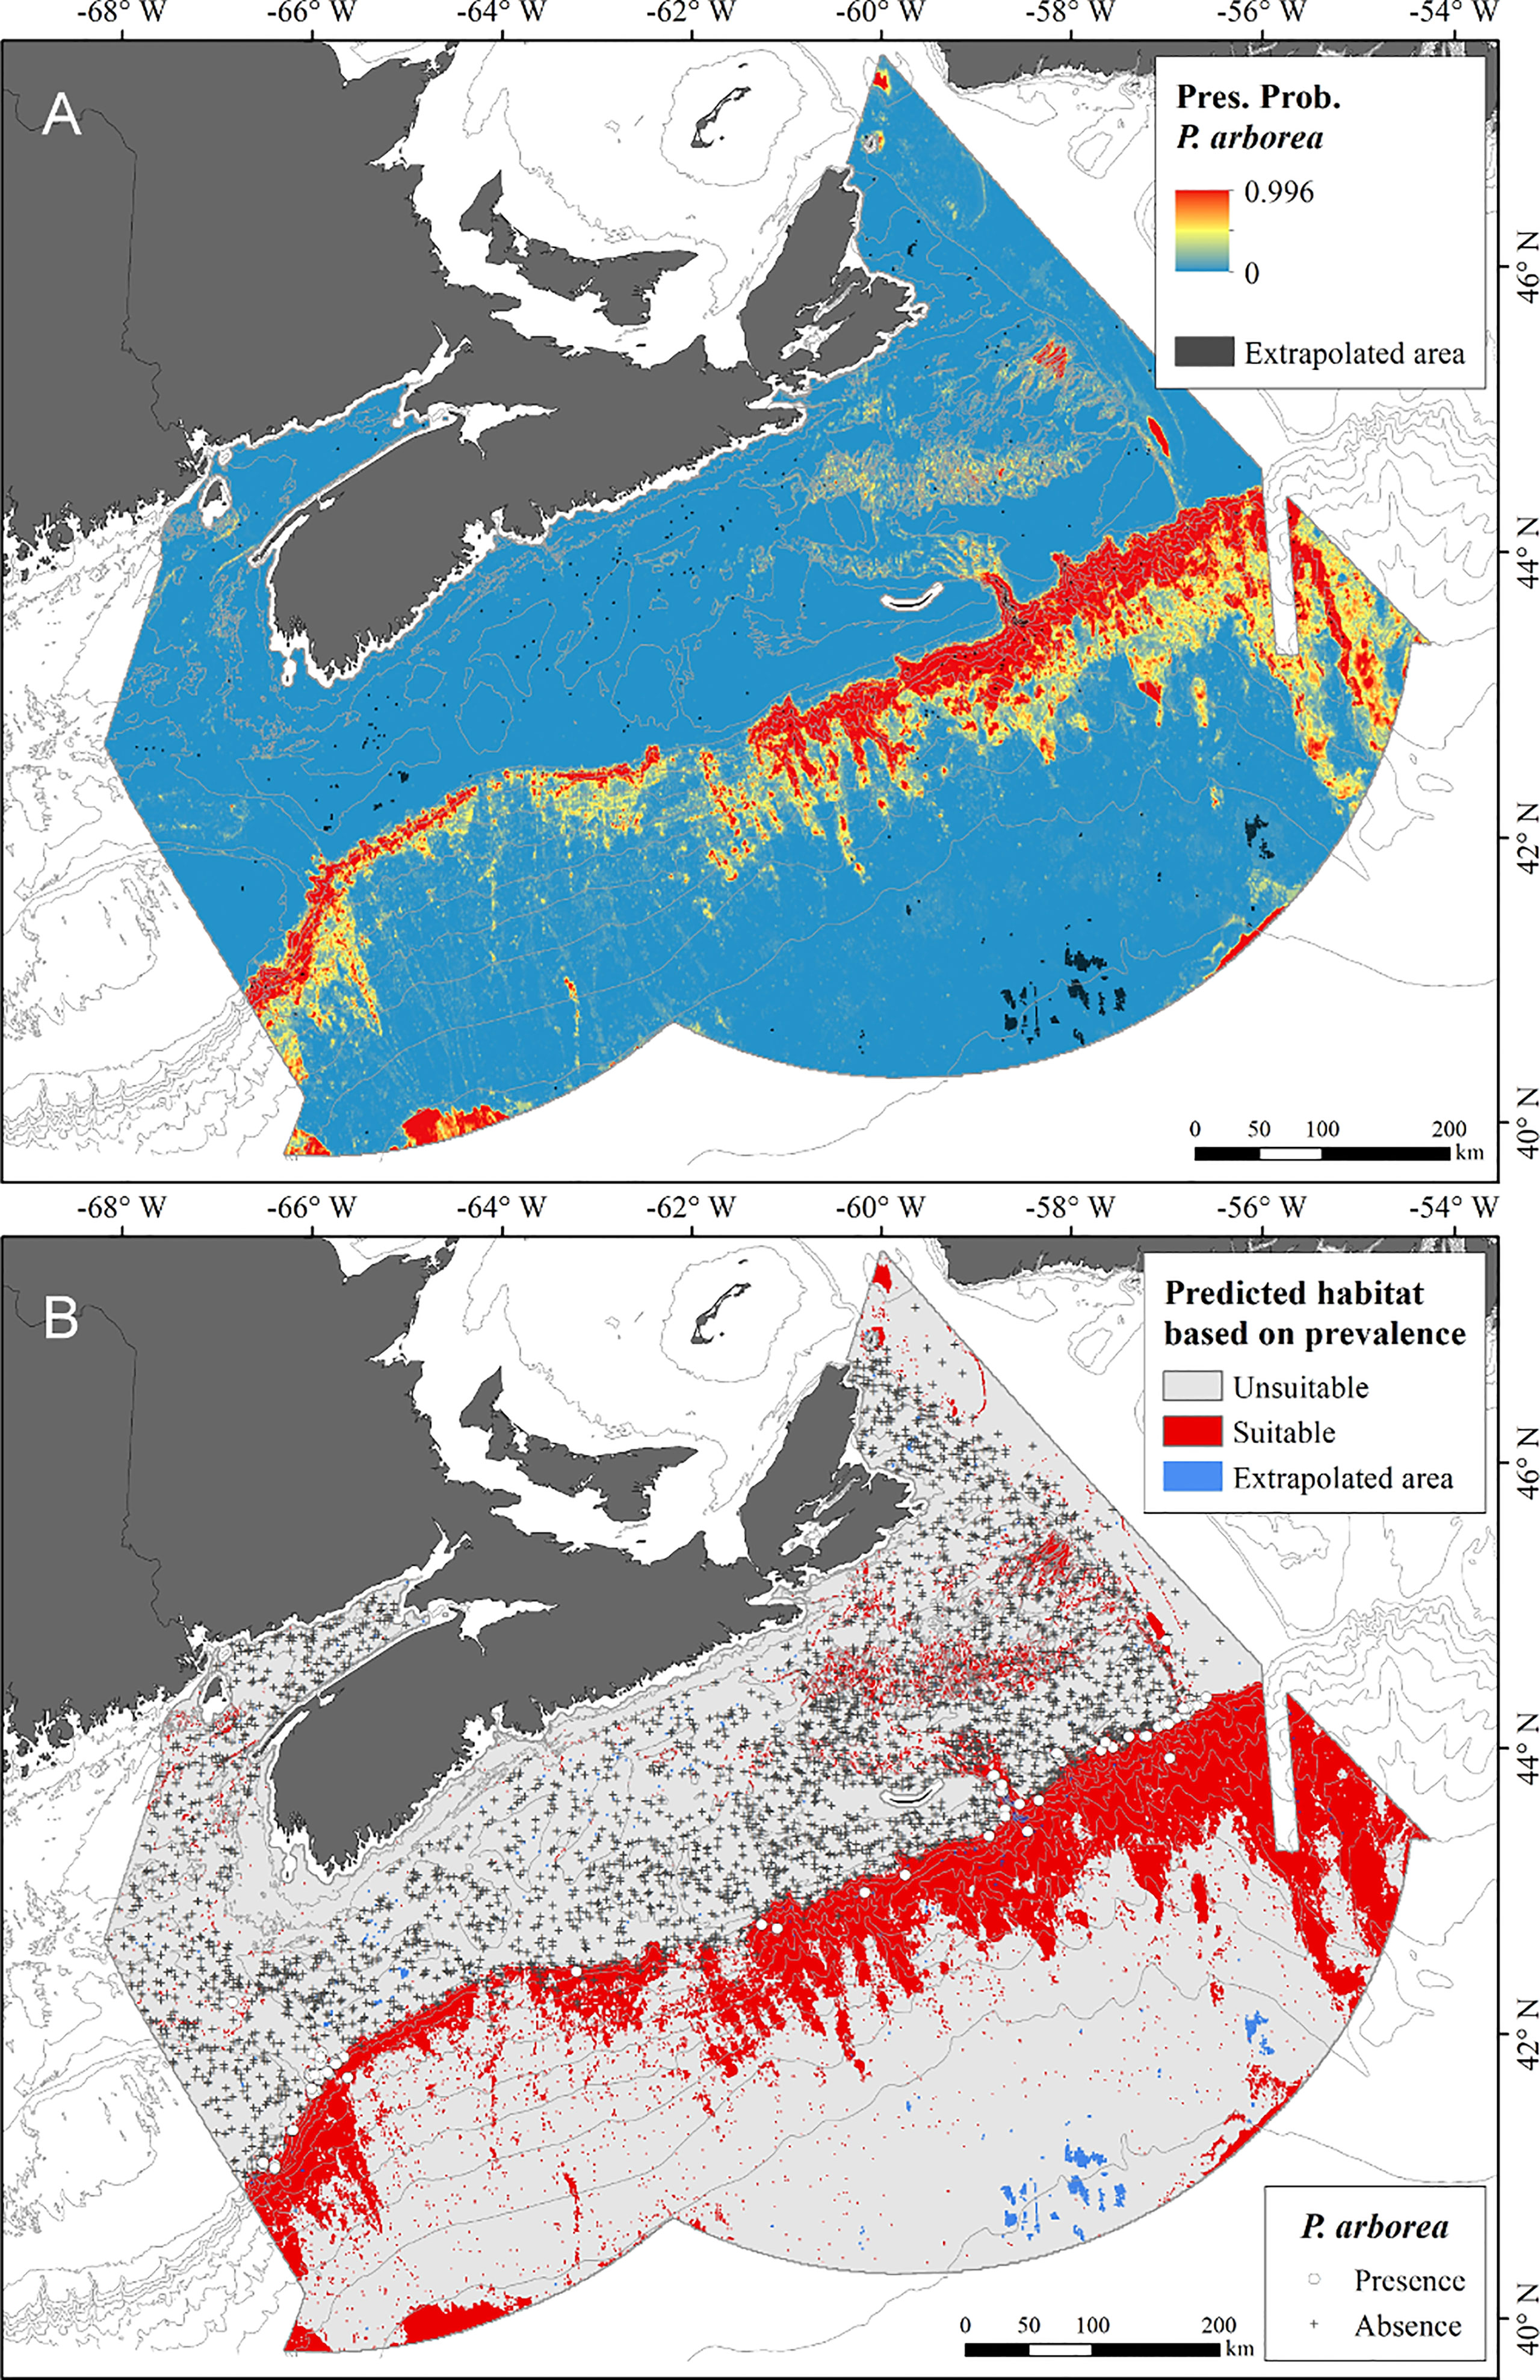
Figure 4 (A) Probability of occurrence of Paragorgia arborea under present-day conditions, based on RF model constructed using 6 terrain predictors; (B) Predicted distribution of suitable and unsuitable habitat following a prevalence threshold of 0.036, overlain with locations of presence and absence response data. (Note: the combined shadings indicating extrapolated areas of predicted suitable habitat appear dark red.).
3.1.2 Contemporary Distribution for Comparison With Climate Projections
The RF model for present-day conditions built on the 8 environmental predictors available for the era of projected climate (Figure 5) had sensitivity and specificity using 10-fold cross-validation of 0.97 and 0.90 respectively (TSS = 0.88), while AUC was 0.98 ± 0.01 (SD), indicating good model performance. Similar values were obtained using 5-fold spatial blocking possibly indicating that either a dependence structure was not a prominent feature of the data or that the algorithm was able to cope with that structure (Supplementary Table 6). Slope, mean surface temperature and mean bottom salinity were the top three most important variables influencing the model (Supplementary Figure 5).
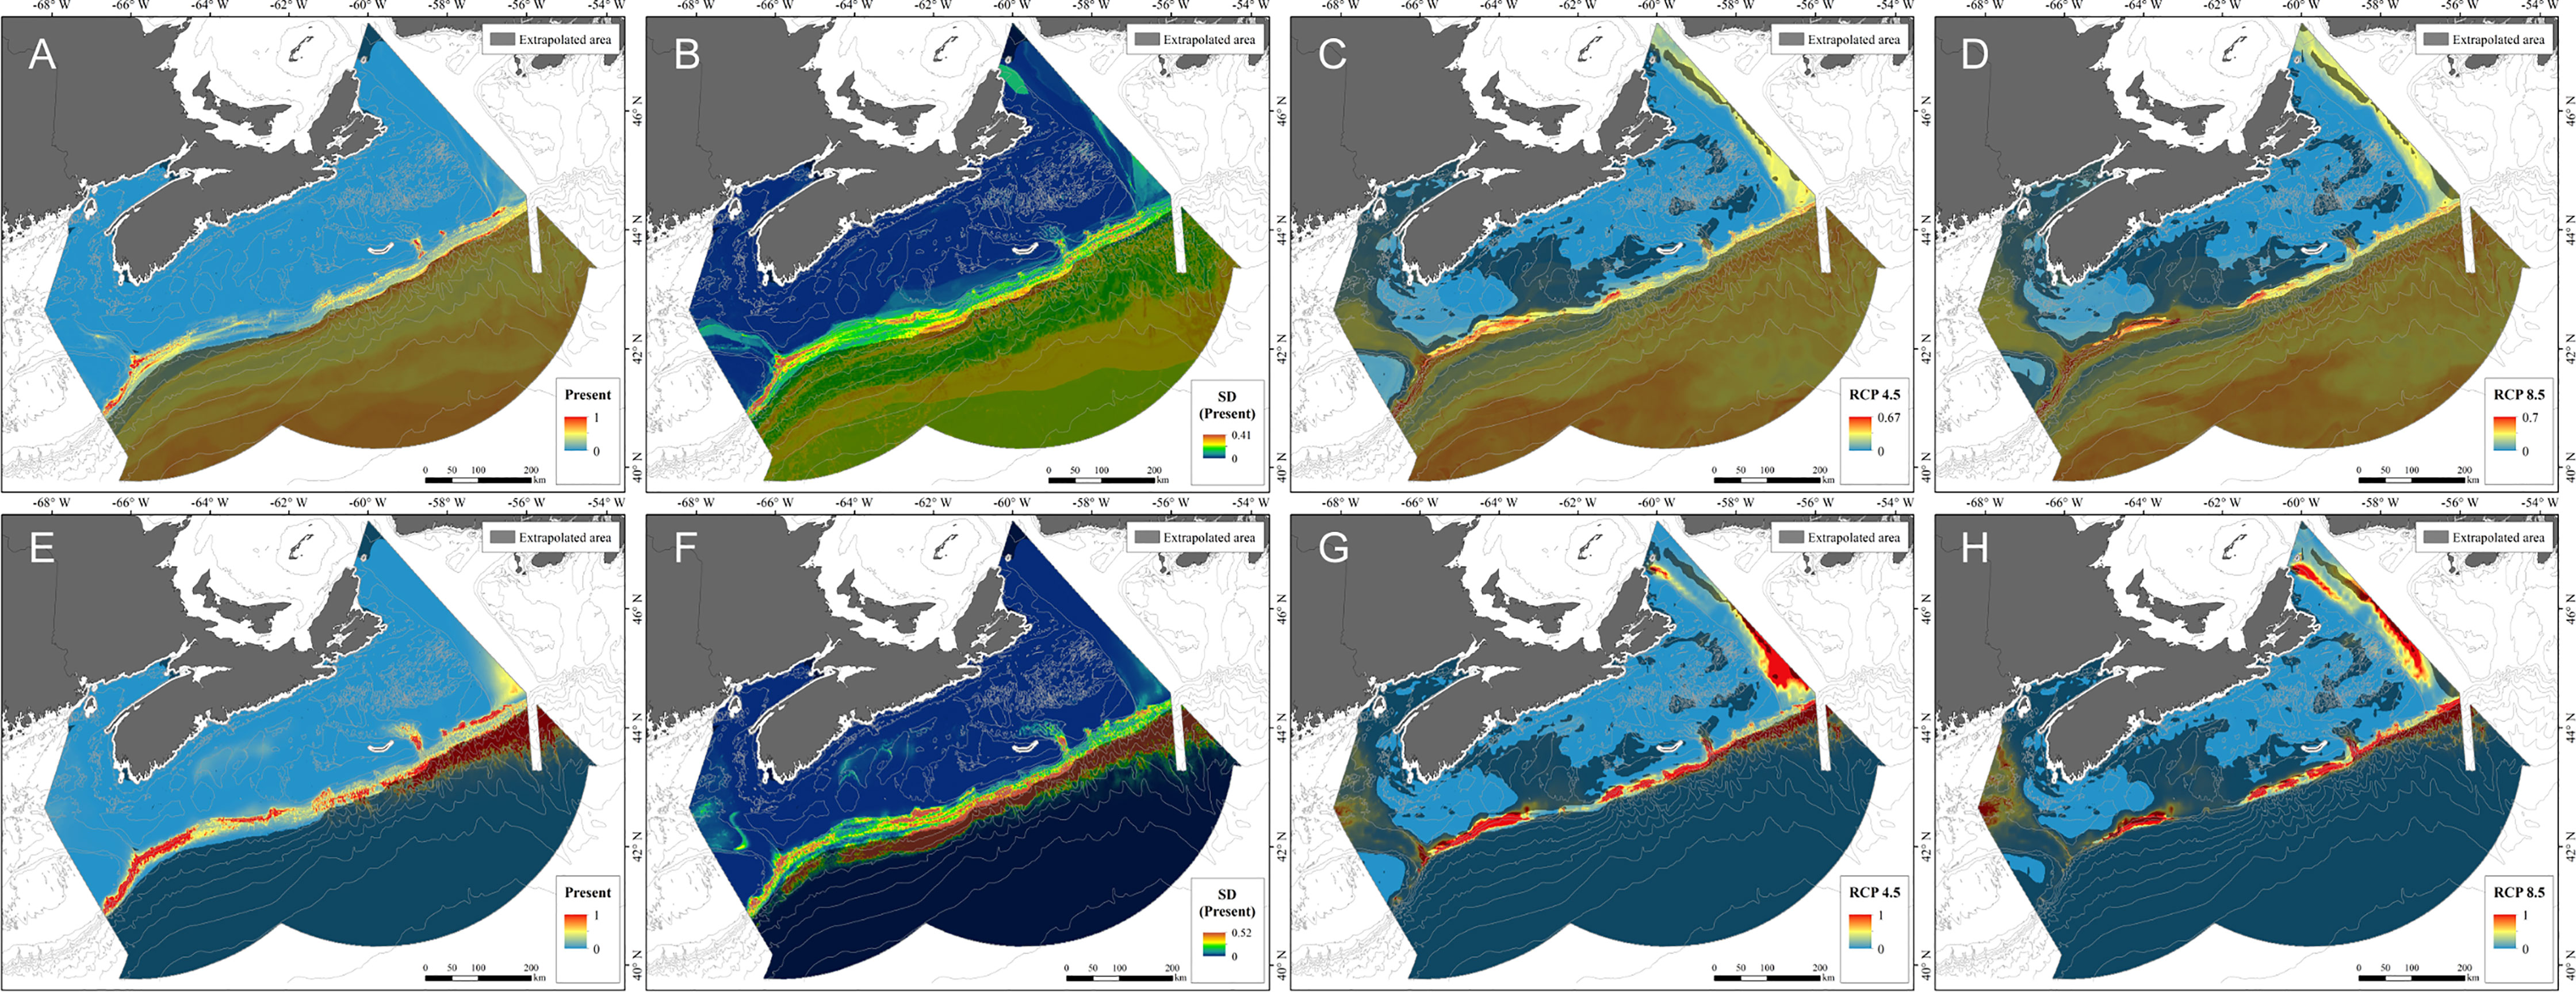
Figure 5 Probability of occurrence of Paragorgia arborea from RF models (A–D) and GAMs (E–H) under present-day (A, E), RCP 4.5 (C, G) and RCP 8.5 (D, H), as predicted by models constructed using 8 environmental predictors, with model uncertainty for present-day predictions (B, F) generated from the standard deviation created from 5-fold spatial block cross-validation. Areas of model extrapolation are shown on each map as a transparent overlay and were created using both presence and absence data.
A GAM fit to the same suite of 8 environmental predictors (Supplementary Figure 6), explained 39% of the variability in the data (Table 1). The most parsimonious GAM included only five variables, with slope and mean surface temperature the most important. Cross-validation using 5-fold spatial blocking with random assignment of blocks into folds showed poor sensitivity compared with other accuracy measures indicating a poorer ability to correctly predict presence records (Supplementary Table 6). Specificity was high indicating that a higher proportion of absence records were correctly predicted but TSS was poor and together with the lower AUC indicated non-independence of hold-out data from the training data and suggested that the GAMs were not as reliable as the AUC indicated. However the spatial blocks appear to have introduced extrapolated conditions between cross-validation folds, causing predictions for the hold-out data to be outside the range of data in the training folds causing the poor sensitivity (Roberts et al., 2017).
The functional response curves for environmental variables in the RF and GAM models (Figure 6) show very similar predictive relationships for the variables they had in common, explained by the general similarity of their predicted distributions under present-day conditions (Figure 5A, E). The bimodal distribution of some of the variables was verified to be explained by spatial differences in environmental conditions. RF and GAMs each identified areas of high probability of P. arborea presence along the Scotian Slope and in the Northeast Channel, associated with high standard deviations in that probability (Figure 5A, B, E, F). Analogous environmental conditions were found over most of these areas (Figure 7A) and in 51.56% of the full study area (Table 2), associated with high percentages of proximate data (Figure 7C). In contrast to the RF model using 47 predictors, the extent of extrapolation could not be mitigated through variable elimination, as most of the available predictors were water-column variables – appropriately so for climate projections – which if removed would nullify the analysis. Instead we relied on spatial mapping to identify areas of extrapolation. Binary classification of habitat predictions based on prevalence showed that the RF model likely wrongly predicted extensive areas of suitable habitat in the areas of extrapolation over deep water (Supplementary Figure 7A), where those predictions were associated with high standard deviations (Figure 5B), while the GAM was able to classify most of the deep-water area as unsuitable (Supplementary Figure 7D), with low standard deviations in probability of presence (Figure 4F). In the deep-water extrapolated area, mixed layer depth, and to the west, mean surface temperature contributed most to the extrapolation (Table 2). Along the shallow boundary of the extrapolated area, on the upper continental slope where predicted presence was high (Figures 5A, D), mean surface and bottom salinity and mean bottom currents contributed the most to the extrapolation (Table 2 and Figure 7E).
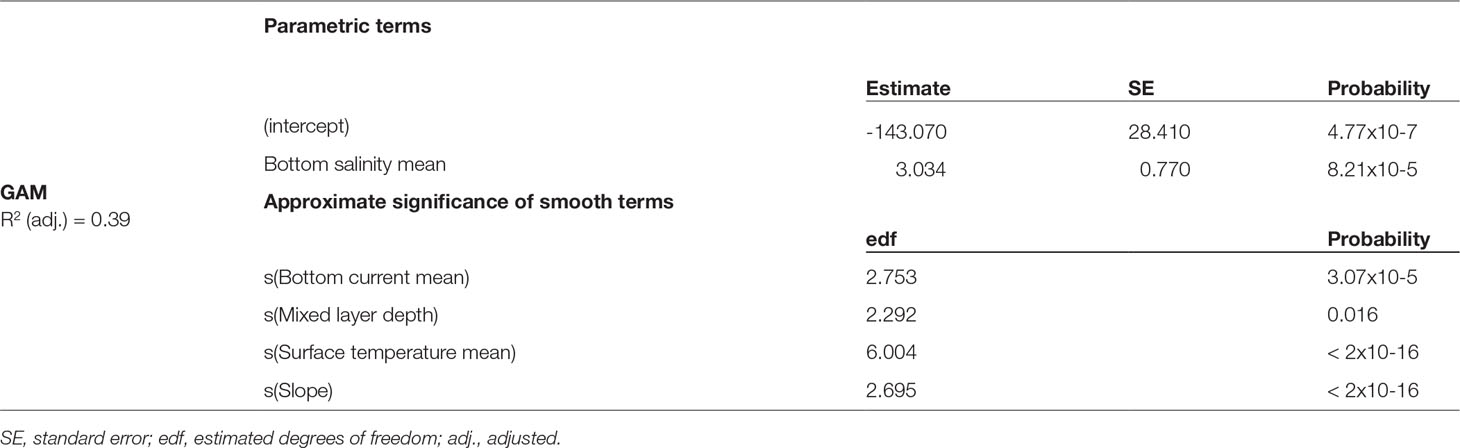
Table 1 Parametric coefficients and approximate probability of smooth terms in the GAMs. SE, standard error; edf, estimated degrees of freedom; adj., adjusted.
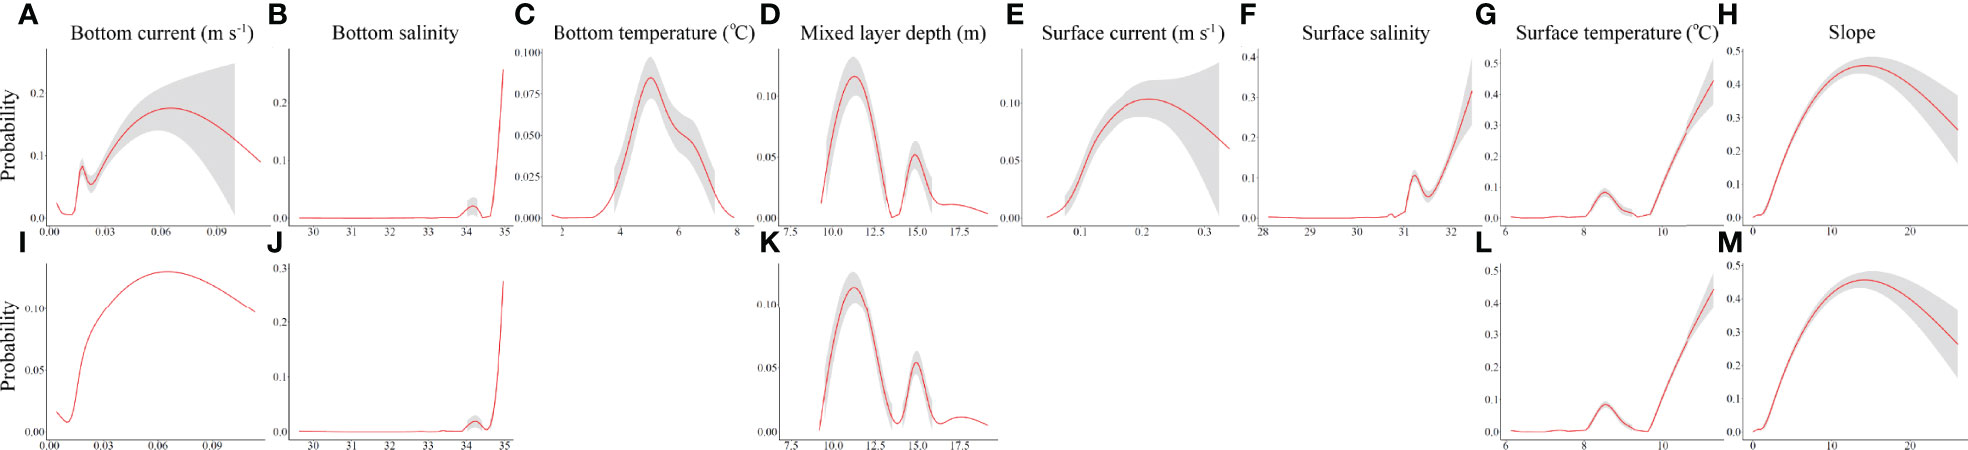
Figure 6 Functional response curves for RF models (A–H) and GAMs (I–M) constructed using 8 environmental predictors, under present-day conditions. (Three predictors not included in the GAMs are left blank). Shaded regions represent approximate 95% confidence intervals. All curves and confidence intervals were bounded at zero probability. (MLD, mixed layer depth. Units are as in Supplementary Table 2).
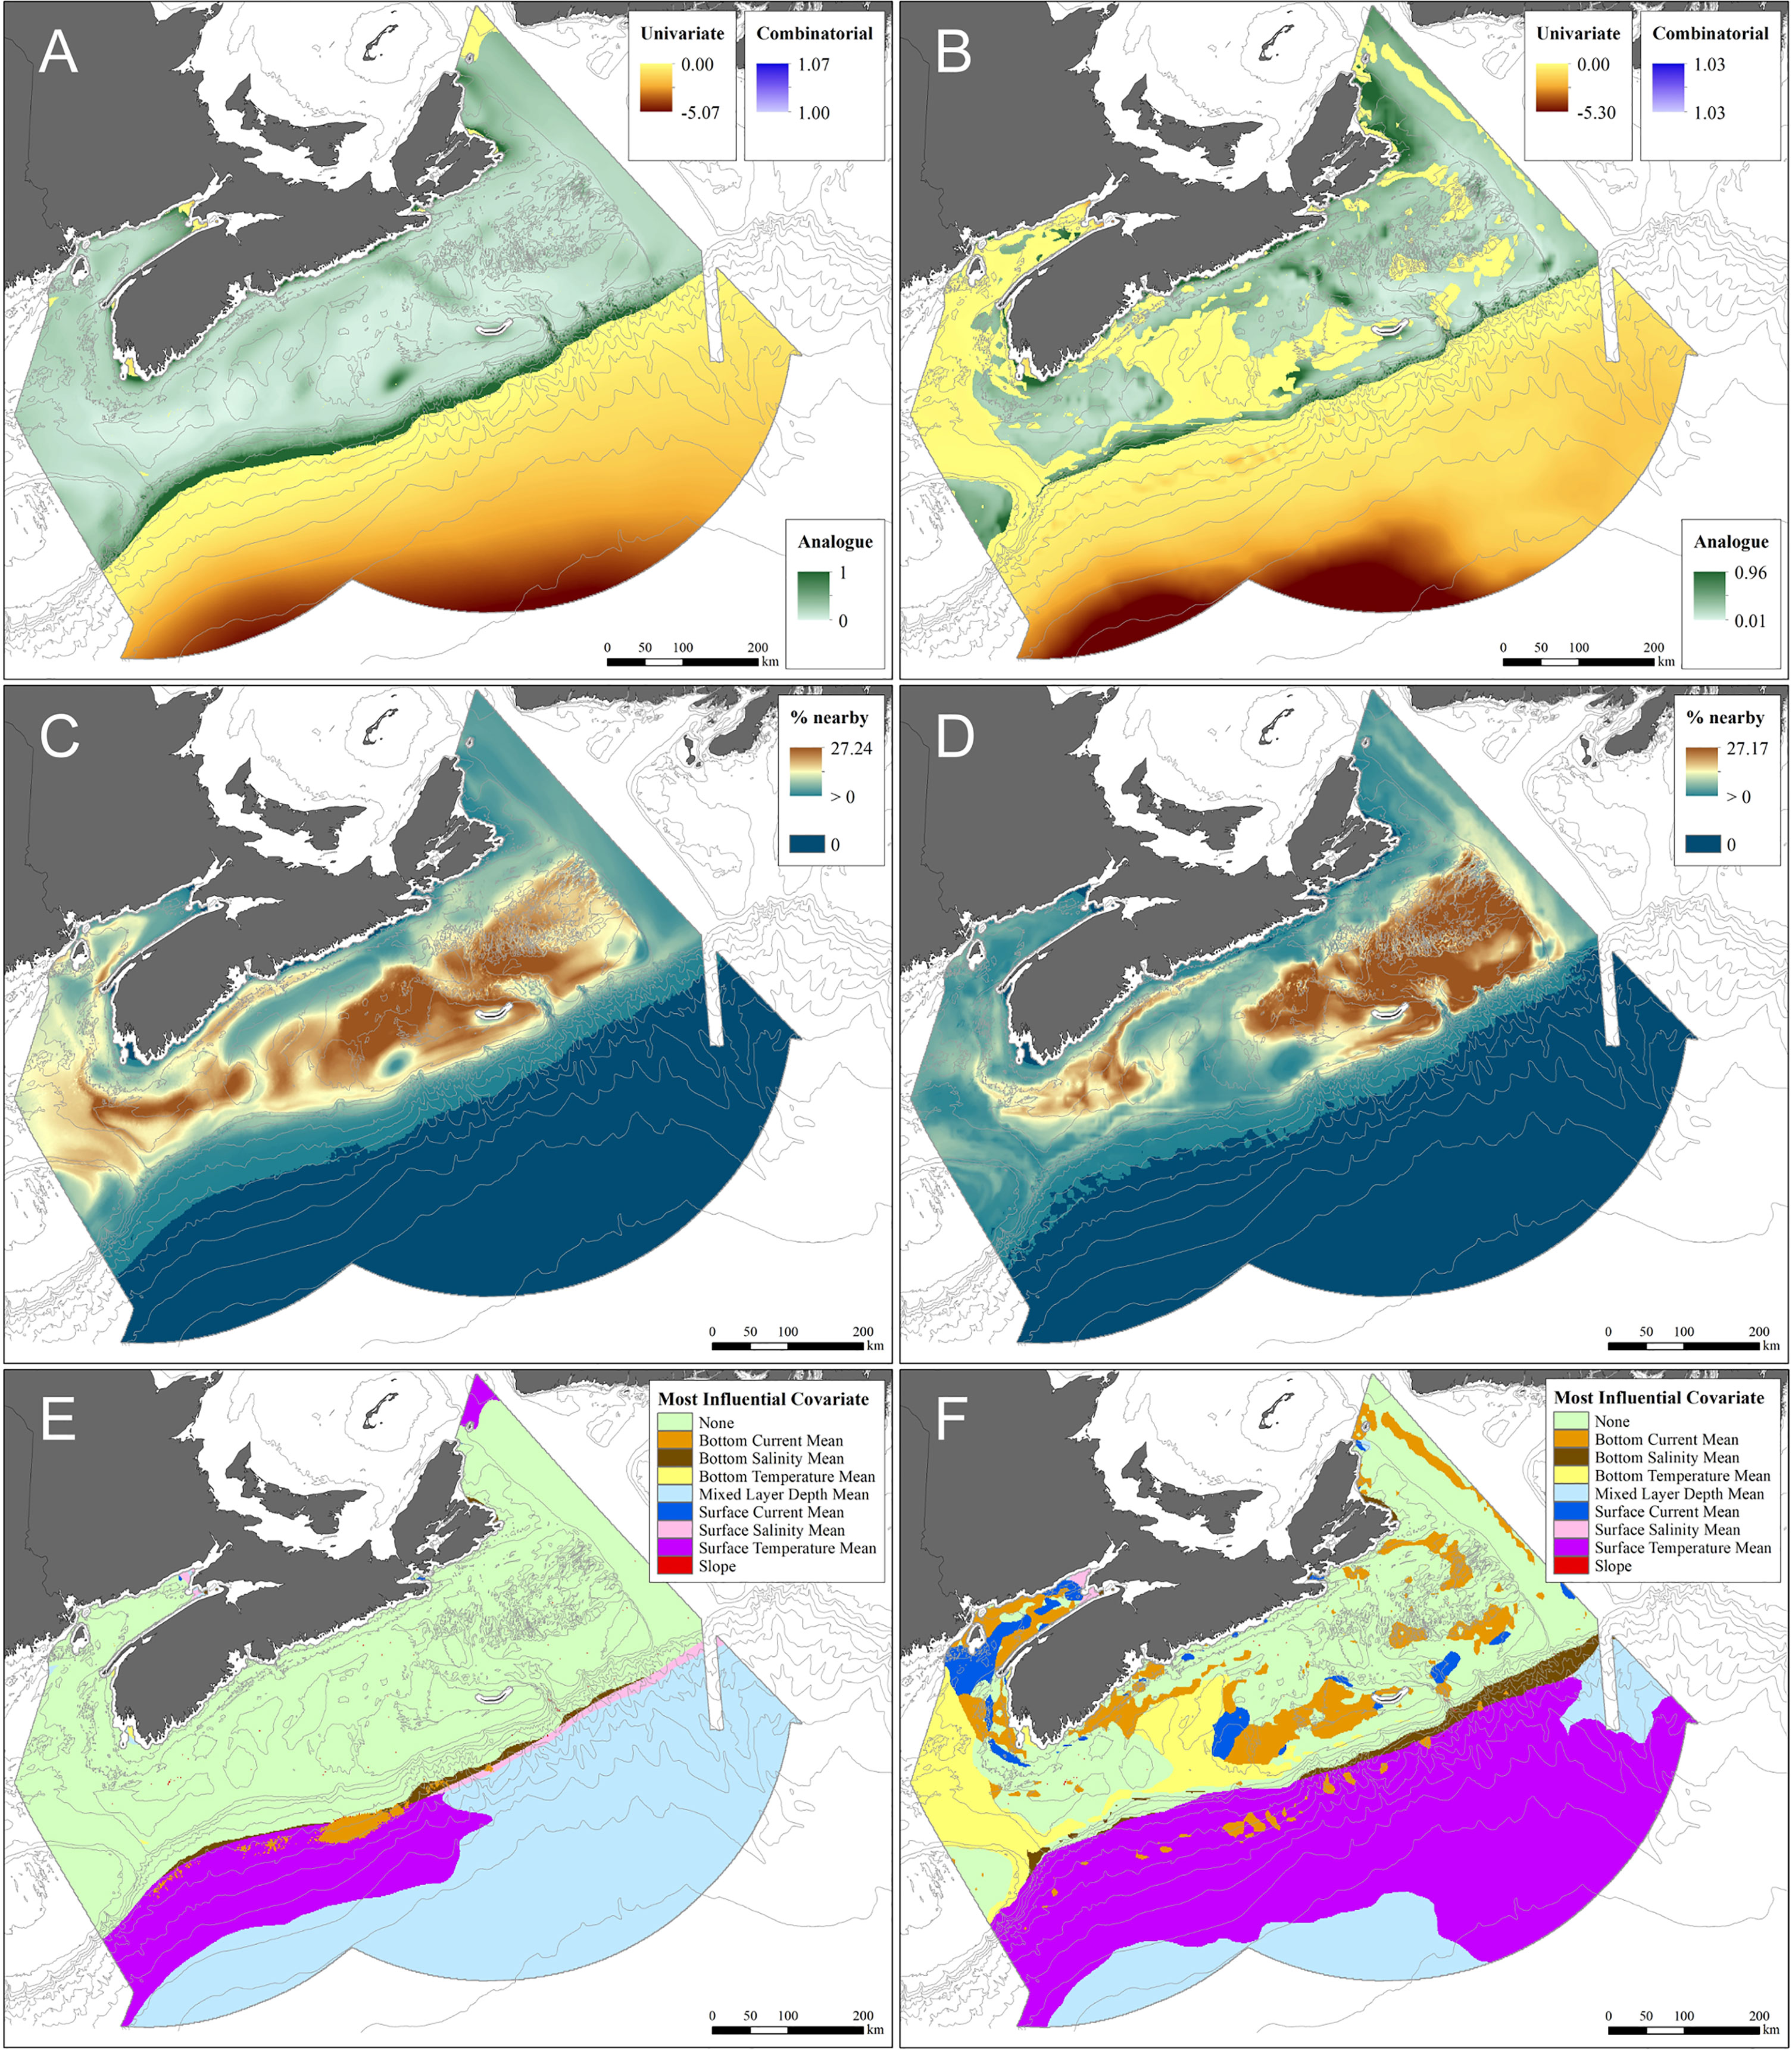
Figure 7 Areas of extrapolation defined by eight input covariates under present-day (A, C, E) and 2046–2065 RCP 4.5 (B, D, F) conditions, using both presence and absence data. (A, B) Extrapolation quantified by the Extrapolation Detection tool (ExDet); (C, D) Percentage of data nearby (% Nearby), with areas where predictions are potentially unreliable shaded in dark blue; (E, F) Areas of extrapolation identified by their most influential covariate. (Areas with analogous conditions are shaded light green).
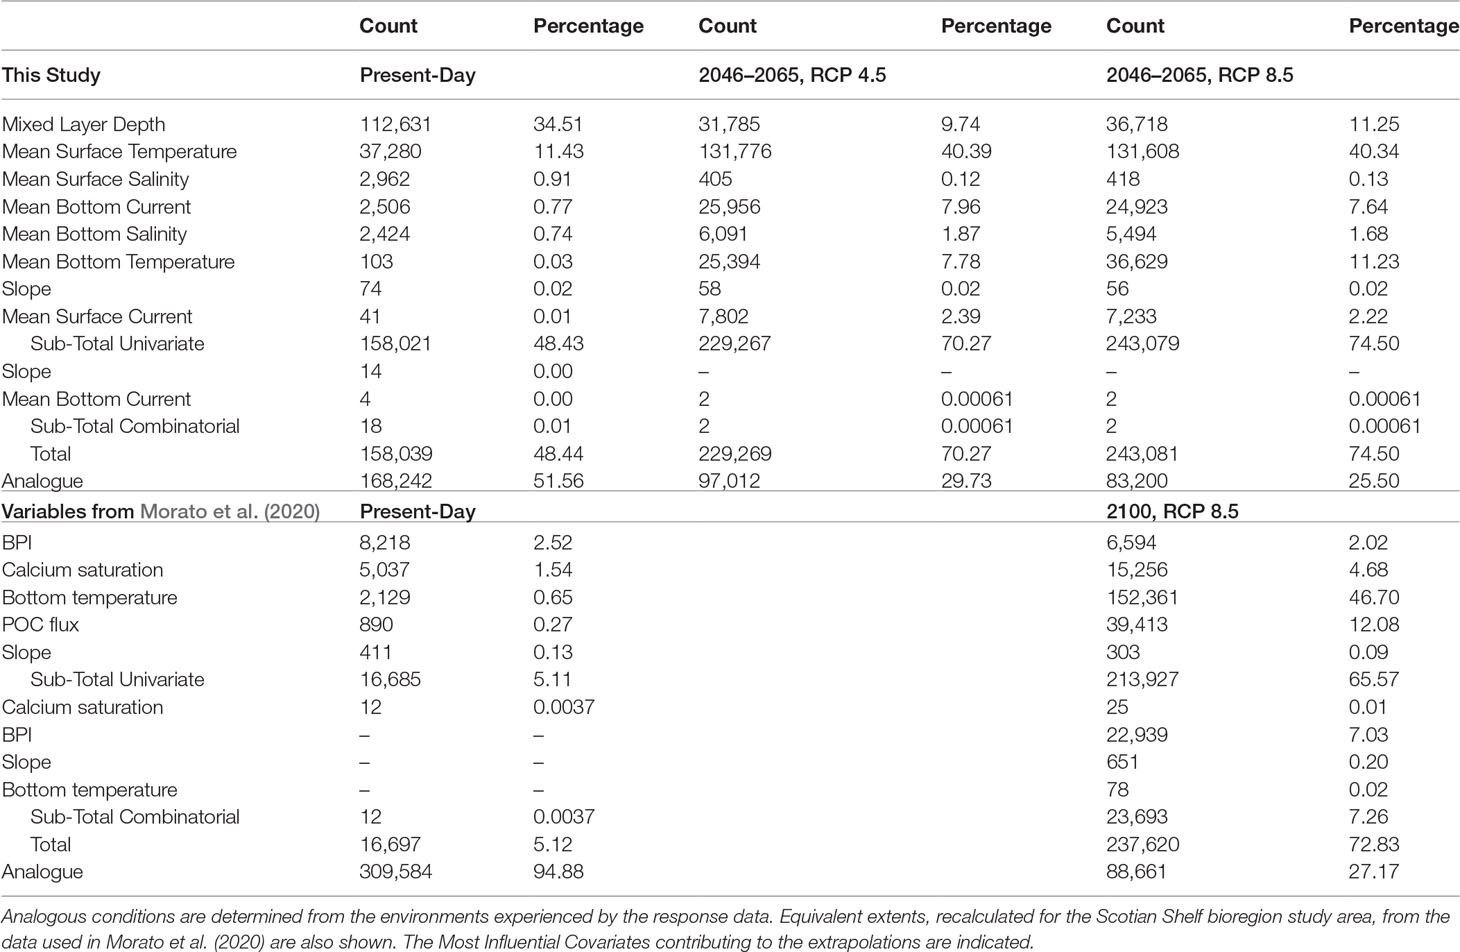
Table 2 Spatial extent (in number of grid cells) of extrapolation for single covariates and combinations of covariates under present-day and future climatologies based on presence and absence data for Paragorgia arborea.
Interestingly, the predicted distribution of binary-classified suitable habitat outside areas of extrapolation produced similar predictions among contemporary models constructed using the 6 terrain variables (Figure 4) and those constructed using the 8 environmental predictors that were mostly water column variables (Supplementary Figure 7). All models predicted suitable habitat along the upper continental slope. Their similarity is best explained by the importance of the slope variable in all of the models, as correlations between water column and terrain variables were generally low (< 0.50).
3.1.3 Assessment of Model Predictions Against Independent Response Data
Of the 44 OBIS records, 86% fell within areas of predicted presence of P. arborea (Supplementary Table 7) in both RF and GAM models, which was relatively consistent with the sensitivity of the RF models (0.99 with all 47 variables, 0.97 with the 8 variables used for the present-day climate baseline). Some records shared positional information with others. Removing those reduced the data-set to 23 unique positions, 19 of which (83%) were found in areas of predicted presence.
The records extracted from Gass’ (2002) compilation of historical reports of coral occurrence did not map well against the areas of suitable habitat identified by either the RF or GAM models for current environmental conditions, only 24% falling within areas deemed as having suitable habitat (Supplementary Table 7). Concordance with the predictions was highest for records from the Scotian Slope. Some eastern Scotian Shelf records were from locations very close to small areas of predicted suitable habitat near the Laurentian Channel (Supplementary Figures 1C, D), such that their poor concordance may result from imprecise positional information in original records. Other cases may have arisen from misidentifications. Therefore the poor match of those data with areas of predicted presence of P. arborea is not necessarily indicative of model performance.
3.2 Predicted Distribution Under Climate Projections
Under projected (2046−2065) environmental conditions, RF modeling predicted both increased probability of occurrence and a considerable expansion of the extent of suitable habitat for P. arborea, especially in the Fundian and Laurentian Channels, along the slope in general, and even onto Georges Bank (Figures 5C, D; Supplementary Figures 7B, C). Although the GAM also predicted some increased probability of occurrence in both channels (Figures 5G, H; Supplementary Figures 7E, F), the predicted expansion in suitable habitat was less than that of the RF models. The Fundian and Laurentian Channels were each associated with higher residuals in the GAM, indicating a poorer fit in those areas (Supplementary Figure 6C).
Extrapolation diagnostics applied to prediction modeling under future environmental conditions, identified extrapolation areas extending from deep ocean into the Northeast Channel, Fundian Channel, Jordan Basin, Emerald and La Have Basins and onto Emerald Bank (Figure 7B). Those areas occupied 70% (RCP 4.5) and 74.5% (RCP 8.5) of the spatial extent of the study area (Table 2). RF predictions in those areas are unreliable, though the extent of extrapolation from present-day values varies. In the Northeast Channel (Figure 7B), where P. arborea occurs under present-day conditions (Figure 3), univariate extrapolation is near zero, indicating that the environmental variables creating the extrapolation (mean bottom temperature and salinity, Figure 7F) are close to the range found in the reference data.
The relative magnitude of univariate and combinatorial extrapolation in the future distribution models associated with different sets of the 8 predictor variables (Table 2), show that the extent of extrapolation was much larger with individual variables than with combinations of them. Small areas of combinatorial extrapolation were found in the Gully MPA and adjacent Shortland Canyon. Closer examination of those areas showed that the combination of variables creating the novel environments (Table 2) was restricted to two grid cells in the former and one grid cell in the latter, both at the canyon heads.
In summary, the predicted distributions under projected climates appear reliable along the upper Scotian Slope and the wall of the Laurentian Channel (Supplementary Figure 7), if not necessarily so elsewhere. Within that restricted area, RF and GAMs produced similar predictions of future distributions, both suggesting the presence of suitable habitat in 2046−2065, including potential for habitat expansion.
3.3 Identification of Potential Climate Refugia
Of the 115 grid cells currently known to contain P. arborea, 39 are expected to retain similar conditions to those seen in presently-occupied cells (Supplementary Table 8), under climate projections for 2046−2065. Most lie along the Scotian Slope east of 60°W (Supplementary Figure 8 and Figure 8). There, 23 of 58 grid cells with P. arborea present today will remain within the range of existing environmental conditions seen in that sub-region, indicating that those cells may contain climate refugia for this species over the next decades. Another 16 of those 58 cells are projected to have future environments similar to present-day conditions in the Northeast Channel, but with one or more variables outside the ranges experienced by extant colonies in the eastern sub-region (Figure 8).
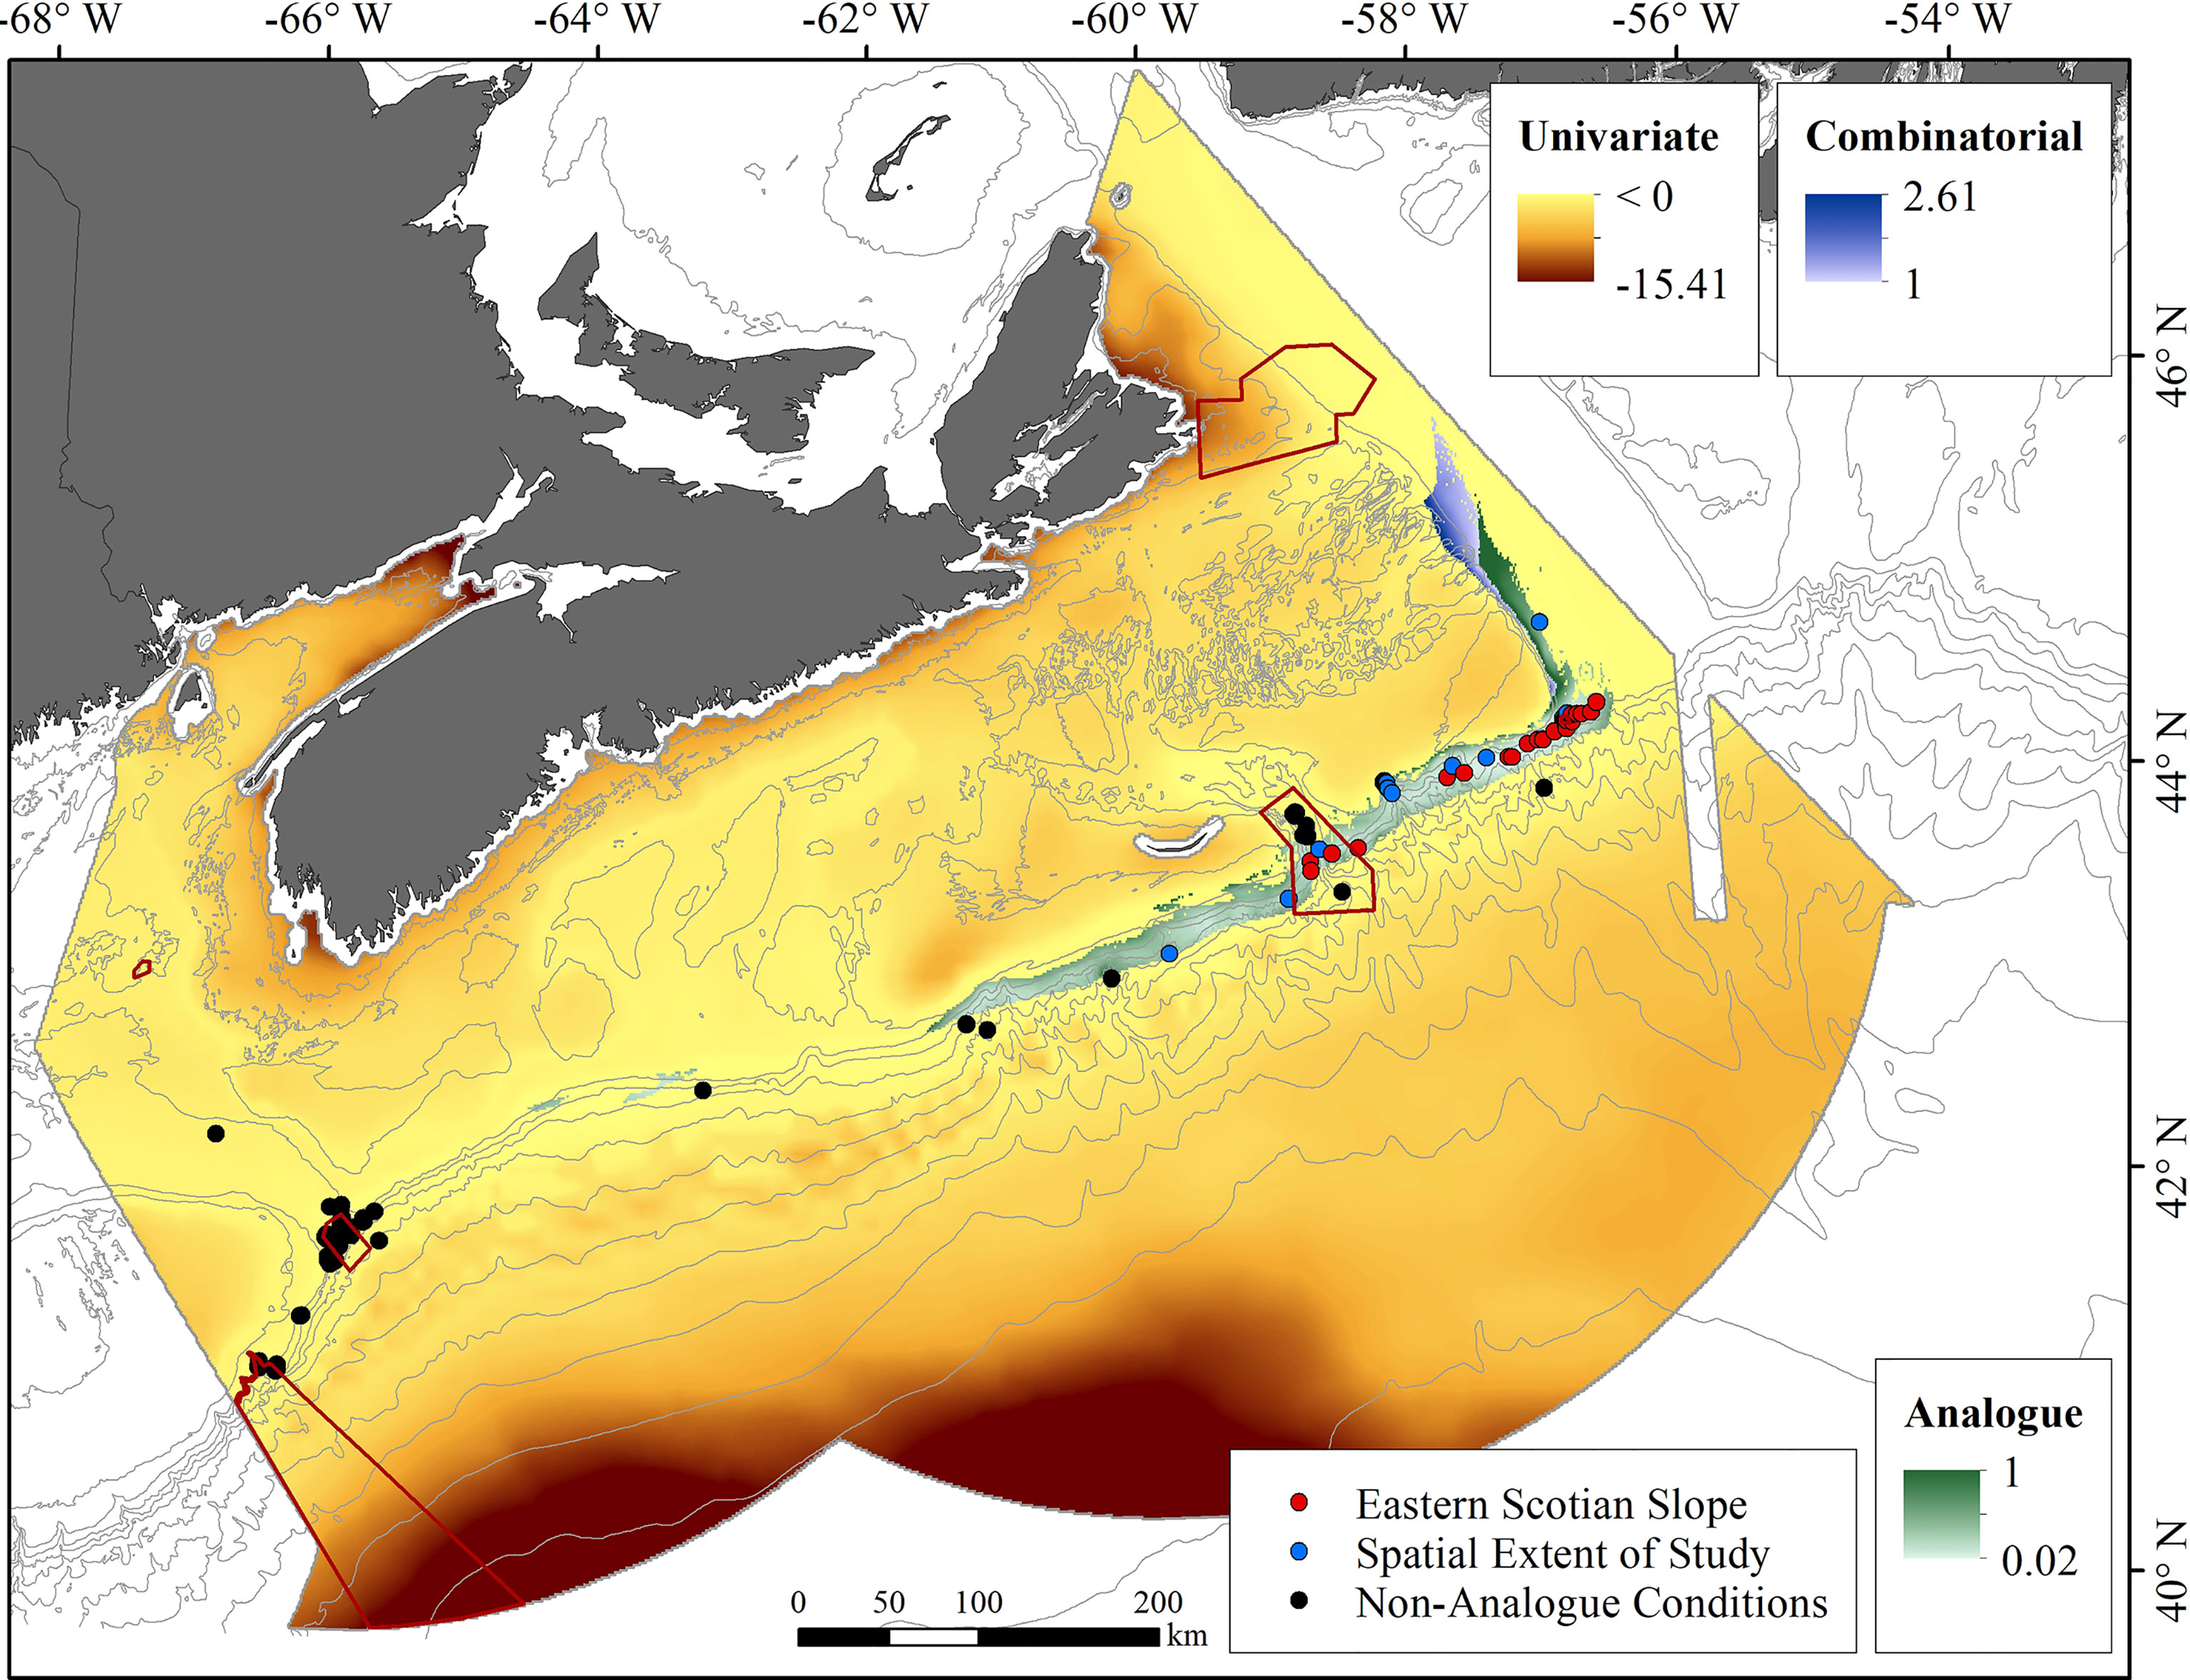
Figure 8 Areas of analogous and non-analogous conditions under RCP 4.5 climate projections for 2046-2065, defined by eight input covariates, showing the locations of confirmed records of Paragorgia arborea coded by the projected future status of environmental conditions at those sites and existing conservation areas (in red outline). Locations of existing records that are projected to retain conditions analogous to those where the species presently occurs on the eastern Scotian Slope are shown in red. Locations which will retain, or change to, conditions analogous to those under which the species is presently found west of 60°W are shown in blue. Black dots mark records in areas projected to change to non-analogous conditions.
The 57 grid cells west of 60°W that are known to have P. arborea today all lie in areas of univariate extrapolation under future conditions (Figure 8), meaning that one or more of the 8 environmental variables is projected to fall outside its present-day range seen in occupied grid cells in the study area by 2046−2065 (Supplementary Table 8). That was a consequence of, primarily, higher projected mean surface temperatures, which will affect 55 of the cells, making the predictions in this area unreliable.
Given the large areas of extrapolation shown in both the contemporary and future predictive models (Section 3.2) this use of the extrapolation diagnostic tool to identify climate refugia is more reliable than identification of common habitat between contemporary and future prediction surfaces.
3.4 Comparison With Results of Basin-Scale Modeling
Extrapolation diagnostics for the suite of response and predictor variables used by Morato et al. (2020), applied within the Scotian Shelf bioregion study area, identified analogous conditions over most of its spatial extent under present-day conditions (94.88%; Table 2), except for some areas of univariate extrapolation in BPI in the canyon areas (Supplementary Figure 9 and Table 2). Under future climate projections (2100, RCP 8.5), large areas of the Scotian Shelf and continental rise were projected to lie in areas of extrapolation, the most important variables being bottom temperature, POC flux and calcite saturation at the seafloor (Table 2). New combinatorial areas on the Scotian Slope were identified, with BPI accounting for most of the extrapolation there. Only the deep continental slope and upper rise were projected to retain analogous conditions (Supplementary Figure 9).
3.5 Regional-Scale Connectivity Patterns
In all seasons and for all particle release depths, connectivity increased with PLD (Supplementary Figures 10–21), that trend being particularly pronounced in autumn and winter, at mid-water and seabed release depths. Connectivity between source boxes was highly and consistently clustered (Figure 9). Down-stream connectivity amongst deep-slope source boxes (Source Boxes 17–23: Figure 3) was observed across all seasons and particle release depths, being particularly strong with mid-water and seabed releases and a PLD of 3 months, which enabled the more distant connections. Similarly, upper-slope down-stream connectivity (Source Boxes 5, 6, 8–11) was observed across all seasons and depths to varying degrees, and was also particularly strong with mid-water and seabed releases and a 3 month PLD. Source Box 10 in the Gully MPA emerged as a potential seed source for the largest number of other Source Boxes, while Source Box 19 showed the greatest redundancy, receiving particles from the largest number of other source boxes.
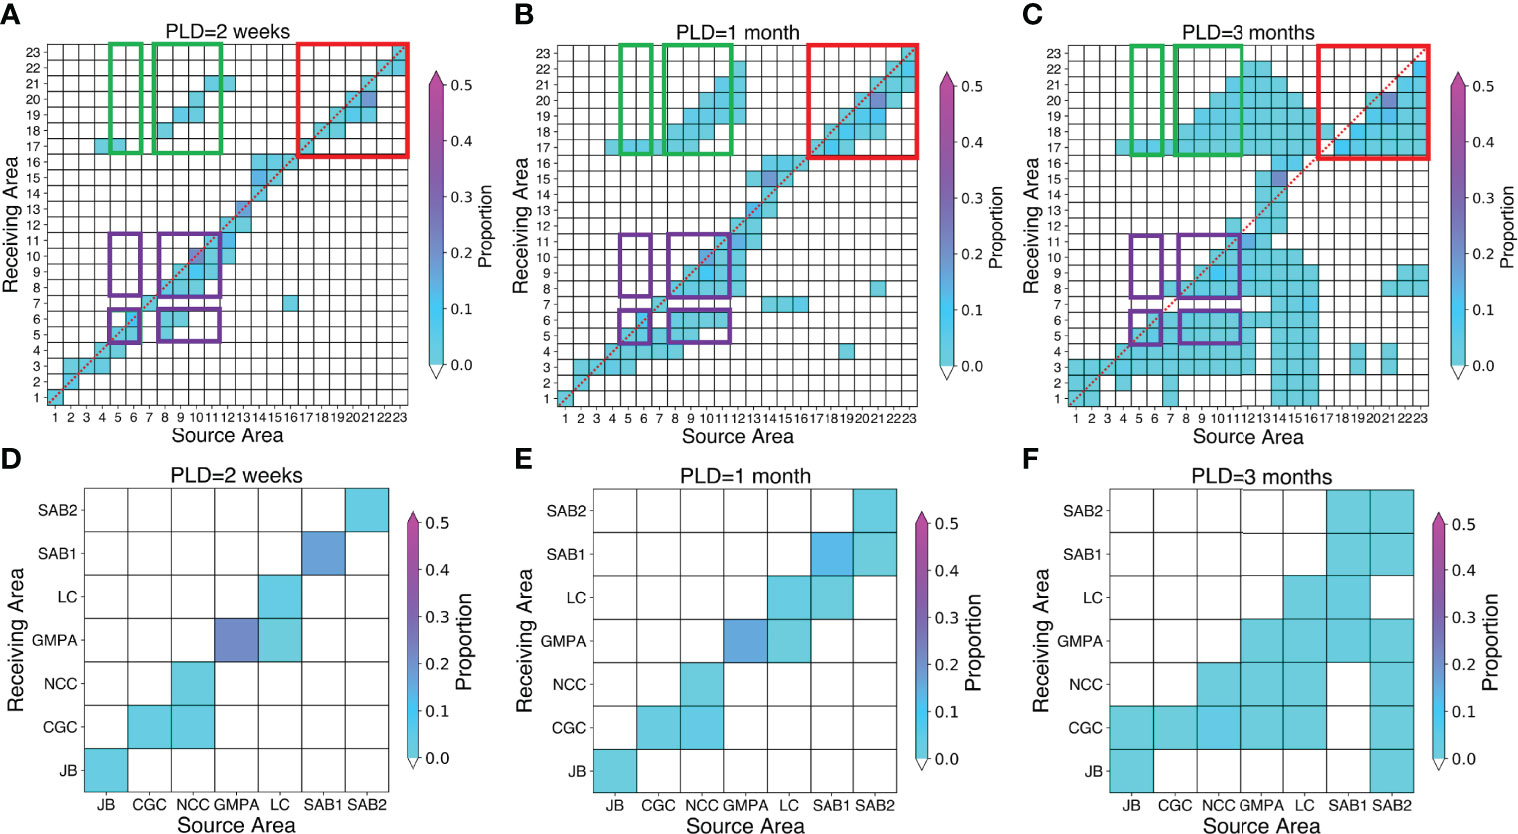
Figure 9 (A–C) Proportions of virtual particles released from each source box, in ensembles of seasonal LPT simulations using long-term averaged currents, that pass over or terminate in each source box (termed: “Receiving Area”), during 2-week (left column), 1-month (centre column) and 3-months (right column) PLDs. Shading on the major diagonal indicates particle retention in the source box at the end of the PLD. Red outlines indicate deep-slope source boxes; purple outlines indicate upper-slope source boxes; green outlines indicate connectivity from upper-slope to deep-slope source boxes. (D–F) Extracts from the above matrices, showing connectivity among source boxes in conservation areas: 1, Jordan Basin Conservation Area, JB; 3, Corsair and Georges Canyons Conservation Area, CGC; 4, Northeast Channel Coral Conservation Area, NCC; 10, Gully MPA, GMPA; 11, Lophelia Coral Conservation Area, LC; 13, 14, St. Anns Bank MPA, SAB1, SAB2.
Connectivity among the source boxes on the inner Scotian Shelf (Source Boxes 7, 13–16) was observed in all seasons and was less influenced by PLD. Among the source boxes at the westward end of the study area, the greatest connectivity was observed between Source Boxes 4 and 3, where connections were made regardless of PLD, season or release depth. Connectivity was also high from the Fundian Channel to the eastern slope of Georges Bank (Source Boxes 1, 2 to 3, 4) with connections in all seasons, but most commonly in spring at all release depths and PLD. Source Boxes 3 and 17 were the least connected to others within the study area, larvae from there perhaps drifting to Paragorgia habitat in waters of the USA, although Source Box 17 did connect eastward to Source Box 18 in autumn releases at the surface with a 3-month PLD.
Connectivity between the clusters of connected source boxes described above was most prevalent between the upper- and deep-slope groups (Figure 9), with connections in the down-slope direction at all release depths in both summer and autumn, but only with surface and mid-water releases in winter and spring. The particle drifts were never made down-slope but rather combined along-slope movements with entrainment of water from the shelf-break current into the east-going offshore flow. Connectivity in the up-slope direction was less common, being observed only in mid-water releases with longer PLDs in summer, autumn and winter (Supplementary Figures 17, 20, 11 respectively). Connections between the source boxes on the inner Scotian Shelf with those on the continental slope were observed, primarily with surface releases in the spring, with deep-slope connections also observed in winter at the surface, and upper-slope connections in autumn at mid-water and surface release depths.
Potential upstream source areas for Source Box 11 (located in the Lophelia Coral Conservation Area) that were identified by hindcast LPT models, included waters from coastal Newfoundland and the Tail of Grand Bank to the Cabot Strait (Supplementary Figure 22). OBIS records (Supplementary Figure 1) showed that Paragorgia spp. do occur in that area, potentially providing a supply of larvae to the populations on the Scotian Slope.
Source Boxes 13 and 14 were situated in the St. Anns Bank MPA, an area where P. arborea has not been observed but is projected to occur in its deeper extent, along the slope of the Laurentian Channel (Supplementary Text 2.1), in future. Hindcast LPT modeling for spring releases (Supplementary Figure 22) identified potential source areas primarily in the Cabot Strait and southern Gulf of St. Lawrence.
Consistent with expectations, particle retention within source boxes decreased with increasing PLD. It was most common in seabed releases in summer, autumn and winter, when it was often the predominant outcome (Supplementary Figures 18, 21, 12). Source Box 3 and to a lesser extent, Source Box 17, which had poor connectivity, showed more particle retention. Elsewhere, retention was commonly seen with PLDs of 2 weeks or 1 month, in all source boxes, and 13 of them showed some retention even after 3 months (Figure 9).
3.5.1 Inter-Annual Variability in Connectivity Patterns
The LPT simulations using monthly-averaged currents for 1993 and 2015 showed generally less difference in connectivity and retention than was seen amongst different PLDs or seasons with the long-term averaged current data, and were consistent with the connectivity patterns observed in simulations using those data (Supplementary Figures 10–21). However, some particular differences were observed. With releases in the winter at the surface, there was greater connectivity among upper-slope source boxes in 1993 than in 2015, for example, whereas mid-water and seabed releases in winter, summer surface releases, plus surface and seabed releases in autumn, showed more connectivity in 2015 than 1993.
3.6 Connectivity Between Conservation Areas in the Offshore Scotian Shelf Planning Area
Some particles released in the Jordan Basin Conservation Area (Source Box 1) in all seasons were retained there, particularly those from seabed and mid-water releases (Figure 9). With 3-month PLD, that area also has direct, down-stream connections to the Corsair and Georges Canyons Conservation Area (Source Box 3) in the spring at all release depths, and for surface releases only, in summer. P. arborea has not been confirmed for this area, although another coral often found with P. arborea, Primnoa resedaeformis occurs there (Supplementary Table 4) and the conservation area is identified as having suitable habitat under climate projection (Supplementary Figure 7).
Source Box 3, in the Corsair and Georges Canyons Conservation Area, did not have downstream connections to other Canadian conservation areas in the simulations based on long-term averaged currents (Figure 9). It was, however, connected to the Northeast Channel Coral Conservation Area (Source Box 4) in both 1993 and 2015, for mid-water releases in summer with PLDs of 1 and 3 months, and in 2015 also in winter under the same conditions. With those same PLDs, Source Box 3 was additionally connected to the deep-slope Source Boxes 17, 18, 19 and 23 in individual years in summer and autumn of 1993 and 2015. There was also particle retention in Source Box 3 in summer, autumn and winter with mid-water and seabed release simulations. The Northeast Channel Coral Conservation Area likewise had particle retention in those seasons and release depths, as well as the strong downstream connections to the Corsair and Georges Canyons Conservation Area noted above.
To the east, Source Box 10 in the Gully MPA is well-connected to the deep-slope cluster with 3-month PLD (Figure 9). It also has downstream connections with the Northeast Channel Coral Conservation Area and Corsair and Georges Canyons Conservation Area (Figure 9), both under simulations using long-term averaged currents and in individual years, and in all seasons. However, those connections were typically restricted to mid-water and seabed particle releases. More connections were seen in 2015 than in 1993. Other particles were retained within Box 10 in both individual years and under long-term averaged conditions, particularly with winter releases as well as those seabed releases in summer and autumn with PLDs of 2 weeks or 1 month. Under those conditions, particle retention was on the order of 50% (Supplementary Figures 12, 18, 21). Similarly high retention was seen in 2015 only in the spring under the same LPT parameters. The Gully MPA also had connections to the Lophelia Coral Conservation Area (Source Box 11) with mid-water releases in spring 2015 and a PLD of 3 months, plus surface and mid-water releases in summer, regardless of the chosen PLD, and in seabed releases with PLDs of 1 and 3 months.
The Lophelia Coral Conservation Area (Source Box 11) also had particle retention in all seasons both under averaged conditions and in individual years. Retention was more common under shorter PLDs (2 weeks, 1 month), and in releases from the mid-water and seabed depths. This area was connected to three other downstream conservation areas, especially the Gully MPA, to which connections were found in all seasons, both in individual years and under long-term averaged conditions. In winter and spring, there were connections at all three release depths, while in the summer they were restricted to surface and mid-water releases, and in autumn to mid-water and seabed releases. The Lophelia Coral Conservation Area was also connected to the Northeast Channel Coral Conservation Area and Corsair and Georges Canyons Conservation Area in the autumn, winter and spring but not the summer. Connections were mostly from mid-water releases with a PLD of 3 months.
On the Scotian Shelf, Source Box 13 in the St. Anns Bank MPA, has a very high retention of 50% of particles released at the seabed in all seasons, with PLDs of 2 weeks or 1 month (Figure 9). Retentions were also seen with a PLD of 3 months but with a lower proportion of particles being retained. There were connections to both the Gully MPA and the Lophelia Coral Conservation Area, with more connections to the latter. Those connections were found in all seasons and predominantly in surface and mid-water releases with 1- and 3-month PLDs. Source Box 14, also in the St. Anns Bank MPA but further to the west of Source Box 13 (Figure 3), is the most highly connected with particles reaching nineteen other source boxes and all protected areas except for the Lophelia Coral Conservation Area when PLD was set to 3 months (Figure 9). The highest connectivity was with Source Box 15 to the west just outside the MPA boundary, but eastward connections to Source Box 13 inside the MPA were observed with 1- and 3-month PLDs. At 1-month PLD particles connected westward along the shelf to Source Boxes 15, 16 and 7, connecting only to Source Boxes 15 and 16 with 2-week PLD (Figure 9). As for the Jordan Basin Conservation Area, the St. Anns Bank MPA includes suitable habitat for P. arborea under climate projection models to mid-century (Supplementary Figure 7).
4 Discussion
This study combined regional species distribution models of the present-day and future distributions of the deep-sea coral P. arborea with particle tracking models that were used to evaluate the likelihood of colonization for areas of predicted habitat and to assess connectivity among areas closed to protect this and other deep-sea coral species. Extrapolation diagnostics proved to be a useful tool for reducing the degree of extrapolation in the species distribution models and for spatially assessing the reliability of model outputs. The results have led to the identification of mid-century climate refugia along the upper slope in the eastern part of the Scotian Shelf bioregion, contrary to projections inferred from models performed at a basin-scale across the North Atlantic. Collectively these results have enabled a first review of the current set of closed areas with respect to fulfilling the expected properties of a protected area network.
4.1 Distribution of Paragorgia arborea in the Study Area
Restricting the RF model from the full complement of 47 predictors to the top six allowed us to reliably exclude large expanses of extrapolated habitat unsuitable for P. arborea over the continental rise and abyssal plain, without compromising model performance. The six were terrain variables which had not previously been used for predictive habitat modeling of benthic species in the study region (e.g., Bryan and Metaxas, 2007; Beazley et al., 2018; Beazley et al., 2021b), but to our knowledge proved to be effective predictors of P. arborea habitat. They identified steep and rugged areas, suitable for the species, along the upper continental slope, reflecting variability in seafloor elevation and steep slopes at scales of kilometres and tens of square kilometers, as well as vertical relief of hundreds of metres. The available variables do not capture micro-relief but rather such geomorphic features as ridges, gullies and moraines (Sowers et al., 2020).
Within those areas of predicted suitable habitat, P. arborea will be confined to the hard surfaces it requires for attachment; surfaces which may be provided by bedrock, boulders in glacial till, or drop stones (Mortensen and Buhl-Mortensen, 2004). The upper Scotian Slope is underlain by till, though at water depths < 300 m that is mostly covered by mobile fine sand in the east, and coarser sand and gravel in the west, while ice-berg pits and scours expose underlying harder substrata (Piper and Campbell, 2002). Low ridges and patches of boulders, which provide suitable settlement substrates for P. arborea, are common and contribute to the ruggedness. Ridges and canyons extend down the Slope. Apart from The Gully’s, the heads of the canyons are mostly choked with sand, although some mudstone outcrops emerge on their walls, creating potential settlement substrate. Hard surfaces in deeper water are typically coated with a layer of fine sediment, and so may not support P. arborea settlement, but the canyon walls have a steep “ridge and gully” topography (Piper and Campbell, 2002), which may promote water flows that maintain exposure of bedrock outcrops. Below 1000 m depth, the continental slope and rise are typically covered with bioturbated mud, consistent with predictions of low probabilities of P. arborea occurrence over much of that area.
Particle tracking models showed potential for biophysical connectivity along that strip of predicted P. arborea habitat on the upper slope, mediated by the Shelf-Break Current, the principal water flow on the Scotian Shelf (Han et al., 1999; Hannah et al., 2001), at all times of year and independent of larval vertical behaviour — hence a conclusion not constrained by limited available knowledge of the species’ reproductive biology. LPT modeling also demonstrated that the areas of suitable habitat identified at greater depths, where the species has yet to be found, could receive recruitment from upper-slope populations and once established, could support other deep-slope populations through passive larval dispersal. Hindcast LPTs showed potential for recruitment to present or future suitable habitat in the eastern part of the study area from populations in Newfoundland waters and as far east as the Tail of Grand Bank.
The greatest uncertainty influencing the degree of connectivity concerned pelagic larval duration, which will profoundly affect dispersal. Two broad classes of sexual reproduction are known in octocorals: either broadcast spawning, with fertilization and development in the water column, or fertilization and subsequent brooding of embryos internally or externally on the maternal colony. Embryos develop into planula larvae, which are either crawling or ciliated and the minimum time to settlement competency is less than 1 week for the few species studied (Simpson, 2006). Even if P. arborea is a broadcast spawner, its PLD is likely short, two weeks or less (Lacharité and Metaxas, 2013). LPT models indicate that, with such short durations, most P. arborea larvae are retained in the immediate environs of their parent colonies. Ensembled connectivity patterns for 2-week PLD (Figure 9) show retention in all source boxes, supporting a hypothesis of primarily localized recruitment, while connections were mostly between adjacent source boxes (Supplementary Figure 23).
4.2 Predicted Distribution Under Climate Change Projections
Because of extrapolation uncertainties, the predicted distributions of P. arborea under climate projections for 2046–2065 are only reliable for the upper continental slope and portions of the eastern Scotian Shelf. Within that limitation, the RF models and GAMs showed very similar predictions (Figure 5), with common areas of suitable habitat expected along the upper slope. In contrast, the predicted areas of suitable habitat in Jordan Basin, on the flanks of Georges Bank, in parts of the Laurentian Channel, and in some areas on the continental slope, cannot be reliably confirmed due to the novel environmental conditions projected to occur there. Nevertheless, a substantial portion of the present-day predicted distribution is projected to persist through to 2046–2065, using models with good performance and reliability.
That limited impact of climate change on P. arborea in the Scotian Shelf bioregion study area conflicts with conclusions from basin-scale modeling of the same species (Morato et al., 2020). Both studies agreed on the existence of suitable habitat along the continental slope under present-day conditions, but they differed widely in their future projections, where the regional models showed an increase in suitable habitat in contrast to the loss of habitat projected in the basin-scale models (Morato et al., 2020). Without access to BNAM outputs for the 2081–2100 period, results directly comparable to those from the basin-scale analyses were not generated. However, trends in regional oceanography during the second half of the century are expected to be similar to those in the first, with no sharp increases anticipated (Shackell and Loder, 2012; Brickman et al., 2016). Thus, the limited projected change in the distribution of suitable habitat for P. arborea through to 2046–2065 should continue until 2100.
The causes of the conflicting results merit closer examination. Extrapolation diagnostics showed that, in both studies and despite their different suites of predictors, much of the study area falls within swaths with non-analogous environmental conditions (Figure 7 and Supplementary Figure 9), where habitat predictions are unreliable. With the predictors used in the basin-scale study applied to the Scotian Shelf bioregion, the continental slope was included in an area of extrapolation, whereas in this study much of the predicted suitable future habitat on the slope had analogous conditions. Hence, the results presented herein are the more confident.
Differences between the basin-scale study and the regional study presented here were also a byproduct of the resolution of the oceanographic models used to create the environmental predictors. In the study area, ocean-climate variability is determined by a complex of atmospheric forcing and solar heating, interactions between the Gulf Stream and Labrador Current and local factors, including tides, river discharge and seabed topography (Brickman et al., 2016). The physical oceanographic variables used in this study came from BNAM, a basin-scale ocean model that has been rigorously tested against observational data in the region (Wang et al., 2018; Wang et al., 2019). In contrast, the basin-scale study (Morato et al., 2020) used output from the Earth System Grid Federation (ESGF) Peer-to-Peer System, which was specifically developed for global-scale studies in support of the IPCC Coupled Model Intercomparison Project 5 (Cinquini et al., 2012). It is well known that those models do not well capture details of the study region (Stock et al., 2011; Saba et al., 2016), and do not resolve the bathymetry of the Scotian Shelf, nor the spatial structure of the ocean overlying the shelf. Neither do they properly resolve the Gulf Stream separation off Cape Hatteras (Saba et al., 2016). It is, therefore, unsurprising that the two studies differ markedly in their predictions (Supplementary Figure 24; Supplementary Text 2.3), while the BNAM-based analysis must be considered the more realistic for the Scotian Shelf bioregion.
The two studies also used different environmental variables as predictors. In the basin-scale study, POC flux to the seafloor and calcite saturation state there, were the most important of five predictors in RF and Maxent models, whereas calcite saturation was the most important in a GAM (Morato et al., 2020). In this study, slope, mean surface temperature and mean bottom salinity were the three most important variables of eight influencing the RF model, while the GAM relied most on slope and mean surface temperature. The only predictor common to both studies was (temporally invariant) slope (Supplementary Text 2.1).
While all of the variables used by both studies are assumed to have biological relevance, very little is known about the threshold limits, tolerance or adaptive capacity of P. arborea or any other deep-water non-symbiotic gorgonian (Schubert et al., 2017; Gugliotti et al., 2019). Without that understanding, the alternative models are correlative, rather than built on causal relationships, limiting the interpretations needed to give preference to one study over the other based on their predictor variables. Of the various predictors, biological response to calcite saturation has received the most attention. The saturation state of seawater for CaCO3 (Ω) is a measure of its potential to corrode the calcitic sclerites found in P. arborea and other gorgonians. When Ω < 1, seawater is corrosive to calcifying organisms (Azetsu-Scott et al., 2010). Experimental evidence suggests that gorgonian coral sclerites are somewhat protected from corrosive environments by their thick, fleshy coenenchyme tissue (Gabay et al., 2014; Gómez et al., 2015) and so P. arborea may be able to tolerate the degree of ocean acidification expected by the end of this century.
4.3 Implications for Conservation
Conservation of the iconic and ecologically significant bubblegum coral, P. arborea, has been a priority for ocean management in Atlantic Canada for over two decades (ESSIM Planning Office, 2006). Indeed, the Northeast Channel Coral Conservation Area was established in June 2002 with the purpose of protecting the largest known concentrations of P. arborea in the region from the harmful effects of bottom-contact fishing gears. Shortly thereafter, the Gully MPA was designated under Canada’s Oceans Act in May 2004. The first such MPA in Canadian Atlantic waters, it was intended (in part) to protect rich aggregations of cold water corals, including P. arborea (Breeze and Fenton, 2007). The species is also found in the Lophelia Coral Conservation Area (Korabik et al., 2021). More recently, the Corsair and Georges Canyons Conservation Area was created in 2016 to protect a wide variety of coral species living on the canyon walls, including P. arborea (Metaxas et al., 2019). Those four protection areas were not originally planned as a network of protected areas nor have they been collectively evaluated for network properties such as representativity, connectivity, adequacy, viability and climate resiliency. The results of this study enable a first assessment of those areas for the suite of protected area network properties as they pertain to P. arborea.
The concept of “representativity” in protected area network design applies to different spatial scales and biogeographic subdivisions (DFO, 2010). The Northeast Channel Coral Conservation Area, the Corsair and Georges Canyons Conservation Area, the Gully MPA and the Lophelia Coral Conservation Area, together create a protected area network for P. arborea spanning from east to west along the upper continental slope within the Offshore Scotian Shelf planning area. The most reliable species distribution models (Figure 4) showed that most of the unexplored deep-water area is unlikely to provide suitable habitat for this species and so the nominal network currently in place has good representation and replication of P. arborea habitat. The areas where predicted suitable habitat extends into deeper waters identify targets for future exploration to determine whether or not the species is present. As noted above, the LPT modeling suggested that those areas have potential for colonization from areas of known presence. If P. arborea is confirmed in the deep-slope areas additional closed areas would need to be established to maintain representativity in the protected area network.
Amongst the four closed areas within the putative network where P. arborea has been observed, LPT analyses demonstrated the potential for connectivity, and extensive connectivity between the protected areas within that network with adjacent habitats outside the closures (Figure 9 and Supplementary Figure 23). The Lophelia Coral Conservation Area, despite being the smallest of the closures at 15 km2, has large potential as a seed source to all of the other protected areas in the network and to adjacent habitats on the Scotian Slope. Increasing its size would render further protection to this area which also protects the only known cold-water coral reef in eastern Canada (Beazley et al., 2021a). Metaxas et al. (2019) showed connectivity to the Corsair and Georges Canyons Conservation Area from canyons to the south, hypotheses not tested in this analysis. Limited connectivity between the Northeast Channel Coral Conservation Area and the Corsair and Georges Canyons Conservation Area was observed in winter and spring using the FVCOM ocean products (Metaxas et al., 2019). Connectivity between those two conservation areas was consistently observed in this study using BNAM ocean products, with connections made under all PLD scenarios, release depths and seasons using both long-term averaged currents (Figure 9) and currents extracted for individual years — the only exceptions being for 2 week PLD in 1993 in summer mid-water (Supplementary Figure 17) and autumn seabed releases (Supplementary Figure 21). Different ocean models are known to produce different connectivity trajectories (Wang et al., 2019; Supplementary Text 2.2), and given other differences between the studies (forward vs. hindcast modeling, particle release numbers, PLD etc.) these differences are not surprising. Collectively they show that the nominal protected area network for P. arborea has potential for strong connectivity between component closed areas either effected in a single spawning event or through stepping stone links where colonies occur along the connectivity trajectories.
The Jordan Basin Conservation Area and the St. Anns Bank MPA at the western and eastern extent of the planning area respectively, may prove to support P. arborea. Although neither area was identified as having suitable habitat in our contemporary models, both were identified as potentially having suitable habitat in mid-century projections under RCP 4.5 and RCP 8.5, albeit for Jordan Basin Conservation Area in areas of extrapolated environmental conditions (Supplementary Figure 7). Jordan Basin has validated presence of Primnoa resedaeformis, a species found co-occurring with P. arborea in the Northeast Channel. LPT modeling indicated that St. Anns Bank MPA connects with the Lophelia Coral Conservation Area under some scenarios and to other closed areas with 3 month larval duration (Figure 9). Assuming that the current velocities are not strongly altered in future, St. Anns Bank MPA should connect to the putative network. Should P. arborea be discovered in the Jordan Basin Conservation Area, the dependence of that area on larval retention would warrant an increase in its size which is currently 49 km2.
Adequacy and viability of a protected-area network should be evaluated relative to the likely effectiveness of each closed area in achieving its objectives (DFO, 2010). If one objective is to maintain and enhance populations of P. arborea, the ability of populations to self-recruit will support effectiveness. All four closed areas have strong potential for larval retention if, as expected, PLD is short. However, increasing the size of the protected areas would improve that potential still further.
Identification of climate refugia is an important element in marine spatial planning (Johnson and Kenchington, 2019). The Gully MPA, the Lophelia Coral Conservation Area and other areas along the Scotian Slope east of Sable Island, some with records of P. arborea presence and others with predicted presence, have potential as climate refugia, where environmental conditions important to the species are projected to remain stable through to 2046–2065 at least (Figure 8). Priority should be given to reducing cumulative stressors on gorgonians, including bottom contact fishing, in those areas. Some other locations along the eastern Scotian Slope, including Shortland Canyon, will experience conditions that the species tolerates in the western sub-area (including the Northeast Channel), but for which the populations further east may not be adapted. Meanwhile, the dense aggregations of P. arborea in the Northeast Channel may experience novel environmental conditions by 2046–2065, indicated in the analyses primarily by warmer mean surface temperatures. However, the projected differences from present-day conditions in that area are not large and colonies already established there may be able to adapt. Management measures to reduce cumulative stresses on P. arborea throughout those areas could support survival in the face of pending environmental change.
Data Availability Statement
The datasets presented in this study can be found in online repositories. The names of the repository/repositories and accession number(s) can be found below:
The 3-D Lagrangian particle simulator (Parcels) is freely available (https://www.oceanparcels.org); Monthly mean currents from the Bedford Institute of Oceanography North Atlantic Model (BNAM) results averaged over the 1990 to 2015 period for the Northwest Atlantic Ocean, are available online on the Federal Government of Canada Open Data Portal (https://open.canada.ca/data/en/dataset/dd5ef0d6-d588-4f4f-99e5-27c4bdfddf6a). The GLORYS12V1 ocean products with daily-means for the surface are publicly available from the Copernicus Marine Service data portal. Environmental data layers used for modeling present and future distributions are available from Mendeley Data as cited in the text.
Author Contributions
SW and FM performed the analyses and produced the tables and figures. All authors designed the experiments and contributed to the writing of the manuscript, take responsibility for the content, and approved the submitted version.
Conflict of Interest
The authors declare that the research was conducted in the absence of any commercial or financial relationships that could be construed as a potential conflict of interest.
Publisher’s Note
All claims expressed in this article are solely those of the authors and do not necessarily represent those of their affiliated organizations, or those of the publisher, the editors and the reviewers. Any product that may be evaluated in this article, or claim that may be made by its manufacturer, is not guaranteed or endorsed by the publisher.
Acknowledgments
We thank Drs. Zeliang Wang and David Brickman at the Bedford Institute of Oceanography (BIO), Dartmouth, Nova Scotia, Canada for providing the BNAM ocean model products for this study, and Dr. Trevor Kenchington, also of BIO, for providing helpful comments on successive drafts of our manuscript. We thank Drs. Telmo Morato and José-Manuel González-Irusta for providing us with regional data used in their analyses which allowed us to interpret our results with greater insight. Dr. González-Irusta also kindly provided comments on a first draft of our manuscript. The authors acknowledge input and discussions within Work Package 2 of the EU Horizon 2020 iAtlantic project (Grant Agreement No. 818123). This publication is a Canadian contribution for Case Study 4 under that Work Package. SW was hired through the Competitive Science Research Fund and FM was hired through the Marine Spatial Planning program, both administered within Fisheries and Oceans Canada.
Supplementary Material
The Supplementary Material for this article can be found online at: https://www.frontiersin.org/articles/10.3389/fmars.2022.863693/full#supplementary-material
References
Amodio S., Aria M., D’Ambrosio A. (2014). On Concurvity in Nonlinear and Nonparametric Regression Models. Statistica 74, 81–94. doi: 10.6092/issn.1973-2201/4599
Azetsu-Scott K., Clarke A., Falkner K., Hamilton J., Jones E. P., Lee C., et al. (2010). Calcium Carbonate Saturation States in the Waters of the Canadian Arctic Archipelago and the Labrador Sea. J. Geophys. Res. 115, C11021. doi: 10.1029/2009JC005917
Beazley L., Guijarro J., Lirette C., Wang Z., Kenchington E. (2017). Characteristics of Environmental Data Layers for Use in Species Distribution Modelling in the Maritimes Region. Can. Tech. Rep. Fish. Aquat. Sci. 3212, vii + 327.
Beazley L., Kenchington E., Korabik M., Fenton D., King M. (2021a). Other Effective Area-Based Conservation Measure Promotes Recovery in a Cold-Water Coral Reef. Glob. Ecol. Conserv. 26, e01485. doi: 10.1016/j.gecco.2021.e01485
Beazley L., Kenchington E., Murillo F. J., Brickman D., Wang Z., Davies A. J., et al. (2021b). Climate Change Winner in the Deep Sea? Predicting the Impacts of Climate Change on the Distribution of the Glass Sponge Vazella Pourtalesii. Mar. Ecol. Prog. Ser. 657, 1–23. doi: 10.3354/meps13566
Beazley L., Kenchington E., Murillo F. J., Brickman D., Wang Z., Davies A. J., et al. (2021c). Data From: Climate Change Winner in the Deep Sea? Predicting the Impacts of Climate Change on the Distribution of the Glass Sponge Vazella pourtalesii. Mendeley Data V1. doi: 10.17632/vm4bjn7g74.1
Beazley L., Wang Z., Kenchington E., Yashayaev I., Rapp H. T., Xavier J. R., et al. (2018). Predicted Distribution of the Glass Sponge Vazella pourtalesi on the Scotian Shelf and its Persistence in the Face of Climatic Variability. PLoS One 13, e0205505. doi: 10.1371/journal.pone.0205505
Beazley L., Wang Z., Kenchington E., Yashayaev I., Rapp H. T., Xavier J. R., et al. (2019). Data From: Predicted Distribution of the Glass Sponge Vazella pourtalesi on the Scotian Shelf and its Persistence in the Face of Climatic Variability. Mendeley Data V2. doi: 10.17632/zg8k3mchgx.2
Biau G. (2012). Analysis of a Random Forests Model. J. Mach. Learn. Res. 13, 1063–1095. doi: 10.5555/2188385.2343682
Biau G., Scornet E. (2016). A Random Forest Guided Tour. TEST 25, 197–227. doi: 10.1007/s11749-016-0481-7
Bouchet P. J., Miller D. L., Roberts J. J., Mannocci L., Harris C. M., Thomas L. (2020). Dsmextra: Extrapolation Assessment Tools for Density Surface Models. Methods Ecol. Evol. 11, 1464–1469. doi: 10.1111/2041-210X.13469
Bracco A., Liu G., Galaska M., Quattrini A. M., Herrera S. (2019). Integrating Physical Circulation Models and Genetic Approaches to Investigate Population Connectivity in Deep-Sea Corals. J. Mar. Syst. 198, 103189. doi: 10.1016/j.jmarsys.2019.103189
Breeze H., Fenton D. (2007). Designing Management Measures to Protect Cold-Water Corals Off Nova Scotia, Canada. Bull. Mar. Sci. 81, 123–133.
Brickman D., Wang Z., DeTracey B. (2016). High Resolution Future Climate Ocean Model Simulations for the Northwest Atlantic Shelf Region. Can. Tech. Rep. Hydrogr. Ocean. Sci. 315, xiv + 143.
Brock R. J., Kenchington E., Martínez-Arroyo A. (Eds.) (2012). Scientific Guidelines for Designing Resilient Marine Protected Area Networks in a Changing Climate (Montreal, Canada: Commission for Environmental Cooperation). Available at: http://www.cec.org/files/documents/publications/10820-scientific-guidelines-designing-resilient-marine-protected-area-networks-in-changing-en.pdf.
Bryan T., Metaxas A. (2007). Predicting Suitable Habitat for Paragorgiidae and Primnoidae on the Atlantic and Pacific Continental Margins of North America. Mar. Ecol. Prog. Ser. 330, 113–126. doi: 10.3354/meps330113
Buhl-Mortensen L., Mortensen P. B. (2005). “Distribution and Diversity of Species Associated With Deep-Sea Gorgonian Corals Off Atlantic Canada” in Cold-Water Corals and Ecosystems. Eds. Freiwald A. R., Roberts J. M. (Berlin: Springer-Verlag), 849–879.
Carr L. M. (2019). Marine Spatial Planning in a Climate of Uncertainty – An Irish Perspective. Irish. Geogr. 52, 1–20. doi: 10.6092/issn.1973-2201/4599.
Carstensen J., Conley D. J., Lophaven S., Danielsson Å., Rahm L., Toompuu A., et al. (2002). “Statistical Analysis and Modelling of Phytoplankton Dynamics,” in Exploitation of Data in the Nordic and Baltic Monitoring Programs Copenhagen: ( Nordic Council of Ministers).
Cinquini L., Crichton D. J., Mattmann C., Bell G. M., Drach B., Williams D., et al. (2012). The Earth System Grid Federation: An Open Infrastructure for Access to Distributed Geospatial Data. Future Gener. Comput. Syst. 36, 1–10. doi: 10.1109/eScience.2012.6404471
Cogswell A. T., Kenchington E. L. R., Lirette C. G., MacIsaac K., Best M. M., Beazley L. I., et al. (2009). The Current State of Knowledge Concerning the Distribution of Coral in the Maritime Provinces. Can. Tech. Rep. Fish. Aquat. Sci. 2855, v + 66.
Conn P. B., Johnson D. S., Boveng P. L. (2015). On Extrapolating Past the Range of Observed Data When Making Statistical Predictions in Ecology. PLoS One 10 (10), e0141416. doi: 10.1371/journal.pone.0141416
Conrad O., Bechtel B., Bock M., Dietrich H., Fischer E., Gerlitz L., et al. (2015). System for Automated Geoscientific Analyses (SAGA) V. 2.1.4. Geosci. Model. Dev. 8, 1991–2007. doi: 10.5194/gmd-8-1991-2015
Cordeiro R., McFadden C., van Ofwegen L., Williams G. (2021)World List of Octocorallia. In: Paragorgia Milne Edward ( World Register of Marine Species) (Accessed September 28, 2021).
Csanady G. T., Hamilton P. (1988). Circulation of Slopewater. Cont. Shelf Res. 8, 565–624. doi: 10.1016/0278-4343(88)90068-4
de Boyer Montégut C., Madec G., Fischer A. S., Lazar A., Iudicone D. (2004). Mixed Layer Depth Over the Global Ocean: An Examination of Profile Data and a Profile-Based Climatology. J. Geophys. Res. 109, C12003. doi: 10.1029/2004JC002378
De Clippele L. H., Buhl-Mortensen P., Buhl-Mortensen L. (2015). Fauna Associated With Cold Water Gorgonians and Sea Pens. Cont. Shelf Res. 105, 67–78. doi: 10.1016/j.csr.2015.06.007
Delandmeter P., van Sebille E. (2019). The Parcels V2.0 Lagrangian Framework: New Field Interpolation Schemes. Geosci. Model. Devel. 12, 3571–3584. doi: 10.5194/gmd-12-3571-2019
DFO (2009). Development of a Framework and Principles for the Biogeographic Classification of Canadian Marine Areas. DFO Can. Sci. Advis. Sec. Sci. Advis. Rep. 2009/056.
DFO (2010). Science Guidance on the Development of Networks of Marine Protected Areas (MPAs). DFO Can. Sci. Advis. Sec. Sci. Advis. Rep. 2009/061.
DFO (2014) Regional Oceans Plan - Scotian Shelf, Atlantic Coast, Bay of Fundy. Background and Program Description (Halifax: Fisheries and Oceans Canada. Regional Oceans Plan (dfo-mpo.gc.ca) (Accessed October 5, 2021).
DFO (2019)Northeast Channel Coral Conservation Area (Restricted Bottom Fisheries Zone). In: Northeast Channel Coral Conservation Area (Restricted Bottom Fisheries Zone) ( dfo-mpo.gc.ca) (Accessed October 4, 2021).
Díaz-Uriarte R., Alvarez de Andrés S. (2006). Gene Selection and Classification of Microarray Data Using Random Forest. BMC Bioinf. 7, 3. doi: 10.1186/1471-2105-7-3
Drinkwater K., Petrie B., Smith P. (2003). Climate Variability on the Scotian Shelf During the 1990s. ICES Mar. Sci. Symp. 219, 40–49.
ESSIM Planning Office (2006). Coral Conservation Plan. Maritimes Region, (2006-2010). Oceans. Coast. Mgt. Rep. 2006, 01.
FAO (2016). Vulnerable Marine Ecosystems: Processes and Practices in the High Seas. Eds. Thompson A., Sanders J., Tandstad M., Carocci F., Fuller J. (Rome, Italy: FAO).
Fawcett T. (2006). An Introduction to ROC Analysis. Pattern Recog. Lett. 27, 861–874. doi: 10.1016/j.patrec.2005.10.010
Feng T., Stanley R. R. E., Wu Y., Kenchington E., Xu J., Horne E. (2022). A High-Resolution 3-D Circulation Model in a Complex Archipelago on the Coastal Scotian Shelf. J. Geophys. Res. Oceans. 127, e2021JC017791. doi: 10.1029/2021JC017791
Fratantoni P. S., Pickart R. S. (2007). The Western North Atlantic Shelfbreak Current System in Summer. J. Phys. Oceanogr. 37, 2509–2533. doi: 10.1175/JPO3123.1
Gabay Y., Fine M., Barkay Z., Benayahu Y. (2014). Octocoral Tissue Provides Protection From Declining Oceanic pH. PLoS One 9 (4), e91553. doi: 10.1371/journal.pone.0091553
Garcia S. M., Rice J., Charles A., Diz D. (2021) OECMs in Marine Capture Fisheries: Systematic Approach to Identification, Use and Performance Assessment in Marine Capture Fisheries (Version 2) (Brussels, Belgium: Fisheries Expert Group of the IUCN Commission on Ecosystem Management, Gland, Switzerland. European Bureau of Conservation and Development). Available at: https://ebcd.org/oecms-in-marine-capture-fisheries/ (Accessed December 14, 2021).
Gass S. E. (2002). An Assessment of the Distribution and Status of Deep-Sea Corals in Atlantic Canada by Using Both Scientific and Local Forms of Knowledge. [MES Thesis] (Halifax, Canada: Dalhousie University).
Gass S. E., Willison J. H. M. (2005). “An Assessment of the Distribution of Deep-Sea Corals in Atlantic Canada by Using Both Scientific and Local Forms of Knowledge” in Cold-Water Corals and Ecosystems. Eds. Freiwald A. R., Roberts J. M. (Berlin: Springer-Verlag), 223–245.
Gómez C. E., Paul V. J., Ritson-Williams R., Muehllehner N., Langdon C., Sánchez J. A. (2015). Responses of the Tropical Gorgonian Coral Eunicea fusca to Ocean Acidification Conditions. Coral Reefs. 34, 451–460. doi: 10.1007/s00338-014-1241-3
Grorud-Colvert K., Claudet J., Tissot B. N., Caselle J. E., Carr M. H., Day J. C., et al. (2014). Marine Protected Area Networks: Assessing Whether the Whole is Greater Than the Sum of its Parts. PLoS One 9, e102298. doi: 10.1371/journal.pone.0102298
Gugliotti E. F., DeLorenzo M. E., Etnoyer P. J. (2019). Depth-Dependent Temperature Variability in the Southern California Bight With Implications for the Cold-Water Gorgonian Octocroal Adelogrogia phyllosclera. J. Exp. Mar. Biol. Ecol. 514 (515), 118–126. doi: 10.1016/j.jembe.2019.03.010
Halliday R. G., Kohler A. C. (1971). Groundfish Survey Programmes of the St. Andrews Biological Station, Fisheries Research Board of Canada – Objectives and Characteristics. ICNAF. Res. Doc. 71, 35.
Hanberry B. B., He H. S. (2013). Prevalence, Statistical Thresholds and Accuracy Assessment for Species Distribution Models. Web Ecol. 13, 13–19. doi: 10.5194/we-13-13-2013
Han G., Loder J. W. (2003). Three-Dimensional Seasonal-Mean Circulation and Hydrography on the Eastern Scotian Shelf. J. Geophys. Res. 108 (C5), 3136. doi: 10.1029/2002JC001463
Han G., Loder J. W., Smith P. C. (1999). Seasonal-Mean Hydrography and Circulation in the Gulf of St. Lawrence and on the Eastern Scotian and Southern Newfoundland Shelves. J. Phys. Ocean. 29, 1279–1301. doi: 10.1175/1520-0485(1999)029<1279:SMHACI>2.0.CO;2
Hannah C. G., Shore J. A., Loder J. W., Naimie C. E. (2001). Seasonal Circulation of the Western and Central Scotian Shelf. J. Phys. Ocean. 31, 591–615. doi: 10.1175/1520-0485(2001)031<0591:SCOTWA>2.0.CO;2
Herrera S., Shank M., Sánchez J. A. (2012). Spatial and Temporal Patterns of Genetic Variation in the Widespread Antitropical Deep-Sea Coral Paragorgia arborea. Mol. Ecol. 21, 6053–6067. doi: 10.1111/mec.12074
Hilário A., Metaxas A., Gaudron S. M., Howell K. L., Mercier A., Mestre N. C., et al. (2015). Estimating Dispersal Distance in the Deep Sea: Challenges and Applications to Marine Reserves. Front. Mar. Sci. 2. doi: 10.3389/fmars.2015.00006
ICES (2021). “EU Request to Advise on the List of Areas Where VMEs are Known to Occur or are Likely to Occur and on the Existing Deep-Sea Fishing Areas (Ref. (EU)2016/2336.)” in Report of the ICES Advisory Committe (Copenhagen: ICES Advice), sr.2021.01. doi: 10.17895/ices.advice.7507
IPCC (2013). Climate Change 2013: The Physical Science Basis. Contribution of Working Group I to the Fifth Assessment Report of the Intergovernmental Panel on Climate Change (Cambridge, UK: Cambridge University Press).
Johnson D., Kenchington E. (2019). Should Potential for Climate Change Refugia be Considered as an Eighth Criterion for Describing EBSAs? Conserv. Lett. 12 (4), e12634. doi: 10.1111/conl.12634
Jones C. C., Acker S. A., Halpern C. B. (2010). Combining Local- and Large-Scale Models to Predict the Distributions of Invasive Plant Species. Ecol. Appl. 20, 311–326. doi: 10.1890/08-2261.1
Kenchington E., Lirette C., Murillo F. J., Beazley L., Downie A.-L. (2019a). Vulnerable Marine Ecosystems in the NAFO Regulatory Area: Updated Kernel Density Analysis of Vulnerable Marine Ecosystem Indicators. NAFO. SCR. Doc., 68. https://www.nafo.int/Portals/0/PDFs/sc/2019/scr19-058.pdf. 19/058, Serial No. N7030.
Kenchington E., Wang Z., Lirette C., Murillo J. F., Guijarro J., Yashayaev I., et al. (2019b). Connectivity Modelling of Areas Closed to Protect Vulnerable Marine Ecosystems in the Northwest Atlantic. Deep-Sea. Res. I 143, 85–103. doi: 10.1016/j.dsr.2018.11.007
Korabik M., Baker E., Beazley L., Thompson S., Bouchard Marmen M., Kenchington E. (2021). A Pictorial Guide to the Epibenthic Megafauna of the Lophelia Coral Conservation Area Identified From In Situ Benthic Images. Can. Tech. Rep. Fish. Aquat. Sci. 3430, v + 142.
Lacharité M., Metaxas A. (2013). Early Life History of Deep-Water Gorgonian Corals may Limit Their Abundance. PLoS One 8 (6), e65394. doi: 10.1371/journal.pone.0065394
Landis J. R., Koch G. G. (1977). The Measurement of Observer Agreement for Categorical Data. Biometrics 33, 159–174. doi: 10.2307/2529310
Lange M., van Sebille E. (2017). Parcels V0.9: Prototyping a Lagrangian Ocean Analysis Framework for the Petascale Age. Geosci. Model. Devel. 10, 4175–4186. doi: 10.5194/gmd-10-4175-2017
Le Corre N., Pepin P., Burmeister A. D., Walkusz W., Skanes K., Wang Z., et al. (2020). Larval Connectivity of Northern Shrimp (Pandalus borealis) in the Northwest Atlantic. Can. J. Fish. Aquat. Sci. 77, 1332–1347. doi: 10.1139/cjfas-2019-0454
Lester S. E., Costello C., Halpern B. S., Gaines S. D., White C., Barth J. A. (2013). Evaluating Tradeoffs Among Ecosystem Services to Inform Marine Spatial Planning. Mar. Policy 38, 80–89. doi: 10.1016/j.marpol.2012.05.022
Leverette T. L., Metaxas A. (2005). “Predicting Habitat for Two Species of Deep-Water Coral on the Canadian Atlantic Continental Shelf and Slope” in Cold-Water Corals and Ecosystems. Eds. Freiwald A., Roberts J. M. (Berlin: Springer-Verlag), 467–479.
Liu C., Berry P. M., Dawson T. P., Pearson R. G. (2005). Selecting Thresholds of Occurrence in Prediction of Species Distribution. Ecography 28, 385–393. doi: 10.1111/j.0906-7590.2005.03957.x
Liu C., Wolter C., Xian W., Jeschke J. M. (2020). Species Distribution Models Have Limited Spatial Transferability for Invasive Species. Ecol. Lett. 23, 1682–1692. doi: 10.1111/ele.13577
Lopes P. F. M., Verba J. T., Begossi A., Pennino M. G. (2019). Predicting Species Distribution From Fishers’ Local Ecological Knowledge: A New Alternative for Data-Poor Management. Can. J. Fish. Aquat. Sci. 76, 1423–1431. doi: 10.1139/cjfas-2018-0148
Mahony C. R., Cannon A. J., Wang T., Aitken S. N. (2017). A Closer Look at Novel Climates: New Methods and Insights at Continental to Landscape Scales. Glob. Change Biol. 23, 3934–3955. doi: 10.1111/gcb.13645
Mannocci L., Roberts J. J., Halpin P. N., Authier M., Boisseau O., Nejmeddine Bradai M., et al. (2018). Assessing Cetacean Surveys Throughout the Mediterranean Sea: A Gap Analysis in Environmental Space. Sci. Rep. 8, 3126. doi: 10.1038/s41598-018-19842-9
Mannocci L., Roberts J. J., Pedersen E. J., Halpin P. N. (2020). Geographical Differences in Habitat Relationships of Cetaceans Across an Ocean Basin. Ecography 43, 1–10. doi: 10.1111/ecog.04979
Mesgaran M. B., Cousens R. D., Webber B. L. (2014). Here be Dragons: A Tool for Quantifying Novelty Due to Covariate and Correlation Change When Projecting Species Distribution Models. Diversity Distrib. 20, 1147–1159. doi: 10.1111/ddi.12209
Metaxas A., Davis J. (2005). Megafauna Associated With Assemblages of Deep-Water Gorgonian Corals in Northeast Channel, Off Nova Scotia, Canada. J. Mar. Biolog. Assoc. U.K. 85, 1381–1390. doi: 10.1017/S0025315405012567
Metaxas A., Giffin B. (2004). Dense Beds of the Ophiuroid Ophiacantha abyssicola on the Continental Slope Off Nova Scotia, Canada. Deep-Sea. Res. I 51, 1307–1317. doi: 10.1016/j.dsr.2004.06.001
Metaxas A., Lacharité M., de Mendonça S. N. (2019). Hydrodynamic Connectivity of Habitats of Deep-Water Corals in Corsair Canyon, Northwest Atlantic: A Case for Cross-Boundary Conservation. Front. Mar. Sci. 6. doi: 10.3389/fmars.2019.00159
Miller J. A. (2012). Species Distribution Models: Spatial Autocorrelation and non-Stationarity. Prog. Phys. Geogr. Earth Environ. 36, 681–692. doi: 10.1177/0309133312442522
Morán-Ordóñez A., Lahoz-Monfort J. J., Elith J., Wintle B. A. (2017). Evaluating 318 Continental-Scale Species Distribution Models Over a 60-Year Prediction Horizon: What Factors Influence the Reliability of Predictions? Glob. Ecol. Biogeogr. 26, 371–384. doi: 10.1111/geb.12545
Morato T., Dominguez-Carrió C., Mohn C., Ocaña Vincente O., Ramos M., Rodrigues L., et al. (2021). Dense Cold-Water Coral Garden of Paragorgia johnsoni Suggests the Importance of the Mid-Atlantic Ridge for Deep-Sea Biodiversity. Ecol. Evol. 00, 1–8. doi: 10.1002/ece3.8319
Morato T., González-Irusta J.-M., Dominguez-Carrió C., Wei C.-L., Davies A., Sweetman A. K., et al. (2020). Climate-Induced Changes in the Suitable Habitat of Cold-Water Corals and Commercially Important Deep-Sea Fishes in the North Atlantic. Glob. Change Biol. 26, 2181–2202. doi: 10.1111/gcb.14996
Mortensen P. B., Buhl-Mortensen L. (2004). Distribution of Deepwater Gorgonian Corals in Relation to Benthic Habitat Features in the Northeast Channel (Atlantic Canada). Mar. Biol. 144, 1223–1238. doi: 10.1007/s00227-003-1280-8
Moss R. H., Edmonds J. A., Hibbard K. A., Manning M. R., Rose S. K., van Vuuren D. P., et al. (2010). The Next Generation Scenarios for Climate Change Research and Assessment. Nature 463, 747–756. doi: 10.1038/nature08823
NAFO (2021) Northwest Atlantic Fisheries Organization Conservation and Enforcement Measures 2021. Serial No. N7153. NAFO/COM Doc. 21-01. Available at: https://www.nafo.int/Portals/0/PDFs/COM/2021/comdoc21-01.pdf.
Okubo A. (1971). Oceanic Diffusion Diagrams. Deep-sea. Res. 18, 789–802. doi: 10.1016/0011-7471(71)90046-5
Piper D. J. W., Campbell D. C. (2002). Surficial Geology of the Scotian Slope, Eastern Canada. Geol. Surv. Can. Curr. Res. 2002, E15.10.
Polovina J. J., Mitchum G. T., Evans G. T. (1995). Decadal and Basin-Scale Variation in Mixed Layer Depth and the Impact on Biological Production in the Central and North Pacific 1960-88. Deep-Sea. Res. 42, 1701–1716. doi: 10.1016/0967-0637(95)00075-H
Qiao H., Feng X., Escobar L. E., Peterson A. T., Soberón J., Zhu G., et al. (2018). An Evaluation of Transferability of Ecological Niche Models. Ecography 42, 521–534. doi: 10.1111/ecog.03986
Quattrini A. M., Nizinski M. S., Chaytor J. D., Demopoulos A. W., Roark E. B., France S. C., et al. (2015). Exploration of the Canyon-Incised Continental Margin of the Northeastern United States Reveals Dynamic Habitats and Diverse Communities. PLoS One 10, e0139904. doi: 10.1371/journal.pone.0139904
R Development Core Team (2020). R: A Language and Environment for Statistical Computing (Vienna, Austria: R Foundation for Statistical Computing).
Roberts D. R., Bahn V., Ciuti S., Boyce M. S., Elith J., Guillera-Arroita, et al (2017). Cross-Validation Strategies for Data With Temporal, Spatial, Hierarchical, or Phylogenetic Structure. Ecography 40, 913–929. doi: 10.1111/ecog.02881
Saba V. S., Griffies S. M., Anderson W. G., Winton M., Alexander M. A., Delworth T. L., et al. (2016). Enhanced Warming of the Northwest Atlantic Ocean Under Climate Change. JGR. Oceans. 121, 118–132. doi: 10.1002/2015JC011346
Sánchez J. A. (2005). Systematics of the Bubblegum Corals (Cnidaria: Octocorallia: Paragorgiidae) With Description of New Species From New Zealand and the Eastern Pacific. Zootaxa 1014, 1–72. doi: 10.11646/zootaxa.1014.1.1
Santos C., Agardy T., Andrade F., Calado H., Crowder L. B., Ehler C. N., et al. (2020). Integrating Climate Change in Ocean Planning. Nat. Sust. 3, 1–12. doi: 10.1038/s41893-020-0513-x
Schubert N., Brown D., Rossi S. (2017). “Symbiotic Versus Non-Symbiotic Octocorals: Physiological and Ecological Implications” in In Marine Animal Forests. Eds. Rossi S., Bramanti L., Gori A., Orejas Saco del Valle C. (Berlin: Springer-Verlag), 1–32. doi: 10.1007/978-3-319-17001-5_54-1
Sequeira A. M. M., Bouchet P. J., Yates K. L., Mengersen K., Caley M. J. (2018). Transferring Biodiversity Models for Conservation: Opportunities and Challenges. Methods Ecol. Evol. 9, 1250–1264. doi: 10.1111/2041-210X.12998
Shackell N., Loder J. W. (2012). “Climate Change and Its Effects on Ecosystems, Habitats and Biota,” in Atlantic Coastal Zone Information Steering Committee, Publisher is Coastal & Ocean Information Network Atlantic (COINAtlantic) based in Halifax, NS, Canada: Mailing Address: COINAtlantic Dalhousie University 6414 Coburg Road PO Box 15000 Halifax, NS B3H 4R2 29 p. Available at: https://0fb5ebe8ca924c3c9170ef778a77f76e.filesusr.com/ugd/cf2ff9_af28b1c825d943a6b204777ac87c0873.pdf.
Sherwood O. A., Edinger E. N. (2009). Ages and Growth Rates of Some Deep-Sea Gorgonian and Antipatharian Corals of Newfoundland and Labrador. Can. J. Fish. Aquat. Sci. 66, 142–152. doi: 10.1139/F08-195
Simard F., Laffoley D., J.M B. (Eds.) (2016). Marine Protected Areas and Climate Change: Adaptation and Mitigation Synergies, Opportunities and Challenges. Full Report (Gland, Switzerland: IUCN).
Simpson A. (2006) Reproduction in Octocorals (Subclass Octocorallia): A Review of Published Literature. Available at: https://userweb.ucs.louisiana.edu/~scf4101/Bambooweb/reviewrepro.pdf (Accessed December 14, 2021).
Sowers D. C., Masetti G., Mayer L. A., Johnson P., Gardner J. V., Armstrong A. A. (2020). Standardized Geomorphic Classification of Seafloor Within the United States Atlantic Canyons and Continental Margin. Front. Mar. Sci. 7. doi: 10.3389/fmars.2020.00009
Stanton J. C., Pearson R. G., Horning N., Ersts P., Reşit Akçakaya H. (2012). Combining Static and Dynamic Variables in Species Distribution Models Under Climate Change. Methods Ecol. Evol. 3, 349–357. doi: 10.1111/j.2041-210X.2011.00157.x
Stock C. A., Alexander M. A., Bond N. A., Brander K. M., Cheung W. W. L., Curchitser E. N., et al. (2011). On the Use of IPCC-Class Models to Assess the Impact of Climate on Living Marine Resources. Prog. Oceanogr. 88, 1–27. doi: 10.1016/j.pocean.2010.09.001
Strychar K. B., Kenchington E. L., Hamilton L. C., Scott D. B. (2011). Phylogenetic Diversity of the Cold Water Octocoral Paragorgia Arborea (Linnaeus 1758) Off the East Coast of Canada. Int. J. Biol. 3, 3–22. doi: 10.5539/ijb.v3n1p3
Sundahl H., Buhl-Mortensen P., Buhl-Mortensen L. (2020). Distribution and Suitable Habitat of the Cold-Water Corals Lophelia pertusa, Paragorgia Arborea, and Primnoa resedaeformis on the Norwegian Continental Shelf. Front. Mar. Sci. 7. doi: 10.3389/fmars.2020.00213
Townsend D. W., Pettigrew N. R., Thomas M. A., Neary M. G., McGillicuddy D. J. Jr., O’Connell J. (2015). Water Masses and Nutrient Sources to the Gulf of Maine. J. Mar. Res. 73, 93–122. doi: 10.1357/002224015815848811
Tremblay M. J., Black G. A. P., Branton R. M. (2007). The Distribution of Common Decapod Crustaceans and Other Invertebrates Recorded in Annual Ecosystem Surveys of the Scotian Shelf 1999-2006. Can. Tech. Rep. Fish. Aquat. Sci. 2762, iii + 74.
Valavi R., Elith J., Lahoz-Monfort J. J., Guillera-Arroita G. (2019). BlockCV: An R Package for Generating Spatially or Environmentally Separated Folds for K-Fold Cross-Validation of Species Distribution Models. Methods Ecol. Evol. 10, 225–232. doi: 10.1111/2041-210X.13107
van Vuuren D. P., Edmonds J., Kainuma M., Riahi K., Thomson A., Hibbard K., et al. (2011). The Representative Concentration Pathways: An Overview. Clim. Change 109, 5. doi: 10.1007/s10584-011-0148-z
Walbridge S., Slocum N., Pobuda M., Wright D. J. (2018). Unified Geomorphological Analysis Workflows With Benthic Terrain Modeler. Geosciences 8, 94. doi: 10.3390/geosciences8030094
Wang Z., Brickman D., Greenan B. J. W. (2019). Characteristic Evolution of the Atlantic Meridional Overturning Circulation From 1990 to 2015: An Eddy-Resolving Ocean Model Study. Deep. Sea. Res. I 149, 103056. doi: 10.1016/j.dsr.2019.06.002
Wang S., Kenchington E., Wang Z., Davies A. J. (2021). Life in the Fast Lane: Modeling the Fate of Glass Sponge Larvae in the Gulf Stream. Front. Mar. Sci. 8. doi: 10.3389/fmars.2021.701218
Wang S., Kenchington E. L., Wang Z., Yashayaev I., Davies A. J. (2020). 3-D Ocean Particle Tracking Modeling Reveals Extensive Vertical Movement and Downstream Interdependence of Closed Areas in the Northwest Atlantic. Sci. Rep. 10, 21421. doi: 10.1038/s41598-020-76617-x
Wang Z., Lu Y., Greenan B., Brickman D. (2018). BNAM: An Eddy-Resolving North Atlantic Ocean Model to Support Ocean Monitoring in Can. Tech. Rep. Hydrogr. Ocean Sci, 327vii + 18.
Wang S., Wang Z., Lirette C., Davies A., Kenchington E. (2019). Comparison of Physical Connectivity Particle Tracking Models in the Flemish Cap Region. Can. Tech. Rep. Fish. Aquat. Sci. 3353, v + 39.
Watanabe S., Metaxas A., Sameoto J., Lawton P. (2009). Patterns in Abundance and Size of Two Deep-Water Gorgonian Octocorals, in Relation to Depth and Substrate Features Off Nova Scotia. Deep-Sea. Res. I: Oceanogr. Res. Pap. 56, 2235–2248. doi: 10.1016/j.dsr.2009.09.003
Watling L., Auster P. J. (2005). “Distribution of Deep-Water Alcyonacea Off the Northeast Coast of the United States” in Cold-Water Corals and Ecosystems. Eds. Freiwald A. R., Roberts J. M. (Berlin: Springer-Verlag), 279–296.
Wood S. N. (2006). Generalized Additive Models: An Introduction With R (Boca Raton, Florida: Chapman & Hall/CRC Press).
Wright D. J., Pendleton M., Boulware J., Walbridge S., Gerlt B., Eslinger D., et al. (2012) ArcGIS Benthic Terrain Modeler (BTM), V. 3.0 (Massachusetts Office of Coastal Zone Management: Environmental Systems Research Institute, NOAA Coastal Services Center) (Accessed October 4, 2021).
Yates K. L., Bouchet P. J., Caley M. J., Mengersen K., Randin C. F., Parnell S., et al. (2018). Outstanding Challenges in the Transferability of Ecological Models. Trends Ecol. Evol. 33, 790–802. doi: 10.1016/j.tree.2018.08.001
Keywords: climate-change refugia, deep-sea coral, species distribution modeling, model transferability, lagrangian particle tracking, Paragorgia arborea, protected area design
Citation: Wang S, Murillo FJ and Kenchington E (2022) Climate-Change Refugia for the Bubblegum Coral Paragorgia arborea in the Northwest Atlantic. Front. Mar. Sci. 9:863693. doi: 10.3389/fmars.2022.863693
Received: 27 January 2022; Accepted: 03 June 2022;
Published: 11 July 2022.
Edited by:
Anna Metaxas, Dalhousie University, CanadaReviewed by:
Ashley Alun Rowden, National Institute of Water and Atmospheric Research (NIWA), New ZealandRebecca E. Ross, Norwegian Institute of Marine Research (IMR), Norway
Copyright © 2022 Wang, Murillo and Kenchington. This is an open-access article distributed under the terms of the Creative Commons Attribution License (CC BY). The use, distribution or reproduction in other forums is permitted, provided the original author(s) and the copyright owner(s) are credited and that the original publication in this journal is cited, in accordance with accepted academic practice. No use, distribution or reproduction is permitted which does not comply with these terms.
*Correspondence: Ellen Kenchington, RWxsZW4uS2VuY2hpbmd0b25AZGZvLW1wby5nYy5jYQ==
†These authors share first authorship