 Matt I. D. Carter1*
 Lars Boehme1
 Michelle A. Cronin2
 Callan D. Duck1
 W. James Grecian1
 Gordon D. Hastie1
 Mark Jessopp2
 Jason Matthiopoulos3Bernie J. McConnell1†David L. Miller4,5Chris D. Morris1Simon E. W. Moss1
 Dave Thompson1
 Paul M. Thompson6
 Debbie J. F. Russell1,4*
- 1Sea Mammal Research Unit, Scottish Oceans Institute, University of St Andrews, St Andrews, United Kingdom
- 2School of Biological, Earth and Environmental Science, University College Cork, Cork, Ireland
- 3Institute of Biodiversity, Animal Health and Comparative Medicine, College of Medical, Veterinary and Life Sciences, University of Glasgow, Glasgow, United Kingdom
- 4Centre for Research into Ecological & Environmental Modelling, University of St Andrews, St Andrews, United Kingdom
- 5School of Mathematics & Statistics, University of St Andrews, St Andrews, United Kingdom
- 6University of Aberdeen, School of Biological Sciences, Lighthouse Field Station, Cromarty, United Kingdom
Marine predator populations are crucial to the structure and functioning of ecosystems. Like many predator taxa, pinnipeds face an increasingly complex array of natural and anthropogenic threats. Understanding the relationship between at-sea processes and trends in abundance at land-based monitoring sites requires robust estimates of at-sea distribution, often on multi-region scales. Such an understanding is critical for effective conservation management, but estimates are often limited in spatial extent by spatial coverage of animal-borne tracking data. Grey (Halichoerus grypus) and harbour seals (Phoca vitulina) are sympatric predators in North Atlantic shelf seas. The United Kingdom (UK) and Ireland represents an important population centre for both species, and Special Areas of Conservation (SACs) are designated for their monitoring and protection. Here we use an extensive high-resolution GPS tracking dataset, unprecedented in both size (114 grey and 239 harbour seals) and spatial coverage, to model habitat preference and generate at-sea distribution estimates for the entire UK and Ireland populations of both species. We found regional differences in environmental drivers of distribution for both species which likely relate to regional variation in diet and population trends. Moreover, we provide SAC-specific estimates of at-sea distribution for use in marine spatial planning, demonstrating that hotspots of at-sea density in UK and Ireland-wide maps cannot always be apportioned to the nearest SAC. We show that for grey seals, colonial capital breeders, there is a mismatch between SACs (where impacts are likely to be detected) and areas where impacts are most likely to occur (at sea). We highlight an urgent need for further research to elucidate the links between at-sea distribution during the foraging season and population trends observed in SACs. More generally, we highlight that the potential for such a disconnect needs to be considered when designating and managing protected sites, particularly for species that aggregate to breed and exhibit partial migration (e.g. grey seals), or spatial variation in migration strategies. We demonstrate the use of strategic tracking efforts to predict distribution across multiple regions, but caution that such efforts should be mindful of the potential for differences in species-environment relationships despite similar accessible habitats.
Introduction
Marine ecosystems are facing an unprecedented biodiversity crisis, with multiple compounding impacts such as overfishing, climate change, and anthropogenic habitat modification (Worm et al., 2006; Brook et al., 2008; Maxwell et al., 2013; McCauley et al., 2015). Quantifying the effects of human activity on marine systems and prioritising conservation efforts is a complex, multifaceted yet pressing concern (Parsons et al., 2014; Venegas-Li et al., 2018; Nelms et al., 2021). Marine predators are often considered sentinels of ecosystem health (Hazen et al., 2019) or indicators of environmental change (Croxall et al., 2002), and hotspots of predator abundance are assumed to represent areas of ecosystem-level importance (Worm et al., 2003; Raymond et al., 2015; Hindell et al., 2020). Understanding what characterises important habitat for marine predators is therefore critical to prioritising conservation efforts and informing marine spatial planning.
Species that return to land between foraging trips and/or to breed such as seabirds, sea turtles and pinnipeds offer a unique opportunity to monitor trends in abundance (Nel et al., 2013; Sherley et al., 2018; Russell et al., 2019). However, linking any observed changes in abundance at land-based monitoring sites to potential threats occurring at sea requires robust estimates of at-sea distribution (Witt et al., 2011; Hindell et al., 2017; Fauchald et al., 2021). This is especially pertinent for protected sites on land, where observed population trends may inform conservation efforts and influence marine spatial planning (Nel et al., 2013). Animal-borne tracking technology allows ecologists to reconstruct the at-sea movements of marine predators, and gain insights into their behaviours and habitat associations (Hazen et al., 2012). Tracking data can be used in habitat preference models to investigate the environmental drivers of distribution and identify areas of suitable or important offshore habitat (Aarts et al., 2008; Raymond et al., 2015; Reisinger et al., 2018). When combined with spatially resolved abundance data (e.g. land counts), these models can be used to predict the spatial variation in density of a population at sea (Wakefield et al., 2017; Fauchald et al., 2021). Such habitat-based distribution maps are integral to effective marine spatial planning, and often inform environmental impact assessments for proposed activities. However, a limiting factor for providing such distribution estimates across a large spatial scale is the requirement of a large sample size of tagged individuals, often covering multiple centres of abundance in different regions (Wakefield et al., 2017; Fauchald et al., 2021). This is further complicated by the fact that a predator population may occupy different habitat types throughout the study range, yet studies often assume one species-environment relationship. Indeed, recent research suggests that in such cases regional habitat preference models are more appropriate than single models (Torres et al., 2015; Mannocci et al., 2020). Nevertheless, species distribution estimates across multi-region study areas are generally restricted to predictions from single models (Wakefield et al., 2017; Fauchald et al., 2021), or predictions for discrete areas from regional models (Huon et al., 2021), and no framework exists to combine predictions from regional models into a continuous distribution map.
The need for robust species distribution estimates is especially pertinent given the widespread and rapidly changing extent of anthropogenic activity on marine predator habitat, alongside efforts to reduce biodiversity loss (McCauley et al., 2015). Against a backdrop of decommissioning of offshore oil and gas infrastructure, the drive to reduce reliance on fossil fuels is leading to extensive planning and construction of offshore marine renewable energy installations around the world (Magagna and Uihlein, 2015; Borthwick, 2016; Wright et al., 2020). Installations such as windfarms and tidal turbine arrays often overlap with predator foraging areas or travel routes, raising concerns about collision risk for flying seabirds with wind turbines (Bradbury et al., 2014) or marine mammals and diving seabirds with tidal turbines (Waggitt and Scott, 2014; Onoufriou et al., 2019), as well as fitness consequences of avoidance behaviour (Masden et al., 2010; Russell et al., 2016; Palmer et al., 2021) and auditory damage for aquatic species (Bailey et al., 2010; Hastie et al., 2015; Whyte et al., 2020) associated with construction and operation. Special Areas of Conservation (SACs) are part of the marine spatial planning toolkit used in the European Union (EU), allowing member states to designate areas for protection that are expected to make a significant contribution to habitats and species conservation targets laid out in the EU Habitats Directive (European Council Directive 92/43/EEC). In the EU and United Kingdom (UK) - which retained the fundamental requirements of the Habitats Directive in domestic law after leaving the EU in January 2021 – as part of the consenting process developers must consider potential impacts on protected species such as marine mammals and seabirds, and the potential for such impacts to propagate to sites designated for their conservation. Consequently, there has been a drive to quantify the connectivity between offshore anthropogenic activities and designated conservation areas (such as SACs and Special Protection Areas (SPAs) for seabirds). One such approach is to “apportion” at-sea species density estimates in a given area (e.g. impact zone or footprint of a development) to specific designated conservation areas. However, to date this work has largely focussed on linking seabird at-sea distributions during the breeding season to land-based SPAs (Butler et al., 2017; Fauchald et al., 2021), or individual tagged seals to land-based SACs.
Grey (Halichoerus grypus) and harbour seals (Phoca vitulina) are high trophic level predator species listed on Annex II of the Habitats Directive, meaning that EU member states (and the UK) have an obligation to designate SACs, monitor their populations and maintain them in a “Favourable Conservation Status” (FCS). The UK and Ireland represents an important population centre for both species, with ~37% of global grey seal pup production (i.e. number of pups born), and ~36% of the Eastern Atlantic subspecies of harbour seals (P. vitulina vitulina) (SCOS, 2020). Both species co-occur around much of the UK and Irish coastline (Jones et al., 2015), but their breeding and moult cycles are asynchronous, and harbour seals can undertake foraging trips during lactation, whereas grey seals are typical capital breeders which aggregate in colonies during the breeding season (Bonner, 1972). Grey seal population monitoring (largely focussed on pup production) over the past 40 years has revealed a steady increase in numbers, but the rate of growth varies regionally (SCOS, 2020). Indeed, abundance appears to be at carrying capacity in the west and north of Scotland; pup production plateaued between 1990 and 2000 (Russell et al., 2019). In contrast, pup production along the UK mainland coast of the North Sea, which holds a substantial proportion (~62%) of the UK and Ireland abundance (SCOS, 2020), has continued to grow exponentially since the 1980s (Russell et al., 2019). Although harbour seal abundance in the UK and Ireland (monitored during the annual moult) in 2019 was comparable to in the late 1990s, there was marked variation in regional population trends, with some areas experiencing catastrophic declines (e.g. Orkney and East Scotland), while others were stable or increasing (Thompson et al., 2019). As yet these declines are unexplained, but are likely related to processes occurring at sea (Thompson et al., 2019). There is evidence of dietary overlap in some areas (Wilson and Hammond, 2019), and grey seals are known to predate harbour seals (van Neer et al., 2015; Brownlow et al., 2016), but the extent of predatory and competitive interactions between the two species, and their contribution to population trends, remains unknown.
Previous work has predicted the at-sea distributions of grey and harbour seal populations in the UK and Ireland using a model-supervised kernel smoothing approach applied to tracking data (Matthiopoulos et al., 2004; Jones et al., 2013; Jones et al., 2015; Russell et al., 2017). Although these “usage maps” have been widely used in marine spatial planning, they now require updating in light of recent changes in regional population trends and the existence of new higher resolution satellite tracking datasets. Moreover, although the track smoothing approach is highly effective for mapping distribution emanating from haulout sites in areas with a wealth of tracking data, it does have certain limitations. Firstly, it does not provide ecological insights into the environmental drivers of distribution, which could help to elucidate the causes of species-specific regional variation in population trends. Secondly, estimates were based on the distribution of tagged individuals, and only a subset of all haulouts used by grey and harbour seals were visited by tagged individuals. Thus, for the remaining haulouts predictions were based on “null usage”; the assumption that usage declines with distance from the haulout (Jones et al., 2013; Russell et al., 2017). Hotspots of important foraging habitat are likely to be heterogeneously distributed offshore, and if none of the tracked seals visited a certain foraging patch, this approach would underestimate or overlook density in that area. Other studies have modelled tracking data in a habitat preference framework and predicted seal distribution in specific discrete areas of the UK and Ireland (Aarts et al., 2008; Bailey et al., 2014; Jones et al., 2017; Huon et al., 2021), but no study has used habitat preference to generate distribution estimates for the whole of the UK and Ireland. Given the regional differences in habitat characteristics (Huon et al., 2021), population dynamics (Thomas et al., 2019; Thompson et al., 2019), diet (Gosch et al., 2019; Wilson and Hammond, 2019), and foraging trip characteristics (Huon et al., 2021) of both seal species, a single habitat preference model would likely produce unrealistic results when used to generate predicted distributions across multiple regions. Therefore, updated distribution estimates are required for the entire populations for both species, based on regional habitat preference.
In the UK and Ireland, grey and harbour seals are primary or qualifying features for 23 and 25 SACs respectively (Natura 2000 data - the European network of protected sites, European Environment Agency, 2021), yet these sites are focussed entirely on coastal haulout sites or breeding colonies and adjacent waters, and do not consider important foraging habitat offshore. Moreover, links between grey and harbour seal distribution at sea and use of land-based SACs have not been explored in detail. In the absence of such information, developers may assume that high at-sea density is attributable to individuals from the nearest SAC. However, foraging areas may be hundreds of kilometres from coastal haulout sites (McConnell et al., 1999). Moreover, grey seals exhibit partial migration; some move between different regions for breeding and foraging, meaning that seals that breed in a given SAC do not necessarily forage nearby (Russell et al., 2013). Understanding how seal density at sea during the foraging season relates to SAC use is therefore an important step in providing effective tools for marine spatial planning.
In this study we utilise an extensive, high resolution (GPS) satellite tracking dataset, unprecedented in both size (114 grey and 239 harbour seals) and spatial extent (covering most major centres of abundance across the UK and Ireland), to build regional habitat preference models. We then use these models, combined with spatially resolved abundance data (haulout counts), to predict the at-sea distribution of all grey and harbour seals hauling-out in the UK and Ireland, and provide updated distribution maps for use in marine spatial planning. We also provide the first SAC-specific estimates of distribution, demonstrate their application to real world planning scenarios, and examine the spatial coherence between SACs and areas of high at-sea density for each species in the context of conservation management. Lastly, we examine the seasonal movements of grey seals in relation to SACs and consider to what degree SAC-specific distribution estimates are indicative of where the SAC population is distributed outside of the breeding season.
Materials and Methods
Study Area
The study area comprised the whole of the UK, Ireland and Isle of Man. This area was divided into regions for habitat preference modelling (Figure 1). Regional boundaries were broadly based on the Seal Monitoring Units (SMUs) used in UK seal conservation and management (SCOS, 2020), but with some alterations to incorporate Ireland and the Isle of Man, and to maximise the predictive power of the models, accounting for the availability of tracking data (Figure 2), as well as spatial differences in movement patterns and the heterogeneity of habitat, and ensuring that clusters of haulout sites were not split by regional boundaries. Each region was assigned a sequential number, used here throughout (Figure 1).
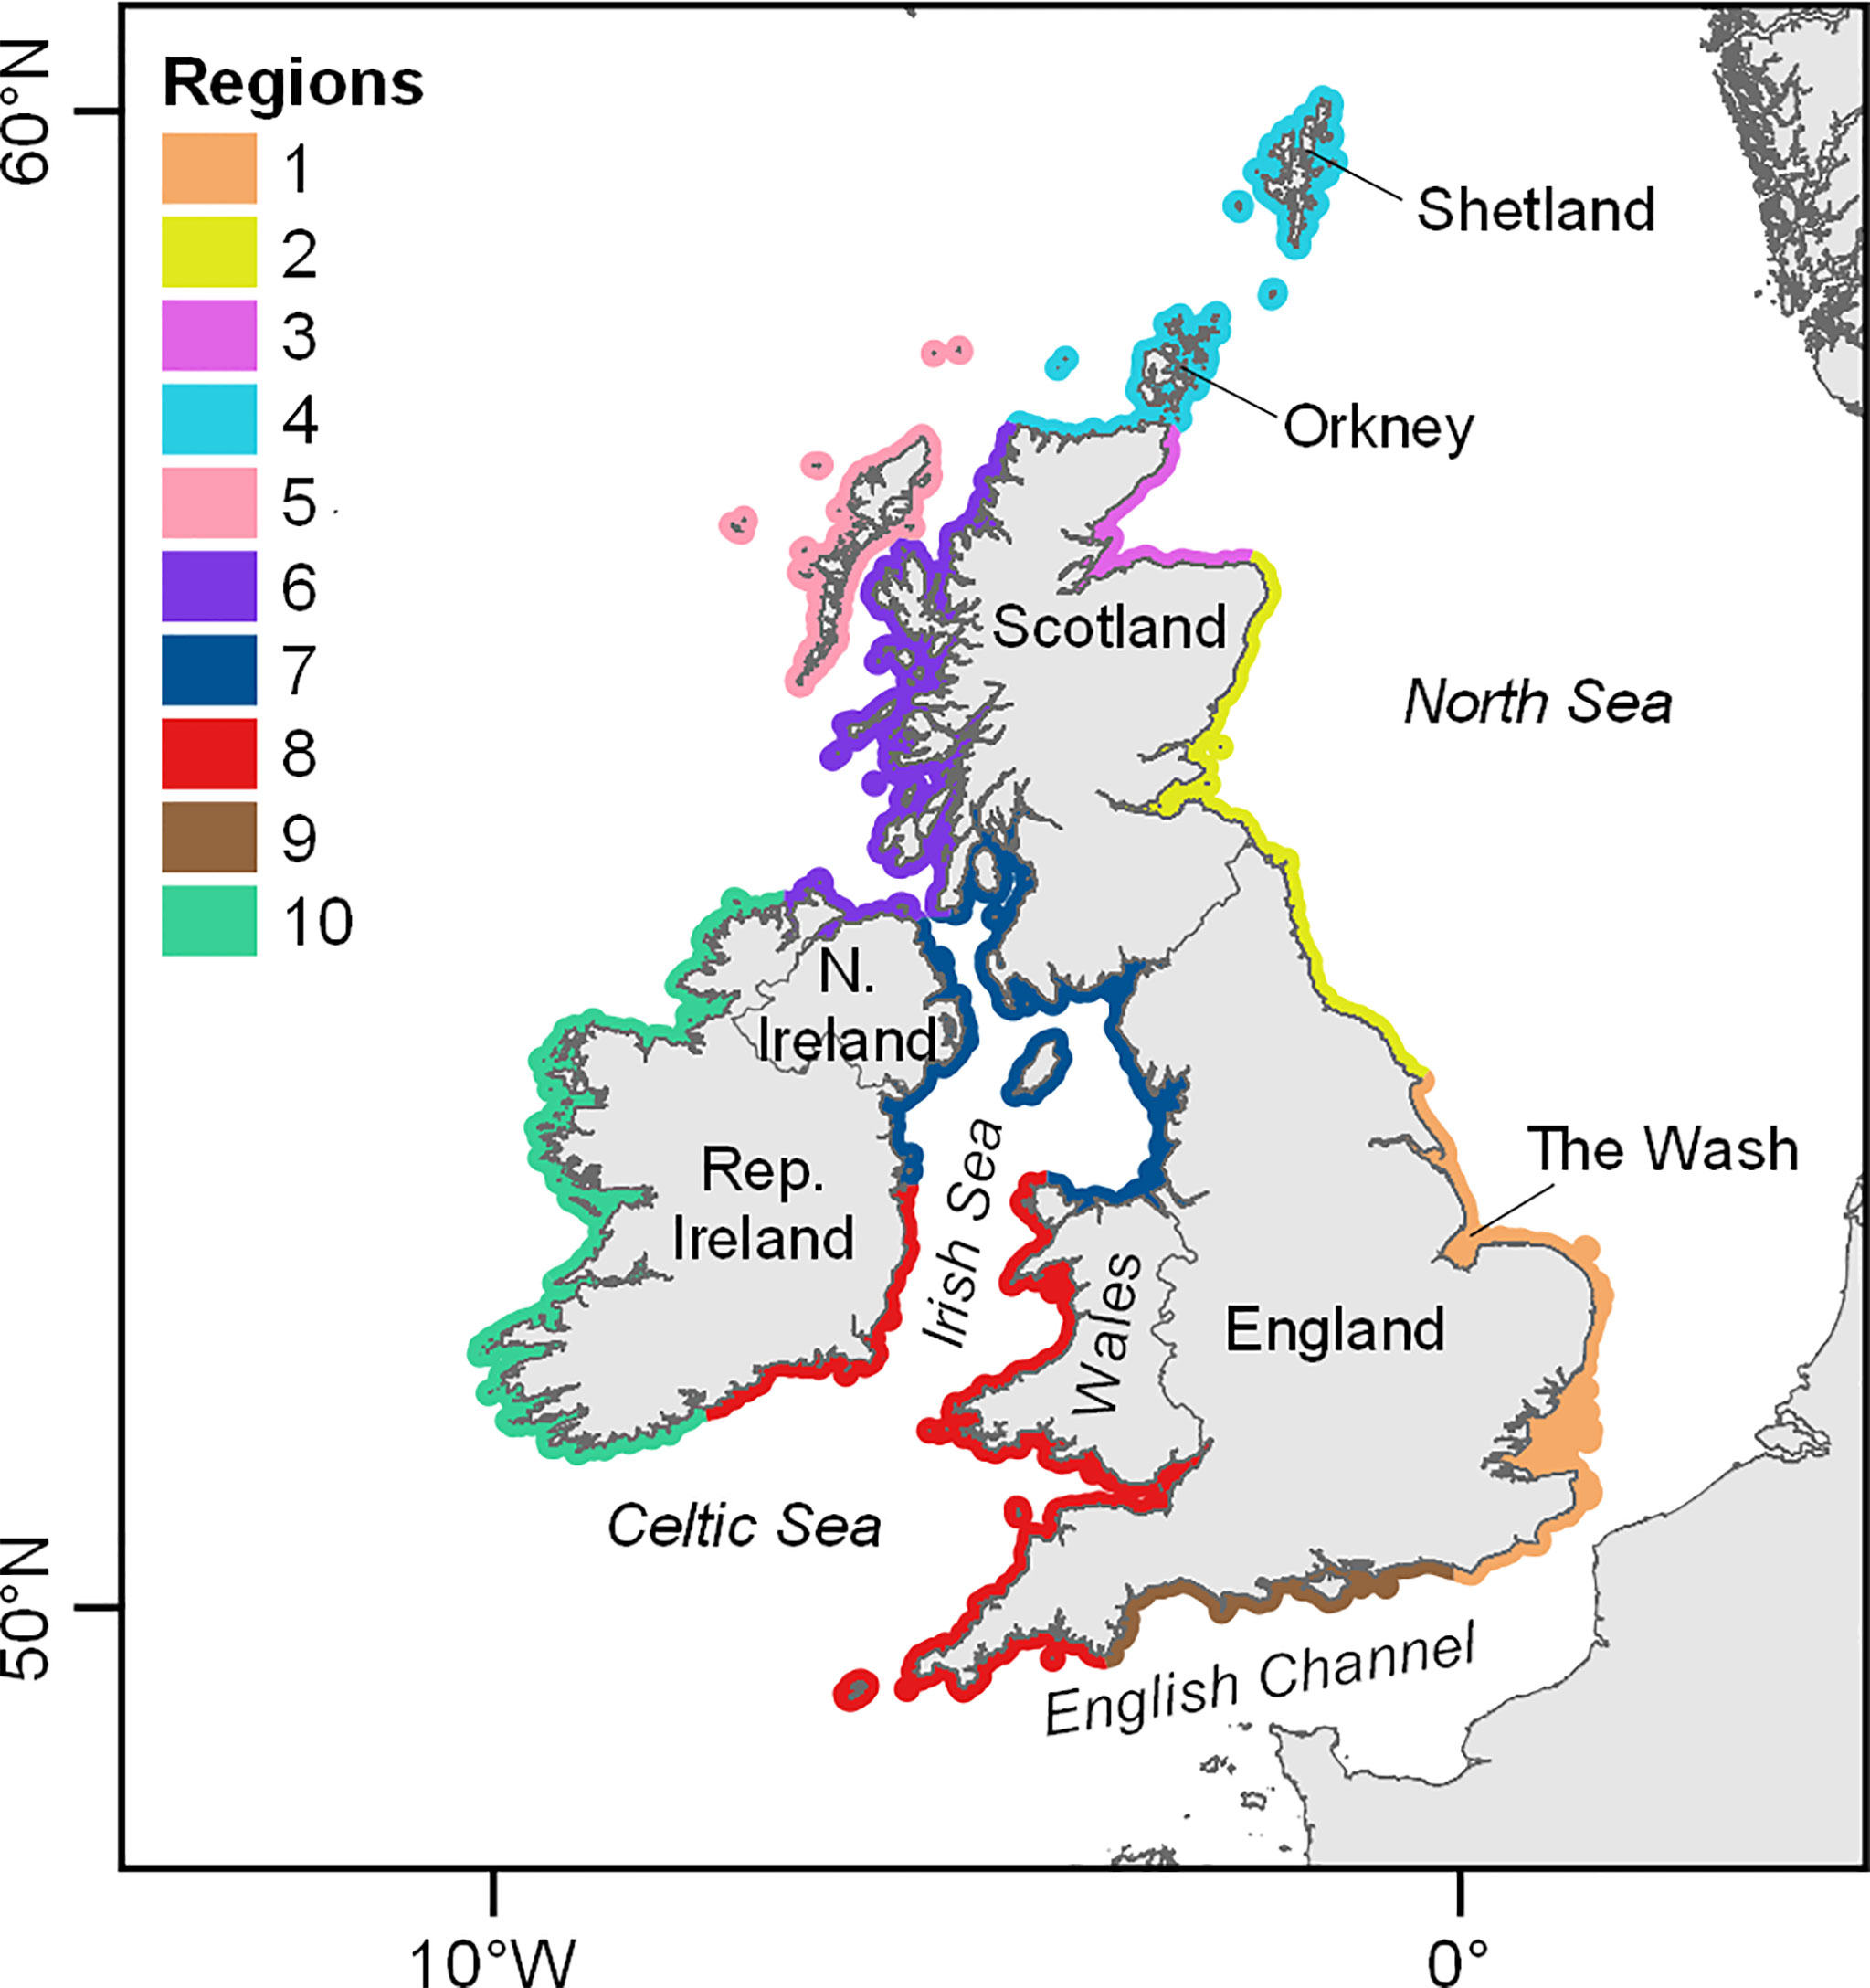
Figure 1 Map of the study area showing regional designations for habitat preference models. 1: Southeast England, 2: East Coast, 3: Moray Firth, 4: North Coast & Northern Isles, 5: Western Isles, 6: West Scotland & Ireland North, 7: Irish Sea North, 8: Celtic Sea & Irish Sea South, 9: English Channel. 10: West Ireland.
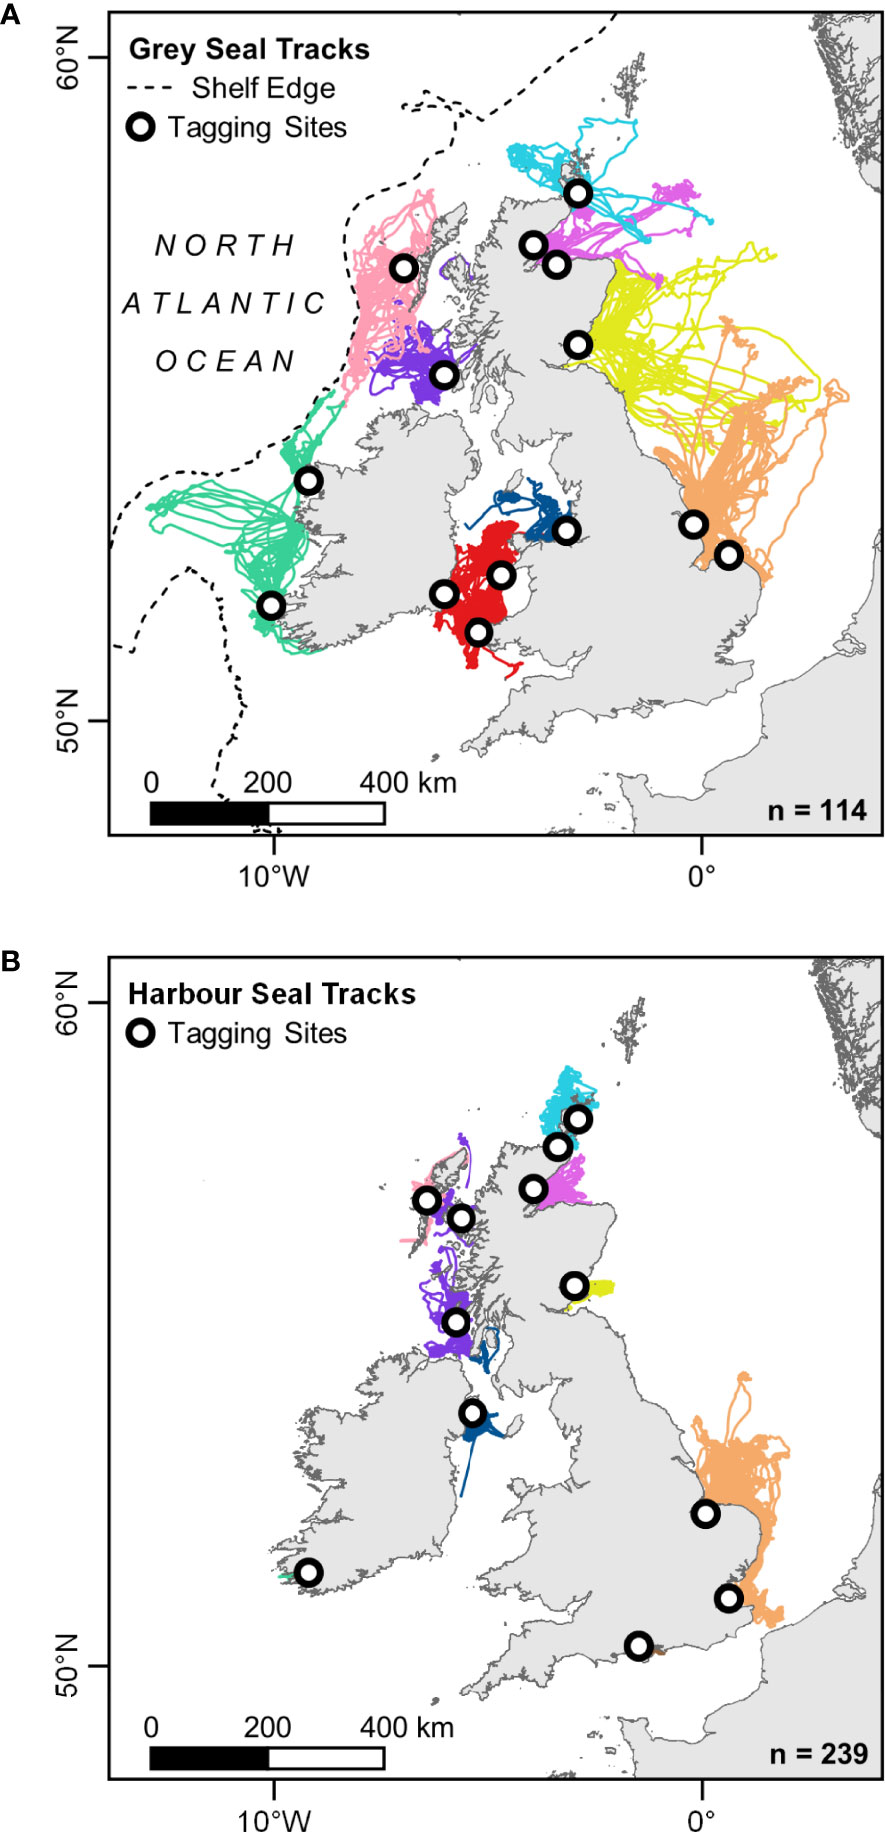
Figure 2 Satellite tracking data for (A) 114 grey, and (B) 239 harbour seals, colour-coded by habitat preference region (see Figure 1). Data shown have been cleaned to remove erroneous location estimates, trips between regions and locations during the corresponding species’ breeding season. Shelf edge is shown as the 600 m isobath.
Tracking Data
Grey (n = 114: 45 M, 69 F) and harbour seals (n = 239: 107 M, 132 F) were tagged at 26 sites in the UK and Ireland between 2005 and 2019 (Supplementary Material S1). All seals were estimated to be >1 year old based on mass and body length. Seals were captured on, or close to, haulout sites using seine, pop-up, tangle, or hand nets. Seals were instrumented with Fastloc® GPS phone tags or dual tags (GPS-GSM-ARGOS) (SMRU Instrumentation, UK), glued to fur at the base of the skull following the procedure outlined by Sharples et al. (2012). For analysis in habitat preference models, data were cleaned following Russell et al. (2016) to remove erroneous location estimates and data during the breeding and moulting seasons (grey seals: September – April, harbour seals: June – August), regularised to a constant 2 h time step and partitioned into trips at sea. Trips were then assigned to one of the ten regional designations for habitat preference models (see Figure 1) based on the location of the haulout sites used at the start and end of each trip. At-sea locations were only included in the analysis if they belonged to trips that originated and terminated at haulout sites in the same region (grey seals: 93% of locations, harbour seals: 99.5% of locations). For detailed data cleaning and processing protocol, see Supplementary Material S2. The resulting dataset for grey seals comprised 3,276 trips (61,296 temporally regularised at-sea locations) throughout the summer foraging season (May – August) (Figure 2A). The dataset for harbour seals comprised 8,579 trips (99,159 temporally regularised at-sea locations) throughout the autumn-winter-spring foraging season (September – May) (Figure 2B).
Use-Availability Design
Under a “use-availability” study design (Johnson, 1980; Aarts et al., 2008; Matthiopoulos et al., 2020), accessibility polygons were generated for each haulout location in the tracking datasets, with a radius based on the maximum geodesic distance (shortest path at sea without crossing land) from a haulout by any seal in the cleaned tracking dataset (Russell et al., 2016) (grey seals: 448 km, harbour seals: 273 km), thus representing the species’ maximum foraging range (Wakefield et al., 2009). For each regularised seal location, a random sample of control points was generated within the corresponding accessibility polygon, representing the available habitat that is accessible to the tagged seal (Aarts et al., 2008; Beyer et al., 2010). The ratio of control points to presences was set using model coefficient stability analysis (Beyer et al., 2010; Ventura et al., 2019), and varied between the species and among regions from 15:1 to 25:1 (see Supplementary Material S3 for more details). In this use-availability framework, areas where seals go (presences; seal location data) are modelled alongside areas where they could go (control points) (Matthiopoulos, 2003). Preference for a particular habitat type is inferred where its use is disproportionate to its availability (Johnson, 1980; Matthiopoulos et al., 2020).
Environmental Covariates
A range of static and seasonally dynamic environmental variables were extracted for each seal location and control point and included as candidate explanatory covariates in a maximal model for each species in each region (Figure 3). These covariates included: distance to haulout site, water depth, substrate type, mean winter sea surface temperature (SST) lagged by one year, water column vertical stratification, Δ stratification (spatial variation in stratification values, analogous to frontal intensity), seabed slope, rugosity and proximity to the continental shelf break (see Supplementary Material S4 for more detail). Covariates were chosen because of known or potential biological relevance to seals and/or their prey, or to account for the effects of accessibility on habitat selection.
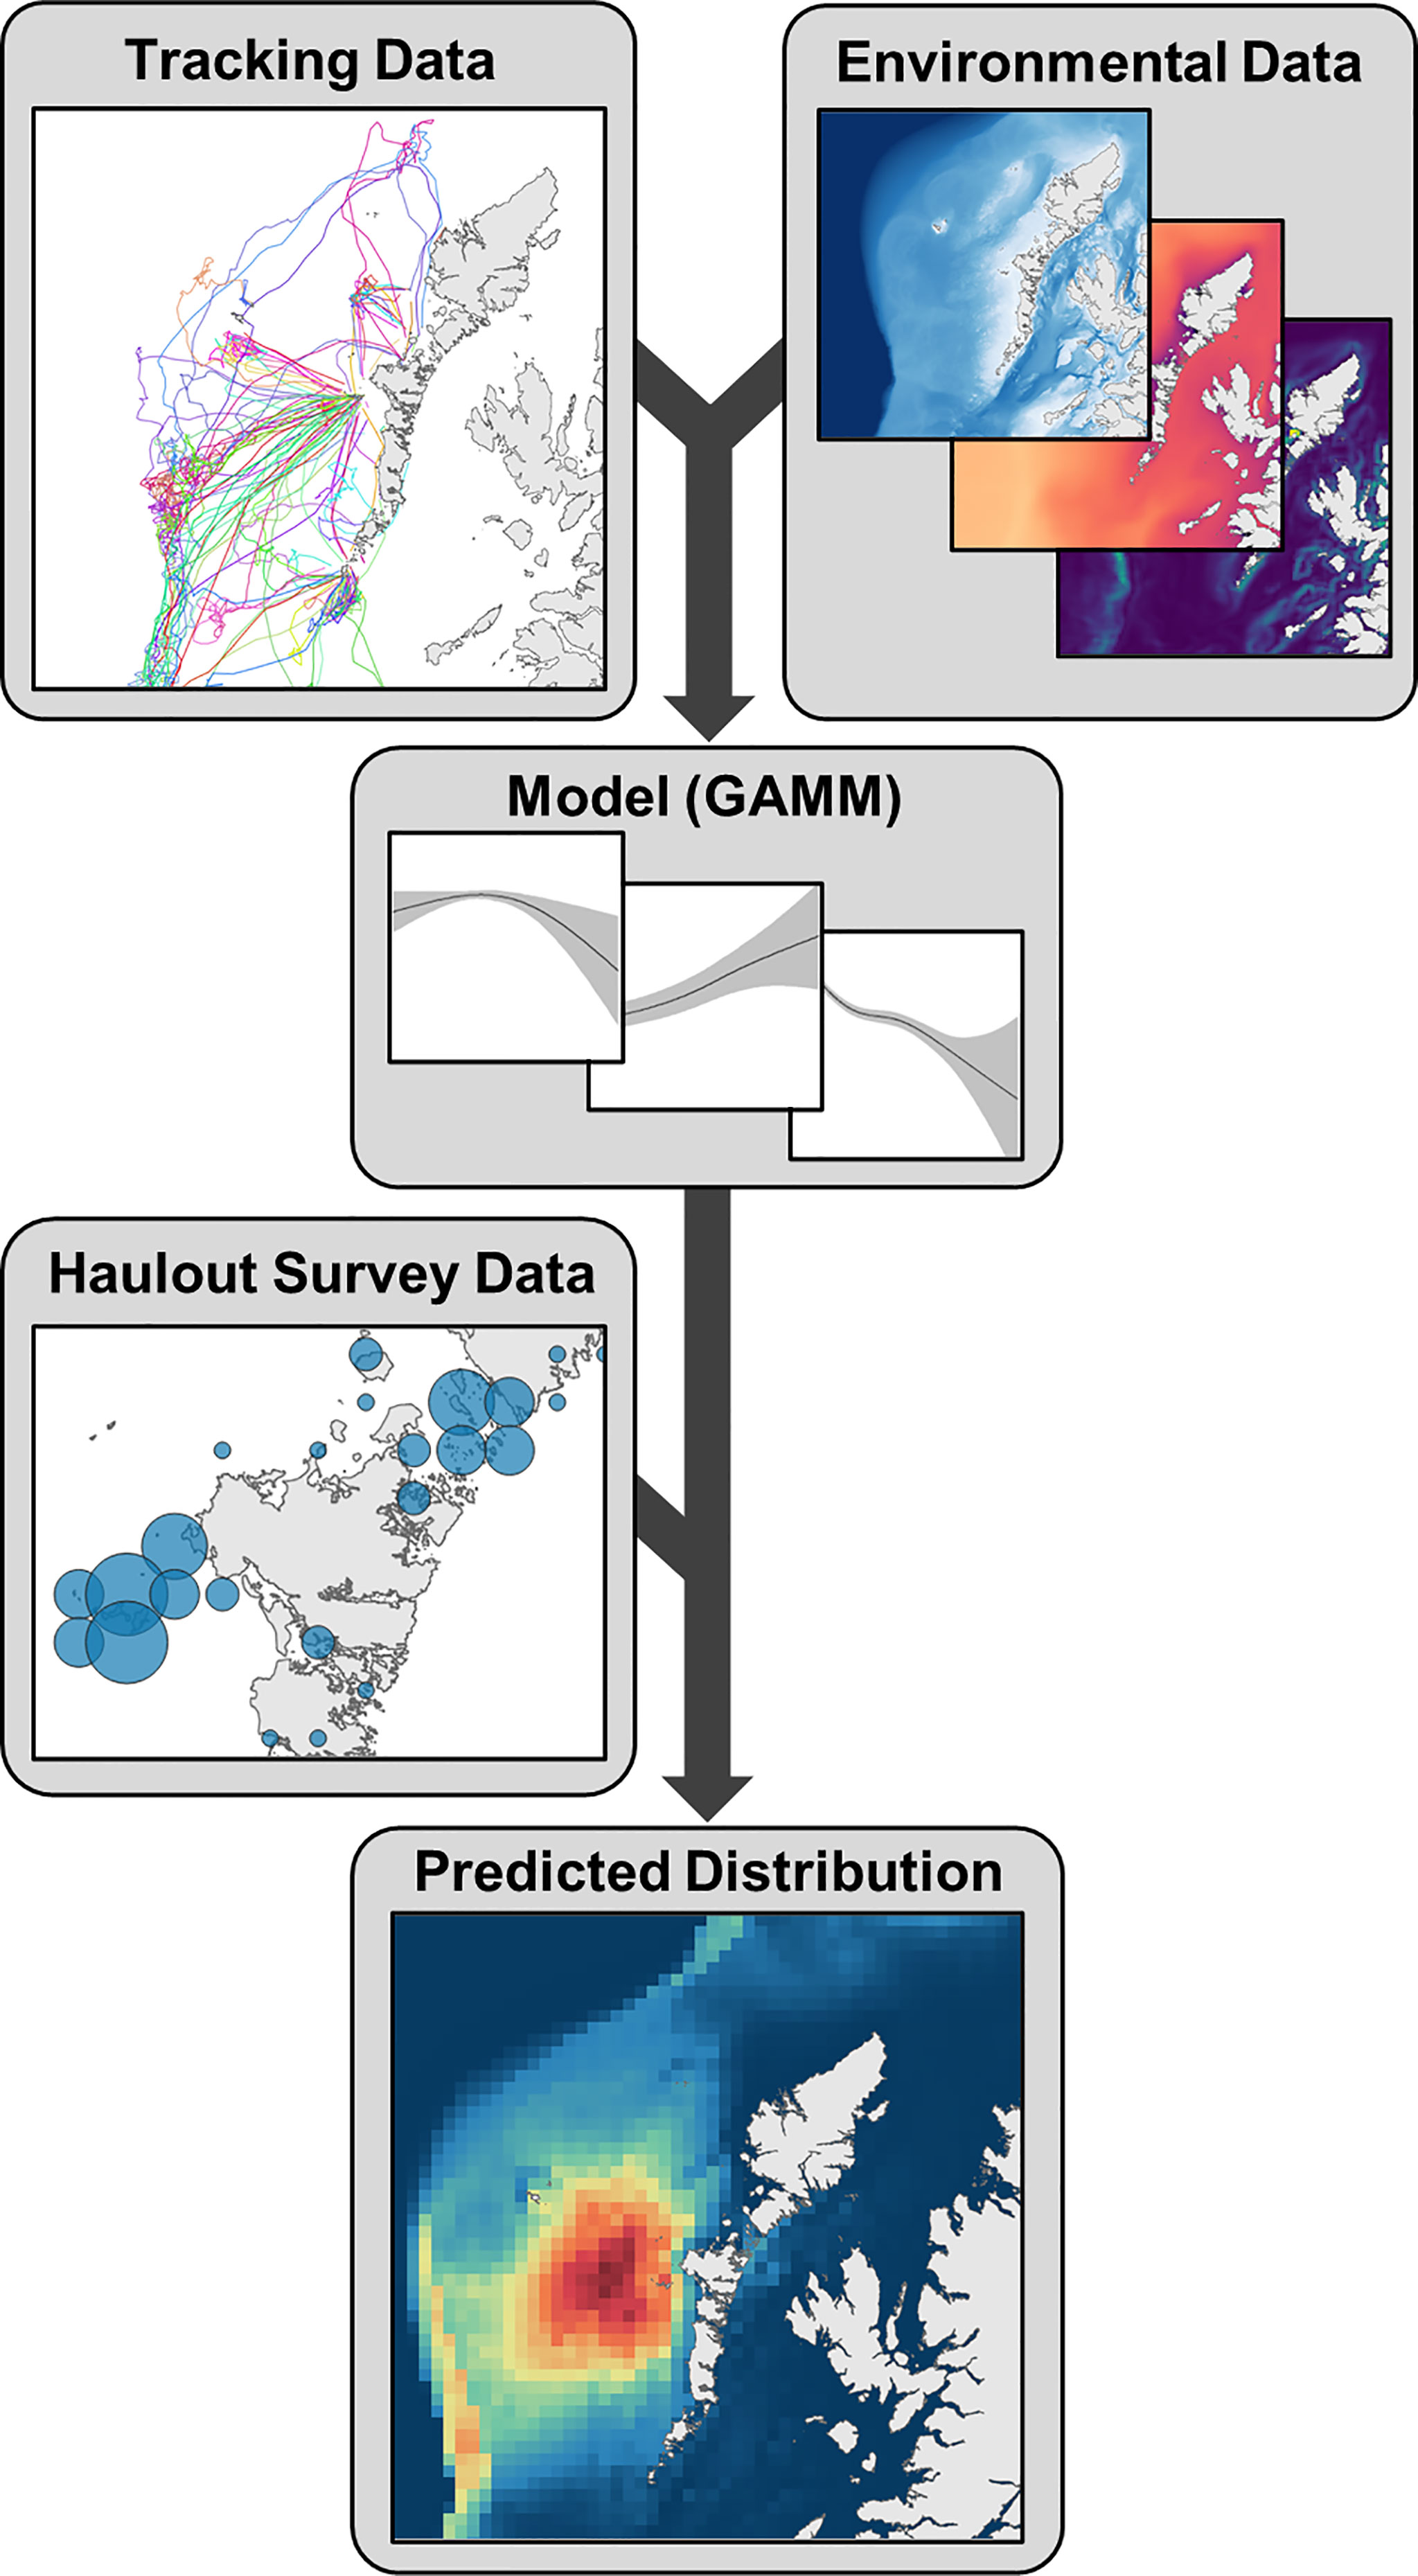
Figure 3 Schematic representation of the methods relating to distribution estimation. Environmental data are extracted for seal tracking locations and availability sample and modelled in regional Generalized Additive Mixed Models (GAMMs). Model predictions are weighted by most recent haulout counts to generate at-sea density estimates. Regional estimates are then combined into one distribution map for the UK and Ireland.
Habitat Preference Modelling
For each species-region combination, a binomial response term (0/1; control/presence) was modelled as a function of environmental covariates in a generalized additive mixed model (GAMM) using the package “mgcv” (Wood, 2020) in R (R Core Team, 2020). Individual seal ID was included as a random intercept. This meant that the relationships in the models were estimated across individuals rather than data points, ensuring that data-rich individuals did not have a disproportionate influence on the overall trends. Control points were weighted in the models according to the ratio of control points to presences, such that each set contributed the same as one presence. I.e., if the ratio of control points to presences was 20:1, then each control point would be weighted at 0.05 (1/20). Each continuous covariate was fitted as a smoothed term with shrinkage, such that uninformative terms can be penalised to zero, effectively making them linear (Wood, 2020). To ensure smooth functions reflected plausible biological relationships, the number of knots (k) was determined for each smooth by trialling different values (2≤k ≤ 10) and selecting that which minimised the model Akaike Information Criterion (AIC) score whilst still returning a relationship that was biologically interpretable. Maximal models were simplified to a minimal adequate model using a two-stage approach comprising: (i) backwards model selection by AIC score and (ii) k-fold cross validation (Supplementary Material S5).
Seal Haulout Counts
Haulout count data were used to weight model spatial predictions (Figure 3; see below). These data comprised counts of grey and harbour seals on terrestrial haulouts from aerial and ground survey platforms, conducted during August (Supplementary Material S6) (Morris and Duck, 2019; SCOS, 2020). In brief, Scotland (SCOS, 2020), Northern Ireland (SCOS, 2020), eastern England (with the exception of the Tees Estuary) (Cox et al., 2020; SCOS, 2020), and Republic of Ireland (Morris and Duck, 2019) were surveyed aerially. Data for the remaining areas (rest of England, Isle of Man and Wales) were comprised of ground and boat counts from multiple organisations (see Supplementary Material S6 for full list of sources). Counts were aggregated to 5 km x 5 km grid cells (hereafter ‘haulout cells’). Survey effort varied spatially; for this study the most recent available counts were used for each haulout cell. The vast majority of counts (94.4%) were recorded from 2015 - 2018 (Figure S6.1).
UK and Ireland Distribution Estimates
A prediction grid was generated on a 5 km x 5 km cell resolution encompassing the at-sea area accessible to seals from all haulout cells in the study area (UK, Isle of Man and Ireland). Environmental data corresponding to the modelled covariates were extracted for each cell (see Supplementary Material S7.1). Data for non-static covariates were extracted for 2018. Spatial predictions of relative at-sea density (mean and associated lower and upper 95% confidence intervals) were generated per species using the corresponding region-specific habitat preference model (Figure 3). Predictions were made emanating from each haulout cell with a non-zero count in the most recent survey (Figure S6.2). Raw predictions (on the logit scale) were exponentiated, then normalised (Manly et al., 2002; Matthiopoulos et al., 2020). Haulout-specific prediction surfaces were then weighted by the number of individuals counted on the most recent survey. These weighted prediction surfaces were then summed into a multi-region surface and normalised. The mean distribution estimates therefore represent the percentage of the at-sea population for the UK and Ireland (i.e. excluding hauled-out animals) estimated to be present in each cell at any one time (see Supplementary Material S7.2 for more detail). Thus, cells in the mean relative density distribution map sum to 100%. Cell-wise lower and upper 95% Bayesian credible intervals (hereafter confidence intervals) were generated using a posterior simulation approach (Wood, 2006; Augustin et al., 2013) (Supplementary Material S7.3). For some applications, estimates of absolute density (i.e. number of seals) are favourable to relative density. Here, we present distribution maps as relative density (see “Technical Considerations” in Discussion for rationale). However, the mean prediction can be converted to absolute density using population scalars derived from telemetry data, and this process is explained in Supplementary Material S7.4. In brief, haulout counts are scaled to total population size for UK and Ireland using the mean estimated proportion of the population hauled-out during the survey window (and thus available to count). Total population size is then scaled to at-sea population size using the mean estimated proportion of time seals spend at-sea during the months that the maps represent (i.e. excluding breeding and moulting). Relative density estimates (percentage of the at-sea population) can then be converted to absolute density using the estimated at-sea population size. However, an important consideration with these absolute density estimates is that uncertainty in the scalars is not propagated through to the confidence intervals around the mean, which only reflect uncertainty in the habitat preference relationships.
Distribution Estimates for SACs
Using the spatial prediction approach described above, distribution estimates can be made emanating from specific haulout cells, allowing users to apportion at-sea abundance to specific areas, such as designated sites. To investigate the at-sea distribution of seals that haul-out in SACs, at-sea density estimates (mean and associated lower and upper 95% confidence intervals) were generated, for both species, for haulout cells within each of the SACs in the UK and Ireland for which the species is a primary or qualifying feature for designation using the associated regional habitat preference model. As above, estimates were normalised to represent the percentage of the at-sea population for that SAC present in each grid cell (i.e. relative density), thus cells in the mean distribution map sum to 100%, representing at-sea distribution of all individuals hauling-out in the SAC during the main foraging season. To demonstrate how these estimates may be used in an applied sense to apportion at-sea seal density to an SAC, grey seal estimates for both the Isle of May SAC and the Berwickshire and North Northumberland Coast SAC were converted to absolute density using the most recent counts (SAC totals) and population scalars (Russell et al., 2015; Russell and Carter, 2021) (Supplementary Material S7.4). The number of seals estimated to be present within a windfarm footprint (Neart na Gaoithe; currently under construction 15 km off the east coast of mainland Scotland) was estimated for (a) the UK and Ireland population, (b) seals hauling-out at Isle of May SAC, and (c) seals hauling-out at the Berwickshire and North Northumberland Coast SAC. Cell values in the absolute density layers were weighted by multiplying the number of seals by the proportion of the cell that overlapped the windfarm polygon (i.e., a cell with an estimated ten seals present, but with only a tenth of its area overlapping the polygon would be counted as one seal). Area-based (i.e., windfarm footprint) 95% confidence intervals were estimated by adapting the posterior simulation process (see Supplementary Material S7.3).
Seasonal Abundance and Movements of Grey Seals in SACs
Grey seals aggregate in large numbers to breed, and SACs are often designated for this species based on breeding numbers, but there may be temporal variation in abundance at these sites. To investigate the relative importance of these sites for grey seals in both the breeding and foraging seasons, the most recent available counts (2019) during the breeding season (pup production estimates; SCOS (2021)) for frequently monitored sites (Scotland and eastern England) were compared to counts of grey seals hauled-out during the harbour seal moult surveys in August (representing the main foraging season for grey seals). Counts for SACs were calculated as percentage of the area-wide totals (i.e., including monitored sites outside of SACs). To update the knowledge base on seasonal movements of grey seals presented by Russell et al. (2013), tracking data from females tagged in this study were examined for evidence of breeding. This analysis focussed on females that were tagged in and/or likely bred in SACs. Following the protocol developed by Russell et al. (2013), a female was assumed to have bred if it was recorded as hauled-out for the majority of an 18-day period during the breeding season and spent <10% of this time diving. Breeding locations were then compared to tagging locations (individuals were tagged during the summer foraging season) to examine seasonal variation in SAC use.
Results
Regional Habitat Preference
Habitat preference modelling revealed regional and inter-specific differences in environmental drivers of distribution. Below we outline some key results with the covariates retained in each regional model shown in Table 1, but full results and associated plots of modelled relationships from each region are given in Supplementary Material S8 (grey seals) and S9 (harbour seals).
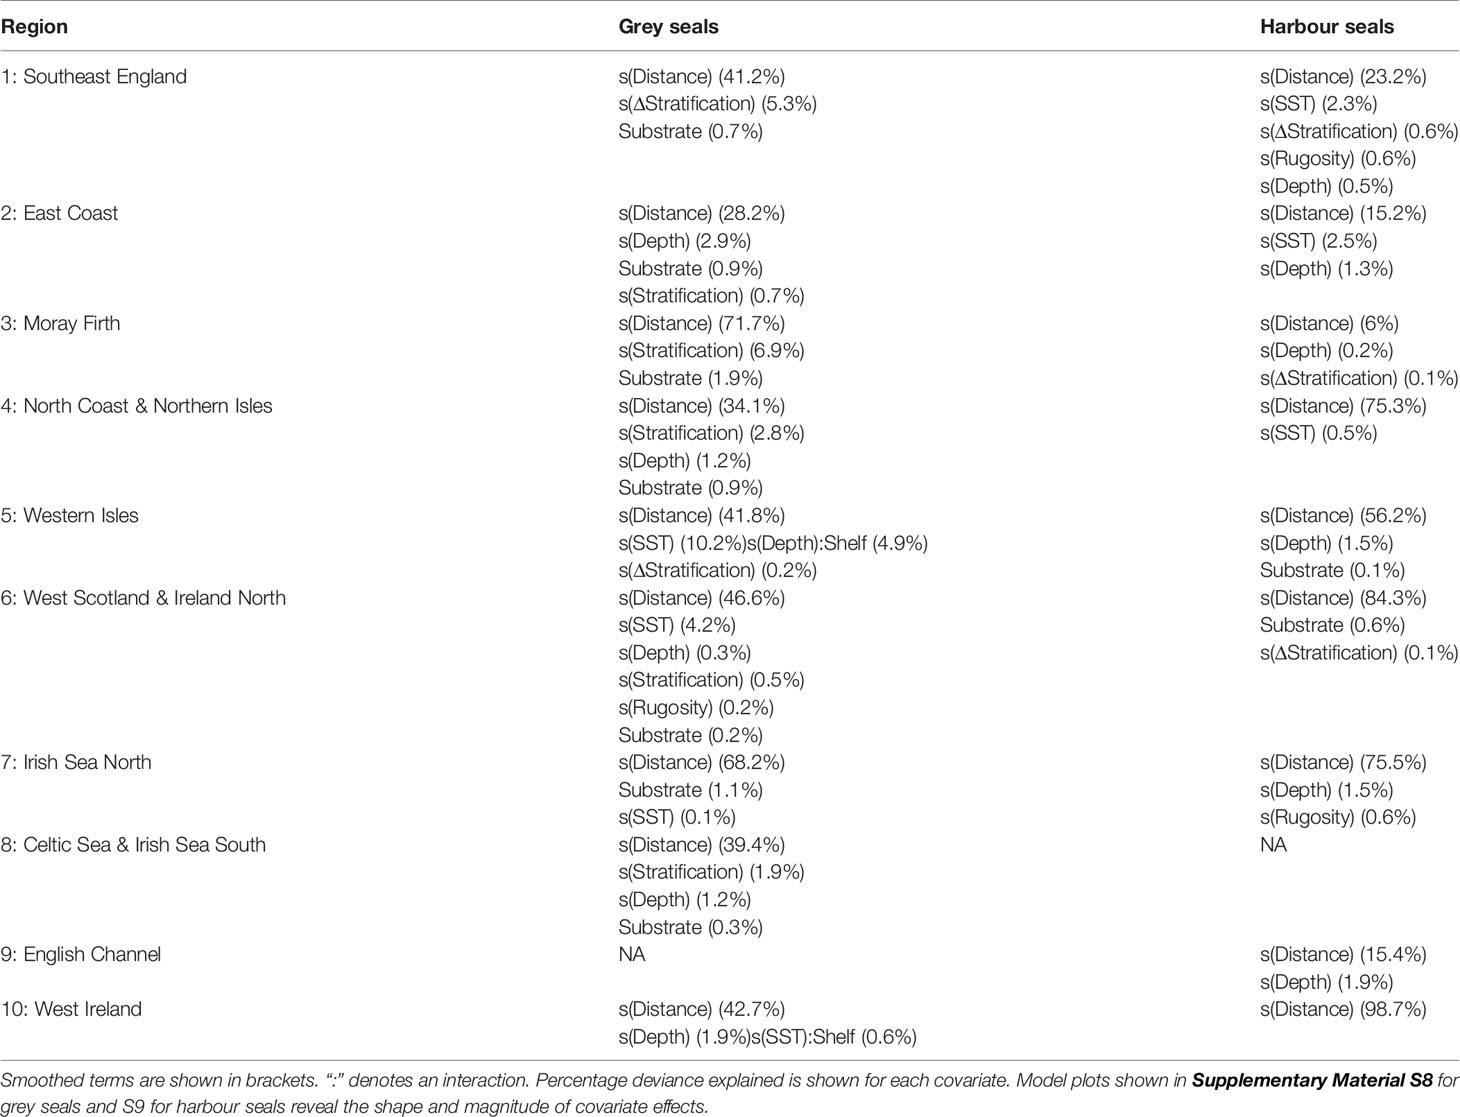
Table 1 Covariates retained in the best ranked model according to model selection for each species in each region.
For grey seals, distance to haulout site was the primary driver of distribution in all regions, with predicted density declining with increasing distance. In addition to distance to haulout, the following covariates were retained in the models: substrate type (Regions 1, 2, 3, 4, 6, 7, 8), water depth (Regions 2, 4, 5, 6, 8, 10), stratification (Regions 2, 3, 4, 6, 8), mean winter SST lagged 1 yr (Regions 1, 5, 6, 7, 10), Δ stratification (Regions 1, 5), shelf edge (Regions 5, 10) and rugosity (Region 6) (Table 1). The best model for grey seals in Region 1 (Southeast England) according to model selection criteria revealed a positive influence of Δ stratification, with seals preferentially selecting habitat in areas with high frontal intensity (Figure S8.1). Mean winter SST (lagged 1 year) was also retained in the model, and preference peaked at values between 6-8°C. The model also revealed an effect of substrate type, with sandy mud having a negative effect on preference. Grey seals in Region 4 (North Coast and Northern Isles) demonstrated a more coastal distribution than in other regions, having a negative association with areas >100 km from the haulout (Figure S8.4). The best model for grey seals in Region 5 (Western Isles) revealed a positive association with shelf edge; areas at the shelf edge had a stronger influence on habitat selection than areas on-shelf (proportionate to their availability), although confidence intervals overlapped (Figure S8.5). Indeed, nine (60%) of the tagged individuals in this region performed repeated trips to the shelf edge. A similar relationship with shelf was found for grey seals in Region 10 (West Ireland; Figure S8.9).
As with grey seals, distance to haulout site was also the primary driver of distribution for harbour seals in all regions. The following covariates were also retained in the models for harbour seals: Δ stratification (Regions 1, 3, 6), mean winter SST lagged 1 yr (Regions 1, 2, 4), substrate type (Regions 5, 6) and rugosity (Regions 1, 7) (Table 1). The best model for harbour seals in Region 1 revealed a similar but stronger relationship to that of grey seals for mean winter SST, with preference peaking at values between 5-7°C. However, in contrast to grey seals the best model also revealed a negative influence of frontal intensity (Figure S9.1). Water depth was also an important driver of distribution for harbour seals, with predicted density declining with increasing depth in Regions 1, 2, 3, 5, 7 and 9. A negative effect of distance to haulout >130 km was predicted for harbour seals in Region 1, but other regional models revealed a much more coastal distribution, with a stronger negative effect for lower values of distance to haulout. For example, in Regions 2 (East Coast; Figure S9.2) and 4 (Figure S9.4), the best model revealed a strong negative association with areas >50 km from the haulout. In Regions 5 and 10 where grey seals showed positive association with the shelf edge, harbour seals had a tight coastal distribution; the best model for Region 5 revealed a strong negative association with both distance to haulout and depth (Figure S9.5), and the best model for Region 10 revealed a strong negative association with distance for areas >20 km from the haulout (Figure S9.9).
UK and Ireland Predicted Distributions
Figures 4, 5 show the mean and associated cell-wise 95% confidence intervals of the at-sea distribution of grey and harbour seals hauling-out in the UK and Ireland according to the combined predictions from the best model for each region. Large areas of relatively high at-sea density are apparent for grey seals adjacent to centres of abundance in Orkney, Northeast England, Southeast England and the Western Isles (Figure 4). The maps also reveal hotspots of grey seal density offshore from Southeast Scotland and Northeast England, along the southern fringes of the Dogger Bank, and at the shelf edge west of Scotland (Figure 4). High at-sea density areas are revealed for harbour seals adjacent to relatively large centres of abundance in Shetland, The Wash (Southeast England), and West Scotland (Figure 5).
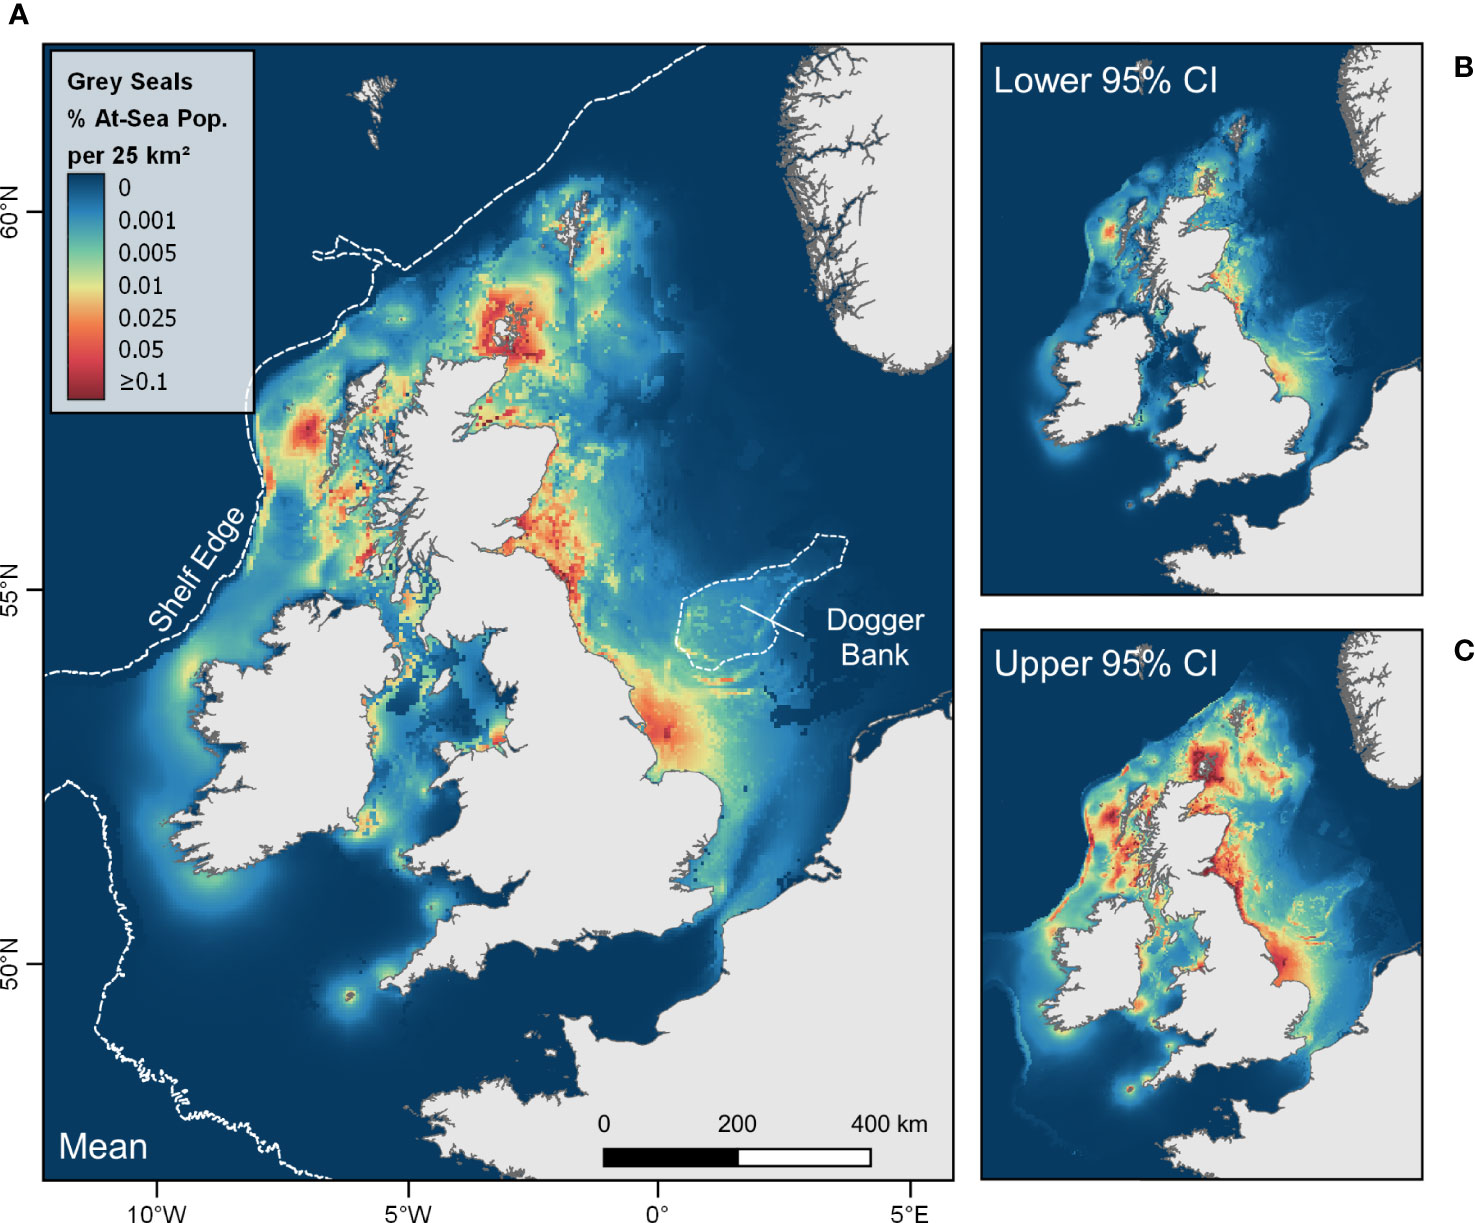
Figure 4 At-sea distribution (relative density) of grey seals from haulouts in the UK and Ireland. Maps show (A) mean with associated cell-wise (B) lower and (C) upper 95% confidence intervals of the percentage of the at-sea population (i.e. excluding hauled-out animals) estimated to be present in each 5 km x 5 km grid cell at any one time.
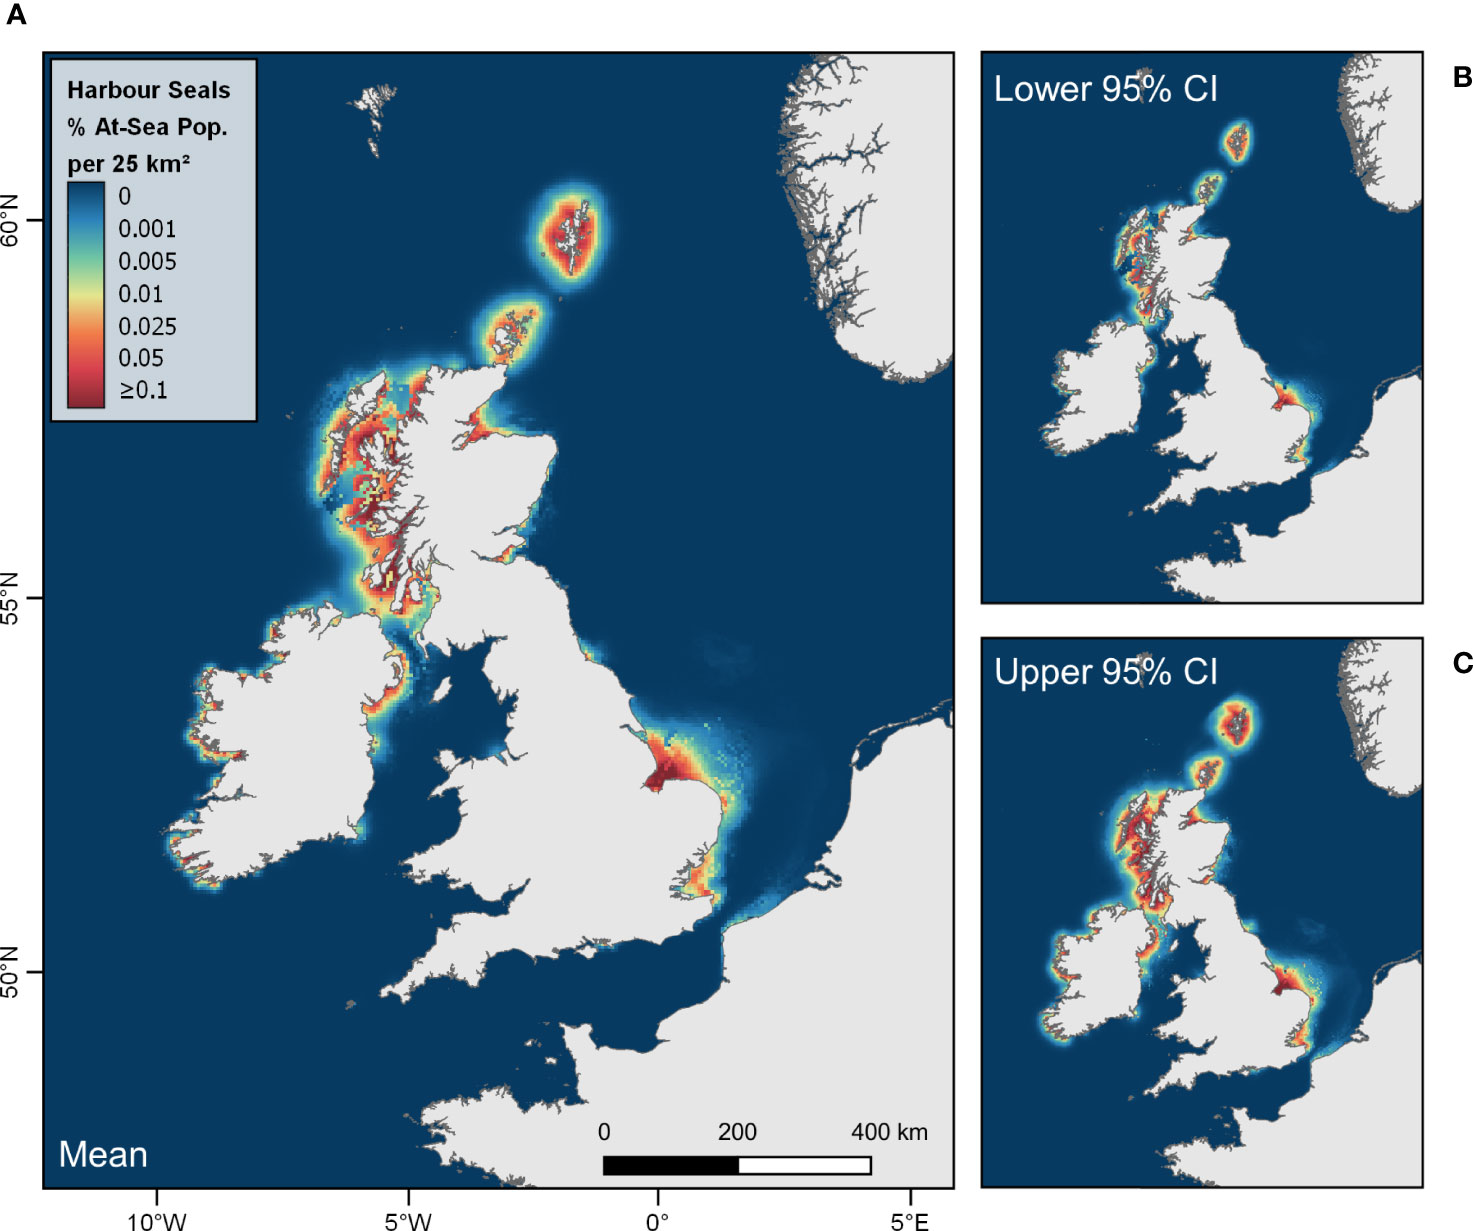
Figure 5 At-sea distribution (relative density) of harbour seals from haulouts in the UK and Ireland. Maps show (A) mean with associated cell-wise (B) lower and (C) upper 95% confidence intervals of the percentage of the at-sea population (i.e. excluding hauled-out animals) estimated to be present in each 5 km x 5 km grid cell at any one time.
Distribution Estimates for SACs
At-sea distribution estimates for grey seals hauling-out in SACs (Supplementary Material S10.1) revealed that hotspots of density occur offshore, often >150 km from the SAC itself. This is particularly apparent for SACs in regions where seals travel further offshore, for example the Humber Estuary SAC in Southeast England, and the Monach Islands SAC in the Western Isles (Figure 6). In general, at-sea distribution estimates of harbour seals (Supplementary Material S10.2) were much more tightly concentrated in waters surrounding the SAC, with hotspots of density extending outwards to ~50 km from the SAC boundaries.
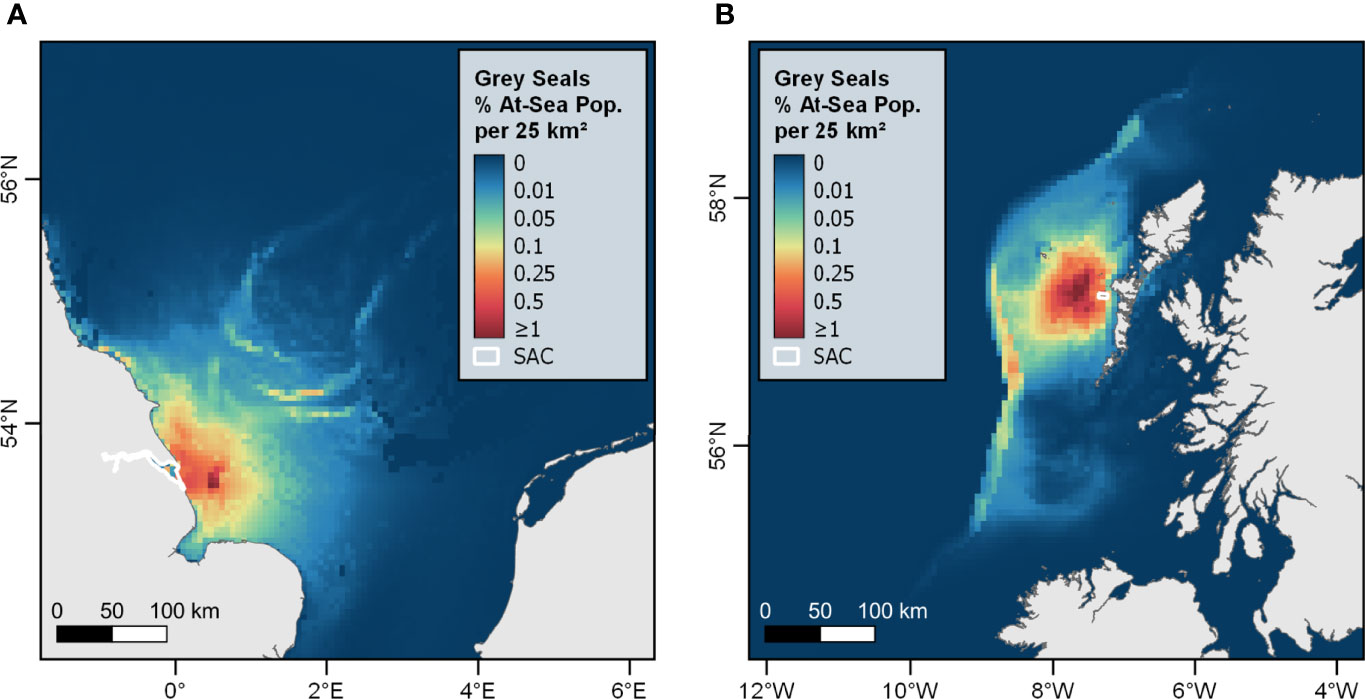
Figure 6 Mean at-sea distribution estimates for grey seals hauling-out in the (A) Humber Estuary SAC, and (B) Monach Islands SAC reveal high concentrations of individuals >200 km from the SAC. Colour scale shows relative density (% SAC at-sea population) per 5 km x 5 km grid cell.
Seasonal Grey Seal Abundance in SACs
SACs represent 42.8% of pup production in Scotland and eastern England, and host 30.4% of individuals during the foraging season, with all but one SAC (Humber Estuary) having a higher proportion of pup production than summer count (Table 2). Some SACs host large breeding numbers but only a small number in the foraging season (e.g. Isle of May: 2.9% of the pup production but only 0.1% of the summer haulout count).
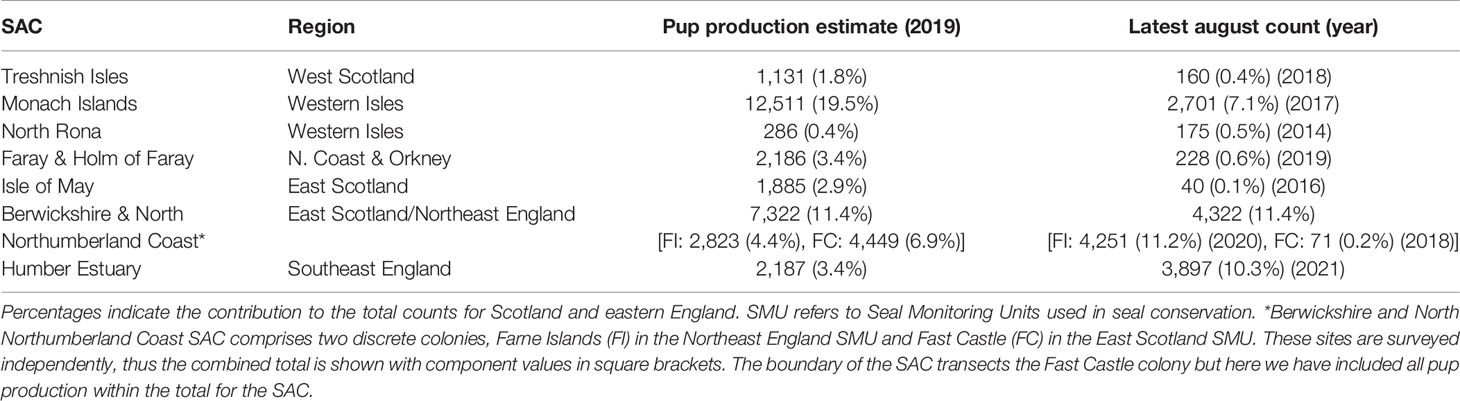
Table 2 Latest pup production estimates and August counts for grey seals within frequently monitored SACs in Scotland and eastern England.
Analysis of absolute density emanating from both the Isle of May and the Berwickshire and North Northumberland Coast SACs revealed large differences in the number of animals estimated to be within the footprint of the Neart na Gaoithe windfarm at any one time. Of the 148 (81-204 95% CIs) seals estimated to be within the footprint, 68.2% (101: 48-116 95% CIs) can be apportioned to the Berwickshire and North Northumberland Coast SAC (~50 km from the windfarm), and 1.4% (2: 1-2 95% CIs) can be apportioned to the Isle of May SAC (~15 km from the windfarm) (Figure 7).
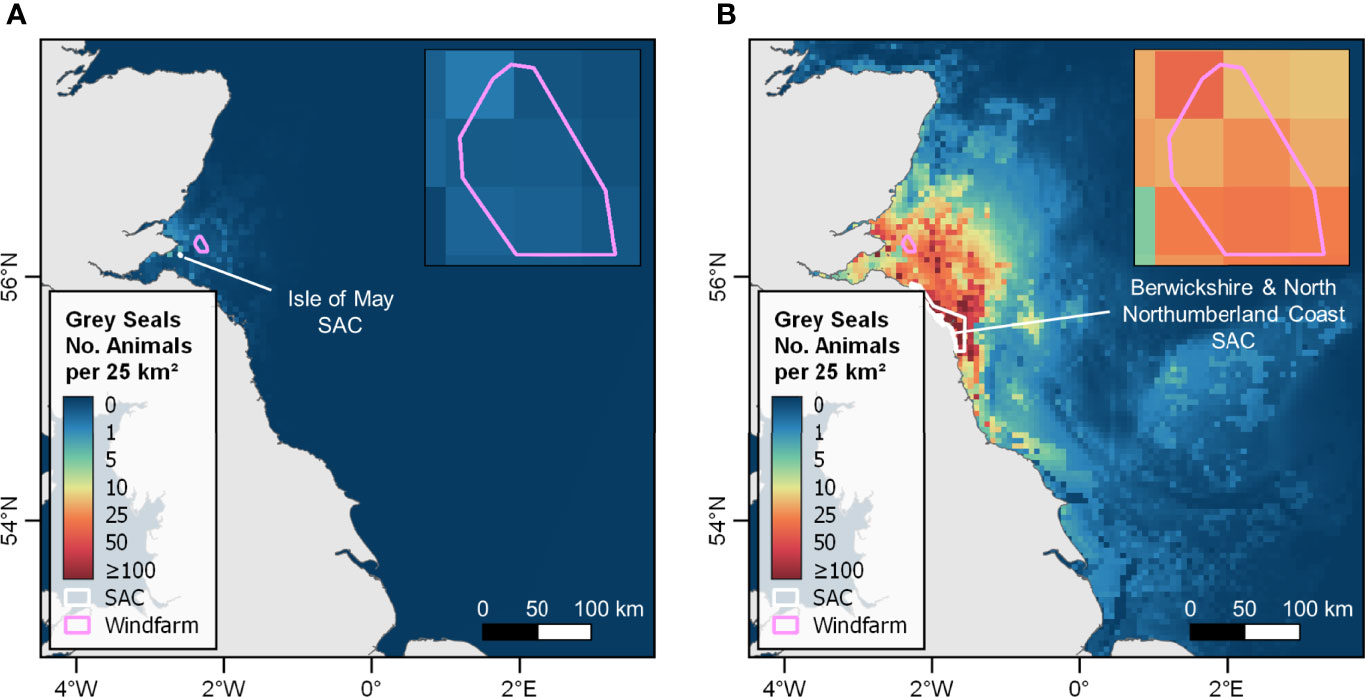
Figure 7 Mean at-sea distribution estimates for grey seals hauling out in (A) the Isle of May SAC, and (B) the Berwickshire and North Northumberland Coast SAC. Estimates are scaled to absolute density (i.e. number of seals) based on most recent August counts, demonstrating that some SACs designated based on breeding numbers (e.g. the Isle of May) do not host large numbers of seals during the main foraging season. Inset maps show the number of seals apportioned to each SAC estimated to be within the footprint of the Neart na Gaoithe windfarm. Windfarm polygon source: EMODnet Human Activities dataset (https://www.emodnet-humanactivities.eu/; accessed 07/10/2021).
Seasonal Movements of Grey Seals in SACs
Of the 69 grey seal females tagged in this study, 12 transmitted data through to the breeding season, showed evidence of breeding activity and were tagged in and/or likely pupped in SACs. Of the 12, ten were tagged and likely pupped in an SAC, one was tagged in an SAC but appeared to pup outside of an SAC, and one was tagged outside of an SAC but appeared to pup in one. Half of the ten females that were tagged and likely pupped in SACs appeared to pup in a different SAC to the one in which they were tagged. Three of these movements constituted a transition between different Seal Monitoring Units (SMUs) (Table 3). For two of the females that had different pupping and tagging sites, the tags continued to transmit after breeding and the tracks revealed the seals returning to the tagging site (Figure 8).
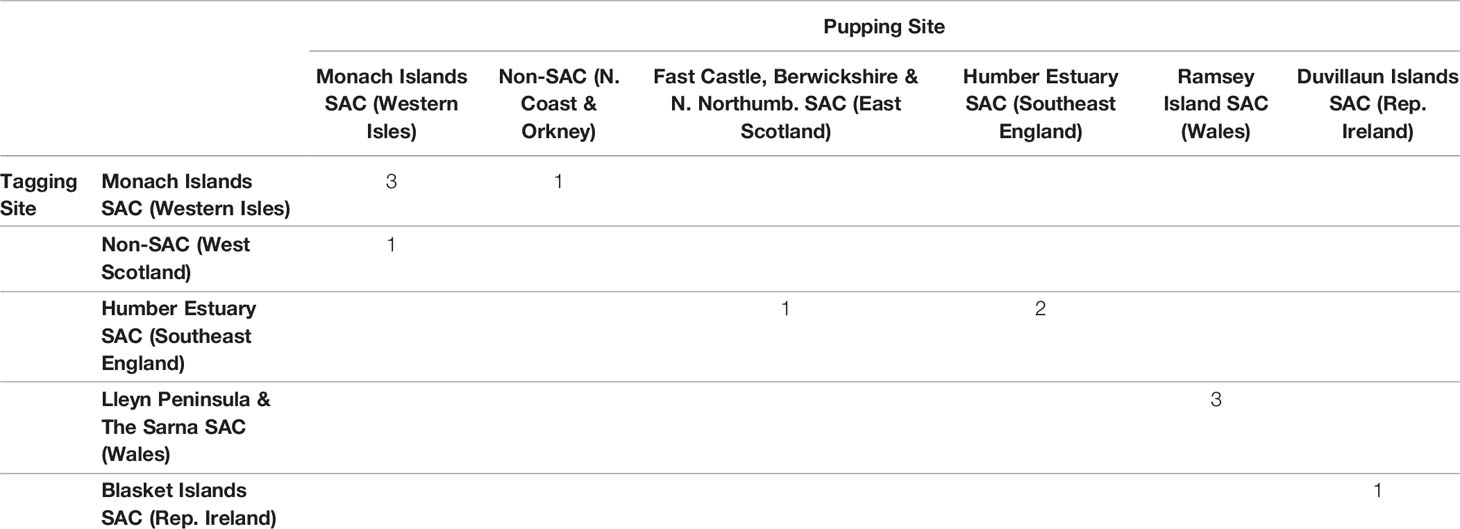
Table 3 Seasonal movements of 12 breeding female grey seals. Seal Monitoring Unit for each site is shown in brackets.
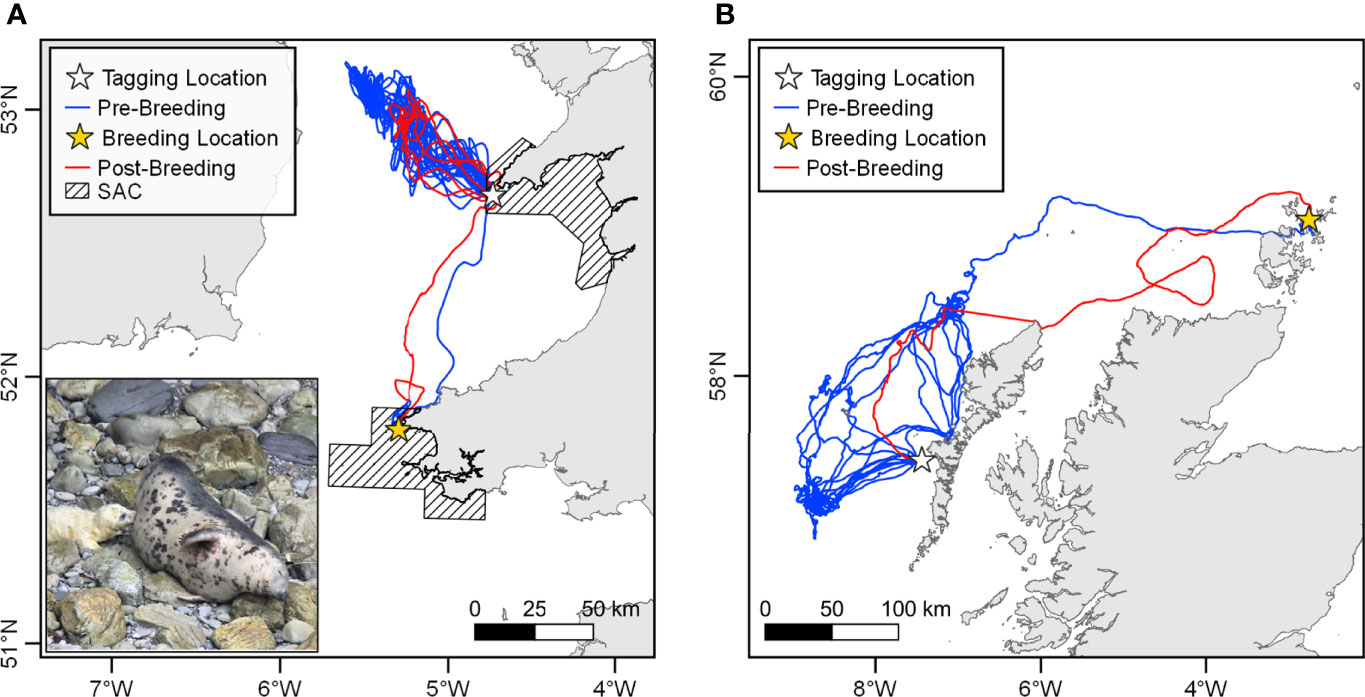
Figure 8 Examples of grey seal breeding migrations. (A) A female seal tagged on Bardsey Island in the Lleyn Peninsula and the Sarnau SAC foraged throughout the summer northwest of Bardsey, using Bardsey as a haulout site, before breeding on Ramsey Island in the Pembrokeshire Marine SAC in the Autumn. The seal returned to Bardsey after breeding. Inset photo shows the tagged seal nursing a pup on Ramsey (courtesy of RSPB Ramsey Island). (B) A female seal tagged in the Monach Islands SAC spent the summer foraging to the west of the Western Isles, hauling-out in the Monach Islands, before migrating to Orkney for breeding in Autumn. The seal returned to the Monach Islands SAC after breeding.
Discussion
Seal Habitat Preference and Overall Distributions
This study presents the first habitat-based at-sea distribution estimates for the entire UK and Ireland populations of grey and harbour seals. Critically, region-specific habitat preference models were used to allow for spatial variation in the species-environment relationship around the coast. UK and Ireland-wide predicted distributions revealed large areas of relatively high at-sea density of grey seals adjacent to large haulout clusters in Southeast England, Northeast England, Orkney and the Western Isles (Figure 4). Hotspots of density were also predicted offshore along the continental shelf edge west of Scotland, off the east coast of Scotland and off the east coast of England extending out to the southern fringes of the Dogger Bank in the central North Sea (Figure 4). The regional habitat preference model for grey seals in Southeast England revealed a positive association with areas of strong heterogeneity in water column stratification values (Figure S8.1), analogous to areas of high frontal intensity. The Flamborough tidal mixing front is a persistent frontal system that occurs from late spring to early autumn off the east coast of England, extending offshore from Flamborough Head and encircling the Dogger Bank (Hill et al., 1993). Our results suggest that this feature is an important driver of distribution for grey seals hauling-out in Southeast England. This finding supports the results of Wyles et al. (2022) who showed that the fringes of the Dogger Bank represent an important foraging area for grey seals hauling-out in Southeast England. Being primarily a bottom feature with weak surface signature (Hill et al., 1993), this frontal system may be particularly attractive to grey seals, which predominantly target benthic and demersal prey (Gosch et al., 2019; Wilson and Hammond, 2019). Tidal mixing fronts can alter the density and behaviour of prey and thus may represent a temporally and spatially predictable area of high foraging success for predators (Cox et al., 2018). Similar tidally driven processes may occur at the continental shelf break, where upwellings from deeper water may provide predictable foraging opportunities (Cox et al., 2018). While persistent surface fronts, detectable with satellite imagery, have been shown to correlate with the foraging behaviour of seabirds (Scales et al., 2014; Grecian et al., 2018), our results demonstrate the importance of also considering vertical water column structure as a potential predictor of habitat use for aquatic predators.
Harbour seal distribution was predominantly driven by a negative association with increasing distance from haulout and water depth. As such, predicted density is more tightly concentrated in coastal and inshore waters compared to grey seals, but with fine-scale structuring of density around the coast (Figure 5). The exception to this is in Southeast England, where the negative associations with distance and depth were weaker. High at-sea density areas of seals hauling-out in this region extended further offshore than elsewhere around the coast (Figure 5). In general, the influence of dynamic covariates (SST, stratification and Δ stratification) was variable among the regions. We found relatively high densities of grey seals predicted in coastal waters (Figure 4) in areas where harbour seal populations have suffered the most rapid declines: including Orkney and the east coast of Scotland which have exhibited declines of over 80% between 2000 and 2016 (Thompson et al., 2019). Competition with grey seals for prey resources is one of several putative drivers of regional harbour seal declines (Thompson et al., 2019). Although comparing inter-specific differences in habitat associations and space use is an important step in quantifying the potential for competition, inference of inter-specific competition for prey resources is limited by a number of factors. For example, high levels of overlap in distribution may equally be indicative of exploitative competition, or sufficient prey resources to support both species. Similarly, low levels of overlap may result from competitive exclusion or spatial partitioning of foraging resources between the species. Moreover, it is impossible to disentangle spatial variation in prey preference or prey distribution from competition without examining changes in foraging habitat preference and distribution through time. This study considered overall habitat preference (i.e. not discriminating by behaviour) in order to capture the overall distribution of seals, since all forms of habitat use are of relevance for marine spatial planning. A priority for future work is to identify foraging behaviour using robust statistical models (such as hidden Markov models; Carter et al., 2016), which will facilitate a comprehensive study of foraging habitat preference and may provide more insight regarding the dynamics of competition between the two species.
Technical Considerations
The habitat preference approach used here provides some key improvements over previous large scale distribution estimates for grey and harbour seals (i.e. usage maps (Matthiopoulos et al., 2004; Jones et al., 2015)). For example, where no tracked seal visited a specific cluster of haulout sites, predictions emanating from the haulout sites were based on null usage; a simple study-wide relationship between distance from haulout site and observed usage (Jones et al., 2013; Russell et al., 2017). In our approach, such predictions are based on a region-specific species-environment relationship, which includes distance to haulout and any other covariates deemed to be good predictors of habitat preference by the model selection process. As such, areas of suitable habitat not visited by the tagged seals may still be detected, whereas they may be overlooked or underrepresented in the usage maps. Nevertheless, in data-rich areas (e.g. harbour seals in Southeast England), distribution patterns resulting from the track smoothing approach may be favourable to habitat-based predictions since they are able to describe features of the distribution which may not be captured by modelled habitat preference relationships averaged across individuals and dependent on relatively simple descriptors of habitat. Future work should seek to combine these two modelling frameworks to maximise robustness and ecological insights; previous work has been restricted to a small, discrete spatial extent (Jones et al., 2017). The usage maps have been an important resource for management applications, and they have also been used in ecological studies (Sadykova et al., 2017; Sadykova et al., 2020). For example, Sadykova et al. (2017) inferred habitat preference relationships for grey and harbour seals from the usage map distribution estimates presented by Jones et al. (2013). However, such inferred relationships, and resulting ecological conclusions, may be subject to distortion due to the reliance on null usage and the assumption that habitat preference does not vary among regions. Moving forwards, the maps presented here offer an updated resource for marine spatial planning, with increased potential for ecological insights on both regional and population-wide scales.
While the distribution estimates presented here represent a valuable resource for both ecology and management, as with any predicted species distribution, there are considerations which should be acknowledged depending on their application. Below we outline four important such considerations. (i) As with the “usage maps” (Jones et al., 2013; Jones et al., 2015; Russell et al., 2017), the upper and lower 95% confidence intervals presented in this study are generated on a cell-wise basis, meaning that they should not be summed across an area (e.g., windfarm footprint), as doing so would lead to inflated uncertainty estimates. Specific area-based confidence intervals can be generated on a case-by-case basis, as demonstrated in the Neart na Gaoithe windfarm example presented here. (ii) The latest count for each haulout cell was used to weight the distribution estimates, and these are taken from different days, and in some cases different years around the coast (Figure A6.1 in Supplementary Material). There may be spatial as well as day-to-day variation in the proportion of the population hauled-out during the surveys, and such variation is not considered here. (iii) For some applications, such as identifying areas of ecosystem-level importance, it should be noted that the estimates presented here represent the at-sea distribution of seals hauling-out in the UK and Ireland and are not inclusive of seals from haulouts in continental Europe. (iv) There are additional considerations when using absolute density estimates, and thus relative density estimates should be used where possible (e.g. for comparison of density between areas). Uncertainty in total abundance (population size) for the study area could not be propagated. Furthermore, the proportion of time spent hauled out, and thus the at-sea population size, varies across the focal months (Russell et al., 2015) but was assumed constant (averaged) to generate maps of absolute abundance.
SAC-Specific Distribution Estimates
The distribution estimates presented here provide an opportunity to link changes in abundance detected at land-based monitoring sites with areas at sea where such changes are likely to be mediated. The ability to draw such links is particularly pertinent for SACs, which provide monitored conservation areas with management efforts focussed on maintenance of (or recovery to) Favourable Conservation Status (FCS). By extension, knowledge of the at-sea distribution of individuals hauling out in an SAC is critical to predicting and managing the potential impact of offshore activities on the integrity of the SAC. Furthermore, in instances of declining SAC abundance, particularly for SACs no longer in FCS, these maps give guidance on where such change may be mediated. The results show that, unless the SAC encapsulates the majority of the abundance within a region (e.g. Monach Islands SAC), UK and Ireland-wide distribution maps may not be representative of SAC-specific distributions. For example, the Firth of Tay and Eden Estuary SAC has seen a steep decline in harbour seal abundance over the last two decades (Thompson et al., 2019). As such, overall distribution patterns in this area are largely driven by individuals hauling-out elsewhere within the region, and hotspots of density are not representative of the distribution of individuals using the SAC (Figure S10.2). Thus, the locations of processes occurring at sea most likely to impact the SAC population cannot be easily identified using the UK and Ireland-wide maps. However, an important consideration is connectivity between haul out sites; unlike true central place foragers (e.g. breeding seabirds) which always return to the same site between foraging trips, seal foraging trips often start and end at different haulout sites. Indeed, only 35% of grey seal trips and 44% of harbour seal trips analysed here started and ended at the same 5 km x 5 km grid cell. These differences in central place strategies mean that seals may utilise multiple designated and non-designated sites throughout the foraging season. Inter-regional movements within the foraging season are more limited (Russell et al., 2013) particularly for harbour seals (Carroll et al., 2020), thus we advise that stakeholders use the SAC-specific maps in conjunction with the overall prediction for the area to identify both primary and potentially secondary (through use of multiple haulouts) areas of linkage with SACs.
In addition to the management implications of movements within the foraging season (discussed above), there are particular complexities for grey seals associated with the relationship between breeding and foraging distributions on land. Grey seals are classic capital breeders and aggregate in large numbers during the breeding season (Bonner, 1972). SACs are generally designated based on breeding numbers, and population monitoring is focussed on trends in pup production (Russell et al., 2019). However, grey seal use of sites on land varies between the foraging and breeding season on two spatial scales. Indeed, breeding sites do not always represent a central place for foraging (Table 2). For example, the Isle of May SAC contributes 2.9% of pup production for Scotland and eastern England with >1,800 pups born annually (almost a quarter of the total pups born in SACs in this area), but hosts just 0.1% of seals hauled-out in this area during the foraging season (most recent count = 40) (Table 2). In such cases, hotspots of density in the area are unlikely to be attributable to individuals hauling-out at the SAC despite the large reported population size (based on breeding numbers). Our analysis reveals that only 1.4% (n=2) of seals estimated to be present within the footprint of the Neart na Gaoithe windfarm at any one time can be apportioned to individuals hauling-out in the Isle of May SAC (~15 km away), while the majority (68.2%; 101) can be apportioned to the Farne Islands within the Berwickshire and North Northumberland Coast SAC ~75 km away (Figure 7). Any decline in the Isle of May breeding population would therefore not be easily attributed to processes occurring at sea, since the non-breeding distribution of these seals is largely unknown.
Grey seals also exhibit seasonal redistribution at broader spatial scales. Our analysis reveals that, of the 12 females that transmitted data through to the breeding season and were tagged in and/or likely bred in SACs, six (50%) bred in different SACs to where they were tagged, with four (33%) breeding at colonies in different Seal Monitoring Units (SMUs) (Table 3). Although these results come from a relatively small sample size, they support the findings of Russell et al. (2013) that 21-58% of breeding females use different regions for breeding and foraging. This highlights the level of uncertainty associated with linking abundance trends observed on grey seal breeding colonies to processes occurring at offshore foraging areas. Partial migration, where a population is comprised of migratory and resident individuals, is a widespread phenomenon in the animal kingdom (Chapman et al., 2011), but has not been widely identified in seals. Evidence from other terrestrial-breeding marine predators has demonstrated that migratory strategy may influence fitness; Grist et al. (2017) showed that breeding success was higher for non-migrating than migrating pairs of European shags (Phalacrocorax aristotelis) breeding on the Isle of May. In grey seals, the drivers of this behaviour are likely related to an inclination to natal philopatry and fidelity to breeding sites following recruitment (Pomeroy et al., 2000). Indeed, the rate of increase in pup production in Southeast England over recent decades lagged behind the rate of increase in seals counted during the foraging season (Russell et al., 2019) likely due to seals foraging in the south, where trends in abundance indicate conditions are favourable compared to further north where a proportion returned to breed. Further work is required to determine the implications of partial migration in grey seals for breeding success, population dynamics and conservation management.
Conclusion
This study presents the most up-to-date and comprehensive at-sea distribution maps for grey and harbour seals hauling-out in the UK and Ireland. These results represent a step forward in our understanding of predator distributions at sea and provide a valuable resource for marine spatial planning and conservation efforts. Furthermore, we reveal that overall hotspots of density at sea are not necessarily attributable to nearby designated sites, and present SAC-specific estimates of distribution. For both sets of resources we provide a comprehensive list of technical considerations to ensure that they are used with acknowledgement of their limitations. We demonstrate a disconnect between monitored sites where impacts are likely to be detected (i.e., SACs) and areas where impacts are likely to occur (i.e., at sea). For harbour seals, this problem can be largely overcome using the SAC-specific distribution estimates. However, for grey seals we show that SACs designated based on breeding numbers cannot be reliably linked to areas where individuals may be exposed to threats at sea due to local redistribution outside of the breeding season and partial migration. The work presented here has focussed on the distribution of seals aged one and above. Grey and harbour seal pups exhibit different movement patterns to experienced individuals, and habitat preference may also vary throughout early life (Blanchet et al., 2016; Carter et al., 2020). Further work should therefore focus on generating distribution estimates for pups.
More generally, our study highlights the importance of considering regional variation in habitat preference. Regional habitat preference models have been shown to be favourable to global models for marine predator populations occupying different sides of an ocean basin (Torres et al., 2015; Mannocci et al., 2020), or discrete regions within shelf seas (Huon et al., 2021). However, few studies have combined predictions from different regional habitat preference models to generate large scale distribution estimates. Our results demonstrate that, although tracking data from a small number of patchily distributed locations can be used to provide species distribution estimates across a region, habitat associations can vary within a population between contiguous regions on a relatively fine spatial scale. Seals exhibited different habitat preference to those hauling-out in adjacent regions despite almost complete overlap in the accessible habitat available (Figure S11.1). We therefore show that differences in habitat associations can occur on a spatial scale that is smaller than the species’ scale of movement, demonstrating the importance of tracking individuals from throughout the study area when using tracking data to predict species distributions. In addition, our results highlight the considerations in designating and managing land-based protected sites for mobile marine predators, particularly those which are not strict central place foragers, aggregate to breed and/or exhibit partial migration. To maximise the effectiveness of such management, there is an urgent need for ecologists and policy makers to assess the links between sites and scales at which monitoring can be conducted and at-sea areas where impacts may occur.
Data Availability Statement
The datasets generated in this study are available from the University of St Andrews data repository: https://doi.org/10.17630/f2a9cc5a-4fac-4740-937e-ed79fc907ebc.
Ethics Statement
The study was reviewed and approved by the University of St Andrews Animal Welfare and Ethics Committee and the University College Cork Animal Ethics Committee (required since 2011). All UK capture, handling and other licenced procedures were carried out under UK Home Office project licence PF84B63DE (and previous iterations: 60/2589, 60/3303, 60/4009 and 70/7806) under the Animals (Scientific Procedures) Act 1986. The capture of seals was conducted under licence from Marine Scotland (Scotland), the Marine Management Organisation (England) and Natural Resources Wales (Wales). In Ireland the work was conducted under licence from the National Parks and Wildlife Service, with additional licences from the Irish Health Products Regulatory Authority. Appropriate site-specific approvals were obtained, with any associated mitigation measures observed for designated sites, including ethics approval from the Royal Society for Protection of Birds (RSPB) for work on Ramsey Island (EAC2018-01). SMRU aerial surveys of haulout sites have been approved by the University of St Andrews Animal Welfare and Ethics Committee (SEC21032).
Author Contributions
DJFR led conception and management of the study. MIDC performed the analysis and wrote the manuscript, with support from DJFR. Data and/or technical expertise were provided by DJFR, BJM, CDD, CDM, DLM, JM, DT, GDH, LB, MAC, MJ, PMT and WJG. SEWM led telemetry data collection.
Funding
Analysis was funded by the UK Government Department for Business, Energy and Industrial Strategy (BEIS; OESEA-16-76/OESEA-17-78) with support from the Natural Environment Research Council (NERC; INSITE Phase II NE/T010614/1 EcoSTAR), EU INTERREG (MarPAMM), and the Scottish Government (MMSS/002/15). DJFR’s contribution was funded by NERC National Capability Funding (NE/R015007/1). WJG was supported by INSITE Phase I (MAPS). Telemetry tags and their deployment were funded in the UK by BEIS (and previous incarnations), NERC, Marine Scotland, Scottish Government, NatureScot, SMRU, SMRU Instrumentation Group, Marine Current Turbines, Ørsted, the Met Office, the Zoological Society of London (ZSL), the Crown Estate, Highlands & Islands Enterprise, Moray Firth Renewables Limited (MORL), Beatrice Offshore Windfarm Limited (BOWL), SITA Trust, BBC Wildlife Fund and the Hampshire & Isle of Wight Wildlife Trust. Tags and their deployment in Ireland were funded by Inland Fisheries Ireland, the Department of Communications, Marine and Natural Resources, the Higher Education Authority of Ireland, the National Geographic Society, the Department of Agriculture, Food and the Marine, and the National Parks and Wildlife Service. UK aerial surveys conducted by SMRU were funded by NERC (NE/R015007/1), NatureScot, the Department for Agriculture, Environment and Rural Affairs (Northern Ireland), Marine Current Turbines, Marine Scotland, Natural England, and Scottish Power. Aerial surveys in Ireland were funded by the Department for Tourism, Culture, Arts, Gaeltacht, Sport and Media.
Conflict of Interest
The authors declare that the research was conducted in the absence of any commercial or financial relationships that could be construed as a potential conflict of interest.
The reviewer MH declared a past co-authorship with the authors MAC and MJ to the handling Editor
Publisher’s Note
All claims expressed in this article are solely those of the authors and do not necessarily represent those of their affiliated organizations, or those of the publisher, the editors and the reviewers. Any product that may be evaluated in this article, or claim that may be made by its manufacturer, is not guaranteed or endorsed by the publisher.
Acknowledgments
We thank Matt Bivins (SMRU), Phil Lovell (SMRU Instrumentation Group), and the many people who were involved in or facilitated fieldwork, including landowners and reserve managers. We are grateful to Dr Carol Sparling (SMRU), Dr Sophie Smout (SMRU) and Prof. Philip Hammond (SMRU) for useful discussions. We thank Hartley Anderson Ltd. for their support and guidance. This study is dedicated to the memory of Dr Bernie McConnell; a legend in the field of biologging and seal ecology who taught us all so much. Unfortunately, Bernie did not get to read the final draft of this manuscript, but we are grateful for his valuable input throughout the study.
Supplementary Material
The Supplementary Material for this article can be found online at: https://www.frontiersin.org/articles/10.3389/fmars.2022.875869/full#supplementary-material
References
Aarts G., MacKenzie M., McConnell B., Fedak M., Matthiopoulos J. (2008). Estimating Space-Use and Habitat Preference From Wildlife Telemetry Data. Ecography 31, 140–160. doi: 10.1111/j.2007.0906-7590.05236.x
Augustin N. H., Trenkel V. M., Wood S. N., Lorance P. (2013). Space-Time Modelling of Blue Ling for Fisheries Stock Management. Environmetrics 24, 109–119. doi: 10.1002/env.2196
Bailey H., Hammond P. S., Thompson P. M. (2014). Modelling Harbour Seal Habitat by Combining Data From Multiple Tracking Systems. J. Exp. Mar. Bio. Ecol. 450, 30–39. doi: 10.1016/j.jembe.2013.10.011
Bailey H., Senior B., Simmons D., Rusin J., Picken G., Thompson P. M. (2010). Assessing Underwater Noise Levels During Pile-Driving at an Offshore Windfarm and its Potential Effects on Marine Mammals. Mar. Pollut. Bull. 60, 888–897. doi: 10.1016/j.marpolbul.2010.01.003
Beyer H. L., Haydon D. T., Morales J. M., Frair J. L., Hebblewhite M., Mitchell M., et al. (2010). The Interpretation of Habitat Preference Metrics Under Use-Availability Designs. Philos. Trans. R. Soc B. Biol. Sci. 365, 2245–2254. doi: 10.1098/rstb.2010.0083
Blanchet M. A., Lydersen C., Ims R. A., Kovacs K. M. (2016). Making it Through the First Year: Ontogeny of Movement and Diving Behavior in Harbor Seals From Svalbard, Norway. Mar. Mammal. Sci. 32, 1340–1369. doi: 10.1111/mms.12341
Bonner W. N. (1972). The Grey Seal and Common Seal in European Waters. Oceanogr. Mar. Biol. Annu. Rev. 10, 461–507.
Borthwick A. G. L. (2016). Marine Renewable Energy Seascape. Engineering 2, 69–78. doi: 10.1016/J.ENG.2016.01.011
Bradbury G., Trinder M., Furness B., Banks A. N., Caldow R. W. G., Hume D. (2014). Mapping Seabird Sensitivity to Offshore Wind Farms. PLoS One 9, e106366. doi: 10.1371/journal.pone.0106366
Brook B. W., Sodhi N. S., Bradshaw C. (2008). Synergies Among Extinction Drivers Under Global Change. Trends Ecol. Evol. 23, 453–460. doi: 10.1016/j.tree.2008.03.011
Brownlow A., Onoufriou J., Bishop A., Davison N., Thompson D. (2016). Corkscrew Seals: Grey Seal (Halichoerus Grypus) Infanticide and Cannibalism may Indicate the Cause of Spiral Lacerations in Seals. PLoS One 11, e0156464. doi: 10.1371/journal.pone.0156464
Butler A., Carroll M., Searle K., Bolton M., Waggitt J., Evans P., et al. (2017). Attributing Seabirds at Sea to Appropriate Breeding Colonies and Populations Vol. Vol 11 (Scottish Marine and Freshwater Science). doi: 10.7489/2006-1
Carroll E. L., Hall A., Olsen M. T., Onoufriou A. B., Gaggiotti O. E., Russell D. J. F. (2020). Perturbation Drives Changing Metapopulation Dynamics in a Top Marine Predator. Proc. R. Soc B. 287, 20200318. doi: 10.1098/rspb.2020.0318
Carter M. I. D., Bennett K. A., Embling C. B., Hosegood P. J., Russell D. J. F. (2016). Navigating Uncertain Waters: A Critical Review of Inferring Foraging Behaviour From Location and Dive Data in Pinnipeds. Mov. Ecol. 4, 25. doi: 10.1186/s40462-016-0090-9
Carter M. I. D., McClintock B. T., Embling C. B., Bennett K. A., Thompson D., Russell D. J. F. (2020). From Pup to Predator: Generalized Hidden Markov Models Reveal Rapid Development of Movement Strategies in a Naïve Long-Lived Vertebrate. Oikos 129, 630–642. doi: 10.1111/oik.06853
Chapman B. B., Brönmark C., Nilsson J. Å., Hansson L. A. (2011). The Ecology and Evolution of Partial Migration. Oikos 120, 1764–1775. doi: 10.1111/j.1600-0706.2011.20131.x
Cox T., Barker J., Bramley J., Debney A., Thompson D., Cucknell A.-C. (2020). Population Trends of Harbour and Grey Seals in the Greater Thames Estuary. Mammal. Commun. 6, 42–51.
Cox S. L., Embling C. B., Hosegood P. J., Votier S. C., Ingram S. N. (2018). Oceanographic Drivers of Marine Mammal and Seabird Habitat-Use Across Shelf-Seas: A Guide to Key Features and Recommendations for Future Research and Conservation Management. Estuar. Coast. Shelf. Sci. 212, 294–310. doi: 10.1016/J.ECSS.2018.06.022
Croxall J. P., Trathan P. N., Murphy E. J. (2002). Environmental Change and Antarctic Seabird Populations. Science 297, 1510–1514. doi: 10.1126/science.1071987
European Environment Agency (2021) Natura 2000 Data - the European Network of Protected Sites. Available at: https://www.eea.europa.eu/data-and-maps/data/natura-12 (Accessed December 22, 2021).
Fauchald P., Tarroux A., Amélineau F., Bråthen V. S., Descamps S., Ekker M., et al. (2021). Year-Round Distribution of Northeast Atlantic Seabird Populations: Applications for Population Management and Marine Spatial Planning. Mar. Ecol. Prog. Ser. 676, 255–276. doi: 10.3354/meps13854
Gosch M., Cronin M., Rogan E., Hunt W., Luck C., Jessopp M. (2019). Spatial Variation in a Top Marine Predator’s Diet at Two Regionally Distinct Sites. PLoS One 14, e0209032. doi: 10.1371/journal.pone.0209032
Grecian W. J., Lane J., Michelot T., Wade H., Hamer K. (2018). Understanding the Ontogeny of Foraging Behaviour: Insights From Combining Marine Predator Bio-Logging With Satellite-Derived Oceanography in Hidden Markov Models. J. R. Soc Interface 15, 20180084. doi: 10.1098/rsif.2018.0084
Grist H., Daunt F., Wanless S., Burthe S. J., Newell M. A., Harris M. P., et al. (2017). Reproductive Performance of Resident and Migrant Males, Females and Pairs in a Partially Migratory Bird. J. Anim. Ecol. 86, 1010–1021. doi: 10.1111/1365-2656.12691
Hastie G. D., Russell D. J. F., Mcconnell B., Moss S., Thompson D., Janik V. M. (2015). Sound Exposure in Harbour Seals During the Installation of an Offshore Wind Farm: Predictions of Auditory Damage. J. Appl. Ecol. 52, 631–640. doi: 10.1111/1365-2664.12403
Hazen E. L., Abrahms B., Brodie S., Carroll G., Jacox M. G., Savoca M. S., et al. (2019). Marine Top Predators as Climate and Ecosystem Sentinels. Front. Ecol. Environ. 17, 565–574. doi: 10.1002/fee.2125
Hazen E. L., Maxwell S. M., Bailey H., Bograd S. J., Hamann M., Gaspar P., et al. (2012). Ontogeny in Marine Tagging and Tracking Science: Technologies and Data Gaps. Mar. Ecol. Prog. Ser. 457, 221–240. doi: 10.3354/meps09857
Hill A. E., James I. D., Linden P. F., Matthews J. P., Prandle D., Simpson J. H., et al. (1993). Dynamics of Tidal Mixing Fronts in the North Sea. Philos. Trans. R. Soc A. Phys. Sci. Eng. 343, 431–446. doi: 10.1098/rsta.1993.0057
Hindell M. A., Reisinger R. R., Ropert-Coudert Y., Hückstädt L. A., Trathan P. N., Bornemann H., et al. (2020). Tracking of Marine Predators to Protect Southern Ocean Ecosystems. Nature 580, 87–92. doi: 10.1038/s41586-020-2126-y
Hindell M. A., Sumner M., Bestley S., Wotherspoon S., Harcourt R. G., Lea M. A., et al. (2017). Decadal Changes in Habitat Characteristics Influence Population Trajectories of Southern Elephant Seals. Glob. Change Biol. 23, 5136–5150. doi: 10.1111/gcb.13776
Huon M., Planque Y., Jessopp M. J., Cronin M., Caurant F., Vincent C. (2021). Fine-Scale Foraging Habitat Selection by Two Diving Central Place Foragers in the Northeast Atlantic. Ecol. Evol. 11, 12349–12363. doi: 10.1002/ece3.7934
Johnson D. H. (1980). The Comparison of Usage and Availability Measurements for Evaluating Resource Preference. Ecology 61, 65–71. doi: 10.2307/1937156
Jones E. L., McConnell B. J., Smout S., Hammond P. S., Duck C. D., Morris C. D., et al. (2015). Patterns of Space Use in Sympatric Marine Colonial Predators Reveal Scales of Spatial Partitioning. Mar. Ecol. Prog. Ser. 534, 235–249. doi: 10.3354/meps11370
Jones E. L., McConnell B. J., Sparling C. E., Matthiopoulos J. (2013). Grey and Harbour Seal Usage Maps. Report to Scottish Government Mr5 (University of St Andrews: Sea Mammal Research Unit).
Jones E. L., Sparling C. E., McConnell B. J., Morris C. D., Smout S. (2017). Fine-Scale Harbour Seal Usage for Informed Marine Spatial Planning. Sci. Rep. 7, 11581. doi: 10.1038/s41598-017-11174-4
Magagna D., Uihlein A. (2015). Ocean Energy Development in Europe: Current Status and Future Perspectives. Int. J. Mar. Energy 11, 84–104. doi: 10.1016/j.ijome.2015.05.001
Manly B. F. J., McDonald L. L., Thomas D. L., McDonald T. L., Erickson W. P. (2002). “Resource Selection by Animals,” in Statistical Design and Analysis for Field Studies, 2nd ed (Dodrecht: Kluwer Academic Publishers).
Mannocci L., Roberts J. J., Pedersen E. J., Halpin P. N. (2020). Geographical Differences in Habitat Relationships of Cetaceans Across an Ocean Basin. Ecography 43, 1250–1259. doi: 10.1111/ecog.04979
Masden E. A., Haydon D. T., Fox A. D., Furness R. W. (2010). Barriers to Movement: Modelling Energetic Costs of Avoiding Marine Wind Farms Amongst Breeding Seabirds. Mar. Pollut. Bull. 60, 1085–1091. doi: 10.1016/j.marpolbul.2010.01.016
Matthiopoulos J. (2003). The Use of Space by Animals as a Function of Accessibility and Preference. Ecol. Modell. 159, 239–268. doi: 10.1016/S0304-3800(02)00293-4
Matthiopoulos J., Fieberg J., Aarts G. (2020). “Species-Habitat Associations,” in Spatial Data, Predictive Models and Ecological Insights (Minnesota, USA: University of Minnesota Libraries Publishing). doi: 10.24926/2020.081320
Matthiopoulos J., McConnell B., Duck C., Fedak M. (2004). Using Satellite Telemetry and Aerial Counts to Estimate Space Use by Grey Seals Around the British Isles. J. Appl. Ecol. 41, 476–491. doi: 10.1111/j.0021-8901.2004.00911.x
Maxwell S. M., Hazen E. L., Bograd S. J., Halpern B. S., Breed G. A., Nickel B., et al. (2013). Cumulative Human Impacts on Marine Predators. Nat. Commun. 4, 2688. doi: 10.1038/ncommsS3688
McCauley D. J., Pinsky M. L., Palumbi S. R., Estes J. A., Joyce F. H., Warner R. R. (2015). Marine Defaunation: Animal Loss in the Global Ocean. Science 347, 1255641. doi: 10.1126/science.1255641
McConnell B. J., Fedak M. A., Lovell P., Hammond P. S. (1999). Movements and Foraging Areas of Grey Seals in the North Sea. J. Appl. Ecol. 36, 573–590. doi: 10.1046/j.1365-2664.1999.00429.x
Morris C. D., Duck C. D. (2019). Aerial Thermal-Imaging Survey of Seals in Ireland 2017 to 2018 (Dublin, Ireland: National Parks and Wildlife Service).
Nelms S. E., Alfaro-Shigueto J., Arnould J. P. Y., Avila I. C., Bengtson Nash S., Campbell E., et al. (2021). Marine Mammal Conservation: Over the Horizon. Endanger. Species Res. 44, 291–325. doi: 10.3354/esr01115
Nel R., Punt A. E., Hughes G. R. (2013). Are Coastal Protected Areas Always Effective in Achieving Population Recovery for Nesting Sea Turtles? PLoS One 8, e63525. doi: 10.1371/journal.pone.0063525
Onoufriou J., Brownlow A., Moss S., Hastie G., Thompson D. (2019). Empirical Determination of Severe Trauma in Seals From Collisions With Tidal Turbine Blades. J. Appl. Ecol. 56, 1712–1724. doi: 10.1111/1365-2664.13388
Palmer L., Gillespie D., MacAulay J. D. J., Sparling C. E., Russell D. J. F., Hastie G. D. (2021). Harbour Porpoise (Phocoena Phocoena) Presence is Reduced During Tidal Turbine Operation. Aquat. Conserv. Mar. Freshw. Ecosyst. 31, 3543–3553. doi: 10.1002/aqc.3737
Parsons E. C. M., Favaro B., Aguirre A. A., Bauer A. M. Y. L., Blight L. K., Cigliano J. A., et al. (2014). Seventy-One Important Questions for the Conservation of Marine Biodiversity. Conserv. Biol. 28, 1206–1214. doi: 10.1111/cobi.12303
Pomeroy P. P., Twiss S. D., Redman P. (2000). Philopatry, Site Fidelity and Local Kin Associations Within Grey Seal Breeding Colonies. Ethology 106, 899–919. doi: 10.1046/j.1439-0310.2000.00610.x
Raymond B., Lea M. A., Patterson T., Andrews-Goff V., Sharples R., Charrassin J. B., et al. (2015). Important Marine Habitat Off East Antarctica Revealed by Two Decades of Multi-Species Predator Tracking. Ecography 38, 121–129. doi: 10.1111/ecog.01021
R Core Team (2020) R: A Language and Environment for Statistical Computing. Available at: http://www.r-project.org/.
Reisinger R. R., Raymond B., Hindell M. A., Bester M. N., Crawford R. J. M., Davies D., et al. (2018). Habitat Modelling of Tracking Data From Multiple Marine Predators Identifies Important Areas in the Southern Indian Ocean. Divers. Distrib. 24, 535–550. doi: 10.1111/ddi.12702
Russell D. J. F., Carter M. I. D. (2021). “Estimating the Proportion of Grey Seals Hauled Out During August Surveys,” in SCOS Briefing Paper 21/02 (University of St Andrews: Sea Mammal Research Unit).
Russell D. J. F., Hastie G. D., Thompson D., Janik V., Hammond P. S., Scott-Haywood L., et al. (2016). Avoidance of Windfarms by Harbour Seals is Limited to Pile Driving Activities. J. Appl. Ecol. 53, 1642–1652. doi: 10.1111/1365-2664.12678
Russell D. J. F., Jones E. L., Morris C. D. (2017). “Updated Seal Usage Maps: The Estimated at-Sea Distribution of Grey and Harbour Seals,” in Scottish Marine and Freshwater Science Report, vol. Vol 8. . doi: 10.7489/2027-1
Russell D. J. F., McClintock B. T., Matthiopoulos J., Thompson P. M., Thompson D., Hammond P. S., et al. (2015). Intrinsic and Extrinsic Drivers of Activity Budgets in Sympatric Grey and Harbour Seals. Oikos 124, 1462–1472. doi: 10.1111/oik.01810
Russell D. J. F., McConnell B., Thompson D., Duck C., Morris C., Harwood J., et al. (2013). Uncovering the Links Between Foraging and Breeding Regions in a Highly Mobile Mammal. J. Appl. Ecol. 50, 499–509. doi: 10.1111/1365-2664.12048
Russell D. J. F., Morris C., Duck C., Thompson D., Hiby L. (2019). Monitoring Long-Term Changes in UK Grey Seal Pup Production. Aquat. Conserv. Mar. Freshw. Ecosyst. 29, 24–39. doi: 10.1002/aqc.3100
Sadykova D., Scott B. E., De Dominicis M., Wakelin S. L., Sadykov A., Wolf J. (2017). Bayesian Joint Models With INLA Exploring Marine Mobile Predator–Prey and Competitor Species Habitat Overlap. Ecol. Evol. 7, 5212–5226. doi: 10.1002/ece3.3081
Sadykova D., Scott B. E., De Dominicis M., Wakelin S. L., Wolf J., Sadykov A. (2020). Ecological Costs of Climate Change on Marine Predator-Prey Population Distributions by 2050. Ecol. Evol. 10, 1069–1086. doi: 10.1002/ece3.5973
Scales K. L., Miller P. I., Embling C. B., Ingram S. N., Pirotta E., Votier S. C. (2014). Mesoscale Fronts as Foraging Habitats: Composite Front Mapping Reveals Oceanographic Drivers of Habitat Use for a Pelagic Seabird. J. R. Soc Interface 11, 20140679. doi: 10.1098/rsif.2014.0679
SCOS (2020). “Scientific Advice on Matters Related to the Management of Seal Populations: 2020,” Special Committee on Seals (SCOS) Main Advice Report.
SCOS (2021). “Scientific Advice on Matters Related to the Management of Seal Populations: 2021,” Special Committee on Seals (SCOS) Main Advice Report.
Sharples R. J., Moss S. E., Patterson T. A., Hammond P. S. (2012). Spatial Variation in Foraging Behaviour of a Marine Top Predator (Phoca Vitulina) Determined by a Large-Scale Satellite Tagging Program. PLoS One 7, e37216. doi: 10.1371/journal.pone.0037216
Sherley R. B., Barham B. J., Barham P. J., Campbell K. J., Crawford R. J. M., Grigg J., et al. (2018). Bayesian Inference Reveals Positive But Subtle Effects of Experimental Fishery Closures on Marine Predator Demographics. Proc. R. Soc B. 285, 20172443. doi: 10.1098/rspb.2017.2443
Thomas L., Russell D. J. F., Duck C. D., Morris C. D., Harwood J., Lonergan M., et al. (2019). Modelling the Population Size and Dynamics of the British Grey Seal. Aquat. Conserv. Mar. Freshw. Ecosyst. 29, 6–23. doi: 10.1002/aqc.3134
Thompson D., Duck C. D., Morris C. D., Russell D. J. F. (2019). The Status of Harbour Seals (Phoca Vitulina) in the UK. Aquat. Conserv. Mar. Freshw. Ecosyst. 29, 40–60. doi: 10.1002/aqc.3110
Torres L. G., Sutton P. J. H., Thompson D. R., Delord K., Weimerskirch H., Sagar P. M., et al. (2015). Poor Transferability of Species Distribution Models for a Pelagic Predator, the Grey Petrel, Indicates Contrasting Habitat Preferences Across Ocean Basins. PLoS One 10, e0120014. doi: 10.1371/journal.pone.0120014
van Neer A., Jensen L. F., Siebert U. (2015). Grey Seal (Halichoerus Grypus) Predation on Harbour Seals (Phoca Vitulina) on the Island of Helgoland, Germany. J. Sea Res. 97, 1–4. doi: 10.1016/j.seares.2014.11.006
Venegas-Li R., Levin N., Possingham H., Kark S. (2018). 3D Spatial Conservation Prioritisation: Accounting for Depth in Marine Environments. Methods Ecol. Evol. 9, 773–784. doi: 10.1111/2041-210X.12896
Ventura F., Matthiopoulos J., Jeglinski J. W. E. (2019). Minimal Overlap Between Areas of High Conservation Priority for Endangered Galapagos Pinnipeds and the Conservation Zone of the Galapagos Marine Reserve. Aquat. Conserv. Mar. Freshw. Ecosyst. 29, 115–126. doi: 10.1002/aqc.2943
Waggitt J. J., Scott B. E. (2014). Using a Spatial Overlap Approach to Estimate the Risk of Collisions Between Deep Diving Seabirds and Tidal Stream Turbines: A Review of Potential Methods and Approaches. Mar. Policy 44, 90–97. doi: 10.1016/j.marpol.2013.07.007
Wakefield E. D., Owen E., Baer J., Carroll M. J., Daunt F., Dodd S. G., et al. (2017). Breeding Density, Fine-Scale Tracking, and Large-Scale Modeling Reveal the Regional Distribution of Four Seabird Species. Ecol. Appl. 27, 2074–2091. doi: 10.1002/eap.1591
Wakefield E. D., Phillips R. A., Matthiopoulos J. (2009). Quantifying Habitat Use and Preferences of Pelagic Seabirds Using Individual Movement Data: A Review. Mar. Ecol. Prog. Ser. 391, 165–182. doi: 10.3354/meps08203
Whyte K. F., Russell D. J. F., Sparling C. E., Binnerts B., Hastie G. D. (2020). Estimating the Impacts of Pile Driving Sounds on Seals: Pitfalls and Possibilities. J. Acoust. Soc Am. 147, 3948–3958. doi: 10.1121/10.0001408
Wilson L., Hammond P. S. (2019). The Diet of Harbour and Grey Seals Around Britain: Examining the Role of Prey as a Potential Cause of Harbour Seal Declines. Aquat. Conserv. Mar. Freshw. Ecosyst. 29, 71–85. doi: 10.1002/aqc.3131
Witt M. J., Bonguno E. A., Broderick A. C., Coyne M. S., Formia A., Gibudi A., et al. (2011). Tracking Leatherback Turtles From the World’s Largest Rookery: Assessing Threats Across the South Atlantic. Proc. R. Soc B. Biol. Sci. 278, 2338–2347. doi: 10.1098/rspb.2010.2467
Wood S. N. (2006). Generalized Additive Models: An Introduction With R (Boca Raton, FL: Chapman & Hall/CRC Press).
Wood S. N. (2020) R Package “Mgcv”: Mixed GAM Computation Vehicle With Automatic Smoothness Estimation. Available at: https://cran.r-project.org/web/packages/mgcv/index.html.
Worm B., Barbier E. B., Beaumont N., Duffy J. E., Folke C., Halpern B. S., et al. (2006). Impacts of Biodiversity Loss on Ocean Ecosystem Services. Science 314, 787–790. doi: 10.1126/science.1132294
Worm B., Lotze H. K., Myers R. A. (2003). Predator Diversity Hotspots in the Blue Ocean. Proc. Natl. Acad. Sci. 100, 9884–9888. doi: 10.1073/pnas.1333941100
Wright A. J., Araújo-Wang C., Wang J. Y., Ross P. S., Tougaard J., Winkler R., et al. (2020). How ‘Blue’ Is ‘Green’ Energy? Trends Ecol. Evol. 35, 235–244. doi: 10.1016/j.tree.2019.11.002
Keywords: animal-borne telemetry, marine spatial planning (MSP), marine vertebrate predators, regional habitat preference, partial migration, place-based conservation, special area of conservation (SAC), use-availability
Citation: Carter MID, Boehme L, Cronin MA, Duck CD, Grecian WJ, Hastie GD, Jessopp M, Matthiopoulos J, McConnell BJ, Miller DL, Morris CD, Moss SEW, Thompson D, Thompson PM and Russell DJF (2022) Sympatric Seals, Satellite Tracking and Protected Areas: Habitat-Based Distribution Estimates for Conservation and Management. Front. Mar. Sci. 9:875869. doi: 10.3389/fmars.2022.875869
Received: 14 February 2022; Accepted: 20 May 2022;
Published: 20 June 2022.
Edited by:
Ryan Rudolf Reisinger, University of Southampton, United KingdomReviewed by:
Mathilde HUON, Université de la Rochelle, FranceDavid Yurkowski, Fisheries and Oceans Canada, Canada
Copyright © 2022 Carter, Boehme, Cronin, Duck, Grecian, Hastie, Jessopp, Matthiopoulos, McConnell, Miller, Morris, Moss, Thompson, Thompson and Russell. This is an open-access article distributed under the terms of the Creative Commons Attribution License (CC BY). The use, distribution or reproduction in other forums is permitted, provided the original author(s) and the copyright owner(s) are credited and that the original publication in this journal is cited, in accordance with accepted academic practice. No use, distribution or reproduction is permitted which does not comply with these terms.
*Correspondence: Matt I. D. Carter, bWlkY0BzdC1hbmRyZXdzLmFjLnVr; Debbie J. F. Russell, ZHI2MEBzdC1hbmRyZXdzLmFjLnVr
†Deceased