 Pedro A. Ribeiro
 Tonje Næss1
 Lars Asplin
 Stein Fredriksen
 Kjersti Sjøtun
- 1Department of Biological Sciences, University of Bergen, Bergen, Norway
- 2Institute of Marine Research, Bergen, Norway
- 3Department of Biosciences, University of Oslo, Oslo, Norway
Saccharina latissima is the most important habitat-forming kelp in sheltered areas of North-Atlantic, and there is also an increasing interest in cultivation and utilization of S. latissima. The cultivation activity may introduce a risk of “crop-to-wild” gene flow from the cultivated crops to natural populations. A baseline study to examine genetic structure and gene flow in S. latissima along the Norwegian coast was therefore done. Microsatellite analyses was carried out on samples from 21 stations, where 12 were in the coastal area from outer Oslofjord in the south to Porsanger in North-Norway, and 9 in the two longest fjords of Norway, Hardangerfjord and Sognefjord. In addition, a hydrographical model was applied, simulating the direction and potential rate of spore dispersal along the coast during the main period of spore release. The results showed a clear isolation by distance pattern along the coast, good connectivity and little genetic structure, except for a reduced connectivity between South- and North-Norway, probably due to the Lofoten archipelago representing a partial barrier for the northward dispersal of spores. In addition, indications of reduced connectivity between coastal stations and the innermost fjord stations were found. Analysing the material with and without one locus potentially under positive selection suggests some degree of genetic adaptation of sugar kelp populations in the Skagerrak area and in the two fjords. The results suggest that genetic connectivity between populations on the coast is strongly influenced by the Norwegian Coastal current.
Introduction
Large brown algae of the order Laminariales are the most important foundation species of temperate or cold rocky shores, and in the northern hemisphere Saccharina latissima (Linnaeus) C.E.Lane, C.Mayes, Druehl & G.W.Saunders (sugar kelp) has a circumpolar and widespread distribution (Lüning, 1990). It has been separated by Luttikhuizen et al. (2018) and Neiva et al. (2018) into four genetically distinct phylogroups, possibly representing incipient species. Two of these are only found in the North-Atlantic; one mainly on the European side and one exclusively on the Northwest Atlantic side, and these most likely originate from a first polar basin crossing of S. latissima after the opening of the Bering strait (~ 5.5 Ma). Luttikhuizen et al. (2018) proposed that S. latissima first migrated across to the Northeast Atlantic side, and thereafter crossed the North Atlantic from east to west, resulting in two separate phylogroups. The two remaining groups are found in the North Pacific, one exclusively so and representing the Saccharina cichorioides complex, while the other occurs in both North Pacific and Northeast Atlantic, and probably migrated from the North Pacific after the Last Glaciation Maximum (Neiva et al., 2018).
Some genetic differentiation within the phylogroups was found both by Luttikhuizen et al. (2018) and Neiva et al. (2018). Neiva et al. (2018) showed that the European phylogroup could be separated into a northern and a southern group based on multilocus genotypes, while Luttikhuizen et al. (2018), using microsatellites, demonstrated significantly differentiated populations in Europe, with low migration rates. This was also shown by Guzinski et al. (2016). In a recent article by Guzinski et al. (2020) studying S. latissima from 11 sites in Europe (from Svalbard to Northern Iberia) using singe nucleotide polymorphisms (SNPs) the greatest diversity was found in the Arctic Ocean and in Scotland. In addition, a high number of microsatellites and SNPs were found to be significantly associated with one of three environmental variables (SST, salinity, and water turbidity). Their study supported the hypothesis of an Arctic refugia for S. latissima during the last glaciation period and highlights the adaptive potential of S. latissima in the North-Atlantic Guzinski et al. (2020).
Saccharina latissima is abundant in sheltered areas along the whole coast of Norway. However, reoccurring reductions in vegetation cover of S. latissima have been observed since 2000 in parts of South-Norway (Christie et al., 2019), possibly due to heatwaves (Armitage et al., 2017; Filbee-Dexter et al., 2020) in combination with other stressors. In North-Norway, massive sea urchin grazing has led to strongly reduced occurrence of kelps for decades (Norderhaug and Christie, 2009), and only recently a reduction in sea urchin density and regrowth of kelps has taken place in the southern parts (Fagerli et al., 2015). Saccharina latissima was probably the most affected kelp species since the density of sea urchins was highest in the more sheltered areas of the coast where S. latissima is most common (Sivertsen, 1997).
The reoccurring decline in S. latissima vegetation along parts of the coast, as well as the escalating effects of climate change, calls for more basic knowledge on population genetic structure and gene flow patterns of S. latissima. Apart from a study by Evankow et al. (2019) on S. latissima and Laminaria hyperborea and Luttikhuizen et al. (2018) on S. latissima along the Norwegian coast, genetic structure and diversity of kelp has not been examined in this region. The study by Evankow et al. (2019) showed some genetic clustering but included for example S. latissima only from coastal stations, while the present study comprises more stations and also includes stations within two large fjords.
The genetic clustering of kelps observed by Evankow et al. (2019) could imply that barriers for gene flow occur along the coast of Norway. Gene flow between populations and spatial genetic structure of marine organisms depends on many interacting forces and traits, where physical barriers for gene flow have a fundamental significance (Selkoe et al., 2016). In the sea such barriers depend on the habit and dispersal mode of an organism. Macroalgae grow in relatively shallow waters and disperse by zygotes, spores or other types of propagules, small thallus fragments, or by drifting thalli if a species has floating abilities, or sometimes by a combination of these. Barriers to gene flow can e.g. be long stretches of open water, shores lacking proper substratum, or currents flowing in an unfavourable direction. The main dispersal unit of kelps is meiospores. These are small, around 10 µm in diameter, and with low sinking rates (Gaylord et al., 2002). Dispersal range for macroalgae, including kelps, has in general been found to be relatively short and typically less than 5 km, when estimated from genetic isolation by distance (IBD) slopes, experiments, and direct observations (Kinlan and Gaines, 2003). However, the small size of the main dispersal unit of kelps suggests that dispersal can be influenced by current velocity and direction, and that kelps potentially may have a wider dispersal range. Simulations carried out by Gaylord et al. (2002) showed a strong impact of current and waves on dispersal range of propagules of a number of species, among others the kelp Macrocystis pyrifera. While some studies have shown that genetic structure in kelps is mainly related to habitat fragmentation or environmental discontinuances (e.g. Billot et al., 2003; Camus et al., 2018; Durrant et al., 2018), others have shown a strong impact of hydrodynamics on dispersal and genetic connectivity in kelps (e.g. Alberto et al., 2011; Coleman et al., 2011). An impact of current pattern on dispersal and genetic connectivity of S. latissima has also been demonstrated, through disruption of general IBD-patterns in areas strongly impacted by local currents (Breton et al., 2018; Mooney et al., 2018).
This study is a contribution to the understanding of genetic structure and diversity of S. latissima along the coast of Norway, and of how genetic connectivity is influenced by currents and topography. The main goal of the investigation was to provide a baseline study of population genetics of S. latissima for future environmental management and monitoring. More specifically our aims were to identify potential barriers to gene flow and genetic clusters along the coast, and to examine to which degree these are related to the main current patterns. The coastline of mainland Norway is particularly well suited for examining patterns of connectivity in marine organisms. It stretches more than 13 degrees of latitude and exhibits conspicuous archipelagos, interrupted by numerous large and small fjords. The Norwegian coastal current flows mainly unidirectionally from Skagerrak and northwards along the coast, with the archipelagos and fjords creating a complex and dynamic hydrodynamic environment (Asplin et al., 2014). Using neutral microsatellites we compared genetic diversity and structure of populations of S. latissima along the coast with populations from the two largest fjords of Norway, Sognefjord and Hardangerfjord. In addition, we have analysed genetic structure pattern in relation to a biophysical model of propagule dispersal, and we discuss the results in the light of dispersal ability, and potential barriers to dispersal.
Materials and Methods
Sampling
Large brown macroalgae of the order Laminariales are the most important foundation species of submarine kelp forests. Saccharina latissima commonly occur throughout the sampling area, and a model study by Gundersen and Bekkby (2013) suggested a distribution area of 682 km2 in South-Norway. It is most abundant in sheltered and moderately wave exposed areas. A high topographical complexity, as is in particular found north of station RO (Figure 1) is thus favourable for S. latissima. The area just south of station RO is relatively wave exposed and is also characterized by unstable substratum such as sandy beaches and will probably have relatively low cover of S. latissima. Its depth distribution in sheltered areas will on the other hand be restricted by turbidity, and inside the fjords also by sea urchin grazing (see Husa et al., 2014).
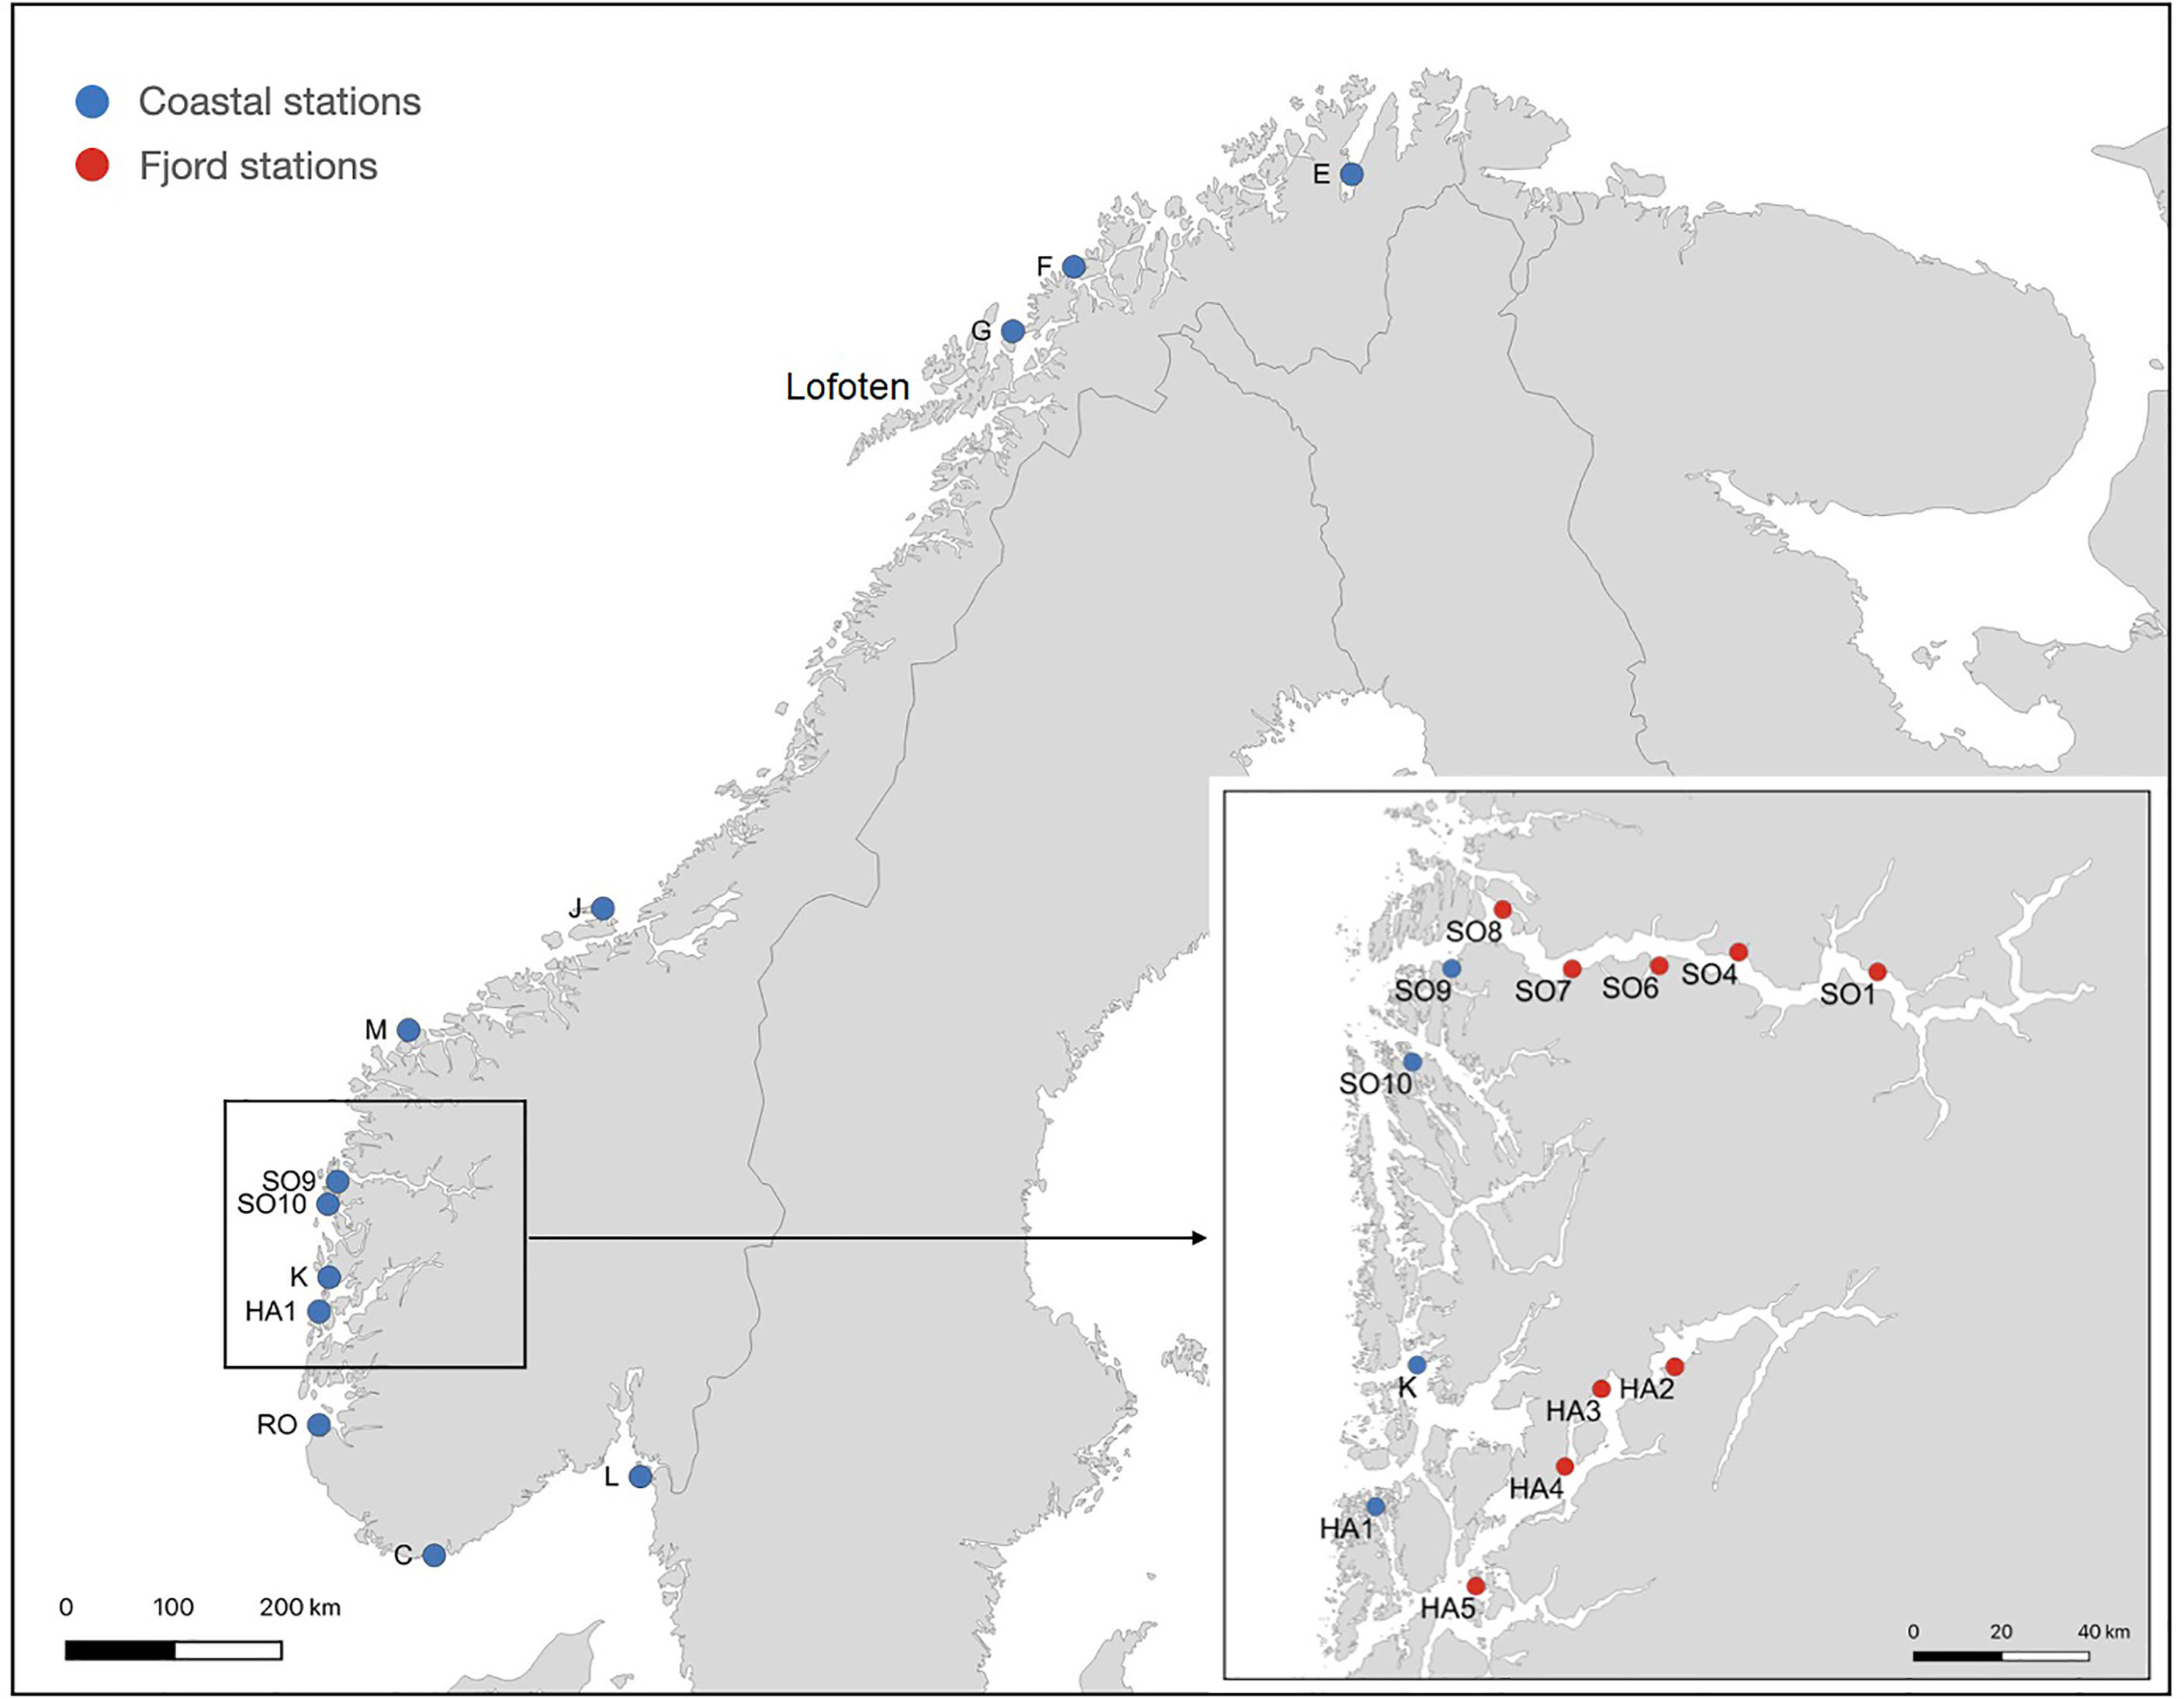
Figure 1 Study area showing sampling locations. A detailed sampling was carried out from the entrance and inwards of two large fjords, Sognefjord (stations SO1, SO4, SO6, SO7, SO8, SO9, SO10) and Hardangerfjord (HA1, HA2, HA3, HA4, HA5). Green dots mark the stations included as coast stations in the analyses.
Samples of S. latissima from a total of 21 stations in Norway were included in the study, and sampling took place between August 2016 and June 2018. The stations ranged from the outer part of Oslofjord in South-East Norway to Porsangerfjord in North-Norway (Table 1; Figure 1). Several stations were located inside two long and narrow fjords in South-West Norway (Hardangerfjord and Sognefjord), to investigate local isolation of S. latissima populations. An overview of seasonal temperatures and salinity ranges in shallow waters close to each station is given in Supplementary Table 1. While the hydrographical conditions along the coast of Norway vary, they do not show a clear north-south gradient of the stations except in maximum temperature, which decrease from 13 to 7.5°C from Mid-Norway to the northernmost station. Minimum sea surface water temperature is lowest in the Oslofjord area and at the northernmost stations. The salinity values display strong spatial and temporal variation, where the lowest salinities (< 22 ppt) occur in the Oslofjord area, and at the stations inside Hardangerfjord and Sogneford (Supplementary Table 1).
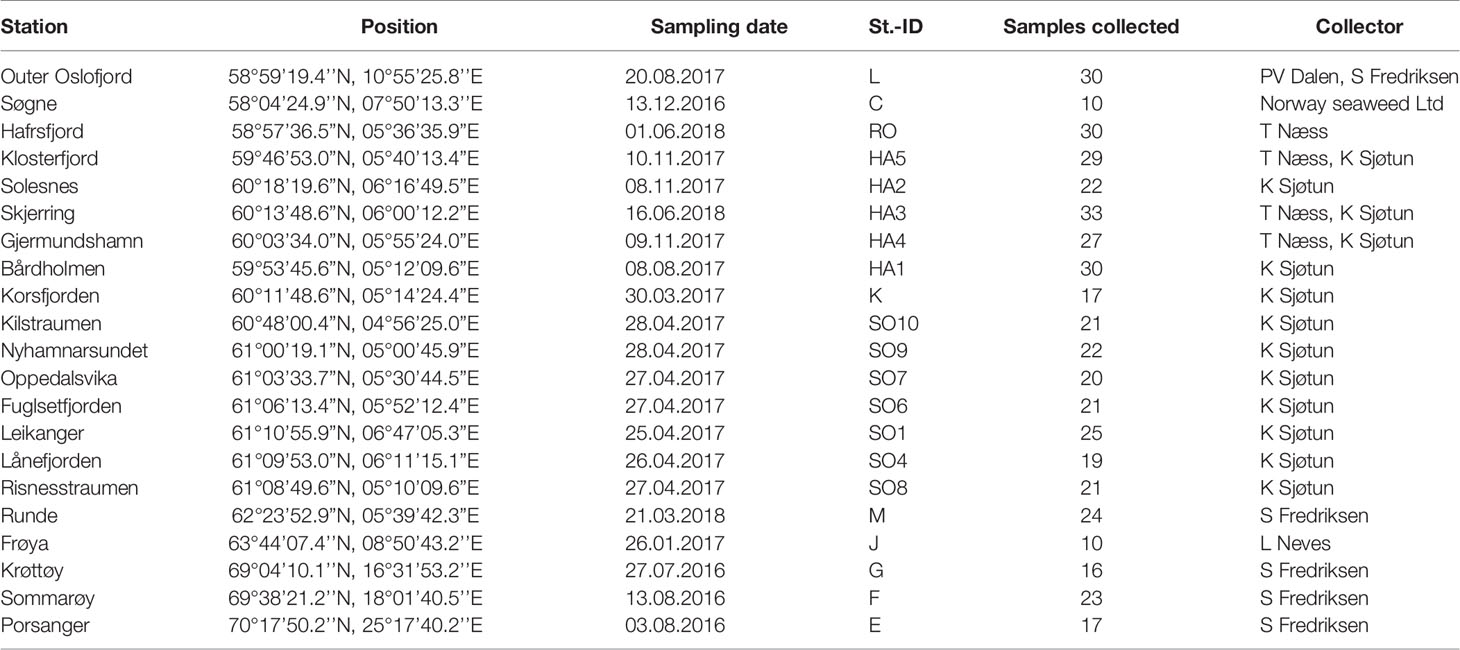
Table 1 Overview of the 21 stations with name of station, position, sampling date, Station-ID, number of samples collected and name of collector.
The sampling procedure depended on the depth range of S. latissima at the site and local topography. Inside Hardangerfjord and Sognefjord S. latissima was most commonly growing shallower than 5 m, and individuals were collected on a 50-100 m stretch along the shore by using a small triangular dredge or a rake at low water, avoiding sampling individuals in close proximity to each other. On the coast S. latissima was commonly collected by diving, or by pulling a triangular formed dredge from a boat, where samples were picked from several pulls along a stretch at 5-10 m depth. Clean pieces of blade tissue of 1-2 cm2 were cut from the meristematic region of the blade on each kelp sample and stored in vials with silica gel until they were analysed. Between 10 and 33 samples were collected per station.
Microsatellite Genotyping
Total genomic DNA was extracted from the tissue samples using Qiagen TissueLyser II and Qiagen DNeasy® 96 Plant Kit or Macherey Nagel NucleoMag® Plant Kit. The extraction was done following the manufacturer protocols with a few modifications. When applying the Qiagen DNeasy Plant Kit the centrifugation steps had to be prolonged, and when applying the NucleoMag Plant Kit the modifications suggested by Fort et al. (2018) were followed. Diluted (1:10) aliquots of all stock DNA solutions were used as template for PCR reactions.
Multilocus genotypes were produced by using 11 of the microsatellites described by Paulino et al. (2016). Initially all twelve microsatellites published in Paulino et al. (2016) were tested, but one (SLN 511) did not amplify. The remaining microsatellites were amplified in two multiplex groups (SLN319, SLN320, SLN34, SLN32 constituting one group, and SLN35, SLN36, SLN314, SLN510 the other), or in single reactions (SLN54, SLN58, SLN62). Primers and thermal cycling conditions as described in Paulino et al. (2016) were applied for the PCR reactions, with some slight modifications of annealing temperatures (55-58°C).
The fragment analysis was done on an ABI 3730 DNA Analyzer (Applied Biosystems). Prior to the analysis, 2 μl of the diluted PCR products were mixed with 8 μl of a mixture of GeneScanTM 500 LIZTM size standard (8 μl) and 800 μl formamide. Binning and allele scoring were performed manually using GeneMapperTM Software 5 (Applied Biosystems).
Data Analysis
Evidence for null alleles, and scoring errors caused by large allele dropout and stuttering, were examined with MICROCHECKER 2.2.3 (Van Oosterhout et al., 2004). LOSITAN (Antão et al., 2008) was used to test the presence of candidate loci under positive or balancing selection, with the default parameters and 50.000 simulations. Genetic diversity estimates including allele frequencies, observed (HO) and expected heterozygosity (HE), and inbreeding coefficient (FIS) were calculated per station and locus using ARLEQUIN 3.5.2.2 (Excoffier and Lischer, 2010). Allelic richness (A; mean number of alleles per locus) was estimated by rarefaction to the smallest sample size (Petit et al., 1998) using FSTAT 2.9.3.2. Significant deviations from Hardy-Weinberg equilibrium (HWE) and genotypic linkage disequilibrium (LD) between pairs of loci were tested by measuring their inbreeding coefficients (FIS) and associated P-values using a Hardy-Weinberg exact test implemented in the web version of ARLEQUIN 3.5.2.2. The same software was also used to perform exact tests for HWE by locus (multipopulation test) and by population (multi-locus test) with a heterozygote deficit as the alternative hypothesis. To correct for type I errors that may arise from multiple comparisons, significance values were adjusted using the sequential Bonferroni correction procedure with α = 0.05 (Rice, 1989).
Genetic population structure was assessed using STRUCTURE version 2.3.4 (Pritchard et al., 2000). STRUCTURE uses a Bayesian approach with Markov chain Monte Carlo (MCMC) method to estimate allele frequencies in each genetic cluster and population memberships for each individual. The analysis was run using a MCMC length of 1,000,000 steps after a burn-in of 200,000, without prior geographic information. The most likely number of clusters (K, set from 2 to 6) was determined over 20 independent runs using the web-based program Structure Selector (Li and Liu, 2018), based on the ΔK method (Evanno et al., 2005). Population structure was further examined using Principal Coordinates Analysis (PCoA) based on Nei’s genetic distance (Nei, 1987) between pairs of populations, implemented in GenAlEx v6.1 (Peakall and Smouse, 2012).
Population differentiation was estimated by calculating FST for each station and locus, and pairwise FST values (Weir and Cockerham, 1984) between stations, in ARLEQUIN 3.5.2.2. Genetic structure was also tested using a hierarchical Analysis of Molecular Variance (AMOVA) implemented in ARLEQUIN 3.5.2.2. Two AMOVAs comprising between and within group comparisons were carried out. In one AMOVA three groups were included; coastal stations (L, C, RO, HA1, K, SO10, SO9, M, J, G, E, F), stations in Hardangerfjord (HA5, HA2, HA3, HA4), and stations in Sognefjord (SO7, SO6, SO1, SO4, SO8). In the second AMOVA, costal stations south of Lofoten (L, C, RO, HA1, K, SO10, SO9, M, J) and north of Lofoten (G, F, E) were compared (location of stations shown in Figure 1). Statistical significance of AMOVA was tested from 10 000 permutations.
Isolation-by-distance among coastal populations was assessed with a Mantel test correlating pairwise genetic differentiation (FST/(1-FST)) and geographic distance matrices using the program ISOLDE in GENEPOP 4.2 (genepop.curtin.edu.au) with 1000 permutations. Pairwise geographical distances between coastal stations were measured as the shortest distance along the coastline using a digital (www.norgeskart.no).
Simulation of Spore Dispersal
Simulation of spore dispersal along the coast was done by a particle tracking model, the Lagrangian Advection and Diffusion Model (LADIM; https://github.com/bjornaa/ladim). The model used hourly values of currents from the NorKyst800 model, which covers the whole Norwegian coast with a horizontal grid resolution of 800 m, and vertically there were 35 terrain following coordinates. Details of validation and set up of the NorKyst800 modelling system is given e.g., in Abretsen et al. (2011) and Asplin et al. (2020). In the simulations a particle was released hourly and drifted at a fixed depth. LADIM solves the Lagrangian equation of motion by normally using a 4th order Runge-Kutta scheme, and a random walk scheme was used to parameterize horizontal sub-grid scale motion, with a diffusion coefficient of 0.1 m2 s-1. Particle positions were stored hourly.
The main fertility period of sporophytes of S. latissima has been reported to be from October to January in Mid-Norway (Forbord et al., 2018). For the simulations the period from 30 September to 30 January was chosen since this probably represents the main period of spore release of S. latissima along most parts of the coast of Norway. Simulations of spore (particle) release from a total of 29 stations (including the 12 coastal stations of this study), positioned along the coast from outer Oslofjord to Finnmark, were carried out. During the main simulation one particle was released at 5 m depth hourly from each station during the simulation period. Additional simulations were done to investigate the potential spore dispersal into one of the main fjords, Hardangerfjord, from the station situated around 35 km from the fjord mouth (Station HA5, Figure 1). The same simulation conditions were applied, but with additional particle release depths of 1, 10 and 20 m. Measurements of currents were done at a site approximately midway into Hardangerfjord (N 59 59.3, E 5 54.1), with a NortekAquadopp 600-kHz Z-cell profiler placed at 26 m. The current meter measured upwards with a vertical bin size of 1 m and stored the results every 10 mins between 8 August-17 October 2018.
Results
A total of 422 individuals were genotyped for the 11 loci. The genotype data are deposited in DataverseNO and can be accessed by https://doi.org/10.18710/IIZ1BZ. While no evidence of linkage disequilibrium was found in any pairs of loci when tested across all populations, two loci with null alleles were detected (SLN34 and SLN54). A preliminary STRUCTURE analysis was done with and without the two loci with null alleles, and the test runs showed that including the loci with null alleles had an effect on the inferred genetic structure. When excluding the two loci, the most likely number of genetic clusters decreased from 5 to 4, and there was a tendency for the genetic structure to become more homogenous and intermixed at several stations. For this reason, loci SLN34 and SLN54 were excluded from the final analyses.
Genetic Diversity
The nine remining loci were polymorphic, with the lowest number of detected alleles observed in SLN62 (Na=4) and the highest in SLN36 (Na=28). Allelic richness (standardized to the minimum sample size which was 8) varied between 2.9 to 4.7, with the lowest value found at the innermost site in Sognefjord (SO1) and the highest value found at Krøttøya, in northern Norway (Table 2).
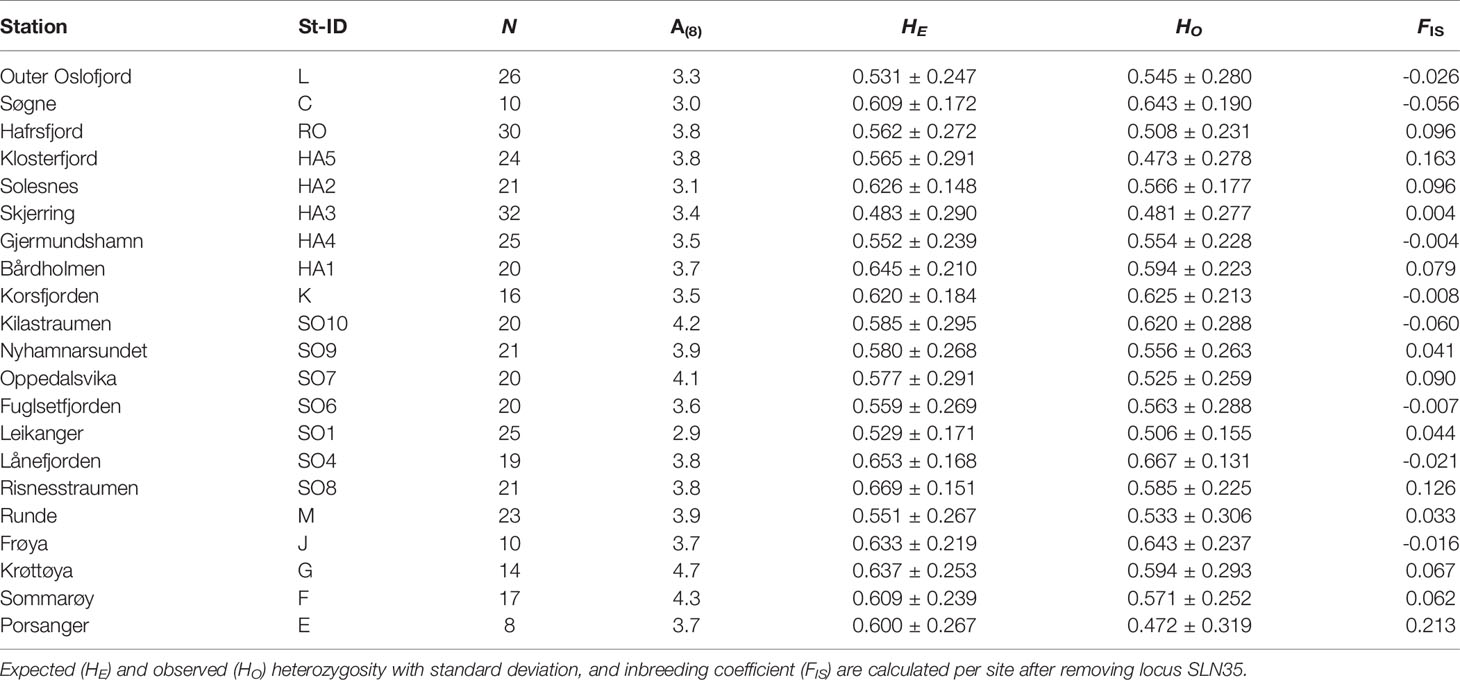
Table 2 Station, Station-id, number individuals amplified (N), allelic richness standardized to smallest sample size (A(8)).
Locus SLN35 was identified by LOSITAN as putatively under positive selection, and locus SLN36 under balancing selection. To calculate estimates of genetic diversity from neutral loci the locus putatively under positive selection was removed.
There was only a few (maximum three cases at one site) significant deviations from HWE in the study, and none of the loci showed consistent deviation from HWE across the study sites. Expected heterozygosity (HE) per station varied between 0.483 and 0.669 and observed heterozygosity (HO) ranged from 0.472 and 0.667 (Table 2). The inbreeding coefficient FIS varied from -0.060 to 0.213, and all but three sites showed values lower than 0.100 (Table 2). The highest FIS coefficient was found at the northernmost site (E). This is however also the site with the lowest sample size (n=8), which could have influenced the FIS value. In addition, sites HA5 in outer Hardangerfjord and SO8 in outer Sognefjord had relatively high FIS coefficients, suggesting some degree of inbreeding and isolation of the populations at these sites.
Genetic Structure and Differentiation
The STRUCTURE analysis inferred the existence of four genetic clusters, with a high degree of admixture and shallow genetic structure across most stations (Figure 2). A slight dominance of one or two clusters was inferred at the innermost fjord stations SO1 in Sognefjord, and HA2 and HA3 in Hardangerfjord (Figure 2A). Clearer population structure was however detected between the three stations in Northern Norway (G, F, E) and those located south of the Lofoten archipelago. The dominance of one cluster in Northern Norway was particularly evident in a separate STRUCTURE analysis excluding the stations situated inside the two big fjords (HA2, HA3, HA4, HA5, SO1, SO4, SO6, SO7, SO8), with all stations on the coast of South-Norway showing a similar pattern of admixture of the four clusters (Figure 2B).
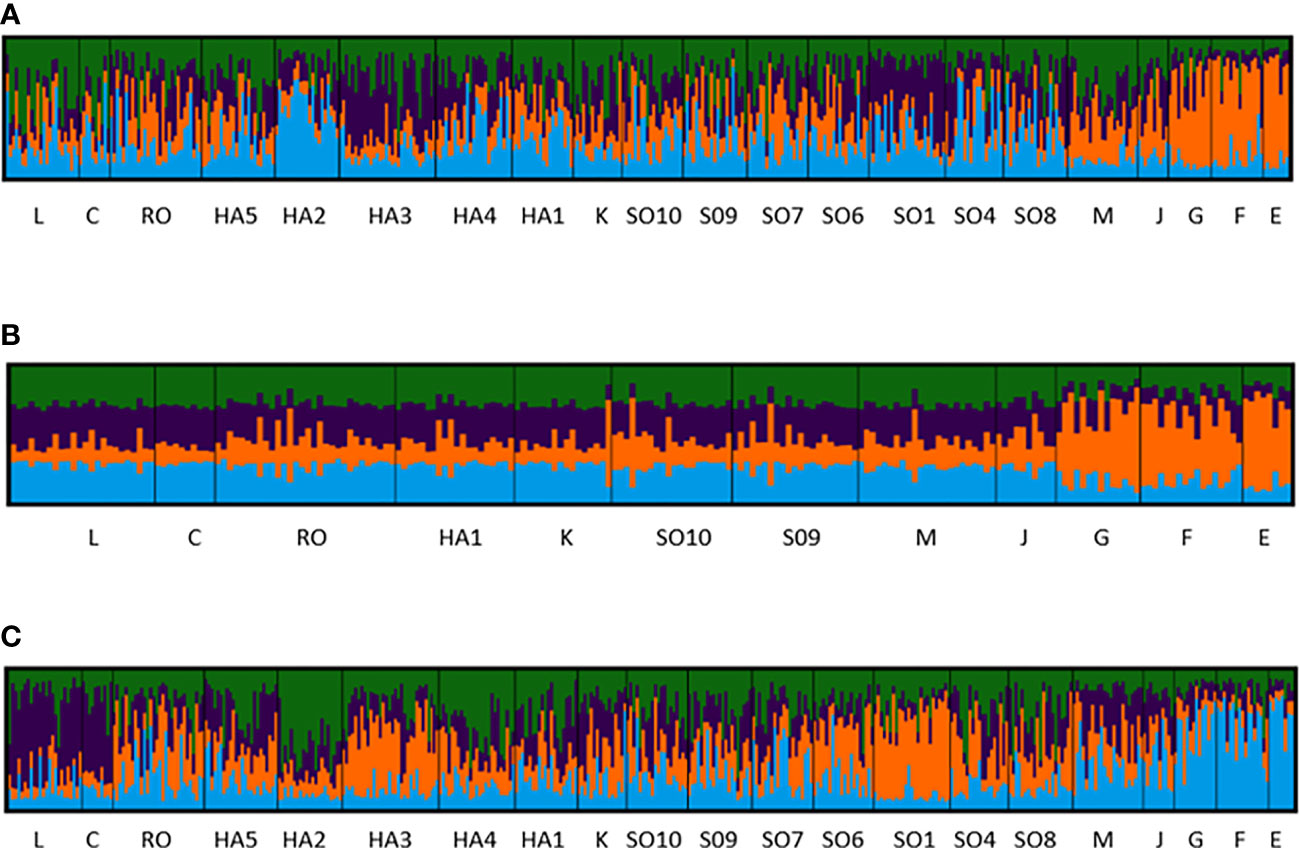
Figure 2 Population structure of Saccharina latissima, based on individual multilocus microsatellite genotypes and an inferred number of genetic clusters of K = 4. Stations are organized from south (L) to north (E) including those in Hardangerfjord (HA) and Sognefjord (SO). Location of the stations is shown in Figure 1. (A) Analysis with 8 loci and all stations included; (B) Analysis with 8 loci, but only coastal stations included; (C) Analysis with 9 loci (locus SLN35 putatively under positive selection included) and all stations included.
An additional STRUCTURE analysis was carried out with all nine loci to test if including the locus putatively under positive selection (SLN35) would influence the inferred population structure. The analysis showed that one of the genetic clusters became more dominant at the two stations in the Skagerrak area (L and C), and at the innermost station in Sognefjord (SO1) another genetic cluster became more dominant, while the changes at station HA3 appeared less prominent (Figure 2C).
The results from the PCoAs on genetic differentiation between stations largely supported the STRUCTURE analyses. Most of the stations clustered together with no spatial resolution (Figure 3). In the PCoA done without the locus putatively under positive selection (SLN35) three station groups showed higher dissimilarity to each other than to the rest of the stations; the two stations in Skagerrak (L and C), two fjord stations (SO1 and HA3), and the northernmost station (E) (Figure 3A). Stations L and C grouped closely together as very similar, and SO1 and HA3 was also relatively similar. The two other stations from North-Norway (G, F) placed themselves intermediate between the main cluster and station E, which showed the largest dissimilarity to the main cluster (Figure 3A). The first axis, which placed the stations in a predominantly south-north gradient, explained 31.5% of the variation, while the second axis explained 19.7%.
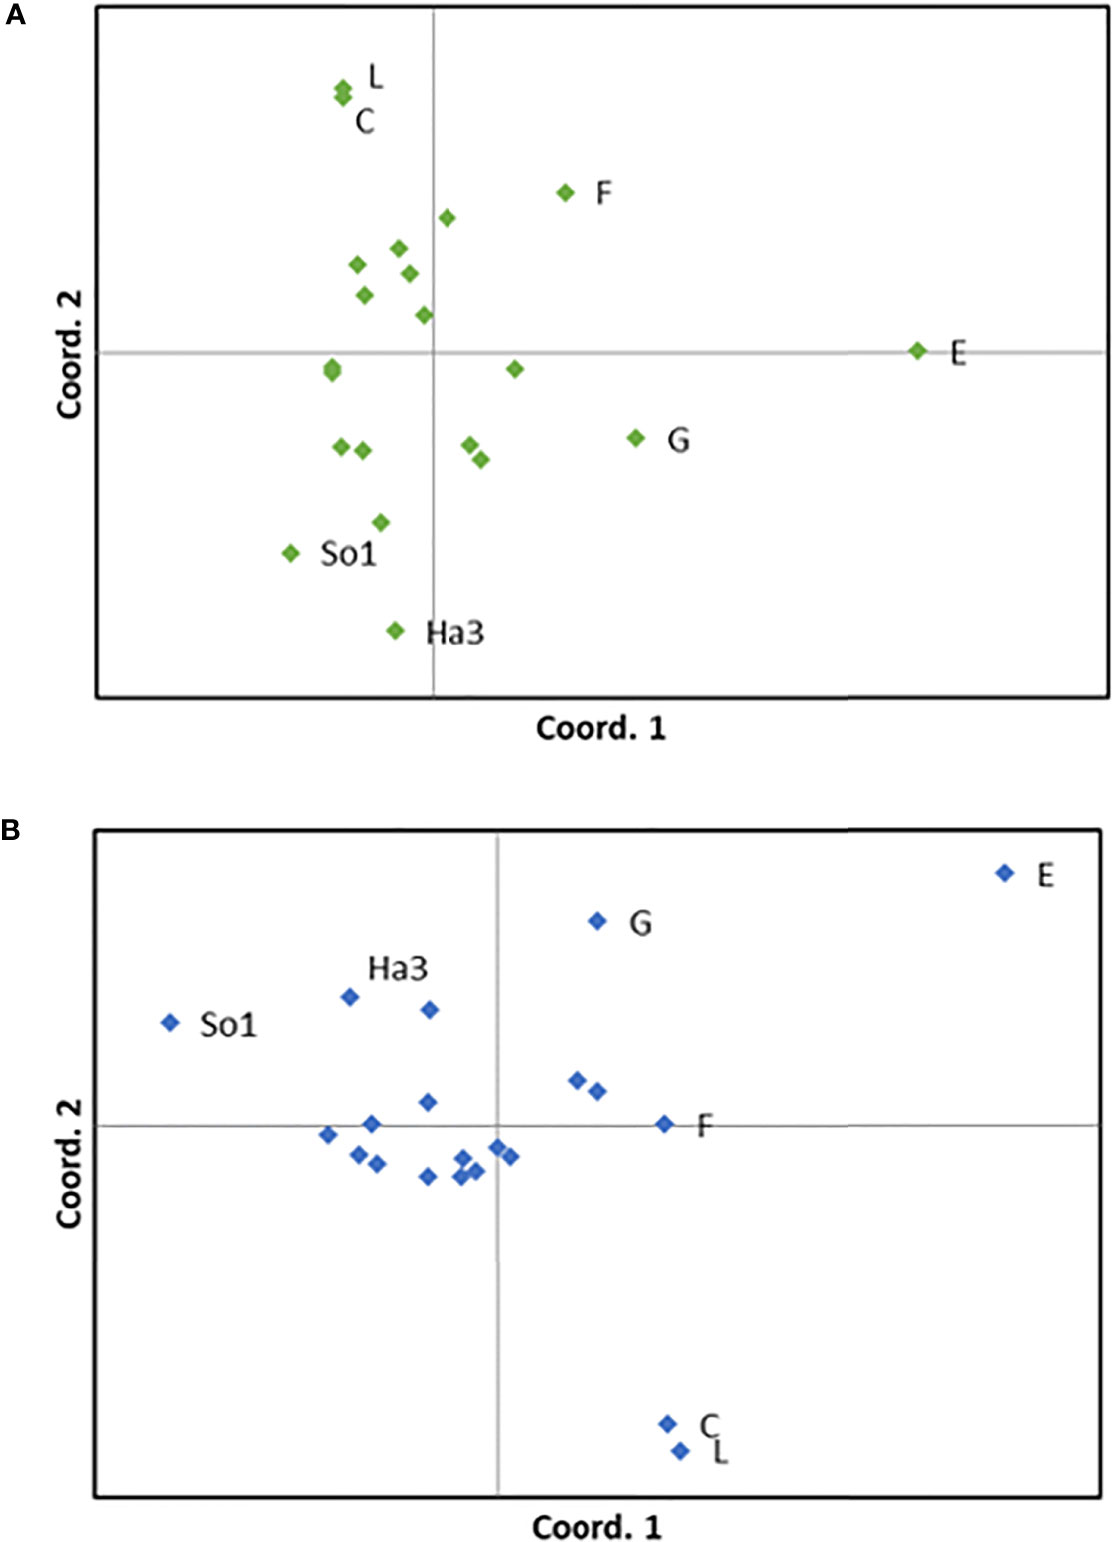
Figure 3 Results from PCoA (Principal Coordinates Analysis), where each dot represents one sampling station. (A) Plot with 8 loci, (B) Plot with 9 loci (i.e. the locus putatively under positive selection (SLN 35) is included). The two stations in Skagerrak (L and C), the three northernmost stations (G, F, E) and the two fjord stations which differs most from the other stations (SO1 in Sognefjord and HA3 in Hardangerfjord) are marked.
Including the locus putatively under positive selection (SLN35) introduced some changes of the PCoA results (Figure 3B). The two stations in Skagerrak (L and C) became more dissimilar to the main cluster of stations, and station SO1, the innermost station in Sognefjord, became somewhat more dissimilar to some of the stations of the main cluster.
The AMOVA analyses revealed that most of the genetic variation occurs within populations (Table 3). Nevertheless, significant genetic differentiation was still found among groups and among populations for both groupings tested (P<0.05). When comparing stations north vs. south of the Lofoten archipelago (Table 3B), the amount of genetic variation among the two groups was slightly higher than among populations within groups.
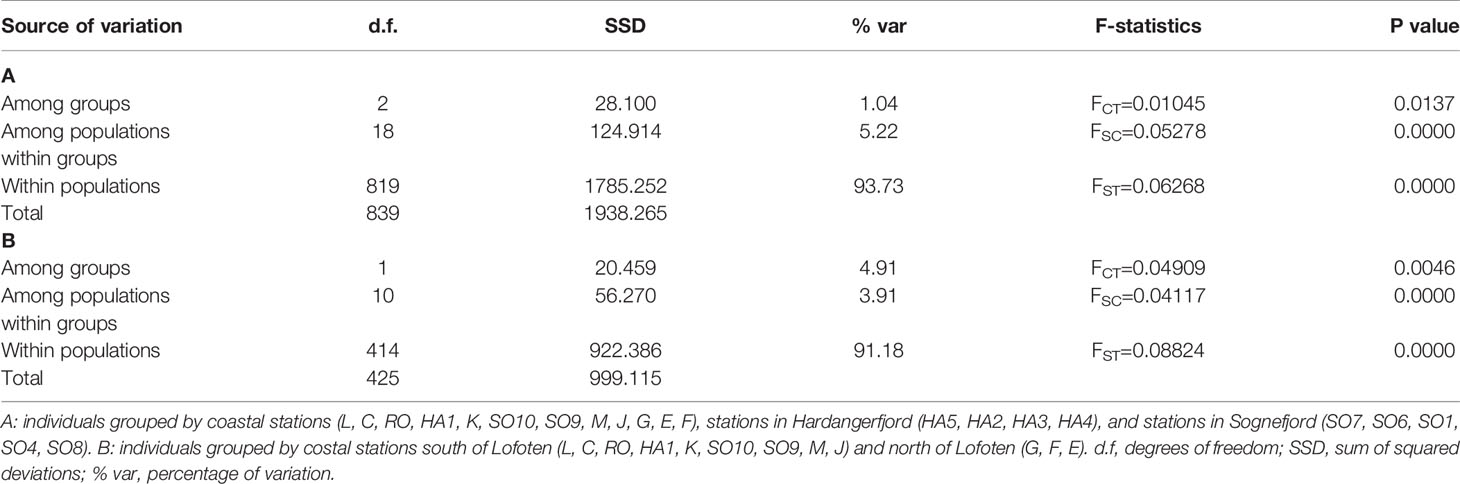
Table 3 Hierarchical analyses of molecular variance (AMOVA) using nine microsatellite loci (after removing locus SLN35) and testing for two possible population structures.
Pairwise FST values varied between 0 and 0.269 and most were statistically significant (Supplementary Table 2). Non-significant FST values were mostly found between some of the stations on the coast of South-Norway, or between coastal stations and some of the fjord stations. The highest FST estimates were more frequently found in pairwise comparisons involving the innermost fjord stations (HA2, HA3, H4, SO1) and stations north of the Lofoten (G, F, E). A plot of genetic distance between the coastal stations, measured as FST/(1-FST), and geographical distance, show a clear isolation by distance (IBD) trend (Figure 4). A Mantel test revealed that IBD is statistically significant for the coastal stations (p<0.05), while separate tests for the stations in Hardangerfjord and Sognefjord showed no significant IBD relationships (p>0.05, data not shown).
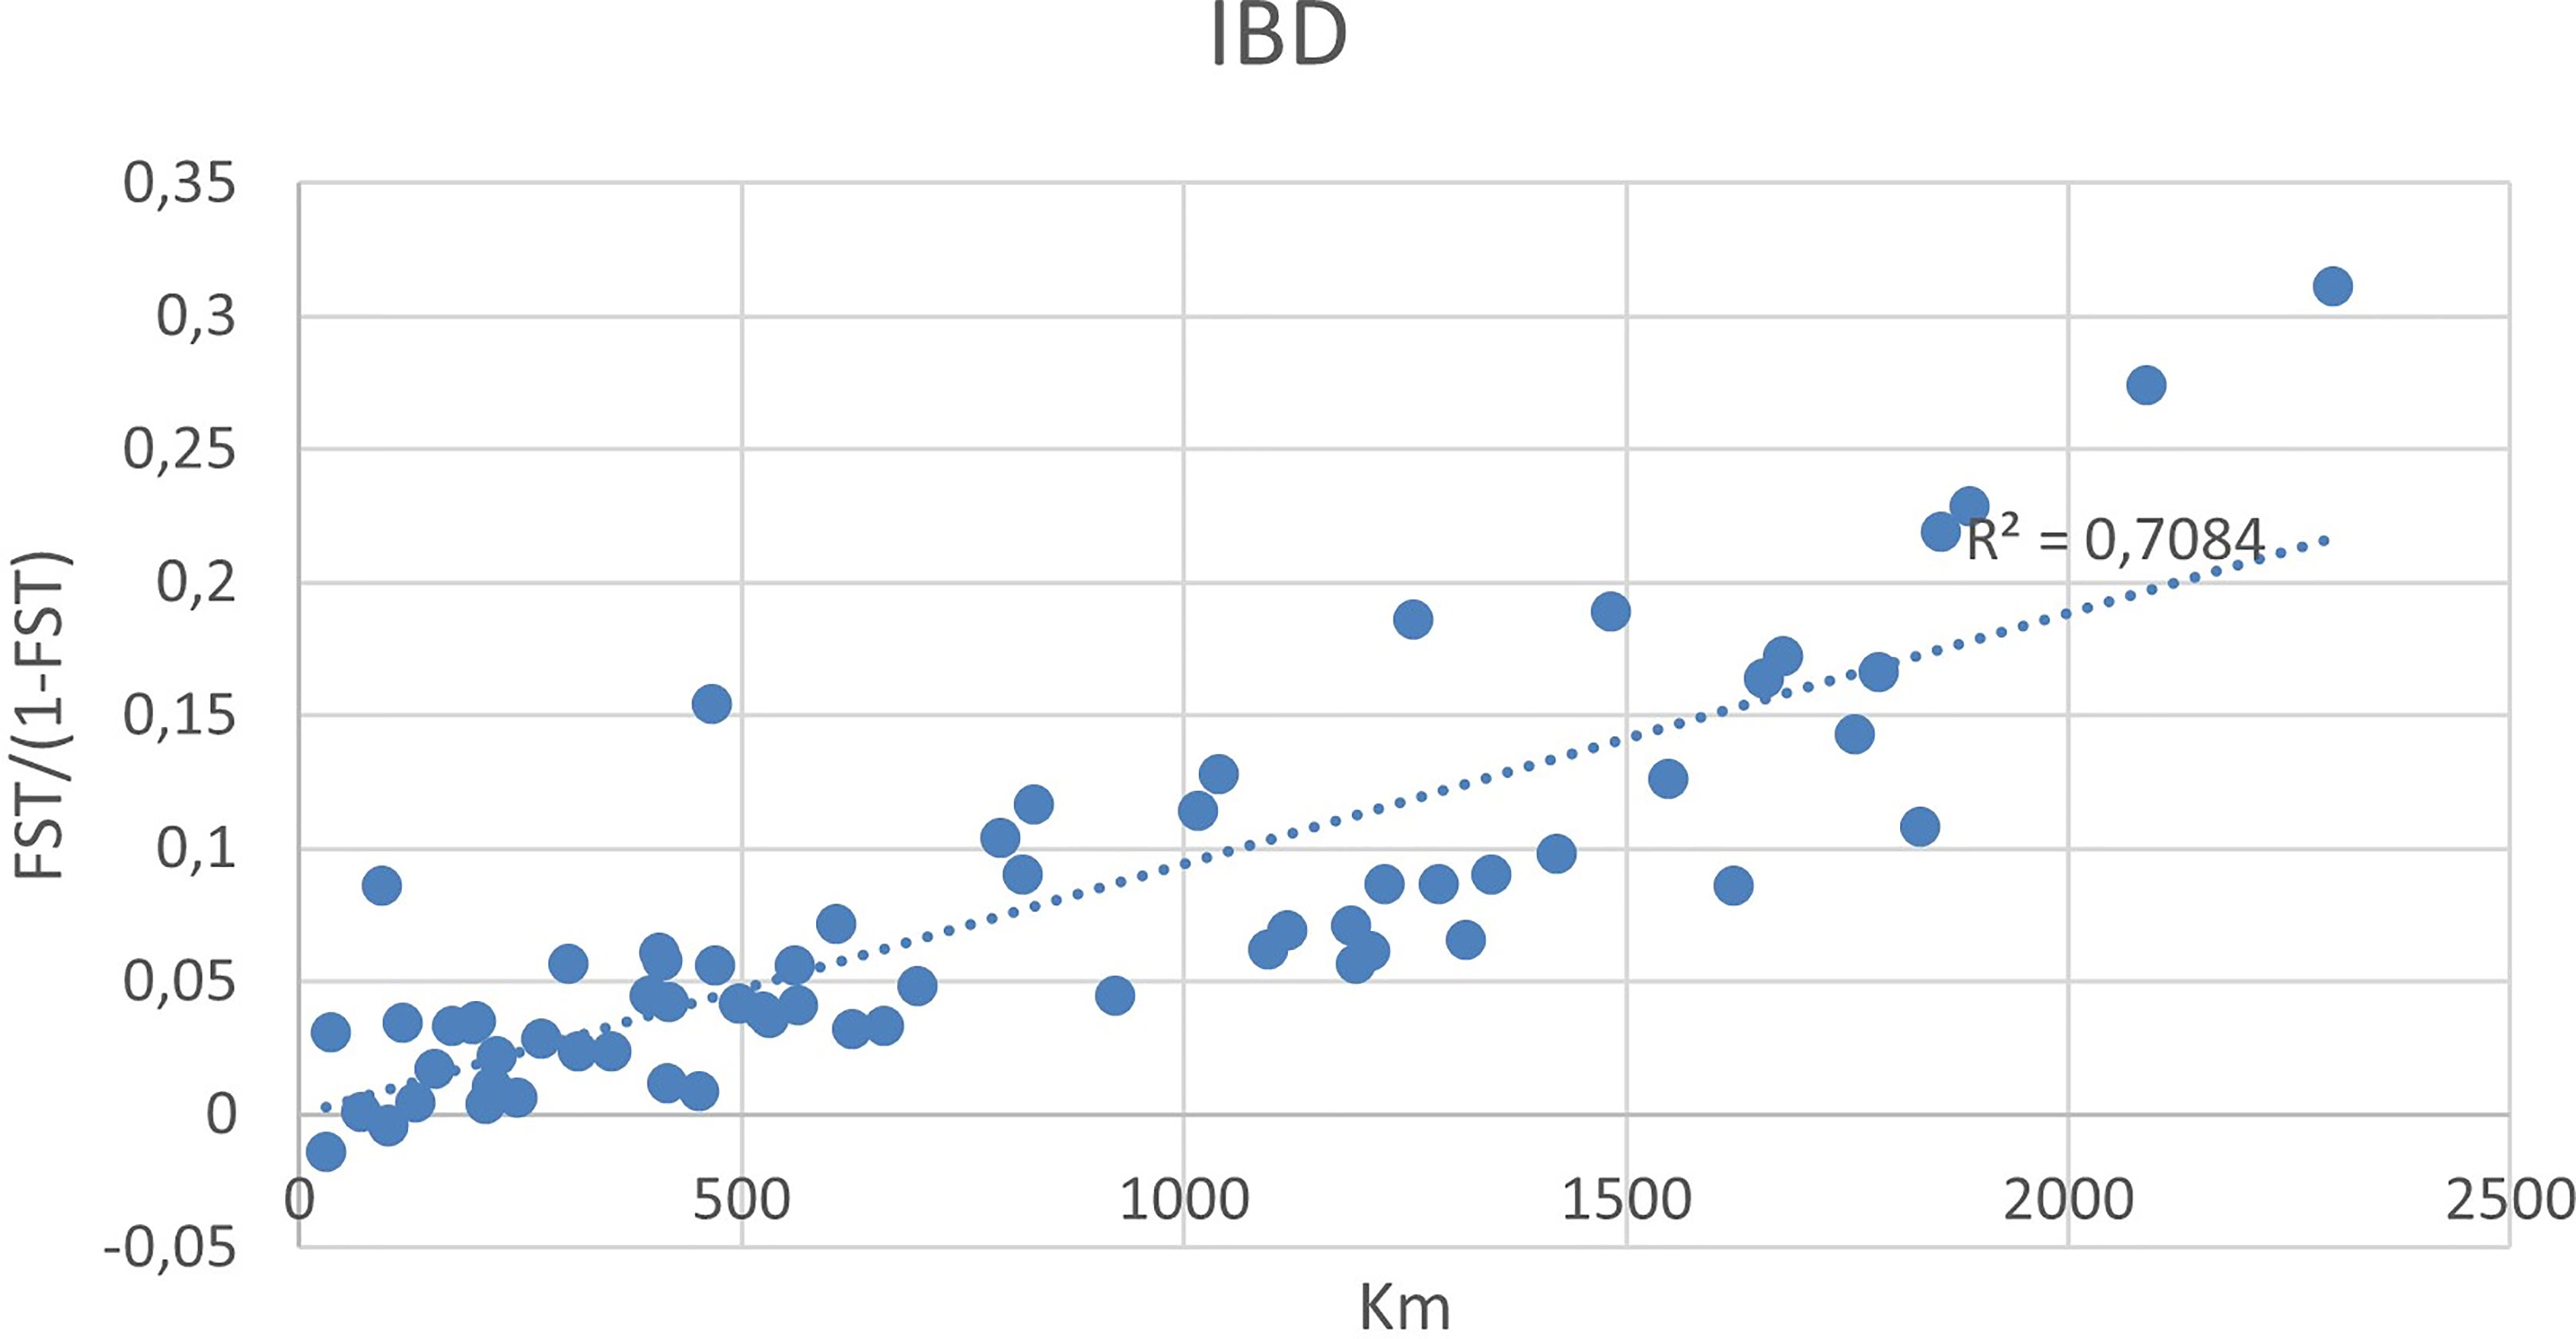
Figure 4 Pairwise FST values of stations plotted against distance (km) between stations, costal stations only.
Simulation of Spore Dispersal
Results from the main simulation of spore dispersal showed that the particles mainly followed the direction of the Norwegian Coastal current along the coast, with much higher densities along the coast than further out from the coast (Figure 5). The dispersal was predominantly west- (on the south coast of Norway) or northwards, with a minor fraction of particles spreading in the opposite direction or offshore (an example is shown in Supplementary Figure 1). On average the particles would travel 200-300 km from the release station during the simulation period, with a small fraction (10%) travelling a considerably longer distance (Figure 6). An exception was found for particles released just south of the Lofoten archipelago, where average spreading distance for particles were less than 100 km from the release station (Figure 6). A detailed study of the simulation showed that particles released from stations south of the Lofoten archipelago would aggregate in front of this, with only minor fractions spreading past it (Figure 7). The results from the main particle release simulation thus suggest that the Norwegian Coastal current causes a strong and rapid dispersal of spores in the shallow parts along the coast all the way till the Lofoten archipelago, which forms a barrier for dispersal.
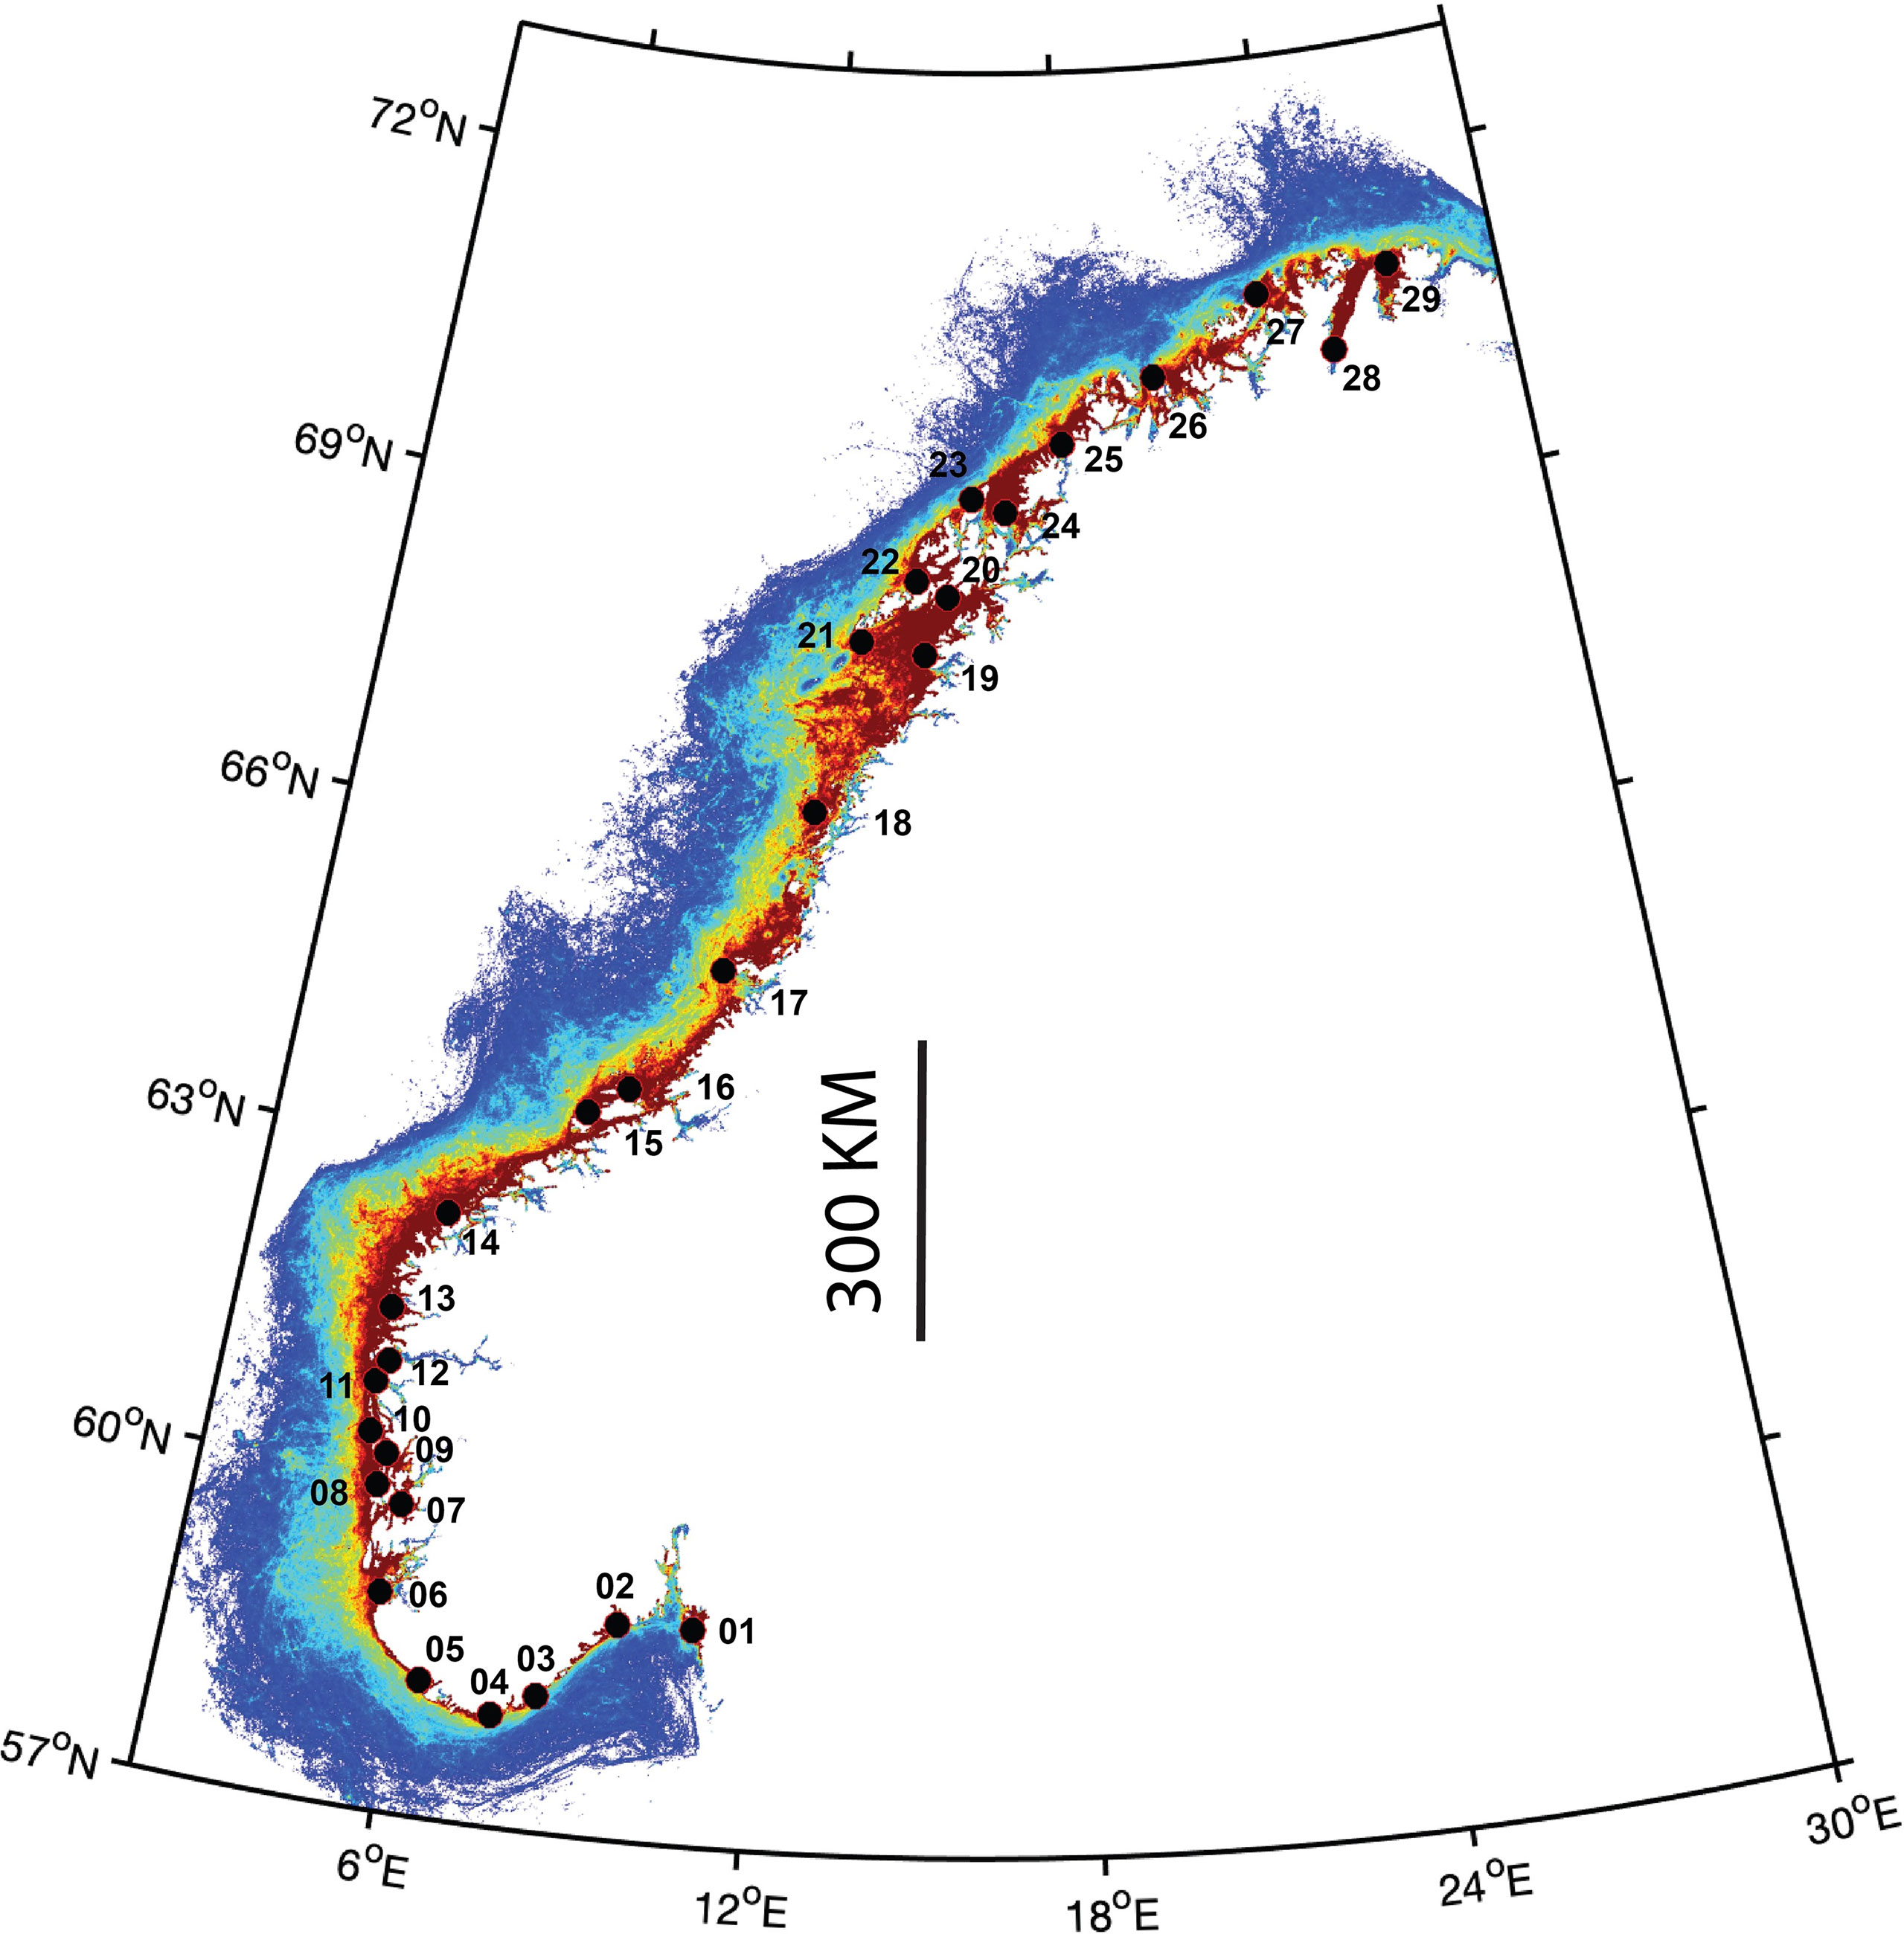
Figure 5 Aggregated particle concentration from all 29 release locations along the coast for the period October 2018 – January 2019. Dark blue color represents low aggregation and red colour high aggregation.
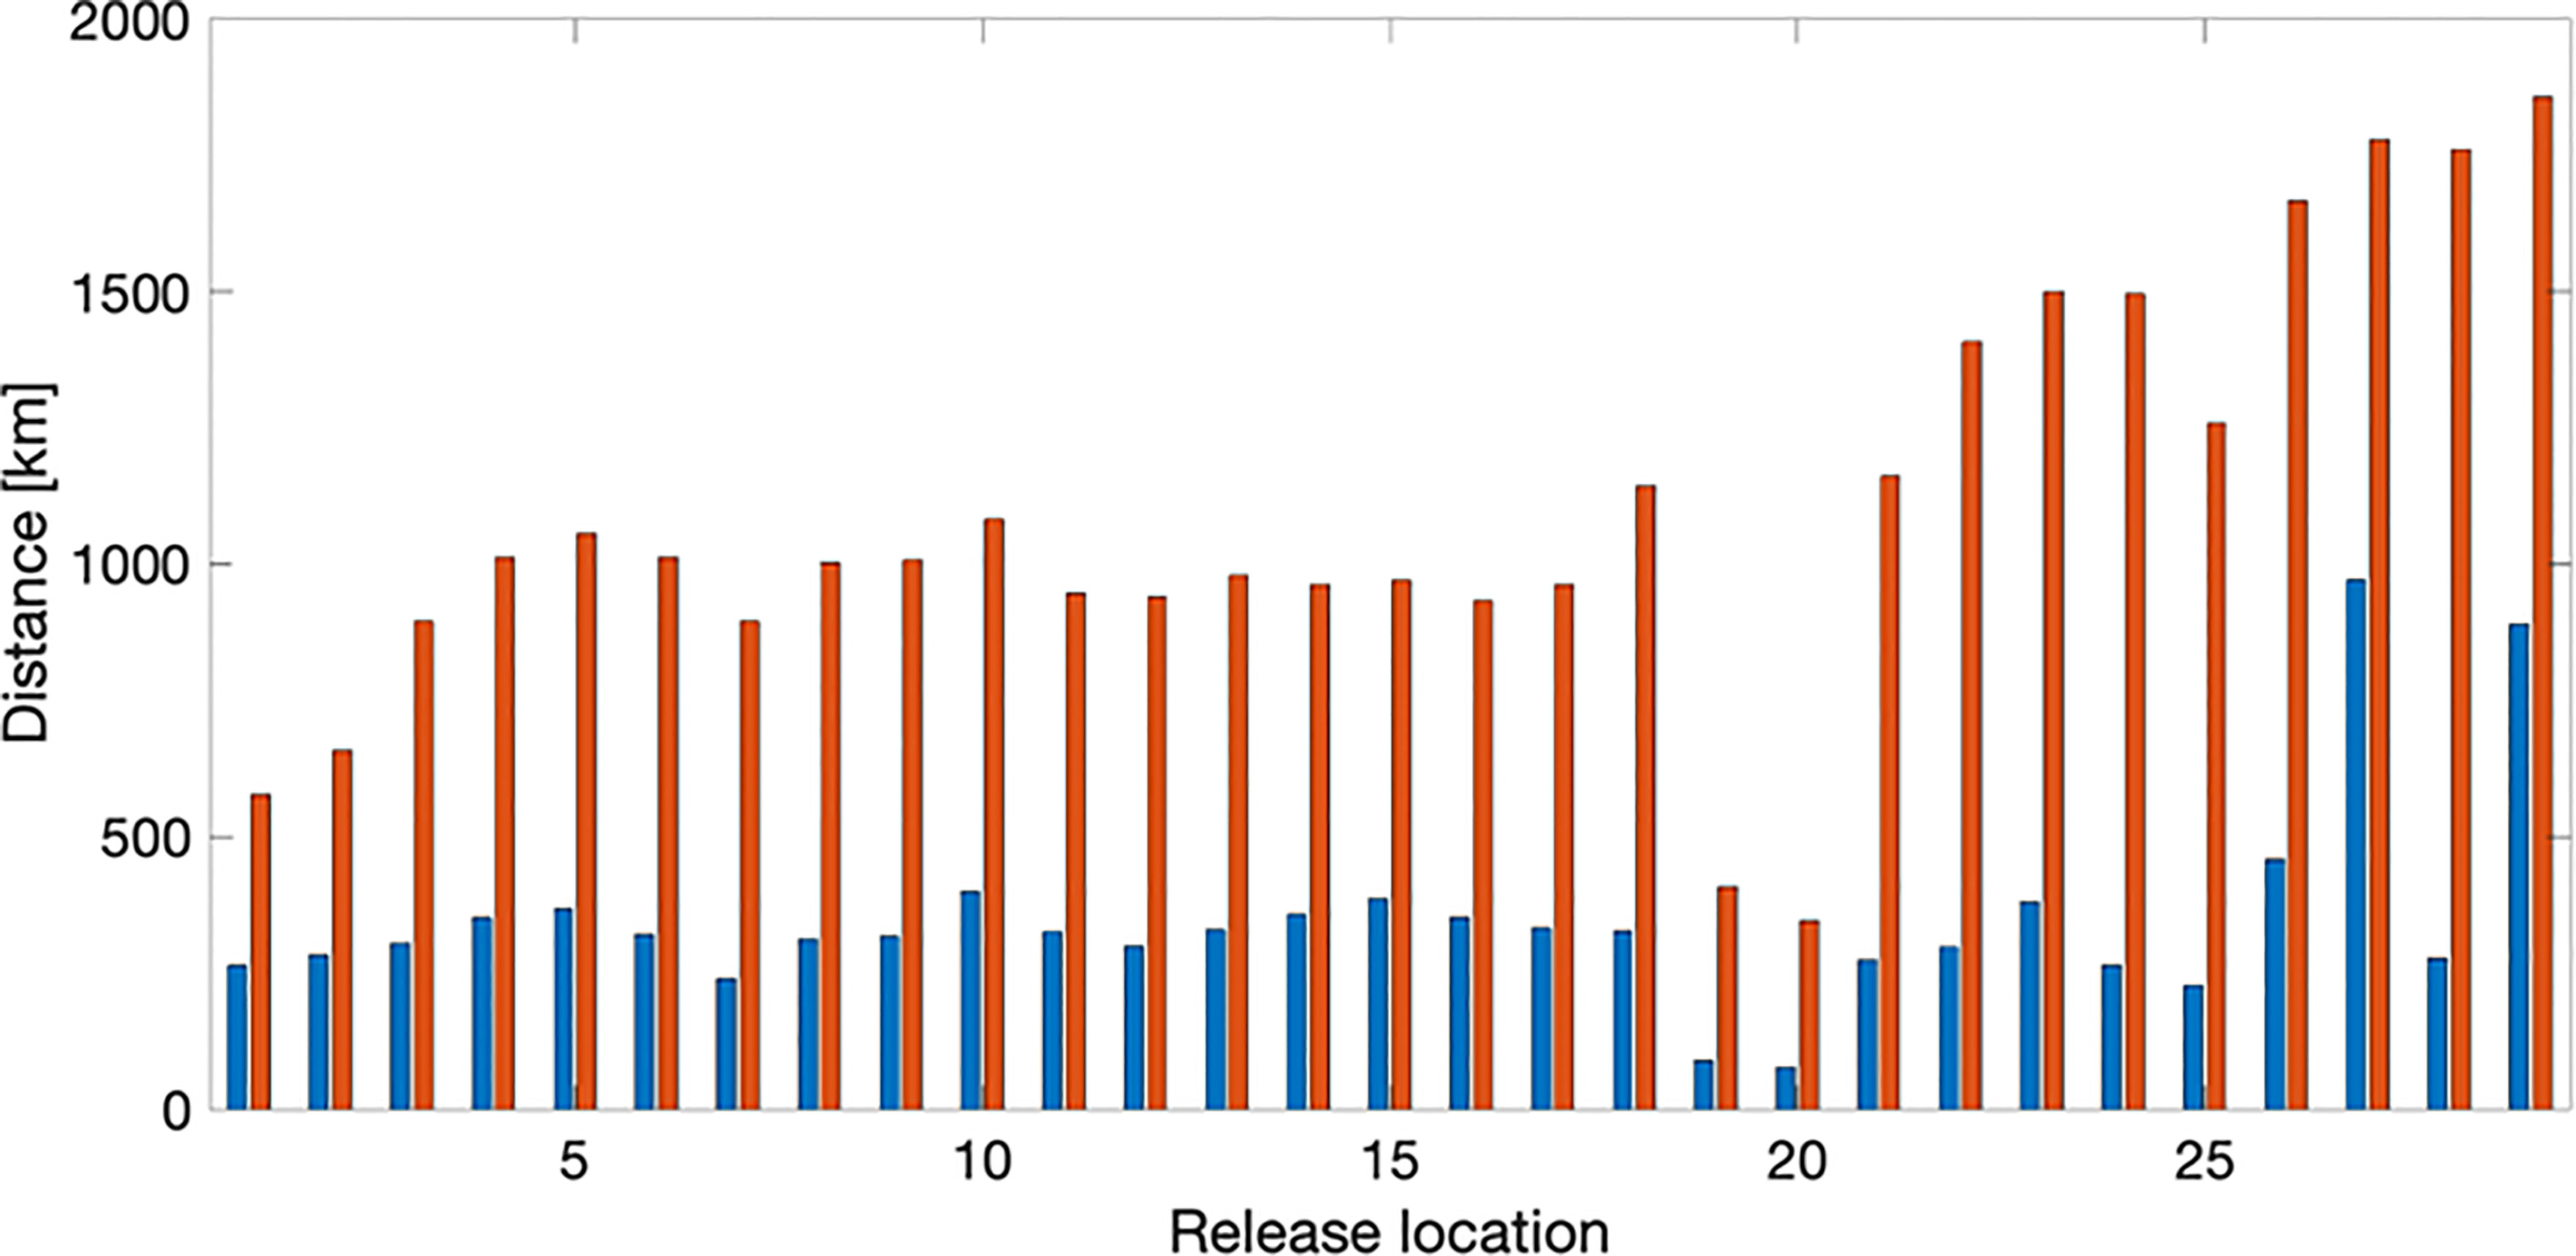
Figure 6 Distances of particle dispersion away from the release locations. Blue bars represent the mean distance travelled for all particles. Red bars represent the mean distance travelled for the 10% of the particles with the longest dispersion.
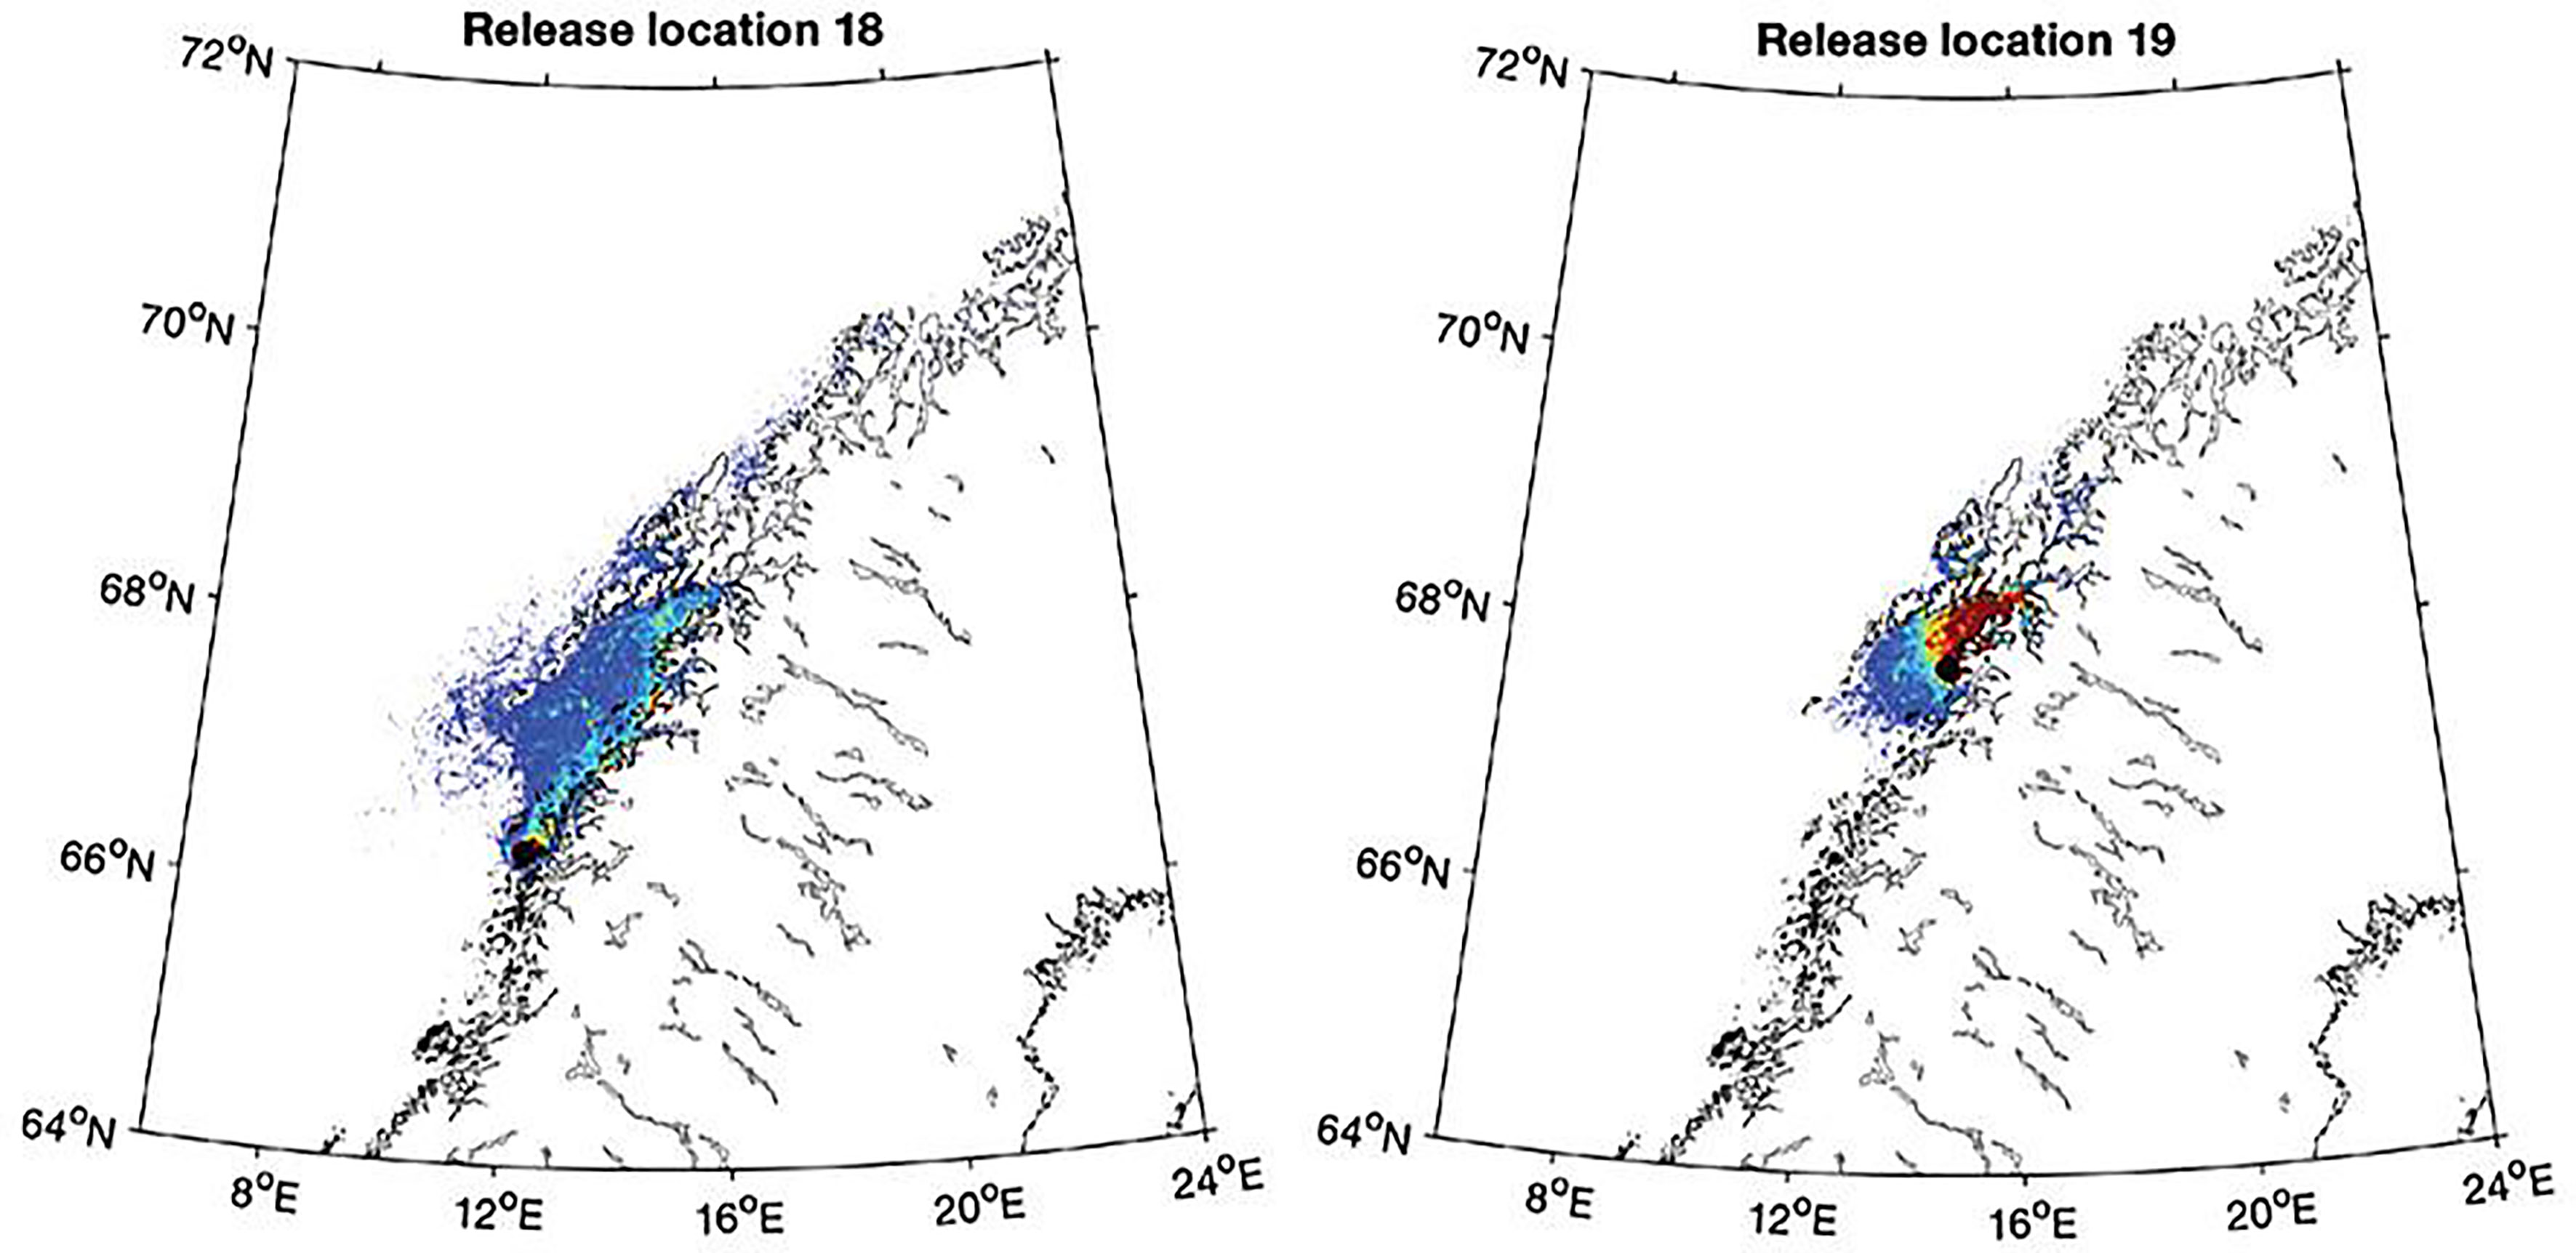
Figure 7 Aggregated particle concentration from release locations south of the Lofoten archipelago area, release locations indicated (locations no 18-19 in Figure 5). Dark blue colour represents low aggregation and red colour high aggregation.
The main simulation of particle spreading was done using a standard depth of 5 m. To investigate the potential for dispersal into a large fjord more detailed simulations was carried out for Hardangerfjord, with more simulation depths. The results showed that using a simulation depth of 5 m for releasing particles resulted in a relatively small dispersal of particles further into the fjord, while particle release at 20 m resulted in considerable dispersal inside the fjord (Figure 8). Measurements of the local current pattern in the fjord showed relatively slow currents (mean rate < 0.05 m s-1) with an outward directed current above 5 m depth, and an inward directed current below, with a peak at 10 m depth (Supplementary Figure 2).
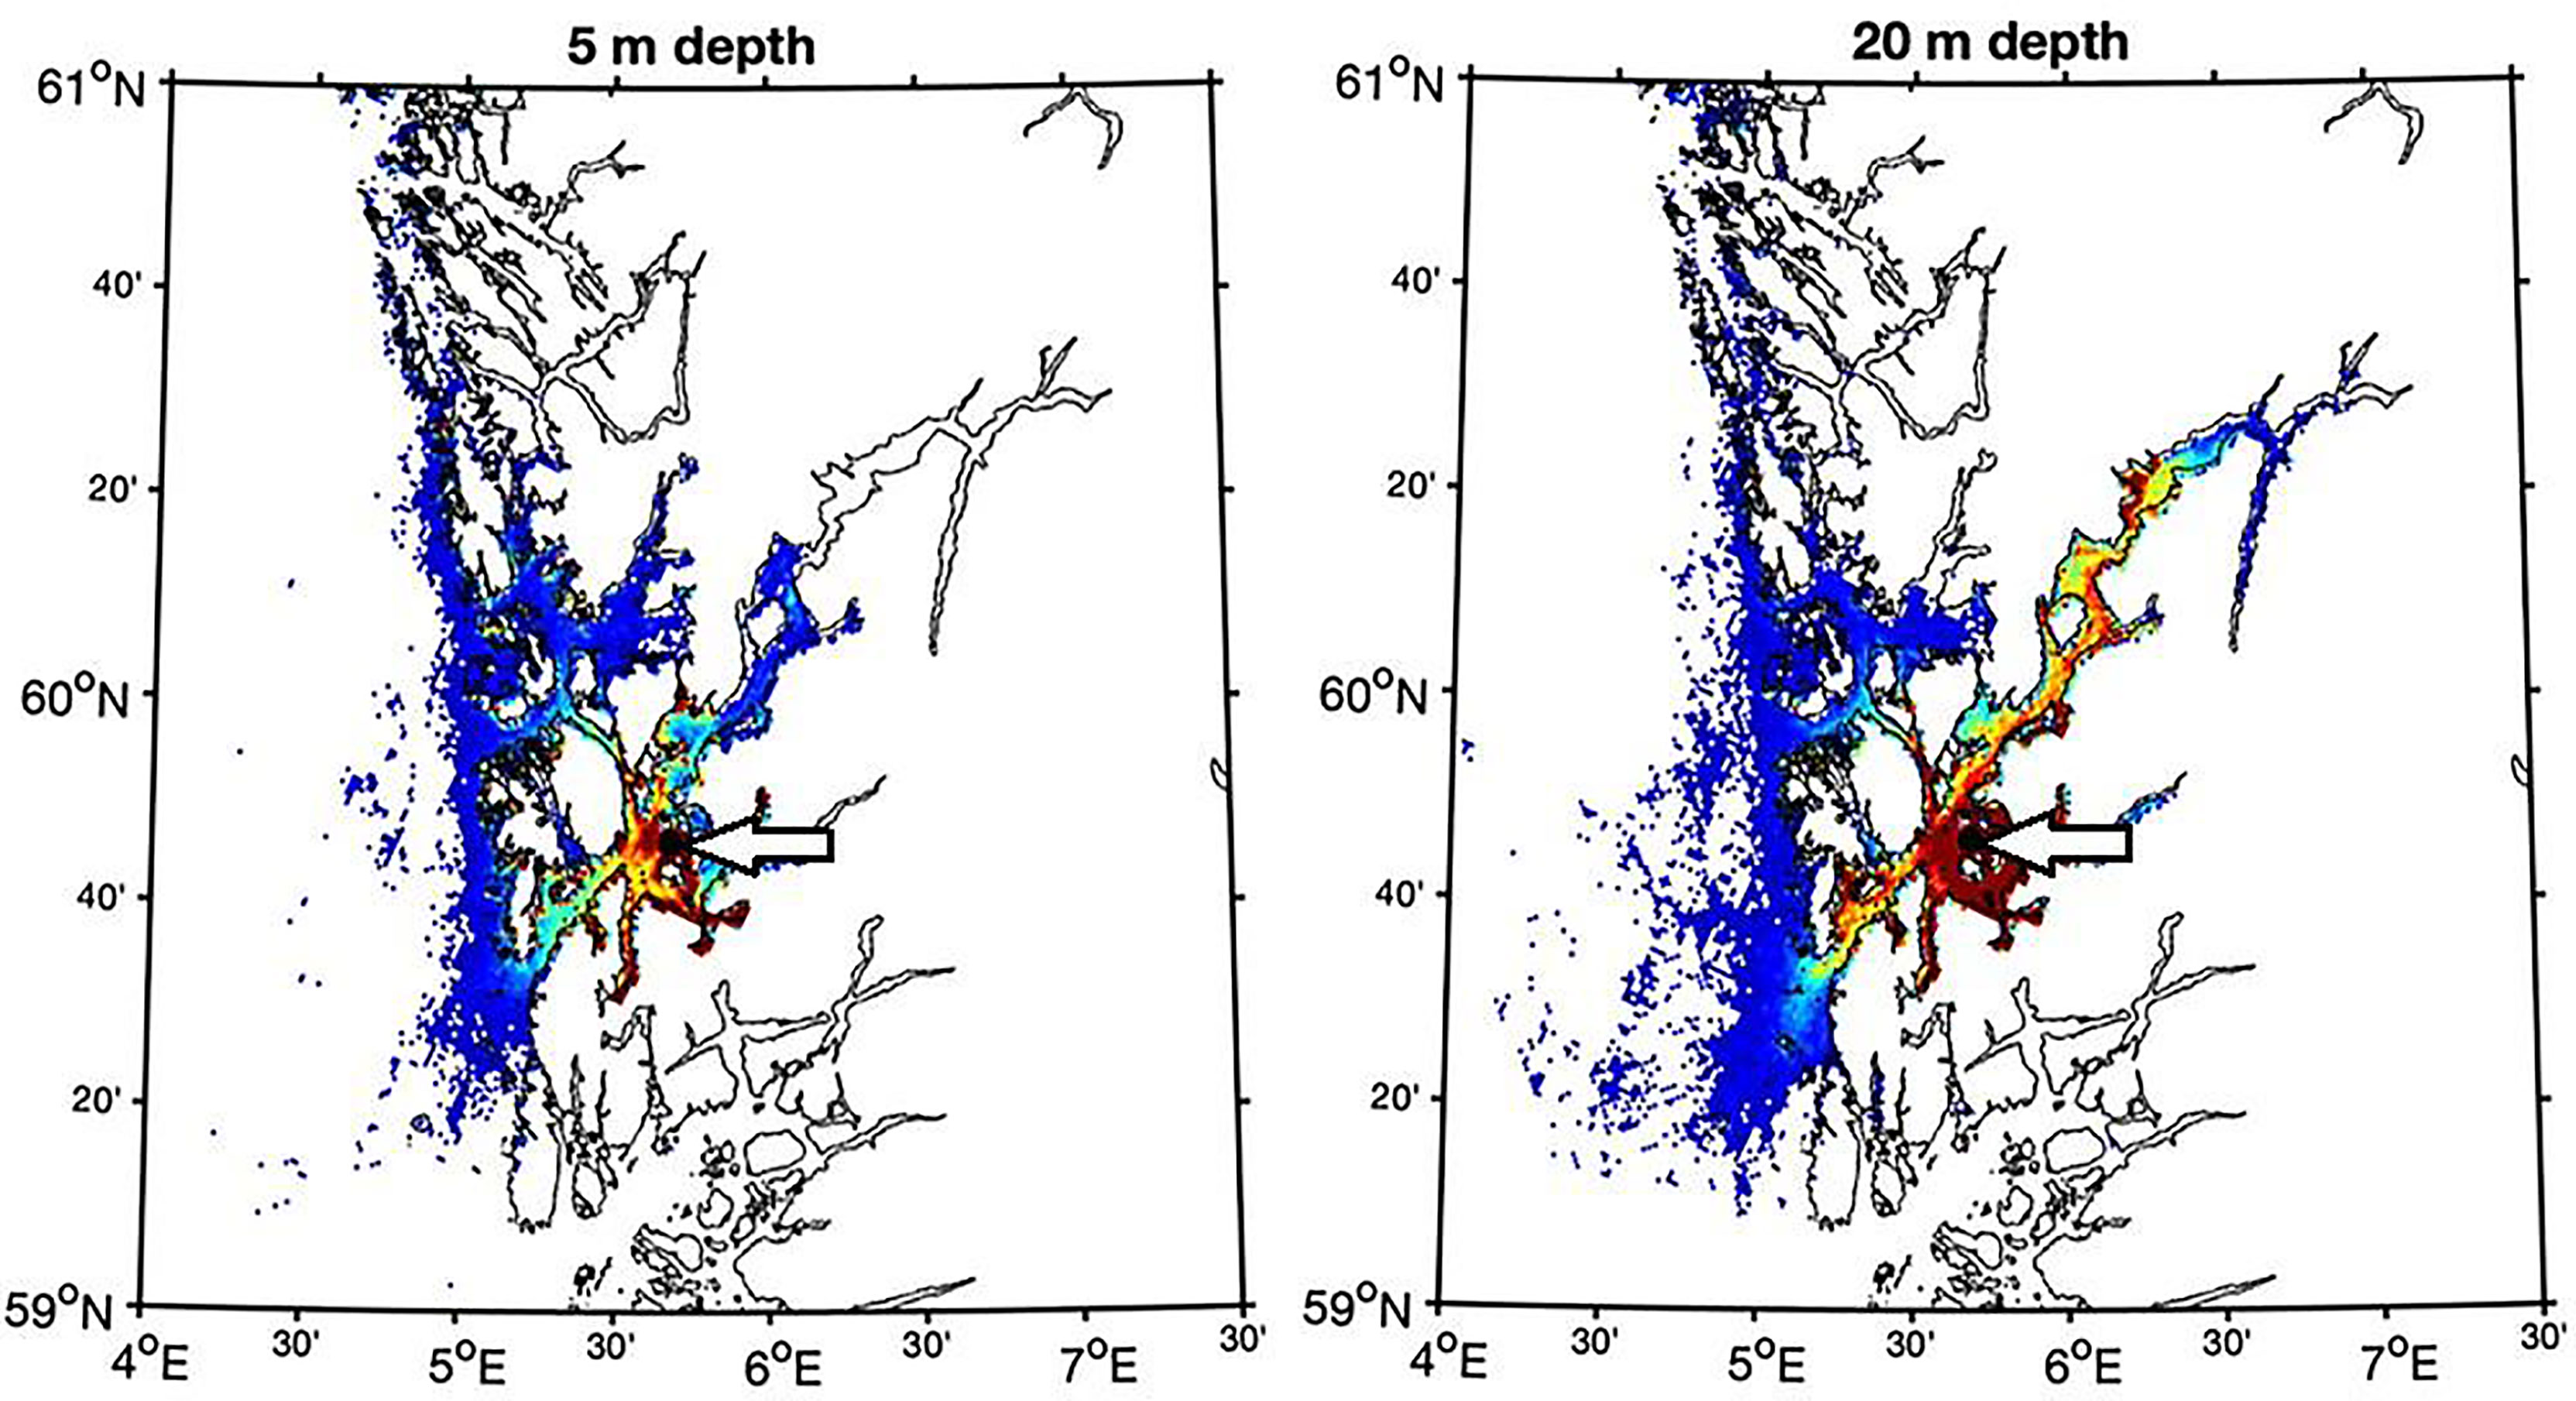
Figure 8 Aggregated particle concentration for particles released in the outer part of the Hardangerfjord (St. HA5, location indicated by arrow) for drift at 5 m (left) and 20 m (right) depths. Dark blue colour represents low aggregation and red colour high aggregation.
Discussion
Genetic Diversity and Structure
The results of the present study suggest high genetic connectivity of Saccharina latissima populations along the coast from the outer part of Oslofjord to Mid-Norway. The genetic diversity (measured as standardized allelic richness and HE) was relatively uniform between all stations and did not display a trend along the coast. Four genetic clusters were identified in the present study, but results from STRUCTURE analyses and PCoA suggested strong mixing and little genetic differentiation in coastal populations south of the Lofoten archipelago. The relatively uniform genetic structure along a stretch of approximately 1000 km from the outer part of Oslofjord to Mid-Norway contrasts with results of some earlier studies of S. latissima using microsatellite markers, displaying genetic structuring over shorter distances (e.g., Breton et al., 2018; Mooney et al., 2018). Both these studies concluded that the degree of connectivity was influenced by hydrodynamic conditions. Breton et al. (2018) found that a strong genetic differentiation between two nearby stations could be attributed to the main current being deflected offshore, while Mooney et al. (2018) observed that stochastic and strong local currents led to a good genetic connection, while open waters and freshwater efflux represented barriers to gene flow. In the present study the results of the dispersal model suggest that the main current will disperse kelp spores in a mainly unidirectional way and with a relatively high rate along the coast. Except for in the fjords, where local hydrodynamics determine the current pattern, this is likely to promote a continuous western (in South-Norway) and northward (in Southwestern and Mid-Norway) dispersal which may explain the finding of a good genetic connection of S. latissima along the coast (see discussion in 4.2). The results of the present study thus support that there can be a strong influence of the main current pattern on the population structure of kelps, as has been shown in a number of studies earlier (e.g. Alberto et al., 2011; Coleman et al., 2011). A lack of connection between currents and population structure may on the other hand be caused by a strongly fragmented habitat availability (e.g. Durrant et al., 2018), strong adaptive selection, or simply that strong or unidirectional currents are lacking. The population sizes of kelps will also be important for dispersal distance and genetic connectivity since dispersal is strongly dependent on spore production (Graham, 2003).
The results of the present study are somewhat in contrast to those of Evankow et al. (2019), where a clear genetic differentiation into two pronounced clusters on the coast of South-Norway was found. However, except for the innermost station in Skagerrak some genetic admixture at the stations in South-Norway was also found by Evankow et al. (2019). It could also be noted that the study of Evankow et al. (2019) was more limited compared to the present study, in including 7 stations along the coast of Norway, and between 4 and 22 samples per station. In addition, different microsatellites were used in the two studies, which could have had some significance for the somewhat deviating results. The present study applied genomic-derived microsatellites developed by Paulino et al. (2016), while those used by Evankow et al. (2019) were EST-derived. Genomic- and EST-derived microsatellites were for example compared in a study of barley by Chabane et al. (2005), and the results showed that the EST-derived microsatellites separated better between wild and cultivated barley than the genomic-derived did. The development of new markers will probably highlight differences in genetic structure and impact of selection in a clearer way in the future.
While the results of the present study show a relatively uniform genetic structure of S. latissima along the coast of South and Southwest Norway, the samples north of Lofoten clearly differed from those further south, by having a dominance of one genetic cluster. This was also supported by the AMOVA analysis. This is in accordance with Evankow et al. (2019), who found a distinct northern genetic cluster of a S. latissima population in North-Norway and Svalbard. Also, the results of the present study show a clear isolation by distance (IBD) relationship when comparing the genetic distance (FST/(1-FST)) of stations situated on the coast, suggesting that some genetic differentiation develops gradually along the coast of South and Southwest Norway, despite little genetic structure.
Simulation of Spore Dispersal
The relatively uniform genetic diversity and little genetic differentiation of S. latissima along the South and Southwestern Norwegian coast could be an effect of rapid spore dispersal caused by the Norwegian Coastal current. The current flows in a mainly northwards direction with an average speed of around 0.3 m s-1 (Haugan et al., 1991). However, the speed is very variable and may be as high as 1 m s-1 (Sætre, 2007), suggesting that a rapid transport of spores could take place along the coast. The simulation results include all relevant current dynamics in the fjords and along the coast with the high grid resolution of 800 m. Thus, the Norwegian Coastal Current, local fjord currents and the exchange between the fjords and the coastal ocean are all processes being included in a realistic way (Asplin et al., 2020). South of the Lofoten archipelago the Norwegian Coastal Current takes a sharp westerly turn, leading the main part of the current past the west side of the archipelago (Sætre, 2007). The results from the particle simulation model suggested that particles released south of the Lofoten archipelago will to a high degree accumulate here, and only slowly spread north of it. Since it is expected that, to a large extent, the particle spreading model simulates the direction and degree of spore dispersal, the results suggest that the Lofoten archipelago acts as a partial barrier for spore dispersal northwards. This may in turn explain a differentiation in genetic structure between populations north of the Lofoten archipelago and in South-Norway.
A separate simulation of spore spreading into Hardangerfjord at different depths was carried out. While S. latissima is mainly found above 5 m in the intermediate and innermost part of Hardangerfjord, due to sea urchin grazing below (Husa et al., 2014), the results from the particle spreading simulation suggested spore dispersal into the fjord mainly below 10 m depth. In addition, the mean current flow was relatively slow (mean current less than 0.05 m s-1 inside the fjord), suggesting a relatively limited transport of spores into the fjord. A high mortality of S. latissima settling below 5 m depth, and a more limited dispersal in the fjord and random dispersal to the shallower parts possibly explain the more stochastic genetic clustering seen in the innermost and shallow stations of Hardangerfjord and Sognefjord, as supported by the STRUCTURE and AMOVA analyses. This could suggest less connectivity between coastal and fjord samples than between samples on the coast, as also suggested for example by relatively high FST values between stations inside the fjords (HA2, HA3, HA4 in Hardangerfjord and between SO1 and the other stations of Sognefjord), despite short distances between the stations. Also, the pairwise genetic distance within the fjord stations did not reveal an IBD pattern.
The present study thus suggests a close relationship between spore dispersal and local current patterns, which has also been shown in other studies (e.g., Brennan et al., 2014). However, even though the particle spreading model of the present study can estimate direction and potential rates of spore dispersal and indicate the presence of potential barriers for gene flow, it does not give a realistic estimate of the spore spreading range. The model particles are for example not subjected to mortality, and they are dispersed during the whole simulation period.
Spreading ranges of kelp spores are difficult to estimate since they depend on a high number of biological and physical factors (e.g., Reed et al., 1992; Gaylord et al., 2002; Graham, 2003; Gaylord et al., 2004). Dispersal range is also very dependent on size of the spore source (Gaylord et al., 2004), and large kelp beds will thus produce more spores with a potential longer dispersal range than small populations. A model study by Gaylord et al. (2002) showed a highly skewed pattern of spore dispersal in kelps, where most spores settled near the source and a small fraction spread longer distances. This pattern has been confirmed by small scale field studies (e.g., Fredriksen et al., 1995; Carney et al., 2013). The results of the present model study also suggested that a minor fraction of released spores could be transported a considerably longer distance than the main fraction. However, since there are little data on potential sizes of S. latissima kelp beds in Norway it is difficult to evaluate the significance of this point here. Further, Gaylord et al. (2002) showed through model simulations that high current speed and wave-induced turbulence resulted in a high spreading range of kelp spores, with 60% of released kelp spores dispersing more than 1 km away from the source with a current rate of 0.5 m s-1. An uncertain point in their model was the bottom encounter of spores, which in the model was irreversible. Spores in nature may however possibly be resuspended after a first bottom encounter, which would increase the dispersal range even more. This could support a pattern of high genetic connectivity of populations of S. latissima, as indicated by the results of the present study.
A vital point in the estimation of spore dispersal range is the survival time of spores in the planktonic phase. Laboratory trials by Reed et al. (1992) showed that when kept in suspension, most of the spores of the kelps Macrocystis pyrifera and Petrygophora californica stopped swimming after 48 hours when in darkness but retained their swimming ability for some more days in light. Loss of swimming ability was on the other hand not detrimental for the spores. In conditions with light the kelp spores would germinate in the planktonic phase and settle, even up to 5-6 days after spore release (Reed et al., 1992). High survival of germinating spores and primary cells have also been shown also for S. latissima and Laminaria spp., where spores will germinate in complete darkness and even survive as primary cells and retain some viability for up to 5 months (Lüning, 1980). This suggests that released spores can survive as plankton for many days; first as spores, thereafter as primary cells, and depending on the environmental conditions also as germinating gametophytes. However, germinating and dividing gametophytes will probably sink more rapidly out of the planktonic phase than the spores and primary cells. On the coast of Norway Saccharina latissima releases the main part of spores during late autumn and winter in conditions with short days and low light, which may result in a delay of the germination of the primary cells in the planktonic phase. For example, when studying development of meiospores in situ of S. latissima (as Laminaria saccharina), Hsiao and Druehl (1973) found gametogenesis to be much slower during autumn and early winter than during spring. Spore release during autumn and early winter together with relatively high and unidirectional current rates along the coast, could favour long distance spreading and explain the relatively little genetic structuring of S. latissima found at the coastal stations of south and south-western Norway.
Another aspect of the survival of the gametophytes in low light, or even darkness, is that the development after settlement will be arrested until the conditions allow maturation. This will result in some synchronization of gametes released from gametophytes of differential age. The period of spore release in S. latissima lasts several months along the coast of Norway, and a synchronized germination of gametophytes of differential ages will be favorable for reproduction, since male and female kelp gametophytes must release gametes in close proximity to each other to ensure fertilization (Reed, 1990).
Genetic Connectivity and Adaptation
The results suggest that there is little genetic structure and connectivity between sample sites of S. latissima in the Skagerrak area. However, including one locus potentially under positive selection had a clear effect of genetic structure in this region, suggesting that local adaptation may be taking place. Gene flow has traditionally been considered as disruptive for local adaptation, except in populations with genes under rapid selection. However, recent studies show many examples of adaptation with gene flow, and local adaptation being maintained even under relatively strong rates of gene flow (Tigano and Friesen, 2016).
In a study of S. latissima along the North Sea–Baltic Sea transition zone, Nielsen et al. (2016) found that reduced salinity had a strong impact on population structure and genetic diversity, and that brackish populations had a distinct genetic structure and lower allelic richness compared to the more saline populations further north. They suggested that local adaptation of S. latissima was probably taking place concurrent with a reduced connectivity between populations. However, in this area currents coming from west and south will merge to a northbound current along the Swedish northwest coast (Svansson, 1972), probably providing a northward transport of genes favourable for such local adaptation in S. latissima. In addition to affecting the population structure in the Skagerrak area, including the locus potentially under positive selection also impacted population structure in some of the fjord populations, especially the innermost station in Sognefjorden (SO1). Both in the outer part of Oslofjord and at the stations inside the two fjords S. latissima will be exposed to long periods with low salinity, suggesting that the locus in question may be associated with adaptation to low salinity or salinity stress. For example, in the outer part of Oslofjord the salinity was 15-20 ppt in the upper part of the water column during spring/summer when measured during two successive years, and as low as 10-15 ppt in the surface layer (Frigstad et al., 2020). Markers for adaptation to reduced salinity or salinity stress have earlier been established in Fucus serratus (Coyer et al., 2011) and F. vesiculosus (Kinnby et al., 2020).
The stations north of Lofoten displayed a pronounced genetic cluster. Formation of this northern cluster may have been favoured by reduced connectivity across the Lofoten archipelago, but it is also likely that the northernmost populations are adapted to more Arctic conditions. Guzinski et al. (2020) found a significantly higher genetic diversity and many private alleles of northern populations of S. latissima, and they speculated weather this could be a signature of an Arctic refugia during the Last Glaciation Maximum.
Implications for Farming of Saccharina latissima
Kelps are among the most relevant species for seaweed cultivation in North America and Europe (Kerrison et al., 2015), and East Asia (Hu et al., 2021). One of the most promising kelp species for cultivation in the North-Atlantic is Saccharina latissima. The last decade has seen an increased interest in cultivation of S. latissima in Norway, where favourable conditions for farming of sugar kelp are found along most parts of the coast (Forbord et al., 2020). The number of licenses for commercial cultivation of S. latissima in Norway has increased from 12 in 2014 to 113 in 2021 (data from The Directorate of Fisheries, https://www.fiskeridir.no/English/Aquaculture/Statistics/Algae, accessed 2 February 2022), suggesting that sugar kelp farming will increase in volume in the future. With several stressors already causing reductions of the S. latissima vegetation along the Norwegian coast, the present development of sea farming of S. latissima in Norway give some cause for concern. In an evaluation by Campbell et al. (2019), the release of reproductive material from farmed seaweed is listed as one of the greatest concerns in developing a European seaweed farming industry. Even with precautions taken by the farmers, there is an unidentified risk that “crop-to-wild” gene flow may occur and cause genetic alterations and depression of natural populations (Valero et al., 2017).
Normally the crop is harvested before the kelps start to develop sori with sporangia, but it has been estimated that up to 13% of the biomass is lost from the farm prior to harvesting (Norderhaug et al., 2021). This, in addition to that part of a crop can be left unharvested leaving time for the cultivated kelps to develop sori and spores, means that there is a certain risk of crossings taking place between the cultured crop and the wild population. This raises the question of what the consequences could potentially be if the farmed kelp originates from another region than the farming location.
The genetic exchange between cultivated and wild seaweed populations has not been well studied. A recent review on kelp aquaculture in China sum up impact of cultivation on population structure of kelps, and shows that especially farmed Saccharina japonica, which originally was introduced to China from Japan for farming, shows strong differentiation from wild S. japonica from Japan and Russia (Hu et al., 2021). In a study comparing gene flow of S. japonica between kelp farms and wild populations, which originally had become established from earlier cultivation, Shan et al. (2019) found that gene flow out of the cultivated populations to the wild populations was very small, while gene flow in the opposite direction was more prominent. This may be explained by settlement of zoospores from wild populations on the cultivation ropes, whereafter gametes from the resulting gametophytes may have crossed with remaining gametophytes from the cultivars (Shan et al., 2019). Still, possible unwanted or harmful gene transfer from cultivated to wild populations of S. latissima in Norway in the future will most likely depend on the genetic composition of the cultivated kelp, and also the amount of cultivated S. latissima along the coast.
Given that there seems to be a relatively rapid and mainly unidirectional dispersal along the coast of South and Southwestern Norway, it seems unlikely that relocating kelp minor distances upstream or downstream of the coastal current in this region will be detrimental for the wild populations of S. latissima. However, the results of the present study are based only on a few microsatellites, which is not sufficient to fully evaluate effects of a potential gene transfer. More detailed studies of S. latissima spanning from Iberia to Svalbard using SNPs have shown a large number of SNPs and microsatellites associated to environmental variables, possibly promoting local adaptation of populations (Guzinski et al., 2020), and this also can also be the case along the Norwegian coast. As a minimum precaution, the occurrence of a northern genetic cluster associated with Arctic conditions makes a transfer of genetic material across the Lofoten archipelago for cultivation purposes not advisable. Likewise, it would not seem advisable to exchange genetic material of S. latissima from the Southwest coast of Norway and the Skagerrak area, or in or out of enclosed fjords since populations here may be under adaptation to specific environmental conditions.
In conclusion, since little is known on how local adaptation takes place and is maintained, caution with transference of genetic material is advisable to prevent valuable local genetic diversity from eroding (Thomson et al., 2021). In addition, for most cultured species, breeding programmes are inevitably developed (see Goecke et al., 2020; Brakel et al., 2021), and this will most likely also be the case for the future North-Atlantic cultivation of S. latissima. Deploying cultivars from a rapid breeding process may result in a massive spread of the selected alleles, potentially leading to genetic erosion of native populations (Valero et al., 2017). Thus, it is important to not only take the present situation into consideration, but also consider potential future perspectives of S. latissima aquaculture, when evaluating the potential harmful genetic impact cultivation may have on wild populations.
Data Availability Statement
The original contributions presented in the study are included in the article/Supplementary Materials. Further inquiries can be directed to the corresponding author.
Author Contributions
PR did the main part of the final statistical analyses, interpreted these and participated in the writing of the manuscript, TN contributed significantly to sampling, analyses of samples and statistical analysis, and participated in the writing, GD did the fragment analyses, some of the statistical analyses, and contributed to the interpretation of the results and the writing, LA ran the simulation model, interpreted the results and provided text in the manuscript, KM contributed significantly to trouble shooting in the lab and sample analyses, SF provided samples and participated in writing, KS had the original idea, provided samples, and drafted the manuscript. All authors contributed to the article and approved the submitted version.
Funding
This work was funded by the Research Council of Norway, project no. 254883 (MacroSea).
Conflict of Interest
The authors declare that the research was conducted in the absence of any commercial or financial relationships that could be construed as a potential conflict of interest.
Publisher’s Note
All claims expressed in this article are solely those of the authors and do not necessarily represent those of their affiliated organizations, or those of the publisher, the editors and the reviewers. Any product that may be evaluated in this article, or claim that may be made by its manufacturer, is not guaranteed or endorsed by the publisher.
Acknowledgments
We are grateful to PV Dalen, L Neves, and Norway Seaweed Ltd. for providing samples to the project, and to the crew of MS Hans Brattström for help with sampling. We would also like to thank Alexander Thompson for comments and two anonymous referees for suggestions to the manuscript. The study was part of TN’s master work at the University of Bergen.
Supplementary Material
The Supplementary Material for this article can be found online at: https://www.frontiersin.org/articles/10.3389/fmars.2022.876420/full#supplementary-material
References
Abretsen J., Sperrevik A. K., Staalstrøm A., Sandvik A. D., Vikebø F., Asplin L. (2011). NorKyst-800 Report No. 1: User Manual and Technical Descriptions. Fisken og Havet 2/2011, 51 pp.
Alberto F., Raimondi P. T., Reed D. C., Watson J. R., Siegel D. A., Mitarai S., et al. (2011). Isolation by Oceanographic Distance Explains Genetic Structure for Macrocystis Pyrifera in the Santa Barbara Channel. Mol. Ecol. 20, 2543–2554. doi: 10.1111/j.1365-294X.2011.05117.x
Antão T., Lopes A., Lopes R. J., Beja-Pereira A., Luikart G. (2008). LOSITAN: A Workbench to Detect Molecular Adaptation Based on a Fst -Outlier Method. BMC Bioinf. 9, 323. doi: 10.1186/1471-2105-9-323
Armitage C. S., Husa V., Petelenz-Kurdziel E. A., Sjøtun K. (2017). Growth and Competition in a Warmer Ocean: A Field Experiment With a non-Native and Two Native Habitat Building Seaweeds. Mar. Ecol. Prog. Ser. 573, 85–99. doi: 10.3354/meps12161
Asplin L., Albretsen J., Johnsen J. A., Sandvik A. D. (2020). The Hydrographic Foundation for Salmon Lice Dispersion Along the Norwegian Coast. Ocean Dynamics 70, 1151–1167. doi: 10.1007/s10236-020-01378-0
Asplin L., Johnsen I. A., Sandvik A. D., Albretsen J., Sundfjord V., Aure J., et al. (2014). Dispersion of Salmon Lice in the Hardangerfjord. Mar. Biol. Res. 10, 216–225. doi: 10.1080/17451000.2013.810755
Billot C., Engel C. R., Rousvoal S., Kloareg B., Valero M. (2003). Current Patterns, Habitat Discontinuities and Population Genetic Structure: The Case of the Kelp Laminaria digitata in the English Channel. Mar. Ecol. Prog. Ser. 253, 111–121. doi: 10.3354/meps253111
Brakel J., Sibonga R. C., Dumilag R. V., Montalescot V., Campbell I., Cottier-Cook E.J., et al. (2021). Exploring, Harnessing and Conserving Marine Genetic Resources Towards a Sustainable Seaweed Aquaculture. Plants People Planet 3, 337–349. doi: 10.1002/ppp3.10190
Brennan G., Kregting L., Beatty G. E., Cole C., Elsäßer B., Savidge G., et al. (2014). Understanding Macroalgal Dispersal in a Complex Hydrodynamic Environment: A Combined Population Genetic and Physical Modelling Approach. J. R. Soc. Interf. 11, 20140197. doi: 10.1098/rsif.2014.0197
Breton T. S., Nettleton J. C., O’Connell B., Bertocci M. (2018). Fine-Scale Population Genetic Structure of Sugar Kelp, Saccharina Atissimi (Laminariales, Phaeophyceae), in Eastern Maine, USA. Phycologia 57, 32–40. doi: 10.2216/17-72.1
Campbell I., Macleod A., Sahlmann C., Neves L., Funderud J., Øverland M., et al. (2019). The Environmental Risks Associated With the Development of Seaweed Farming in Europe - Prioritizing Key Knowledge Gaps. Front. Mar. Sci. 6, 107. doi: 10.3389/fmars.2019.00107
Camus C., Faugeorn S., Buschmann A. H. (2018). Assessment of Genetic and Phenotypic Diversity of the Giant Kelp, Macrocystis Pyrifera, to Support Breeding Programs. Algal Res. 30, 101–112. doi: 10.1016/j.algal.2018.01.004
Carney L. T., Bohonak A. J., Edwards M. S., Alberto F. (2013). Genetic and Experimental Evidence for a Mixed-Age, Mixed-Origin Bank of Kelp Microscopic Stages in Southern California. Ecology 94, 1955–1965. doi: 10.1890/13-0250.1
Chabane K., Ablett G. A., Cordeiro G. M., Valkoun J., Henry R. J. (2005). EST Versus Genomic Derived Microsatellite Markers for Genotyping Wild and Cultivated Barley. Genet. Resour. Crop Evol. 52, 903–909. doi: 10.1007/s10722-003-6112-7
Christie H., Andersen G. S., Bekkby T., Fagerli C. W., Gitmark J. K., Gundersen H., et al. (2019). Shifts Between Sugar Kelp and Turf Algae in Norway: Regime Shifts or Fluctuations Between Different Opportunistic Seaweed Species? Front. Mar. Sci. 6, 72. doi: 10.3389/fmars.2019.00072
Coleman M. A., Roughan M., Macdonald H. S., Connell S. D., Gillanders B. M., Kelaher B. P., et al. (2011). Variation in the Strength of Continental Boundary Currents Determines Continent-Wide Connectivity in Kelp. J. Ecol. 99, 1026–1032. doi: 10.1111/j.1365-2745.2011.01822.x
Coyer J.A., Hoarau G., Pearson G., Mota C., Jüterbock A., Alpermann T., et al. (2011). Genomic Scans Detect Signatures of Selection Along a Salinity Gradient in Populations of the Intertidal Seaweed Fucus Serratus on a 12 Km Scale. Mar. Genomics 4, 41–49.
Durrant H. M. S., Barrett N. S., Edgar G. J., Coleman M. A., Burridge C. P. (2018). Seascape Habitat Patchiness and Hydrodynamics Explain Genetic Structuring of Kelp Populations. Mar. Ecol. Prog. Ser. 587, 81–92. doi: 10.3354/meps12447
Evankow A., Christie H., Hancke K., Brysting A. K., Junge C., Fredriksen S., et al. (2019). Genetic Heterogeneity of Two Bioeconomically Important Kelp Species Along the Norwegian Coast. Conserv. Genet. 20, 615–28. doi: 10.1007/s10592-019-01162-8
Evanno G., Regnaut S., Goudet J. (2005). Detecting the Number of Clusters of Individuals Using the Software STRUCTURE: A Simulation Study. Mol. Ecol. 14, 2611–2620. doi: 10.1111/j.1365-294X.2005.02553.x
Excoffier L., Lischer H. E. L. (2010). Arlequin Suite Ver 3.5: A New Series of Programs to Perform Population Genetics Analyses Under Linux and Windows. Mol. Ecol. Resour. 10, 564–567. doi: 10.1111/j.1755-0998.2010.02847.x
Fagerli C. W., Stadniczeñko S. G., Pedersen M. F., Christie H., Fredriksen S., Norderhaug K. M. (2015). Population Dynamics of Strongylocentrotus Droebachiensis in Kelp Forests and Barren Grounds in Norway. Mar. Biol. 162, 1215–1226. doi: 10.1007/s00227-015-2663-3
Filbee-Dexter K., Wernberg T., Grace S. P., Thormar J., Fredriksen S., Narvaez C. N., et al. (2020). Marine Heatwaves and the Collaps of Marginal North Atlantic Kelp Forests. Sci. Rep. 10, 13388. doi: 10.1038/s41598-020-70273-x
Forbord S., Matsson S., Brodahl G. E., Bluhm B. A., Broch O. J., Handå A., et al. (2020). Latitudinal, Seasonal and Depth-Dependent Variation in Growth, Chemical Composition and Biofouling of Cultivated Saccharina Latissima (Phaeophyceae) Along the Norwegian Coast. J. Appl. Phycol 32:2215–32. doi: 10.1007/s10811-020-02038-y
Forbord S., Steinhovden K. B., Rød K. K., Handå A., Skjermo J. (2018). “Cultivation Protocol for Saccharina Latissima”, in Protocols for Macroalgae Research. 1st Edn. Eds. Charrier B., Wichard T., Reddy C. R. K. (Boca Raton, FL; London; New York, NY: CRC Press), 37–59.
Fort A., Guiry M. D., Sulpice R. (2018). Magnetic Beads, a Particularly Effective Novel Method for Extraction of NGS-Ready DNA From Macoalgae. Algal Res. 32, 308–313. doi: 10.1016/j.algal.2018.04.015
Fredriksen S., Sjøtun K., Lein T. E., Rueness J. (1995). Spore Dispersal in Laminaria Hyperborea (Laminariales, Phaeophyceae). Sarsia 80, 47–54. doi: 10.1080/00364827.1995.10413579
Frigstad H., Kaste Ø., Deininger A., Kvalsund K., Christensen G., Bellerby R. G. J., et al. (2020). Influence or Riverine Input on Norwegian Coastal Systems. Front. Marine Sci. 7, 332. doi: 10.3389/fmars.2020.00332
Gaylord B., Reed D. C., Raimondi P. T., Washburn L., McLean S. R. (2002). A Physically Based Model of Macroalgal Spore Dispersal in the Wave and Current-Dominated Nearshore. Ecology 83, 1239–1251. doi: 10.1890/0012-9658(2002)083[1239:APBMOM]2.0.CO;2
Gaylord B., Reed D. C., Washburn L., Raimondi P. T. (2004). Physical–biological Coupling in Spore Dispersal of Kelp Forest Macroalgae. J. Mar. Syst. 49, 19–39. doi: 10.1016/j.jmarsys.2003.05.003
Goecke F., Klemetsdal G., Ergon Å. (2020). Cultivar Development of Kelps for Commercial Cultivation - Past Lessons and Future Prospects. Front. Mar. Sci. 8, 110. doi: 10.3389/fmars.2020.00110
Graham M. H. (2003). Coupling Propagule Output to Supply at the Edge and Interior of a Giant Kelp Forest. Ecology 84, 1250–1264. doi: 10.1890/0012-9658(2003)084[1250:CPOTSA]2.0.CO;2
Gundersen H., Bekkby T. (2013). Sukkertarens Naturlige Utbredelse – Modellering Av Referansetilstand for Norsk Naturindeks. VANN 02 2013 (in Norwegian) 48, 217–22.
Guzinski J., Mauger S., Cock J. M., Valero M. (2016). Characterization of Newly Developed Expressed Sequence Tag-Derived Microsatellite Markers Revealed Low Genetic Diversity Within and Low Connectivity Between European Saccharina Latissima Populations. J. Appl. Phycol 28, 3057–70. doi: 10.1007/s10811-016-0806-7
Guzinski J., Ruggeri P., Ballenghien M., Mauger S., Jacquemin B., Jollivet C., et al. (2020). Seascape Genomics of the Sugar Kelp Saccharina Latissima Along the North Eastern Atlantic Latitudinal Gradient. Genes 11 (12), 1503. doi: 10.3390/genes11121503
Haugan P. M., Evensen G., Johannessen J. A., Johannessen O. M., Pettersson L. H. (1991). Modeled End Observed Mesoscale Circulation and Wave-Current Refraction During the 1988 Norwegian Continental Shelf Experiment. J. Geophysical Res. 96, 10487. doi: 10.1029/91JC00299
Hsiao S. I. C., Druehl L. D. (1973). Environmental Control of Gametogenesis in Laminaria Saccharina. IV. In Situ Development of Gametophytes and Young Sporophytes. J. Phycol. 9, 160–164.
Husa V., Steen H., Sjøtun K. (2014). Historical Changes in Macroalgal Communities in Hardangerfjord (Norway). Marine Biol. Res. 10, 226–240. doi: 10.1080/17451000.2013.810751
Hu Z.-M., Shan T.-F., Zhang J., Zhang Q.-S., Critchley A. T., Choi H.-G., et al. (2021). Kelp Aquaculture in China: A Retrospective and Future Prospects. Rev. Aquaculture 13, 1324–1351. doi: 10.1111/raq.12524
Kerrison P. D., Stanley M. S., Edwards M. D., Black K. D., Hughes A. D. (2015). The Cultivation of European Kelp for Bioenergy: Site and Species Selection. Biomass Bioenergy 80, 229–242. doi: 10.1016/j.biombioe.2015.04.035
Kinlan B. P., Gaines S. D. (2003). Propagule Dispersal in Marine and Terrestrial Environments: A Community Perspective. Ecology 84, 2007–2020. doi: 10.1890/01-0622
Kinnby A., Jonsson P. R., Ortega-Martinez O., Töpel M., Pavia H., Pereyra R. T., et al. (2020). Combining an Ecological Experiment and a Genome Scan Show Idiosyncratic Responses to Salinity Stress in Local Populations of a Seaweed. Front. Mar. Sci. 7, 470. doi: 10.3389/fmars.2020.00470
Li Y. L., Liu J. X. (2018). StructureSelector: A Web-Based Software to Select and Visualize the Optimal Number of Clusters Using Multiple Methods. Mol. Ecol. Resour. 18 (1), 176–177. doi: 10.1111/1755-0998.12719
Lüning K. (1980). Critical Levels of Light and Temperature Regulating the Gametogenesis of Three Laminaria Species (Phaeophyceae). J. Phycol. 16, 1–15. doi: 10.1111/j.1529-8817.1980.tb02992.x
Luttikhuizen P. C., van den Heuvel F. H. M., Rebours C., Witte H. J., van Bleijswijk J. D. L., Timmermans K. (2018). Strong Population Structure But No Equilibrium Yet: Genetic Connectivity and Phylogeography in the Kelp Saccharina Latissima (Laminariales, Phaeophyta). Ecol. Evol. 8, 4265–4277. doi: 10.1002/ece3.3968
Mankettikkara R. (2013). Hydrophysical Characteristics of the Northern Norwegian Coast and Fjords. Thesis for the Degree of Philosophiae Doctor. Faculty of Biosciences, Fisheries and Economics Department of Arctic and Marine Biology (Tromsø, Norway: University of Tromsø).
Mooney K. M., Beatty G. E., Elsäßerc B., Follis E. S., Kregting L., O’Connor N. E., et al. (2018). Hierarchical Structuring of Genetic Variation at Differing Geographic Scales in the Cultivated Sugar Kelp Saccharina Latissima. Marine Environ. Res. 142, 108–115. doi: 10.1016/j.marenvres.2018.09.029
Nei M. (1978). Estimation of Average Heterozygosity and Genetic Distance From a Small Number of Individuals. Genetics 89, 583–90.
Neiva J., Paulino C., Nielsen M. M., Krause-Jensen D., Saunders G. W., Assis J., et al. (2018). Glacial Vicariance Drives Phylogeographic Diversification in the Amphi-Boreal Kelp Saccharina Latissima. Sci. Rep. 8, 1112. doi: 10.1038/s41598-018-19620-7
Nielsen M. M., Paulino C., Neiva J., Krause-Jensen D., Bruhn A., Serrão E. A. (2016). Genetic Diversity of Saccharina Latissima (Phaeophyceae) Along a Salinity Gradient in the North Sea-Baltic Sea Transition Zone. J. Phycol. 52, 523–531. doi: 10.1111/jpy.12428
Norderhaug K. M., Christie H. C. (2009). Sea Urchin Grazing and Kelp Re-Vegetation in the NE Atlantic. Mar. Biol. Res. 5, 515–528. doi: 10.1080/17451000902932985
Norderhaug K. M., Hansen P. K., Fredriksen S., Grøsvik B. E., Naustvoll L.-J., Steen H., et al. (2021). Miljøpåvirkning Fra Dyrking Av Makroalger. Risikovurdering for Norske Farvann (Institute of Marine Research, Norway: Rapport fra havforskningen), 2021–2024. ISSN:1893-4536 (in Norwegian).
Paulino C., Neiva J., Coelho N. C., Aires T., Marbà N., Krause-Jensen D., et al. (2016). Characterization of 12 Polymorphic Microsatellite Markers in the Sugar Kelp Saccharina Latissima. J. Appl. Phycol 28, 3071–74. doi: 10.1007/s10811-016-0811-x
Peakall R., Smouse P. E. (2012). GenALEx V6.5: Genetic Analysis in Excel. Population Genetic Software for Teaching and Research-an Update. Bioinformatics 28, 2537–2539. doi: 10.1093/bioinformatics/bts460
Petit R. J., Mousadik A. E. I., Pons O. (1998). Identifying Populations for Conservation on the Basis of Genetic Markers. Conserv. Biol. 12, 844–855. doi: 10.1046/j.1523-1739.1998.96489.x
Pritchard J. K., Stephens M., Donnelly P. (2000). Inference of Population Structure Using Multilocus Genotype Data. Genetics 155, 945–959. doi: 10.1093/genetics/155.2.945
Reed D. C. (1990). The Effects of Variable Settlement and Early Competition on Patterns of Kelp Recruitment. Ecology 71, 776–787. doi: 10.2307/1940329
Reed D. C., Amsler C. D., Ebeling A. W. (1992). Dispersal in Kelps: Factors Affecting Spore Swimming and Competency. Ecology 73, 1577–1585. doi: 10.2307/1940011
Rice W. R. (1989). Analyzing Tables of Statistical Tests. Evolution 43, 223–225. doi: 10.1111/j.1558-5646.1989.tb04220.x
Rustad D. (1978). Hydrographical Observations From Sognefjorden (Western Norway) Vol. 30 (Gunneria), 1–59.
Sætre R. (2007). The Norwegian Ccoastal Current – Oceanography and Climate (Trondheim, Norway: Tapir Academic Press).
Selkoe K. A., D’Aloia C. C., Crandall E. D., Iacchei M., Liggins L., Puritz J. B., et al. (2016). A Decade of Seascape Genetics: Contributions to Basic and Applied Marine Connectivity. Mar. Ecol. Prog. Ser. 554, 1–19. doi: 10.3354/meps11792
Shan T., Li Q., Wang X., Su L., Pang S. (2019). Assessment of the Genetic Connectivity Between Farmed Populations on a Typical Kelp Farm and Adjacent Spontaneous Populations of Saccharina Japonica (Phaeophyceae, Laminariales) in China. Front. Mar. Sci. 6, 494. doi: 10.3389/fmars.2019.00494
Sivertsen K. (1997). Geographic and Environmental Factors Affecting the Distribution of Kelp Beds and Barren Grounds and Changes in Biota Associated With Kelp Reduction at Sites Along the Norwegian Coast. Can. J. Fish. Aquat. Sci. 54, 2872–2887. doi: 10.1139/f97-186
Sjøtun K., Husa V., Asplin L., Sandvik A. D. (2015). Climatic and Environmental Factors Influencing Occurrence and Distribution of Macroalgae – a Fjord Gradient Revisited. Marine Ecol. – Prog. Ser. 532, 73–88. doi: 10.3354/meps11341
Svansson A. (1972). Canal Models of Sea Level and Salinity Variations in the Baltic and Adjacent Waters Fishery Board of Sweden, (Series hydrography, Report No 26), 72 pp.
Thomson A., Archer F. L., Coleman M. A., Gajardo G., Goodall-Copestake W. P., Hoban S., et al. (2021). Charting a Course for Genetic Diversity in the UN Decade of Ocean Science. Evol. Appl. 14, 1497–1518. doi: 10.1111/eva.13224
Tigano A., Friesen V. L. (2016). Genomics of Local Adaptation With Gene Flow. Mol. Ecol. 25, 2144–2164. doi: 10.1111/mec.13606
Valero M., Guillemin M.-L., Destombe C., Jacquemin B., Gachon C. M. M., Badis Y., et al. (2017). Perspectives on Domestication Research for Sustainable Seaweed Aquaculture. Perspect. Phycol. 4, 33–46. doi: 10.1127/pip/2017/0066
Van Oosterhout C., Hutchinson W. F., Wills D. P. M., Shipley P. (2004). MICRO-CHECKER: Software for Identifying and Correcting Genotyping Errors in Microsatellite Data. Mol. Ecol. 4, 535–538. doi: 10.1111/j.1471-8286.2004.00684.x
Keywords: Saccharina latissima, population genetics, connectivity, isolation by distance, current pattern
Citation: Ribeiro PA, Næss T, Dahle G, Asplin L, Meland K, Fredriksen S and Sjøtun K (2022) Going With the Flow – Population Genetics of the Kelp Saccharina latissima (Phaeophyceae, Laminariales). Front. Mar. Sci. 9:876420. doi: 10.3389/fmars.2022.876420
Received: 15 February 2022; Accepted: 19 April 2022;
Published: 19 May 2022.
Edited by:
Sophie von der Heyden, Stellenbosch University, South AfricaReviewed by:
Zi-Min Hu, Yantai University, ChinaAlejandro H. Buschmann, University of Los Lagos, Chile
Copyright © 2022 Ribeiro, Næss, Dahle, Asplin, Meland, Fredriksen and Sjøtun. This is an open-access article distributed under the terms of the Creative Commons Attribution License (CC BY). The use, distribution or reproduction in other forums is permitted, provided the original author(s) and the copyright owner(s) are credited and that the original publication in this journal is cited, in accordance with accepted academic practice. No use, distribution or reproduction is permitted which does not comply with these terms.
*Correspondence: Kjersti Sjøtun, a2plcnN0aS5zam90dW5AdWliLm5v