 Marco Scotti
 Silvia Opitz
 Liam MacNeil
 Axel Kreutle
 Christian Pusch3
 Rainer Froese
- 1GEOMAR Helmholtz Centre for Ocean Research Kiel, Kiel, Germany
- 2Institute of Biosciences and Bioresources, National Research Council of Italy, Sesto Fiorentino, Italy
- 3Bundesamt für Naturschutz BfN, Insel Vilm, Germany
Legal requirement in Europe asks for Ecosystem-Based Fisheries Management (EBFM) in European seas, including consideration of trophic interactions and minimization of negative impacts of fishing on food webs and ecosystem functioning. This study presents the first mass-balanced ecosystem model focused on the western Baltic Sea (WBS). Results show that heavy fishing pressure exerted on the WBS has forced top predators such as harbour porpoise and cod to cover their dietary needs by shifting from forage fish to other prey or find food outside of the model area. The model was then developed to explore the dynamics of four future fishery scenarios: (1) business as usual (BAU), (2) maximum sustainable fishing (F = FMSY), (3) half of FMSY, and (4) EBFM with F = 0.5 FMSY for forage fish and F = 0.8 FMSY for other fish. Simulations show that BAU would perpetuate low catches from depleted stocks with a high risk of extinction for harbour porpoise. In contrast, the EBFM scenario would allow the recovery of harbour porpoise, forage fish and cod with increases in catch of herring and cod. EBFM promotes ecosystem resilience to eutrophication and ocean warming, and through the rebuilding of commercial stocks increases by more than three times carbon sequestration compared to BAU. The model provides an interrelated assessment of trophic guilds in the WBS, as required by European law to assess whether European seas are in good environmental status.
1 Introduction
Overfishing belongs to the strongest negative anthropogenic interventions on marine ecosystems (Jones, 1992; Hall et al., 2000; Kaiser et al., 2006). In northern Europe, this is particularly true for the Baltic Sea, where all major species such as cod and herring have been heavily overfished for decades. Beyond depleting target species, overfishing exerts significant negative impacts on the marine ecosystem and its components (Gilles et al., 2005; Frederiksen et al., 2006; Herr, 2009; Thiel et al., 2013; Andreasen et al., 2017) and the erosion of fish stocks alters ocean biogeochemistry: by the 1990s, the global reduction of fish biomass caused by fisheries almost halved biomass cycling rates (Bianchi et al., 2021). Impacts of fisheries diffuse through the whole food web thus modifying carbon, nutrient and oxygen cycles (Getzlaff and Oschlies, 2017). The Common Fisheries Policy (CFP, 2013) of the European Union (EU) demands an end of overfishing. The Marine Strategy Framework Directive (MSFD, 2008; MSFD, 2017a; MSFD, 2017b) of the EU calls for an ensemble of criteria requiring: (1) the preservation of biological diversity with species abundance or demographic characteristics not altered by anthropogenic pressures, (2) a healthy size and age structure of exploited stocks, and (3) marine food webs with species composition, diversity, balance and productivity not affected by stress factors of anthropogenic origin. This study determines the current state of the western Baltic Sea (WBS) ecosystem and explores potential future developments under different exploitation scenarios (study area in Figure 1).
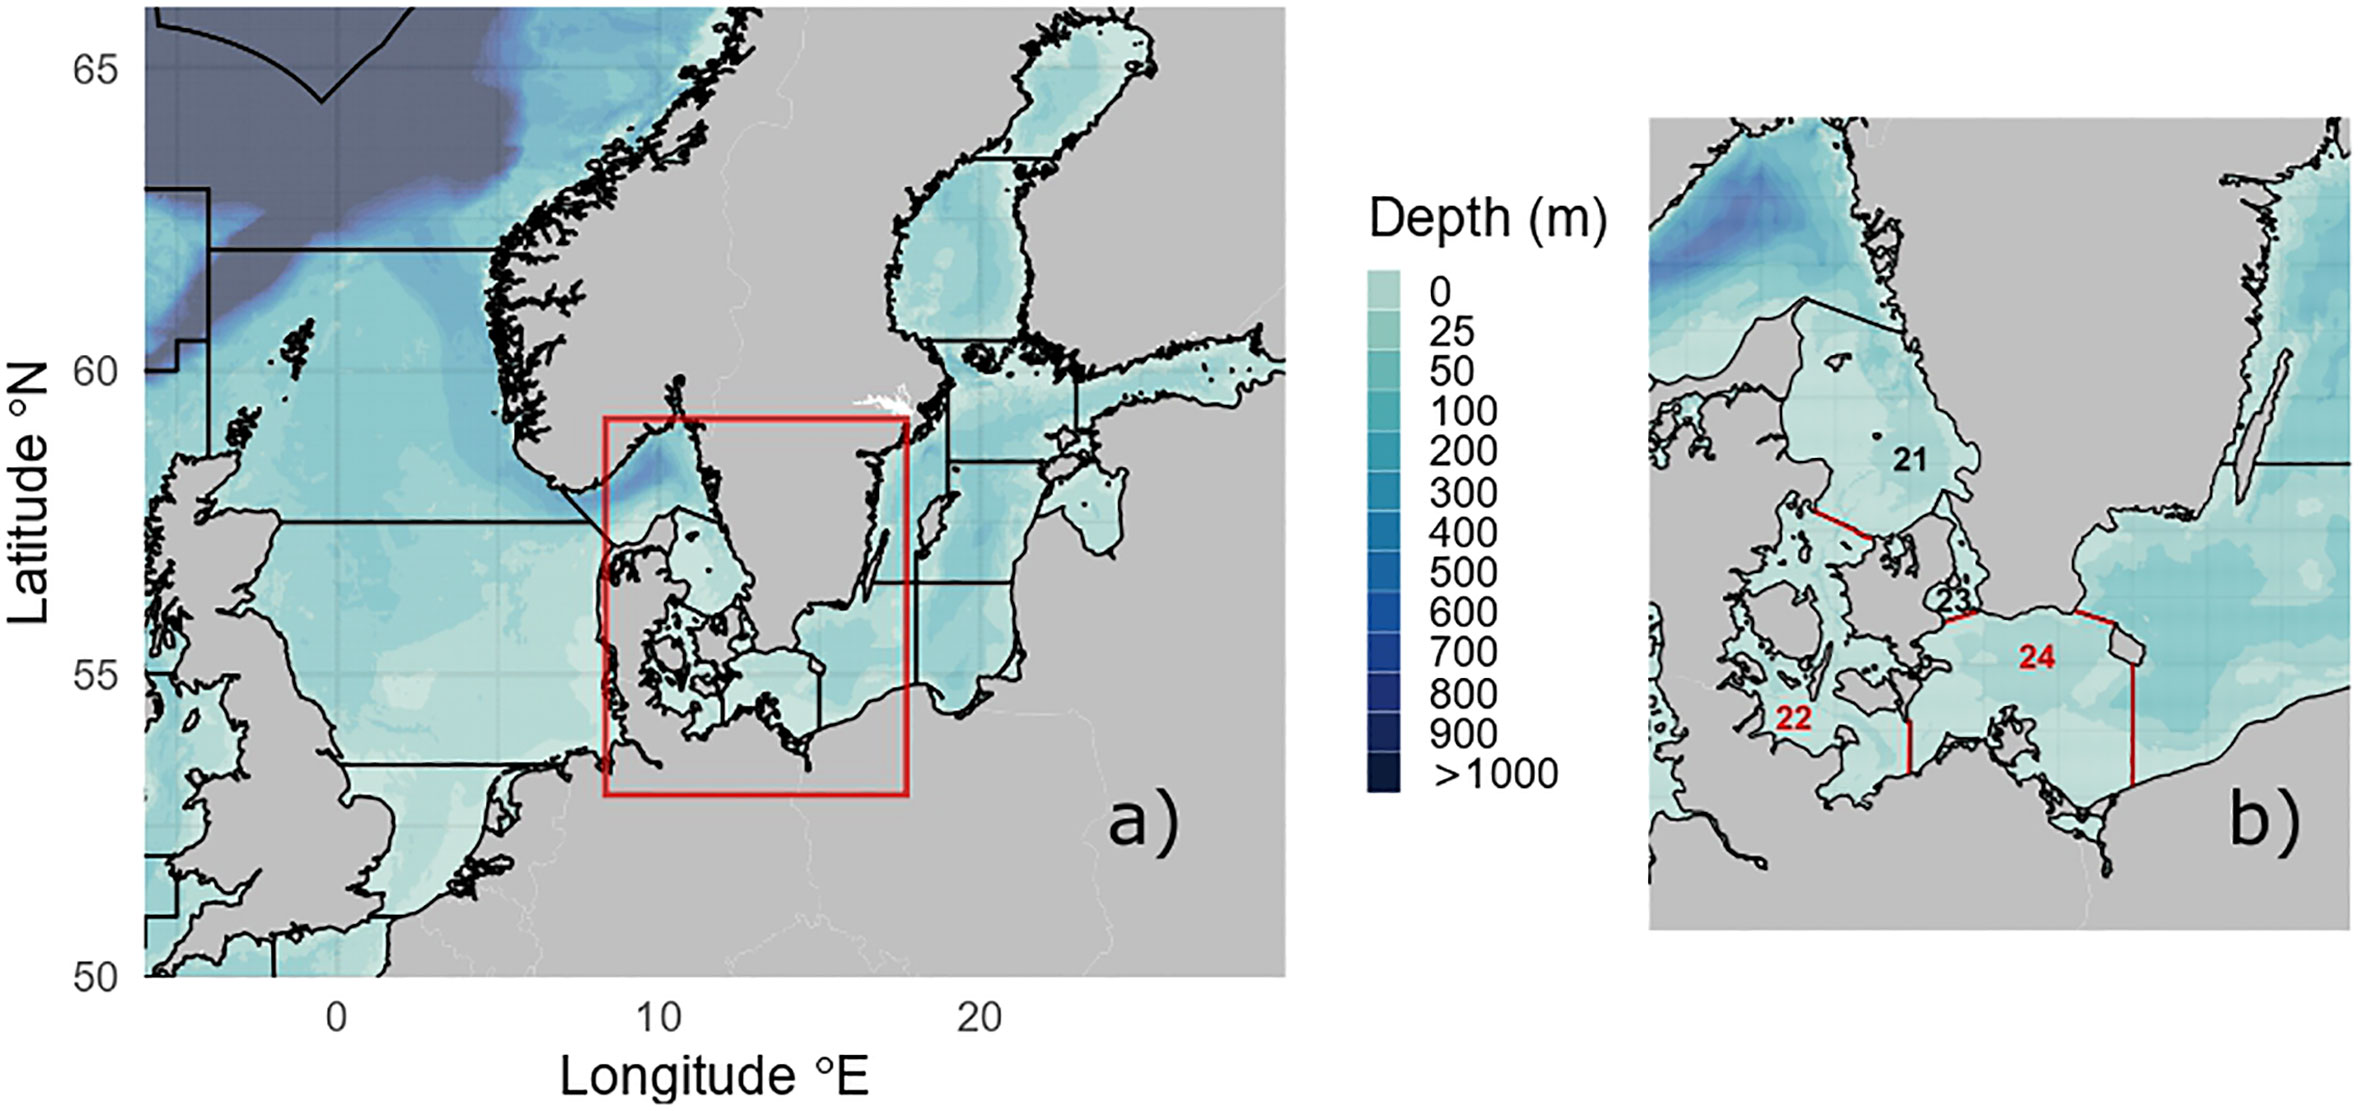
Figure 1 Western Baltic Sea (WBS) position in the context of the northeast Atlantic shelf region including the entire Baltic Sea region (A). The WBS ecosystem (B) is bounded by ICES subdivisions 22 and 24 (red line). Maps were produced using R package marmap (v. 1.0.6) (Pante and Simon-Bouhet, 2013).
Ecosystem-Based Fisheries Management (EBFM) represents a new direction for fisheries management, reversing the order of priorities so that management starts with ecosystem considerations rather than the maximum exploitation of several target species (Pikitch et al., 2004). EBFM aims to sustain healthy marine ecosystems and the fisheries they support. Specifically, it aims to rebuild and sustain populations of non-target and protected species. Network modelling has been evoked as a suitable tool to implement ecosystem-based management because its focus on connections among components is functional to understanding the dynamics of socio-ecological systems and helps designing effective management strategies (Long et al., 2015). For instance, an ecosystem model of the North Sea (Mackinson et al., 2009) was applied to assess multi-annual management plans formulated by the EU Commission (STECF, 2015). Moreover, in silico experiments showed that biodiversity confers resilience to fish extraction in the Baja California food web (Rocchi et al., 2017). The positive relationship linking biodiversity to resilience confirms previous findings based on field data analysis (Lindegren et al., 2016) and mesocosms experiments (Moustaka-Gouni et al., 2016).
The purpose of this study is the creation of the first mass-balanced ecosystem model for the WBS by using the best available, recent data and focusing on the interaction between fisheries and ecosystem components. This work focuses on three main aspects. First, quantifying the impacts of long-term overfishing of western Baltic cod (Gadus morhua, Gadidae) and western Baltic spring-spawning herring (Clupea harengus, Clupeidae) on the whole system. Second, studying the role of herring and sprat (Sprattus sprattus, Clupeidae) as low-trophic level key species in the food web. Third, assessing the competition between marine mammals and fishers as well as the consumption of fish by seabirds.
Fishing pressure dramatically reduced stock size and catches of the western Baltic spring-spawning herring and western Baltic cod over the last 25 years (ICES, 2019a). Comparing data for 2019 against 1994 shows a decline of spawning stock biomass (SSB) of herring and cod by approximately 75% and 38%, respectively (ICES, 2020a; ICES, 2020b). These changes had a strong negative impact on catches of herring (-85%) and cod (-56%). Moreover, cod experienced repeated recruitment failures resulting in a population now dominated by a single year class (ICES, 2019a; ICES, 2019b; Froese et al., 2022). Herring and sprat are planktivorous fish that occupy strategic positions in the WBS food web (Casini et al., 2004; Andreasen et al., 2017). They represent bottlenecks for energy delivery from lower trophic levels of the planktonic food web to larger-size predators such as cod, seabirds and marine mammals (see the wasp-waist structure of marine food webs in e.g. Cury et al., 2000; Scotti and Jordán, 2015). Overfishing has severely compromised the size of reproducing adult populations of western Baltic spring-spawning herring and western Baltic cod, making them vulnerable to threats caused by climate change and eutrophication. Changes in atmospheric circulation resulted in lower frequency and intensity of North Sea water inflows into the Baltic Sea (Mohrholz et al., 2015; Mohrholz, 2018). These events, together with eutrophication, increased the extent of low-oxygen zones in cod-spawning habitats (Möllmann, 2019). Declining water inflows from the North Sea also lowered the salinity in areas relevant for cod reproduction. These conditions increased the sinking of cod eggs, which experienced higher mortality rates because of the exposure to unfavourable anoxic zones (Hüssy et al., 2012). Overfishing of western Baltic spring spawning herring eroded its stock and exposed the population to the negative impacts of raising temperatures, with a later onset of winter negatively correlated to reproductive success (Polte et al., 2021).
To explore the consequences of alternative fishing regimes at the ecosystem level, an Ecopath with Ecosim (EwE) model (Polovina, 1984; Christensen and Pauly, 1992; Christensen et al., 2000; Pauly et al., 2000) of the WBS was constructed based on an earlier version by Opitz and Froese (2019). Referring to the legal framework outlined by the CFP and MSFD, the WBS model was used to compare different fishery management options for the recovery of depleted stocks and sustainable future catches. Additionally, it was analysed how the different fisheries scenarios impacted endangered species such as the harbour porpoise, and assessed whether fishing pressure may induce a shift in the WBS community composition. Finally, impacts that BAU and EBFM have on the WBS food web resiliency to eutrophication and warming, and on carbon sequestration rates attributed to commercially exploited fish stocks were quantified.
2 Materials and methods
The Ecopath base model represents the WBS ecosystem in 1994. This is the first year for which complete ICES catch and stock size data sets were available for the majority of fish groups included in the model and particularly for cod, herring and sprat — the economically most important species in the WBS. The Ecopath model is a static snapshot and provides a description of the average annual carbon circulation in the ecosystem. Time series from 1994 to 2019 for catch and stock biomass were used to produce a reference model with Ecosim as a prerequisite to explore the ecosystem-level impacts of alternative fishery management solutions. Predictions were made assuming different fishing mortality rates along a medium-term scenario (i.e. 2020-2050) and for the period 2020-2100 (i.e. to ensure all trends attaining a novel steady state).
The area represented by the WBS model covers ICES subdivisions (SDs) 22 and 24 (Figure 1B). Fitting the model to these management areas was practical to match ICES fishery data structure and ecologically, the WBS is also a conveniently uniform area that clearly differs from the surrounding regions. To the north, limited exchange of ocean water through the Danish straits creates persistent salinity gradients resulting in brackish water conditions in the WBS. To the east in the Arkona Basin (SD 24), low salinity causes eastern Baltic cod eggs to sink and exposes them to bottom contact, threatening eggs survival due to lethal temperatures (<1.5°C) or oxygen depleted conditions (<2 ml l-1); thus limiting eastern Baltic cod recruitment in the western Baltic management area (Hüssy et al., 2016). The Öresund – separating Sweden from Denmark (SD 23) – has mostly rocky floor and exhibits ecological properties different from the sandy-muddy areas in the WBS (SDs 22 and 24). The chain of lagoons in the southern WBS contributes to the sedimentation and chemical, physical and biological transformation of freshwater discharges from rivers, being particularly effective in the removal of inorganic nitrogen compounds (Kuss et al., 2020). Taken together, the WBS ensures data availability, ecological homogeneity and correspondence with active management units.
The Ecopath with Ecosim software tool1 was used for model preparation. Ecopath creates mass-balanced snapshots of ecosystem resources and their interactions, represented by biomass pools connected through trophic links. The biomass pools may consist of a single or groups of species representing ecological guilds. Pools may be further split into ontogenetically linked groups such as done here for adult (>35 cm) and juvenile (<=35 cm) cod. Biomass was expressed as grams of carbon per square meter (gC m-2) to account for differences between the carbon contents per wet weight (WW) in the trophic groups (see Supplementary Materials). Ecopath bases the parameterization on the assumption of mass balance over an arbitrary period, usually a year. In accordance with this basic feature, the WBS model used annual means as inputs for parameters. The parameterization of an Ecopath model requires satisfying two master equations. The first describes the production of biomass for each group:
The second is derived from the principle of matter conservation within a group:
A detritus compartment (D) receives flows originating from other mortality (M) (disease, starvation) and non-assimilated food (NA), so that:
Input of at least three of the following four elements is required for every group: (a) biomass, (b) production/biomass ratio (P/B or total mortality, Z), (c) consumption/biomass ratio (Q/B) and (d) ecotrophic efficiency (EE). Here, EE expresses the proportion of the production of a group that is extracted by other system components, i.e. the proportion of total mortality due to predation/grazing and fisheries (Heymans et al., 2016). If all four elements are available for a group, the program can estimate the degree of either biomass accumulation or net migration. For further details, see Christensen et al. (2000).
The Ecosim component of EwE provides a dynamic simulation capability at the ecosystem level, with key initial parameters inherited from the base Ecopath model. The basics of Ecosim consist of biomass dynamics expressed through a series of coupled differential equations. The equations are derived from the Ecopath master equation and take the form:
where dBi/dt represents the growth rate of group i in terms of its biomass Bi during the time interval dt. The term gi indicates the net growth efficiency (production/consumption ratio), and ∑j Qji stands for the total consumption by trophic group i over all resources j. The element ∑j Qij defines the total predation by all predators j on trophic group i. The last part of the equation includes the non-predation (i.e. other) natural mortality rate (MOi); the fishing mortality rate (Fi); the emigration rate (ei); and the immigration rate (Ii) (Walters et al., 1997; Walters et al., 2000).
Ecosim allows for time dynamic simulations of biomass changes and for the assessment of predicted biomass with respect to independent time series data. Sum of squares (SS) quantifies the goodness of fit between observed values and model predictions. Time-varying fishing mortality was deduced using empirical ICES data on catch (C) and biomass (B); it was calculated for each year i as Fi = -loge(1-Ci/Bi) (Table 2 in Hu and Wroblewski, 2009). Ecosim was applied to perform simulations with F as driver and to compare model predictions to time series of biomass and catch. Moreover, Ecosim allows the dynamic forward projection of future biomass and catch of trophic groups based on assumed F exerted on commercial groups. This feature enabled evaluating the impact of different fisheries scenarios on future biomass and catch in the WBS.
2.1 Trophic groups represented in the model of the WBS ecosystem
Altogether, the WBS ecosystem model comprised 18 trophic groups. Groups are briefly summarized here, and input sources are listed in Table 1; a more detailed description and input quality ranking are found in the Supplementary Materials (Table S6).
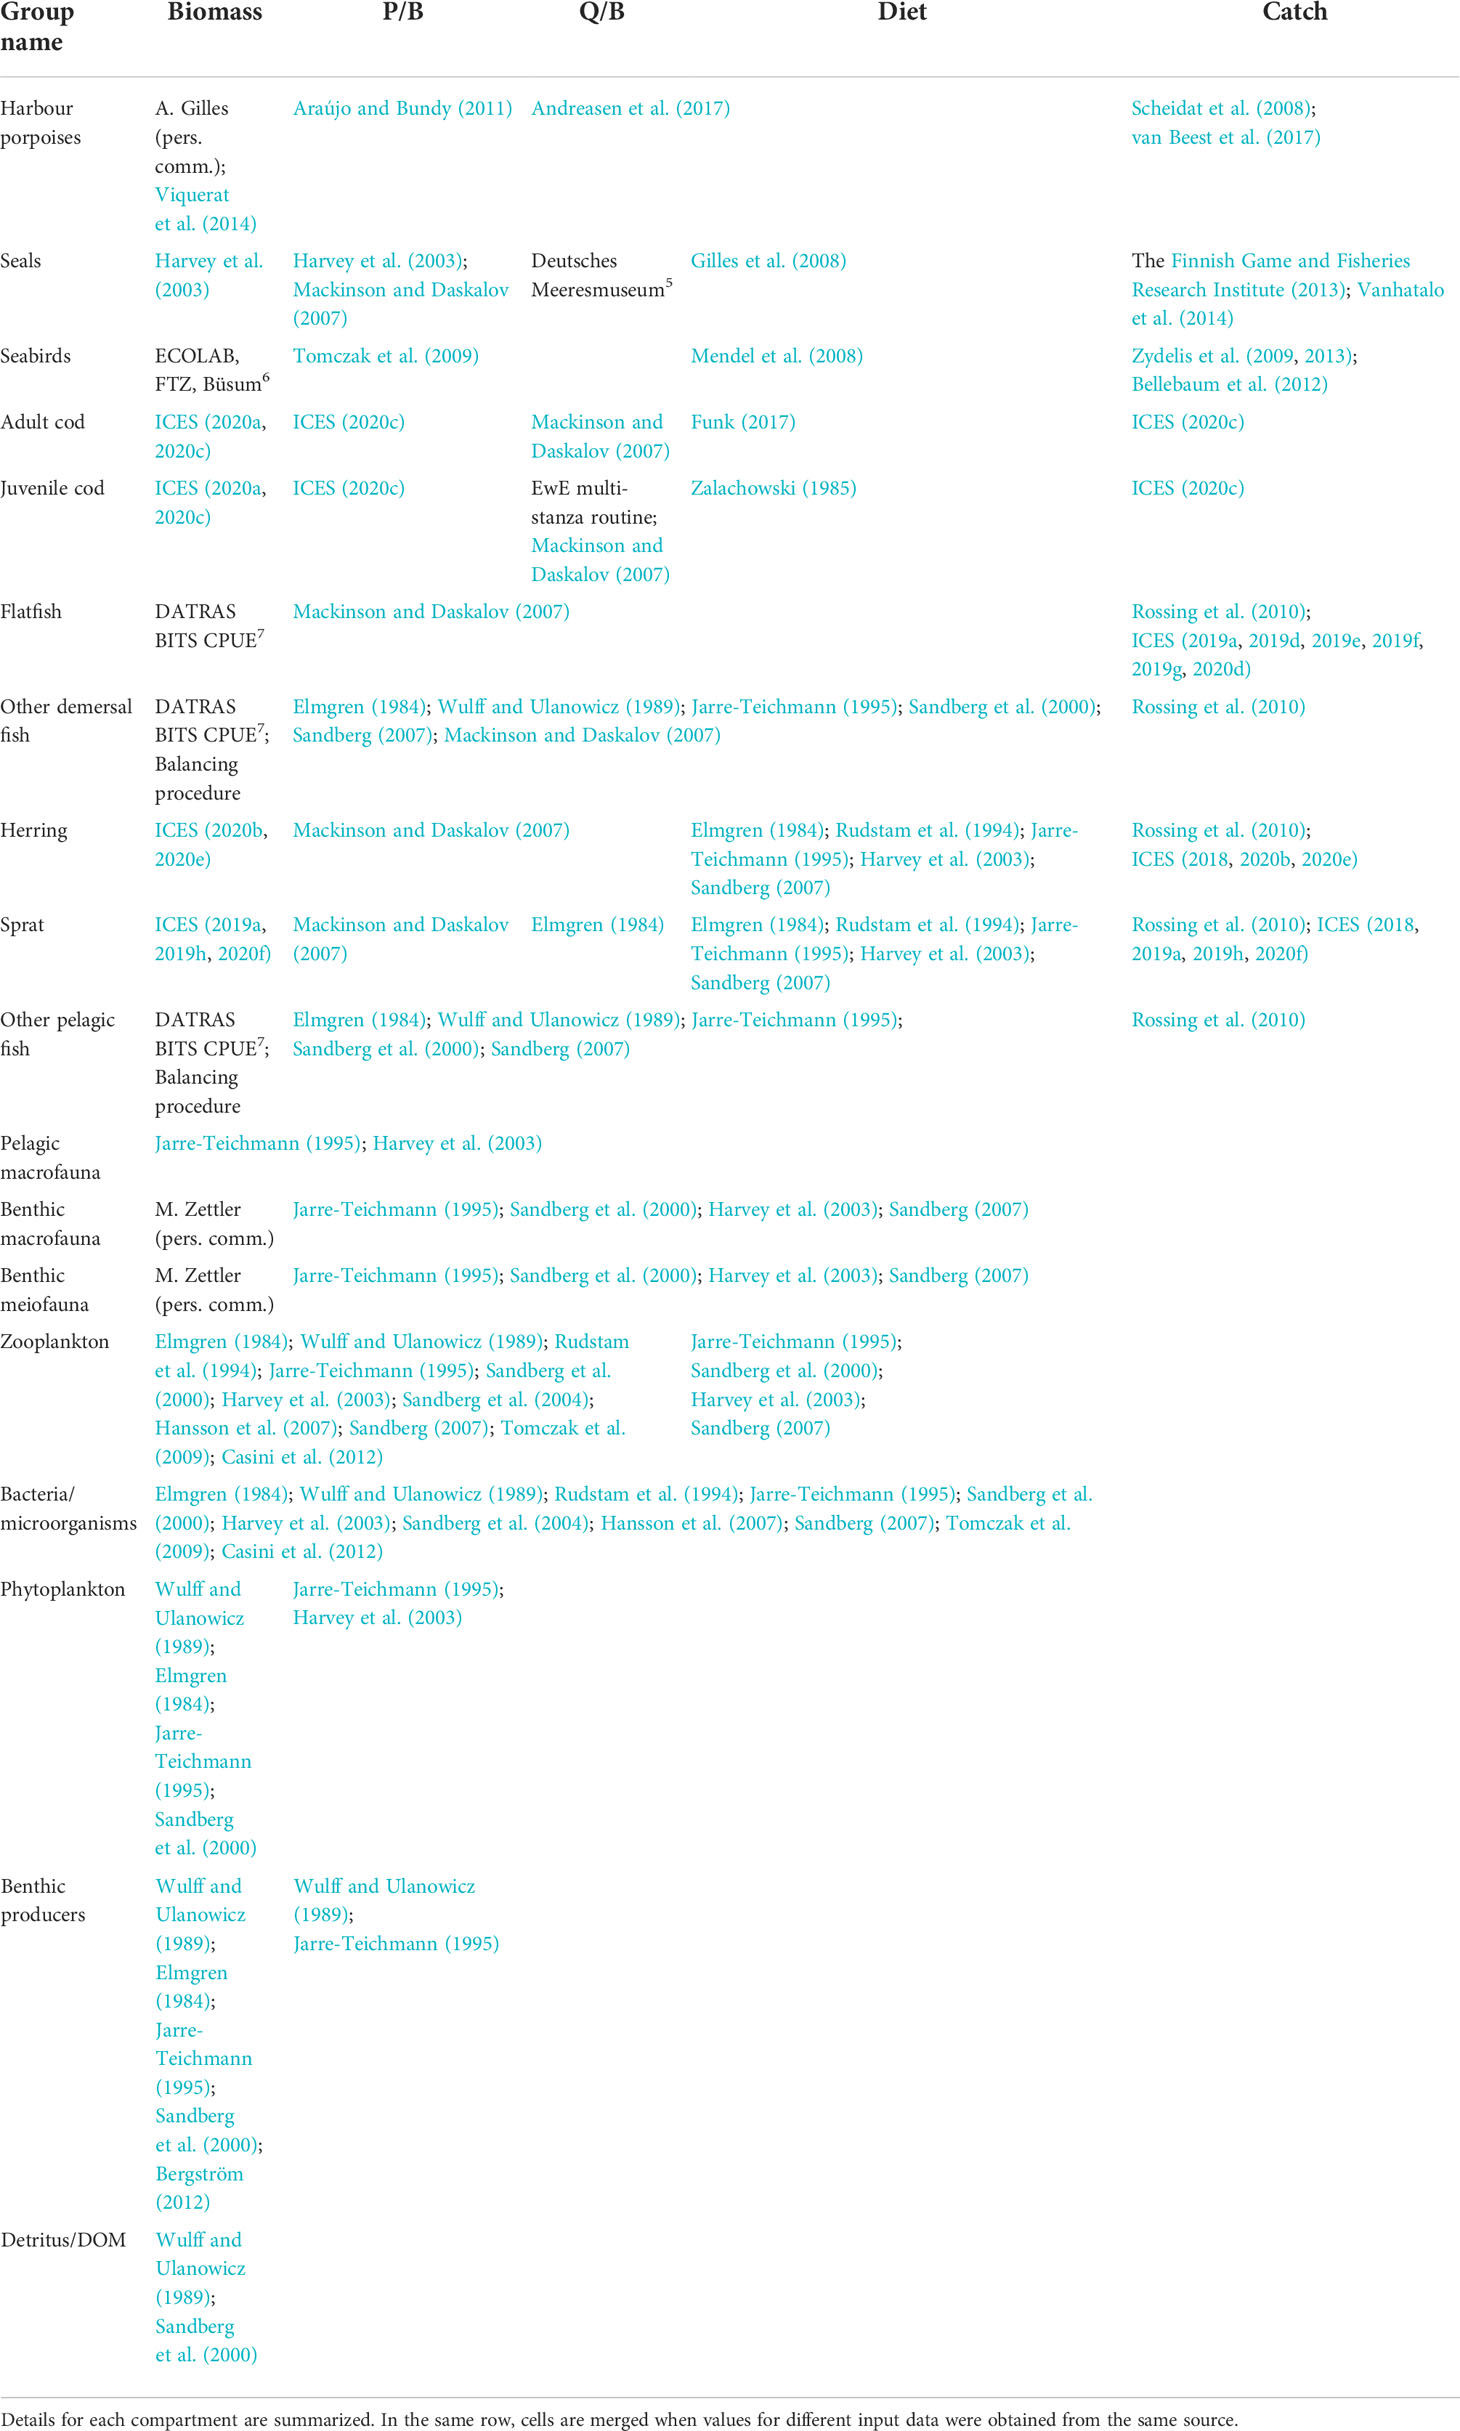
Table 1 Sources consulted to retrieve variables and parameters used to build the EwE model.
Top predators are represented by harbour porpoises (Phocoena phocoena, Phocoenidae) and a seal compartment lumping together harbour seal (Phoca vitulina, Phocidae) and grey seal (Halichoerus grypus, Phocidae). Theoretically, the river otter (Lutra lutra, Mustelidae) should be included as predator but no information on species abundance was available and its biomass is negligible. Approximately 50 seabird species are included which occur in the WBS ecosystem as listed by HELCOM2. They are composed of a mixture of proper seabirds and some aquatic bird species that are not primarily connected to the sea.
Demersal fish groups included western Baltic cod (Gadus morhua, Gadidae) divided into adult (>35 cm) and juveniles (< = 35 cm) compartments adhering to the official EU minimum landing size of cod in the Baltic Sea after 20143. An alternative model including the fraction of eastern Baltic cod in SD 24, estimated from otoliths (ICES, 2019c), is presented in the Supplementary Materials (metabolic parameters from Tomczak et al., 2012); this eastern Baltic cod compartment refers only to the biomass of mature adults because no recruitment occurs for this stock in the WBS (ICES, 2013a). Flatfish incorporated five commercially important species: brill (Scophthalmus rhombus, Scophthalmidae), dab (Limanda limanda, Pleuronectidae), flounder (Platichthys flesus, Pleuronectidae), plaice (Pleuronectes platessa, Pleuronectidae) and turbot (Scophthalmus maximus, Scophthalmidae). A final demersal fish compartment represented over 130 species populating the lower parts of the water column4. Initial estimates rely on 52 species caught during DATRAS BITS surveys (listed in Table S1); the group also included nine flatfish species not fully assessed by ICES and not represented in the flatfish compartment.
Pelagic fishes are represented by compartments for western Baltic spring-spawning herring (Clupea harengus, Clupeidae) stock, the western part of the Baltic Sea sprat (Sprattus sprattus, Clupeidae) stock, and 35 other pelagic fish species populating upper and midwater depths (data were available for 10 species only, which were recorded in the DATRAS BITS surveys; see Table S1).
Other faunal compartments were defined by pelagic macrofauna comprising all animals >2 cm inhabiting the water column. These are mainly jellyfish such as moon jellyfish (Aurelia aurita) and lion’s mane jellyfish (Cyanea capillata), other cnidarians such as hydrozoans, and several species of polychaetes. A vast benthic macrofauna trophic group represented >500 invertebrate species (i.e. Annelida, Arthropoda, Bryozoa, Chordata, Cnidaria, Echinodermata, Mollusca, Nemertea, Phoronida, Platyhelminthes, Porifera, Priapulida, and Sipunculida) >1 mm in size and associated with benthic habitat. A benthic meiofauna group represented all animals < 1 mm in size, not identified to the species level, which are associated with bottom substrates.
Planktonic groups were defined by zooplankton, phytoplankton, and a broad bacteria/microorganisms compartment. Zooplankton merged micro-, meso-, and macrozooplankton. Microzooplankton comprises planktonic animals from 0.02 to 0.2 mm in size (e.g. phagotrophic protists such as flagellates, dinoflagellates, ciliates, radiolarians, foraminiferans and metazoans such as copepods nauplii, rotiferans and meroplanktonic larvae), mesozooplankton comprises planktonic animals from 0.2 to 2 mm in size (mainly adult copepods and cladocerans), and macrozooplankton includes all planktonic animals >2 mm in size (mainly mysids and amphipods). Phytoplankton included pelagic microalgae (>0.02-0.2 mm) and at smaller size scales, bacteria and other microorganisms<0.02-0.03 mm are included as pelagic and benthic-associated forms. Mixotrophic flagellates are also included in this broad microorganisms’ compartment.
At the bottom of the trophic chain there are also benthic producers represented by benthic (macro- and micro-) algae and seaweeds composed of Angiospermophyta, Charophyta, Chlorophyta, Ochrophyta, Phaeophyta, Rhodophyta and Xanthophyta. Finally, the detrital compartment is defined as dead organic matter — particulate and dissolved.
2.2 Dynamic modelling of different fishery management scenarios
The first step to explore ecosystem responses to changes in fisheries management was the development of a static model with Ecopath for 1994 and the fitting of the related dynamic model to time series of stock and catch from external sources. Simulations served to test whether the biomass, consumption and productivity levels estimated for the various groups in 1994 could reasonably predict biomass and catch observed in the following 25 years.
In order to evaluate how well the model resembles the real world WBS ecosystem, Ecosim provides a tool to compare time series of predicted with observed biomass and catch for selected groups: juvenile cod, adult cod, herring, sprat and flatfish. Ecosim uses time series of fishing mortality F as the main driver to produce predictions of time series of biomass and catch. Time series of F made available in ICES stock assessments typically refer only to certain age groups and biomass often concerns adult individuals only, whereas catches always comprise juveniles and may include discards. In addition, ICES reports the biomass available at the beginning of the year whereas EwE works with the average of monthly biomass estimates, which typically is higher because of within-year recruitment and somatic growth of the individuals. All of these factors lead to situations where catches may exceed the reported biomass, which is highly unlikely given the productivity of the considered species. Therefore, total stock biomass was used when available rather than biomass from select classes of mature individuals as reported by ICES. Furthermore, catches were corrected compared to values in ICES advice documents because: (1) they were solely estimated for SDs 22 and 24 while in some cases, e.g. herring, ICES reported catches refer broadly to SDs 20-24; and (2) total catch is the sum of commercial landings, recreational fishery and bycatch/IUU fishery.
Pattern and magnitude of predicted biomass and catch were then compared with real data trends and the goodness of fit was evaluated by the sum of squares (SS). Further validation was achieved through pattern-oriented assessment of predictions, which indicates the capacity of the model to reproduce biological phenomena observed in reality (Heymans et al., 2016). First, the stock-recruitment relationship obtained modelling the cod ontogenetic development was evaluated to verify whether it yields the expected hockey-stick shape. Second, a scenario without fisheries was simulated to check if the model attains a steady state dominated by either herring or cod (Köster and Möllmann, 2000). Third, outcomes of the present model were contrasted with those of other EwE models developed for the Baltic Sea.
In a second step, the calibrated model was used to explore the impact of different fisheries scenarios in the period 2020-2050 (medium-term scenario) and during the years 2020-2100 (i.e. to allow the model reaching steady-state conditions). In the latter, responses were assessed during the last 20 years of each simulation to avoid biases due to the transition phase. Biomass and catch of all trophic groups attained in fact a new equilibrium in the period 2081-2100. Five distinct scenarios were tested, where FMSY is the fishing mortality corresponding to the maximum sustainable yield (MSY):
1. Scenario no fishing: F = 0
2. Scenario business as usual (BAU): F of all exploited stocks corresponding to the average of fishing mortalities during last five years (2015-2019)
3. Scenario FMSY: F = FMSY
4. Scenario half FMSY: F = 0.5 FMSY
5. Scenario EBFM: F = 0 for juvenile cod while fishing mortalities of herring and sprat were set to 0.5 FMSY and those of adult cod and flatfish to 0.8 FMSY
To project forward ecosystem dynamics, constant F values were employed. The scenarios are exploratory and describe the food web at equilibrium state under different combinations of fishing pressure. The objective was to assess alternative solutions to achieve sustainable fisheries (1) by referring to ICES advice where FMSY is used as a target and (2) by taking into account the ecological role of species (e.g. lower exploitation of forage fishes since they represent a bottleneck to energy transport from the planktonic food web to the upper trophic levels). Table 2 shows the species/trophic groups and the respective F values used for the simulation of fisheries management scenarios into the future; FMSY indicated in Table 2 are official reference values from ICES (2020a, 2020b, 2020c, 2020d, 2020e, 2020f). The choice of applying FMSY from single-species stock assessments rather than estimating them with EwE avoids the risk of overly optimistic predictions. Ecosim may in fact overestimate the amount of biomass that can be sustained by mature fishes, especially when projecting onto exploited ecosystems with a high prevalence of younger individuals (Aydin, 2004), which is exactly the status of the western Baltic Sea in the period used for model validation.
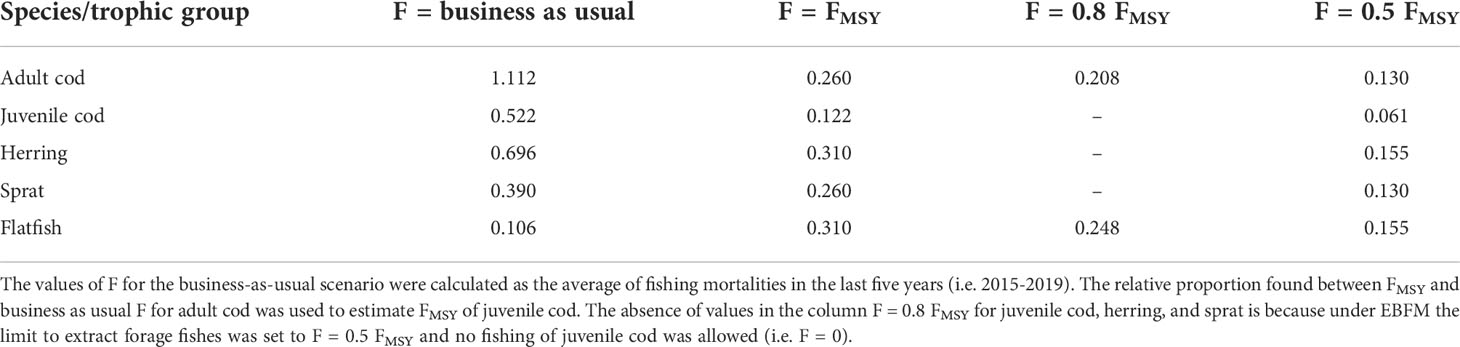
Table 2 Fishing mortality (F) values employed to simulate management scenarios.
2.3 Uncertainty analysis
Trends of biomass and catch obtained with Ecosim starting from the 1994 Ecopath model do not account for the consequences that the uncertainty of inputs has on predictions. This aspect may be relevant because data used to build the 1994 Ecopath model show different levels of reliability as they include local variables (e.g. stock biomass of the adult cod) and parameters borrowed from EwE models of similar ecosystems (e.g. Q/B and P/B ratios of zooplankton); see Table S6. Moreover, evaluating the performance of alternative fisheries management strategies requires quantifying the sensitivity of predictions with respect to the uncertainty of inputs (Heymans et al., 2016). To this end, multiple simulations were run in Ecosim using a Monte Carlo approach creating a series of plausible biomass and catch trends generated through random samplings of symmetrical intervals centred on the 1994 Ecopath model. Prediction uncertainties in trophic group biomass, P/B and Q/B ratios were represented as coefficients of variations (CV) for interval ranges produced in Monte Carlo simulations that reflect the specificity of input data to the WBS (Corrales et al., 2017; Supplementary Materials section Uncertainty analysis and Table S10 for correspondence between pedigree classification and CV). Different sets of random draws were used where fishing mortality was the sole forcing factor while a single set of random draws was applied to perform pairwise comparisons between BAU and EBFM under multiple stressors. This last choice ensured that differences in outcomes across scenarios were due to the interplay of stressors and fisheries management rather than diverse combinations of parameters.
2.4 Multi stressors’ scenarios
Exploration of future scenarios considered fish extraction as the main driver altering fish stock biomass, an assumption corroborated by previous studies on the WBS (Möllmann et al., 2021; Froese et al., 2022). However, when food web resilience is eroded by excessive fishing the importance of other stress factors cannot be neglected (Möllmann et al., 2021). Additional scenarios were then simulated applying a fully factorial design that combines changes in the biomass of phytoplankton and consequences of warming on the recruitment of key species including western Baltic cod, herring and sprat. For this purpose, variations in stock biomass and catch of all commercial targets were modelled considering two fishery strategies, business as usual and EBFM. Simulations were run over the period 2020-2100 with Monte Carlo estimates of uncertainty. Simulation results were expressed as biomass or catch ratios. Stock biomasses obtained with either BAU or EBFM scenarios were divided by estimates under no fishing without any stressor; when the ratios fall below 0.5 then the biomass is lower than BMSY. Catches under either BAU or EBFM were normalized using catch estimates under the MSY scenario (CMSY) without any other stressor as a reference; where CMSY represents a reference threshold for fisheries management.
Phytoplankton biomass was varied ±25% compared to reference runs considering fishery as the only driver. Such changes lie within the limits observed for phytoplankton in the WBS during the 2000s (Henriksen, 2009) and reflect relative diatoms variations predicted by the model ERGOM for the WBS in response to meteorological forcing and varying levels of nutrients input (Friedland et al., 2012). In general, phytoplankton biomass may increase from nutrients enrichment while the decline of nutrients concentration and elevated temperatures cause the biomass to decrease (Wasmund et al., 2019).
To relate prospected ocean warming impacts on western Baltic cod, herring and sprat recruitment, forcing factors for future projections include (1) the total mortality of cod and herring (both progressively increased in the period 2020-2100) and (2) sprat SSB, evenly increased through the time series. These conditions reflect detrimental impacts exerted by ocean warming on cod and herring recruitment (Voss et al., 2012; Polte et al., 2021) and account for the empirical positive relationships between higher temperatures and sprat recruitment (Voss et al., 2012; Supplementary Materials section Multi-stressors’ scenarios). Ecosim simulations served (1) to explore whether fishing according to a business-as-usual model increases the fragility of depleted stocks in the face of warming (Möllmann et al., 2021), and (2) to quantify the buffer potential EBFM holds for the decline of cod and herring recruitment caused by warming. This modelling scheme both implicates the impact of ocean warming on main commercial stocks and potential effects propagated at an ecosystem-level triggered by warming over the heavily depleted stocks of western Baltic cod and herring.
2.5 Fisheries management and carbon sequestration
A last aspect investigated here concerns the carbon sequestration achieved through the contribution of main commercial targets, depending on fisheries management type. Net flows to detritus were determined in four trophic groups (i.e. sprat, herring, western Baltic cod, and flatfish) under either EBFM or BAU. For each fish group, the net flow was quantified as the difference between flows to detritus (i.e. non-assimilated food and natural mortality) and flows from detritus (e.g. in the case of herring, sprat and juvenile cod, it represents part of the diet). Net flows were calculated by extracting an Ecopath snapshot of static carbon flows in the ecosystem during 2095. Such year was chosen as barycentre of the last decade, to ensure the model attained a new equilibrium in response to fisheries. Test runs showed that values found for the 2095 network were representative of averages computed over last 10 years. First, carbon sequestration caused by the four fish groups was determined for the reference model (i.e. with input parameters as defined in the model construction phase) under either EBFM or BAU. Net carbon flows to detritus were calculated by summing the contribution of all four fish groups. Second, a unique set of 99 Monte Carlo simulations randomly varied input parameters according to the pedigree classification, which allowed the extraction of 99 static networks used for both fisheries management scenarios in correspondence with 2095. Third, a distribution of net carbon flows to detritus was obtained for EBFM and BAU, with net flow quantification made following the same approach used for reference models. Our hypothesis was that larger stock sizes found with EBFM indirectly support larger carbon flows towards detritus.
3 Results
3.1 The 1994 Ecopath model
Carbon flows between trophic compartments in the WBS ecosystem reveal a relatively simple system (Figure 2). Top predators harbour porpoises and seals (trophic level > 4) have a small biomass and consequently small consumption compared to the fisheries operating at comparable trophic levels. Cod, flatfish and other demersal fish are the main fish predators of herring, sprat and benthic macrofauna. The role of herring as key species is marked by strong carbon flow exchanges. Herring feeds mainly on zooplankton and makes energy available to higher trophic levels that cannot consume plankton directly (e.g. predatory fishes, birds, seals and harbour porpoises) and to fisheries.
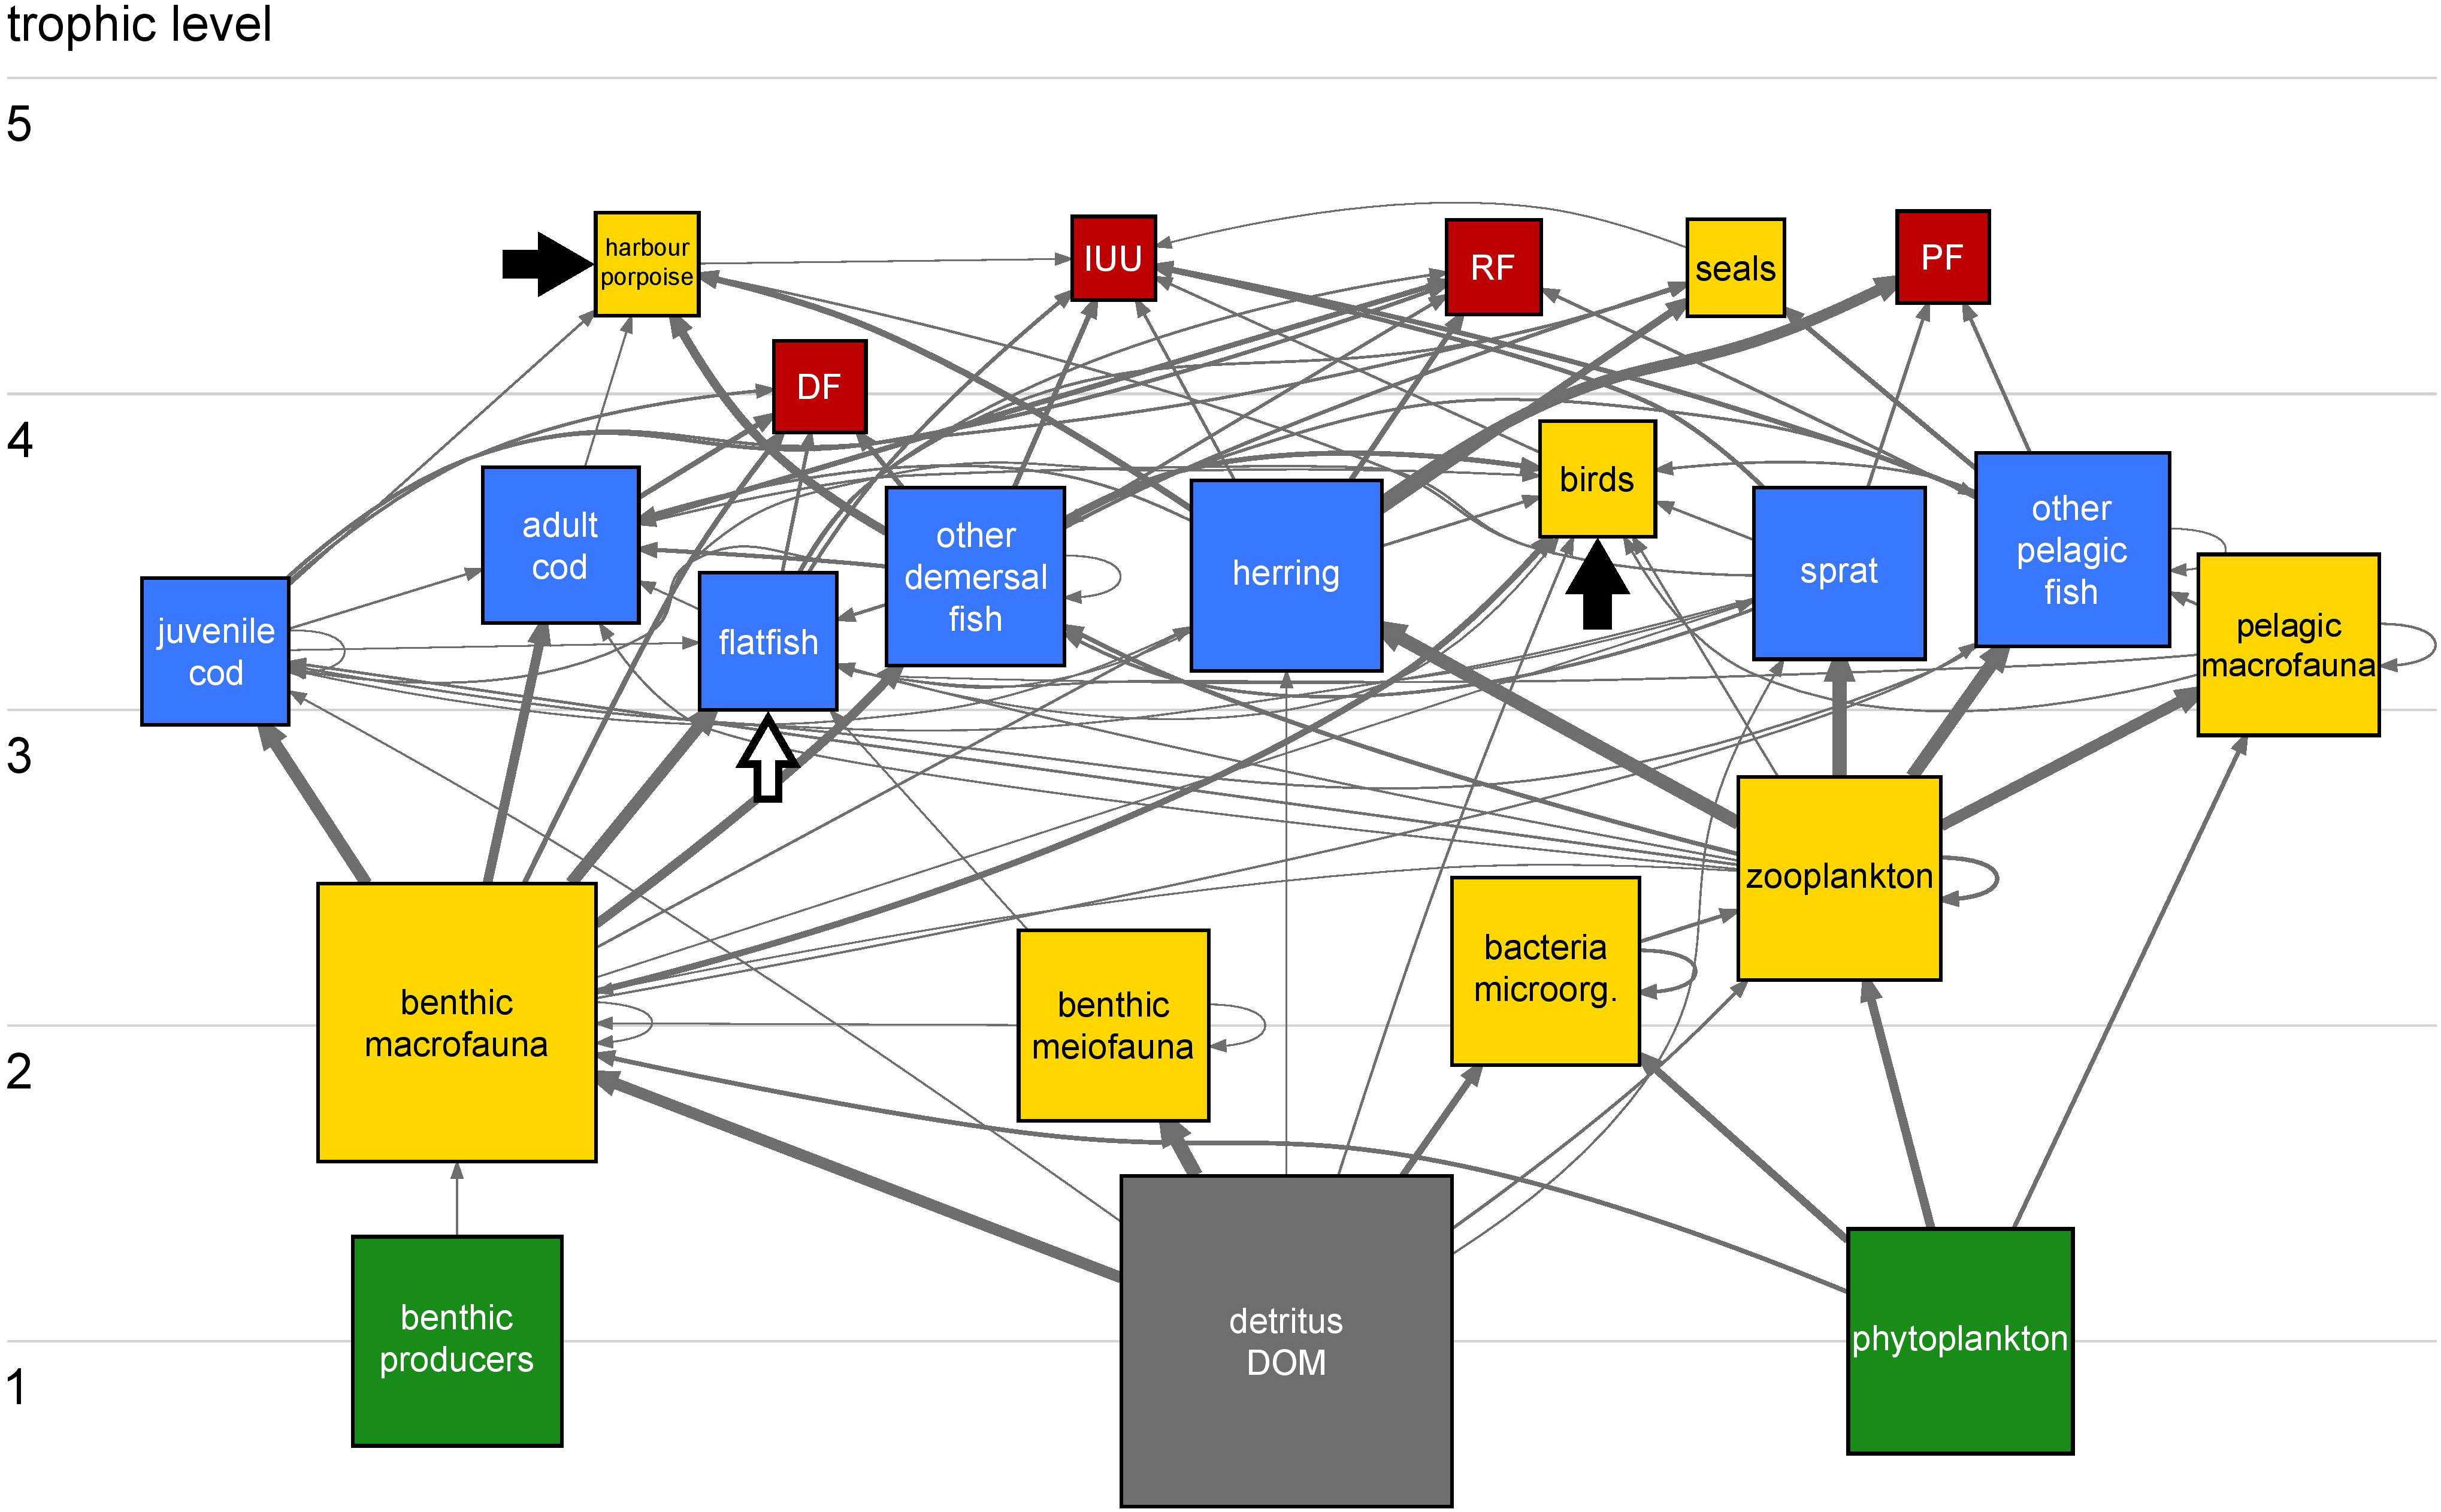
Figure 2 Carbon flow network of the WBS ecosystem in 1994. Trophic groups and fisheries are represented by 22 squares/compartments (17 living, one non-living and four fisheries) and interconnected by 99 links/flows. Color codes for the compartments: primary producers, green; fish, blue; non-fish, yellow; non-living, grey; and fisheries, red. Compartments are ordered vertically according to the effective trophic level (Scotti et al., 2006) and their size is proportional to the biomass on a log10 scale, except for fisheries. Grey, arrowheaded links indicate carbon flows from donor compartments (e.g. prey and resources) to receiving compartments (e.g. predators and consumers). Strength of flows is proportional to feeding preferences of consumers. Black and white arrows indicate import of food (harbour porpoises, birds) and immigration (flatfish) from adjacent ecosystems, respectively. Note that their size here is not proportional to their intensity. Table S9 provides size of all flows in the network in absolute numbers. Herring occupies a crucial position for transferring carbon from zooplankton to higher trophic levels and to fisheries, with the latter extracting about 89% of carbon flows leaving the herring compartment.
Some cannibalism occurred within the cod population, with 4.3% of the adult cod diet consisting of juvenile cod, and 0.3% of the juvenile cod diet including other juvenile cod. These low percentages have only a marginal effect on the population. Harbour porpoises consumed two times more juvenile cod than adult cod, however the high mobility of harbour porpoises and low abundance of juvenile cod in SDs 22 and 24 drove a shift in harbour porpoise diet towards imported food obtained by roaming in neighboring ecosystems outside the model area. Thus, adult cod became the main predator of juvenile cod in the baseline model by consuming up to 7.2% of its production, which corresponds to 7.2% of the total juvenile cod mortality (i.e. including predator and fishing mortality).
In some cases, consumption of fish by predators exceeded the annual production. For instance, modelling mobile predators such as harbour porpoises required considering the consumption of juvenile cod outside of the study area to satisfy their energy demand. Competition for fish as food (mainly herring and sprat) occurs between fisheries and other top predators, with the fisheries extracting about 8.5 times more than harbour porpoises, birds, and seals combined. Figure S4 illustrates the relative impact of all trophic groups on the ecosystem based on a comparison between keystone indices (Libralato et al., 2006). Herring shows the highest keystone index value as a single fish species with a relatively large stock size feeding low in the food web and thus transporting matter from lower trophic levels to predators high in the food web (low-trophic level species with high impact on the food web). Although sprat occupies a strategic position by transporting energy from zooplankton to higher trophic levels, its impact on the food web is lower due to its smaller stock size in SDs 22 and 24 during the recent decades. More details on inputs, balancing procedure and final values of the Ecopath model for 1994 are given in the Supplementary Materials.
3.2 Dynamic modelling of different management scenarios with EwE
EwE allows for the dynamic forward projection of biomass (B) and catch (C) of trophic groups based on fishing mortality (F) exerted on the commercially exploited groups. Prediction curves of the overall model reasonably reproduce biomass and catch values against reported values (SS = 67.17), with SS of functional groups ranging from 1.190 for herring catch to 19.080 for juvenile cod catch (Figure 3). Average SS (6.72) lies within the range of reported values for other EwE models (5.39 in Wang et al., 2012 to 37.06 in Chagaris et al., 2020). The WBS model also attains better fit and higher SS scores than single trophic groups in other models (Adebola and de Mutsert, 2019). Finally, 1000 Monte Carlo simulations improved by less than 10% the predictions compared to the reference model (best SS = 62.83). Although no indication exists in the literature about thresholds to rank SS, comparisons with other EwE models and relatively stable uncertainty values suggest a good model fit onto the WBS.
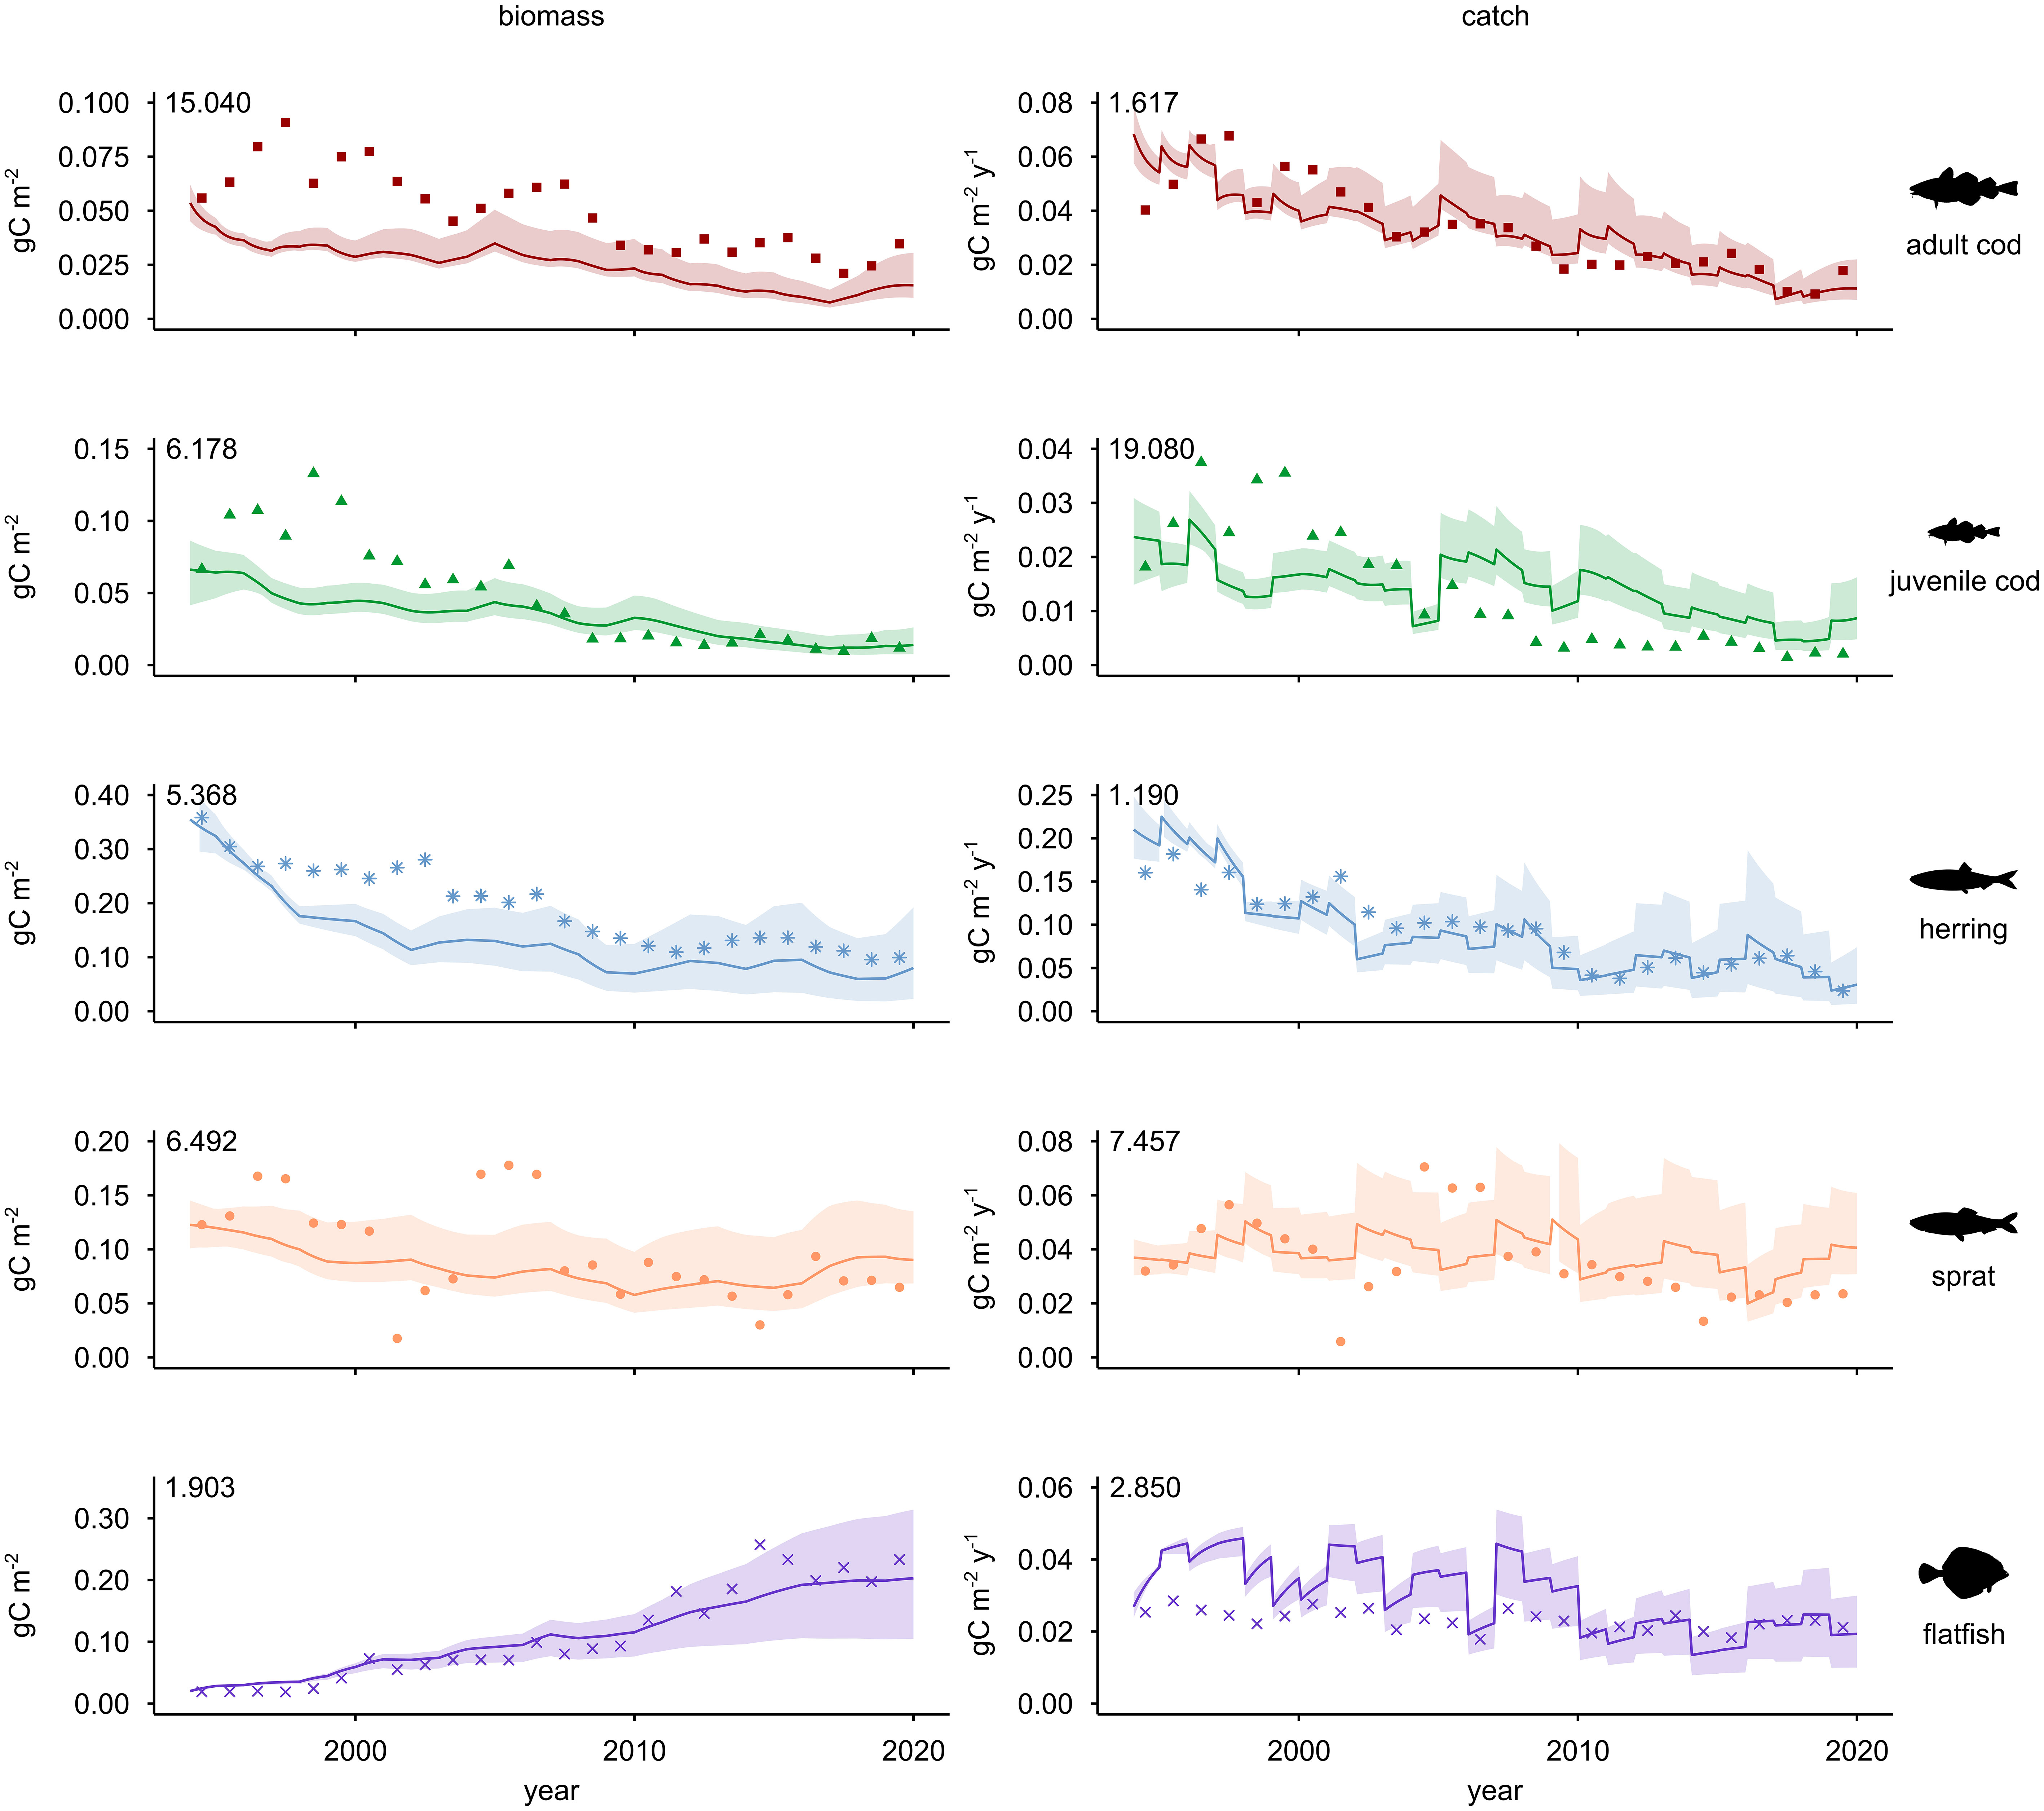
Figure 3 Comparison between observed data and Ecosim predictions for trends of biomass (left) and catch (right). Results refer to commercially most relevant fish stocks, from 1994 until 2019. Fishing mortality (F) is the forcing factor used to perform simulations. Plots show changes for adult cod, juvenile cod, herring, sprat, and flatfish. The match between model predictions (continuous line) and observed time series (dots) is visualized. Shaded areas illustrate non-parametric confidence intervals (2% and 98%). Numbers in the upper left corner of plots represent the sum of squares (SS) of residuals between predictions and observations, as a measure of goodness of fit.
The Monte Carlo simulations enabled non-parametric confidence intervals showing 2% and 98% of the distributions based on varying levels of input data uncertainty (see shaded areas delimiting fitted trends in Figure 3). After 2010, observed biomass and catch lie mostly within the confidence interval of the predictions, with more deviations found for adult cod biomass and juvenile cod catch. In general, model predictions display a better match with observed catch than biomass.
3.2.1 Exploring ecosystem development under different fisheries scenarios
Predictions of biomass and catch were extended up to 2050 (Figures 4, 5, medium-term scenario) and 2100 (Figures S5, S6, long-term simulations), respectively, for the four fisheries regimes described above (i.e. BAU, EBFM, FMSY, and half FMSY) and the no-fishing scenario. If not indicated otherwise, values reported in the manuscript for comparison with present stock and catch status are those of the medium-term scenario (i.e. up to 2050).
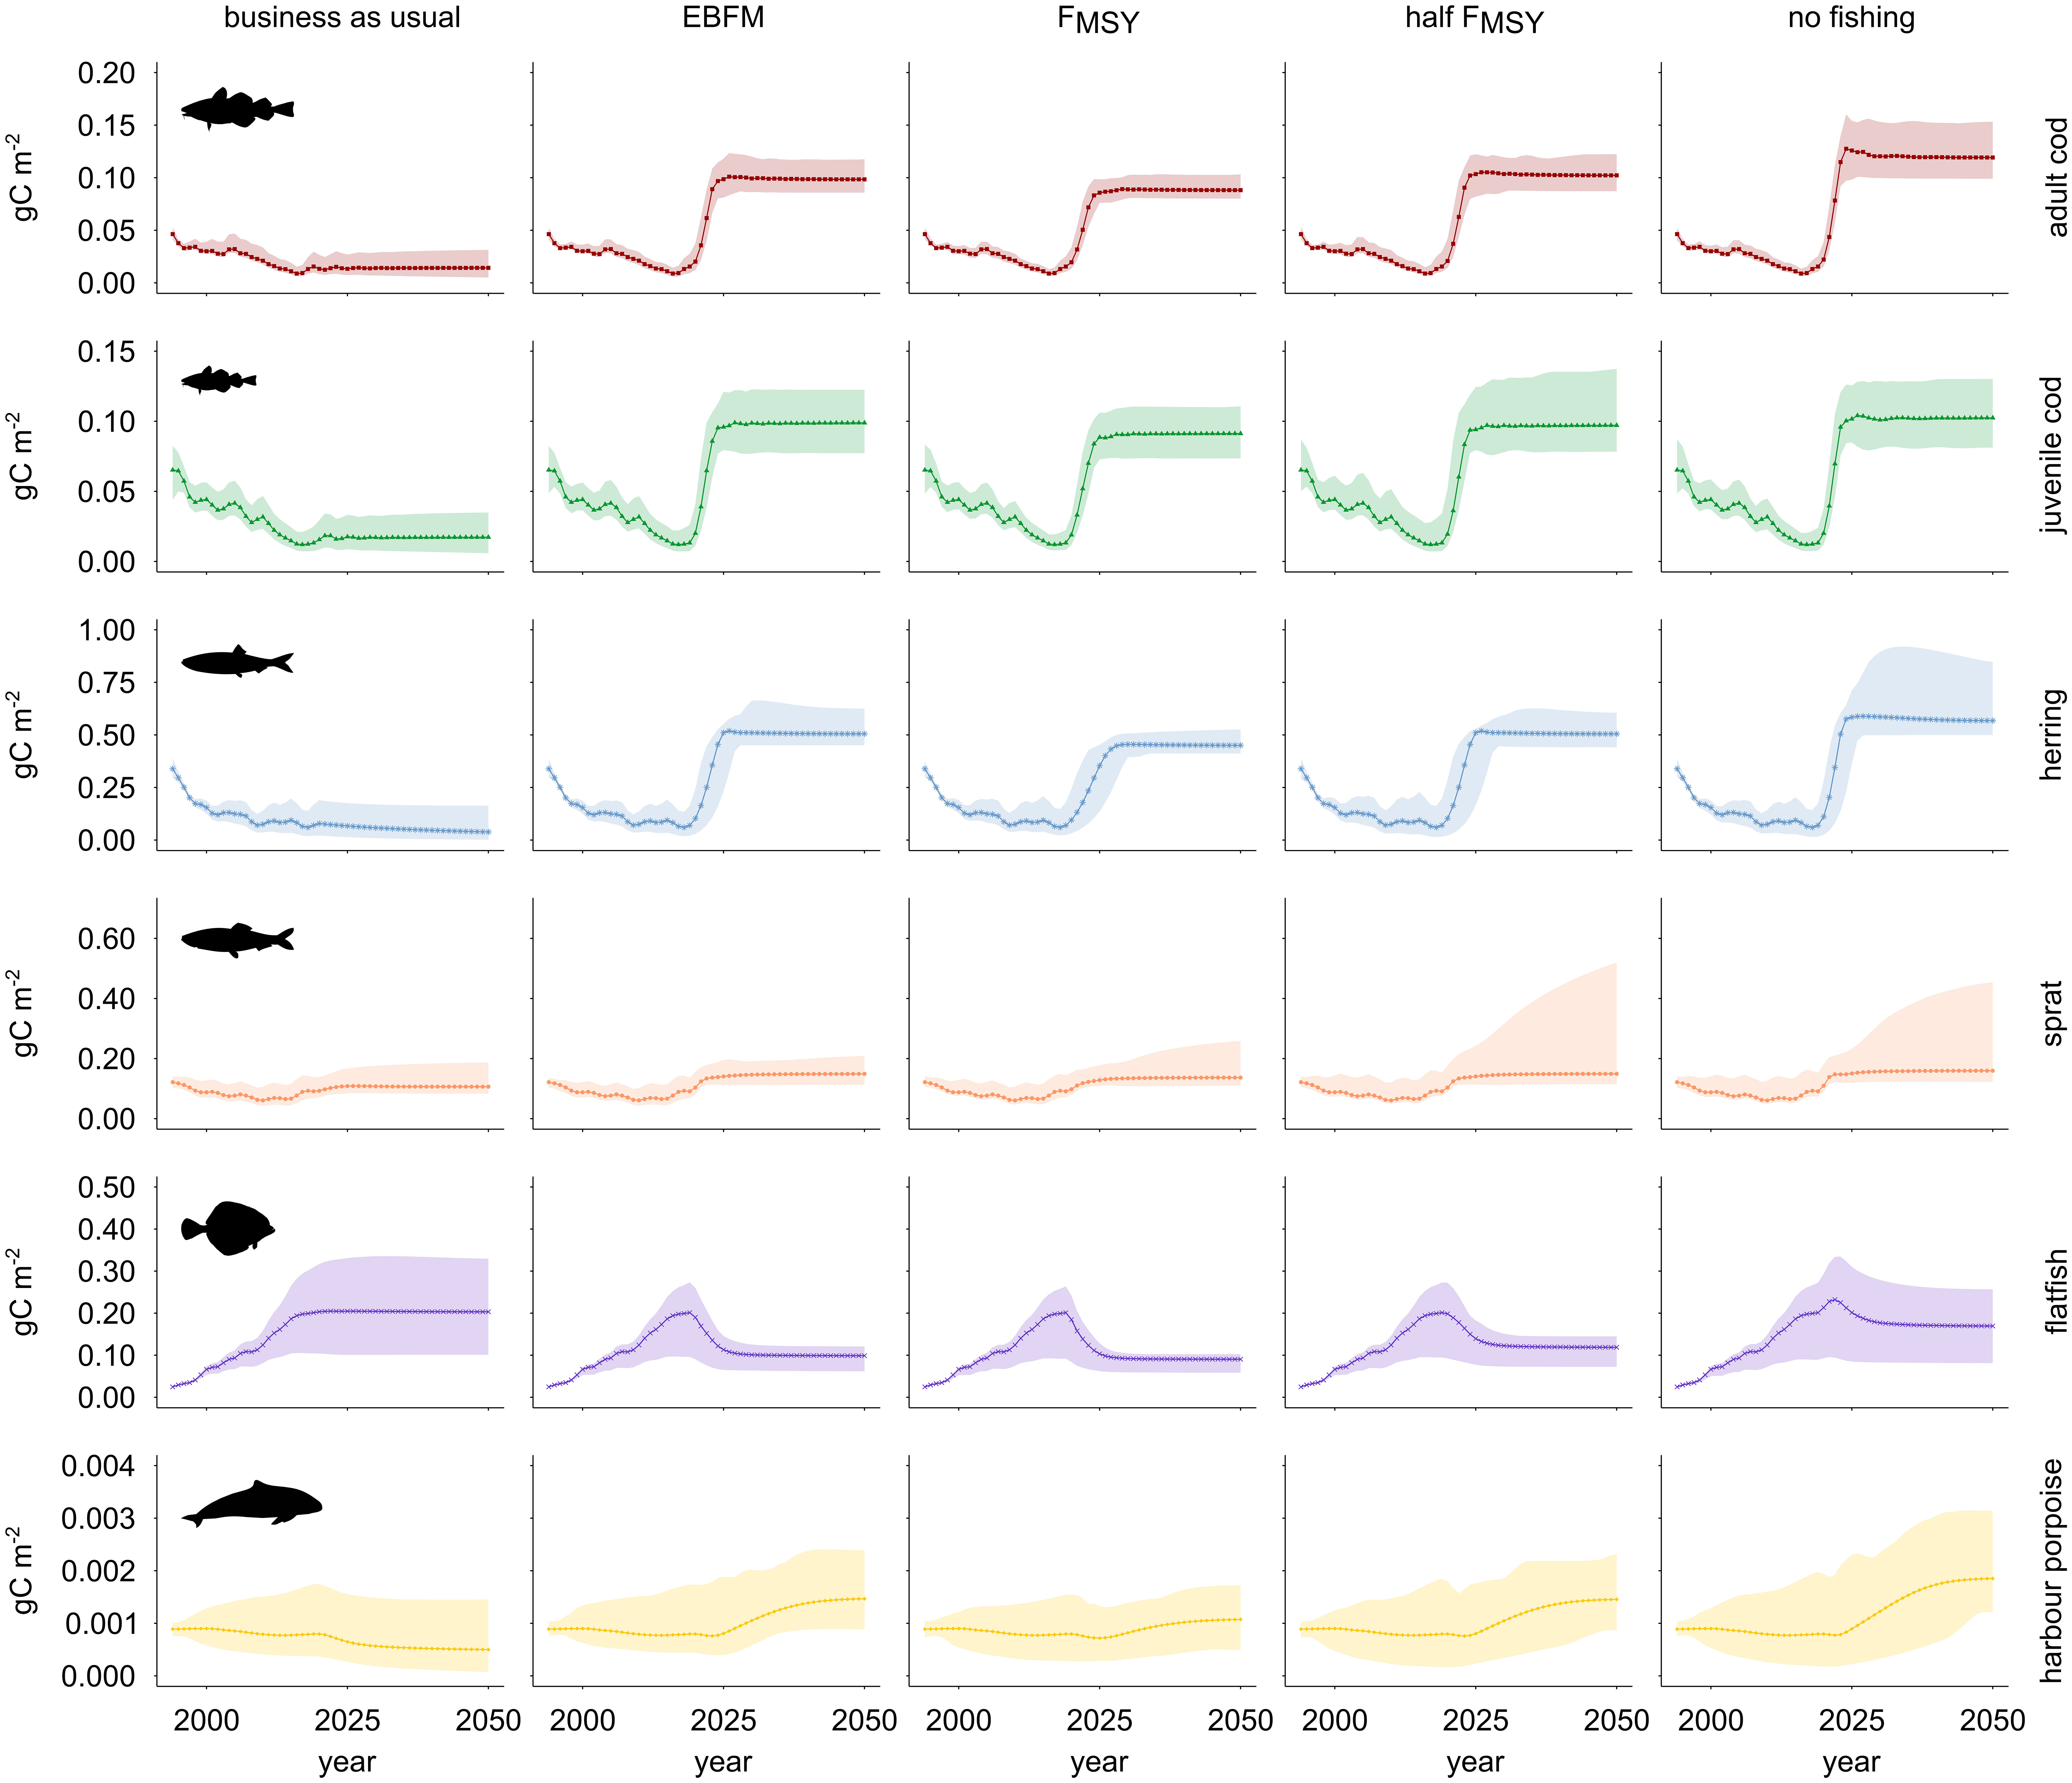
Figure 4 Biomass of commercially most relevant fish stocks and harbour porpoise in the WBS under five alternative fisheries management scenarios. Columns refer to fishing regimes: business as usual (BAU), Ecosystem-Based Fisheries Management (EBFM), maximum sustainable yield (FMSY), half of maximum sustainable yield (FMSY), and no fishing. Rows show trends for the trophic groups. Solid lines depict the predictions generated using the reference model while shaded areas indicate approximate 95% confidence limits. Under BAU, flatfish and sprat dominate the ecosystem thus confirming the regime shift triggered by overfishing during the last decades. All other scenarios lead to the recovery of the cod and herring stocks. BAU is incompatible with the preservation of a healthy harbour porpoise population.
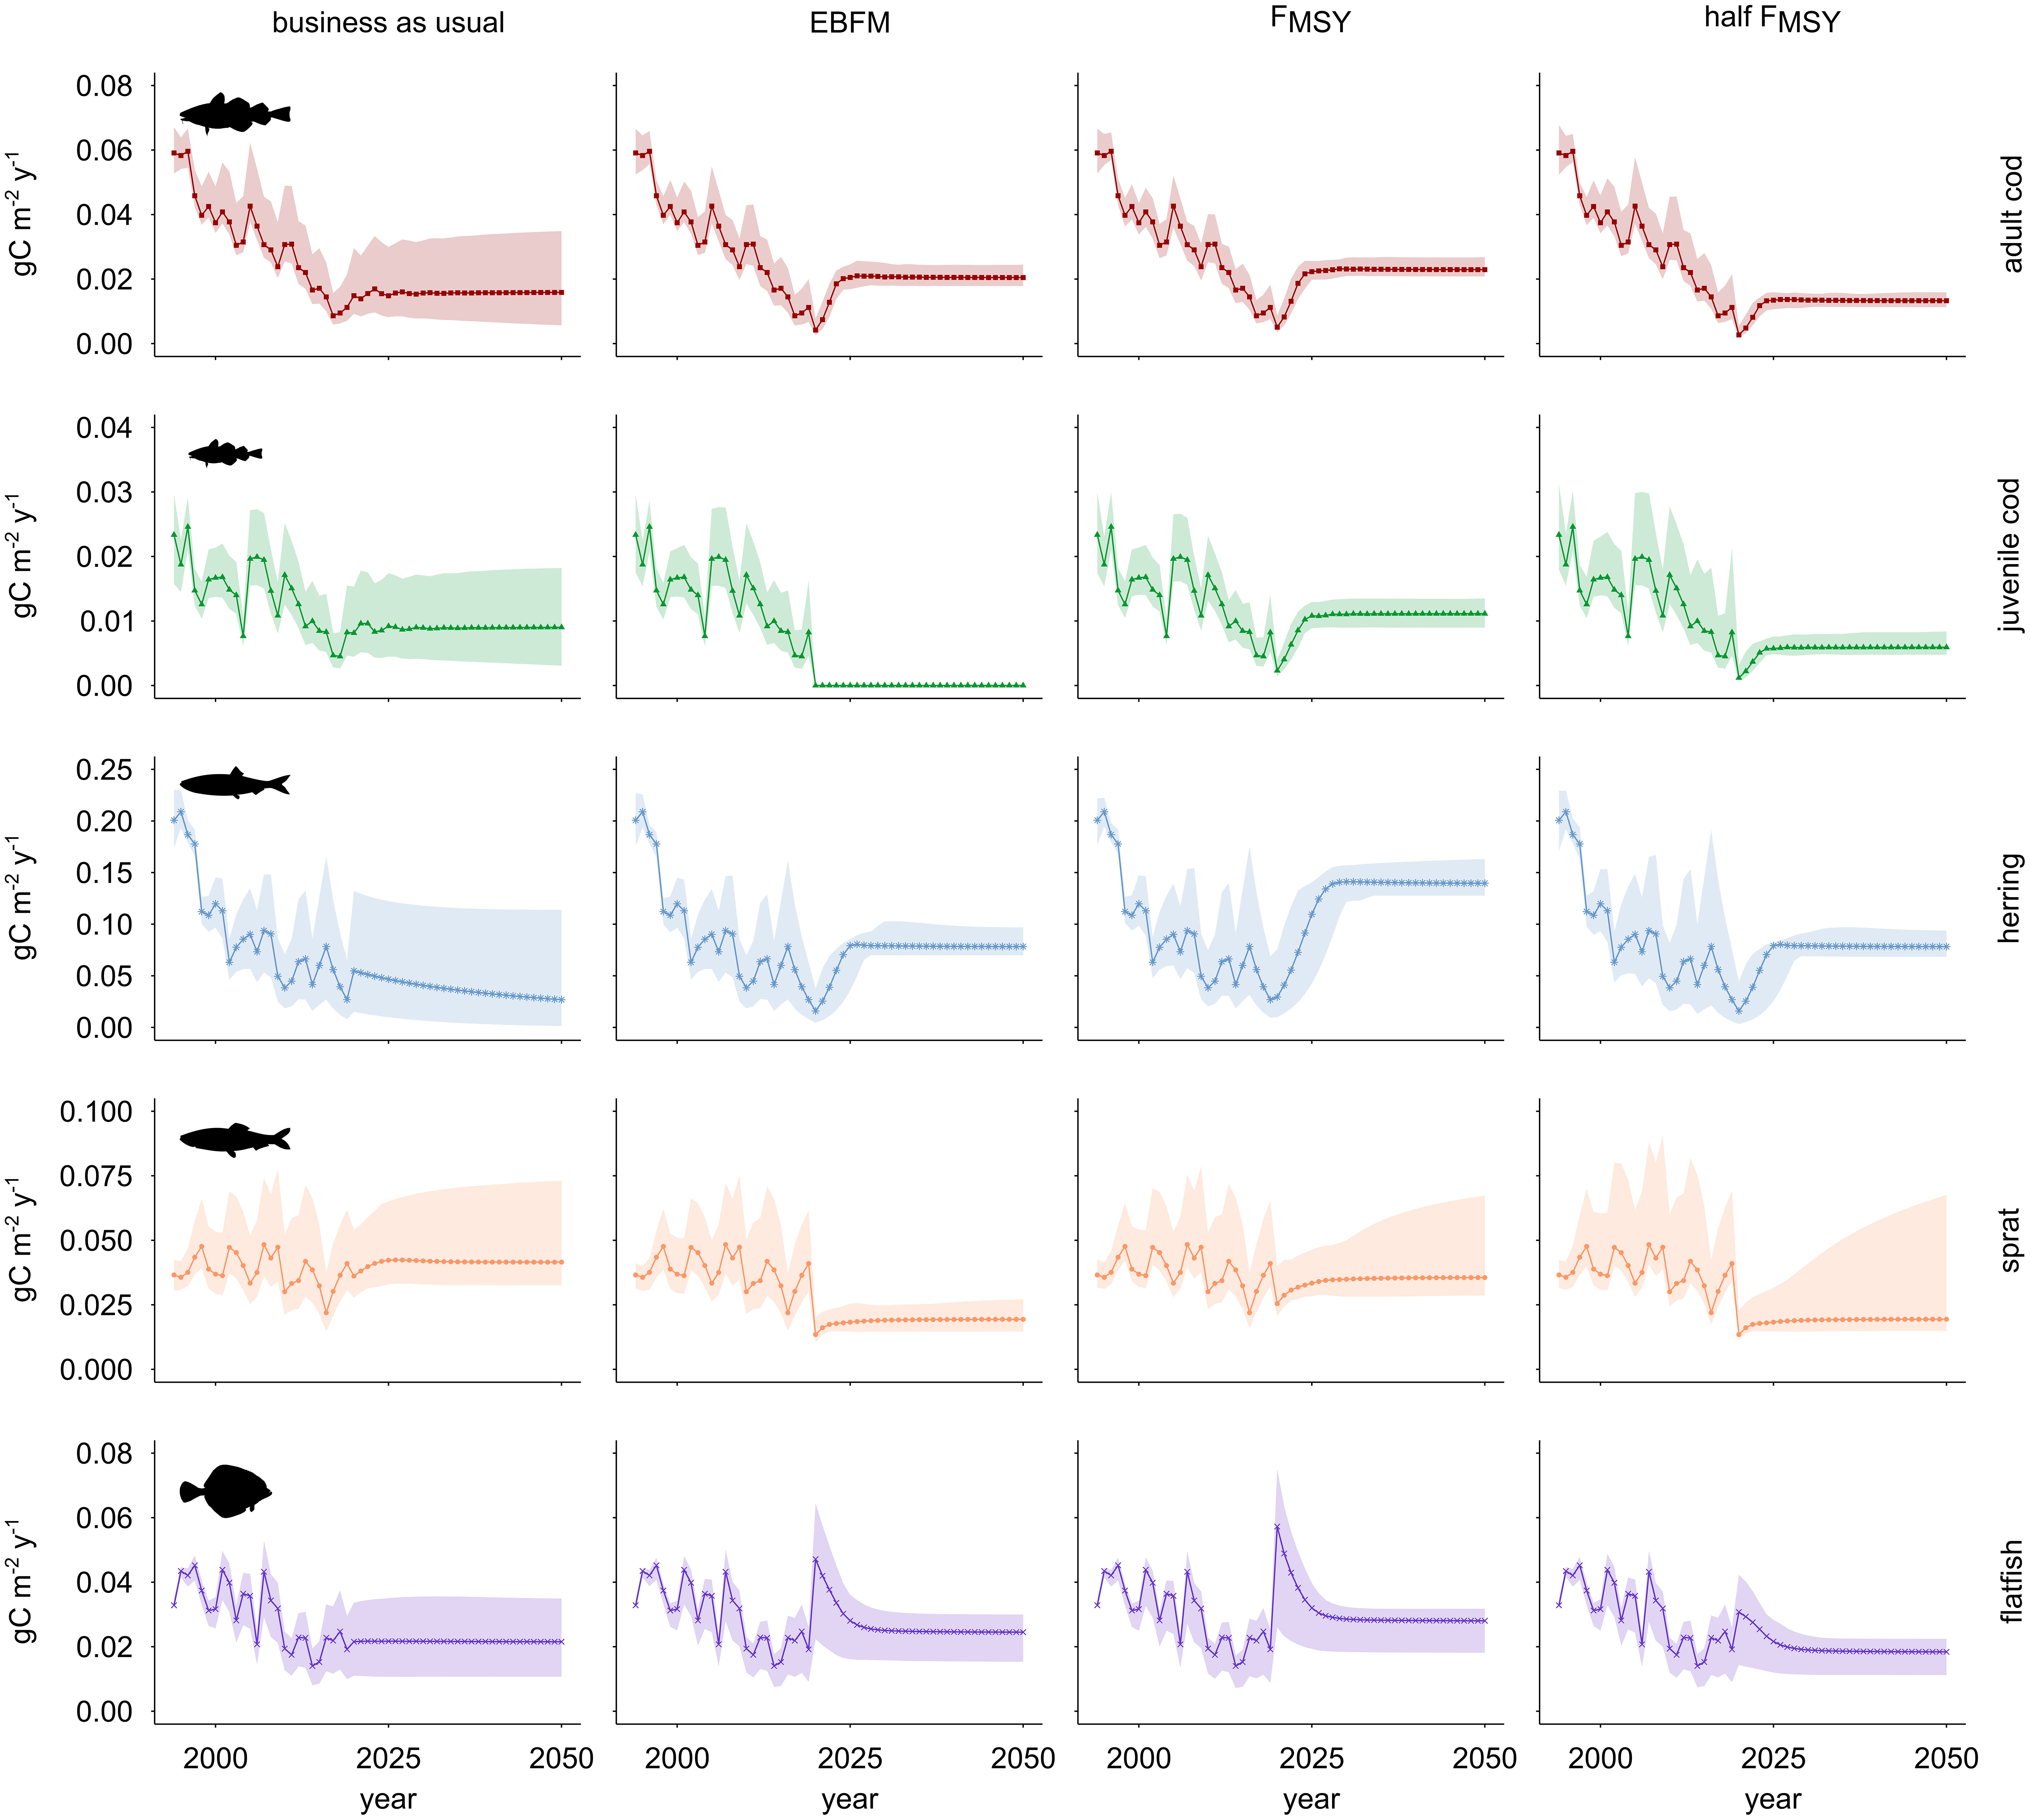
Figure 5 Catch of commercially most relevant fish stocks in the WBS ecosystem under four alternative fisheries management scenarios. Columns refer to fishing regimes: business as usual (BAU), Ecosystem-Based Fisheries Management (EBFM), maximum sustainable yield (FMSY), and half of the maximum sustainable yield (FMSY). Rows show trends for the various trophic groups. Solid lines depict the predictions generated using the reference model while shaded areas indicate approximate 95% confidence limits.
The no-fishing scenario was included to test model robustness, because the removal of top predators with highest consumption (i.e. combined fisheries in the WBS model) may lead to chaotic development and unrealistic predictions. However, in the absence of fishing none of the trophic groups collapsed or overshot realistic limits of carrying capacity (Figure 4). The main species in the system, cod and herring, are predicted to interact in a way that herring biomass rebuilds first and faster, leading to a herring-dominated regime (Köster and Möllmann, 2000), followed by cod recovery such that herring is increasingly controlled and finally balanced by predation pressure. The model predicts sprat restoration above the 1990s levels, but the role of this species remains of secondary importance compared to herring. Flatfish biomass peaks after 2021, when the group is the largest of the system, but its biomass declines thereafter and flatfish become less important than herring.
The business-as-usual (BAU) scenario continues average fishing mortality (F) of 2015-2019 until the end of the simulation. Under this scenario (Figure 4), cod biomass declines even below the 2019 level (-8%), herring stock biomass decreases towards the end of the time series by about 40% compared to 2019 while the biomass of sprat and flatfish slightly increases. These results suggest a shift compared to the 1990s from a cod and herring dominated system to a food web where sprat and flatfish are prevalent. Catches of cod in the decade 2041-2050 stabilize around the values recorded in 2016. Catches of herring are lowest compared to all other management scenarios and decline towards the end of the time series by 44% compared to the level of 2015-2019 (Figure 5). Catches of sprat and flatfish slightly increase compared to 2019 (i.e. in 2041-2050, sprat and flatfish catches are 1% and 12% higher, respectively); sprat catches are highest compared to all other scenarios suggesting that it benefits from the depletion of cod and herring.
The FMSY scenario (Figure 4) leads to an improvement of the ecosystem because it ends the high fishing rates applied in the BAU scenario. In comparison to 2019, during the period 2041-2050 the biomass of all stocks increases except flatfish (-55%), with stock sizes growing about six-fold for both cod and herring. During the same decade, the FMSY scenario predicts that catches of cod double compared to 2019 while herring catches are five times more than in 2019 (Figure 5). Comparing predicted cod catches for 2050 against 2020 they amount to almost five times the initial value.
The more precautionary half FMSY scenario (Figure 4) applies F values that are 50% of those adopted under the previously described FMSY scenario and except for flatfish (-41%), this scenario results in a strong recovery of all stocks; compared to 2019, during 2041-2050 the biomass of cod and herring increases seven-fold. In the same period, catches of cod, herring, sprat and flatfish are not as high as under the FMSY scenario (Figure 5). Of the fisheries scenarios, this one leads to the lowest catches in 2020 for all fish groups but flatfish.
The Ecosystem-Based Fisheries Management (EBFM) scenario (Figure 4) implements rules as keeping fishing pressure below the maximum level (here: 0.8 FMSY), applying especially low F values (here: 0.5 FMSY) to key species such as herring and sprat, and setting catches of juvenile cod to zero (Pikitch et al., 2004). As a result, when comparing average stock sizes in 2041-2050 to those in 2019, biomass of all groups except flatfish increases under EBFM. In the period 2041-2050, cod and sprat attain slightly lower stock sizes (-4% and -0.2%, respectively) while herring biomass equals its total under the half FMSY scenario. In all cases, stocks under EBFM are larger than in the FMSY scenario. Level of catches for cod, herring and flatfish are intermediate when compared to the FMSY and half FMSY scenarios; sprat catches equal their total under the half FMSY scenario while they decline compared to the FMSY scenario. In the EBFM scenario, 2050 catches of cod increase by 30% while herring catches exceed those under BAU threefold. Catches of sprat decrease 53% and flatfish catches increase 14% when comparing EBFM and BAU scenarios in 2050 (Figure 5).
A comparison between outcomes of all simulations shows that harbour porpoise biomass is expected to achieve the best recovery under the EBFM and half FMSY scenarios, attaining in the period 2041-2050 an average size of about 80% of the scenario without fishing. The FMSY scenario ensures the recovery of the population without reaching the levels of previous scenarios. With BAU, harbour porpoise continues to decline towards a probable local extinction (Figure 4). Under BAU conditions the diet of harbour porpoise consists mostly of other demersal fish, whereas under the EBFM scenario the diet consists mainly of herring, and is very similar to the one found in the absence of fishing (Figure S7). Fishers often complain that birds, seals and harbour porpoises are competitors responsible for the poor state of cod, herring and sprat stocks. However, medium-term predictions for cod, herring, and sprat under BAU conditions show that these groups taken together consume only a fraction of the amount taken by the fishers (Figure S8).
In summary, predictions for major fish groups in the WBS suggest a continuation of low biomass and catch, and a decline with potential loss of harbour porpoises under the BAU scenario. Fishing at FMSY rebuilds all stocks except flatfish, albeit with lower biomass levels compared to the subsequent two scenarios. Fishing at half FMSY shows the best rebuilding of biomass for all commercial species but herring, which exhibits the largest stock size with EBFM (Table S12). This may be attributed to an increase in biomass of predators such as harbour porpoise and cod, or derive from the competition between sprat and herring. The EBFM scenario accounts for the need to reduce fishery impact on key species such as herring and sprat. Herring, in particular, shows the highest keystone index value as a single fish species transporting matter from the low trophic levels to predators feeding towards the top of the trophic chain (Figure S4). Under the EBFM scenario, there is good development of biomass both for cod and herring, and to a lesser extent for sprat. Moreover, cod and herring catches increase significantly in 2050 compared to average values of the period 2015-2019 (68% and 50% more, respectively). Catches of flatfish slightly increase (+18%) compared to the average value in the period 2015-2019, but with largely reduced fishing effort and thus lower cost of fishing. Flatfish exhibit a decrease of stock size while sprat is the only group experiencing a decline in catches. Values of biomass recorded for EBFM are all higher than in the FMSY scenario while all catches found with FMSY outscore those of EBFM. Stock size and catch of all fish groups are similar when comparing EBFM to the half FMSY scenario and only herring shows higher values for both biomass and catch in the EBFM scenario.
3.2.2 Exploring ecosystem development under multiple stressors
The predictions obtained using fisheries management scenarios were driven by alternative fishing mortality combinations. Under the assumption that future environmental conditions will change compared to average values in years 1994-2019, new simulations considering variations in phytoplankton biomass and impact of ocean warming on western Baltic cod, herring and sprat recruitment were performed. Responses to these stressors in isolation and combined across BAU and EBFM scenarios were quantified by averaging the values during last 20 years of long-term (2081-2100) scenarios.
In all stressor scenarios, the biomass of herring and western Baltic cod returned by the reference model was larger under EBFM (Figure 6). However, considerable uncertainty surrounded many estimates except for flatfish and, in some cases, adult and juvenile cod. Biomass changes triggered by warming are comparable in magnitude with those predicted when decreasing the phytoplankton biomass (-25%) although flatfish do not seem to be particularly responsive. Flatfish are not sensitive to changes in phytoplankton biomass because they feed mostly on benthic macrofauna and do not depend on the pelagic grazing chain (Figure 2). Moreover, ocean warming may influence flatfish only indirectly as no impact on their recruitment was modelled. The uncertainty of predictions is always larger under BAU and attains extreme levels for herring. In the case of herring, marginal impacts caused by increasing temperatures, which also depend on the direct negative effect on recruitment modelled according to Polte et al. (2021), are more evident than for other fishes and partially buffered by EBFM. All findings persist with simulations that include the presence of eastern Baltic cod in SD 24 (Figures S9 and S11).
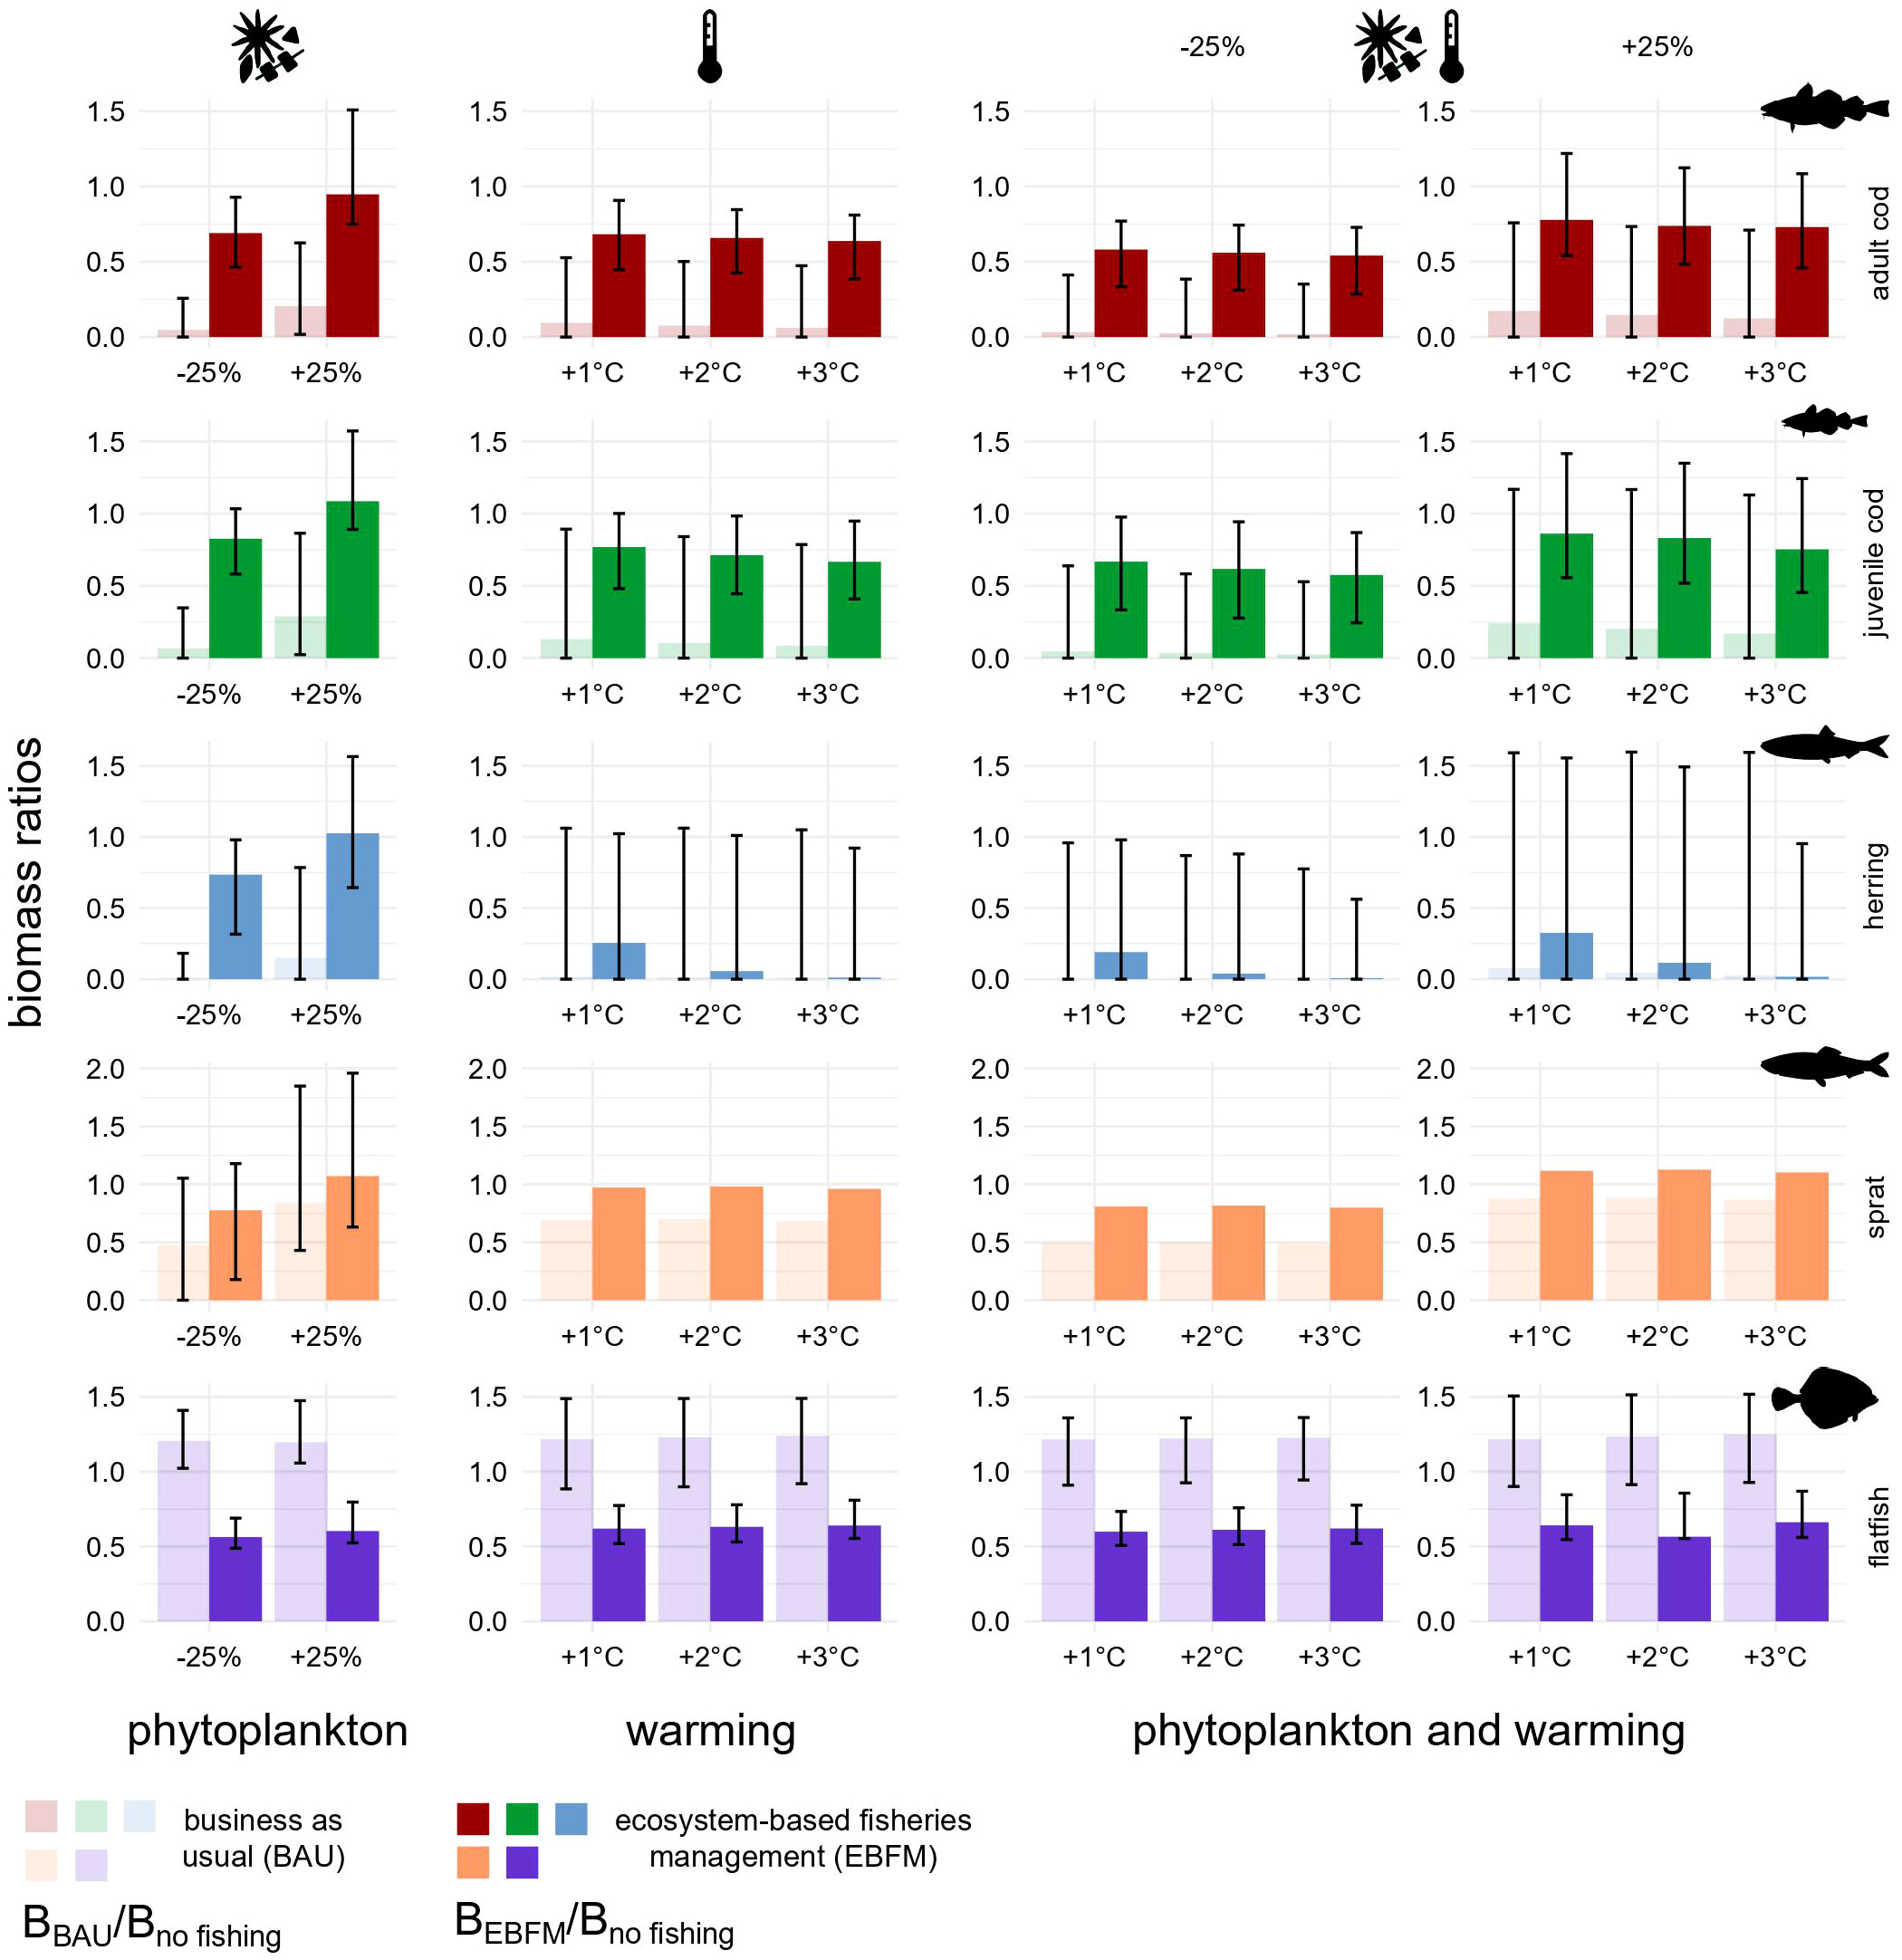
Figure 6 Biomass ratios under fishing pressure plus phytoplankton biomass change, ocean warming, or all factors in combination. Each bar illustrates the ratio between the biomass under BAU (transparent) or EBFM (opaque) and the no-fishing scenario biomass, all quantified using reference runs. Ratios equal to 0.5 indicate BMSY. Biomasses were computed as the average of values estimated for the last 20 years of each simulation (2081-2100). Error bars were built using the corresponding Monte Carlo randomizations and show 2% and 98% percentiles as lower and upper bounds, respectively. Under all warming scenarios, sprat bar plots do not have error bars because its stock biomass was used as forcing factor.
In most stressors scenarios, catches of herring and flatfish under EBFM exceed those found with BAU (Figure 7). The same pattern holds true for adults of western Baltic cod, except when phytoplankton biomass was assumed to increase by 25%. The scenario based on changes in phytoplankton biomass is the only one considered for sprat. Its biomass was in fact the forcing factor used for all other simulations as it reflects increases of recruitment triggered by warmer waters. For sprat, fish extraction is always higher under BAU, irrespective of the direction of phytoplankton biomass change (Figure 7, first column), due to the concurrent decline of its main food web competitor (i.e. herring). Yields predicted for herring in presence of all three stress factors (Figure 7, last two columns) were the sole responses sometimes exhibiting higher uncertainty under EBFM than under BAU. Robustness and consistency of the findings are confirmed by other simulations executed considering the presence of eastern Baltic cod in SD 24 (see Figures S10, S11).
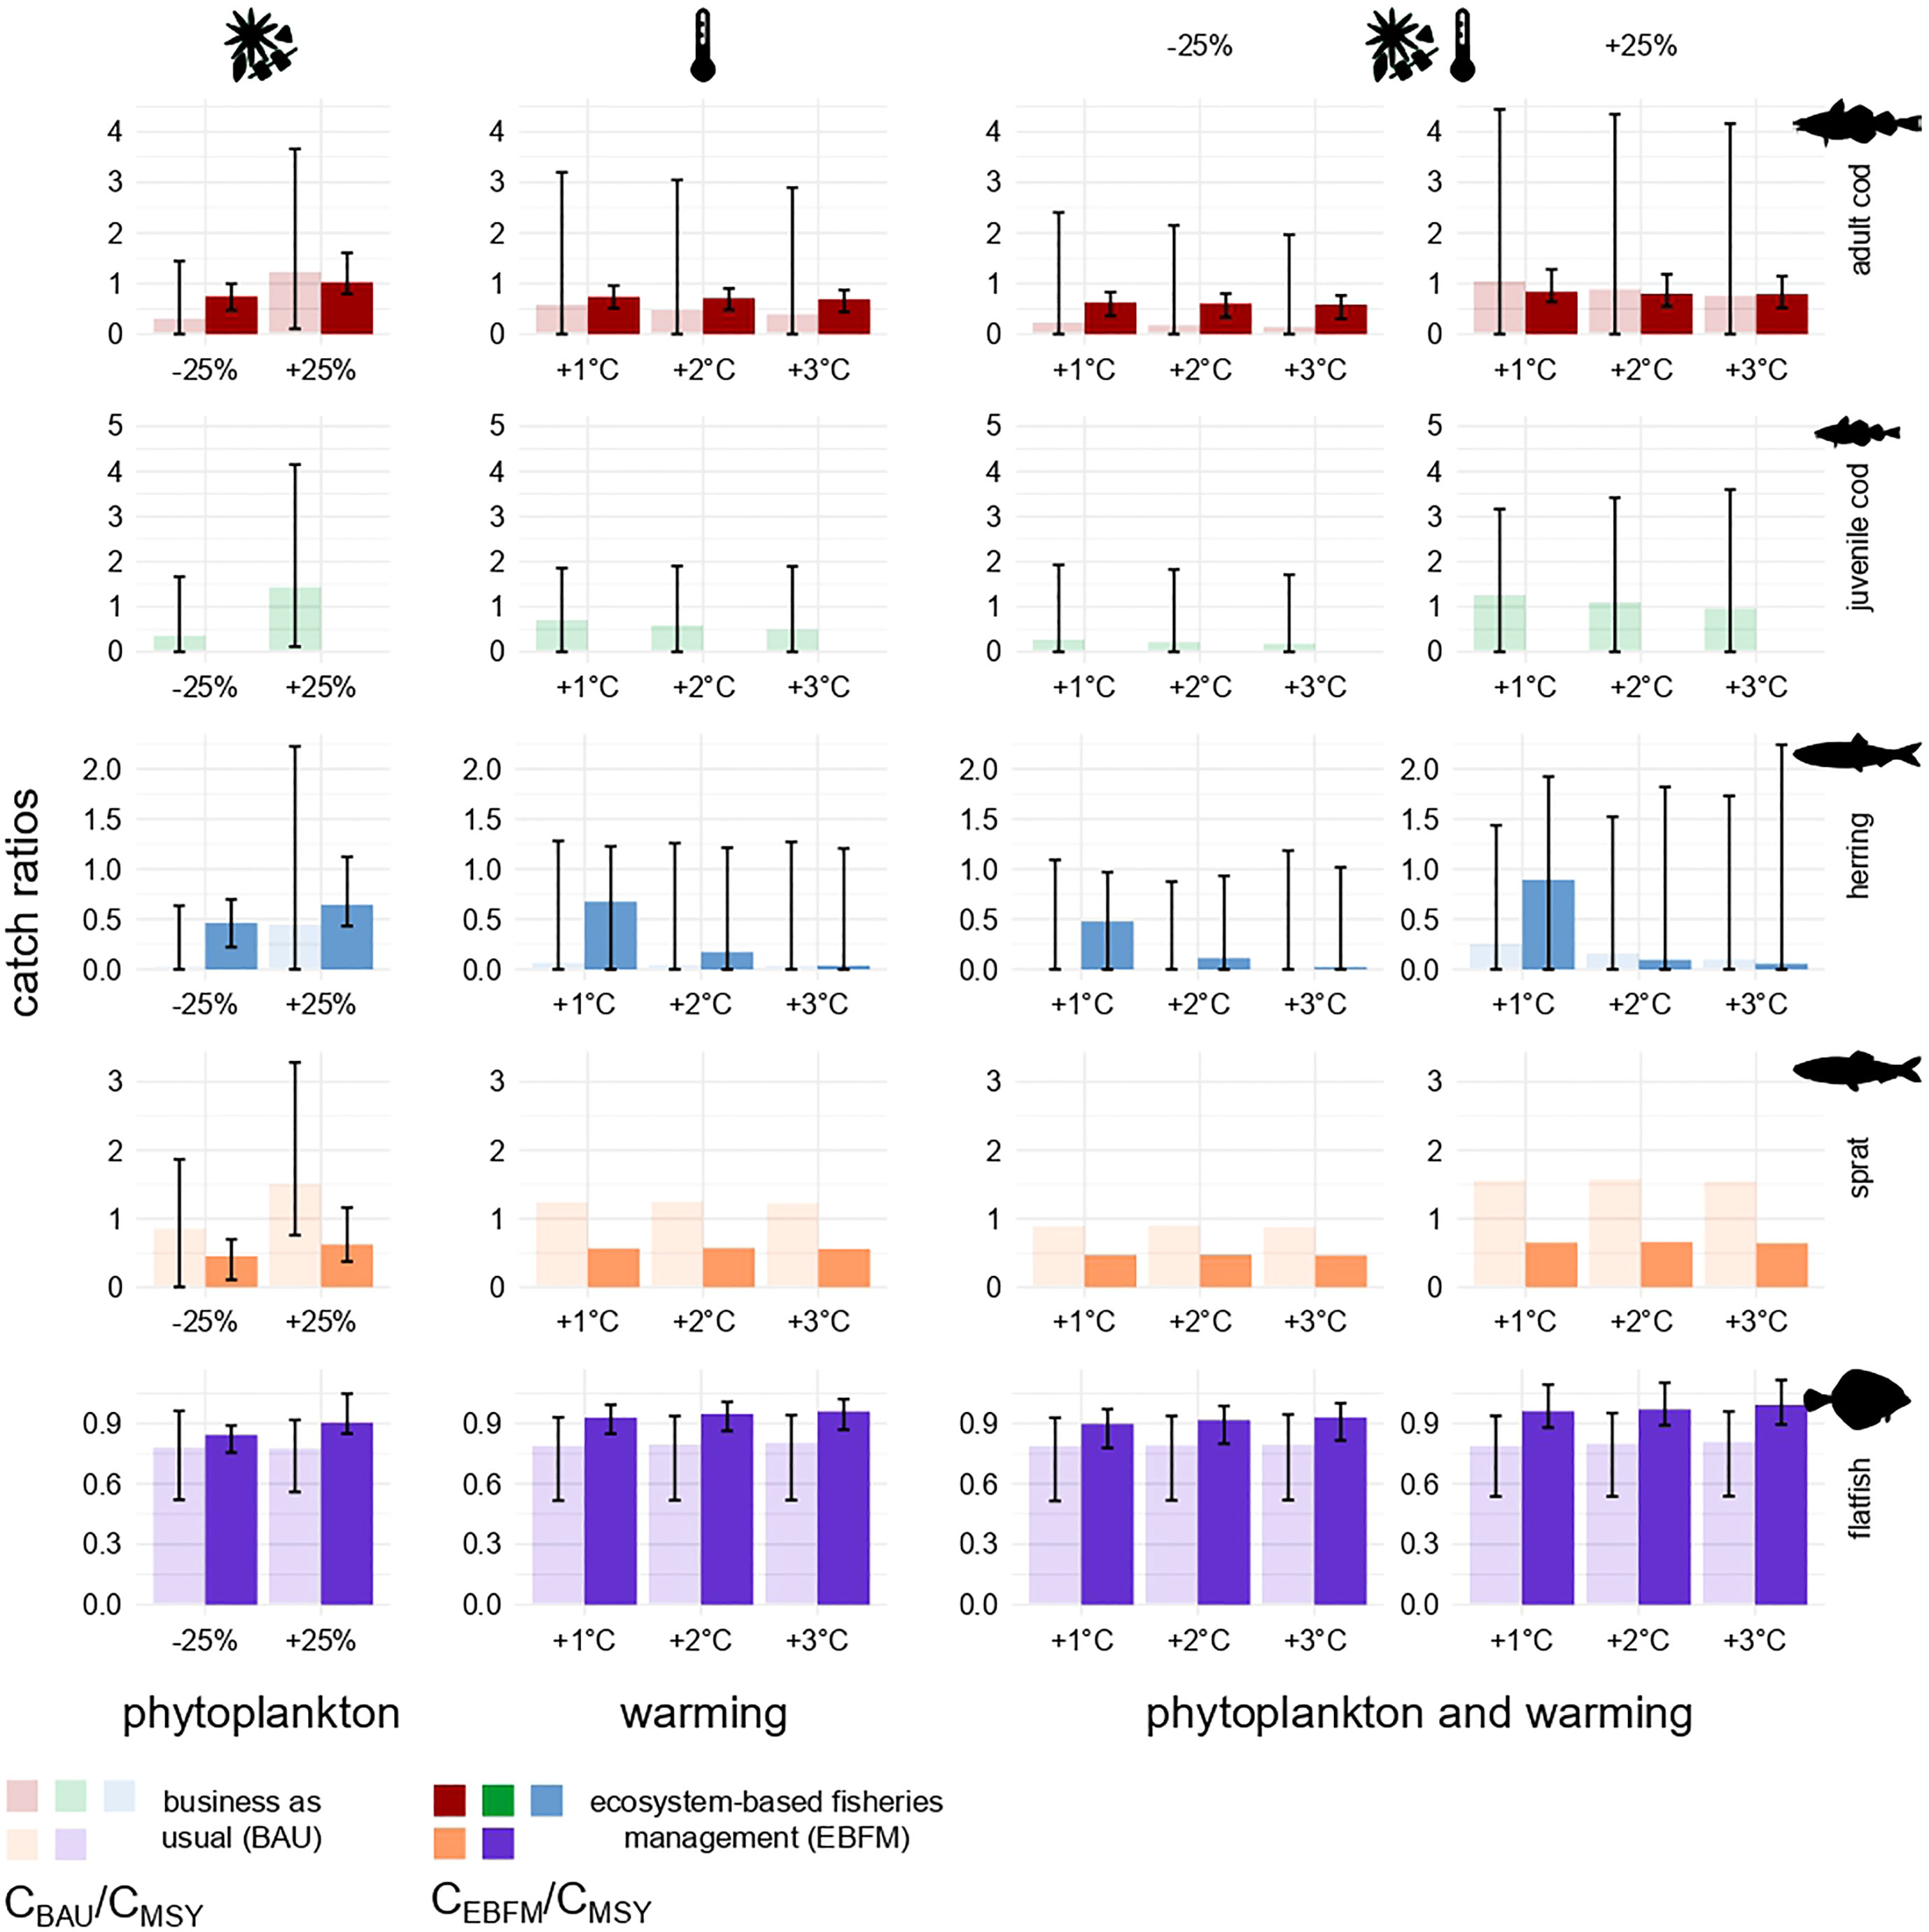
Figure 7 Catch ratios under the impact of fish extraction plus phytoplankton biomass change, ocean warming, or all factors in combination. Each bar illustrates the ratio between the catch under BAU (transparent) or EBFM (opaque) and FMSY catch, all quantified using reference runs. Ratios equal to 1 indicate the CMSY level. Catches were computed as the average of values estimated for the last 20 years of each simulation (2081-2100). Error bars were built using the corresponding Monte Carlo randomizations and show 2% and 98% percentiles as lower and upper bounds, respectively. Under all warming scenarios, sprat bar plots do not have error bars because its stock biomass was used as forcing factor.
3.2.3 Exploring carbon sequestration under BAU and EBFM
Comparative analysis shows carbon sequestration caused by the four commercial targets occurs at a rate that under EBFM is 3.4 times faster than with BAU. Uncertainty analysis indicates that EBFM results in carbon sequestration rates 2.5 to 4.6-fold greater than BAU (2% and 98% percentiles, respectively).
4 Discussion
4.1 Quality of the 1994 WBS model
The Ecopath model for 1994 combines all living components of the WBS ecosystem and quantitatively connects them via their diet. The WBS food web in 1994 was a system already under stress as indicated by the high ecotrophic efficiency for all fish species and trophic groups. Such values reflect heavy exploitation of fish where annual consumption — largely driven by fisheries and to a lesser extent by natural predators — approaches annual production. Therefore, when the EE of a trophic group is close to 1 there is no scope for its biomass increase while low EE stands for the fact that only a small fraction of production is utilized within the ecosystem.
The WBS is not a closed system: water mass inflows and outflows transport organisms actively swimming and drifting therein, meanwhile harbour porpoises, birds, and other predators actively search for food in nearby ecosystems. In the Ecopath base model for 1994, this was accounted for by assuming import or immigration of scarce food items. An important Ecopath rule is that such exchange with neighboring systems may not exceed the production of matter within the model system. Summary statistics for the model area showed a total system production of 632.1 gC m-2 y-1. Such production largely exceeds exports out of system boundaries (0.2 gC m-2 y-1) and carbon flows entering the system as imported food through mobile organisms (i.e. birds and harbour porpoises) or flatfish immigration, which altogether amount to 0.04 gC m-2 y-1.
Herring is a key species in the WBS (Essington and Plagányi, 2013) and, in terms of energy transfer to higher trophic levels, far exceeds similarly planktivorous sprat; the Ecopath modelling showed consumption of zooplankton by herring was 63% greater than sprat (1.5 gC m-2 y-1 vs. 0.92 gC m-2 y-1). Herring relevance may be attributed to its biomass, as its stock size is more than twice that of sprat, and may be due to higher trophic flows predicted by the model as herring is consumed in larger amounts than sprat.
There is a strong need for higher quality input data — especially surrounding catch and bycatch values — for top predators (Table S6) such as harbour porpoises, seals, and birds. For the 1994 Ecopath base model, the seal biomass was very low and the two species composing the compartment, P. vitulina and H. grypus, might have been grouped with harbour porpoise into a single marine mammals’ cohort. However, harbour porpoises was treated separately because they are threatened by extinction and thus of special concern in the WBS. The different dietary needs between harbour porpoises, which are particularly dependent on energy-rich food and must eat constantly to meet high metabolic energy demand (Read and Hohn, 1995; Wisniewska et al., 2018), and seals also justify their separation. Birds are a unique case spanning several trophic levels composed of benthic macrofauna eaters such as ducks, and fish eaters such as seagulls and cormorants while also comprising migratory and non-migratory species (ICES, 2016). For these reasons, the discussion focuses mainly on fish and harbour porpoise.
4.2 Quality of the EwE predictions
Catch and biomass predictions for the years 1994-2019 obtained with fishing mortality as a driver match values of stock size and catch remarkably well. This finding directly supports the hypothesis that the depletion of cod and herring in the WBS and the retraction of sprat towards the northern central Baltic were not primarily caused by changes in carrying capacity but were driven by overfishing (ICES, 2020f; Möllmann et al., 2021; Froese et al., 2022).
The foraging arena concept, expressed in EwE through a vulnerability parameter of prey towards their predators, has the effect of “dampening the unrealistically large population fluctuations usually predicted by the Lotka-Volterra formulation” (see Plagányi and Butterworth, 2004). Vulnerability parameters are usually difficult to estimate and default values of 2 were therefore adopted. Another EwE routine allows performing uncertainty analysis by exploring effects of random changes in input parameters through Monte Carlo simulations (see Heymans et al., 2016). Running 1000 such Monte Carlo simulations resulted in only a negligible change in the SS, which decreased from 67.17 to 62.83, suggesting that model outcomes are robust to single changes in inputs.
The following aspects and trends underpin the trustworthiness of model predictions. (1) Juvenile and adult cod are being treated as interdependent development stanza (i.e. life history stages) and the resulting modelled relationship between juvenile and adult cod biomass (Figure 8) resembles the expected hockey-stick stock-recruitment relationship (Froese et al., 2016a; see Figure S1 and related text in the Supplementary Materials). (2) Most ecosystem models enter states where some stock sizes crash or explode when left unchecked for an extended period, but no such behaviour was displayed in the WBS model. Under the no-fishing scenario, no group collapses or increases indefinitely, and without fishing all groups attained equilibrium levels that seem to be reasonable representations of their carrying capacity when compared with historic values or typical stock sizes (see Figures 4 and S5). The stability of the no-fishing scenario adds to the results of pre-balancing (PREBAL) diagnostics (Figure S2) and suggests the parameterization of the model is meaningful and robust. Thus, in the WBS model for the year 2019 stock sizes of cod and herring reached 13% and 12%, respectively, of their carrying capacity. (3) Köster and Möllmann (2000) suggested the existence of two stable states for the Baltic Sea ecosystem, one dominated by herring and the other one by cod. Model predictions without fishing (Figure 4) showed that a herring-dominated state would establish first since herring biomass increases faster (2020-2030). After peaking at 0.59 gC m-2 in 2027, the herring stock slightly declines and then levels off at density values of around 0.57 gC m-2 (2081-2100) under the top-down control of predators. (4) Finally, the present findings are supported by previous research: based on an ecosystem model for the central and eastern Baltic Sea by Harvey et al. (2003); Hansson et al. (2007) predicted a continued and ultimately drastic decrease of the herring and cod populations under a status quo scenario similar to the BAU scenario in the WBS model.
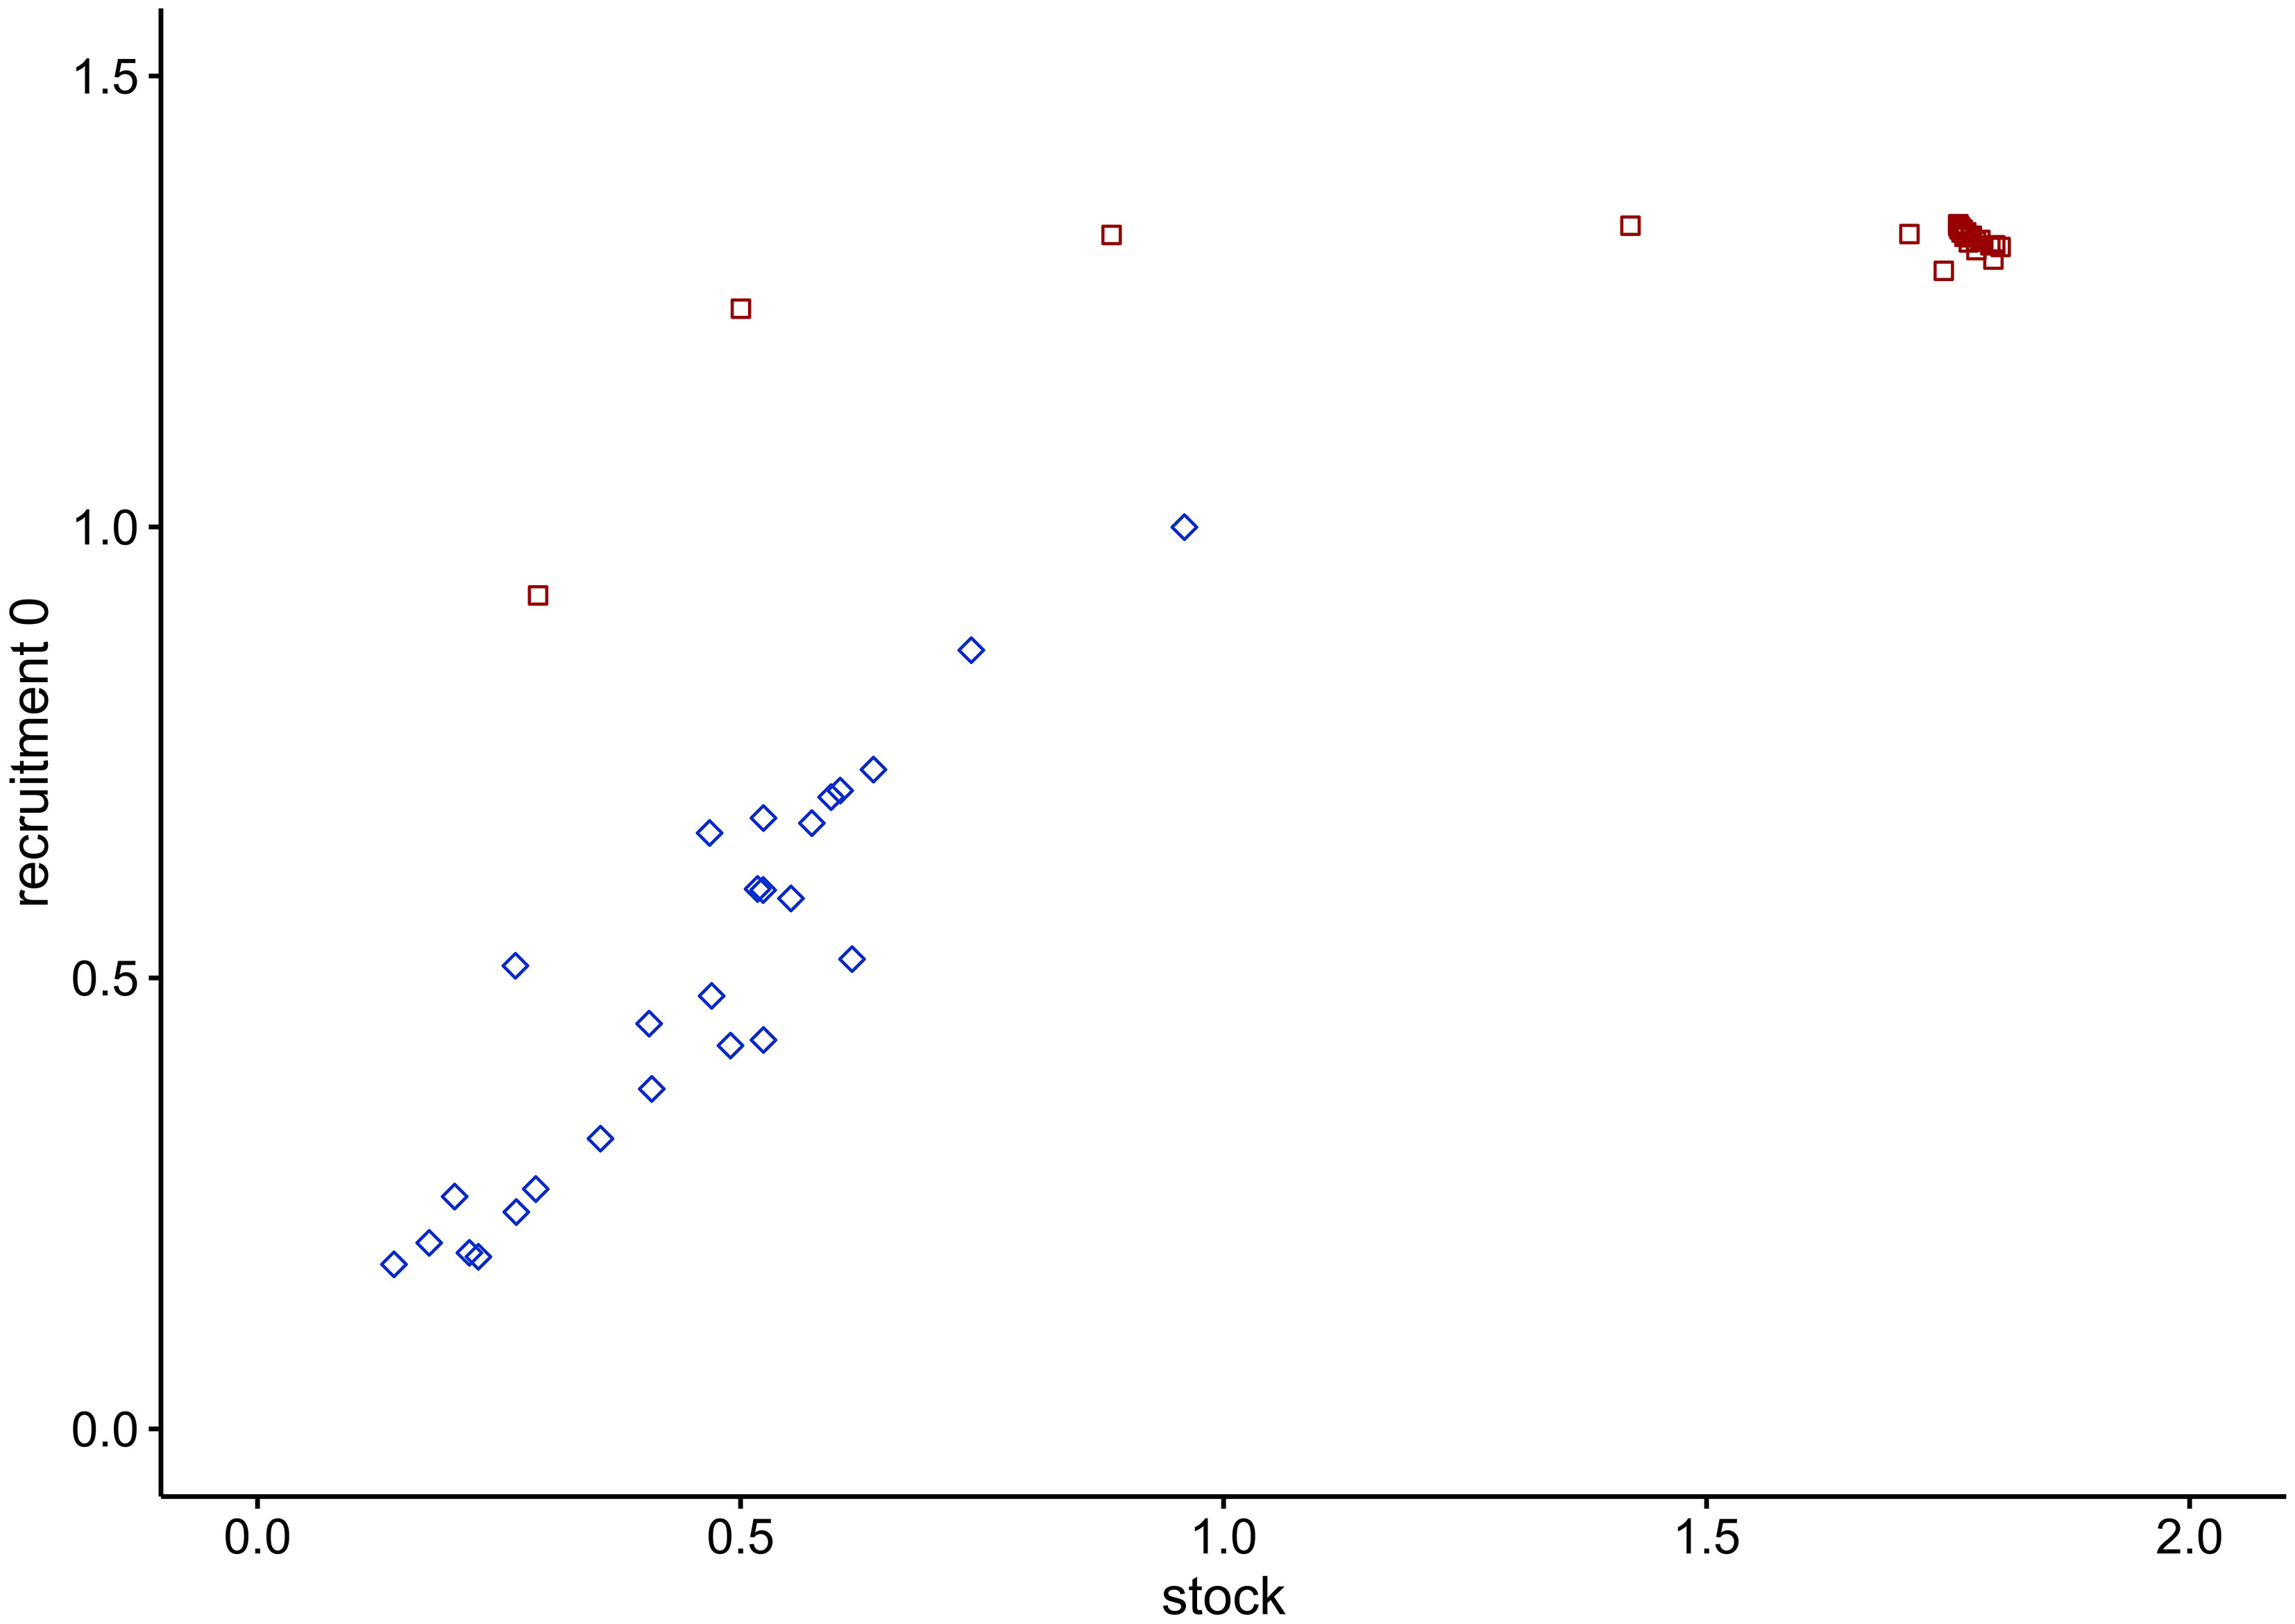
Figure 8 Stock-recruitment relationship of cod in the WBS ecosystem. Blue squares depict the trend from 1994 to 2019 after fitting of the model; red squares illustrate the time series from 2020 to 2100, with predictions obtained under the EBFM scenario.
4.3 Correction of misconceptions
A number of misconceptions exist about the trophic relations in the WBS. One of these predicts that an increase in adult cod biomass would intensify the rate of cannibalism on juvenile cod (ICES, 2013b). However, our model shows that if fishing pressure is reduced herring biomass increases and so does its relative importance in adult cod diet. Because of such dietary shift, the cannibalism on juvenile cod plays a minor role in meeting the energy demand of adult cod. This is evident in the stock-recruitment relationship, which emerged from the model (Figure 8): after an early peak, the number of juveniles should continuously decline with increase in biomass of cannibalistic adults but this does not happen.
Another misconception is that birds (especially cormorants) consume a large fraction of cod and herring. The model illustrates that under the BAU scenario the joint consumption by birds, seals and harbour porpoises on cod, herring, and sprat, under medium-term time scale (2041-2050), is less than the extraction by fisheries. Similarly, Hansson et al. (2018) found that in the Baltic Sea the competition between marine mammal and seabird predators and fishers for the consumption of herring, sprat and cod is negligible.
A third misconception is that the lack of nutrients may limit primary production in the WBS. Our model suggests that about 1.2% of the primary productivity is required for the current regime of catches of the commercially most relevant fish stocks (Table S11). This number is very low compared to the usual 24-35% of other coastal systems (Pauly and Christensen, 1995). It suggests that the biomass of herring and sprat is presently too low to transport large amounts of energy from zooplankton to upper trophic levels and fisheries. Instead, much of the production goes to detritus and increases the extension of oxygen-deficient zones8 (Hammarlund et al., 2018).
4.4 EBFM for the WBS
One reason for implementing EBFM is to balance good fishing yields with stock sizes that enable both prey and predators to fulfil their natural roles in the ecosystem. Although no generally accepted framework exists to make such judgement, stock sizes larger than two-thirds of the unfished stock offer safe assumptions. Comparing the predicted stock sizes for cod and herring under the EBFM scenario with the respective stock sizes during the herring-dominated regime in the no-fishing scenario indicates a relative stock size of about 80% for both cod and herring (Figure 4). Another reason for implementing EBFM is the restoration of species threatened by extinction or otherwise sensitive to fishing, such as harbour porpoises, seals and birds. Future model developments should devote increased attention to the role of top predators. The current grouping of birds is in fact insufficient to explore the impact of different fisheries scenarios because it combines species with diverse traits and feeding habits.
The CFP (2013) and the MSFD (2008, 2017a, 2017b) of the EU call for the implementation of Ecosystem-Based Fisheries Management in European seas, now a legally binding principle for managing the entire marine environment of the EU (MSFD, 2008; EU COM, 2020), with the objective to minimize negative impacts of fishing and to safeguard biological wealth and natural functioning of ecosystems. To abide with these objectives, multiannual management plans shall take into account knowledge about the interactions between the fish stocks, fisheries and marine ecosystems. While enabling a sustainable use of marine goods and services, priority should be given to achieving and maintaining good environmental status. This requires that pressures of human activities do not exceed levels that compromise the capacity of ecosystems to remain healthy, clean and productive. With these obligations from the MSFD, the entire spectrum of species (including non-commercial fishes) and habitats in European seas must be included in management decisions (Kreutle et al., 2016). For the assessment of the good environmental status, the EU Commission (MSFD, 2017a; MSFD, 2017b) laid down criteria and methodological standards for ecosystems, including food webs, and yet in the Baltic Sea, several EU member states have not assessed many aspects for Descriptor 4 in their MSFD reports to the EU Commission (HELCOM, 2018b; EU MSFD Art. 8 report9). The WBS model addresses most of these legal requirements and allows, for the first time, a comprehensive assessment of the MSFD criterion D4C2, referring to not adversely affecting diversity, abundance and balance of trophic guilds.
While common sense implementations of EBFM have been proposed (Pikitch et al., 2004; Froese et al., 2016b), such as fishing all stocks below FMSY and reducing fishing pressure even further for forage fish like herring and sprat (Pikitch et al., 2012), few studies have explored a range of alternative fishing scenarios. This study shows for the first time for the WBS that, without changes to the present fishing regime, low biomass and catch will continue. This was certainly the case for the post-hindcasting years 2020 and 2021, when cod and herring biomass reached all-time lows (ICES, 2021a; ICES, 2021b). The business-as-usual scenario also predicts that without a rescue effect from the Belt Sea where harbour porpoises occur at high abundance, the decline of these mammals in the WBS persists. The average density of harbour porpoises under BAU conditions is expected to attain 0.106 individuals per km2 (Table 3), which is in the range of values found in the WBS during the 1990s (Table 1 in Scheidat et al., 2008); such densities might improve with increasing attention dedicated to the reduction of bycatches (Chladek et al., 2020). Under all scenarios, most trophic groups respond quickly when levels of fishing mortality are altered, and fish stocks and catches attain novel equilibrium levels within five years from the implementation of new management strategies (Figures 4 and S5). Instead, the harbour porpoise biomass reaches new equilibrium states after 2050 in every scenario, indicating that the recovery of the population is a long-term process. The delayed response of the harbour porpoise confirms that top predators occupy as consumers very fragile food web positions, which make them particularly vulnerable (see Scotti and Jordán, 2015).
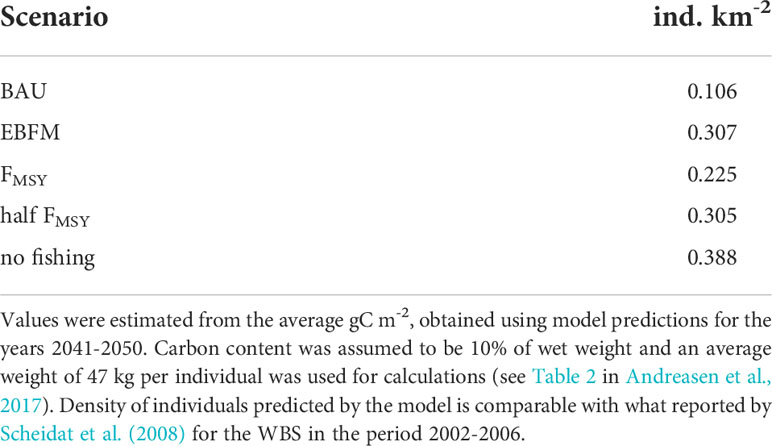
Table 3 Impact of alternative fishery scenarios on harbour porpoise density in the WBS.
Although the WBS model was developed for an ecosystem with unique features, it demonstrates a procedure that could be applied more generally. Ecosystem-based fisheries management, proposed for the sustainable use of resources and biodiversity conservation, was built according to some fundamental principles of fisheries and ecology that can be extended across ecosystems. This study shows that fishing mortality must always lie below FMSY for sustainable extraction of fish biomass and that food web position is integral to describe ecosystem-level effects including indirect effects, such as the threatening of top predators by the decline of energy supplied by forage fishes (i.e. when fished > FMSY) in case of their excessive exploitation.
4.5 EBFM enhances resilience to ocean warming and phytoplankton changes
The Baltic Sea ecosystem is affected by multiple stress factors including nutrient pollution, deoxygenation, ocean warming and acidification (Reusch et al., 2018); these stressors act concurrently and their effect may be exacerbated in the presence of heavily depleted stocks (Möllmann et al., 2021; Polte et al., 2021). Although excessive fish extraction represents the primary and most pervasive cause behind the collapse of iconic stocks like western Baltic cod and western Baltic spring-spawning herring (Froese et al., 2022), this study also developed a wider view of future scenarios that account for changes in phytoplankton biomass and ocean warming. Nutrient enrichment enhances phytoplankton productivity leading to increased density. Phytoplankton degradation stimulates oxygen consumption and results in hypoxic or anoxic conditions, which threaten suitable habitats for fish spawning (e.g. seagrass ecosystems) and impair the recruitment of herring and cod (Hüssy et al., 2016; Kanstinger et al., 2018). Ocean warming has been shown to have overall detrimental effect on herring and cod recruitment as it shortens the temperature window for successful hatching and increases the hypoxia (Dodson et al., 2019; Voss et al., 2019). These aspects were simulated with extra runs of the EwE model with main findings that (1) under all stressors scenarios, EBFM always ensures the best stock recovery compared to BAU, except for flatfish (Figure 6); (2) warming always affects negatively catches of adult cod and its impact may exceed benefits of bottom-up forcing caused by 25% raise of phytoplankton biomass (Figure 7); and (3) the uncertainty associated to predictions that take into account multistressors is generally larger under BAU than under EBFM (Figures 6, 7) — presumably because of the reduced resilience of stocks at low biomass. Results illustrate that EBFM is compatible with the long-term, sustainable use of resources. It preserves the resilience of the WBS food web, making suitable safeguards that balance between trophic groups and to maintain the productivity of the main commercial fishes in response to warming and varying phytoplankton concentrations. Under ocean warming and with the decrease of phytoplankton biomass, EBFM allows the stock size of adult cod to exceed levels attained in the early 1990s while total catches remain below the values reported for that decade. Fish extraction shows a leading role in determining stock status in the WBS, which agrees with findings of another ecosystem model built for the central Baltic Sea (Niiranen et al., 2013).
Recently, Bianchi et al. (2021) showed that fisheries play a relevant role for ocean biogeochemistry. Biomass decline caused by fisheries accompanied drastic changes at global scale, reducing biomass cycling roughly 40% compared to levels attained during the preindustrial period. In the WBS, clear-cut differences emerge when quantifying carbon sequestration under BAU and EBFM scenarios: larger stock sizes found with EBFM support larger carbon flows (i.e. natural mortality, urine and faeces) towards detritus compared to BAU, suggesting about three times higher carbon sequestration under EBFM.
4.6 Limitations and caveats
EwE is suitable to assess how altering biomass of specific trophic groups spreads effects throughout the food web given explicit interaction terms from primary producers to top predators. The whole-ecosystem approach implemented in EwE (and allowed by other software tools such as Atlantis; see Forrest et al., 2015) is ideal for investigating the impact that primary production has on higher trophic level consumers. Differently, MICE and OSMOSE are less suitable for modelling such a bottom-up forcing on all compartments, due to their focus on a selected set of trophic groups (Plagányi et al., 2011). Conclusions drawn from ecosystem models should always be assessed within the limited capabilities of the software program used and assumptions made during model building. A summary of the main caveats and limitations in the EwE model of the WBS include: First, fishing efforts are constant and do not vary in response to changing biomass, indicating the absence of any feedback to management following stocks recover or decline (Chagaris et al., 2015). Second, the importance of marine protected areas for reconstituting stocks and conserving endangered species cannot be evaluated since the model does not consider spatial dynamics. However, an Ecospace version could be developed from this EwE model, thus allowing to replicate Ecosim over a 2D grid (Christensen and Walters, 2004). Spatial dynamics are especially relevant for high trophic level groups which are typically patchy and highly mobile. In the case of the WBS, the integration of EwE with Ecospace could provide clearer mapping of marine mammal feeding grounds for juvenile cod and herring. Third, feeding preferences are an input to Ecopath, stored in the diet composition matrix with the static architecture of trophic interactions. Together, they influence predator consumption rates, which linearly increase as a function of prey biomass (Plagányi and Butterworth, 2004). These features differ from those of two other popular end-to-end ecosystem models such as Atlantis and OSMOSE (Table 1 in Smith et al., 2015). For instance, the spatio-temporal co-occurrence and size-based constraints regulate the likelihood of trophic interactions in the individual-based framework of OSMOSE, making it more suitable to model an opportunistic feeding behaviour while specialized diets are better described in EwE (Travers et al., 2010). Fourth, metabolic parameters used for the 1994 Ecopath model define the starting conditions for Ecosim. These parameters do not vary under simulation, a feature that prevents the modelling of any evolutionary response to changing environmental conditions. Finally, the WBS model considers ontogeny with the multi-stanza routine (i.e. juvenile and adult cod) but a higher number of age classes and, consequently, of feeding interactions might have emerged from Atlantis and OSMOSE (Table 1 in Smith et al., 2015).
5 Conclusions
The trophic model presented here shows for the first time the “big picture” of the WBS food web by quantifying structure and flows between major trophic groups. The model is a preliminary but thermodynamically sound hypothesis of the WBS food web, especially useful for the assessment of broad trophic guilds as required by European law. Results show that the fishing pressure presently exerted on organisms within the WBS forces top predators such as harbour porpoises and seals, but also cod and other demersal fish, to compete heavily for fish as food. A common strategy adopted to cover their dietary needs is to shift consumption towards organisms lower in the trophic web, mainly benthic macrofauna. Highly mobile organisms like the harbour porpoise may search for suitable prey in adjacent ecosystems such as the Kattegat, Skagerrak, central Baltic Sea and North Sea. Simulations show that the business-as-usual scenario would perpetuate low catches from depleted stocks in an unstable ecosystem where endangered species may be lost. In contrast, the EBFM scenario allows rebuilding of the harbour porpoise population and the recovery of all stocks except flatfish, with strongly increased catches well above the present levels for cod and herring. EBFM confers resilience to the WBS food web, making it less susceptible to changes exerted by increased phytoplankton biomass and ocean warming. It results in lower levels of uncertainty for future predictions on catches, a desirable condition to plan management actions (see modern portfolio theory; Runting et al., 2018). At larger scales, EBFM improves carbon sequestration as required for slowing climate change, only furthering the urgent reasons to abandon business as usual and adopting the legally required ecosystem-based fisheries management.
Data availability statement
The original contributions presented in the study are included in the article/Supplementary Material. Further inquiries can be directed to the corresponding author.
Author contributions
MS, SO, and RF conceived the study. SO built the reference model. MS assembled the alternative models, and performed new simulations and uncertainty analysis. All authors contributed to manuscript preparation and approved the final version. None of the authors has any conflicts of interest to declare. This manuscript has not been published nor is under consideration for publication elsewhere.
Funding
The German Federal Agency for Nature Conservation (Bundesamt für Naturschutz, BfN) provided financial support to MS, SO, LM, and RF with funds from the Federal Ministry of the Environment, Nature Conservation and Nuclear Safety (BMU), under the grant agreement FKZ: 3521532201. MS, SO and LM received further support from the German Federal Ministry of Education and Research (BMBF) through the project balt_ADAPT (Adaptation of the Western Baltic Coastal Fishery to Climate Change, grant no. 03F0863). MS and LM are also thankful to the EcoScope Project, which received funding from the European Commission’s Horizon 2020 Research and Innovation programme under grant agreement No 101000302.
Acknowledgments
ECOLAB (FTZ Büsum) gave information on marine mammals and birds. M. Zettler (IOW, Warnemünde) helped with quantitative information on benthic macrofauna and meiofauna. C. Garilao provided valuable technical support. Two reviewers are kindly acknowledged for their constructive and helpful comments, which substantially contributed to improve the manuscript.
Conflict of interest
The authors declare that the research was conducted in the absence of any commercial or financial relationships that could be construed as a potential conflict of interest.
Publisher’s note
All claims expressed in this article are solely those of the authors and do not necessarily represent those of their affiliated organizations, or those of the publisher, the editors and the reviewers. Any product that may be evaluated in this article, or claim that may be made by its manufacturer, is not guaranteed or endorsed by the publisher.
Supplementary material
The Supplementary Material for this article can be found online at: https://www.frontiersin.org/articles/10.3389/fmars.2022.879998/full#supplementary-material
Footnotes
- ^ www.ecopath.org
- ^ www.helcom.fi
- ^ www.ices.dk/sites/pub/Publication%20Reports/Stock%20Annexes/2019/cod.27.22-24_SA.pdf
- ^ www.fishbase.org
- ^ www.deutsches-meeresmuseum.de/wissenschaft/infothek/artensteckbriefe
- ^ www.ftz.uni-kiel.de/de/forschungsabteilungen/ecolab-oekologie-mariner-tiere
- ^ www.ices.dk/data/data-portals/Pages/DATRAS.aspx
- ^ https://www.eea.europa.eu/data-and-maps/indicators/oxygen-concentrations-in-coastal-and/assessment
- ^ https://water.europa.eu/marine/data-maps-and-tools/msfd-reporting-information-products/ges-assessment-dashboards/country-thematic-dashboards
References
Adebola T., de Mutsert K. (2019). Spatial simulation of redistribution of fishing effort in Nigerian coastal waters using ecospace. Ecosphere 10, e02623. doi: 10.1002/ecs2.2623
Andreasen H., Ross S. D., Siebert U., Andersen N. G., Ronnenberg K., Gilles A. (2017). Diet composition and food consumption rate of harbour porpoises (Phocoena phocoena) in the western Baltic Sea. Mar. Mam. Sci. 33, 1059–1073. doi: 10.1111/mms.12421
Araújo J. N., Bundy A. (2011). Description of three ecopath with ecosim ecosystem models developed for the bay of fundy, Western scotian shelf and NAFO division 4X. Can. Tech. Rep. Fisheries Aquat. Sci. 2952.
Aydin K. Y. (2004). Age structure or functional response? reconciling the energetics of surplus production between single-species models and ECOSIM. Afr. J. Mar. Sci. 26, 289–301. doi: 10.2989/18142320409504062
Bellebaum J., Schirmeister B., Sonntag N., Garthe S. (2012). Decreasing but still high: bycatch of seabirds in gillnet fisheries along the German Baltic coast. Aquat. Conserv. 23, 210–221. doi: 10.1002/aqc.2285
Bergström K. (2012). Impact of using macroalgae from the Baltic Sea in biogas production: a review with special emphasis on heavy metals (Linnaeus University). Available at: http://urn.kb.se/resolve?urn=urn:nbn:se:lnu:diva-20843.
Bianchi D., Carozza D. A., Galbraith E. D., Guiet J., DeVries T. (2021). Estimating global biomass and biogeochemical cycling of marine fish with and without fishing. Sci. Adv. 7, eabd7554. doi: 10.1126/sciadv.abd7554
Casini M., Blenckner T., Möllmann C., Gardmark A., Lindegren M., Llope M., et al. (2012). Predatory transitory spillover induces trophic cascades in ecological sinks. Proc. Natl. Acad. Sci. U.S.A 109, 8185–8189. doi: 10.1073/pnas.1113286109
Casini M., Cardinale M., Arrhenius F. (2004). Feeding preferences of herring (Clupea harengus) and sprat (Sprattus sprattus) in the southern Baltic Sea. ICES J. Mar. Sci. 61, 1267–1277. doi: 10.1016/j.icesjms.2003.12.011
CFP (2013). Regulation EU no. 1380/2013 of the European parliament and of the council of 11 December 2013 on the common fisheries policy, amending council regulations (EC) no 1954/2003 and (EC) no 1224/2009 and repealing council regulations (EC) no 2371/2002 and (EC) no 639/2004 and council decision 2004/585/EC. Off. J. Eur. Union.
Chagaris D., Drew K., Schueller A., Cieri M., Brito J., Buchheister A. (2020). Ecological reference points for Atlantic menhaden established using an ecosystem model of intermediate complexity. Front. Mar. Sci. 7. doi: 10.3389/fmars.2020.606417
Chagaris D. D., Mahmoudi B., Walters C. J., Allen M. S. (2015). Simulating the trophic impacts of fishery policy options on the West Florida shelf using ecopath with ecosim. Mar. Coast. Fish. 7, 44–58. doi: 10.1080/19425120.2014.966216
Chladek J., Culik B., Kindt-Larsen L., Albertsen C. M., von Dorrien C. (2020). Synthetic harbour porpoise (Phocoena phocoena) communication signals emitted by acoustic alerting device (Porpoise ALert, PAL) significantly reduce their bycatch in western Baltic gillnet fisheries. Fish. Res. 232, 105732. doi: 10.1016/j.fishres.2020.105732
Christensen V., Pauly D. (1992). Ecopath II–a software for balancing steady-state ecosystem models and calculating network characteristics. Ecol. Model. 61, 169–185. doi: 10.1016/0304-3800(92)90016-8
Christensen V., Walters C. J. (2004). Ecopath with ecosim: methods, capabilities and limitations. Ecol. Model. 172, 109–139. doi: 10.1016/j.ecolmodel.2003.09.003
Christensen V., Walters C., Pauly D. (2000). Ecopath and ecosim: a user’s guide (Vancouver, Canada: Fisheries Centre, University of British Columbia and Penang. Malaysia: ICLARM).
Corrales X., Ofir E., Coll M., Goren M., Edelist D., Heymans J. J., et al. (2017). Modeling the role and impact of alien species and fisheries on the Israeli marine continental shelf ecosystem. J. Mar. Syst. 170, 88–102. doi: 10.1016/j.jmarsys.2017.02.004
Cury P., Bakun A., Crawford R. J., Jarre A., Quinones R. A., Shannon L. J., et al. (2000). Small pelagics in upwelling systems: patterns of interaction and structural changes in “wasp-waist” ecosystems. ICES J. Mar. Sci. 57, 603–618. doi: 10.1006/jmsc.2000.0712
Dodson J. J., Daigle G., Hammer C., Polte P., Kotterba P., Winkler G., et al. (2019). Environmental determinants of larval herring (Clupea harengus) abundance and distribution in the western Baltic Sea. Limnol. Oceanogr. 64, 317–329. doi: 10.1002/lno.11042
Elmgren R. (1984). Trophic dynamics in the enclosed, brackish Baltic Sea. Rapp. P.-v. Réun. Cons. Int. Explor. Mer. 183, 152–169.
Essington T., Plagányi E. E. (2013). Model and data adequacy for marine stewardship council key low trophic level species designation and criteria and a proposed new assessment index. Mar. Stewardship Council Sci. Ser. 1, 171–191.
EU COM (2020) Report from the commission to the European parliament and the council on the implementation of the marine strategy framework directive (Directive 2008/56/EC). Available at: https://ec.europa.eu/info/sites/info/files/com2020_259_final_en.pdf.
Finnish Game and Fisheries Research Institute (2013)Up to 28,000 grey seals in the Baltic. Available at: https://yle.fi/uutiset/osasto/news/up_to_28000_grey_seals_in_the_baltic/6444137.
Forrest R. E., Savina M., Fulton E. A., Pitcher T. J. (2015). Do marine ecosystem models give consistent policy evaluations? a comparison of Atlantis and ecosim. Fish. Res. 167, 293–312. doi: 10.1016/j.fishres.2015.03.010
Frederiksen M., Edwards M., Richardson A. J., Halliday N. C., Wanless S. (2006). From plankton to top predators: bottom-up control of a marine food web across four trophic levels. J. Anim. Ecol. 75, 1259–1268. doi: 10.1111/j.1365-2656.2006.01148.x
Friedland R., Neumann T., Schernewski G. (2012). Climate change and the Baltic Sea action plan: model simulations on the future of the western Baltic Sea. J. Mar. Syst. 105, 175–186. doi: 10.1016/j.jmarsys.2012.08.002
Froese R., Coro G., Kleisner K., Demirel N. (2016a). Revisiting safe biological limits in fisheries. Fish Fish. 17, 193–209. doi: 10.1111/faf.12102
Froese R., Papaioannou E., Scotti M. (2022). Climate change or mismanagement? Environ. Biol. Fishes. doi: 10.1007/s10641-021-01209-1
Froese R., Winker H., Gascuel D., Sumaila U. R., Pauly D. (2016b). Minimizing the impact of fishing. Fish Fish. 17, 785–802. doi: 10.1111/faf.12146
Funk S. (2017). Depth-specific patterns in distribution and food intake of cod (Gadus morhua) in the western Baltic Sea (Institute for Hydrobiology and Fisheries Science, University of Hamburg).
Getzlaff J., Oschlies A. (2017). Pilot study on potential impacts of fisheries-induced changes in zooplankton mortality on marine biogeochemistry. Global Biogeochem. Cycles 31, 1656–1673. doi: 10.1002/2017GB005721
Gilles A., Andreasen H., Müller S., Siebert U. (2008) Nahrungsökologie von marinen säugetieren und seevögeln für das management von NATURA 2000 gebieten. teil: Marine säugetiere (Endbericht für das bundesamt für naturschutz, f + e vorhaben FKZ: 805 85 018). Available at: https://www.bfn.de/fileadmin/MDB/documents/themen/meeresundkuestenschutz/downloads/Forschungsberichte/NAHRUNG_Meeressaegetiere_Endbericht_2008.pdf.
Gilles A., Siebert U., Scheidat M., Lehnert K., Risch D., Kaschner K., et al. (2005). Erfassung der dichte und verteilungsmuster von schweinswalen (Phocoena phocoena) in der deutschen nord- und ostsee. MINOS+ Zwischenbericht 2005 Teilprojekt 2, S, 29–44.
Hall M. A., Alverson D. L., Metuzals K. I. (2000). By-catch: problems and solutions. Mar. pollut. Bull. 41, 204–219. doi: 10.1016/S0025-326X(00)00111-9
Hammarlund C., Nielsen M., Waldo S., Nielsen R., Hoff A., Bartolino V. (2018). Fisheries management under nutrient influence: cod fishery in the Western Baltic Sea. Fish. Res. 201, 109–119. doi: 10.1016/j.fishres.2018.01.012
Hansson S., Bergström U., Bonsdorff E., Härkönen T., Jepsen N., Kautsky L., et al. (2018). Competition for the fish – fish extraction from the Baltic Sea by humans, aquatic mammals, and birds. ICES J. Mar. Sci. 75, 999–1008. doi: 10.1093/icesjms/fsx207
Hansson S., Hjerne O., Harvey C., Kitchell J. F., Cox S. P., Essington T. E. (2007). Managing Baltic Sea fisheries under contrasting production and predation regimes: ecosystem model analyses. Ambio 36, 265–271. doi: 10.1579/0044-7447(2007)36[265:MBSFUC]2.0.CO;2
Harvey C. J., Cox S. P., Essington T. E., Hansson S., Kitchell J. F. (2003). An ecosystem model of food web and fisheries interactions in the Baltic Sea. ICES J. Mar. Sci. 60, 939–950. doi: 10.1016/S1054-3139(03)00098-5
HELCOM Inputs of nutrients to the sub-basins. HELCOM core indicator report. (2018a)Available at: https://helcom.fi/baltic-sea-trends/holistic-assessments/state-of-the-baltic-sea-2018/reports-and-materials/.
HELCOM State of the Baltic Sea – second HELCOM holistic assessment 2011-2016. Baltic Sea environment proceedings 155.(2018b) Available at: www.helcom.fi/baltic-sea-trends/holistic-assessments/state-of-the-baltic-sea-2018/reports-and-materials/.
Henriksen P. (2009). Long-term changes in phytoplankton in the kattegat, the belt Sea, the sound and the western Baltic Sea. J. Sea Res. 61, 114–123. doi: 10.1016/j.seares.2008.10.003
Herr H. (2009). Vorkommen von schweinswalen (Phocoena phocoena) in nord- und ostsee – in konflikt mit schifffahrt und fischerei? dissertation zur erlangung des doktorgrades des departments biologie der fakultät für mathematik, informatik und naturwissenschaften der universität Hamburg.
Heymans J. J., Coll M., Link J. S., Mackinson S., Steenbeek J., Walters C., et al. (2016). Best practice in ecopath with ecosim food-web models for ecosystem-based management. Ecol. Model. 331, 173–184. doi: 10.1016/j.ecolmodel.2015.12.007
Hüssy K., Hinrichsen H. H., Eero M., Mosegaard H., Hemmer-Hansen J., Lehmann A., et al. (2016). Spatio-temporal trends in stock mixing of eastern and western Baltic cod in the arkona basin and the implications for recruitment. ICES J. Mar. Sci. 73, 293–303. doi: 10.1093/icesjms/fsv227
Hüssy K., Hinrichsen H. H., Huwer B. (2012). Hydrographic influence on the spawning habitat suitability of western Baltic cod (Gadus morhua). ICES J. Mar. Sci. 69, 1736–1743. doi: 10.1093/icesjms/fss136
Hu L., Wroblewski J. S. (2009). Conserving a subpopulation of the northern Atlantic cod metapopulation with a marine protected area. Aquat. Conserv.: Mar. Freshw. Ecosyst. 19, 178. b
ICES (2013b). “Multispecies considerations for the central Baltic stocks: cod in subdivisions 25-32, herring in subdivisions 25-29 and 32, and sprat in subdivisions 22-32,” in Report of the ICES advisory committee 2013. Available at: http://ices.dk/sites/pub/Publication%20Reports/ICES%20Advice/2013/Book%208%20-%20Baltic%20Sea.pdf.
ICES (2016). Report of the joint OSPAR/HELCOM/ICES working group on seabirds (JWGBIRD) (Copenhagen, Denmark). Available at: http://www.ices.dk/sites/pub/Publication%20Reports/Expert%20Group%20Report/acom/2015/JWGBIRD/JWGBIRD_2015.pdf.
ICES (2018). “ICES fisheries overviews Baltic Sea ecoregion,” in Report of the ICES advisory committe. doi: 10.17895/ices.pub.4648.
ICES (2019b). “Cod (Gadus morhua) in subdivisions 22-24, western Baltic stock (western Baltic Sea),” in Report of the ICES advisory committe, vol. cod.27. , 22–24. doi: 10.17895/ices.advice.5587.
ICES (2019c). “Benchmark workshop on Baltic cod stocks (WKBALTCOD2),” in ICES scientific reports, vol. 1.doi: 10.17895/ices.pub.4984.
ICES (2019d). “Flounder (Platichthys flesus) in subdivisions 22 and 23 (Belt seas and the sound),” in Report of the ICES advisory committe, vol. fle.27. , 2223. doi: 10.17895/ices.advice.5273.
ICES (2019e). “Flounder (Platichthys flesus) in subdivisions 24 and 25 (west of bornholm and southwestern central Baltic),” in Report of the ICES advisory committe, vol. fle.27. , 2425. doi: 10.17895/ices.advice.5274.
ICES (2019f). “Plaice (Pleuronectes platessa) in subdivisions 21-23 (Kattegat, belt seas, and the sound),” in Report of the ICES advisory committe, vol. ple.27. , 21–23.doi: 10.17895/ices.advice.4751.
ICES (2019g). “Plaice (Pleuronectes platessa) in subdivisions 24-32 (Baltic Sea, excluding the sound and belt seas),” in Report of the ICES advisory committe, vol. ple.27. , 24–32.doi: 10.17895/ices.advice.4752.
ICES (2019h). “Sprat (Sprattus sprattus) in subdivisions 22-32 (Baltic Sea),” in Report of the ICES advisory committe. ICES advice 2019, vol. spr.27. , 22–32. doi: 10.17895/ices.advice.4754.
ICES (2020a). “Cod (Gadus morhua) in subdivisions 22-24, western Baltic stock (western Baltic Sea),” in Report of the ICES advisory committe, vol. cod.27. , 22–24. doi: 10.17895/ices.advice.5942.
ICES (2020b). “Herring (Clupea harengus) in subdivisions 20-24, spring spawners (Skagerrak, kattegat, and western Baltic),” in Report of the ICES advisory committe, vol. her.27. , 20–24. doi: 10.17895/ices.advice.5928.
ICES (2020d). “Plaice (Pleuronectes platessa) in subdivisions 21-23 (Kattegat, belt seas, and the sound),” in Report of the ICES advisory committe, vol. ple.27. , 21–23. doi: 10.17895/ices.advice.5870.
ICES (2020e) Herring assessment working group for the area south of 62° n (HAWG). doi: 10.17895/ices.pub.6105.
ICES (2020f). “Sprat (Sprattus sprattus) in subdivisions 22-32 (Baltic Sea),” in Report of the ICES advisory committe, vol. spr.27. , 22–32. doi: 10.17895/ices.advice.5879.
ICES (2021a). “Cod (Gadus morhua) in subdivisions 24-32, eastern Baltic stock (eastern Baltic Sea),” in ICES advice on fishing opportunities, catch, and effort, vol. cod.27. , 24–32. doi: 10.17895/ices.advice.7745.
ICES (2021b). “Herring (Clupea harengus) in subdivisions 20-24, spring spawners (Skagerrak, kattegat, and western Baltic),” in Report of the ICES advisory committe, vol. her.27. , 20–24. doi: 10.17895/ices.advice.7766.
Jarre-Teichmann A. (1995). Seasonal mass-balance models of carbon flow in the central Baltic Sea with emphasis on the upper trophic levels.
Jones J. B. (1992). Environmental impact of trawling on the seabed: a review. New Zeal. J. Mar. Fresh. 26, 59–67. doi: 10.1080/00288330.1992.9516500
Kaiser M. J., Clarke K. R., Hinz H., Austen M. C., Somerfield P. J., Karakassis I. (2006). Global analysis of response and recovery of benthic biota to fishing. Mar. Ecol. Prog. Ser. 311, 1–14. doi: 10.3354/meps311001
Kanstinger P., Beher J., Grenzdörffer G., Hammer C., Huebert K. B., Stepputis D., et al. (2018). What is left? macrophyte meadows and Atlantic herring (Clupea harengus) spawning sites in the greifswalder bodden, Baltic Sea. Estuar. Coast. Shelf Sci. 201, 72–81. doi: 10.1016/j.ecss.2016.03.004
Köster F. W., Möllmann C. (2000). Trophodynamic control by clupeid predators on recruitment success in Baltic cod? ICES J. Mar. Sci. 57, 310–323. doi: 10.1006/jmsc.1999.0528
Kreutle A., Schröder N., Krause J. C., von Nordheim H. (2016). Das erste MSRL-maßnahmenprogramm und sein beitrag zum erhalt der biodiversität der deutschen meeresgebiete. Natur und Landschaft 91 (11/16), 520–521.
Kuss J., Nausch G., Engelke C., Weber M. V., Lutterbeck H., Naumann M., et al. (2020). Changes of nutrient concentrations in the western Baltic Sea in the transition between inner coastal waters to the central basins: time series from 1995 to 2016 with source analysis. Front. Earth Sci. 8. doi: 10.3389/feart.2020.00106
Libralato S., Christensen V., Pauly D. (2006). A method for identifying keystone species in food web models. Ecol. Model. 195, 153–171. doi: 10.1016/j.ecolmodel.2005.11.029
Lindegren M., Checkley D. M. Jr., Ohman M. D., Koslow J. A., Goericke R. (2016). Resilience and stability of a pelagic marine ecosystem. Proc. R. Soc B 283, 20151931. doi: 10.1098/rspb.2015.1931
Long R. D., Charles A., Stephenson R. L. (2015). Key principles of marine ecosystem-based management. Mar. Policy 57, 53–60. doi: 10.1016/j.marpol.2015.01.013
Mackinson S., Daskalov G. (2007). “An ecosystem model of the north Sea to support an ecosystem approach to fisheries management: description and parameterisation.” in Science series technical report (Cefas Lowestoft), 142–196.
Mackinson S., Deas B., Beveridge D., Casey J. (2009). Mixed-fishery or ecosystem conundrum? multispecies considerations inform thinking on long-term management of north Sea demersal stocks. Can. J. Fish. Aquat. Sci. 66, 1107–1129. doi: 10.1139/F09-057
Mendel B., Sonntag N., Wahl J., Schwemmer P., Dries H., Guse N., et al. (2008). Artensteckbriefe von see- und wasservögeln der deutschen nord- und ostsee: Verbreitung, Ökologie und empfindlichkeiten gegenüber eingriffen in ihren marinen lebensraum (Naturschutz und biologische vielfalt. heft 59). Bonn: Bundesamt für naturschutz.
Mohrholz V. (2018). Major Baltic inflow statistics–revised. Front. Mar. Sci. 5. doi: 10.3389/fmars.2018.00384
Mohrholz ,. V., Naumann M., Nausch G., Krüger S., Gräwe U. (2015). Fresh oxygen for the Baltic Sea – an exceptional saline inflow after a decade of stagnation. J. Mar. Syst. 148, 152–166. doi: 10.1016/j.jmarsys.2015.03.005
Möllmann C. (2019). “Effects of climate change and fisheries on the marine ecosystem of the Baltic Sea,” in Oxford Research encyclopedia of climate science. doi: 10.1093/acrefore/9780190228620.013.682.
Möllmann C., Cormon X., Funk S., Otto S. A., Schmidt J. O., Schwermer H., et al. (2021). Tipping point realized in cod fishery. Sci. Rep. 11, 14259. doi: 10.1038/s41598-021-93843-z
Moustaka-Gouni M., Kormas K. A., Scotti M., Vardaka E., Sommer U. (2016). Warming and acidification effects on planktonic heterotrophic pico-and nanoflagellates in a mesocosm experiment. Protist 167, 389–410. doi: 10.1016/j.protis.2016.06.004
MSFD (2008). DIRECTIVE 2008/56/EC OF THE EUROPEAN PARLIAMENT AND OF THE COUNCIL of 17 June 2008 establishing a framework for community action in the field of marine environmental policy (Marine strategy framework directive). Off. J. Eur. Union L.
MSFD (2017a). COMMISSION DECISION (EU) 2017/848 of 17 may 2017 laying down criteria and methodological standards on good environmental status of marine waters and specifications and standardised methods for monitoring and assessment, and repealing decision 2010/477/EU. Off. J. Eur. Union L.
MSFD (2017b). COMMISSION DIRECTIVE (EU) 2017/845 of 17 may 2017 amending directive 2008/56/EC of the European parliament and of the council as regards the indicative lists of elements to be taken into account for the preparation of marine strategies. Off. J. Eur. Union.
Niiranen S., Yletyinen J., Tomczak M. T., Blenckner T., Hjerne O., MacKenzie B. R., et al. (2013). Combined effects of global climate change and regional ecosystem drivers on an exploited marine food web. Glob. Change Biol. 19, 3327–3342. doi: 10.1111/gcb.12309
Opitz S., Froese R. (2019) Ecosystem based fisheries management for the Western Baltic sea. extended report. Available at: https://www.researchgate.net/publication/339237754.
Pante E., Simon-Bouhet B. (2013). Marmap: a package for importing, plotting and analyzing bathymetric and topographic data in r. PloS One 8, e73051. doi: 10.1371/journal.pone.0073051
Pauly D., Christensen V. (1995). Primary production required to sustain global fisheries. Nature 374, 255–257. doi: 10.1038/374255a0
Pauly D., Christensen V., Walters C. (2000). Ecopath, ecosim, and ecospace as tools for evaluating ecosystem impact of fisheries. ICES J. Mar. Sci. 57, 697–706. doi: 10.1006/jmsc.2000.0726
Pikitch E., Boersma P. D., Boyd I. L., Conover D. O., Cury P., Essington T., et al. (2012). Little fish, big impact: managing a crucial link in ocean food webs (Washington DC: Lenfest Ocean Program).
Pikitch E. K., Santora C., Babcock E. A., Bakun A., Bonfil R., Conover D. O., et al. (2004). Ecosystem-based fishery management. Science 305, 346–347. doi: 10.1126/science.1098222
Plagányi É.E., Bell J. D., Bustamante R. H., Dambacher J. M., Dennis D. M., Dichmont C. M., et al. (2011). Modelling climate-change effects on Australian and pacific aquatic ecosystems: a review of analytical tools and management implications. Mar. Freshw. Res. 62, 1132–1147. doi: 10.1071/MF10279
Plagányi É.E., Butterworth D. S. (2004). A critical look at the potential of ecopath with ecosim to assist in practical fisheries management. Afr. J. Mar. Sci. 26, 261–287. doi: 10.2989/18142320409504061
Polovina J. J. (1984). Model of a coral reef ecosystem i. the ECOPATH model and its application to French frigate shoals. Coral Reefs 3, 1–11. doi: 10.1007/BF00306135
Polte P., Gröhsler T., Kotterba P., von Nordheim L., Moll D., Santos J., et al. (2021). Reduced reproductive success of Western Baltic herring (Clupea harengus) as a response to warming winters. Front. Mar. Sci. 8. doi: 10.3389/fmars.2021.589242
Read A. J., Hohn A. A. (1995). Life in the fast lane: the life history of harbour porpoises from the gulf of Maine. Mar. Mam. Sci. 11, 423–440. doi: 10.1111/j.1748-7692.1995.tb00667.x
Reusch T. B., Dierking J., Andersson H. C., Bonsdorff E., Carstensen J., Casini M., et al. (2018). The Baltic Sea as a time machine for the future coastal ocean. Sci. Adv. 4, eaar8195. doi: 10.1126/sciadv.aar8195
Rocchi M., Scotti M., Micheli F., Bodini A. (2017). Key species and impact of fishery through food web analysis: a case study from Baja California sur, Mexico. J. Mar. Syst. 165, 92–102. doi: 10.1016/j.jmarsys.2016.10.003
Rossing P., Booth S., Zeller D. (2010). Total marine fisheries extractions by country in the Baltic Sea: 1950-present. Fisheries Centre Res. Rep. 18. doi: 10.14288/1.0074744
Rudstam L. G., Aneer G., Hildén M. (1994). Top-down control in the pelagic Baltic ecosystem. Dana 10, 105–129.
Runting R. K., Beyer H. L., Dujardin Y., Lovelock C. E., Bryan B. A., Rhodes J. R. (2018). Reducing risk in reserve selection using modern portfolio theory: Coastal planning under sea-level rise. J. Appl. Ecol. 55, 2193–2203. doi: 10.1111/1365-2664.13190
Sandberg J., Elmgren R., Wulff F. (2000). Carbon flows in Baltic Sea food webs – a re-evaluation using a mass balance approach. J. Mar. Syst. 25, 249–260. doi: 10.1016/S0924-7963(00)00019-1
Sandberg J., Andersson A., Johansson S., Wikner J. (2004).Pelagic food web structure and carbon budget in the northern Baltic Sea: potential importance of terrigenous carbon. Mar. Ecol. Prog. Ser.2004 268, 13–29. doi: 10.3354/meps268013
Sandberg J. (2007). Cross-ecosystem analyses of pelagic food web structure and processes in the Baltic Sea. Ecol. Model. 201, 243–261. doi: 10.1016/j.ecolmodel.2006.09.023
Scheidat M., Gilles A., Kock K. H., Siebert U. Harbour porpoise Phocoena phocoena abundance in the southwestern Baltic Sea. Endanger. Species Res.(2008) 5, 215–223. doi: 10.3354/esr00161
Scotti M., Allesina S., Bondavalli C., Bodini A., Abarca-Arenas L. G. (2006). Effective trophic positions in ecological acyclic networks. Ecol. Model. 198, 495–505. doi: 10.1016/j.ecolmodel.2006.06.005
Scotti M., Jordán F. (2015). The structural importance of less abundant species in prince William sound food web. Isr. J. Ecol. Evol. 61, 77–89. doi: 10.1080/15659801.2015.1067972
Smith M. D., Fulton E. A., Day R. W., Shannon L. J., Shin Y. J. (2015). Ecosystem modelling in the southern benguela: comparisons of Atlantis, ecopath with ecosim, and OSMOSE under fishing scenarios. Afr. J. Mar. Sci. 37, 65–78. doi: 10.2989/1814232X.2015.1013501
STECF (2015). Multiannual management plans (North Sea), working group 16-20th march 2015, ispra, Italy. STECF EWG 15, 02.
Thiel R., Winkler H., Böttcher U., Dänhardt A., Fricke R., George M., et al. (2013). “Rote liste und gesamtartenliste der etablierten fische und neunaugen (Elasmobranchii, actinopterygii & petromyzontidae) der marinen gewässer deutschlands,” in Rote liste gefährdeter tiere, pflanzen und pilze deutschlands – bd 2: Meeresorganismen, vol. 70 . Eds. Becker N., Haupt H., Hofbauer N., Ludwig G., Nehring S. (Münster: Landwirtschaftsverlag), 11–76.
Tomczak M. T., Muller-Karulis B., Jarv L., Kotta J., Martin G., Winde A., et al. (2009). Analysis of trophic networks and carbon flows in south-eastern Baltic coastal ecosystems. Prog. Oceanogr. 81, 111–131. doi: 10.1016/j.pocean.2009.04.017
Tomczak M. T., Niiranen S., Hjerne O., Blenckner T. (2012). Ecosystem flow dynamics in the Baltic proper – using a multi-trophic dataset as a basis for food-web modelling. Ecol. Model. 230, 123–147. doi: 10.1016/j.ecolmodel.2011.12.014
Travers M., Watermeyer K., Shannon L. J., Shin Y. J. (2010). Changes in food web structure under scenarios of overfishing in the southern benguela: comparison of the ecosim and OSMOSE modelling approaches. J. Mar. Syst. 79, 101–111. doi: 10.1016/j.jmarsys.2009.07.005
van Beest F. M., Kindt-Larsen L., Bastardie F., Bartolino V., Nabe-Nielsen J. (2017). Predicting the population-level impact of mitigating harbor porpoise bycatch with pingers and time-area fishing closures. Ecosphere 8, e01785. doi: 10.1002/ecs2.1785
Vanhatalo J., Vetemaa M., Herrero A., Aho T., Tiilikainen R. (2014). By-catch of grey seals (Halichoerus grypus) in Baltic fisheries - a Bayesian analysis of interview survey. PloS One 9, e113836. doi: 10.1371/journal.pone.0113836
Viquerat S., Herr H., Gilles A., Peschko V., Siebert U., Sveegaard S., et al. (2014). Abundance of harbour porpoises (Phocoena phocoena) in the western Baltic, belt seas and kattegat. Mar. Biol. 161, 745–754. doi: 10.1007/s00227-013-2374-6
Voss R., Petereit C., Schmidt J. O., Lehmann A., Makarchouk A., Hinrichsen H. H. (2012). The spatial dimension of climate-driven temperature change in the Baltic Sea and its implication for cod and sprat early life stage survival. J. Mar. Syst. 100, 1–8. doi: 10.1016/j.jmarsys.2012.03.009
Voss R., Quaas M. F., Stiasny M. H., Hänsel M., Pinto G. A. S. J., Lehmann A., et al. (2019). Ecological-economic sustainability of the Baltic cod fisheries under ocean warming and acidification. J. Environ. Manage. 238, 110–118. doi: 10.1016/j.jenvman.2019.02.105
Walters C., Christensen V., Pauly D. (1997). Structuring dynamic models of exploited ecosystems from trophic mass-balance assessments. Rev. Fish Biol. Fisher. 7, 139–172. doi: 10.1023/A:1018479526149
Walters C., Pauly D., Christensen V., Kitchell J. F. (2000). Representing density dependent consequences of life history strategies in aquatic ecosystems: EcoSim II. Ecosystems 3, 70–83. doi: 10.1007/s100210000011
Wang Y., Li S. Y., Duan L. J., Liu Y. (2012). Fishery policy exploration in the pearl river estuary based on an ecosim model. Ecol. Model. 230, 34–43. doi: 10.1016/j.ecolmodel.2012.01.017
Wasmund N., Nausch G., Gerth M., Busch S., Burmeister C., Hansen R., et al. (2019). Extension of the growing season of phytoplankton in the western Baltic Sea in response to climate change. Mar. Ecol. Prog. Ser. 622, 1–16. doi: 10.3354/meps12994
Wisniewska D. M., Johnson M., Teilmann J., Siebert U., Galatius A., Dietz R., et al. (2018). High rates of vessel noise disrupt foraging in wild harbour porpoises (Phocoena phocoena). P. R. Soc B-Biol. Sci. 285, 20172314. doi: 10.1098/rspb.2017.2314
Wulff F., Ulanowicz R. E. (1989). “A comparative anatomy of the Baltic Sea and Chesapeake bay,” in Network analysis in marine ecology. Eds. Wulff F., Field J. G., Mann K. H. (Berlin: Springer-Verlag), 232–256. doi: 10.1007/978-3-642-75017-5_11
Zalachowski W. (1985). Amount and composition of food of cod (Gadus morhua) in the southern Baltic in 1977-1982. Acta Ichthyol. Piscat 15, 96–118. doi: 10.3750/AIP1985.15.2.04
Zydelis R., Bellebaum J., Österblom H., Vetemaa M., Schirmeister B., Stipniece A., et al. (2009). Bycatch in gillnet fisheries – an overlooked threat to waterbirds populations. Biol. Conserv. 142, 1269–1281. doi: 10.1016/j.biocon.2009.02.025
Keywords: eutrophication, fishery scenarios, food web resilience, ocean warming, sustainable fishing, top predators, trophic interactions
Citation: Scotti M, Opitz S, MacNeil L, Kreutle A, Pusch C and Froese R (2022) Ecosystem-based fisheries management increases catch and carbon sequestration through recovery of exploited stocks: The western Baltic Sea case study. Front. Mar. Sci. 9:879998. doi: 10.3389/fmars.2022.879998
Received: 20 February 2022; Accepted: 08 September 2022;
Published: 05 October 2022.
Edited by:
Rashid Sumaila, University of British Columbia, CanadaReviewed by:
Rene Friedland, Leibniz Institute for Baltic Sea Research (LG), GermanyKristin N. Marshall, National Marine Fisheries Service, (NOAA), United States
Copyright © 2022 Scotti, Opitz, MacNeil, Kreutle, Pusch and Froese. This is an open-access article distributed under the terms of the Creative Commons Attribution License (CC BY). The use, distribution or reproduction in other forums is permitted, provided the original author(s) and the copyright owner(s) are credited and that the original publication in this journal is cited, in accordance with accepted academic practice. No use, distribution or reproduction is permitted which does not comply with these terms.
*Correspondence: Marco Scotti, bWFyY29zY290QGdtYWlsLmNvbQ==