 Yunqing Li1,2
 Yinyin Zhou1,2
 Jinkuan Wei1,2
 Gongpengyang Shi1,2
 Qingliang Liao1,2
 Shuming Guo1,2
 Zihua Zhou1,2
 Jun Li1,2,3,4,5
 Yanping Qin1,2,3,4,5
 Haitao Ma1,2,3,4,5
 Ziniu Yu1,2,3,4,5*
 Yuehuan Zhang1,2,3,4,5*
- 1Key Laboratory of Tropical Marine Bio-resources and Ecology, Guangdong Provincial Key Laboratory of Applied Marine Biology, South China Sea Institute of Oceanology, Chinese Academy of Science, Guangzhou, China
- 2University of Chinese Academy of Sciences, Beijing, China
- 3Marine Science and Engineering Guangdong Laboratory (Guangzhou), Guangzhou, China
- 4Innovation Academy of South China Sea Ecology and Environmental Engineering, Chinese Academy of Sciences, Guangzhou, China
- 5Hainan Provincial Key Laboratory of Tropical Marine Biology Technology, Sanya Institute of Oceanology Chinese Academy of Sciences, Tropical Marine Biological Research Station in Hainan, Chinese Academy of Sciences, Sanya, China
Giant clams are marine bivalves that inhabit Indo-Pacific coral reefs. The boring giant clam, Tridacna crocea, exhibits bright and conspicuous mantle coloration based on the specialized cells (iridocytes) that generate structural colors. In order to illustrate the coloring mechanism of individual iridocytes, the reflection spectra curve of iridocytes was obtained by a micro-hyperspectral imager. TEM images were obtained to show the inner nanostructures of iridocytes. FDTD simulation was conducted to analyze the relationship between the color of iridocytes and the unique lamellar structure. We found that the laminae in the regular arrangement within cells govern the coloration of individual iridocytes. With the gradual increase of lamellar thickness and spacing, the color of the structure varies from bright violet to orange-red, forming a full visible spectrum. This study provides a new understanding of the various colors produced by individual iridocytes.
Introduction
Creatures in nature display a variety of colors (Caro and Mallarino, 2020; Kjernsmo et al., 2020; Mello et al., 2021). The biology of color is an emerging branch of science. It focuses on the mechanisms of color formation, color inheritance, dynamic changes of color, and color interactions with other sensory modalities. It runs through diverse scientific fields such as evolutionary biology (Wallbank et al., 2016), behavioral ecology (de Abreu et al., 2021), optical physics (De Tommasi et al., 2021), bionics (Dou et al., 2021), visual physiology (Sandkam et al., 2016) and genetics (Joron et al., 2011; Hohenlohe, 2014; Orteu and Jiggins, 2020). This subject has the characteristics of multi-level, interdisciplinary, and comprehensive knowledge (Cuthill et al., 2017).
Biological coloration can be divided into pigment coloration and structural coloration (Shawkey and D'Alba, 2017). The former derives from a class of substances inherently determined by pigment synthesis genes. Pigment molecules, such as pterins (Andrade and Carneiro, 2021), melanin (Delgado-Vargas et al., 2000; Almeida-Paes et al., 2017), and carotenoids (Lopes et al., 2016; Heriyanto et al., 2021; Tian et al., 2022), selectively absorb, transmit, and reflect the light of specific wavelengths, thus presenting colors. Structural coloration is usually generated by the interaction between light and biological nanostructures. Thin-film interference, multilayer interference, light scattering, diffraction grating effect, and photonic crystals are considered to be the fundamental optical processes related to structural colors (Kinoshita and Yoshioka, 2005; Doucet and Meadows, 2009; Saranathan and Finet, 2021).
A considerable amount of animals can produce structural coloration, and even use nanoscale structures to manipulate light for specific purposes. Many butterflies exhibit the vivid structural coloration of their wings, which is produced by complex three-dimensional biophotonic nanostructures (Saranathan et al., 2010). Chameleons are well known for their adjustable appearance color adapted to the environment (Saranathan et al., 2010; Teyssier et al., 2015). The neon tetra has a remarkable ability to change the structural color of its lateral stripes from blue-green in the daytime to indigo at night (Gur et al., 2015). Cephalopods, especially squids, can strategically and rapidly alter and reflect in their skin to show different coloration in social interaction and behavior (Tao et al., 2010).
Giant clams (Bivalvia: Cardiidae: Tridacninae) are also characterized by a high diversity of mantle color with brilliant iridescence. Initially, the structural coloration of giant clams was thought to be determined by the species richness and cell abundance of symbiotic microalgae, zooxanthellae. However, with the progress of research, the iridescent cells in the mantle called iridocytes rather than zooxanthellae are supposed to be the cause of intense coloration (Kamishima, 1990). More specifically, according to the red-green-blue (RGB) pixel strategy (Ghoshal et al., 2016b), iridocytes have been shown to generate vibrant colors by backscattering (Ghoshal et al., 2016a). The boring giant clam, T. crocea strongly expresses mantle color polymorphism with iridocytes in specific colors such as blue, green, yellow, and orange-red. Based on the color type of iridocytes, two strains of T. crocea (Figures 1A, B), blue strain (blue iridocytes as major components), and yellow-green strain (mainly found yellow and green iridocytes) were established (Kawaguti, 1966; Zhou et al., 2021).
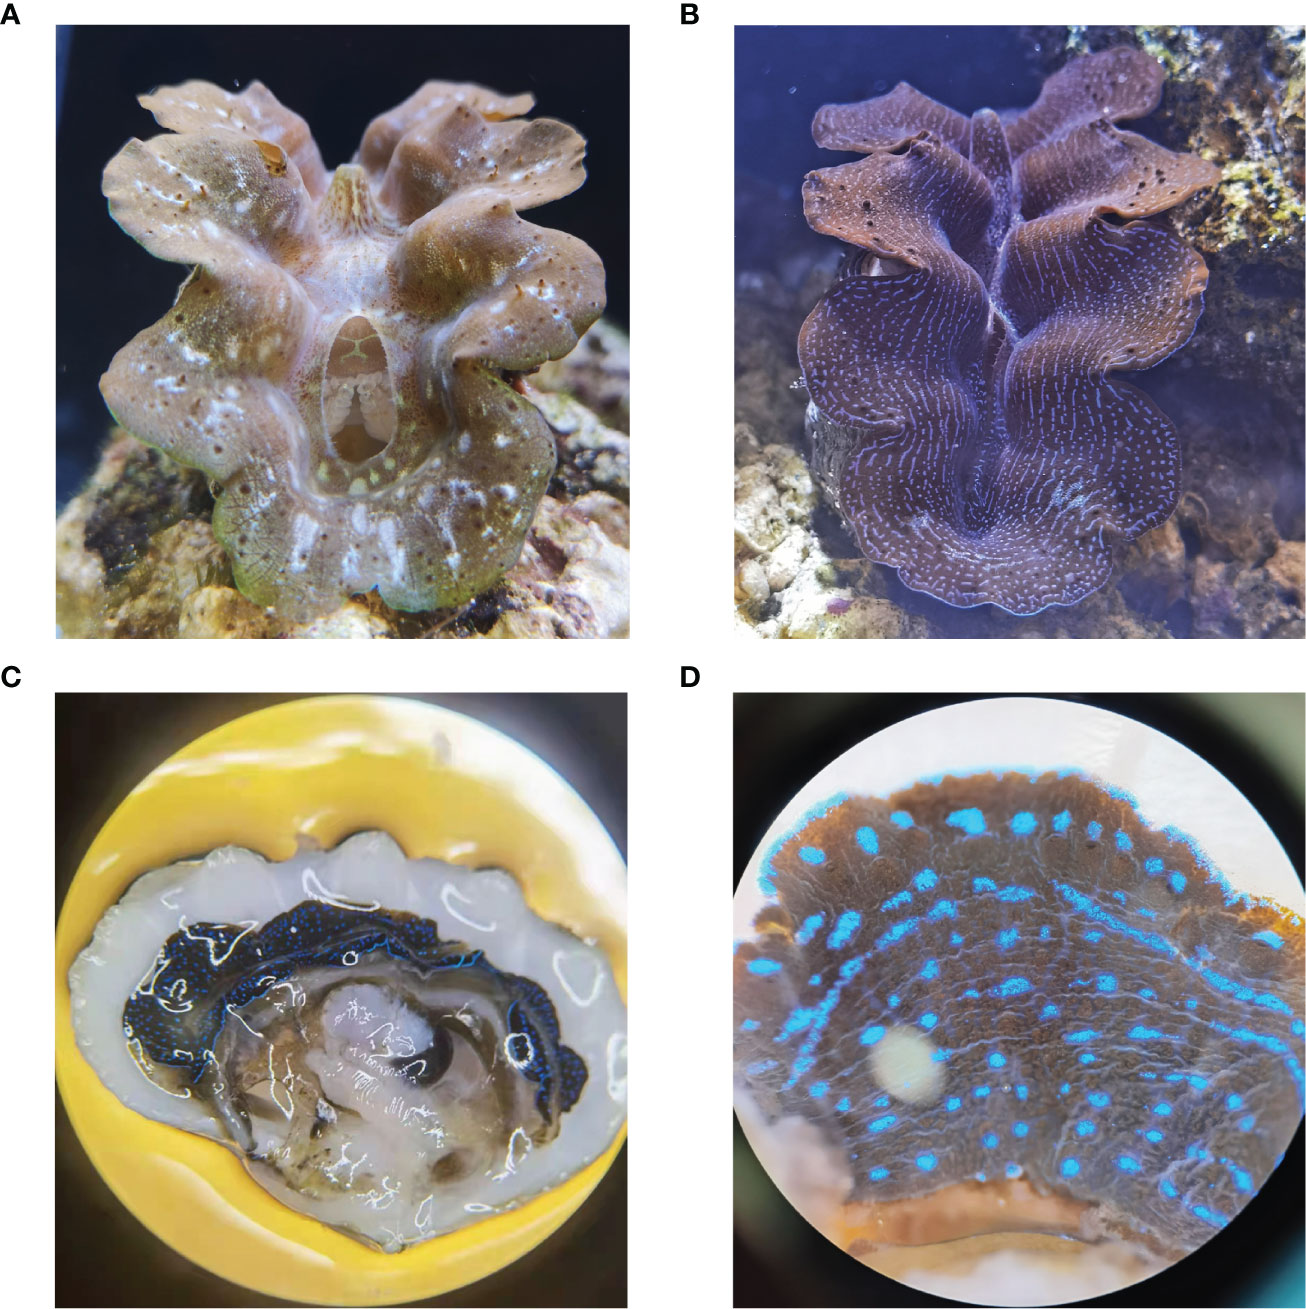
Figure 1 T. crocea specimens from yellow-green strain (A) and blue strain (B) were chosen and temporarily kept on the coral living stones in an aquarium. (C) Dissected section of a blue specimen. The tissue adjacent to the edge of the shell appears blue. (D) The outer surface of the mantle. The regions that display blue shining are iridocyte clusters, while the brown regions in the deeper layer are zooxanthellae.
However, an outstanding question about how an individual iridocytes produces structural coloring is unknown. Here we used tissue sections and transmission electron microscopy (TEM) to investigate the mechanism of coloration originated from individual iridocytes. Furthermore, we also used the finite difference time domain (FDTD) method to develop a model to simulate the optical behavior of iridocytes at the nanoscale.
Material and Methods
Boring giant clam, T. crocea specimens were obtained from Hainan Tropical Marine Biology Research Station, Chinese Academy of Sciences, Sanya, China (18°12’42’’ N, 109°28’26’’ E), and maintained under the following conditions: artificial seawater at 33 psu, temperature ranged from 24°C to 26°C, with natural light.
To analyze the iridocytes on the outer surface of T. crocea, siphonal mantle tissues with bright colors were extracted (Figures 1C, D). The micro-hyperspectral imager was set at reflection mode, with the emission light source turning on and the balance of white and dark adjusting to conduct the observation and analysis. The original reflection spectrum data of a single iridocyte were analyzed, and then the spectral curve was drawn by ENVI software.
Tissues with a size of 1mm3 were prefixed in 2.5% precooled glutaraldehyde. After washing with 0.1 M phosphate buffer (pH=7.4), the samples were transferred to 1% osmium tetroxide (pH=7.4) for further fixation. After ethanol dehydration, the fixed mantle tissue was embedded with Spurr’s resin. Finally, all sections were stained with 2% uranium acetate saturated alcohol solution and 2.6% lead citrate, and then the images were observed and photographed on HITACHI TEM system.
Since we assumed that the various structural coloration is due to interaction and the common effect of the high index lamellar and the low index spacing (Figures 2A, B), electromagnetic simulation was conducted for a more detailed study. FDTD is an algorithm strategy that uses a finite element method to simulate the distribution of electric field and magnetic field in the transmission process of the electromagnetic field in materials. FDTD method has high accuracy in the analysis of microstructure size similar to or smaller than a light wave. Here, Lumerical’s FDTD simulations were performed to reveal the optical behavior of iridocytes. We only considered the effect of Bragg stacks on the color formation and created a simplified structure of iridocytes, modeling the cells as two-dimensional cross-sections, with a constant refractive index of lamellae and variable thickness of lamellae and cisterns. For built-in primitives, they represented alternating dark and light regions of high index lamellar (n=1.44) and low index spacing (n=1.35), respectively (Ghoshal et al., 2016a). The outer edge of the 20×20 nm2 simulation region was set as implementing perfectly matched layers, with absorbing boundary conditions. To emulate the sunlight sources, a plane wave with a broadband spectrum ranging from 300 to 800 nm was perpendicular to the plane of Bragg layers and then vibrated in x or z polarized directions synchronically (Figures 2C–F).
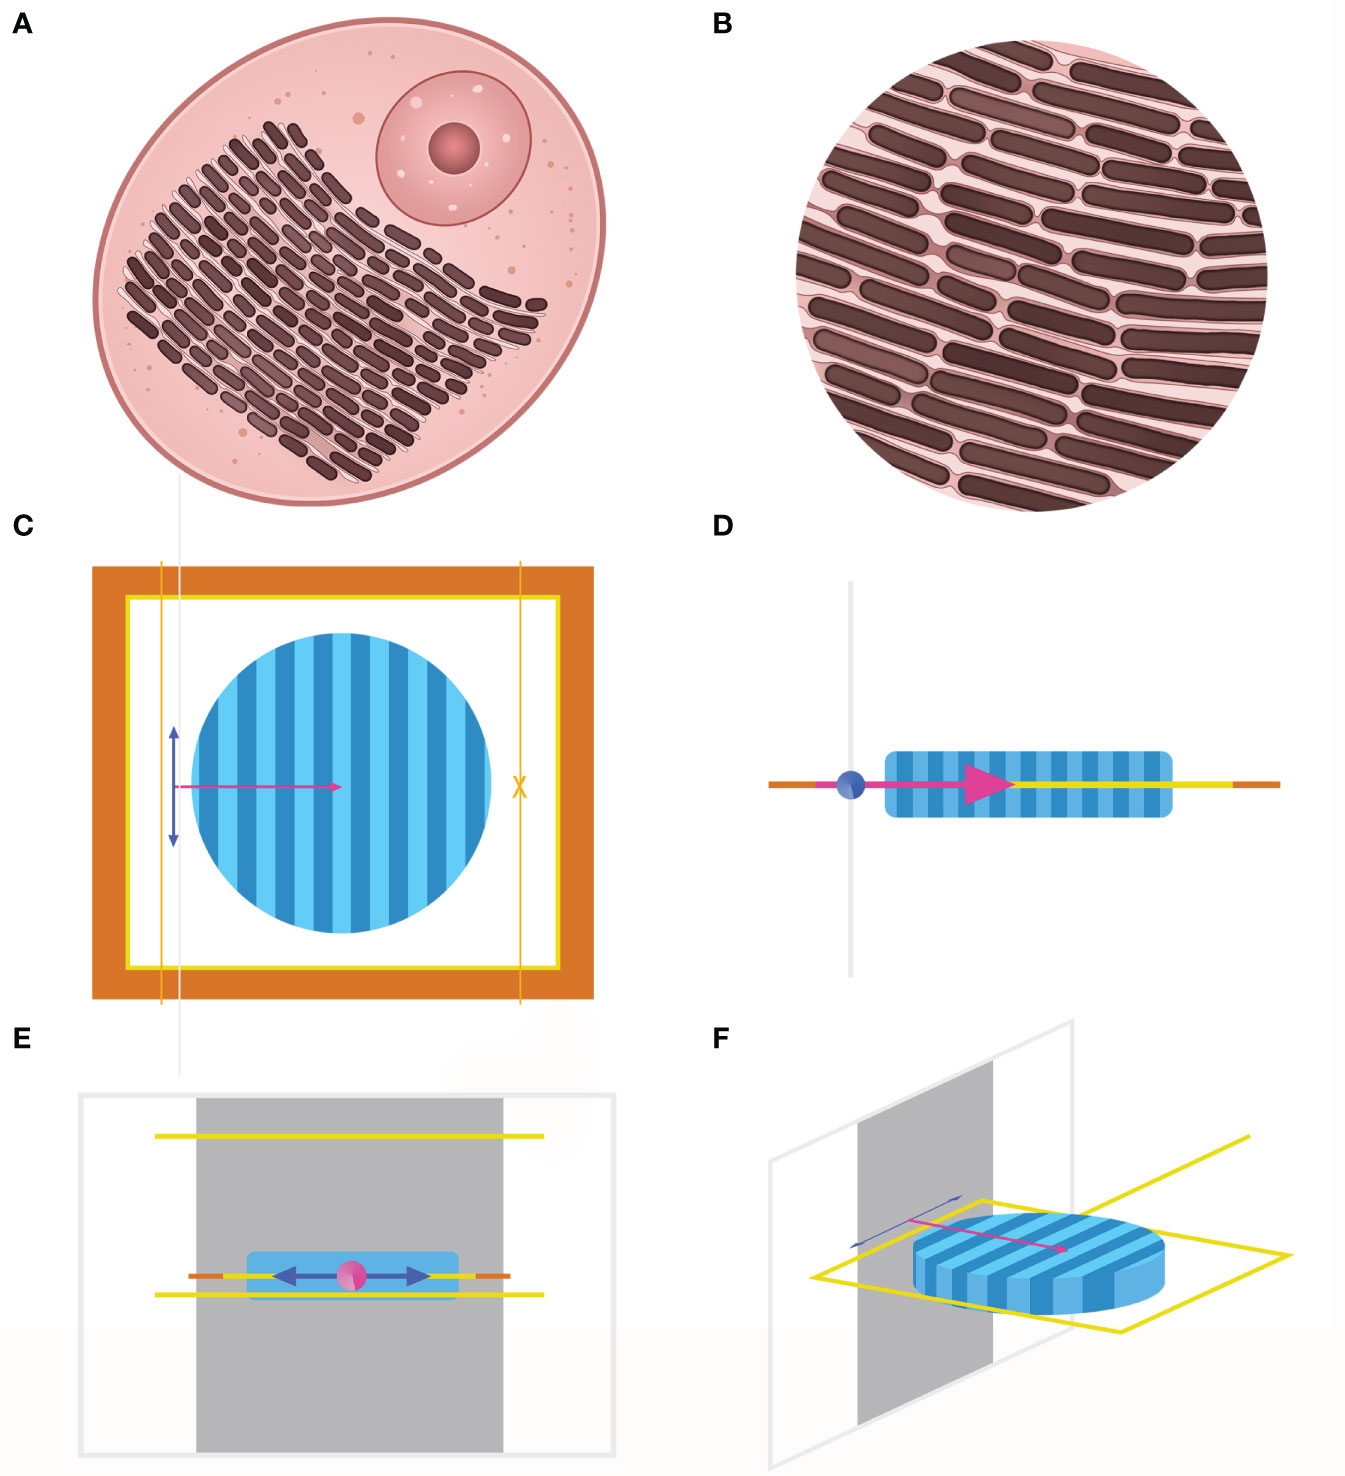
Figure 2 (A), Diagram of individual iridocytes in T. crocea. (B), Close-up image of lamellae structure in (A) The brown rectangles toward the same direction represent the lamellae with a high refractive index, and the light pink sections represent the spacings with a low refractive index. The three-dimension image (F) and the three views (C-E) of the simulation model created by the FDTD method. Only considering the interference of lamellar structure on iridocytes’ coloration, the structure within the cells is simplified into a cylindrical shape, as shown in (F) Dark blue and light blue areas represent the high and low refractive index parts respectively. The orange and yellow frames in (C) indicate that the boundary conditions are perfectly matched layers.
Results
Nanostructure of Iridocytes
In order to verify the consistency between the observed colors and the reflection spectrum of individual iridocytes, we targeted blue, green, yellow as well as orange-red bright cells on the shallow mantle of all specimens.
When the observed color of iridocytes was blue, the reflectance peak maximum was at ∼480 nm. In addition, the peaks of spectra curves of green, yellow, and orange-red iridescent cells were located at ∼570 nm, ∼590 nm, and ∼620 nm, respectively (Figure 3 column 2). As expected, the peaks result in the observed colors of individual cells. In the visible spectrum, the blue range is 440 to 480 nm, the green range is 500 to 570 nm, the yellow range is 580 to 590 nm, and the orange-red range is 600 to 700 nm. Such structural coloration is an optical process produced by the submicroscopic structure of organisms, rather than related to pigmentation. That indicates that some changes in structure at nanoscale within iridocytes should be accountable for the various structural colors displayed in the mantle.
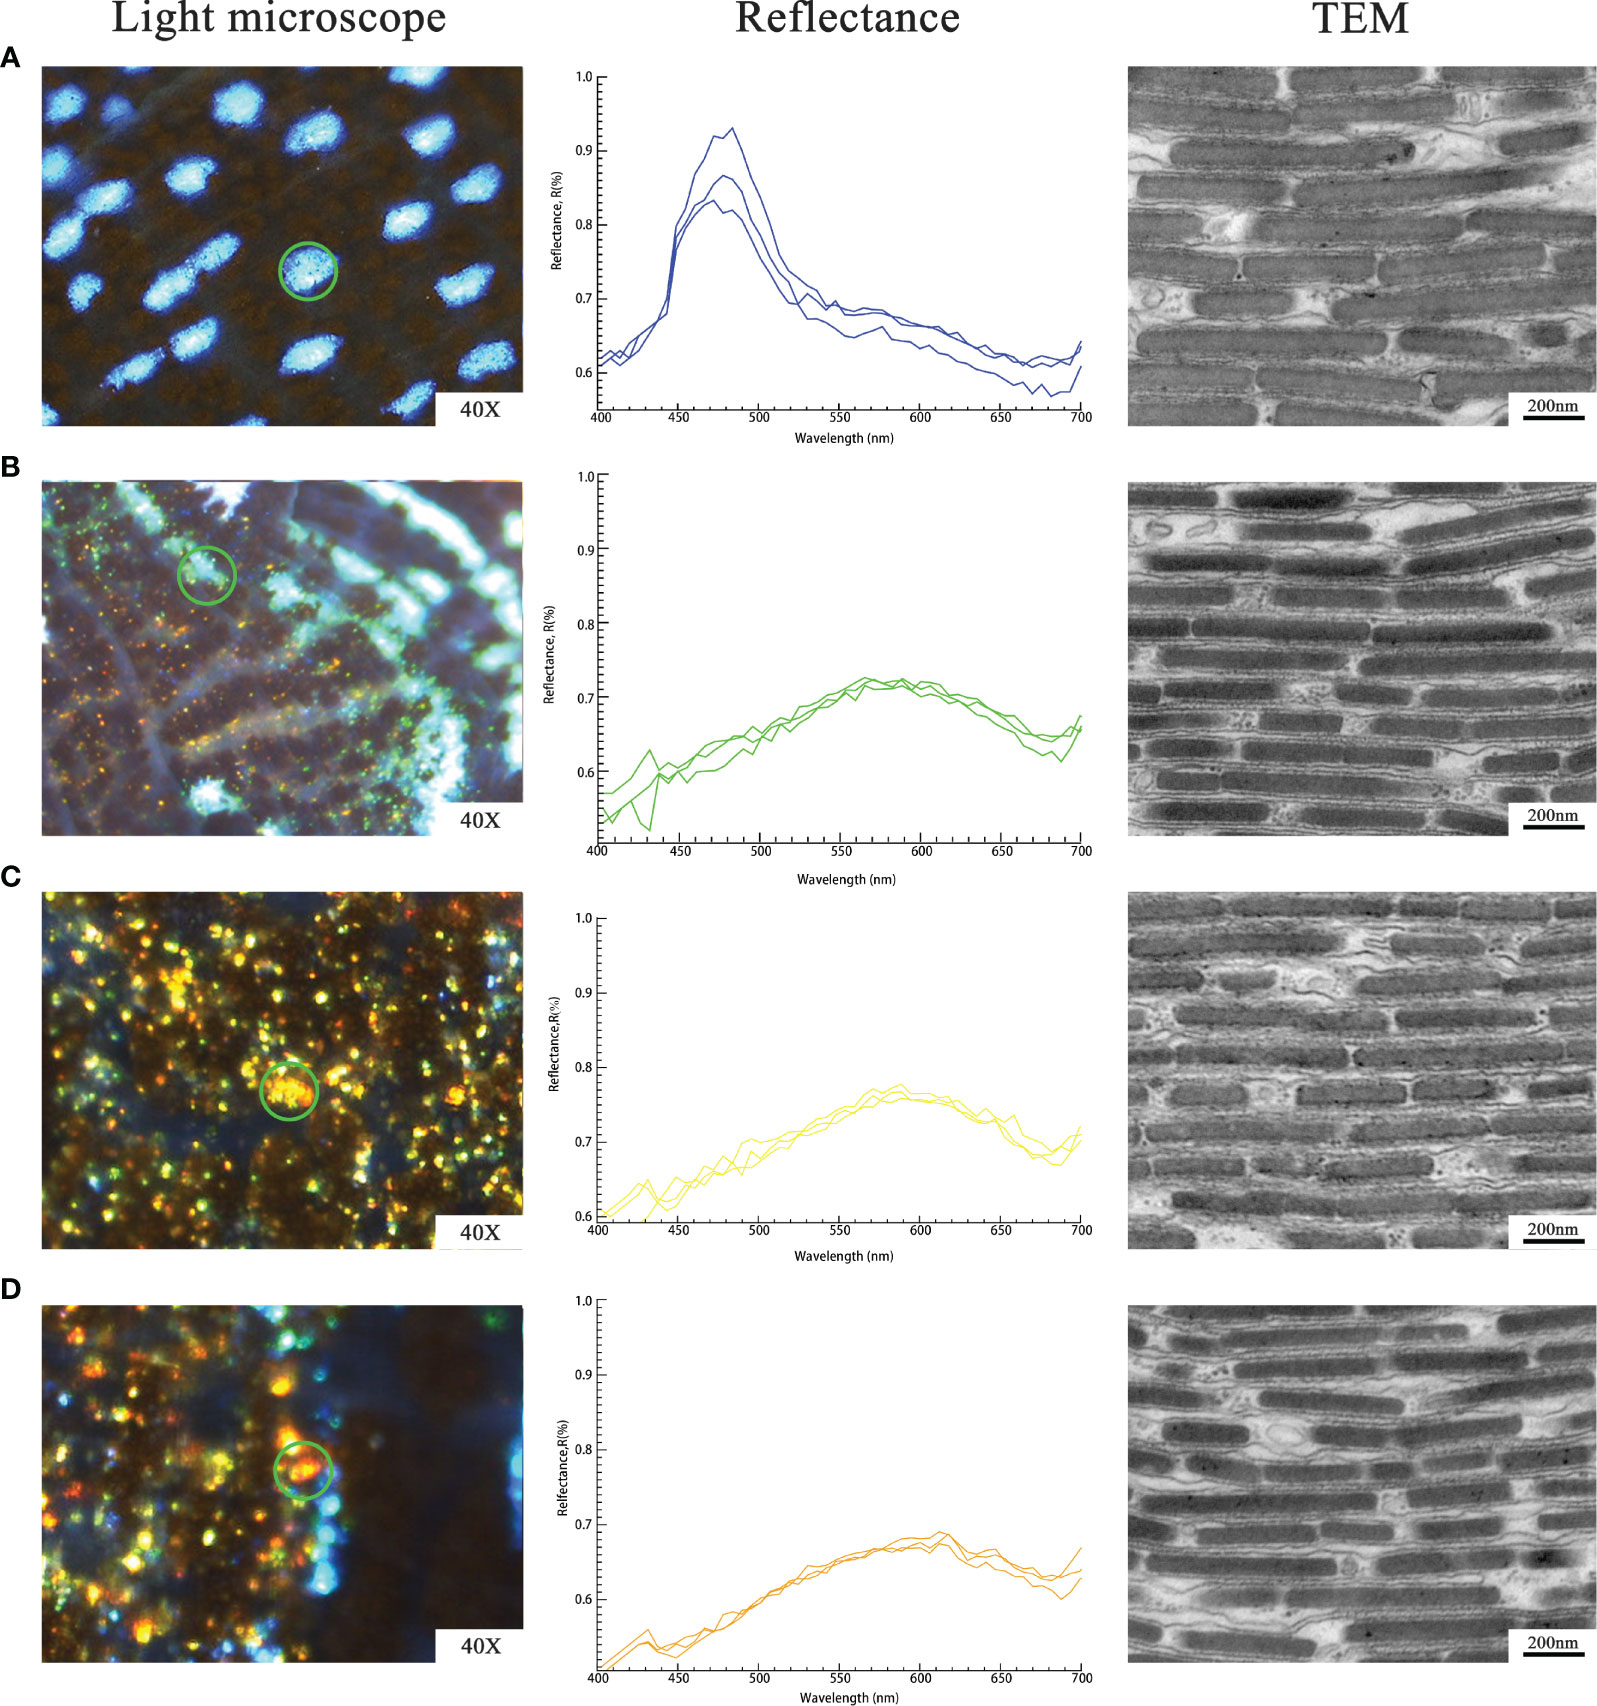
Figure 3 Detected reflectance and nanoscale structure of individual iridocytes: (A), Blue iridocytes. (B), Green iridocytes. (C), Yellow iridocytes. (D), Orange-red iridocytes. Column 1 (left) shows single iridocyte or iridophores of the specific color under the light microscope (indicated by the green circles). Measured reflectance spectra of various colors of iridocytes are shown in column 2 (middle). Every normalized curve represents each iridocyte and three normalized curves mean three replicates. TEM observation in column 3 (right) shows the lamellae in a single iridocyte which contributes to various structural colors. The thickness of lamellae and the spacing among them were measured and calculated to investigate differently colored specimens.
The TEM images in Figure 3 column 3 show the inner structure of iridocytes at the nanoscale. As mentioned in previous studies, most iridescent cells are occupied by stacked flattened lamellae, which are arranged in a uniform orientation (Kamishima, 1990; Griffiths et al., 1992; Kawaguti, 1966). Between the neighboring lamellae is the cytoplasm, which is enveloped with a membrane called cisterns. Electron dense lamellae with a high refractive index of 1.44 and the cisterns with a low refractive index of 1.35 are alternately arranged to form a periodic structure similar to the Bragg reflector. One pair of layers with high and low refractive index are considered as basic reflection units, which can enhance the reflection of a specific wavelength of light. Additionally, a quarter of the increased reflectivity wavelength is equal to the optical thickness (product of physical thickness and refractive index) of the layer pair.
The optical thickness of iridocytes of T. crocea is variable in a certain range. We measured the thickness of lamellae and cisterns of individual iridocytes to study the relationship between nanostructure and particular colors. The average recorded lamellar thickness was 76.84 ± 6.45 nm, ranging from 57.23 ± 4.97 nm to 115.53 ± 6.92 nm. The measurement is summarized in Table 1.
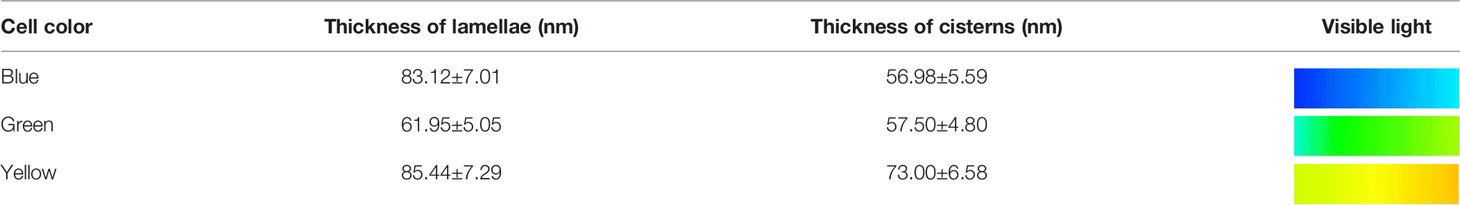
Table 1 Laminae and Cisterns Thickness of Iridocytes.
FDTD Simulations
The reflectance spectrum of the first model designed to simulate the optical characteristics corresponding to the cell structures of blue, green, and yellow iridocytes is shown in Figure 4. After the simulation was completed, the origin wavelength excitation modeled from 300 to 800 nm showed varying degrees of reflection. Some wavelengths of light were strongly enhanced, while a great part of wavelengths were eliminated by interference. The blue, green, and yellow curves represent the wavelength reflection of the iridocytes structure of the corresponding color. The simulated peak wavelength varies in the visible range, from blue band to yellow band, including three isolated and intensive one-peak curves. As expected, the peak wavelength of blue iridocytes is approximately 460 nm, and the reflection value in the blue band in the visible spectrum is 440 to 480 nm. The green curve and yellow curve move to the right relative to the blue curve, with peaks of 540 nm and 580 nm, respectively, corresponding to the green and yellow bands. Figure 4 reveals that with the increase of the thickness and spacing of lamellae, the wavelength of the reflection peak increases, and the corresponding light band in the visible spectrum shifts toward red. To further investigate how the structure determines the color of iridocytes, it is necessary to quantify these two parameters, namely, the thickness and spacing of layers.
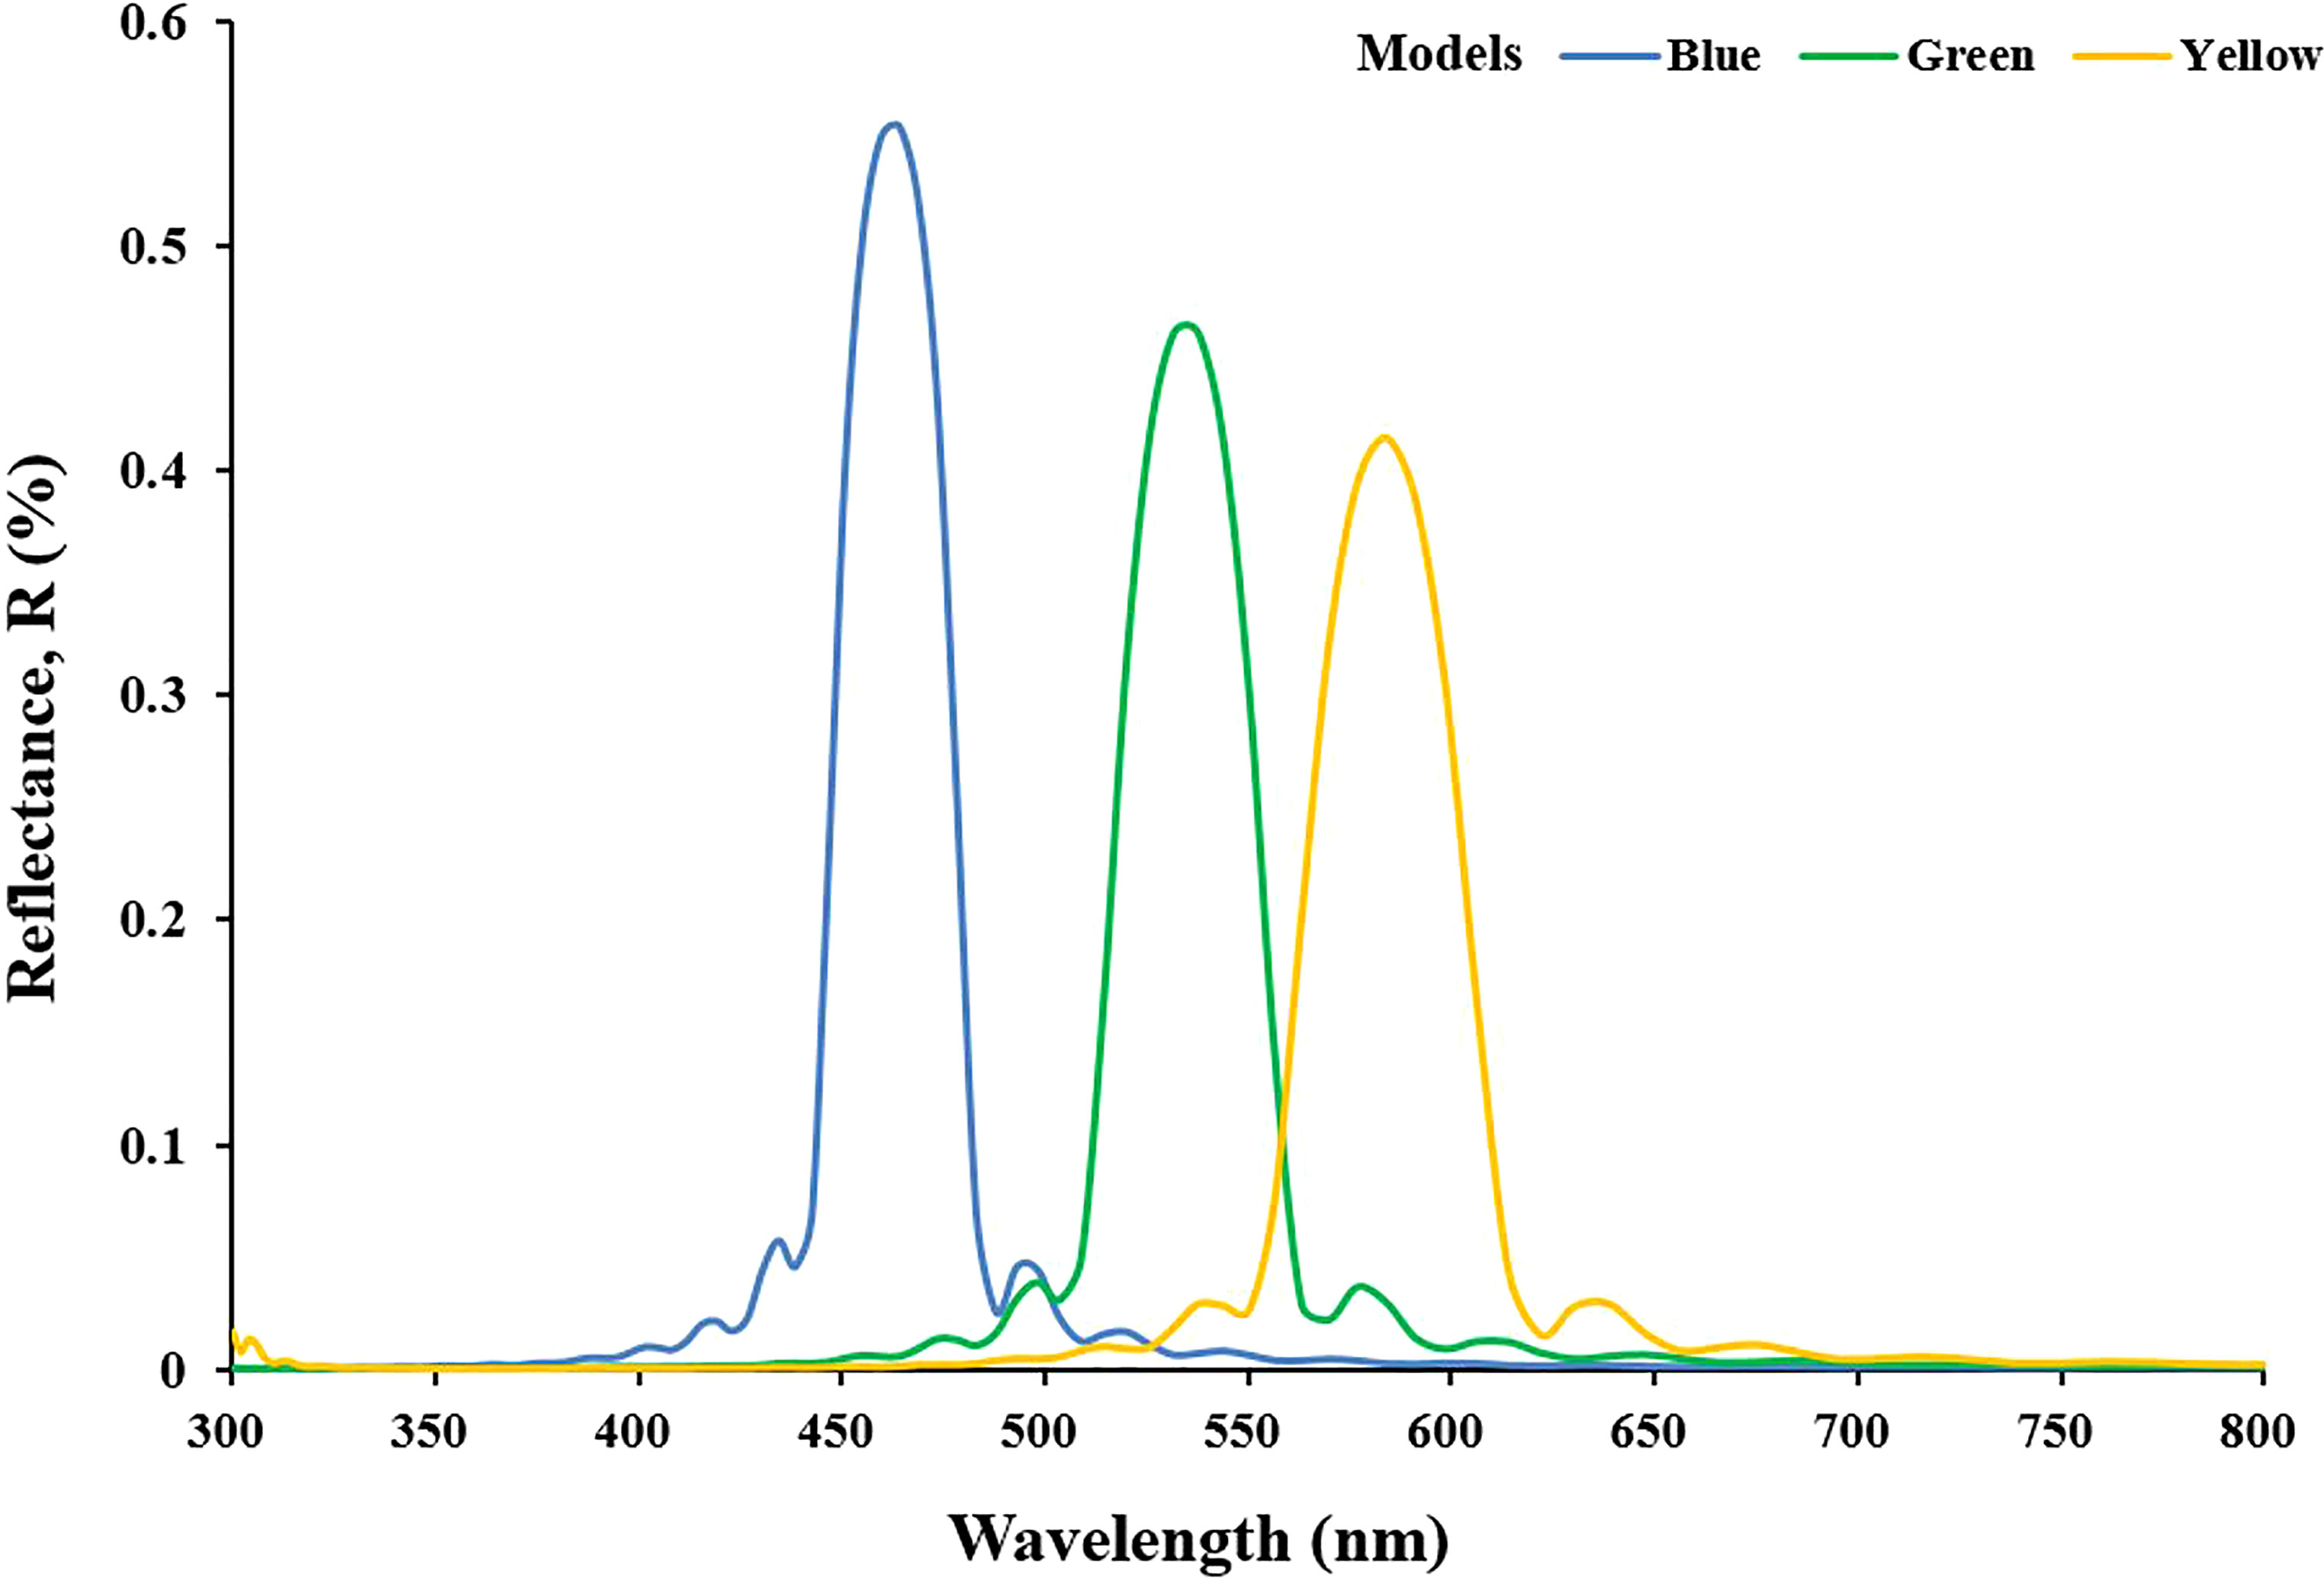
Figure 4 Spectrums of reflectance from simulation modeled by data based on measurements. The blue, green, and yellow curves indicate the simulated results of corresponding color models.
The result of the second is shown in Figure 5. The simulation was conducted by increasing h1 every 10 nm with changing h2 within a specified range to obtain the intensity of the reflection. When h1 is fixed and h2 increases from 40 nm to 110 nm, as seen from Figures 5A–G, the reflected wavelength gradually increases, shifts from ultraviolet to blue, and then towards red. In Figures 5A–H, when h2 remains unchanged and h1 increases, the wavelengths increase and the reflected wave bands become wider at the same time. It is worth noting that when h1 reaches 120 nm and h2 exceeds 90 nm, two bright bands appear in the reflection distribution (Figure 5H), with strong reflection in both visible wavelength and ultraviolet regions. Similar cases also appear in Figure 5I, h1 = 130 nm and h2 above 80 nm; Figure 5J, h1 = 140 nm, h2 above 70 nm; Figure 5K, h1 = 150 nm, h2 above 60 nm. More importantly, with the increase of thickness, iridocytes take successively multiple colorations of green, yellow, or even orange-red. Surprisingly, when the sum of thickness and spacing of lamellae reach above 210 nm, iridocytes seem to produce both visible and ultraviolet radiation, which has not been found in previous studies (Figures 5I–K).
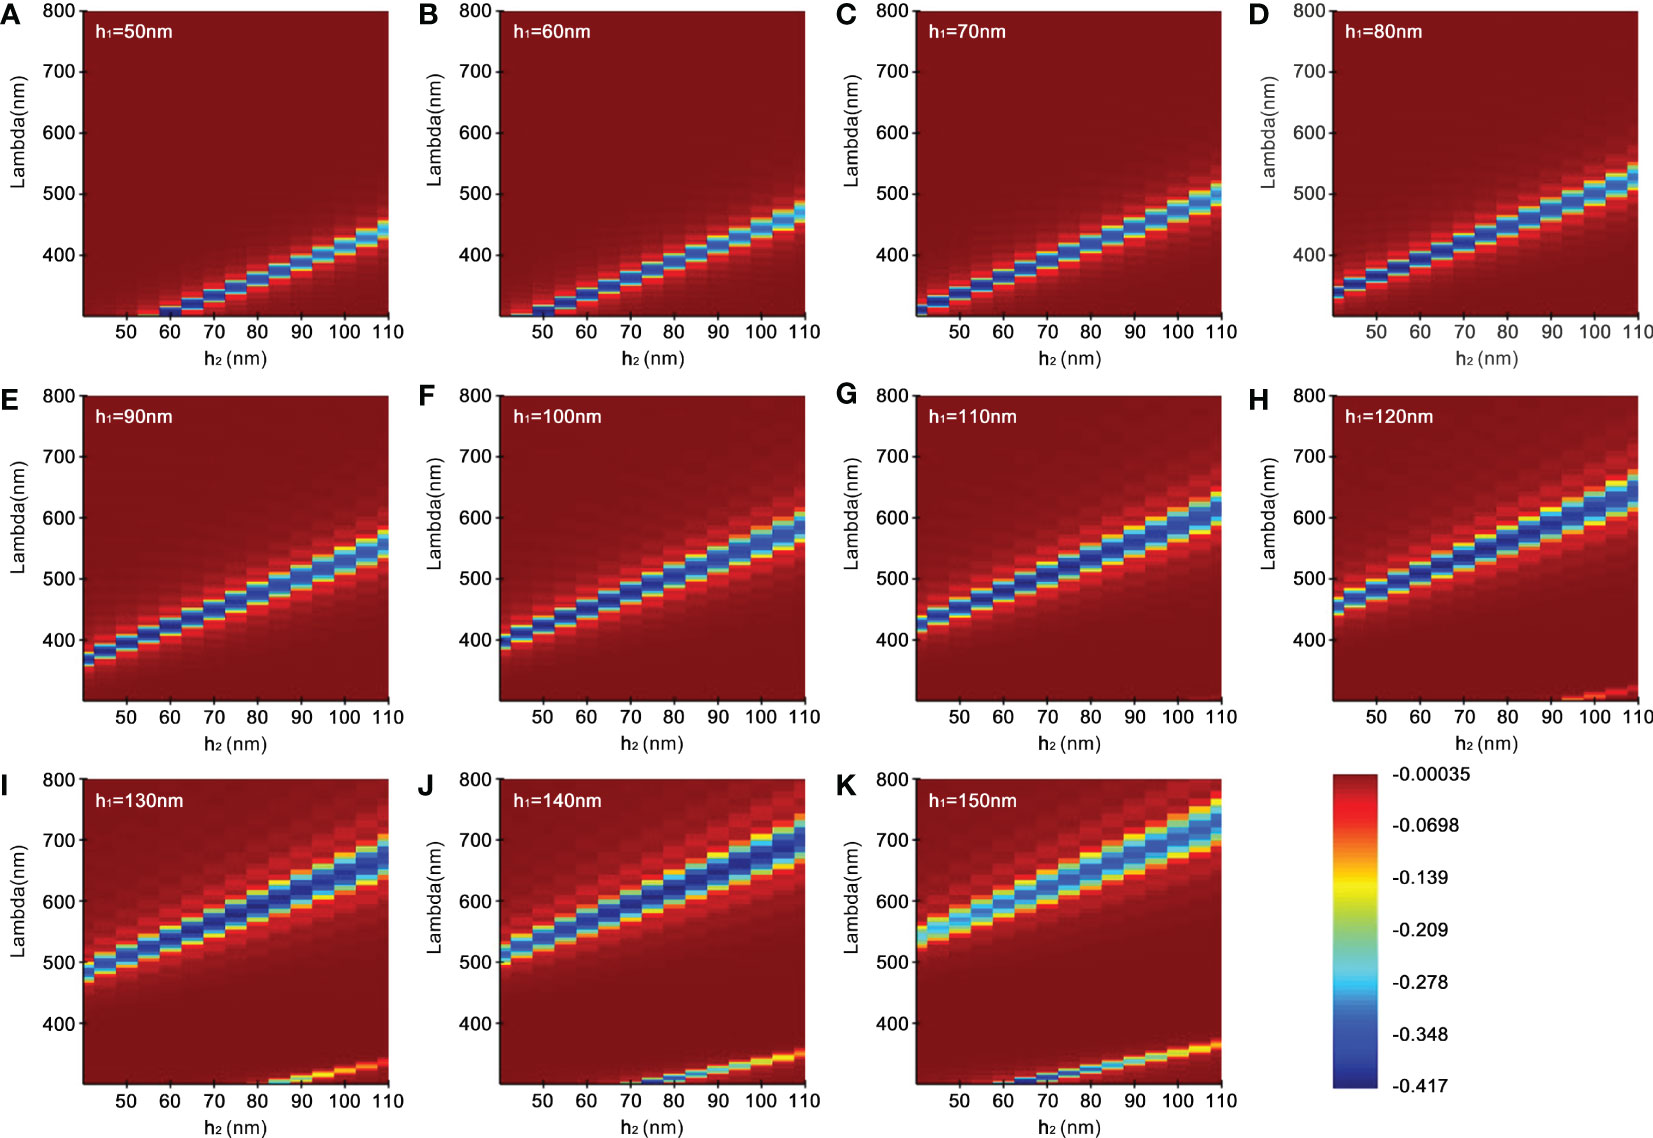
Figure 5 Reflectivity distribution of simulation. (A–K) represent the wavelength reflection intensity corresponding to a series of gradients with the high refractive index lamellae (h1, 50-150 nm) as well as different low refractive index spacing (h2, 40-110 nm).
Discussion
Bragg Stacks Govern the Structural Colors in Individual Iridocytes
Previous studies have preliminarily shown that the structural colors are determined by nanostructure (Ghoshal et al., 2016a). In our study, we found that an optical process is of great importance in iridocytes’ colors generated by the lamellae structure. That indicates that some changes in structure at the nanoscale within iridocytes should be accountable for the various structural colors displayed in the mantle. Our FDTD model is designed for the simulation of iridocytes with alternating high and low refractive index layers observed in T. crocea and applies to cells with similar structures. Furthermore, the ultrastructure structures of iridescent cells in T. maxima and T. gigas are consistent with that of iridocytes in T. crocea. Therefore, our model holds true in T. maxima and T. gigas. The results of the FDTD simulations show that there is a clear corresponding relationship between coloration and the internal Bragg stacks, which is associated with thicknesses and spacing of lamellae. Since the lamellae are thought to be a stable substance with constant thickness in iridocytes, in real situations, the variation of colors is more likely to be caused by the change of spacing. Similar to the lamellae in the iridocytes of giant clams, squid also has an unusual structure called reflectins that create thin-film interference, resulting in the reflection of certain incident light (Crookes et al., 2004; Kramer et al., 2007). The reflections in squid are connected to the extracellular environment. When the water flows between the reflectors and the extracellular space, the spacing of lamellae becomes larger or smaller, resulting in color variation of squid (DeMartini et al., 2013). We speculated that this phenomenon might also exist in giant clams, and studied the theoretical possibility of creating FDTD simulation of iridocytes in T. crocea. We also found that the structural colors caused by the thickness and spacing of laminae drive the reflected light of iridocytes to vary in the full spectrum as well as the ultraviolet region. However, different species or strains with typical coloration and patterns usually maintain their characteristics. Therefore, the Bragg structure of individual iridocytes may also stay in a stable range.
Functions of Individual Iridocytes to Produce Ultraviolet Radiation
In addition, there is another interesting phenomenon in the FDTD simulation results: when the lamellar structure meets certain conditions, iridocytes will generate ultraviolet radiation, which is not useful for giant clams. In general, low dose ultraviolet would benefit organisms with sterilization, while high energy strong ultraviolet radiation (280-400 nm) often imposes adverse effects, such as DNA damage, oxidative stress, and inhibition of photosynthesis (Lesser, 1996; van de Poll et al., 2001; Llabres et al., 2013). To protect the giant clam itself, there are countless eyes and photosensitivity cells along the margin of the mantle, which can sense light (Wilkens, 1984; Land, 2003). This visual system is also sensitive to ultraviolet radiation, thus enabling the giant clams to respond to a dynamic environment and to meet the requirements of clam symbionts (Rossbach et al., 2020a). Many marine bivalves can rapidly adapt to various environmental conditions. Marine bivalves have been found to actively modify the calcification physiology in response to an acidifying ocean (Zhao et al., 2020). In addition, pearl oysters can respond plastically to marine heatwaves with a series of enzymes activity enhanced (He et al., 2021). Previous studies have shown that giant clams can avoid high-intensity ultraviolet damage in some special ways. Iridocytes in the mantle are thought to eliminate part of ultraviolet radiation by performing non-photosynthetic backscattering (Ghoshal et al., 2016a). Some studies believe that the lamellae stacks of the iridocytes, guanine, absorb ultraviolet radiation to protect the giant clams and promote zooxanthellae photosynthesis by continuously emitting longer wavelengths of light (Rossbach et al., 2020b). The symbiotic microalgae harbored by giant clams, zooxanthellae, can absorb certain wavelengths of light for performing photosynthesis. Abundant zooxanthellae live in the mantle of giant clams and form the tertiary zooxanthellae tube (Norton and Jones, 1992). The iridescent cells are thought to be enhancers of zooxanthellae photosynthesis, improving the light-harvesting efficiency and solar energy conversion. More specifically, iridocytes over the surface of the mantle redeliver light to algal pillars with controlled doses (Holt et al., 2014) and selectively use some particular bands of light, resulting in iridescent colors. Therefore, the ultrastructure of iridocytes is closely related to the changes in the photic environment in giant clams, affecting the photosynthetic efficiency of symbiotic zooxanthellae. In addition, this may provide the driving force for the distribution of different clades of symbiosis that preferentially utilize different parts of the solar spectrum for photosynthesis. In addition, a special substance known as mycosporine-like amino acids (MAAs) was found in the mantle of giant clams, which plays the role of ultraviolet-resistance (Ishikura et al., 1997). The factors mentioned above provide photoprotection and promote the efficient use of sunlight energy. In this study, the simulation results show that iridocytes may also have the potential to produce minute doses of ultraviolet radiation, which means that ultraviolet radiation may impose both beneficial and adverse effects on the giant clams, depending on the ultraviolet radiation dose they receive or produce.
Conclusion
The boring giant clam, T. crocea, is characterized by the diverse color of the mantle, which is determined by the nanoscale structure of Bragg stacks in iridocytes. The thickness of alternating high and low refractive index layers leads to different coloration. Based on our FDTD results, iridocytes can generate a full spectrum of light. With the increase of thickness, the wavelength becomes longer and the reflected light moves towards the blue band even to the red band. Elucidating the color formation mechanism of individual iridocytes may help to further understand the mutualism between giant clam and zooxanthellae, as well as the adaptation of organisms to the environment. Further studies are required to explore the mechanism of the formation and stability of the specific coloration.
Data Availability Statement
The original contributions presented in the study are included in the article/supplementary material. Further inquiries can be directed to the corresponding authors.
Author Contributions
YHZ, ZY, and YL contributed to conception and design of the study. YYZ, JW, GS, QL, and SG conducted the experiments. ZZ performed the statistical analysis. YL and YYZ wrote the first draft of the manuscript. JL, YQ, and HM made suggestions and amendments to manuscripts. All authors contributed to manuscript revision, read, and approved the submitted version.
Funding
This work was supported by the Haina Provincial Key R&D Programme(ZDYF2021XDNY135, ZDYF2021XDNY183), National Key Research and Development Program of China (2020YFD0901102, 2018YFD0901400), Key Special Project for Introduced Talents Team of SouthernMarine Science and Engineering Guangdong Laboratory (Guangzhou) (GML2019ZD0404), the Chinese Ministry of Science and Technology through the National Science Foundation of China (31872566, 31702340, 32002387), Guangdong Provincial Key R&D Programme (2021B0202020003), the Network Service Local Plan STS of the Chinese Academy of Sciences (KFJ-STS-QYZD-158), the Innovation Academy of South China Sea Ecology and Environmental Engineering, Chinese Academy of Sciences (ISEE2018PY01, ISEE2018ZD02), the Open Foundation of the State Key Laboratory of Loess and Quaternary Geology(SKLLQG1813, SKLLQG1918), China Agriculture Research System of MOF and MARA, and the Science and Technology Planning Project of Guangdong Province, China (2017B030314052).
Conflict of Interest
The authors declare that the research was conducted in the absence of any commercial or financial relationships that could be construed as a potential conflict of interest.
Publisher’s Note
All claims expressed in this article are solely those of the authors and do not necessarily represent those of their affiliated organizations, or those of the publisher, the editors and the reviewers. Any product that may be evaluated in this article, or claim that may be made by its manufacturer, is not guaranteed or endorsed by the publisher.
Acknowledgments
The authors would like to thank the editor and several reviewers for their assistance in the manuscript revision process.
References
Almeida-Paes R., Borba-Santos L. P., Rozental S., Marco S., Zancope-Oliveira R. M., Da Cunha M. M. L. (2017). Melanin Biosynthesis in Pathogenic Species of Sporothrix. Fungal Biol. Rev. 31 (1), 50–59. doi: 10.1016/j.fbr.2016.09.001
Andrade P., Carneiro M. (2021). Pterin-Based Pigmentation in Animals. Biol. Lett. 17 (8), 12. doi: 10.1098/rsbl.2021.0221
Caro T., Mallarino R. (2020). Coloration in Mammals. Trends Ecol. Evol. 35 (4), 357–366. doi: 10.1016/j.tree.2019.12.008
Crookes W. J., Ding L. L., Huang Q. L., Kimbell J. R., Horwitz J., McFall-Ngai M. J. (2004). Reflectins: The Unusual Proteins of Squid Reflective Tissues. Science 303 (5655), 235–238. doi: 10.1126/science.1091288
Cuthill I. C., Allen W. L., Arbuckle K., Caspers B., Chaplin G., Hauber M. E., et al. (2017). The Biology of Color. Science 357 (6350), eaan0221. doi: 10.1126/science.aan0221
de Abreu M. S., Giacomini A., Genario R., dos Santos B. E., Marcon L., Demin K. A., et al. (2021). Color as an Important Biological Variable in Zebrafish Models: Implications for Translational Neurobehavioral Research. Neurosci. Biobehav. Rev. 124, 1–15. doi: 10.1016/j.neubiorev.2020.12.014
Delgado-Vargas F., Jimenez A. R., Paredes-Lopez O. (2000). Natural Pigments: Carotenoids, Anthocyanins, and Betalains - Characteristics, Biosynthesis, Processing, and Stability. Crit. Rev. Food Sci. Nutr. 40 (3), 173–289. doi: 10.1080/10408690091189257
DeMartini D. G., Krogstad D. V., Morse D. E. (2013). Membrane Invaginations Facilitate Reversible Water Flux Driving Tunable Iridescence in a Dynamic Biophotonic System. Proc. Natl. Acad. Sci. U. S. A. 110 (7), 2552–2556. doi: 10.1073/pnas.1217260110
De Tommasi E., Esposito E., Romano S., Crescitelli A., Di Meo V., Mocella V., et al. (2021). Frontiers of Light Manipulation in Natural, Metallic, and Dielectric Nanostructures. Rivista Del Nuovo Cimento 44 (1), 1–68. doi: 10.1007/s40766-021-00015-w
Doucet S. M., Meadows M. G. (2009). Iridescence: A Functional Perspective. J. R. Soc. Interface 6, S115–S132. doi: 10.1098/rsif.2008.0395.focus
Dou S. L., Xu H. B., Zhao J. P., Zhang K., Li N., Lin Y. P., et al. (2021). Bioinspired Microstructured Materials for Optical and Thermal Regulation. Adv. Mater. 33 (6), 29. doi: 10.1002/adma.202000697
Ghoshal A., Eck E., Gordon M., Morse D. E. (2016a). Wavelength-Specific Forward Scattering of Light by Bragg-Reflective Iridocytes in Giant Clams. J. R. Soc. Interface 13 (120), 20160285. doi: 10.1098/rsif.2016.0285
Ghoshal A., Eck E., Morse D. E. (2016b). Biological Analogs of RGB Pixelation Yield White Coloration in Giant Clams. Optica 3 (1), 108–111. doi: 10.1364/optica.3.000108
Griffiths D. J., Winsor H., Luongvan T. (1992). Iridophores in the Mantle of Giant Clams. Aust. J. Zool. 40 (3), 319–326. doi: 10.1071/Zo9920319
Gur D., Palmer B. A., Leshem B., Oron D., Fratzl P., Weiner S., et al. (2015). The Mechanism of Color Change in the Neon Tetra Fish: A Light-Induced Tunable Photonic Crystal Array. Angewandte Chem-Int. Ed. 54 (42), 12426–12430. doi: 10.1002/anie.201502268
He G. X., Liu X. L., Xu Y., Liang J., Deng Y. W., Zhang Y. H., et al. (2021). Repeated Exposure to Simulated Marine Heatwaves Enhances the Thermal Tolerance in Pearl Oysters. Aquat. Toxicol. 239, 105959. doi: 10.1016/j.aquatox.2021.105959
Heriyanto Gunawan I. A., Fujii R., Maoka T., Shioi Y., Kameubun K. M. B., et al. (2021). Carotenoid Composition in Buah Merah (Pandanus Conoideus Lam.), an Indigenous Red Fruit of the Papua Islands. J. Food Compos. Anal. 96, 10. doi: 10.1016/j.jfca.2020.103722
Hohenlohe P. A. (2014). Ecological Genomics in Full Colour. Mol. Ecol. 23 (21), 5129–5131. doi: 10.1111/mec.12945
Holt A. L., Vahidinia S., Gagnon Y. L., Morse D. E., Sweeney A. M. (2014). Photosymbiotic Giant Clams are Transformers of Solar Flux. J. R. Soc. Interface 11 (101), 13. doi: 10.1098/rsif.2014.0678
Ishikura M., Kato C., Maruyama T. (1997). UV-Absorbing Substances in Zooxanthellate and Azooxanthellate Clams. Marine Biol. 128 (4), 649–655. doi: 10.1007/s002270050131
Joron M., Frezal L., Jones R. T., Chamberlain N. L., Lee S. F., Haag C. R., et al. (2011). Chromosomal Rearrangements Maintain a Polymorphic Supergene Controlling Butterfly Mimicry. Nature 477 (7363), 203–U102. doi: 10.1038/nature10341
Kamishima Y. (1990). Organization and Development of Reflecting Platelets in Iridophores of the Giant Clam, Tridacna-Crocea Lamarck. Zool. Sci. 7 (1), 63–72.
Kawaguti S. (1966). Electron Microscopy on the Mantle of the Giant Clam With Special References to Zooxanthelar and Iridophores. Biol. J. Okayama Univ. 12, 81–92.
Kinoshita S., Yoshioka S. (2005). Structural Colors in Nature: The Role of Regularity and Irregularity in the Structure. Chemphyschem 6 (8), 1442–1459. doi: 10.1002/cphc.200500007
Kjernsmo K., Whitney H. M., Scott-Samuel N. E., Hall J. R., Knowles H., Talas L., et al. (2020). Iridescence as Camouflage. Curr. Biol. 30 (3), 551–55+. doi: 10.1016/j.cub.2019.12.013
Kramer R. M., Crookes-Goodson W. J., Naik R. R. (2007). The Self-Organizing Properties of Squid Reflectin Protein. Nat. Mater. 6 (7), 533–538. doi: 10.1038/nmat1930
Land M. F. (2003). The Spatial Resolution of the Pinhole Eyes of Giant Clams (Tridacna Maxima). Proc. R. Soc. B-Biol. Sci. 270 (1511), 185–188. doi: 10.1098/rspb.2002.2222
Lesser M. P. (1996). Elevated Temperatures and Ultraviolet Radiation Cause Oxidative Stress and Inhibit Photosynthesis in Symbiotic Dinoflagellates. Limnol. 41 (2), 271–283. doi: 10.4319/lo.1996.41.2.0271
Llabres M., Agusti S., Fernandez M., Canepa A., Maurin F., Vidal F., et al. (2013). Impact of Elevated UVB Radiation on Marine Biota: A Meta-Analysis. Glob. Ecol. Biogeog. 22 (1), 131–144. doi: 10.1111/j.1466-8238.2012.00784.x
Lopes R. J., Johnson J. D., Toomey M. B., Ferreira M. S., Araujo P. M., Melo-Ferreira J., et al. (2016). Genetic Basis for Red Coloration in Birds. Curr. Biol. 26 (11), 1427–1434. doi: 10.1016/j.cub.2016.03.076
Mello N. D., Sanchez L. G. F., Gawryszewski F. M. (2021). Spatio-Temporal Colour Variation of Arthropods and Their Environment. Evol. Ecol. 36 (1), 117–133. doi: 10.1007/s10682-021-10144-7
Norton J. H., Jones G. W. (1992). ACIAR Monograph Series: The Giant Clam: An Anatomical and Histological Atlas. ACIAR (Australian Centre for International Agricultural Research) {a}, Canberra, ACT, Australia.
Orteu A., Jiggins C. D. (2020). The Genomics of Coloration Provides Insights Into Adaptive Evolution. Nat. Rev. Genet. 21 (8), 461–475. doi: 10.1038/s41576-020-0234-z
Rossbach S., Overmans S., Kaidarova A., Kosel J., Agusti S., Duarte C. M. (2020a). Giant Clams in Shallow Reefs: UV-Resistance Mechanisms of Tridacninae in the Red Sea. Coral Reefs 39 (5), 1345–1360. doi: 10.1007/s00338-020-01968-w
Rossbach S., Subedi R. C., Ng T. K., Ooi B. S., Duarte C. M. (2020b). Iridocytes Mediate Photonic Cooperation Between Giant Clams (Tridacninae) and Their Photosynthetic Symbionts. Front. Marine Sci. 7. doi: 10.3389/fmars.2020.00465
Sandkam B. A., Deere-Machemer K. A., Johnson A. M., Grether G. F., Rodd F. H., Fuller R. C. (2016). Exploring Visual Plasticity: Dietary Carotenoids can Change Color Vision in Guppies (Poecilia Reticulata). J. Comp. Physiol. A-Neuroethol Sensory Neural Behav. Physiol. 202 (7), 527–534. doi: 10.1007/s00359-016-1097-9
Saranathan V., Finet C. (2021). Cellular and Developmental Basis of Avian Structural Coloration. Curr. Opin. Genet. Dev. 69, 56–64. doi: 10.1016/j.gde.2021.02.004
Saranathan V., Osuji C. O., Mochrie S. G., Noh H., Narayanan S., Sandy A., et al. (2010). Structure, Function, and Self-Assembly of Single Network Gyroid (I4132) Photonic Crystals in Butterfly Wing Scales. Proc. Natl. Acad. Sci. U. S. A. 107 (26), 11676–11681. doi: 10.1073/pnas.0909616107
Shawkey M. D., D'Alba L. (2017). Interactions Between Colour-Producing Mechanisms and Their Effects on the Integumentary Colour Palette. Philos. Trans. R. Soc. B-Biol Sci. 372 (1724), 9. doi: 10.1098/rstb.2016.0536
Tao A. R., DeMartini D. G., Izumi M., Sweeney A. M., Holt A. L., Morse D. E. (2010). The Role of Protein Assembly in Dynamically Tunable Bio-Optical Tissues. Biomaterials 31 (5), 793–801. doi: 10.1016/j.biomaterials.2009.10.038
Teyssier J., Saenko S. V., van der Marel D., Milinkovitch M. C. (2015). Photonic Crystals Cause Active Colour Change in Chameleons. Nat. Commun. 6, 7. doi: 10.1038/ncomms7368
Tian X., Peng N. N., Ma X., Wu L. M., Shi X., Liu H. F., et al. (2022). microRNA-430b Targets Scavenger Receptor Class B Member 1 (Scarb1) and Inhibits Coloration and Carotenoid Synthesis in Koi Carp (Cyprinus Carpio L.). Aquaculture 546, 737334. doi: 10.1016/j.aquaculture.2021.737334
van de Poll W. H., Eggert A., Buma A. G. J., Breeman A. M. (2001). Effects of UV-B-Induced DNA Damage and Photoinhibition on Growth of Temperate Marine Red Macrophytes: Habitat-Related Differences in UV-B Tolerance. J. Phycol 37 (1), 30–37. doi: 10.1046/j.1529-8817.2001.037001030.x
Wallbank R. W. R., Baxter S. W., Pardo-Diaz C., Hanly J. J., Martin S. H., Mallet J., et al. (2016). Evolutionary Novelty in a Butterfly Wing Pattern Through Enhancer Shuffling. PloS Biol. 14 (1), 16. doi: 10.1371/journal.pbio.1002353
Wilkens L. A. (1984). Ultraviolet Sensitivity In Hyperpolarizing Photoreceptors Of The Giant Clam Tridacna. Nature 309 (5967), 446–448. doi: 10.1038/309446a0
Zhao L. Q., Shirai K., Tanaka K., Milano S., Higuchi T., Murakami-Sugihara N., et al. (2020). A Review of Transgenerational Effects of Ocean Acidification on Marine Bivalves and Their Implications for Sclerochronology. Estuar. Coast. Shelf Sci. 235, 106620. doi: 10.1016/j.ecss.2020.106620
Keywords: Tridacna crocea, giant clams, iridocytes, mantle color, FDTD simulation, Bragg stacks
Citation: Li Y, Zhou Y, Wei J, Shi G, Liao Q, Guo S, Zhou Z, Li J, Qin Y, Ma H, Yu Z and Zhang Y (2022) Study on the Individual Coloring Mechanism of Iridescent Cells in the Mantle of the Boring Giant Clam, Tridacna crocea. Front. Mar. Sci. 9:883678. doi: 10.3389/fmars.2022.883678
Received: 25 February 2022; Accepted: 30 March 2022;
Published: 25 April 2022.
Edited by:
Xiaotong Wang, Ludong University, ChinaReviewed by:
Xizhi Huang, Johannes Gutenberg University Mainz, GermanyChunsheng Liu, Hainan University, China
Richard Braley, Aquasearch, Australia
Copyright © 2022 Li, Zhou, Wei, Shi, Liao, Guo, Zhou, Li, Qin, Ma, Yu and Zhang. This is an open-access article distributed under the terms of the Creative Commons Attribution License (CC BY). The use, distribution or reproduction in other forums is permitted, provided the original author(s) and the copyright owner(s) are credited and that the original publication in this journal is cited, in accordance with accepted academic practice. No use, distribution or reproduction is permitted which does not comply with these terms.
*Correspondence: Ziniu Yu, Y2FybHp5dUBzY3Npby5hYy5jbg==; Yuehuan Zhang, eWh6aGFuZ0BzY3Npby5hYy5jbg==