 Weilun Li1,2,3
 Jiansong Qiu1,4
 Peiyu Lei1,4Xiaohong Chen2Fei Fan1Xiaojun Deng1,3Yingen Dai5Yanqing Deng6
 Kexiong Wang1,3*
 Zhigang Mei1,3*
- 1The Key Laboratory of Aquatic Biodiversity and Conservation, Institute of Hydrobiology, Chinese Academy of Sciences, Wuhan, China
- 2Wuhan Pindu Technology Co., Wuhan, China
- 3Wuhan Baiji Conservation Foundation, Wuhan, China
- 4University of Chinese Academy of Sciences, College of Advanced Agricultural Sciences, , Beijing, China
- 5Jiangxi Aquatic Animal Protection and Rescue Center, Nanchang, China
- 6Jiangxi Provincial Key Laboratory of Hydrological and Ecological Monitoring, Nanchang, China
Phocoenidae live in fresh, coastal waters where they often share a significant portion of their habitat with humans. As a result, local activities (e.g., coastal fisheries and shipments) cause underwater noise pollution and threaten their ecosystem. To better conserve the habitat of porpoises, we aimed to study their activities in these waters by recording their echolocation clicks using a passive acoustic monitoring (PAM) system. However, because the off-line PAM instruments were often used in the past that need to be periodically deployed and recovered, data acquisition is typically obtained and analyzed in batches, rather than in real-time. A real-time PAM detection system would help minimize the impact of underwater noise on approaching porpoises. Furthermore, issues of bad quality data–with gaps due to loss or damage of the off-line PAM instruments–could be avoided with a real-time detection system. Therefore, in this study, we developed the Real-time Porpoise Click Detector-II (RPCD-II), equipped with a digital hydrophone, main memory (2 TB storage), a central processing unit, and a wireless transmission module. We deployed the RPCD-II under a docked fishing vessel at the Ganjiang River in Yangzi Zhou Town Fisheries Village, Nanchang City (8–9 December 2021), where it recorded signals of Yangtze finless porpoise and produced a real-time report. To validate the results of RPCD-II, another underwater sound recorder, the SoundTrap 300HF (ST), was also set up (as a control device) under the docked fishing vessel. Both devices recorded consistent results of 9330 clicks, further demonstrating RPCD-II’s ability for the real-time detection of Yangtze finless porpoise in the field.
Introduction
Continuous monitoring of the distribution and dynamic changes of endangered species populations is important when planning conservation measures and policies. With the advancements in methodology and technologies, new ways of monitoring animals have been developed as manpower-saving alternatives to human visual observation, such as using drones and cameras to monitor target animals and identify them through image detection algorithms (Atanbori et al., 2015; Li et al., 2021; Tarling et al., 2022). However, for underwater vocalizing animals like porpoises, with some species (such as harbor porpoises, Yangtze finless porpoises) critically endangered (Gallus et al., 2012; Huang et al., 2019), the application of camera technology is limited due to the turbidity and poor visibility of the coastal and riverside water bodies where they live. Passive acoustic monitoring (PAM) is suitable for them due to its characteristics of frequently emitting narrow-band high-frequency (NBHF) clicks (William et al., 1969; Møhl, 1973; Teilmann et al., 2002; Akamatsu et al., 2005; Kimura et al., 2009).
Originally, researchers marked the target signals by eye, manually checking the spectrogram of the acoustic data (Goold and Jefferson, 2002), which is a large amount of work and greatly dependent on the operator’s subjective judgment. Thus, some automatic programs have been developed, such as automatic filters with several parameters (such as the sound pressure level of clicks after band-pass filtering or the inter-click time intervals) based on event data loggers (Thomsen et al., 2005; Kyhn et al., 2008; Sven et al., 2008; Kimura et al., 2010.; Bailey et al., 2010) or spectrogram classification algorithms based on a convolutional neural network model to separate clicks from other noise (Mellinger, 2021; Seydi et al., 2022). However, the automatic filters were mainly built on event data loggers and important acoustic parameters, such as the center frequency of clicks or 3-dB bandwidth, are not included in the filters (Kimura et al., 2010; Kyhn et al., 2013; Fang et al., 2015). Only part of the filters calculated these parameters for extracting porpoise pulses in the audio (Clausen et al., 2018).
For convolutional neural network models, limited ground truth training data may reduce the algorithm’s accuracy (Soekhoe et al., 2016; Barbedo, 2018), and the detection rate is susceptible to spatial-temporal variation (Fang et al., 2019). In addition, this traditional “deploy-retrieve-analyze” pattern for PAM could not provide immediate information, which can be necessary to timely protect porpoises from exposure to strong ambient noise caused by anthropogenic construction or underwater blasting, and could cause temporary hearing damage to the porpoises (Eva and Stephen, 2018; Eva et al., 2019; Simonis et al., 2020; Benhemma-Le Gall et al., 2021). Under these conditions, real-time detection could play a vital role in the conservation of the animal.
Here, we describe a novel self-made device named Real-time Porpoise Click Detector-II (RPCD-II). The system is equipped with an automatic filter (Auto-Click Detector) to extract clicks through several parameters (such as 3-dB bandwidth, peak frequency, and inter-click interval changes within the click train), the threshold value of which was set according to a previous study (Fang et al., 2015). The filter operates without the need to build a local dataset and stores the waveform data to post-verify the system’s performance.
Yangtze finless porpoise (YFP, Neophocaena asiaeorientalis asiaeorientalis) is the only remaining freshwater cetacean in the Yangtze River Basin (Turvey et al., 2010), which emits a high level of click intensity, with an apparent sound pressure level of 163.7 to 185.6 dB (Li et al., 2006) and a peak-to-peak sound pressure level of more than 160 dB on the off axis (Akamastsu et al., 2005). The center frequency of the clicks is mainly distributed between 110 and 150 kHz (Fang et al., 2015). This species frequently produces NBHF clicks (on average, one click every 5–6 s), and among them there are buzzes (ICI< 10 ms) representing hunting behavior. PAM is a powerful tool for studying the occurrence, distribution, and behavior of YFP (Kimura et al., 2013).
SoundTrap HF300 has been used to record different types of clicks of Yangtze finless porpoises (Zhou et al., 2021) and to record the vocal frequencies of Yangtze finless porpoises in open water and captive environments (Serres et al., 2021). Therefore, the detection results of ST can be used as references to compare the effectiveness of RPCD-II for the detection of Yangtze finless porpoises, through which we can further infer the potential of the homemade system to be applied in other porpoises emitting NBHF clicks, such as harbor porpoises.
Materials and methods
Study site
The study site is in the Yangzi Zhou Town Fisheries Village of Ganjiang River (E115.961151, N28.779175). It is approximately 20 km upstream from Nanchang, the capital of Jiangxi Province. This section is a busy shipping waterway. For several years, there has been a group of finless porpoises inhabiting this river section, but scientific surveys of the area are lacking.
In this study, the RPCD-II and ST were placed together from the fishing boat moored near the south shore of the section. The hydrophones of both instruments were placed 1.5 m below the water surface to receive signals from YFPs, with a horizontal distance of 10.5 cm between the two instruments and 5 m offshore. We ensured the water depth of the hydrophone exceeds the ship’s draft. The location where we set up the instruments was a channel with a depth of 4.5 m during the dry period and 16.5 m during the rich period (average of 10.5–11.5 m) (Figure 1). These nearshore areas are their distribution hotspots.
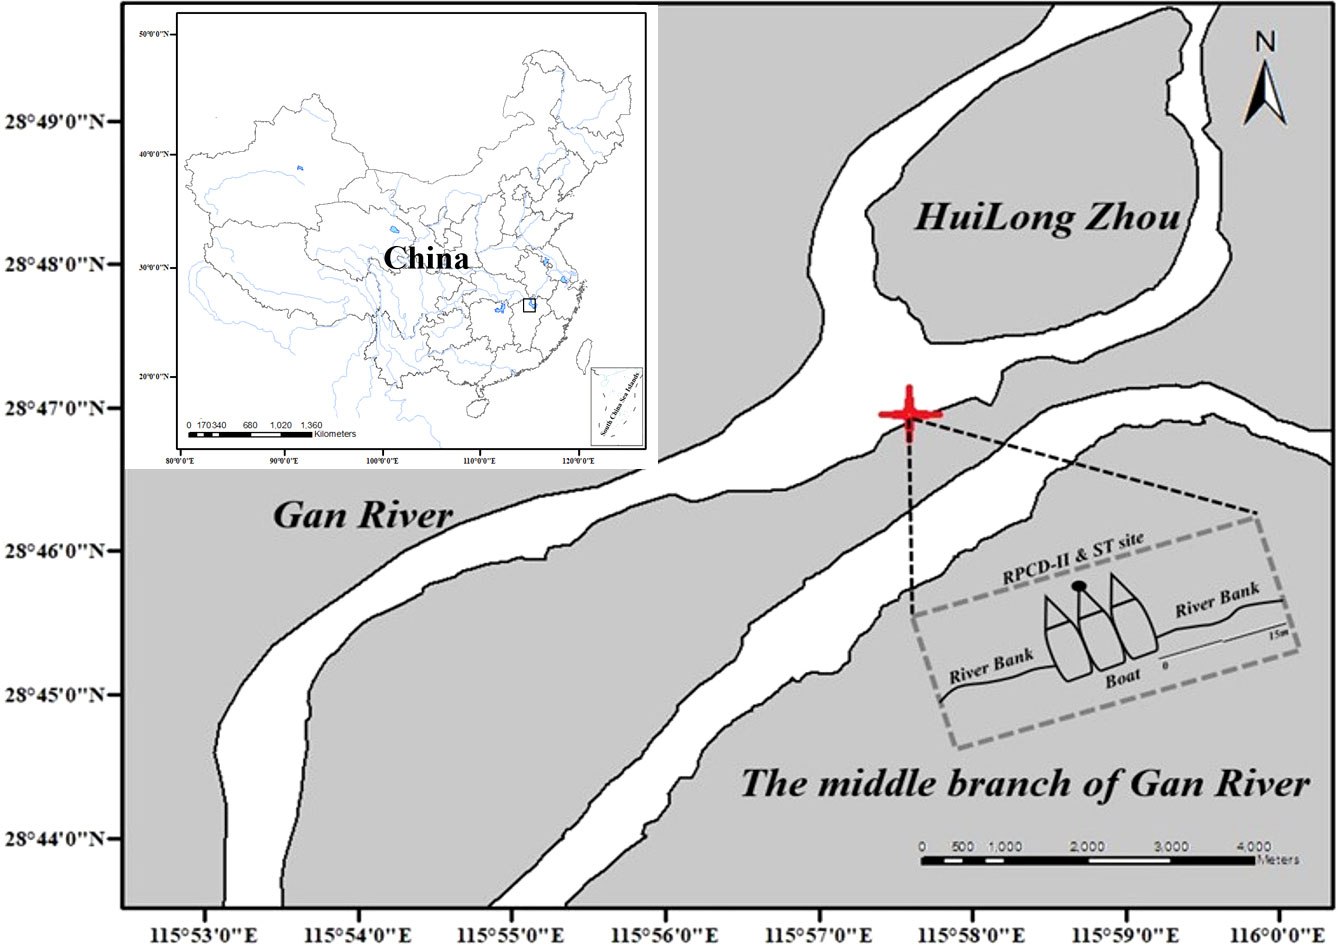
Figure 1 RPCD-II and SoundTrap 300HF were placed under the fishing boat moored near the shore, fixed on the same steel tube, with a horizontal distance of 10.5 cm between each other. The hydrophones of both instruments were placed 1.5 m below the water surface.
The RPCD-II operated constantly from 17:40 on December 08 to 09:30 on December 09, 2021. It has two modes: real-time reporting mode and recording mode, and both were on during the experiment. The sample rate of RPCD-II is 400 kHz, and data recorded were saved as WAV files every 1 min. The ST was recorded from 17:36 on December 08 to 09:45 on December 09, 2021. We programmed the ST to work for 1 min every 6 min, the sample rate was 576 kHz with high gain.
Instruments
RPCD-II is a real-time porpoise click detector co-developed by the Institution of Hydrobiology, Chinese Academy of Sciences and Wuhan Pindu Technology Co. Ltd (see Supplementary Materials 1, Figure S1). The system includes a self-made digital underwater sensor (hydrophone), a cable connecting the sensor to the chassis, a computing module (host computer), a power supply module, and a network transmission module (Figure S2). The sample rate of RPCD-II is up to 400 kHz; the working frequency is 20 Hz–200 kHz, and the Analog-to-Digital Converter resolution is 24 bit. The sensitivity of the hydrophone is -170 dB re 1 μPa. The self-noise of the system is lower than 35 dB re 1 μPa above 1 kHz. Apart from the real-time report function, RPCD-II also records constantly and saves the data into the storage space of 2 TB.
The digital hydrophone comprises three parts: sensor, cable, and metal acquisition box (Figure S3). The sensor contains a piezoelectric ceramic and a preamplifier, which transfers the sound pressure to the voltage signal, and the signals are transmitted to the acquisition box via a 20-meter cable. The metal acquisition box contains a low pass filter to filter high-frequency interference signals above 200 kHz. The analog-to-digital converter converts analog signals to digital signals. The data is transmitted to the host computer through power over ethernet (POE) port for computing. The sensitivity curve of the hydrophone has been obtained through hydrophone calibration experiments (Figure S4). According to the sensitivity curve, the hydrophone was found to be more sensitive above 100 kHz, which makes the clicks of the Yangtze finless porpoise with central frequency at 110–150 kHz could be recorded effectively.
SoundTrap 300HF is an underwater self-contained sound recorder (Ocean Instruments, New Zealand). The device has a relatively smooth frequency response curve (± 3 dB) at 20 Hz – 150 kHz (Cited from the official website introducing SoundTrap 300 HF: http://www.oceaninstruments.co.nz/soundtrap-300/), which is suitable for recording the high-frequency pulses produced by toothed whales. The sample rate is up to 576 kHz, and there are two gain modes, with a sensitivity of -173 dB re 1 μPa in the high gain mode.
Software in RPCD-II
A real-time click detection software named Auto-Click Detector (compiled in QT5.1 compiler, the main language is C++) has been developed and installed on the host computer. Auto-Click Detector reads data from the POE (Power over ethernet) port and cuts the data every second. Then, it picks out the segments (1 s) containing target signals and saves them as WAV files in designated catalogs. The spectrograms of the picked-out segments are drawn (dt = 0.00512s, df= 195.3125Hz) and saved as PNG files in specific catalogs. All the saved as WAV files and as PNG files are then transmitted through a 4G wireless network to the central server (Figure S5). The working procedure of Auto-Click Detector can be summarized as follows:
STEP 1: Filtering: The signals transmitted to Auto-Click Detector are cut into time segments (s) and filtered through a band-pass filter from 80 to 160 kHz (the filter band can be set freely).
STEP 2: Peak capturing: capture the peak after filtering. Mark the voltage peak that exceeds the specific threshold. In order to mitigate the impacts of reflections, if the time interval between two voltage peaks is less than 1ms (400 data points), replace the voltage data 19 points before and 40 points after the later peak with zero, and then do FFT transformation of 1024 points before and after the other peak remained (2048 points in total), obtaining the power spectrum density (PSD) curve. The peak frequency (fp) and the -3dB bandwidth is calculated. These are then compared to the acoustic parameters of Yangtze finless porpoise (Fang et al., 2015), keeping the matching pulses (Figure 2).
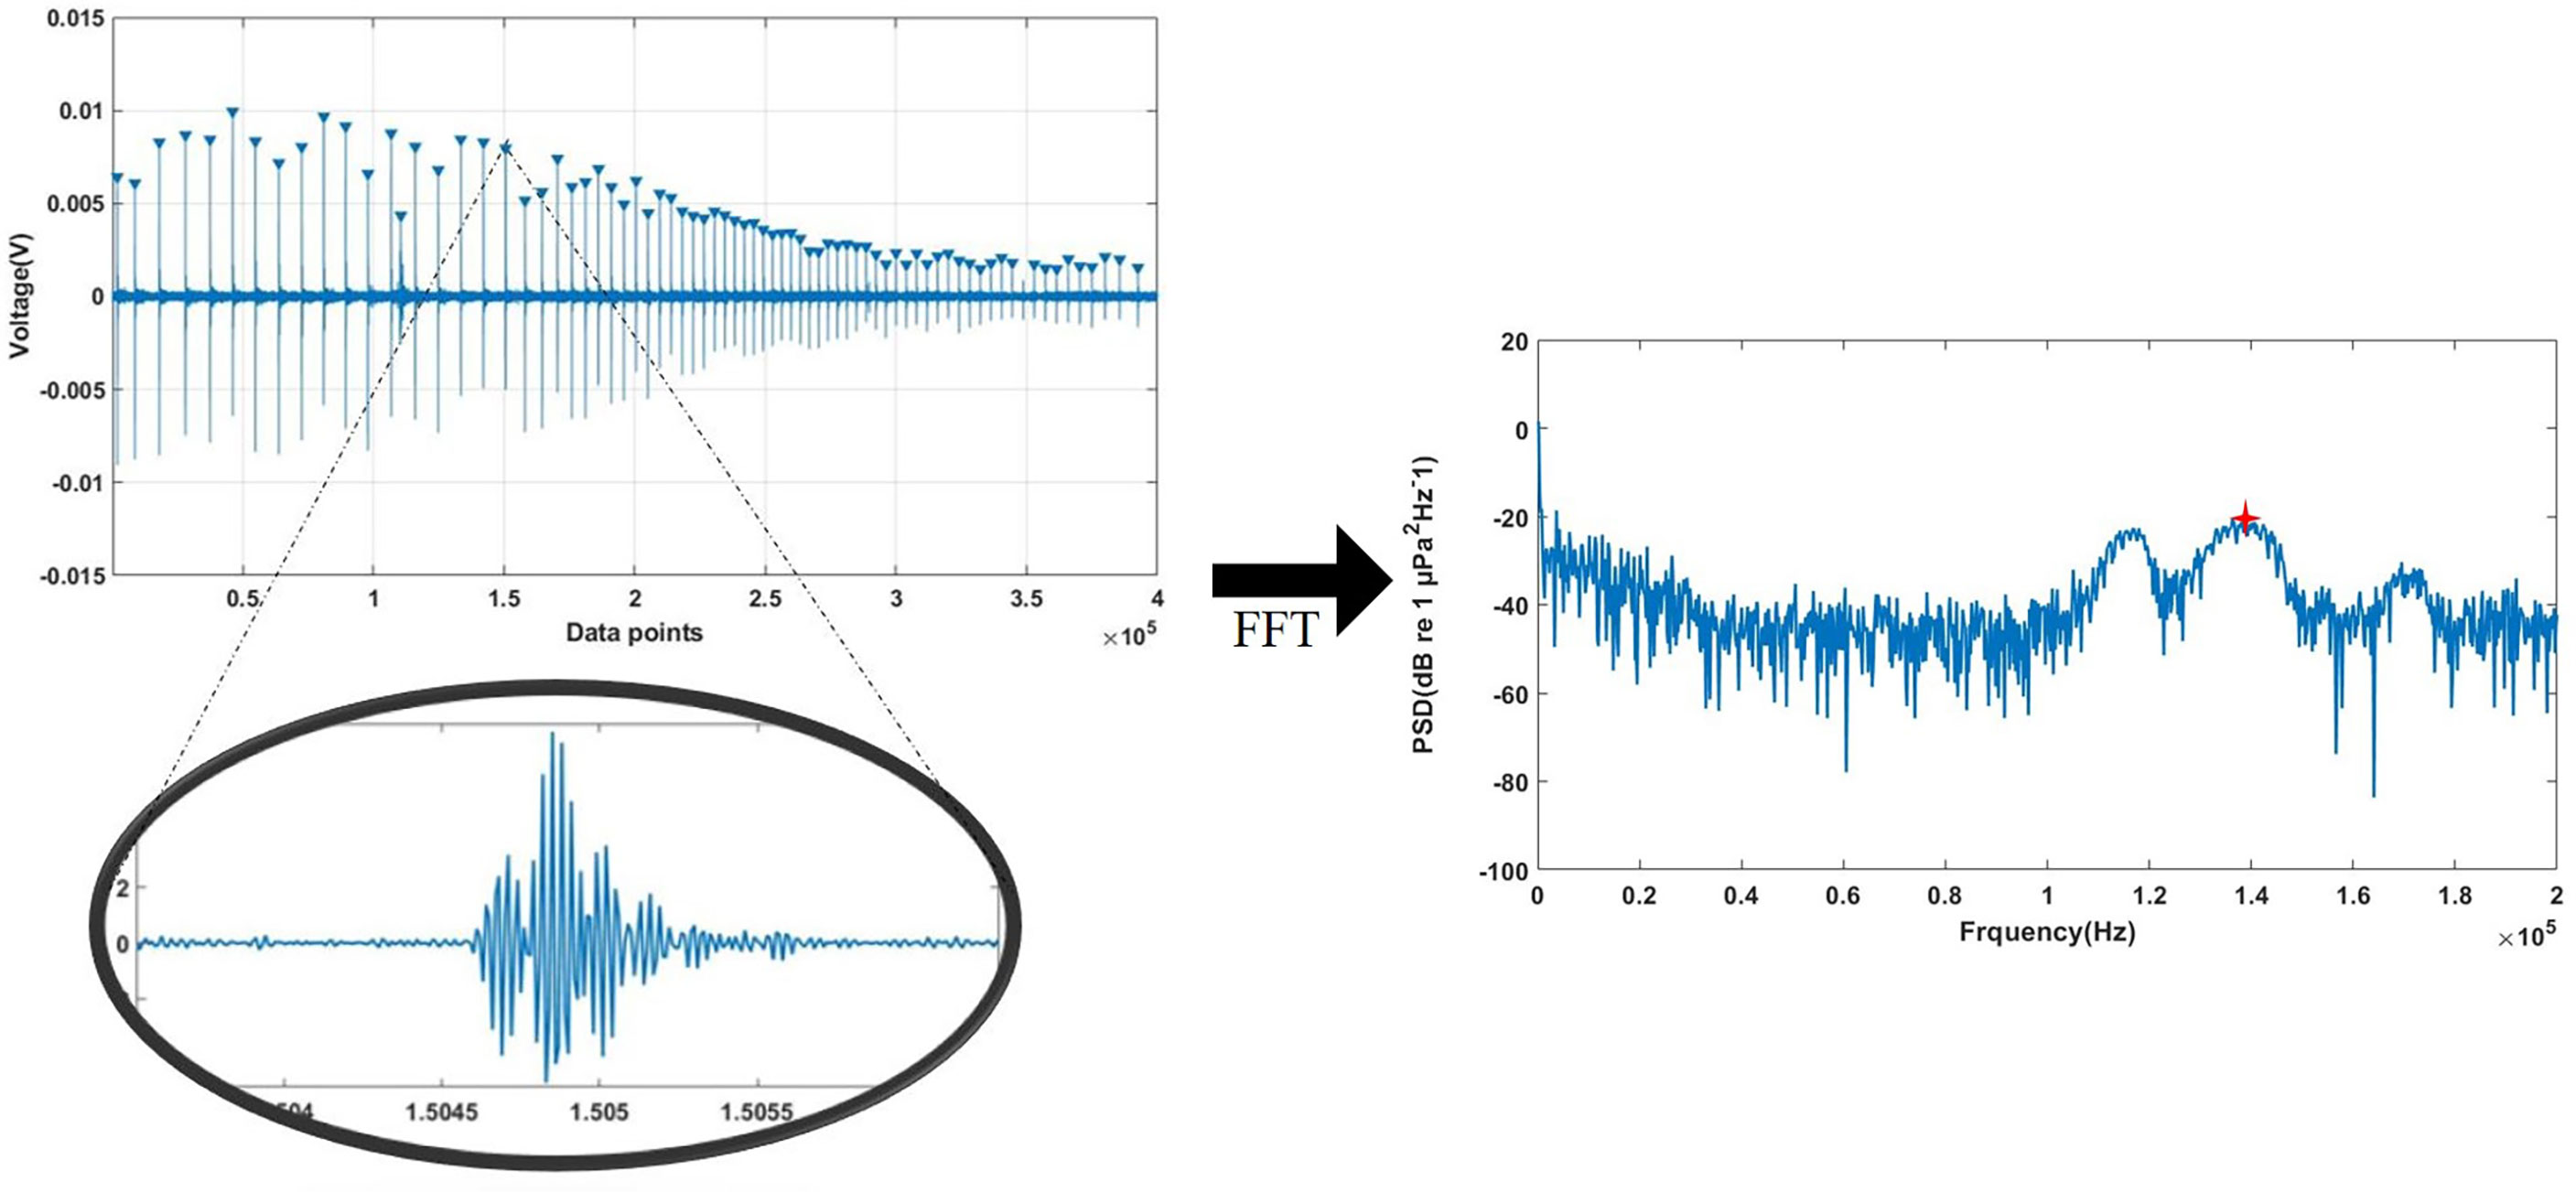
Figure 2 After band-pass filtering, we marked the peak of the pulse by setting the threshold (the inverted triangle mark in the figure). After deleting the peak that may be caused by reflection, we perform FFT transformation at 1024 points before and after the remaining marked peak to obtain PSD curve to calculate the peak frequency of each pulse.
STEP 3: Calculate the time interval between peaks: After removing the pulses that are not considered YFP clicks (Figure 3, red box). The time intervals between the remaining peaks were calculated. As shown in Figure 3, there are 73 valid pulses with 72 time intervals.
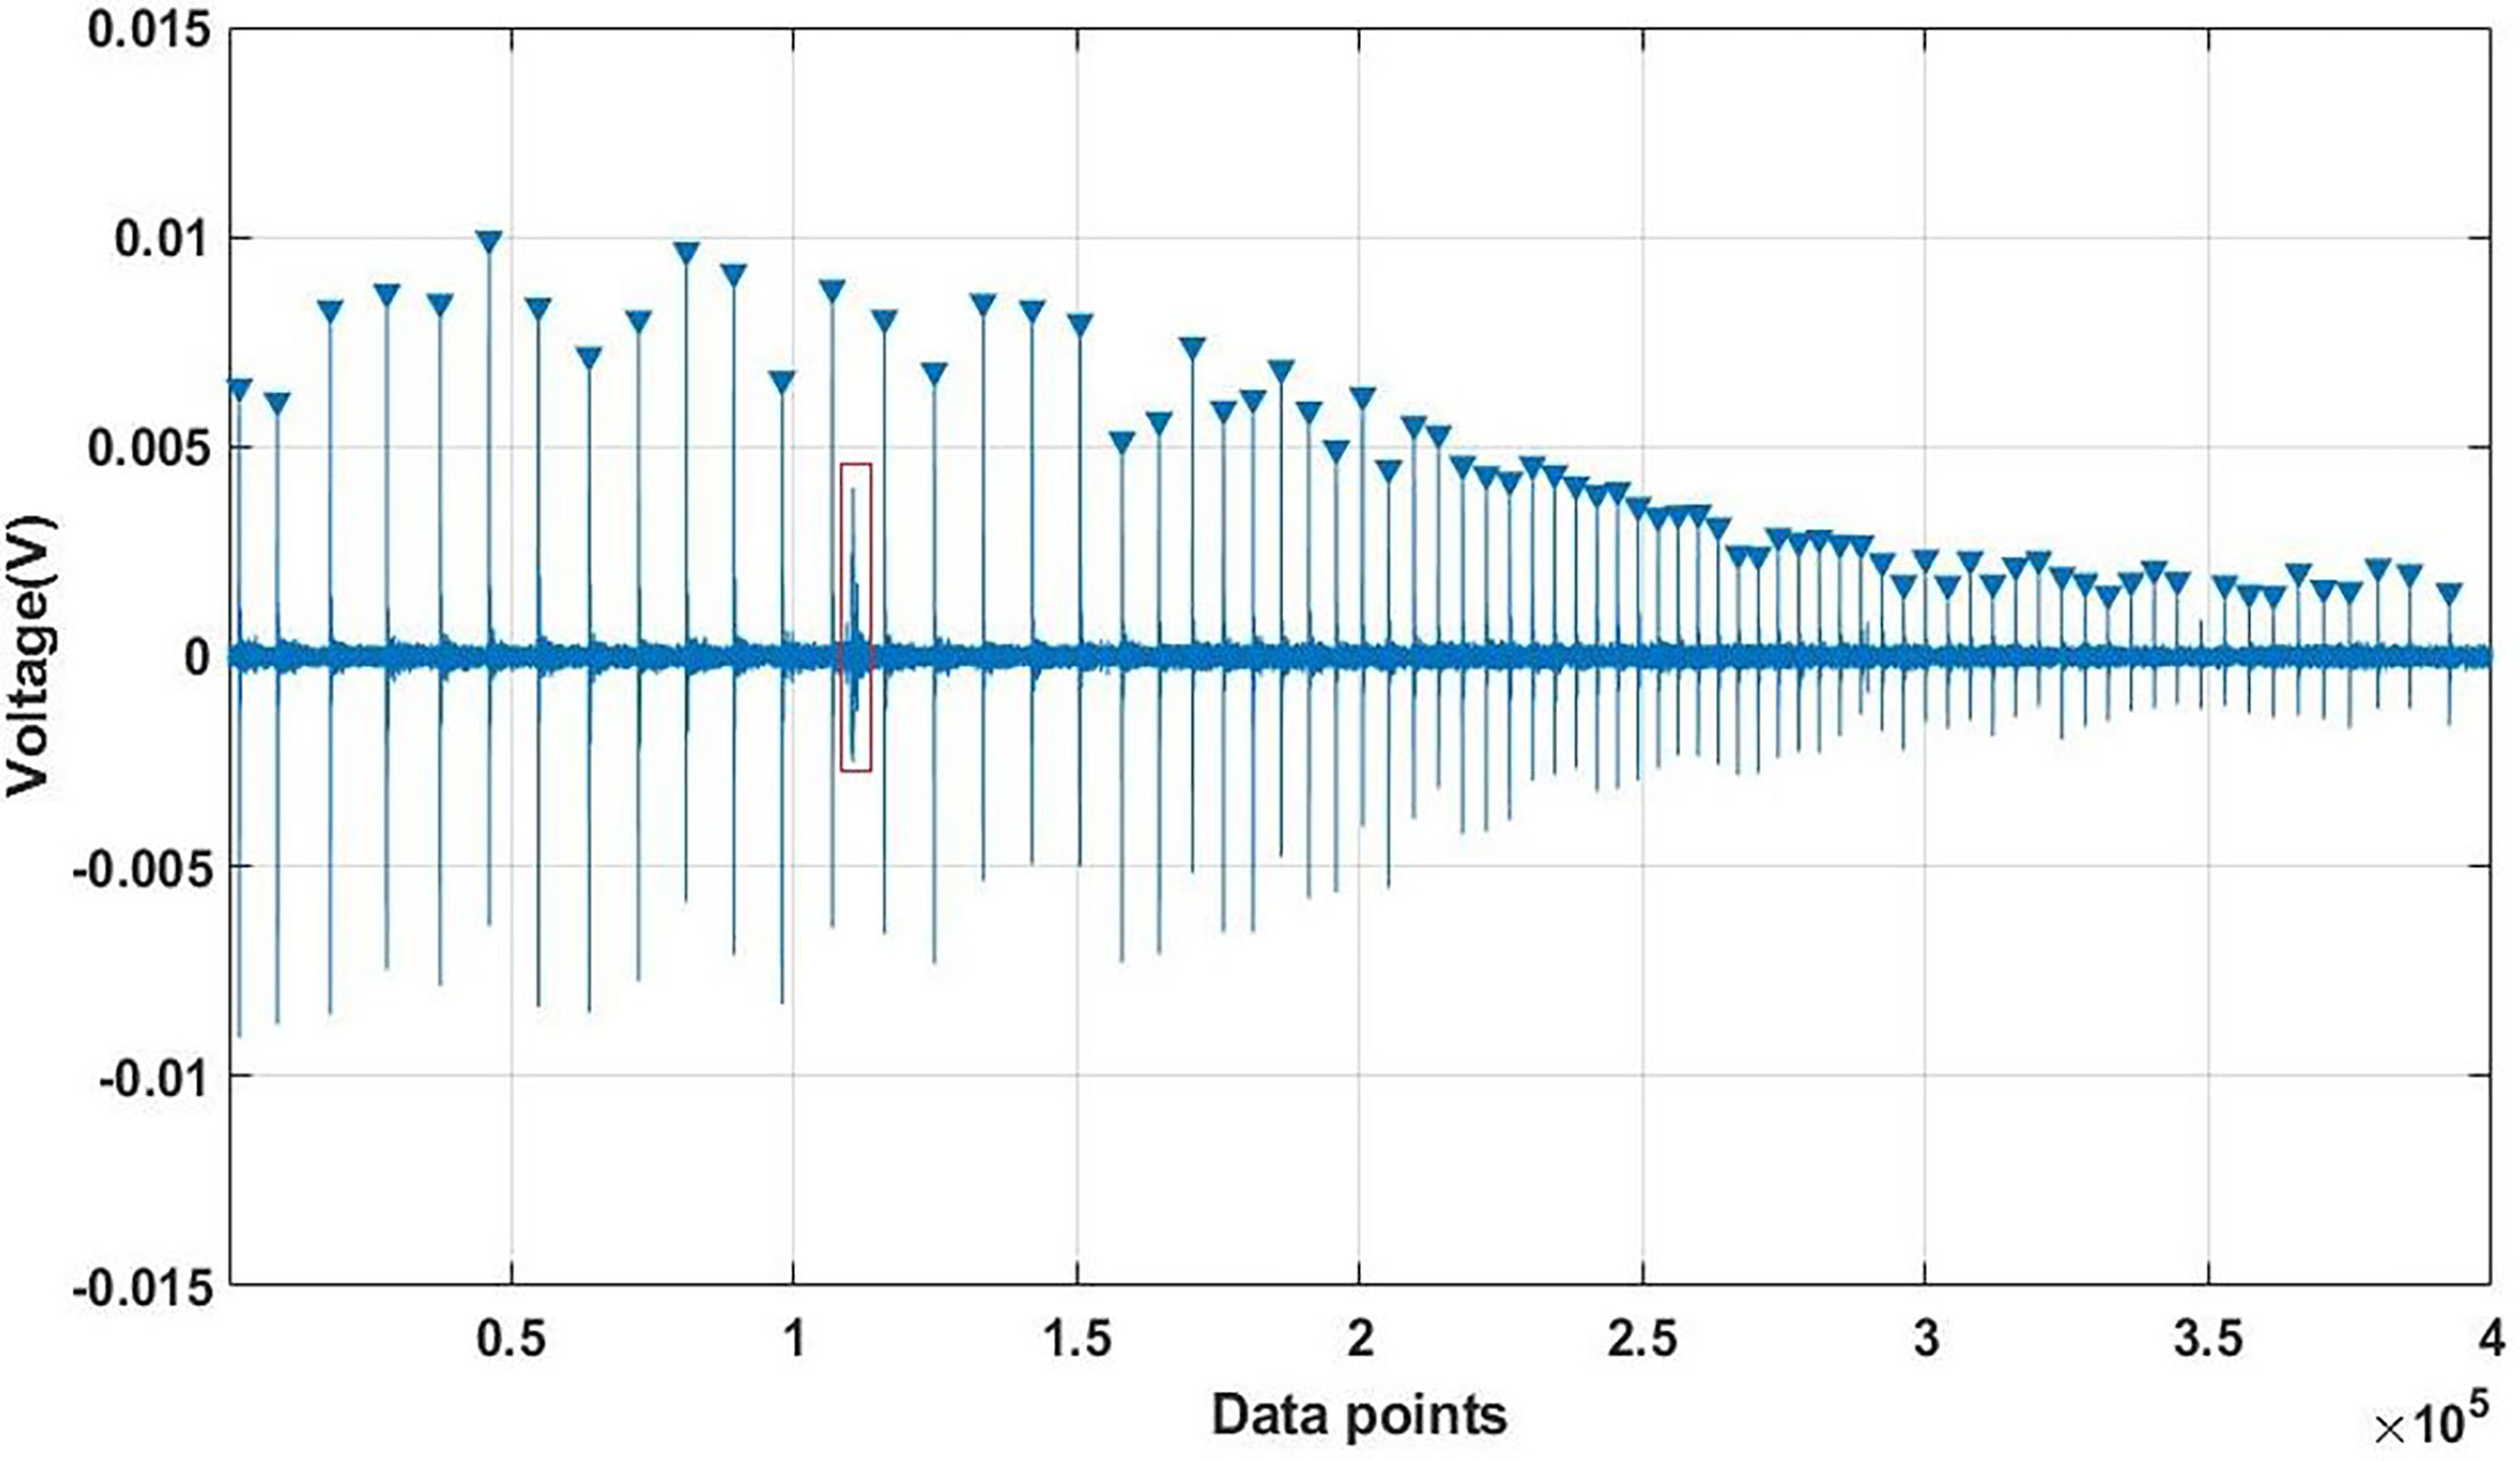
Figure 3 Calculating the time interval between peaks. The peaks are again marked after comparing with previous study (Fang et al., 2015), and the time intervals between peaks calculated.
STEP 4: Determine if var is less than the threshold value: Calculate the var value using the formula:
If var is less than the threshold, it will be stored in as WAV file format and sent back to the cloud platform, and the spectrogram will be drawn (PNG); we call this real-time reports.
We developed an event detection software based on Windows. We can detect the results catalog in real-time and transmit the results back to the cloud platform in real-time if they are detected (the data is transmitted back to the central server through the 4G module, and the whole data return takes less than 4 s; see Supplementary Materials 1 for platform login information).
RPCD-II performance verification
In this study, the ST was not equipped with a Click Detector; thus, the results generated by the real-time reporting mode of the RPCD-II and the recorded sound files of the ST were verified by two software programs: Raven Pro Bioacoustics software (version 2.0; Cornell Laboratory of Ornithology, NY, USA) and Matlab ver. 2021 (a routine specifically written for this study).
The first step was the manual verification of the spectrogram using Raven Pro Bioacoustics software to perform a manual visual analysis of the recorded sound spectra. The corresponding parameters were set as follows: Hanning window type; temporal resolution, 512 ms; frequency resolution, 195.3125 Hz; 2048 analysis window bits; 2048 Fourier transform bits.
We observed the energy distribution of the signals according to the results of Fang et al. (2015). We defined that the clicks of YFP were contained if the pulses were mainly located between 110 and 150 kHz and there were more than ten pulses in the frequency spectrum.
In the second step, the waveform data (from both the RPCD-II and ST) was verified through the first step using Matlab to extract the pulse peaks. We calculated the time intervals between peaks and the peak-to-zero sound pressure level for each peak. If the acoustic parameters of the pulses were in accordance with the parameters of the automatic click train detector for toothed whales mentioned by Kimura et al. (2010), the time of the clicks, and thus, the correct real-time report of RPCD-II and the seconds with YFP clicks in the ST data were marked.
Strict synchronization in the time domain was required to compare the waveform records of the two monitoring devices. In this experiment, the waveform records of the two instruments were checked in the time domain by tapping a rod six times on December 09, 2021. We calculated the generalized cross-correlation between the tapping pulse signals of the two instruments, and the highest number of correlations corresponds to the time difference between the two instruments receiving the same signal (Figures 4A, B).
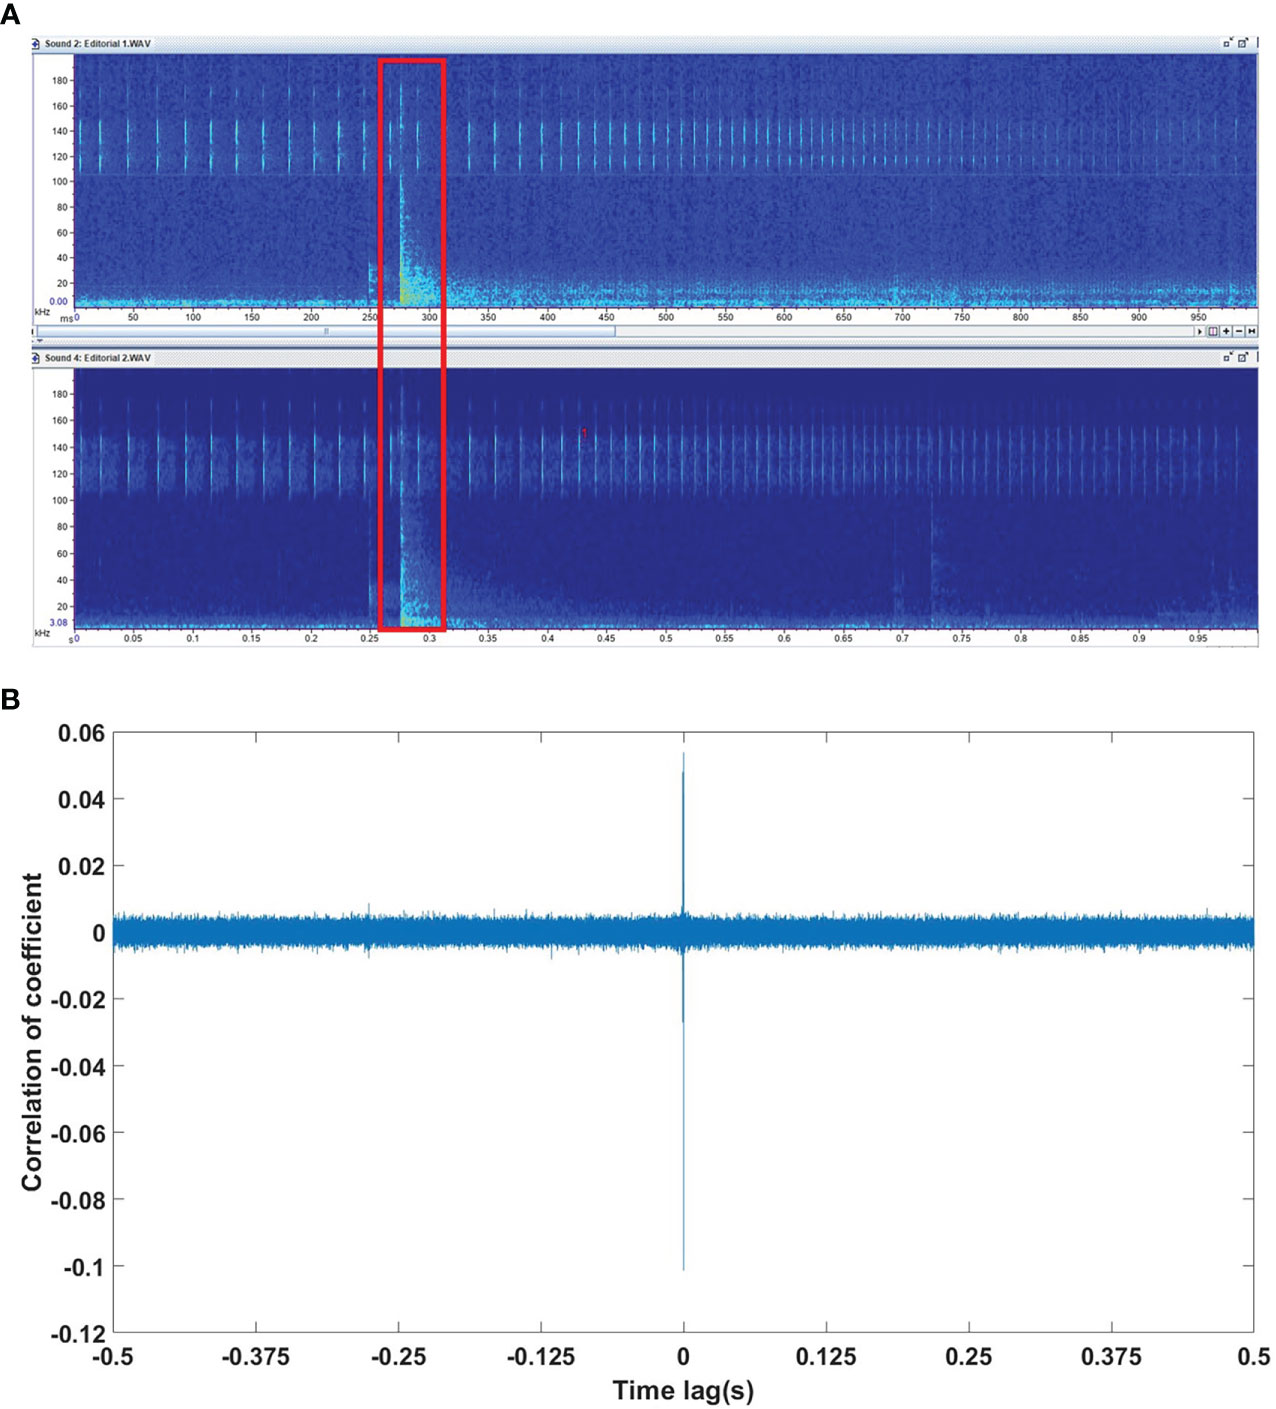
Figure 4 (A) Using Raven Pro Bioacoustics software (version 2.0; Cornell Laboratory of Ornithology, NY, USA) to read waveform data and plots the spectrogram for manual visual inspection. This figure shows the clicks of YFP recorded simultaneously by RPCD-II (top half of the figure) and ST (bottom half of the figure), with one of the manual taps recorded by both instruments in the red box; and (B) the time difference between the systems of the two instruments (the time corresponding to the maximum value of the correlation coefficient, marked by the triangle in the figure) is obtained by calculating the cross-correlation coefficient between the tapping recorded by the two instruments at the red box in (A).
After the above steps, the times when both instruments detected clicks simultaneously were defined as common detection events. The zero-to-peak sound pressure level of the clicks in those events was calculated to obtain the 1%, 25%, 50%, 75%, and 99% percentile intensities. The number of YFP clicks in all the verified reports of RPCD-II was summed, and the inter click intervals (ICIs) were recorded to determine whether clicks were within buzzes. We counted the effective recording lengths of both devices during the experiment in seconds. The power spectra of all seconds were averaged after Fourier transforms every 400 k voltage value, and the 1/3-octave power spectra were calculated according to the 1/3-octave band range (refer to ANSI S 1.6-1986) ISO 266:1997(E)).
Results
During the experiment, RPCD-II generated 3214 real-time reports, only three of which were false alarms (false alarm rate = 0.0093%) after verification (see Section 2.5). Each real-time report contains a period of 1 s. The system effectively separated YFP clicks from other high-frequency noises (Figure 5) and the total correct time was 3211 s, containing 76,611 YFP clicks (Table 1), of which 55.19% of the correct reports contained buzzes (implying a minimum click interval of less than 10 ms, Table 2).
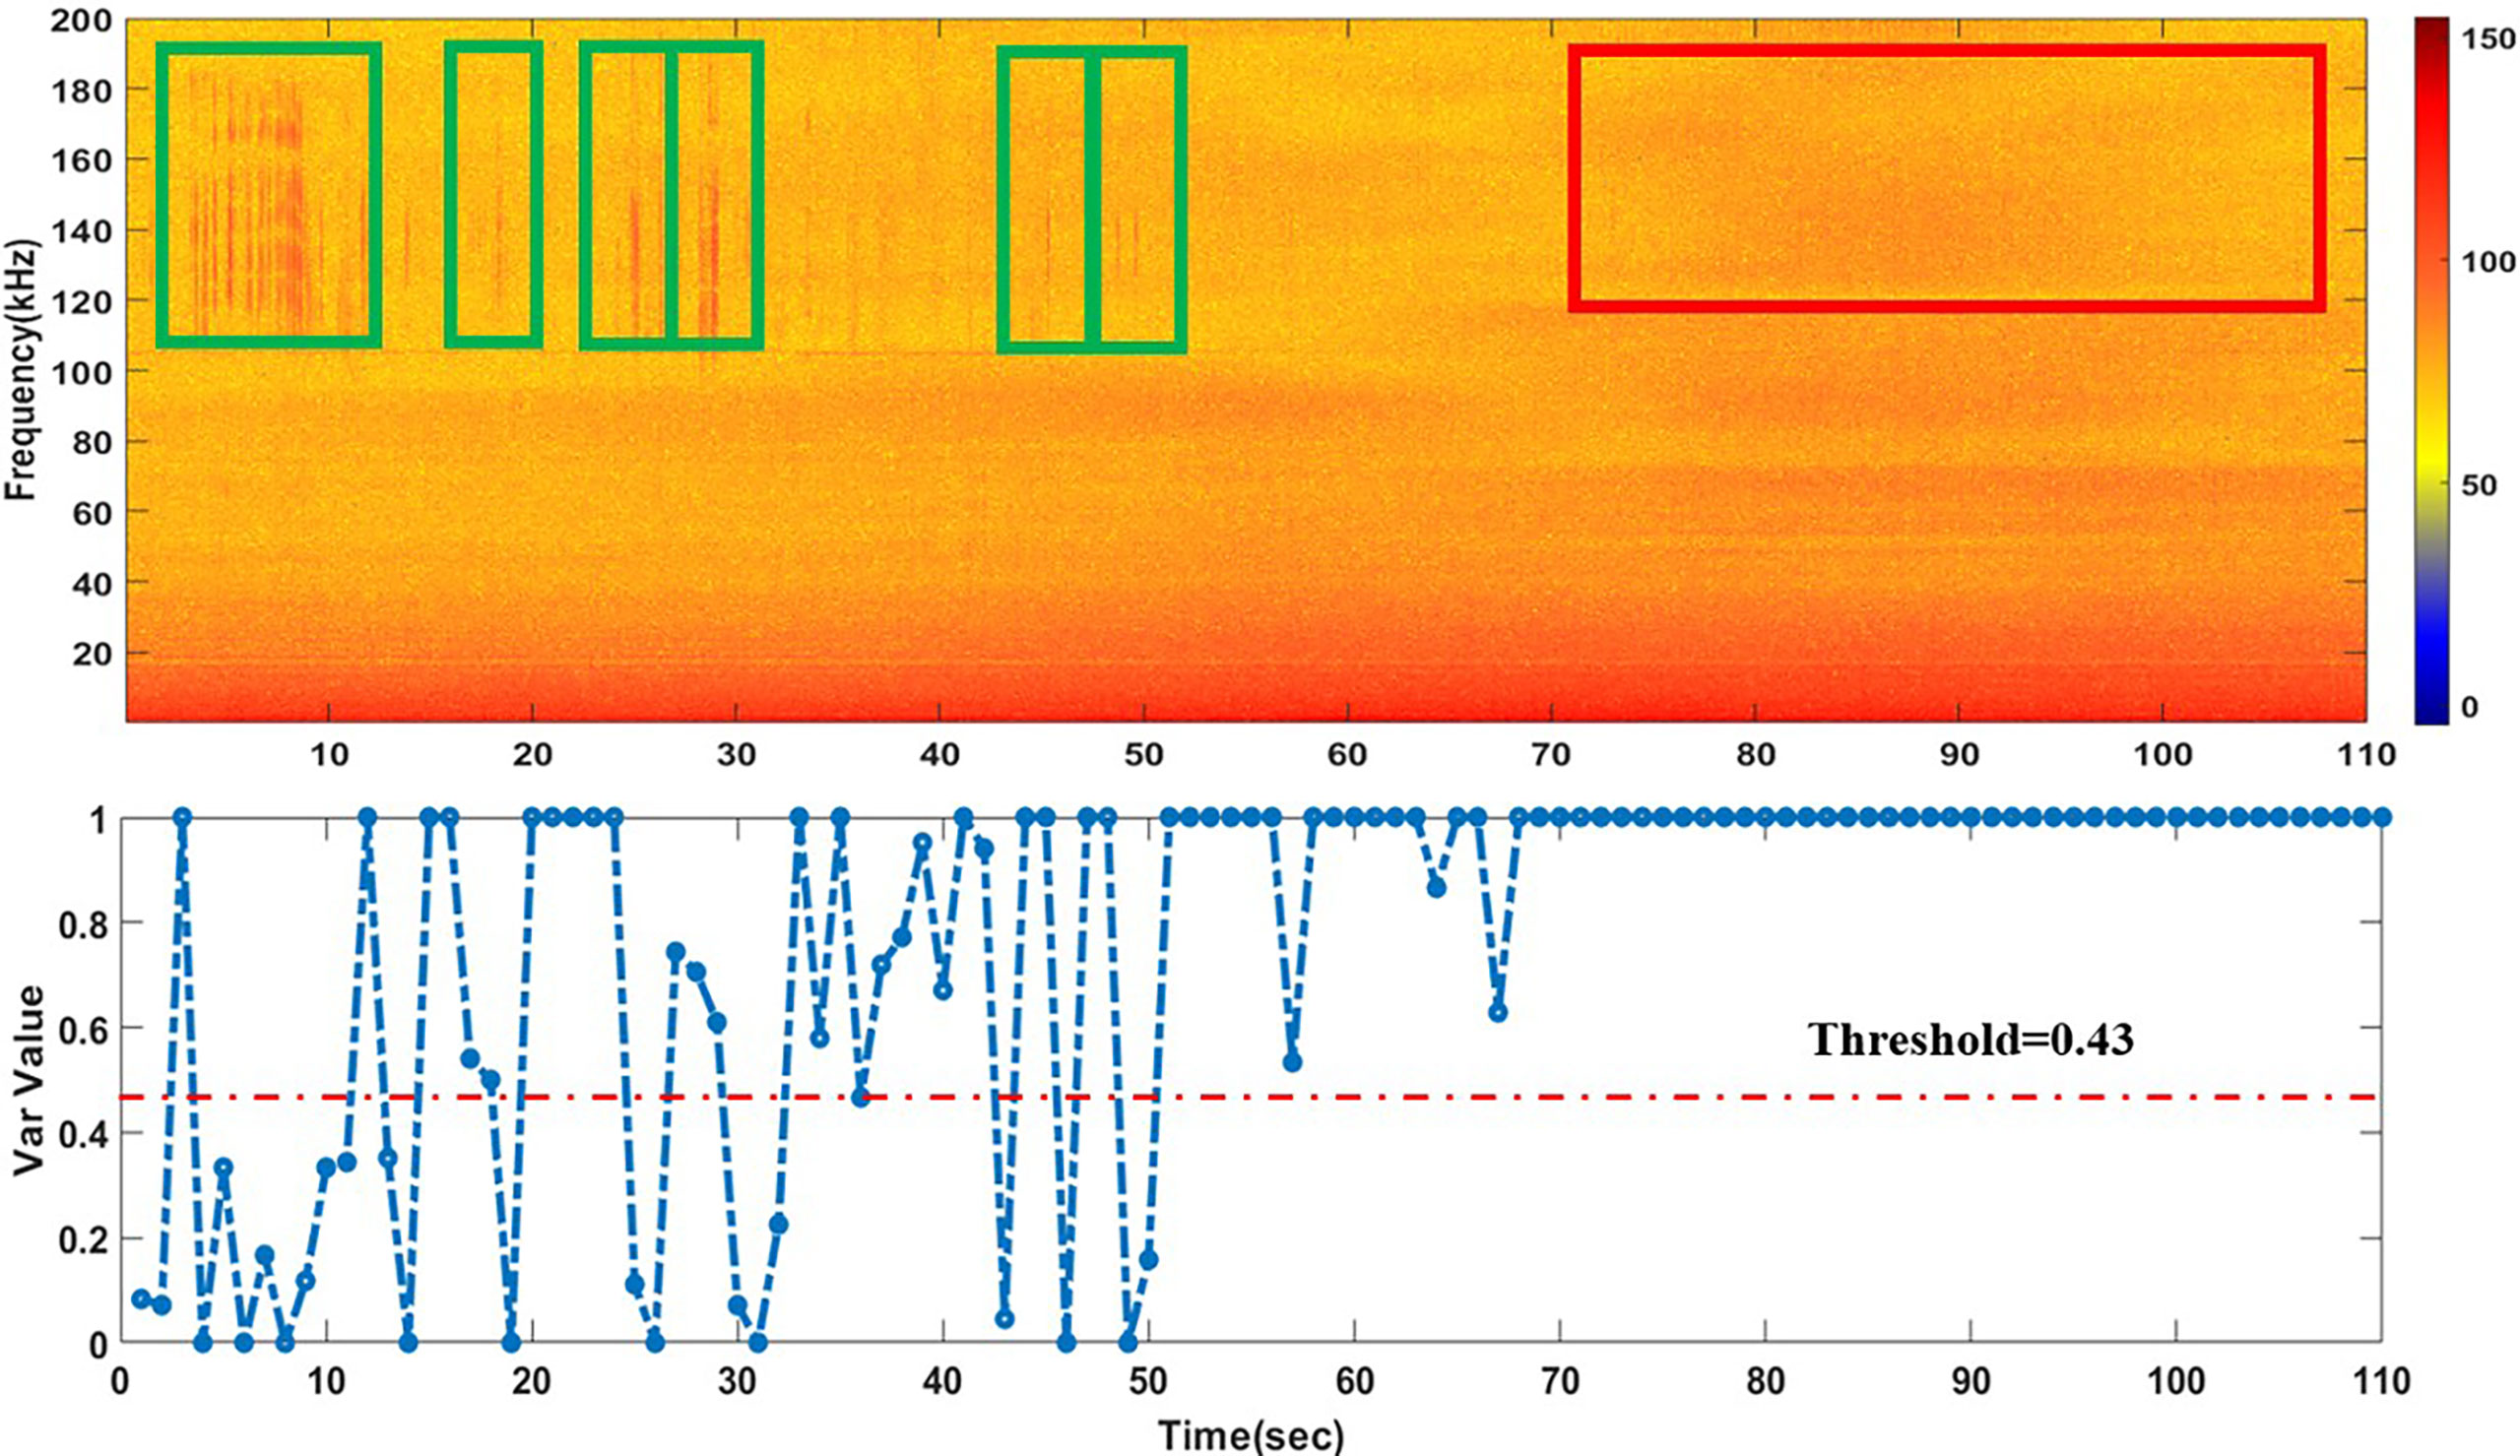
Figure 5 Var is the most important parameter of Auto-Click Detector in RPCD-II system, var is calculated per second, if it is less than the threshold value (=0.43), it will generate real time report (in seconds). This figure shows the recording results from 2021/12/08 20:26:46 to 12/08 20:28:46, the green box is the clicks of YFP, the red box is the broadband noise from ship (the upper part is the time spectrum; color label represents PSD in units of dB re 1μ Pa2 Hz−1 ). The lower half is the var value that corresponds to the number of seconds.
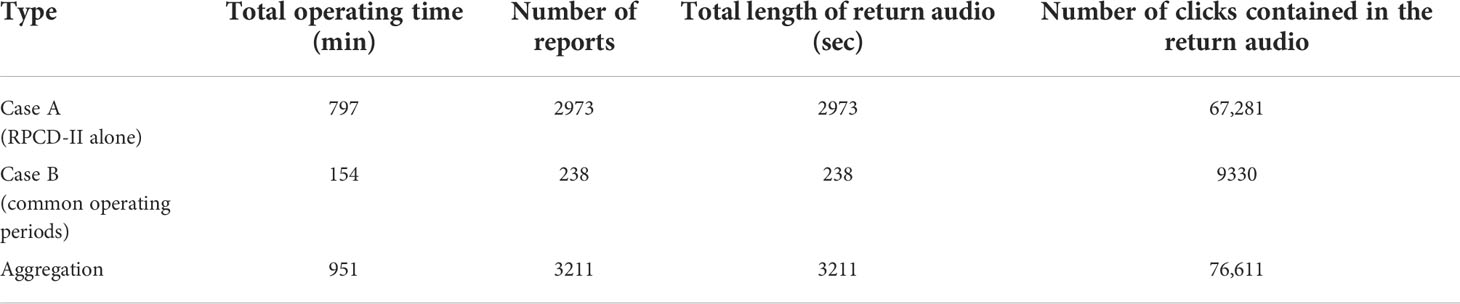
Table 1 Comparison of the number of reports and the number of clicks contained in Case A (RPCD-II alone) and Case B (the common operating periods of RPCD-II and SoundTrap 300HF).

Table 2 Proportion of buzzes detected by RPCD-II (From 3211 real-time reports).
In the periods when both the RPCD-II and STs were operating (Table 1), the number of seconds that ST was flagged to contain the clicks of YFP was 238 s, and the RPCD-II real-time reporting system reported 238 common detection events in the same periods (Figure 6 shows one event). There were no additional reports from RPCD-II in other periods, and both the RPCD-II and ST records were consistent.
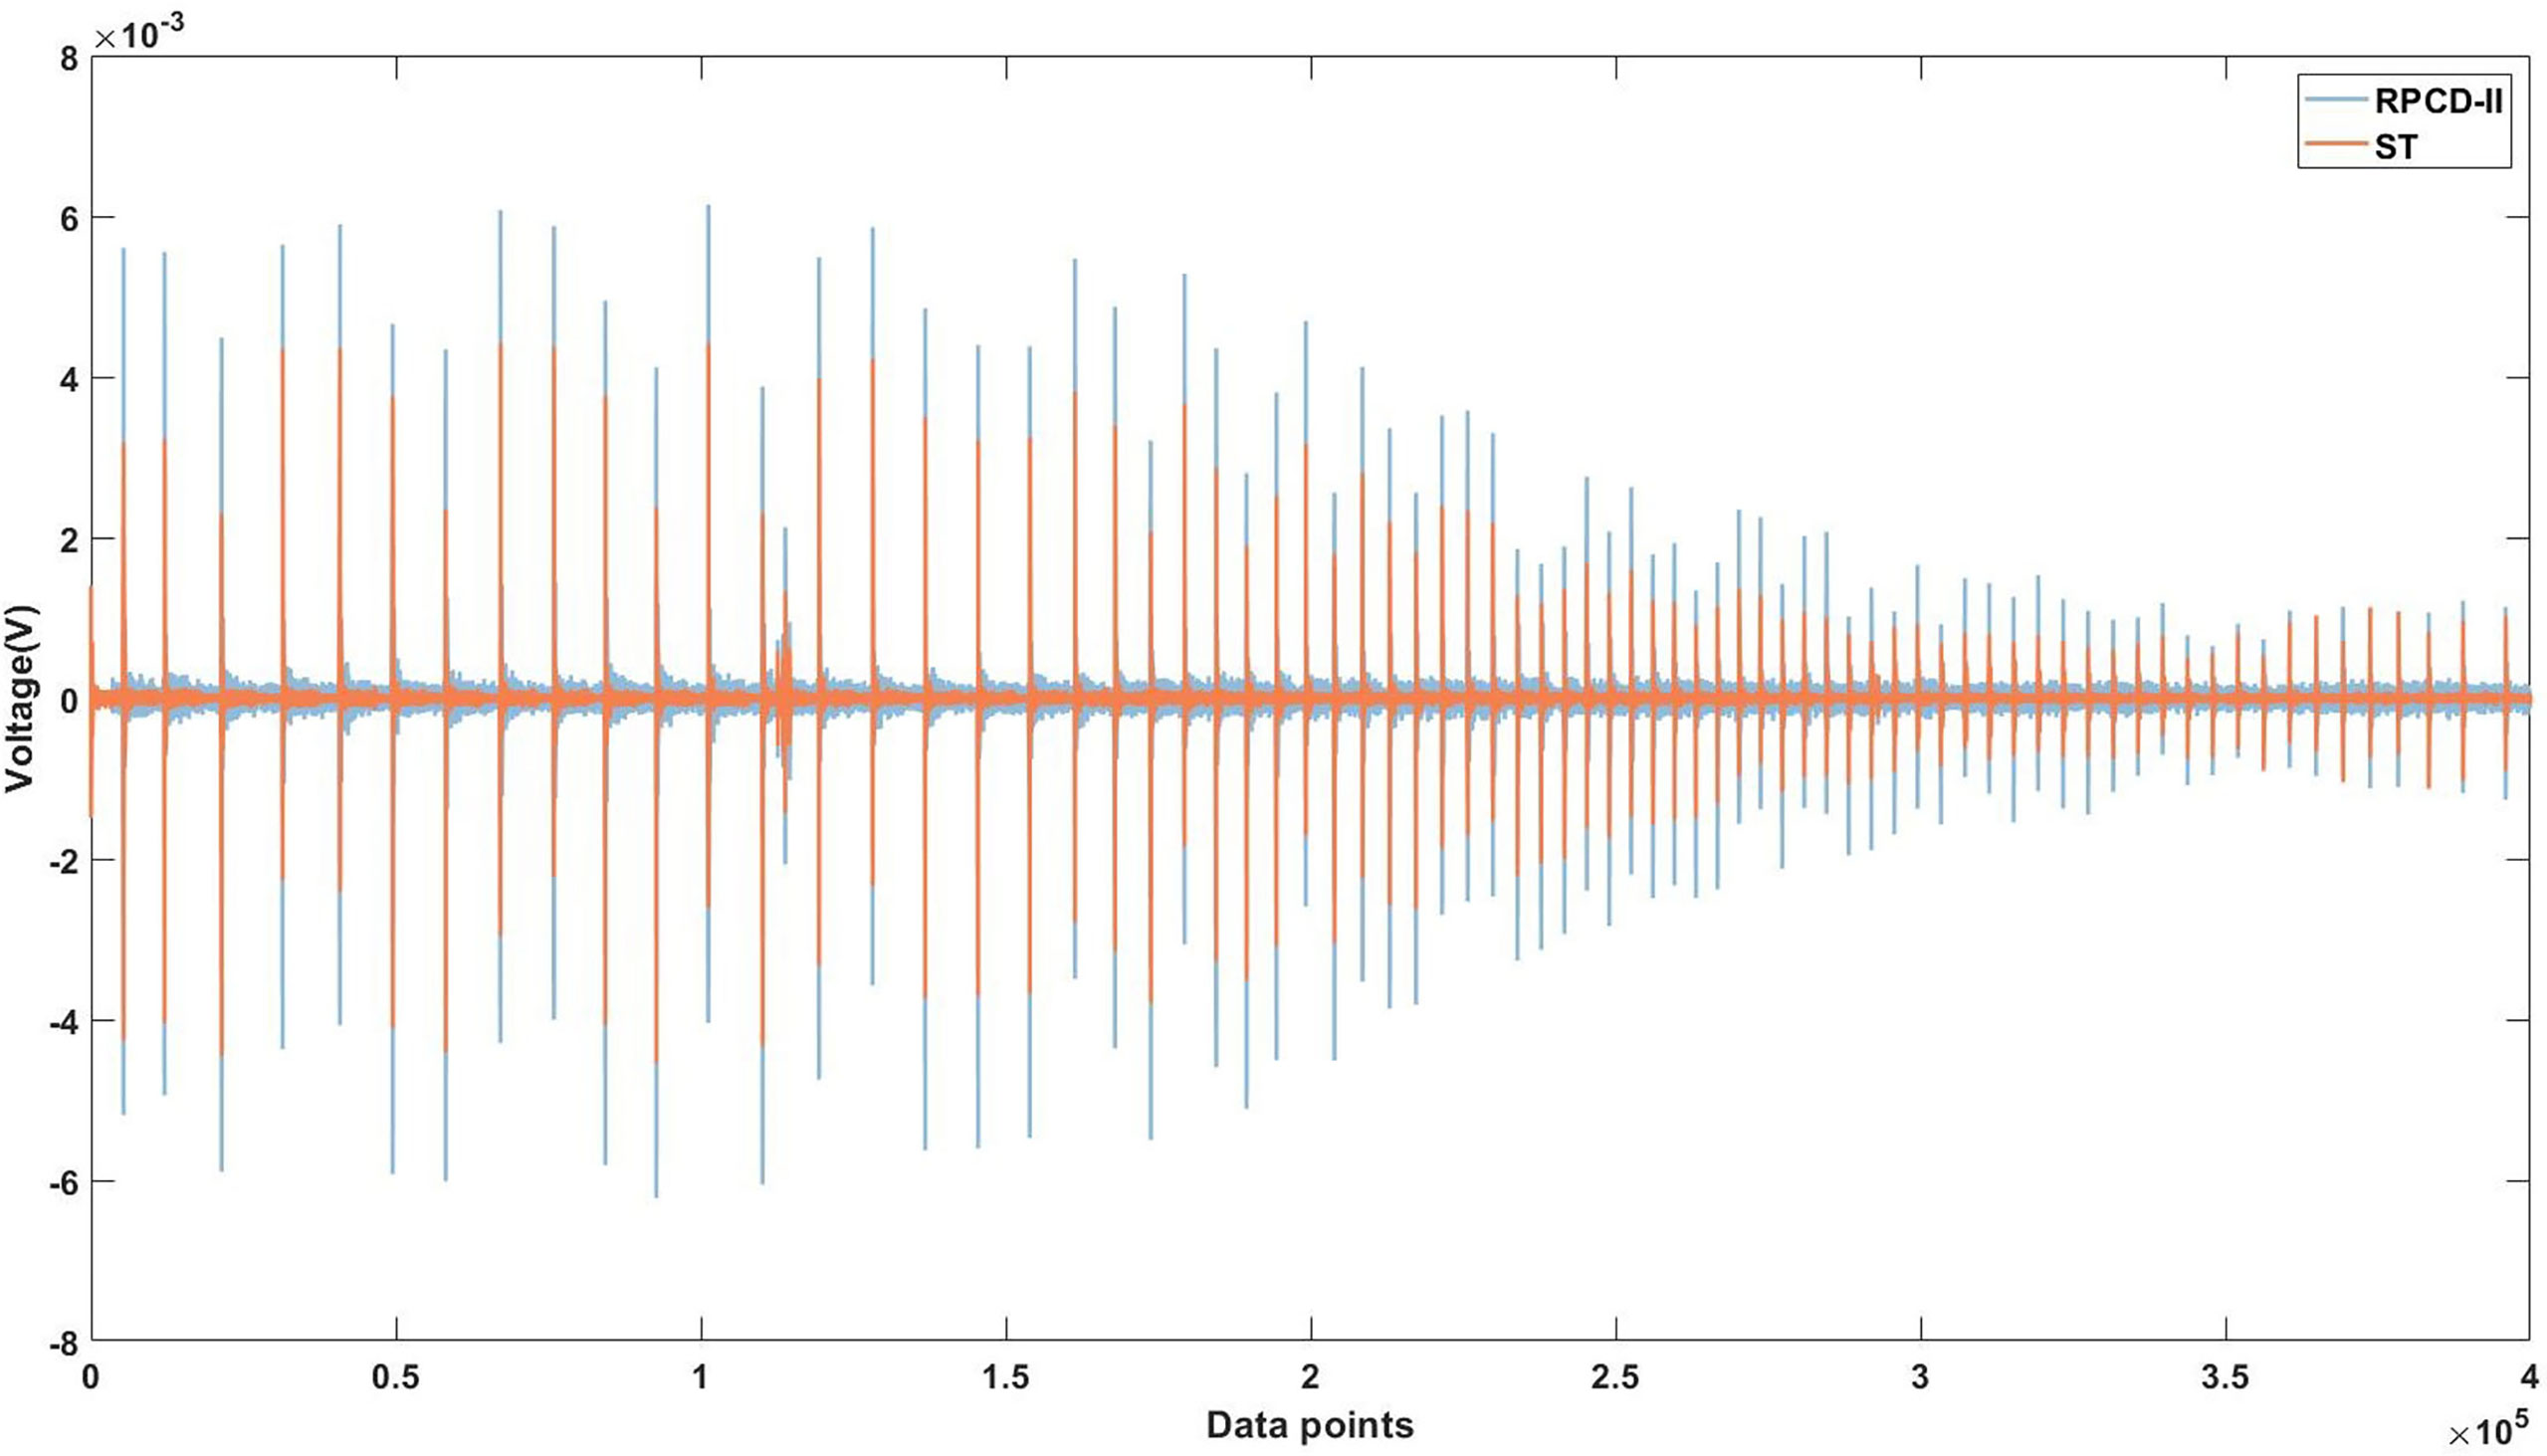
Figure 6 One of the common detection events (time of data was 07:56:38–07:56:39 on December 09, 2021). Both signals were time synchronized. The blue signal was recorded by RPCD-II and the orange signal was recorded by SoundTrap 300HF.
We defined “the 50th SPLzp recorded by both instruments” as Both_50th. From Table 1, we can see that the RPCD-II and the ST have a total of 9330 clicks in 238 common detection events (CDE). From Figure 7, we can see the difference between Both_50th was less than 10 dB in all CDE, and the 50th SPLzp recorded by RPCD-II was higher than that recorded by the ST in 68.48% of the CDE. The difference between both_50th was less than 2 dB in 34.5% of the CDE, between 2 and 4 dB in 20.3%, between 4 and 6 dB in 18.5%, and between 8 to 10 dB in 10.7%. In addition, from Figures 8A, B, we know that in the same CDE (such as the 60th to 62nd), the SPLzp of the clicks from the same click train can differ by more than 8 dB.
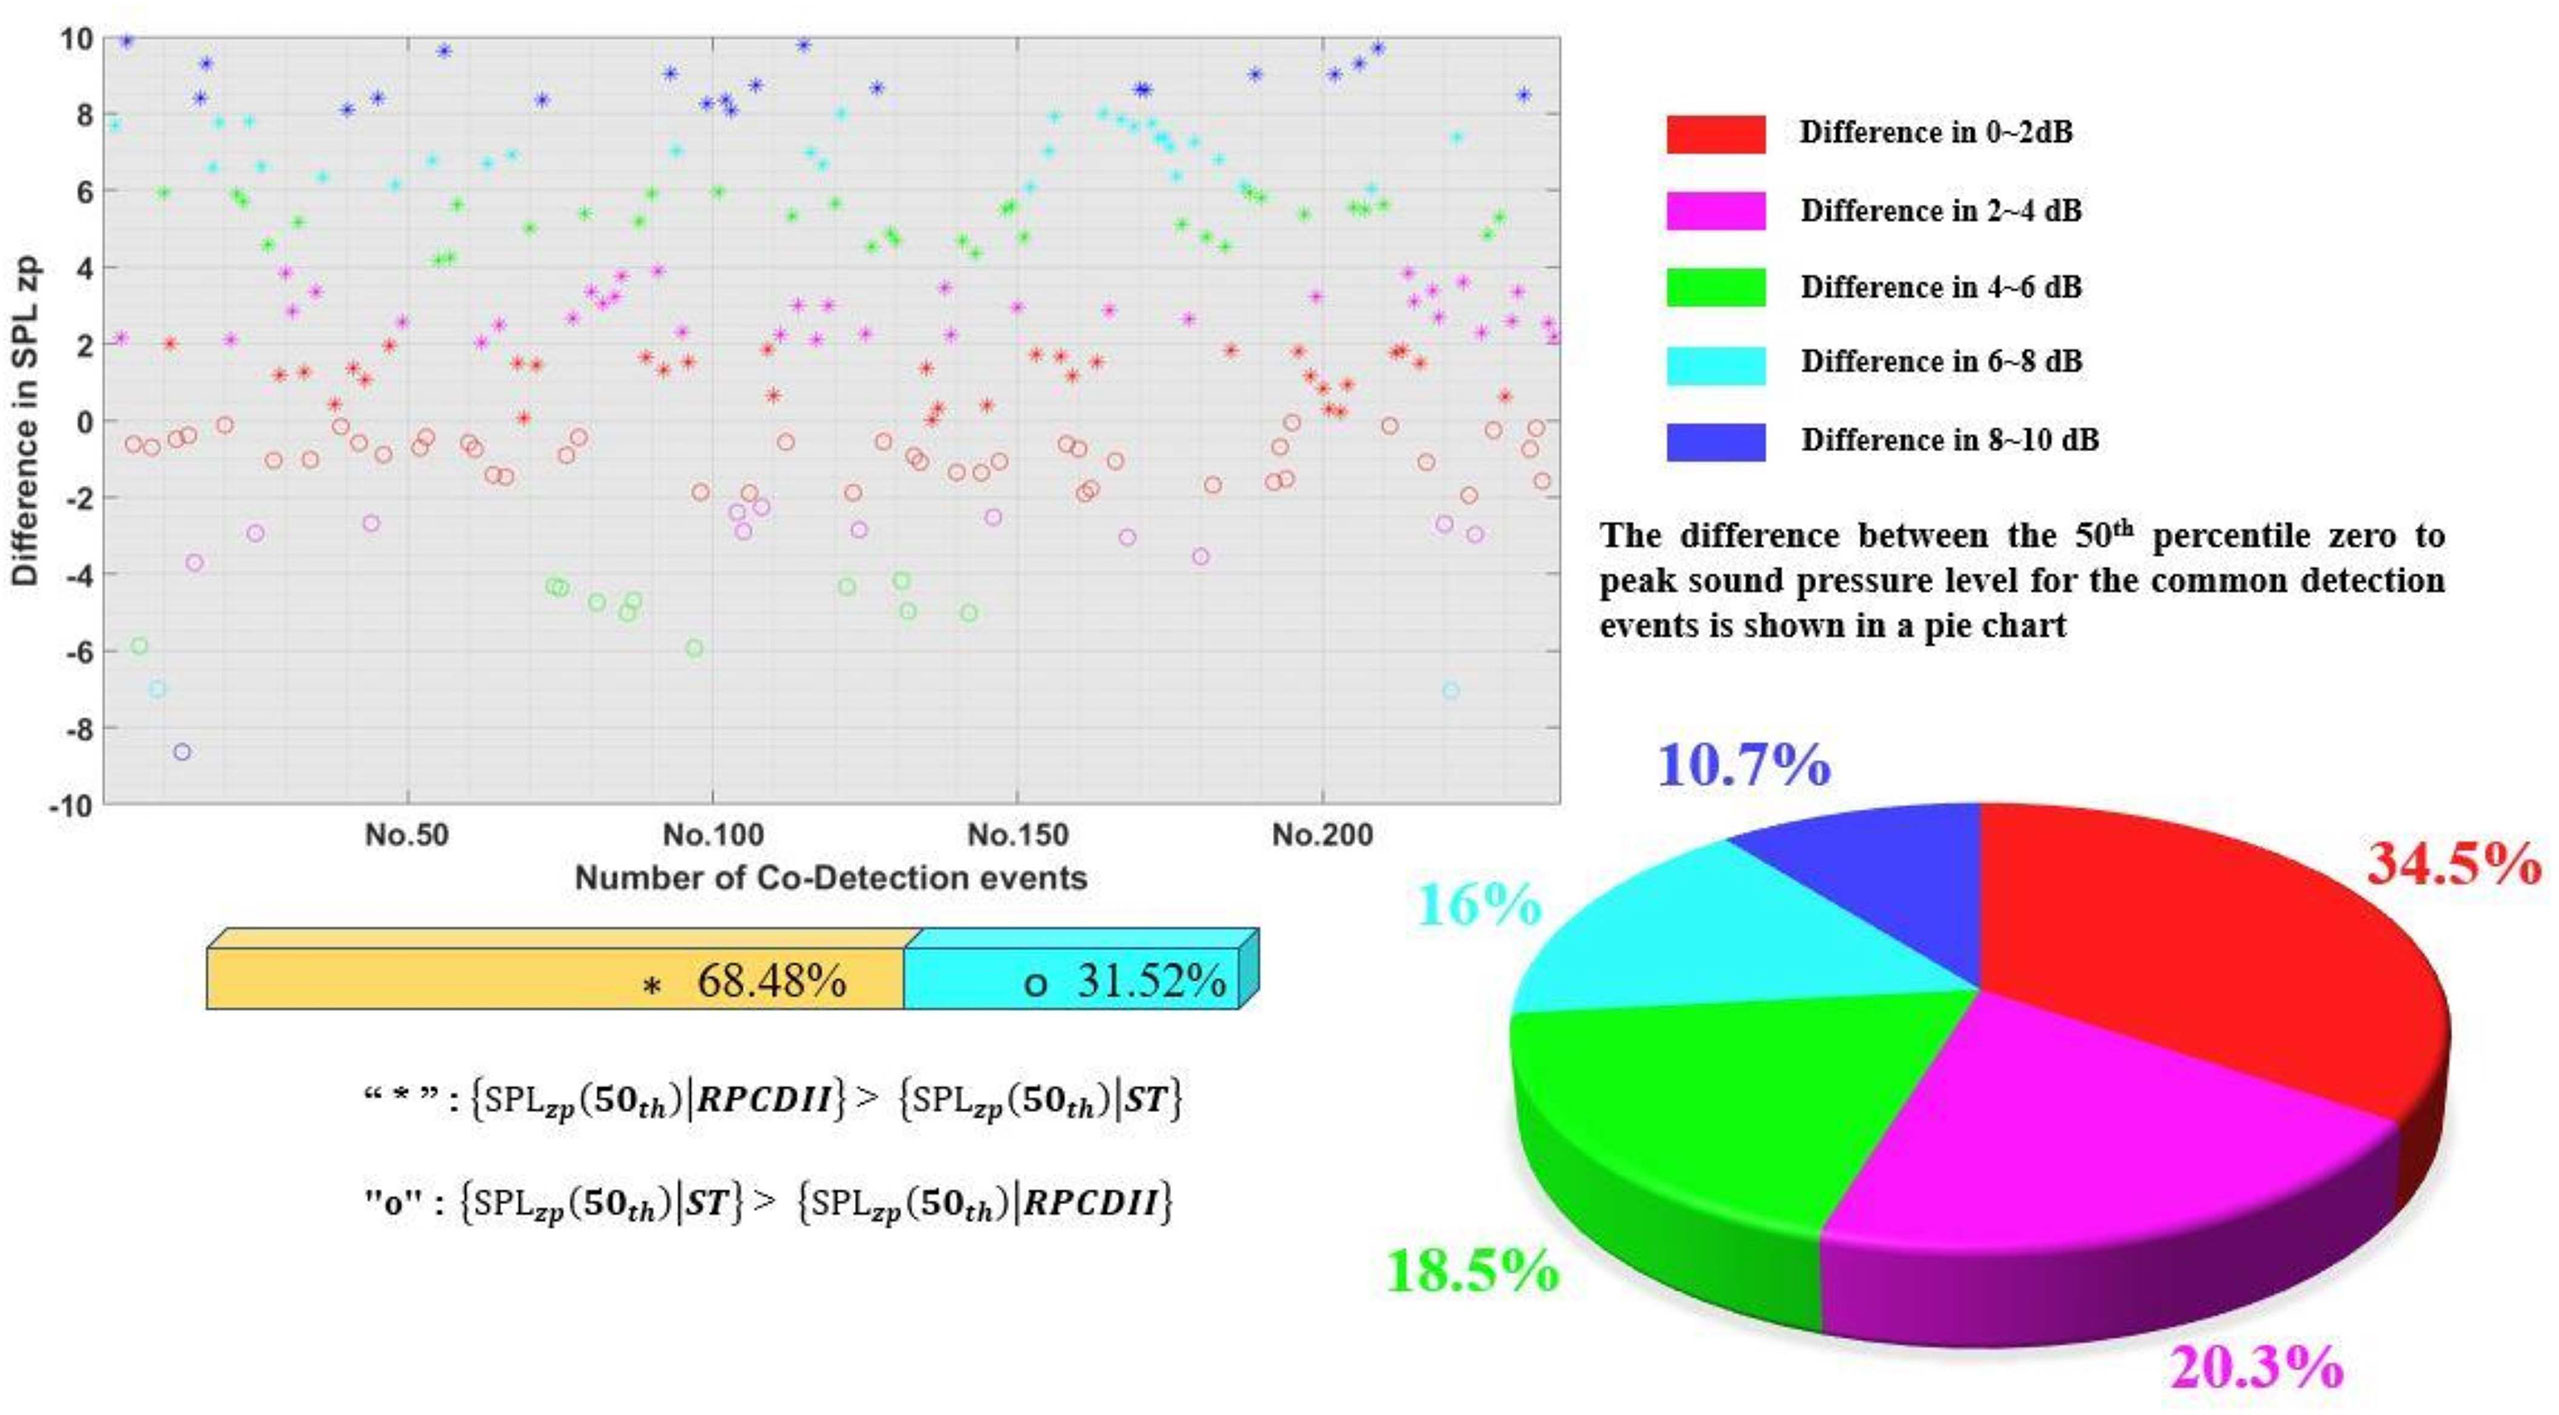
Figure 7 The 50th percentile SPLzp recorded by RPCD-II was subtracted from the 50th percentile SPLzp recorded by ST for each of the 238 common detections events, and the difference was marked by different colors. The symbol “*” indicates that the 50th percentile SPLzp recorded by RPCD-II is greater than that recorded by ST, and the symbol “o” indicates the opposite.
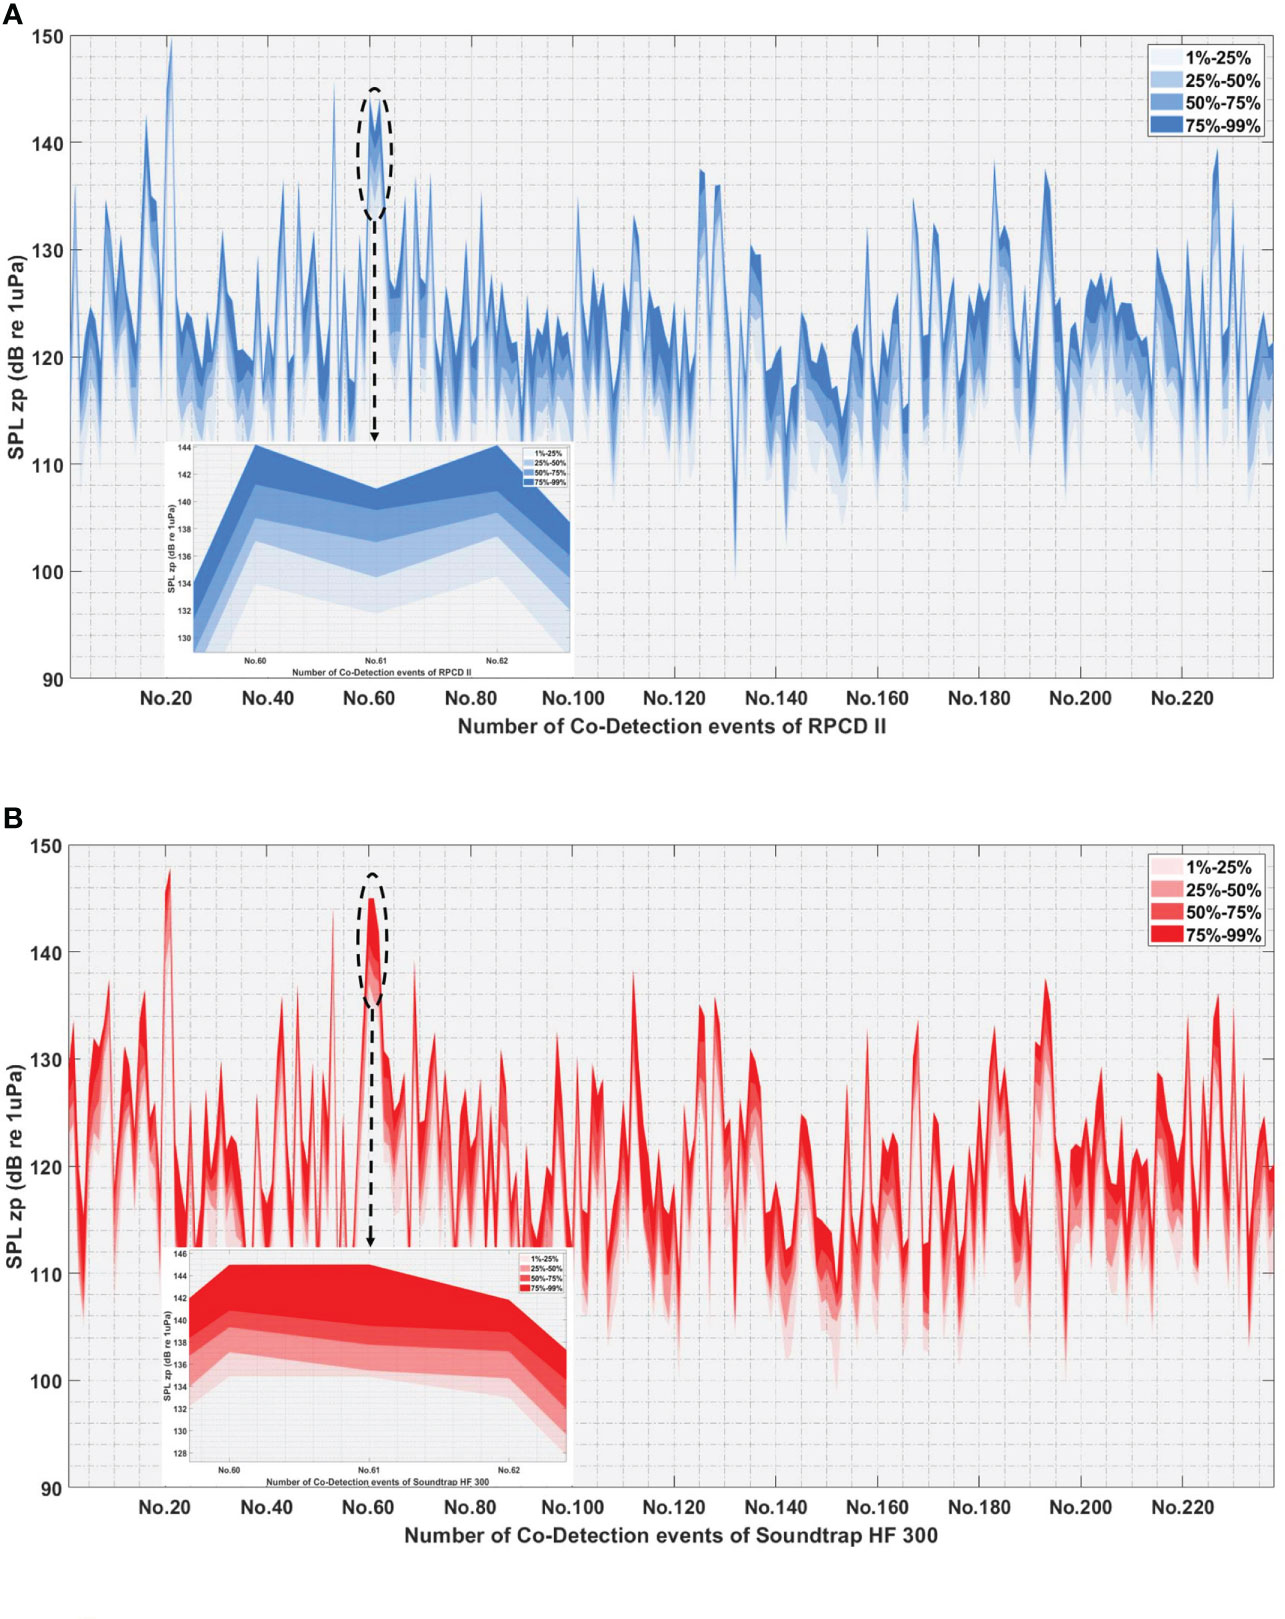
Figure 8 The comparison between the SPLzp of clicks recorded by ST and RPCD-II in the 238 common detection events. (A) Percentiles chart for SPLzp of clicks in RPCD-II. (B) Percentiles chart for SPLzp of clicks in ST.
The effective recording length of 951 min (Table 1) for RPCD-II and the effective recording length of 154 min (Table 1) for the ST were plotted for the 1/3-octave power spectrum density curve. The difference between the band level of the 1/3-octave frequency band centered at 251–158,489 Hz of the energy spectrum curves of both instruments in Figure 9 does not exceed 11dB (the difference is 10.87dB for the 1/3-octave band centered at 158,489 Hz).
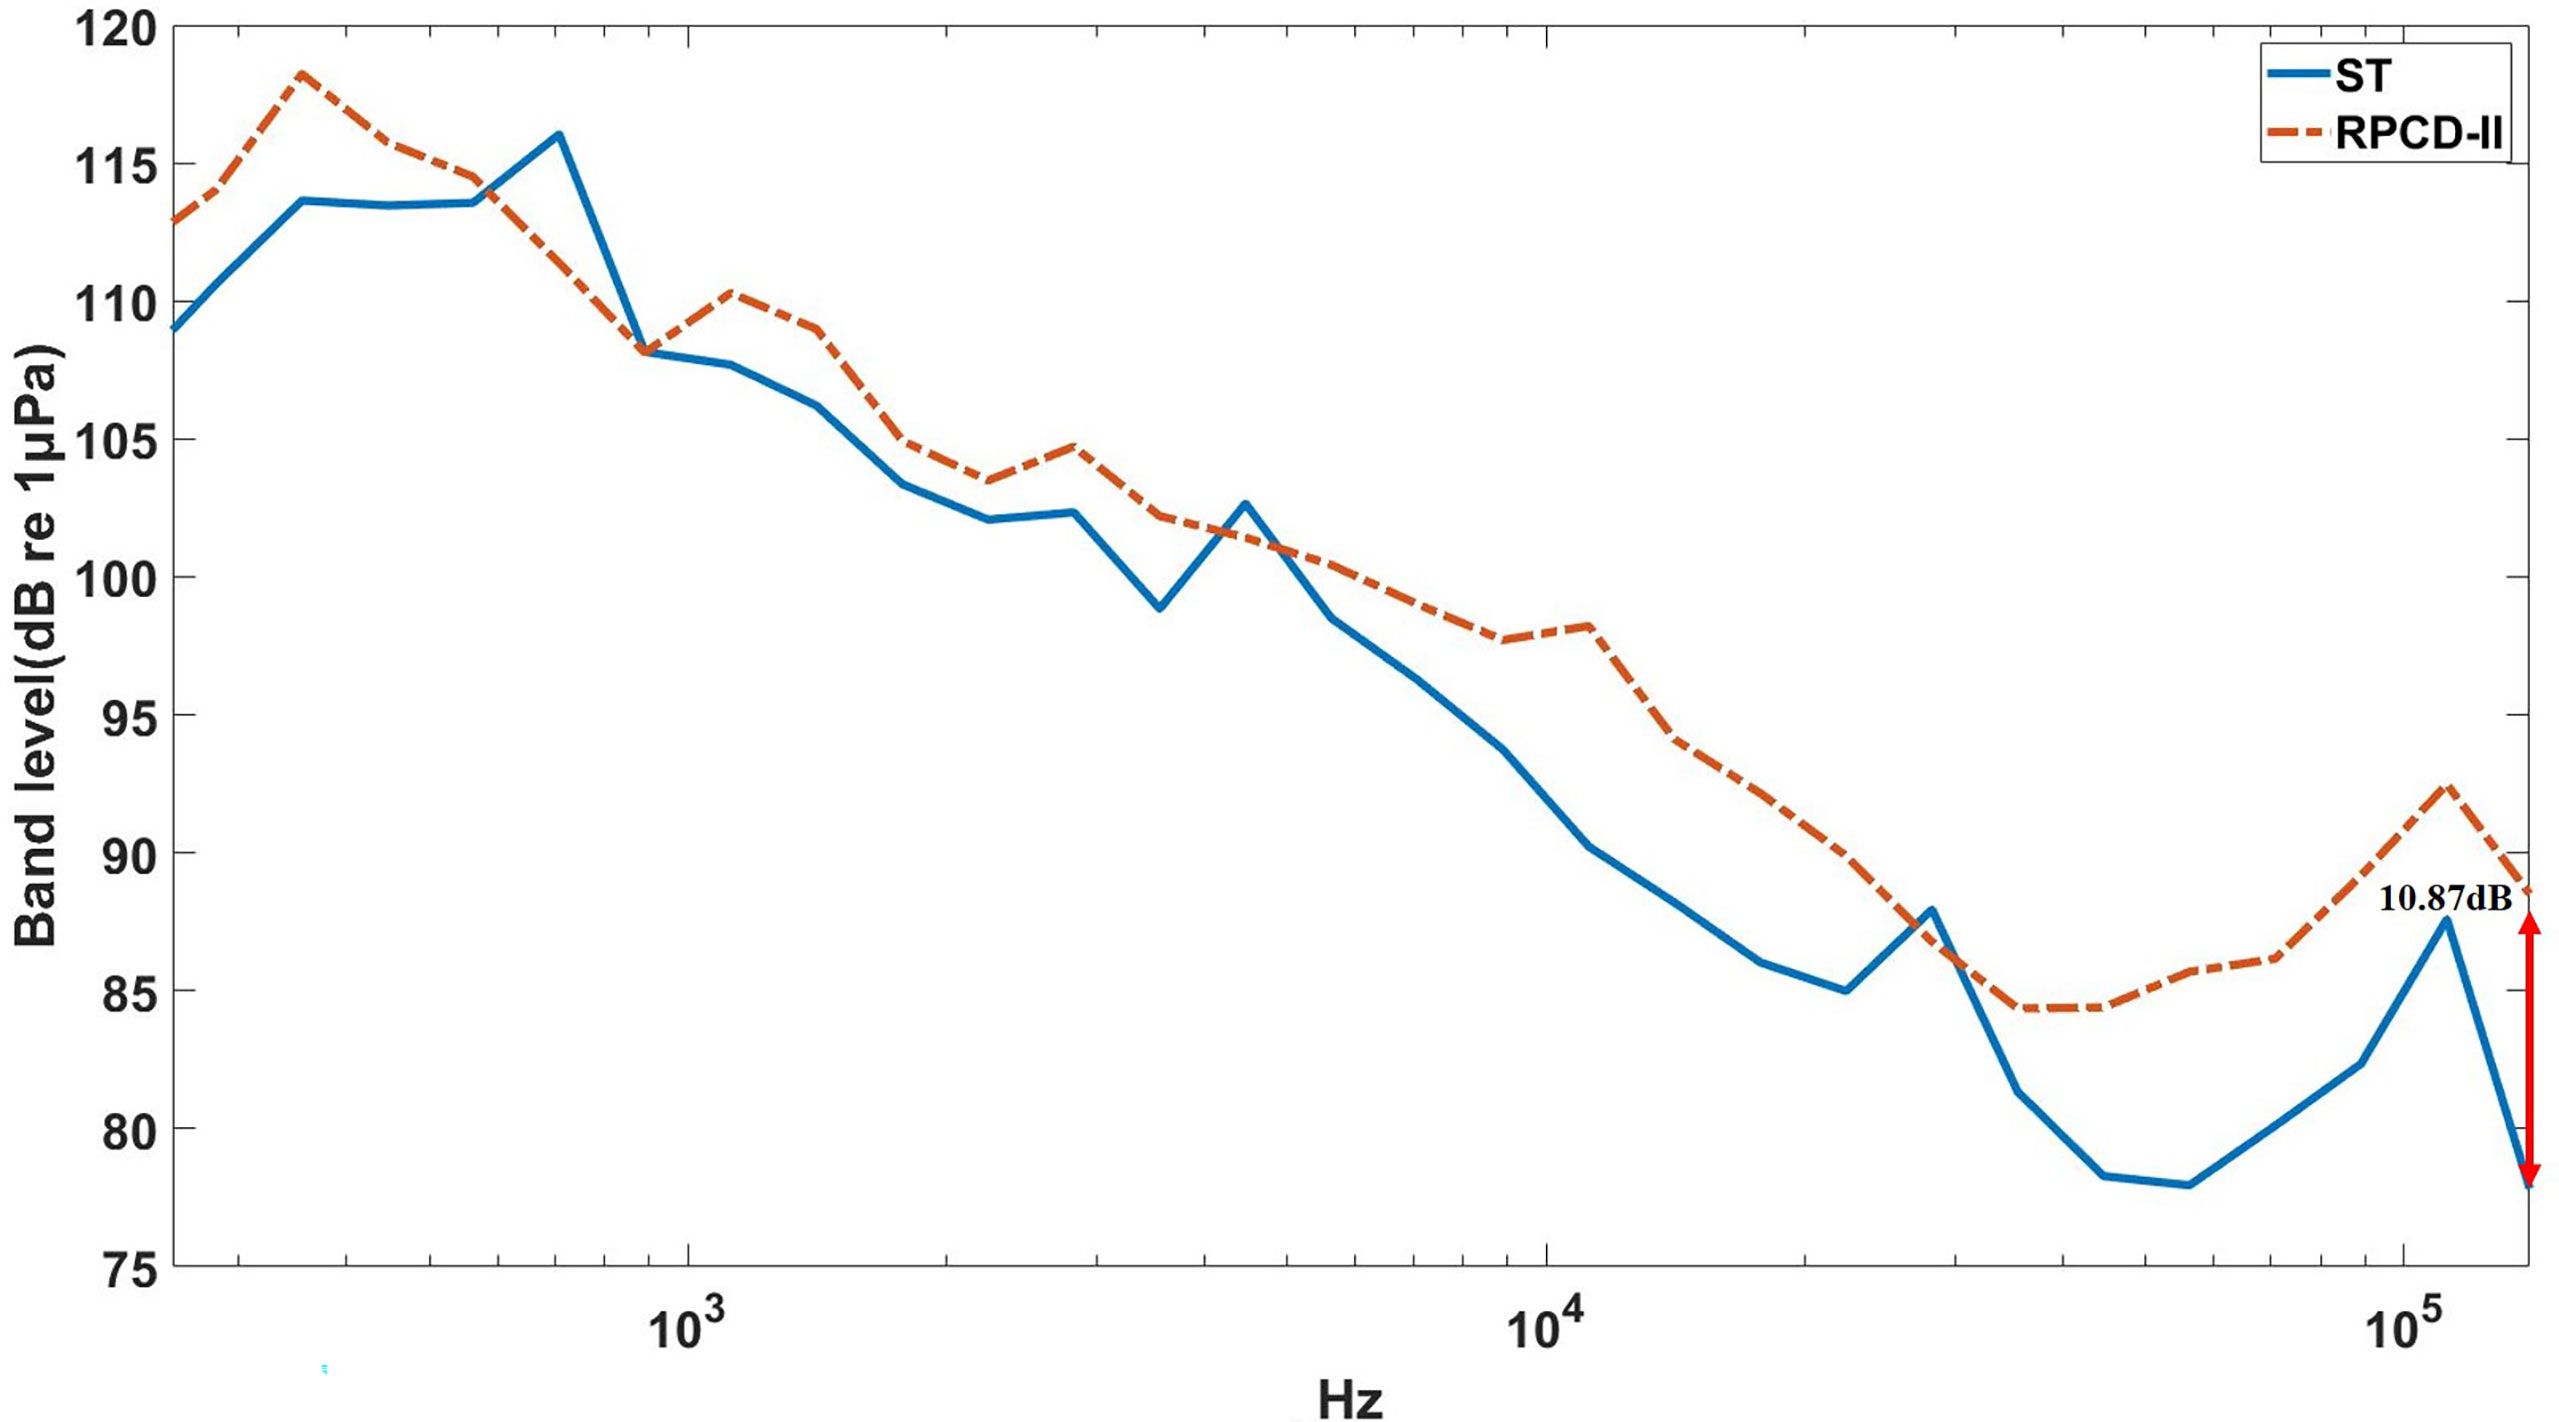
Figure 9 Comparison of the 1/3-octave power spectrum density recorded by RPCD-II and SoundTrap 300HF. The total effective recording time of RPCD-II was 951 min and SoundTrap 300HF was 154 min.
Discussion
Comparing the 1/3 octave band power spectrum density curves of RPCD-II and ST (Figure 9), we found that the RPCD-II had a higher power spectrum density in most frequency bands, which is likely due to the higher sensitivity of the RPCD-II (-170 dB re 1μPa) and its higher ADC resolution. The higher sensitivity of the hydrophone enables RPCD-II to convert the sound pressure into voltage signals with larger amplitudes. And higher ADC resolution allows RPCD-II to resolve weaker voltage amplitude fluctuations.
Figure 8A shows that the SPLzp of the weakest click recorded by RPCD-II in the whole experiment was 106 dB, so the recording threshold of the system should be less than 106 dB. Previous studies mentioned the detection radius of an event data logger (A-tag) with a detection threshold of 134 dB is 300 m for YFP (Akamatsu et al., 2008). Because the digital hydrophone of RPCD-II has a relatively low monitoring threshold, it is reasonable to conclude that the detection radius of RPCD- II for YFP should be larger than 300 m.
In this experiment, 55.18% of the correct reports recorded by RPCD-II contain buzzes (Table 2), which suggest feeding activity (Miller et al., 1995), and some studies have shown that this type of signal can represent predation behavior (Todd et al., 2009) or directly indicate success in predation (Miller et al., 2004). With the system’s high detection accuracy (only three errors out of 3214 real-time reports) and the estimated detection radius (>300 m), we considered that the deployment of multiple RPCD-IIs could effectively find out potential predation hotspots of YFP in a wide range of waters.
The ST has been used to record the clicks of YFP in previous studies and served as a valid instrument for the real-time reporting results of RPCD-II in this study. In this experiment, only three out of 3214 real-time reports of RPCD-II were incorrect, which is a high accuracy rate. Auto Click Detector software in the RPCD-II effectively differentiates YFP click trains from other high-frequency noises (such as ships) because the variation in ICIs from YFPs was orderly, and the var parameter was an important indicator of this characteristic. Should the ICI change less dramatically, then the var is smaller.
Because both instruments detected the target signals simultaneously during the common recording period, the real-time reports of YFP by RPCD-II can be considered a valid indicator that the system can be put into practical use.
Conclusions
Porpoises frequently emit clicks, and PAM is an effective method to monitor the species by detecting such signals. In this study, we have developed a real-time echolocation signal detecting device, the RPCD-II. The RPCD-II has a low detecting threshold, high sensitivity, and ADC resolution. During the experiment, the parameters were set in reference to the acoustic characteristics of echolocation clicks produced by Yangtze finless porpoises. The results show that the real-time detection time of RPCD-II is consistent with that of SoundTrap 300HF in the same working site, which proves the liability and precision of RPCD-II. It is worth noting that in addition to the Yangtze finless porpoise, the clicks of other species (e.g., harbor porpoise) can also be detected by Auto-Click Detector in RPCD-II with reasonable parameters adjustments. The real-time reporting function makes the traditional PAM working procedure more efficient and flexible and can be used as a reference to the construction unit of large aquatic projects in terms of animal protection. For instance, during the construction of large offshore wind farms, timely reporting of the occurrence of endangered porpoises allows us to take immediate protective construction measures or use acoustic dispersal techniques to drive them away, effectively reducing the risk of long-term exposure of porpoises under high-intensity anthropogenic noise.
Data availability statement
The raw data supporting the conclusions of this article will be made available by the authors, without undue reservation.
Author contributions
WL: Conceptualization, methodology, software, data curation, visualization, investigation, and writing - original draft preparation. JQ: Validation, writing- reviewing and editing. PL: Visualization. XC: Methodology, hardware, data curation, visualization, investigation FF: Writing - Reviewing and editing. XD: Writing - Reviewing and editing. YiD: Field deployment and data collection YaD: Field deployment and data collection KW: Supervised, conceptualization, reviewing and editing ZM: Conceptualization, filed data collection, data curation, validation, writing- reviewing and editing. All authors contributed to the article and approved the submitted version.
Funding
This research was partly funded by Wuhan Baiji Conservation Foundation, a cetacean conservation charity organization based in China. ZM was supported by the Key Projects of Water Conservancy Science and Technology Plan of Jiangxi Province (No. 201922ZDKT01 and 202124ZDKT26).
Acknowledgments
This work was supported by IHB, CAS, and Wuhan Pindu Technology Co. We thank the Nanchang Yangtse Township Government for their help in the field equipment installation. We are sincerely grateful to Dr. Matt Pine for his help polishing the language.
Conflict of interest
Author WL is employed by Wuhan Pindu Technology Co.
The remaining authors declare that the research was conducted in the absence of any commercial or financial relationships that could be construed as a potential conflict of interest.
The authors declare that this study received funding from Wuhan Pindu Technology Co. The funder had the following involvement in the study: Provided real-time acoustic equipment for field monitoring, and participated in experimental design, field data collection and analysis.
Publisher’s note
All claims expressed in this article are solely those of the authors and do not necessarily represent those of their affiliated organizations, or those of the publisher, the editors and the reviewers. Any product that may be evaluated in this article, or claim that may be made by its manufacturer, is not guaranteed or endorsed by the publisher.
Supplementary material
The Supplementary Material for this article can be found online at: https://www.frontiersin.org/articles/10.3389/fmars.2022.883774/full#supplementary-material
References
Akamatsu T., Wang D., Wang K. (2005). Off-axis sonar beam pattern of free-ranging finless porpoises measured by a stereo pulse event data logger. J. Acoust. Soc Am. 117, 3325–3330. doi: 10.1121/1.1893325
Akamatsu T., Wang D., Wang K., Li S., Dong S., Zhao X., et al. (2008). Estimation of the detection probability for Yangtze finless porpoises (Neophocaena phocaenoides asiaeorientalis) with a passive acoustic method. J. Acoust. Soc Am. 123, 4403–4411. doi: 10.1121/1.2912449
Atanbori J., Duan W., Murray J., Appiah K., Dickinson P. (2015). Automatic classification of flying bird species using computer vision techniques. PATREC 81, 53–62. doi: 10.1016/j.patrec.2015.08.015
Bailey H., Clay G., Coates E. A., Lusseau D., Senior B., Thompson P. M. (2010). Using T-PODs to assess variations in the occurrence of coastal bottlenose dolphins and harbour porpoises. aquatic conservations. Aquat. Conserv. 20, 150–158. doi: 10.1002/aqc.1060
Barbedo J. G. A. (2018). Impact of dataset size and variety on the effectiveness of deep learning and transfer learning for plant disease classification. Comput. Electron. Agric. 153, 46–53. doi: 10.1016/j.compag.2018.08.013
Benhemma-Le Gall A., Graham I. M., Merchant N. D., Thompson P. M. (2021). Broad-scale responses of harbor porpoises to pile-driving and vessel activities during offshore windfarm construction. Front. Mar. Sci. 8. doi: 10.3389/fmars.2021.664724
Clausen K. T., Tougaard J., Carstensen J., Delefosse M., Teilmann J. (2018). Noise affects porpoise click detections – the magnitude of the effect depends on logger type and detection filter settings. Bioacoustics, 1–7. doi: 10.1080/09524622.2018.1477071
Eva M., Stephen M. (2018). Underwater noise levels of pile-driving in a new Zealand harbour, and the potential impacts on endangered hector’s dolphins. Mar. Pollut. Bull. 135, 195–204. doi: 10.1016/j.marpolbul.2018.07.024
Eva M., William J., Stephen M. (2019). Impact of pile-driving on hector’s dolphin in lyttelton harbour, new Zealand. Mar. pollut. Bull. 142, 31–42. doi: 10.1016/j.marpolbul.2019.03.017
Fang Y., Chen C., Wu S. (2019). Feature identification using acoustic signature of ocean researcher III of Taiwan. ANZIAM J. 59, C301–C340. doi: 10.21914/anziamj.v59i0.12655. (EMAC2017).
Fang L., Wang D., Li Y., Cheng Z., Pine M. K., Wang K., et al. (2015). The source parameters of echolocation clicks from captive and free-ranging Yangtze finless porpoises (Neophocaena asiaeorientalis asiaeorientalis). PloS One 10 (6), e0129143. doi: 10.1371/journal.pone.0129143
Gallus A., Dähne M., Verfuß U. K., Bräger S., Benke H. (2012). Use of static passive acoustic monitoring to assess the status of the ‘Critically endangered’ Baltic harbour porpoise in German waters. Endang. Species Res. 18, 265–278. doi: 10.3354/esr00448
Goold J. C., Jefferson T. A. (2002). Acoustic signals from free ranging finless porpoises (Neophocaena phocaenoides) in the waters around Hong Kong. Raffles Bull. Of Zoology 2002 Supplement No. 10, 131–139. doi: 10.1086/342003
Huang J., Mei Z., Chen M., Han Y., Zhang X., Moore J., et al. (2019). Population survey showing hope for population recovery of the critically endangered Yangtze finless porpoise. Biol. Conserv 241, 108351. doi: 10.1016/j.biocon.2019.108315
Kimura S., Akamatsu T., Li S., Dong S., Dong L., Wang K., et al. (2010). Density estimation of Yangtze finless porpoises using passive acoustic sensors and automated click train detection. J. Acoust. Soc Am. 128, 1435–1445. doi: 10.1121/1.3442574
Kimura S., Akamatsu T., Wang D., Li S., Wang K., Yoda K. (2013). Variation in the production rate of biosonar signals in freshwater porpoises. J. Acoust. Soc Am. 133, 3128. doi: 10.1121/1.4796129
Kimura S., Akamatsu T., Wang K., Wang D., Li S., Dong S., et al. (2009). Comparison of stationary acoustic monitoring and visual observation of finless porpoises. J. Acoust. Soc Am. 125, 547–53. doi: 10.1121/1.3021302
Kyhn L. A., Tougaard J., Beedholm K., Jensen F. H., Ashe E., Williams R., et al. (2013). Clicking in a killer whale habitat: narrow-band, high-frequency biosonar clicks of harbour porpoise (Phocoena phocoena) and dall’s porpoise (Phocoenoides dalli). PloS One 8, e63763. doi: 10.1371/journal.pone.0063763
Kyhn L. A., Tougaard J., Teilmann J., Wahlberg M., Jørgensen P. B., Bech N. I. (2008). Harbour porpoise (Phocoena phocoena) static acoustic monitoring: laboratory detection thresholds of T-PODs are reflected in field sensitivity. J. Mar. Biol. Assoc. U.K 88 (6), 1085–1091. doi: 10.1017/s0025315408000416
Li X. H., Huang H. L., Savkin A. V. (2021). Autonomous navigation of an aerial drone to observe a group of wild animals with reduced visual disturbance. IEEE Syst. J 16 (2), 3339–3348. doi: 10.1109/JSYST.2021.3135982
Li S., Wang D., Wang K., Akamatsu T., et al. (2006). Sonar gain control in echolocating finless porpoises (Neophocaena phocaenoides) in an open water. J. Acoust. Soc Am. 120, 1803–1180. doi: 10.1121/1.2335674
Møhl B. (1973). Echolocation: high-frequency component in the click of the harbour porpoise (Phocoena ph. l.). J. Acoust. Soc Am. 54, 1368. doi: 10.1121/1.1914435
Mellinger D. K. (2021). Find porpoises: Deep learning for detection of harbor porpoise echolocation clicks. J. Acoust. Soc Am. 149, A39–A40. doi: 10.1121/10.0004456
Miller P. J. O., Johnson M. P., Tyack P. L. (2004). Sperm whale behaviour indicates the use of echolocation click buzzes ‘creaks’ in prey capture. Proc. R. Soc London Ser. B 271, 2239–2247. doi: 10.1098/rspb.2004.2863
Miller L. A., Pristed J., Moshl B., Surlykke A. (1995). The click-sounds of narwhals (Monodon monoceros) in inglefield bay, Northwest Greenland. Mar. Mammal Sci. 11, 491–502. doi: 10.1111/j.1748-7692.1995.tb00672.x
Teilmann J., Miller L. A., Kirketerp T., Kastelein R. A., Madsen P. T., Nielsen B. K., et al. (2002). Characteristics of echolocation signals used by a harbour porpoise (Phocoena phocoena) in a target detection experiment. Aquat. Mammals. 28(3), 275–284.
Serres A., Xu C., Hao Y., Wang D. (2021). The click production of captive Yangtze finless porpoises (Neophocaena asiaeorientalis asiaorientalis) is influenced by social and environmental factors. Animals. 11, 511. doi: 10.3390/ani11020511
Seydi V., Chapuis L., Veneruso G., Balaguru S., Bristow N., Mills D., et al. (2022). The application of neural networks to classify dolphin echolocation clicks. bioRxiv. doi: 10.1101/2022.06.14.496047
Simonis A. E., Forney K. A., Rankin S., Ryan J., Zhang Y., DeVogelaere A., et al. (2020). Seal bomb noise as a potential threat to Monterey bay harbor porpoise. Front. Mar. Sci. 7. doi: 10.3389/fmars.2020.00142
Soekhoe D., van der Putten P., Plaat A. (2016). On the impact of data set size in transfer learning using deep neural networks. Adv. Intelligent Data Anal. XV. 9897, 50–60. doi: 10.1007/978-3-319-46349-0_5
Sven K., Ansgar D., Mats A. (2008). Click train patterns of free-ranging harbour porpoises acquired using T-PODs may be useful as indicators of their behavior. J. Cetacean Res. Manage. 10(2), 147–155.
Tarling P., Cantor M., Clapés A., Escalera S. (2022). Deep learning with self-supervision and uncertainty regularization to count fish in underwater images. PloS One 17, e0267759. doi: 10.1371/journal.pone.0267759
Thomsen F., Elk N.-V., Brock V., Piper W. (2005). On the performance of automated porpoise-click-detectors in experiments with captive harbor porpoises (Phocoena phocoena). J. Acoust. Soc Am. 118, 37–40. doi: 10.1121/1.1937347
Todd V. L. G., Pearse W. D., Tregenza N. C., Lepper P. A., Todd I. B. (2009). Diel echolocation activity of harbor porpoises (Phocoena phocoena) around north Sea offshore gas installations. ICES J. Mar. Sci. 66, 734–745. doi: 10.1093/icesjms/fsp035
Turvey S. T., Barrett L. A., Hao Y., Zhang L., Zhang X., Wang X., et al. (2010). Rapidly shifting baselines in Yangtze fishing communities and local memory of extinct species. Conservation Biology 24(3), 778–787. doi: 10.1111/j.1523-1739.2009.01395.x
William E. S., William A. W., Carleton R. (1969). Click structure in the porpoise, phocoena phocoena. J Mam 50(4), 721–728.
Zhou L., Chen X., Duan P., Wang D., Wang Z., Wang K. (2021). Spatial–temporal variations in biosonar activity of Yangtze finless porpoise in the lower reaches of the Yangtze river and its correlation with underwater noise: Are quieter non-shipping branches the remaining shelters? Aquat. Conserv 31 (4), 964–978. doi: 10.1002/aqc.3535
Keywords: Yangtze finless porpoise, RPCD-II, soundtrap 300HF, porpoise, clicks
Citation: Li W, Qiu J, Lei P, Chen X, Fan F, Deng X, Dai Y, Deng Y, Wang K and Mei Z (2022) A real-time passive acoustic monitoring system to detect Yangtze finless porpoise clicks in Ganjiang River, China. Front. Mar. Sci. 9:883774. doi: 10.3389/fmars.2022.883774
Received: 25 February 2022; Accepted: 31 August 2022;
Published: 16 September 2022.
Edited by:
Peter Corkeron, New England Aquarium, United StatesReviewed by:
Jennifer L. K. McCullough, Pacific Islands Fisheries Science Center, United StatesZhongchang Song, Xiamen University, China
Rui Ruan, Chinese Academy of Fishery Sciences (CAFS), China
Copyright © 2022 Li, Qiu, Lei, Chen, Fan, Deng, Dai, Deng, Wang and Mei. This is an open-access article distributed under the terms of the Creative Commons Attribution License (CC BY). The use, distribution or reproduction in other forums is permitted, provided the original author(s) and the copyright owner(s) are credited and that the original publication in this journal is cited, in accordance with accepted academic practice. No use, distribution or reproduction is permitted which does not comply with these terms.
*Correspondence: Kexiong Wang, d2FuZ2tAaWhiLmFjLmNu; Zhigang Mei, bWVpemhpZ2FuZ0BpaGIuYWMuY24=