 Chanhyung Jeon
 D. Randolph Watts2
 Hong Sik Min
 Jae-Hun Park
- 1Department of Oceanography, Pusan National University, Busan, South Korea
- 2Graduate School of Oceanography, University of Rhode Island, Narragansett, RI, United States
- 3Korea Institute of Ocean Science and Technology, Busan, South Korea
- 4Typhoon Research Center, Jeju National University, Jeju, South Korea
- 5Department of Ocean Sciences, Inha University, Incheon, South Korea
An array of five pressure-recording inverted echo sounder (PIES) moorings spanning a distance of 420 km around the subtropical countercurrent and North Equatorial Current regions of the western Pacific detected extraordinary sea level drops from November to December 2013. In October 2013, three typhoons, namely, Danas, Wipha, and Francisco, consecutively passed east of the PIES sites, which significantly strengthened pre-existing cyclonic cold eddies to create the observed sea level drops. The typhoon-strengthened cold eddies propagated westward over approximately 1000 km for approximately 4 months and eventually met the Kuroshio offshore Taiwan. The approaching eddies interacted with the Kuroshio upstream for ~3 months and reduced the Kuroshio intensity by up to 24% in February–May 2014, the lowest record for the last 26 years of satellite measurements. Our results can provide a new mechanism linking typhoon-to-eddy-to-Kuroshio variability through oceanic processes.
Introduction
Typhoon, tropical cyclone in the western Pacific, that passes over the ocean often leave notable traces along their track. A well-known sign is a cold wake (sea surface cooling) (D’Asaro et al., 2007; Dare & McBride, 2011; Zhang et al., 2016; Potter, 2018; Wu and Li, 2018; Yue et al., 2018; Park et al., 2019), which is frequently observed in chlorophyll blooms (Lin et al., 2003; Lin and Oey, 2016; Chacko, 2017; Pan et al., 2018; Lee et al., 2020). The typhoon-induced cold wake can be created by energetic vertical mixing or upwelling forced by cyclonic winds driving a divergence of surface water (D’Asaro et al., 2014; Liu et al., 2017). Such traces in the sea surface are restored within a week or so, while those in the sub-surface layer can persist for longer than weeks, even months (Park et al., 2011; Mei et al., 2013; Lin et al., 2017; Jeon et al., 2019; Lu et al., 2020).
The northwestern Pacific is eddy-abundant and high typhoon-activity region. When typhoons encounter warm or cold eddies, the oceanic response is significantly different; the warm (cold) eddy can usually suppress (enhance) sea surface cooling because of the thicker (thinner) upper-ocean mixed layer and more (less) warm water (Lin et al., 2005; Liu et al., 2017). In addition, typhoon-induced upwelling governed by typhoon translation speed influences cooling over the water column (Lin et al., 2017), and the trace in the subsurface layer can propagate across the basin (Jan et al., 2017).
The mesoscale eddies in the northwestern Pacific propagate westward overall and can encounter the Kuroshio, a western boundary current in the north Pacific. The eddies collided with the Kuroshio can significantly modulate the Kuroshio intensity (Tsai et al., 2015; Yan et al., 2016). The changes in the Kuroshio intensity can influence the Kuroshio intrusion into the East China Sea (ECS) through northeast Taiwan and along the ECS slope; for example, impinging cold eddies east of Taiwan increase the intrusion into the ECS (e.g., Wu et al., 2017; Ando et al., 2021; Liu et al., 2021; Shi and Wang, 2021). The intrusion into the ECS can have impacts on chlorophyll distribution and primary production in the ECS, as it occurred during the spring of 1993 in the northeast of Taiwan (Gong et al., 1996). Moreover, the intrusion causes subsurface-layer warming which have potential in ecosystem variability of the ECS (Kang and Na, 2022).
Zhang et al. (2020) reported the strengthening of the Kuroshio by intensifying Pacific-typhoon activities through enhanced positive potential vorticity anomalies by typhoon-induced changes in eddy fields. Nonetheless, the direct evidence demonstrating connectivity between Pacific-typhoons and the Kuroshio intensity is yet unclear, because it is generally difficult to track typhoon-traces directly existed in the subsurface layer due to the limited in situ observations and nonlinear eddy-evolving processes during their westward propagation revealed by the satellite altimetry (Chelton et al., 2011; Faghmous et al., 2015).
In this study, we show the connectivity between the typhoons and the Kuroshio intensity with a special focus on typhoons in October 2013 and an anomalously weak event of the Kuroshio intensity in February–May 2014. We present evidence showing the reinforcement of cyclonic cold eddies by consecutive three typhoons from in situ observations and satellite measurements including estimations of the ocean heat content (OHC) changes and sensible and latent heat fluxes at the sea surface. Then, we show that the enhanced cold eddies, the oceanic memory of typhoons, weakened the Kuroshio upstream (east of Taiwan) for approximately 3 months after the passage of typhoons over the northwestern Pacific.
Data and Methods
An array of five pressure-recording inverted echo sounders (PIES) was deployed from June 2012 and 2013 to May 2014 in the eddy-abundant subtropical countercurrent and the North Equatorial Current regions of the western Pacific (Figure 1). Four sites (F03, F05, F08, and F12) spanned from June 2012 through May 2014, and site PS1 spanned the last year from June 2013 through May 2014. The PIES records the bottom pressure (Pbot) and round-trip acoustic travel time from the seafloor to the sea surface (τ). The accuracy of τ is 0.05 ms, and that of Paroscientific quartz Pbot sensor is ±0.01% with a resolution of 0.1 mbar (Kennelly et al., 2007).
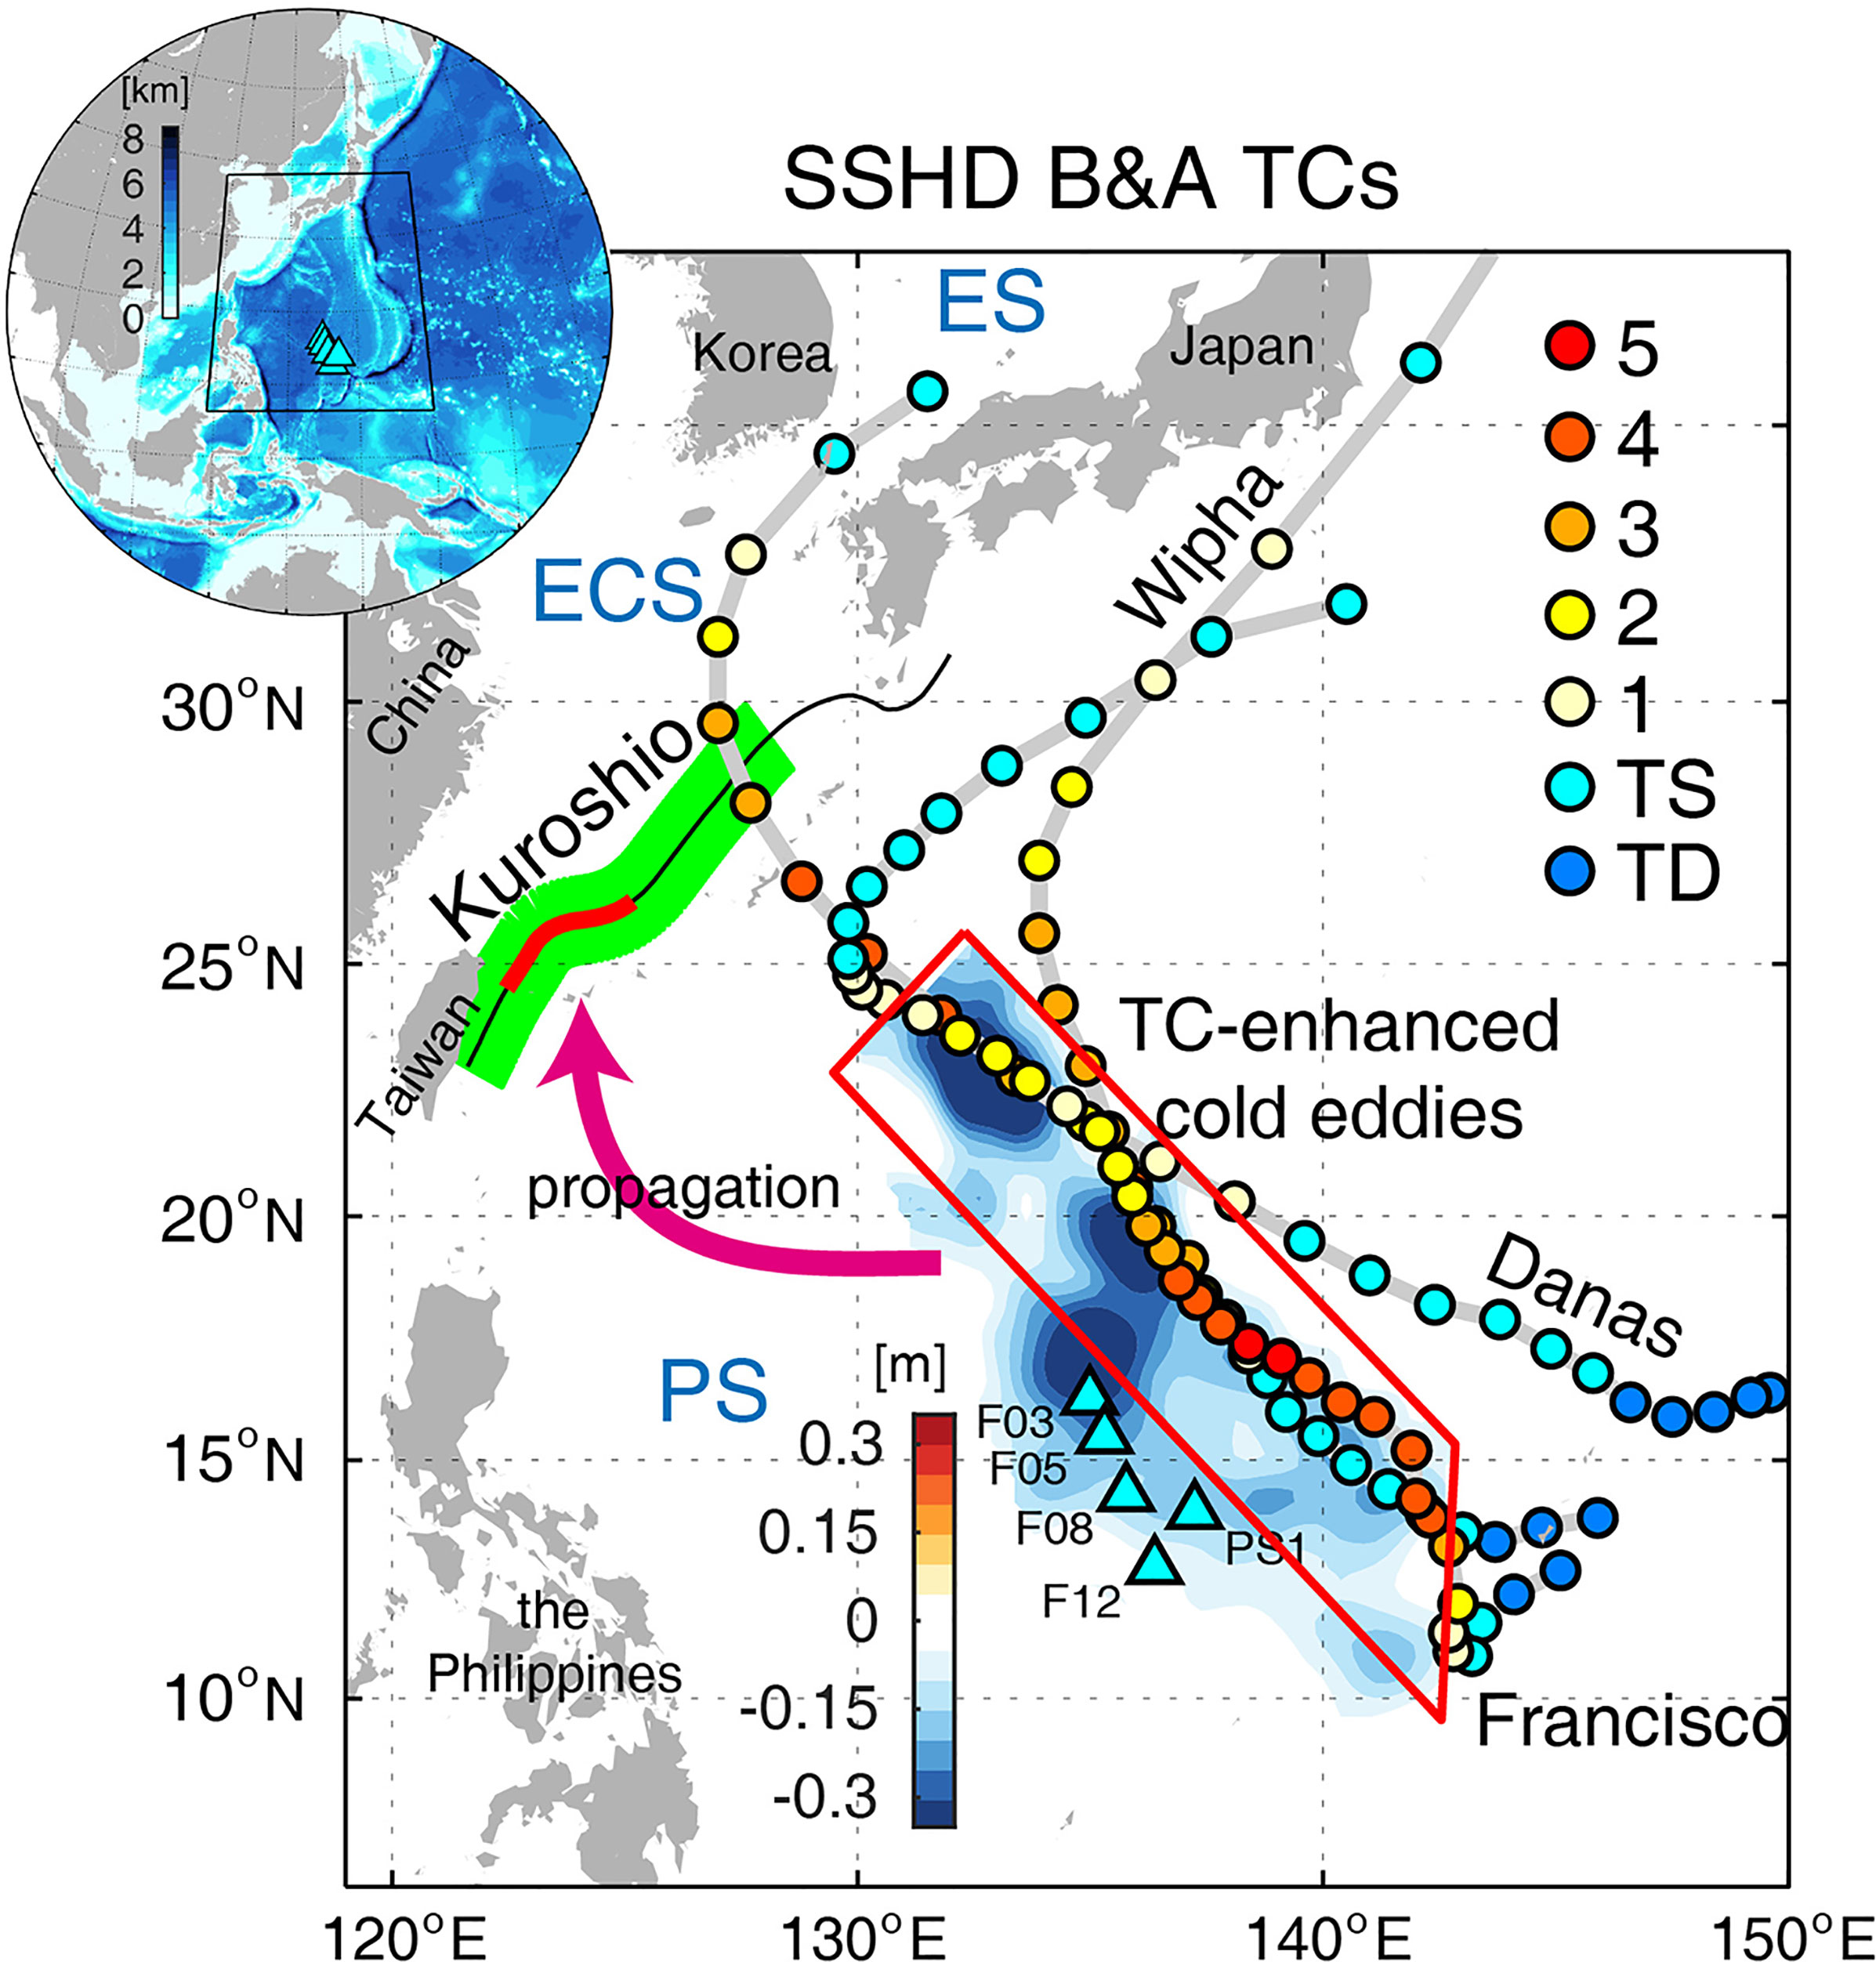
Figure 1 Typhoon tracks (gray solid line) and intensity with Saffir–Simpson scale (color dots every 6 h). Background color indicates the sea-surface height (SSH) difference between before (October 5th, 2013) and after (October 31st, 2013) three typhoons (Danas, Wipha, and Francisco). Black solid line extending northeast of Taiwan indicates the mean Kuroshio path, and green indicates perpendicular lines to the Kuroshio path every 10 km. Red line is the Kuroshio upstream used for Kuroshio intensity estimation shown in Figure 7. Pressure-recording inverted echo sounder (PIES) mooring sites are marked with cyan triangles. Red trapezoid is the calculation region of the ocean heat content (OHC) change. PS, ECS, and ES indicate the Philippine, East China, and East Seas, respectively.
Historical hydrocasts from EN4.2.1 were used to establish a linear relationship between the geopotential height anomaly (GPHA) and the OHC anomaly with a deep reference level of 1,500 dbar (Figure 2). In total, 30,175 profiles were used in regions of 10–26°N and 130–150°E. Using this relationship, the SSH anomaly was converted to an OHC anomaly.
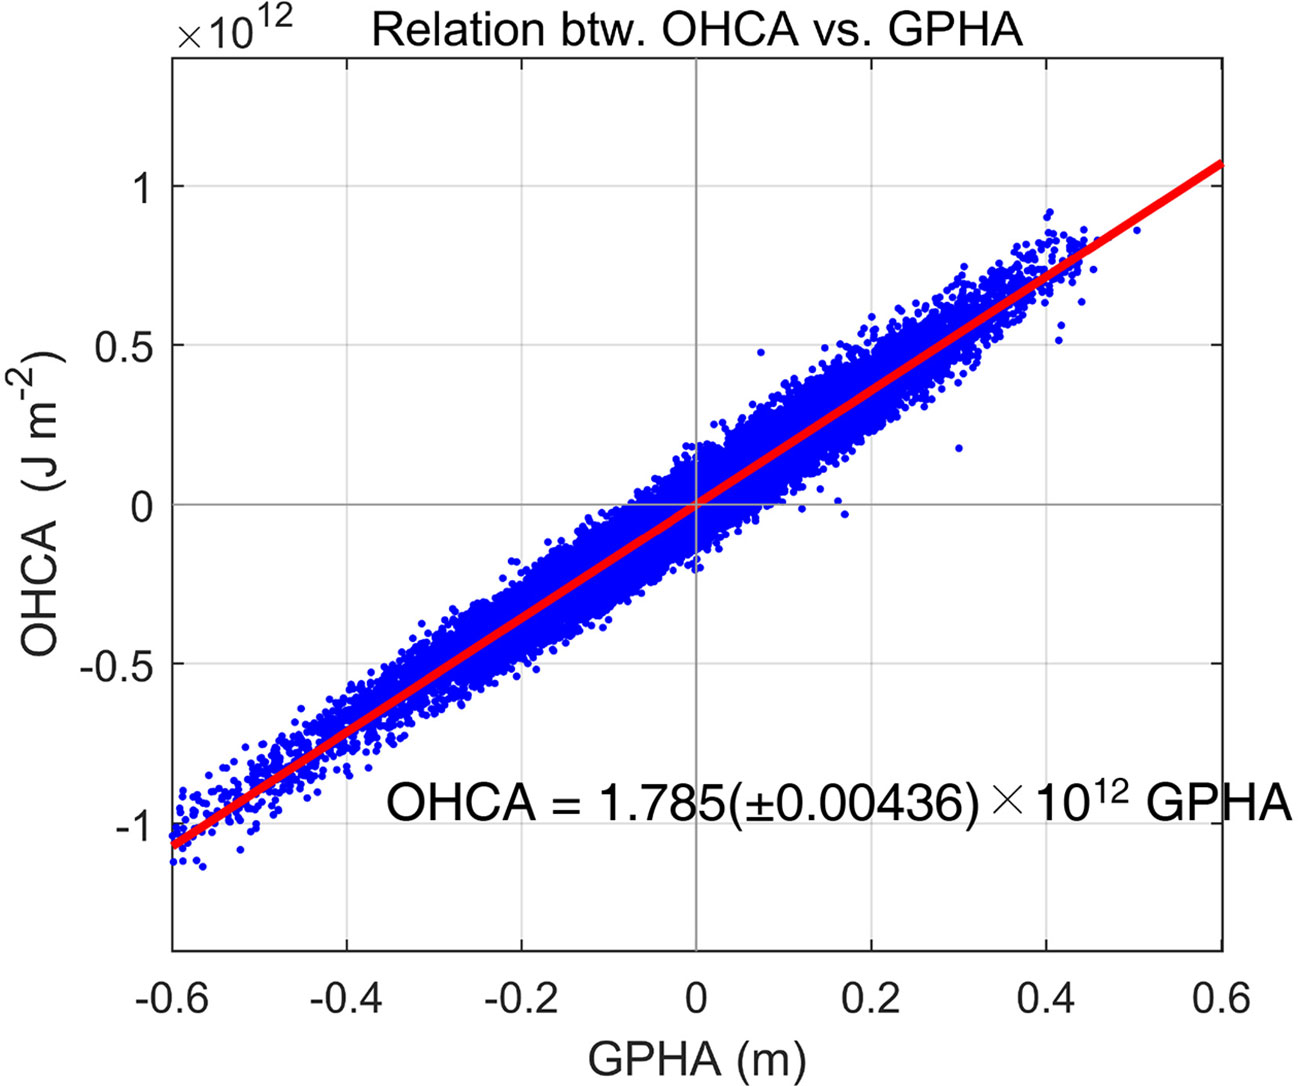
Figure 2 Scatterplots for geopotential height anomaly (GPHA) and ocean heat content anomaly (OHCA) calculated with historical hydrocasts (EN4 version 4.2.1, Good et al., 2013). The red line is a linear regression with the slope of 1.785×10¹² and the value in parenthesis is the 95% confidence interval. The relationship was used to convert GPHA to OHCA.
As in previous studies (e.g., Park et al., 2012; Donohue et al., 2016), τ and Pbot were converted to steric and mass-loading sea-surface heights (SSH) using historical hydrocasts from EN4.2.1 (Good et al., 2013); the total SSH, calculated as the sum of steric and mass-loading components, was dominated by the steric component and compared with satellite-measured SSH. More details about SSH conversion and error estimates are described in Jeon et al. (2018).
The PIES-derived total SSH were in good agreement with the satellite-measured SSH (after-mentioned all-satellite product) and showed correlation coefficients in the range of 0.79–0.88 (Figure 3). Two types of delayed-time mapping of absolute dynamic topography (ADT) and sea level anomaly daily products were used: two-satellite and all-satellite products. Both types were gridded with 0.25°×0.25° spatial resolution from CMEMS (https://marine.copernicus.eu/, Product user manual for sea level anomaly products, March 2020). Eddy-tracking spanning from October 2013 to May 2014 and SSH comparisons were conducted using an all-satellite product, while a two-satellite product was employed for long-term Kuroshio variability from January 1993 to December 2018 (26 years).
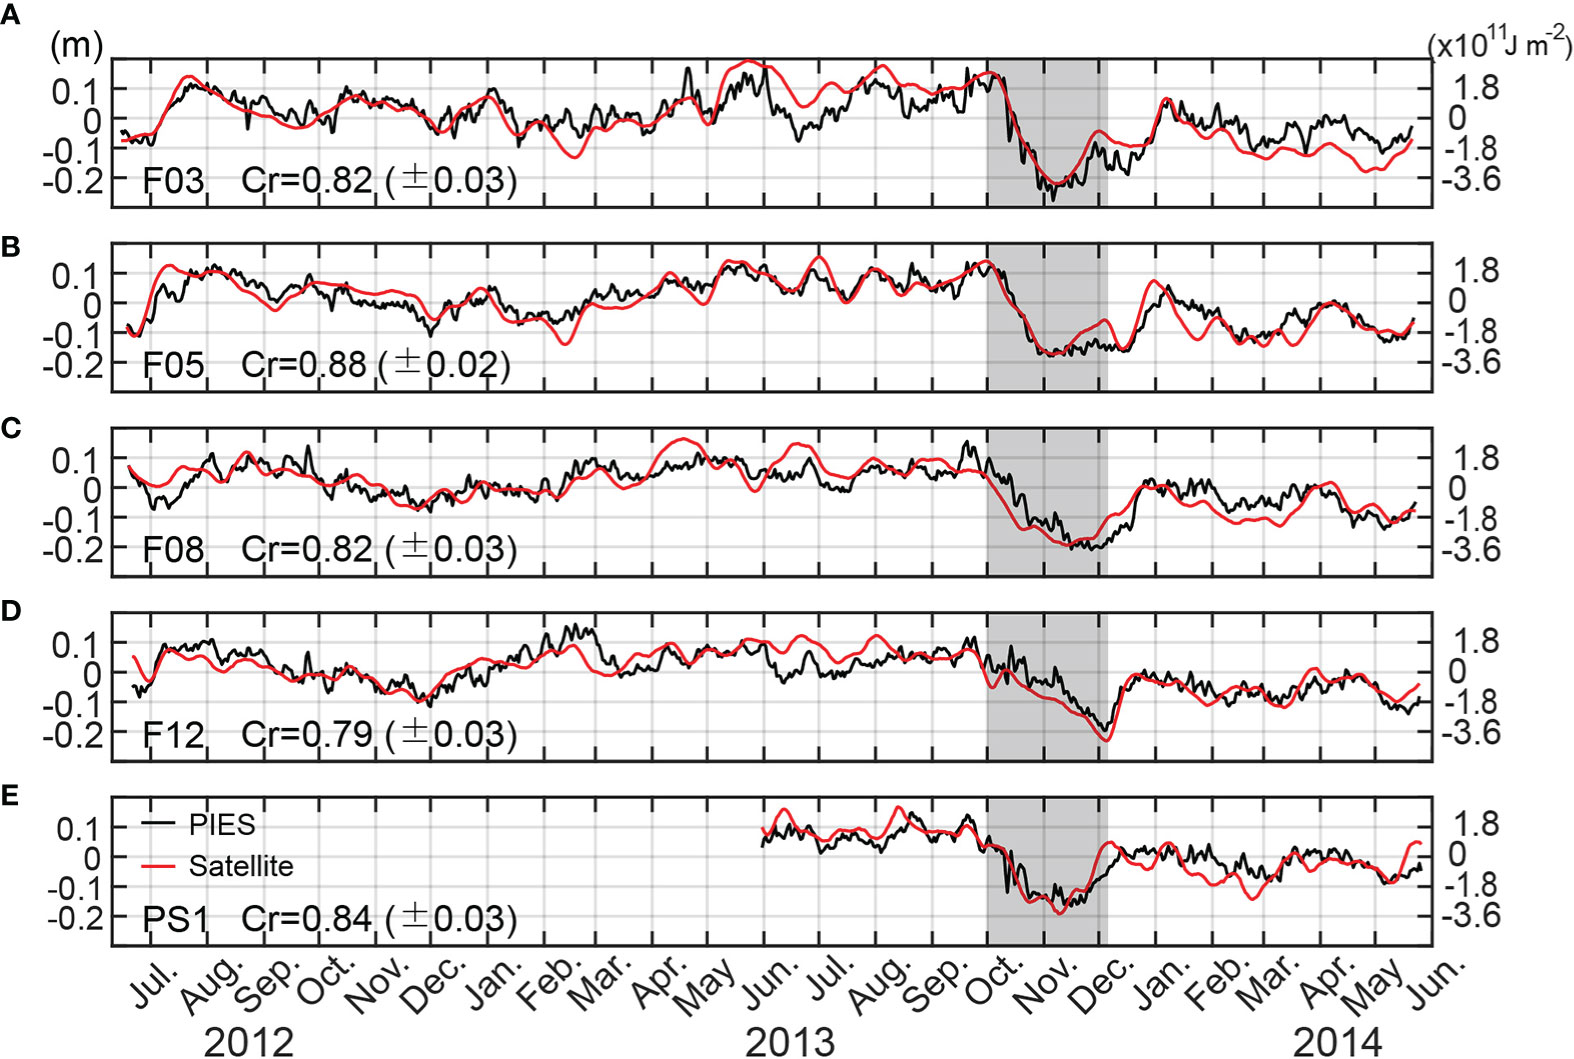
Figure 3 Comparison of sea-surface height (SSH) anomalies from pressure-recording inverted echo sounder (PIES; black) and satellite altimetry (red) at (A) F03, (B) F05, (C) F08, (D) F12, and (E) PS1. Ocean heat content (OHC; J m–2) anomalies converted from PIES-derived and satellite-measured SSH are marked on the right y-axis (see text for details). The dark shaded period is the timing at which typhoon-enhanced cold eddy passes through the PIES sites. The mooring site names and correlation coefficients with 95% confidence interval between PIES-derived and satellite-measured SSHs (Cr) are described on the left of each panel.
The Kuroshio path was defined as the maximum SSH gradient point along the Kuroshio every 10 km from the east of Taiwan to the southwest of Japan using a 26-year-mean ADT field (black and red lines, Figure 1). The lines perpendicular to the Kuroshio axis cover a ±100-km range from the Kuroshio core (green line, Figure 1). The Kuroshio intensity was estimated from the SSH gradient in the range of the perpendicular line (thick red line).
Sensible (Qs) and latent (Ql) heat fluxes between the atmosphere and the ocean (positive upward) were calculated in the typhoon region using the following bulk formulae:
where ρa is the air density (= 1.22 kg m -3), cp is the specific heat of air at a constant pressure (=1,004 J kg–1°C -1), Lvap is the latent heat of vaporization (=2.5×10⁶ J kg–1), ∣W∣ is the wind speed, SST is the sea surface temperature, and qs is the saturated specific humidity at the SST (here, we assumed that qs is at 98% saturation at the SST). Ta and qa are the air temperature and specific humidity at 10-m height above the sea surface, respectively. The exchange coefficients of sensible and latent heat fluxes, Ch and Cq, respectively, were estimated as suggested by Jaimes et al. (2015). For the SST, we used a Multi-sensor Improved SST, an optimally interpolated cloud‐free daily satellite product extracted from microwave and infrared SSTs at a spatial resolution of 10 km (Gentemann et al., 2009). The Ta and qa were obtained from the Modern‐Era Retrospective Analysis for Research and Applications, version 2 reanalysis data (time interval of 1 hr and horizontal resolutions of 0.5° latitude × 2/3° longitude; Gelaro et al., 2017). We reconstructed the radial structure of the typhoon wind field using the method proposed by Chavas et al. (2015), referring to the maximum typhoon wind at a specific 6-hr interval location and time from the Joint Typhoon Warning Center (JTWC). SST and reconstructed wind fields were interpolated to 1-hr data to coincide with specific humidity and air temperature variables.
Isopycnal displacement or shoaling of the thermocline (η) due to storm-induced upwelling (Price et al., 1994; Babin et al., 2004; Nam et al., 2012) was calculated as η = τ / ( ρofUH ), where τ is the wind stress, ρo is the water density (=1022 kg m–3), f is the Coriolis parameter (s–1), and UH is the typhoon translation speed. Wind stress was calculated using typhoon wind from JTWC based on the formula (Gill, 1982) and drag coefficients (Large and Pond, 1981; Trenberth et al., 1990). The η was computed as ΔSSH using the following equation (Shay et al., 2000; Walker et al., 2005): Δ S S H=−η g′/g , where g is gravity and g′ is reduced gravity (=0.015 m s–2 as used in the similar area by Nam et al. (2012)).
Results and Discussions
Typhoon-Induced SSH Decrease
One- or two-year-long SSH time series obtained from the PIES array (black lines in Figure 3) and satellite altimetry (red lines in Figure 3) revealed remarkable sea-level drops from October through early December 2013 (gray shaded in Figure 3). The SSH decrease reached approximately 0.2–0.3 m over all PIES sites spanning a distance of 420 km. The SSH minimum was not temporally identical among sites: two northern sites (F03 and F05) and the southeastern site (PS1) in early November 2013 and two southern sites (F08 and F12) in late November and early December. The sea level drops bounced back close to zero during December–January.
The significant sea level drops were associated with pre-existing cyclonic cold eddies and three typhoon passages east of the PIES sites. In October 2013, three consecutive typhoons, Danas, Wipha, and Francisco, passed through the eddy-abundant subtropical gyre region (12–26°N, 132–144°E) from southeast to northwest (Figure 4). Before the typhoon passage, two cold eddies pre-existed around 20°N and 134°E and 136°E along the Danas track (hereafter, northern cold eddies). The other low SSH area existed around 13°N and 143°E (hereafter, southern cold eddy), as indicated by the black arrows in Figure 4A. Typhoons Danas, Wipha, and Francisco passed among the cold eddies on October 5–6 (Figures 4A, B), October 12–14 (Figures 4C–E), and October 18–25 (Figures 4F, G), respectively. The northern cold eddies were reinforced by Danas, and the SSH decreased by approximately 0.05–0.1 m. Then, Wipha and Francisco went by the cold eddies and reinforced both northern and southern cold eddies again. Additional SSH decrease reached 0.1–0.25 m and two northern cold eddies merged into the large cold eddy (Figure 4G). The northern and southern cold eddies grew strongest on October 31st at approximately 14°N and 20°N with a total of 0.1–0.3 m SSH decrement (Figure 4H). The SSH difference between October 5th (before typhoons) and October 31st (after typhoons) superimposed by three typhoon tracks (gray solid line and colored circles) shows notable sea-level drops caused by the three typhoons (Figure 4I). Note that the SSH difference before and after typhoons was significant, but at the two PIES sites (F03 and F05) this was not entirely owing to the typhoon passages. At those two sites a warm eddy had existed before the arrival of the typhoon-enhanced cold eddies and it subsequently propagated to the west (Figure 4A). During November the enhanced cold eddies propagated westward with time (Figures 5A, B) passing through the PIES sites and producing the spatiotemporally different SSH minima shown in Figure 4I.
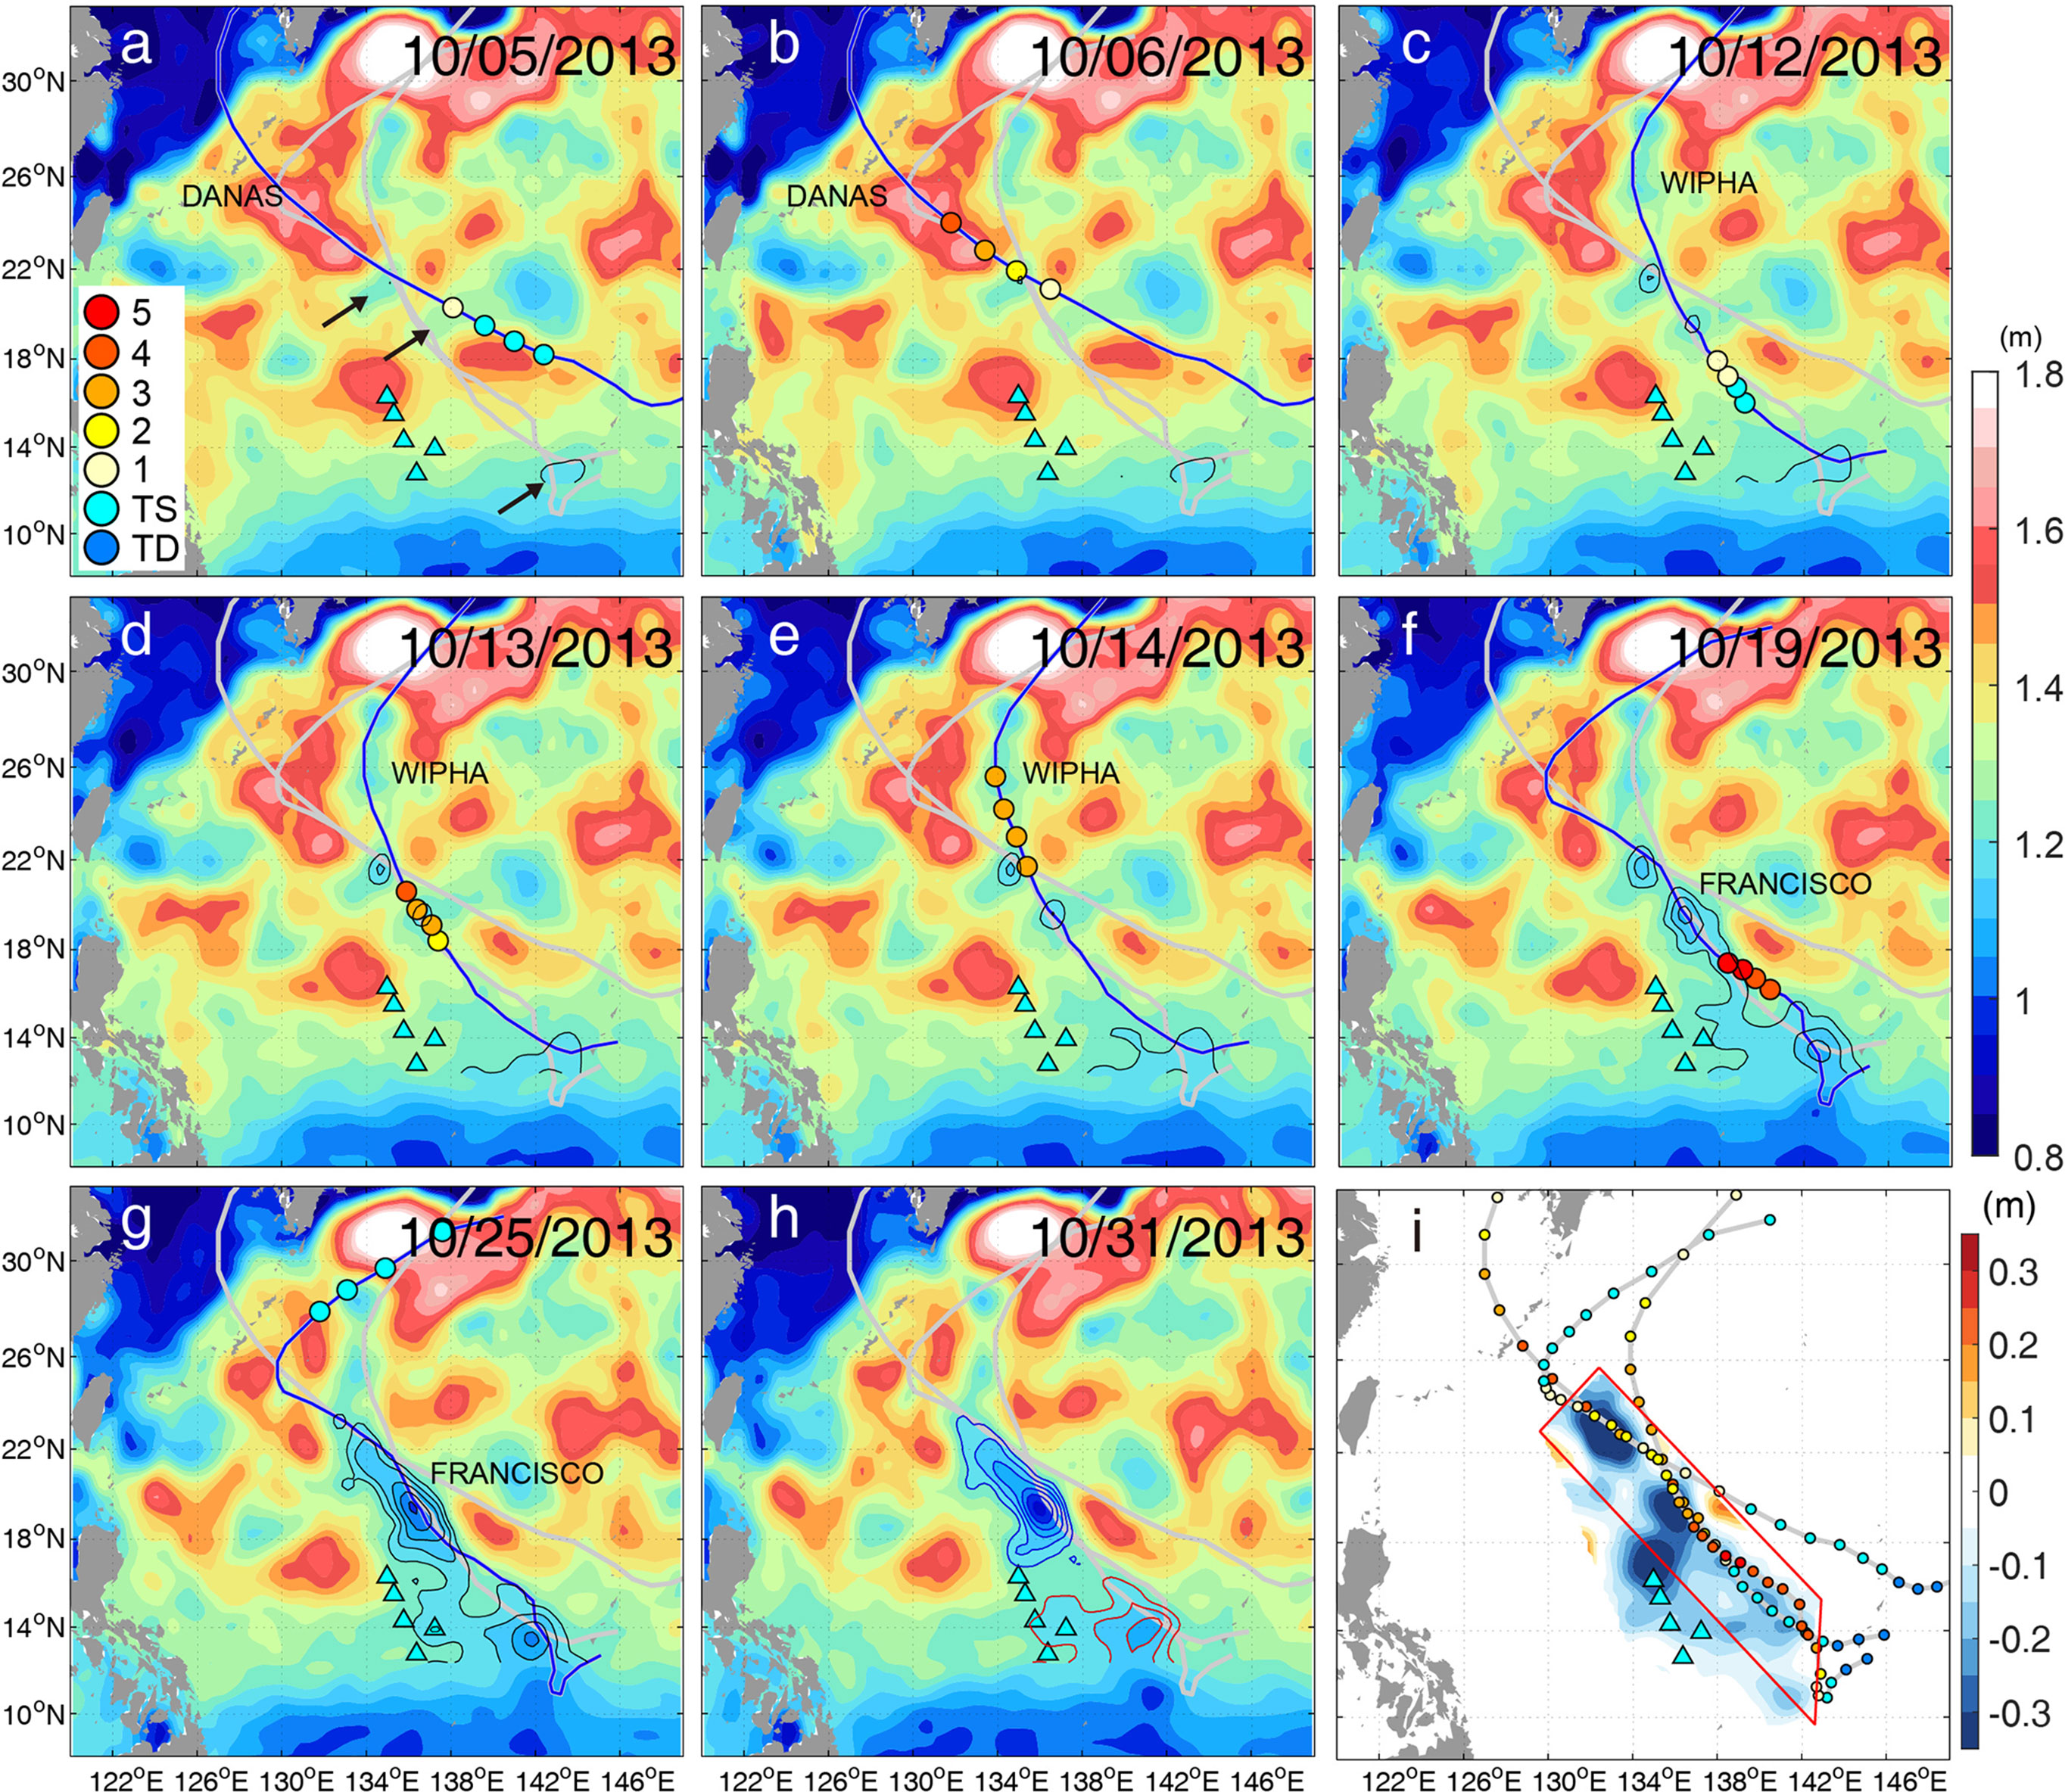
Figure 4 Snapshot of sea-surface height (SSH) maps in the western Pacific during typhoon passages in October 2013. (A) SSH maps on October 5th, (B) October 6th, (C) October 12th, (D) October 13th, (E) October 14th, (F) October 19th, (G) October 25th, and (H) October 31st. Typhoon tracks (gray and blue lines) and Saffir–Simpson scale (color dots every 6 h) at 00, 06, 12, and 18 h GMT on each day. Pressure-recording inverted echo sounder (PIES) mooring sites are marked with cyan triangles. Black contours in (a–g) and blue and red contours in (H) indicate SSH lows from 0.9 to 1.2 m with 0.05 m intervals. (I) SSH difference between October 5th and October 31st superimposed by three typhoon tracks (gray solid line) with Saffir–Simpson scale. Red trapezoid indicates the region where ocean heat content (OHC) changes are calculated.
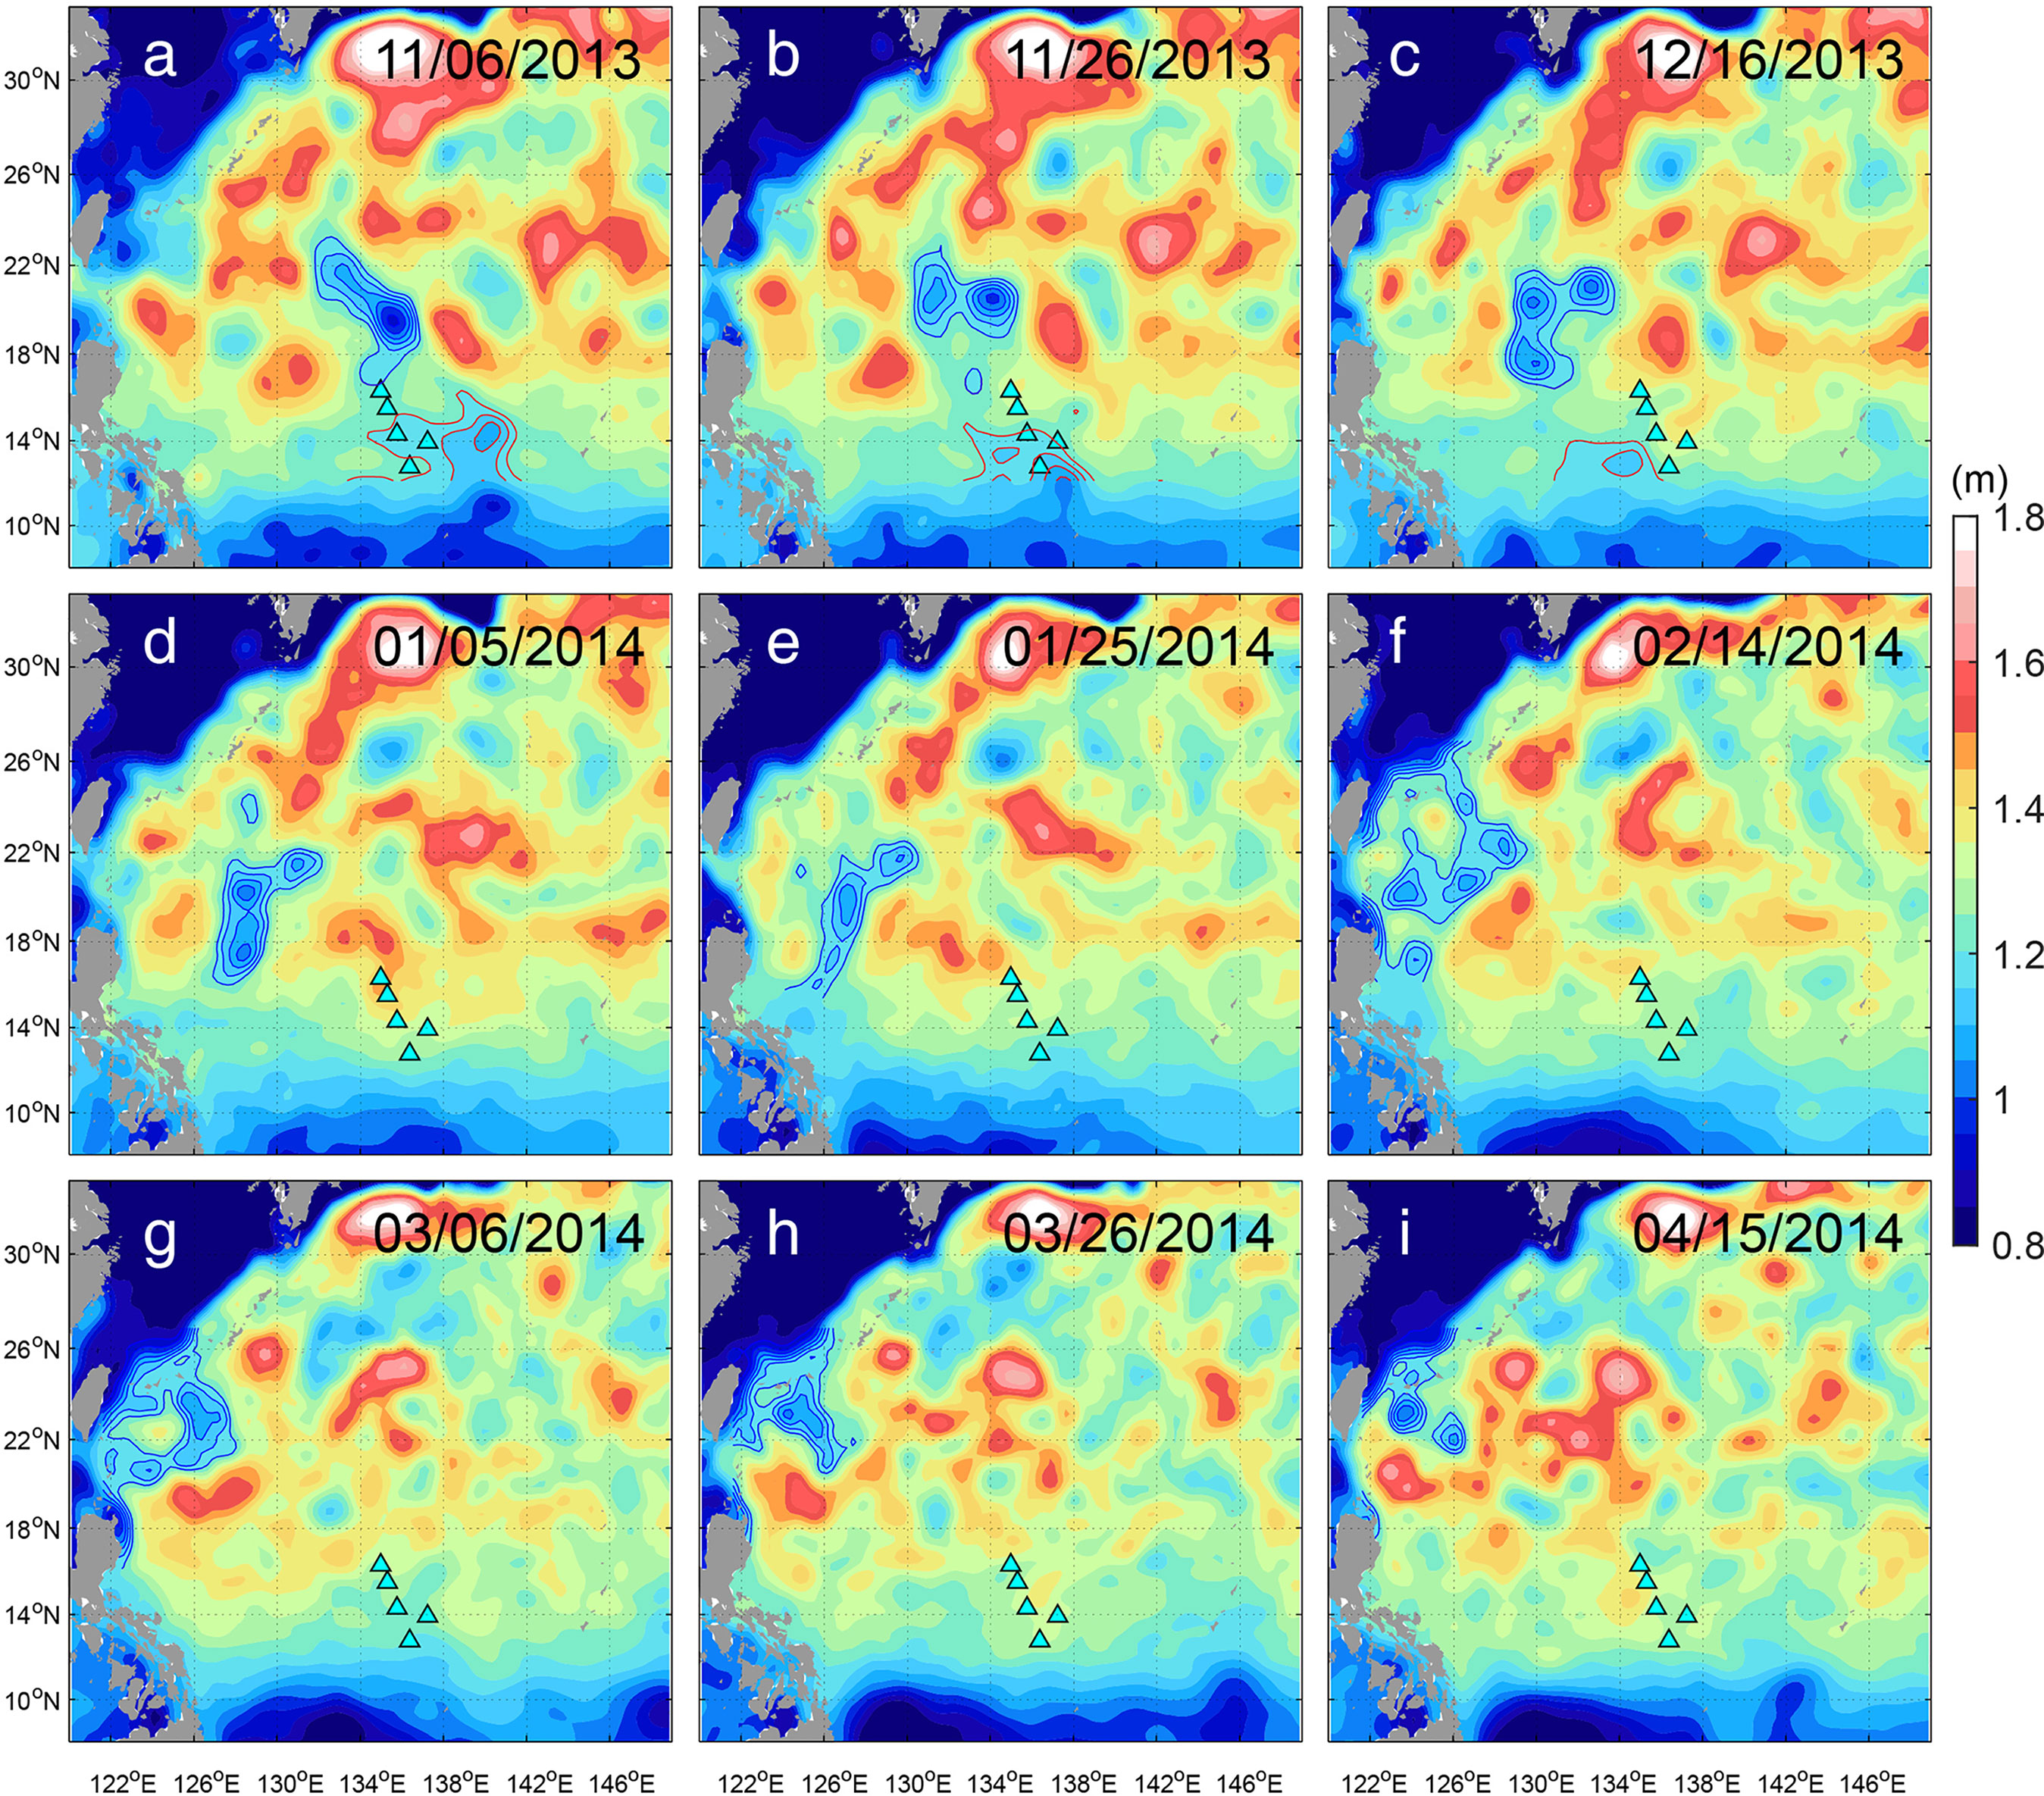
Figure 5 (A–I) Snapshot of sea-surface height (SSH) maps in the western Pacific during the westward propagation of the typhoon-enhanced cold eddies. Snapshots of SSH is every 20 days from November 6th in 2013 to April 15th in 2014. Pressure-recording inverted echo sounder (PIES) mooring sites are indicated by cyan triangles. Blue and red contours are from 0.9 to 1.2 m with 0.05 m intervals.
OHCs and Air-Sea Heat Exchange During Typhoon Passages
The dramatic decrease in SSH along the typhoon tracks is associated with heat loss in the water column. The heat loss can be attributed to ocean interior processes such as upwelling or horizontal advection and air-sea interaction. Using the relationship between the GPHA and OHC anomalies (Figure 2), given the westward eddy propagation, the estimated time- and area-integrated OHC variation in the cold-eddy area (red trapezoid in Figures 1 and 4I) between October 31st and October 5th was – 2.07 × 10²⁰ J. In the same time and area, sensible and latent heat exchanges, which are vital for typhoon intensity (e.g., Malkus and Riehl, 1960; Emanuel, 1986), were – 3.45 × 10¹⁸ J and 4.25 × 10¹⁹ J, respectively. The total air-sea heat exchange was 3.91 × 10¹⁹ J, 18.9% of the estimated OHC change. Sensible and latent heat exchanges even in the broader range of the 300-km radius from typhoon centers were – 5.13 × 10¹⁸ J and 5.91 × 10¹⁹ J, respectively, which were still only 26% of the estimated OHC change. Previous studies (Price, 1981; Jacob et al., 2000; Prasad and Hogan, 2007) have reported that surface heat fluxes generally contribute only to 10%–15% of sea surface cooling, suggesting that the heat balances estimated above are reasonable. Area-averaged values of calculated ΔSSH (and corresponding thermocline shoaling) by Danas, Wipha, and Francisco over the red trapezoid reached –0.04, –0.07, and –0.15 m (24, 44, and 98 m), respectively, comparable to the observed SSH decrements. Hence, the larger fraction of OHC change was due to the thermocline shoaling driven by Ekman divergences, caused by input of cyclonic vorticity by typhoons.
Impacts of Typhoon-Enhanced Cold Eddies on the Kuroshio
We traced the typhoon-reinforced cold eddies visually because eddy tracking methods (Chelton et al., 2011; Faghmous et al., 2015) missed the cold eddies due to nonlinear processes of merging, splitting, and distortion during their westward propagation near the rim of the subtropical gyre. The northern cold eddy spanning 17–23°N on 11/06 split into three-core eddies by 12/16 (Figures 5A–C, blue contours). Repeating distortion, splitting, and merging, they approached the east of the Philippines and Taiwan (Figures 5D–G) and eventually met the Kuroshio east/northeast of Taiwan (Figures 5H, I). The southern cold eddy located at 14°N and 135–141°E (Figure 5A, red contours) moved westward across the PIES sites (F08, F12, and PS1) from October through mid-December (Figures 5B, C). The southern cold eddy became weak and diffuse in early January 2014 (Figures 5D–I), however, it might contribute to the relatively low SSH northeast of the Philippines around 14–18°N in late January–March 2014 (Figures 5E–H).
Mesoscale eddies in subtropical countercurrent region are known to develop through baroclinic instability (e.g., Qiu, 1999). The longitude-time Hovmöller diagram of sea level anomaly at 19.5°N, where the typhoon-enhanced northern cold eddy appeared, shows such time-evolving eddy fields across the basin (Figure 6). The exceptionally strong cold eddy is found at 136°E on October 31st, 2013 (zonal cyan line in Figure 6), demonstrating that the cold eddy enhancement is primarily associated with typhoon passages.
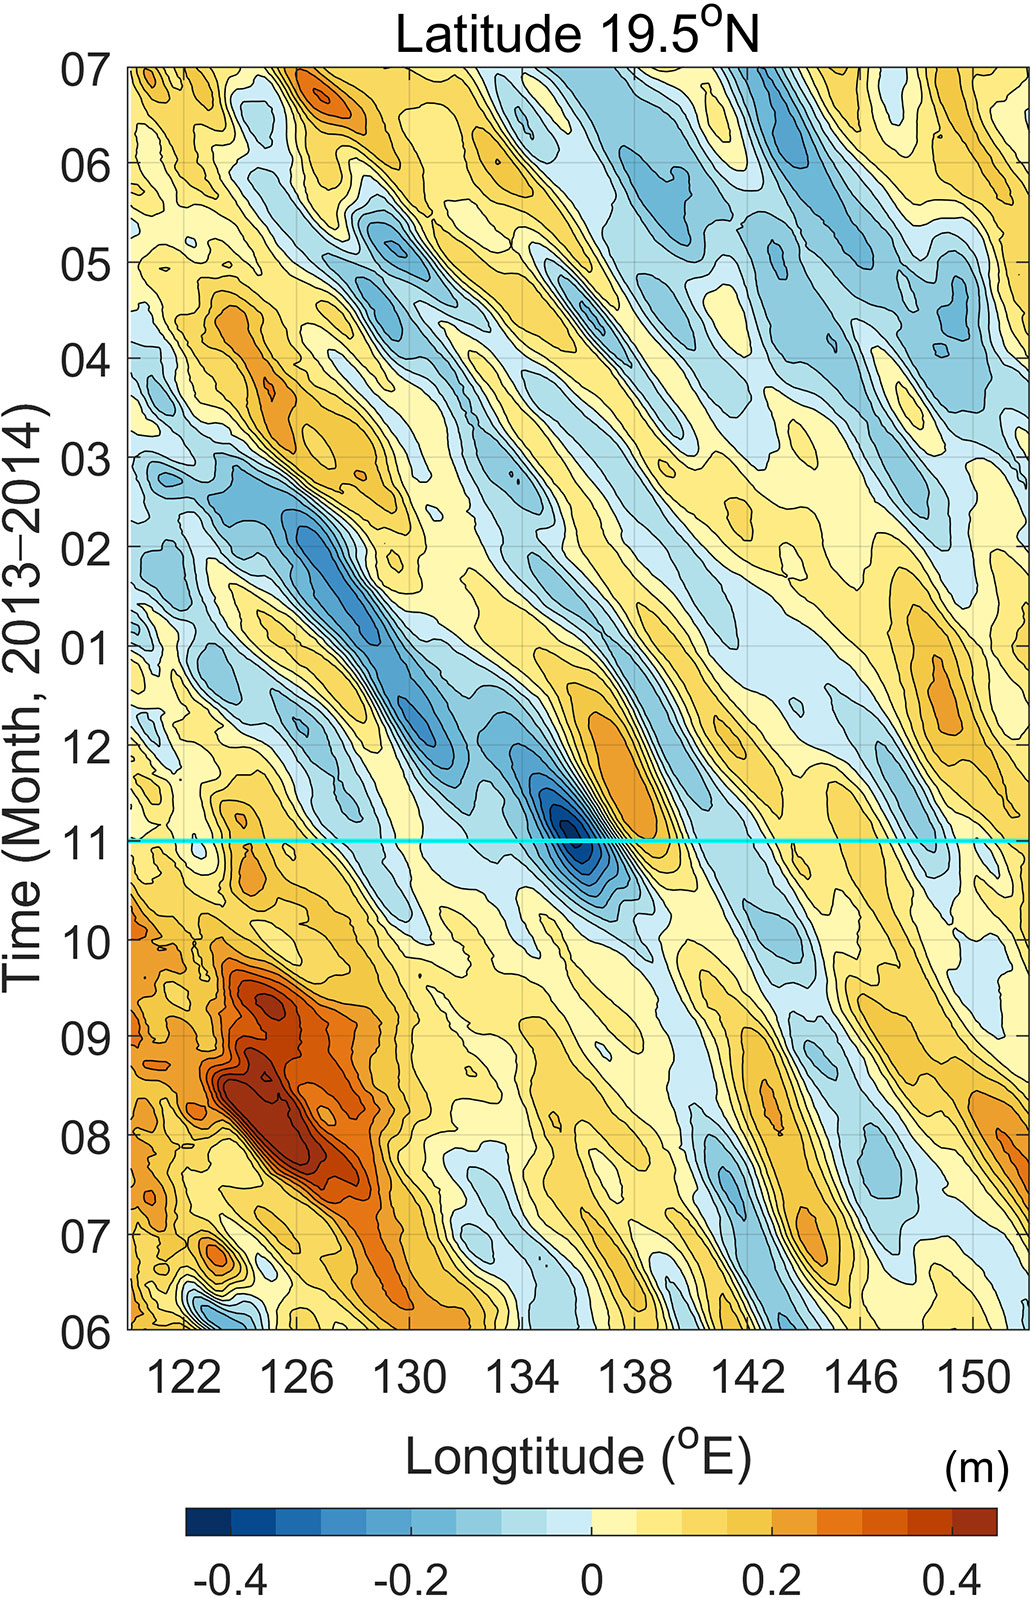
Figure 6 Longitude-time Hovmöller diagram of sea level anomaly (m) at 19.5°N. Zonal cyan line denotes October 31st in 2013 when the notable sea-level drops occurred by the three typhoons as shown in Fig 4h.
Eddies that met the Kuroshio east of Taiwan modulated the Kuroshio intensity from February through May 2014, 4–7 months after typhoon passage. Anomalies in climatological SSH difference across the Kuroshio averaged over February–May (Figure 7) represent the temporal variation of the Kuroshio intensity over 26 years (1993–2018). The SSH difference in 2014 (red bar) was the lowest recorded over the last 26 years (–0.10 m) and corresponds to a 24% decrease from the mean (0.42 m).
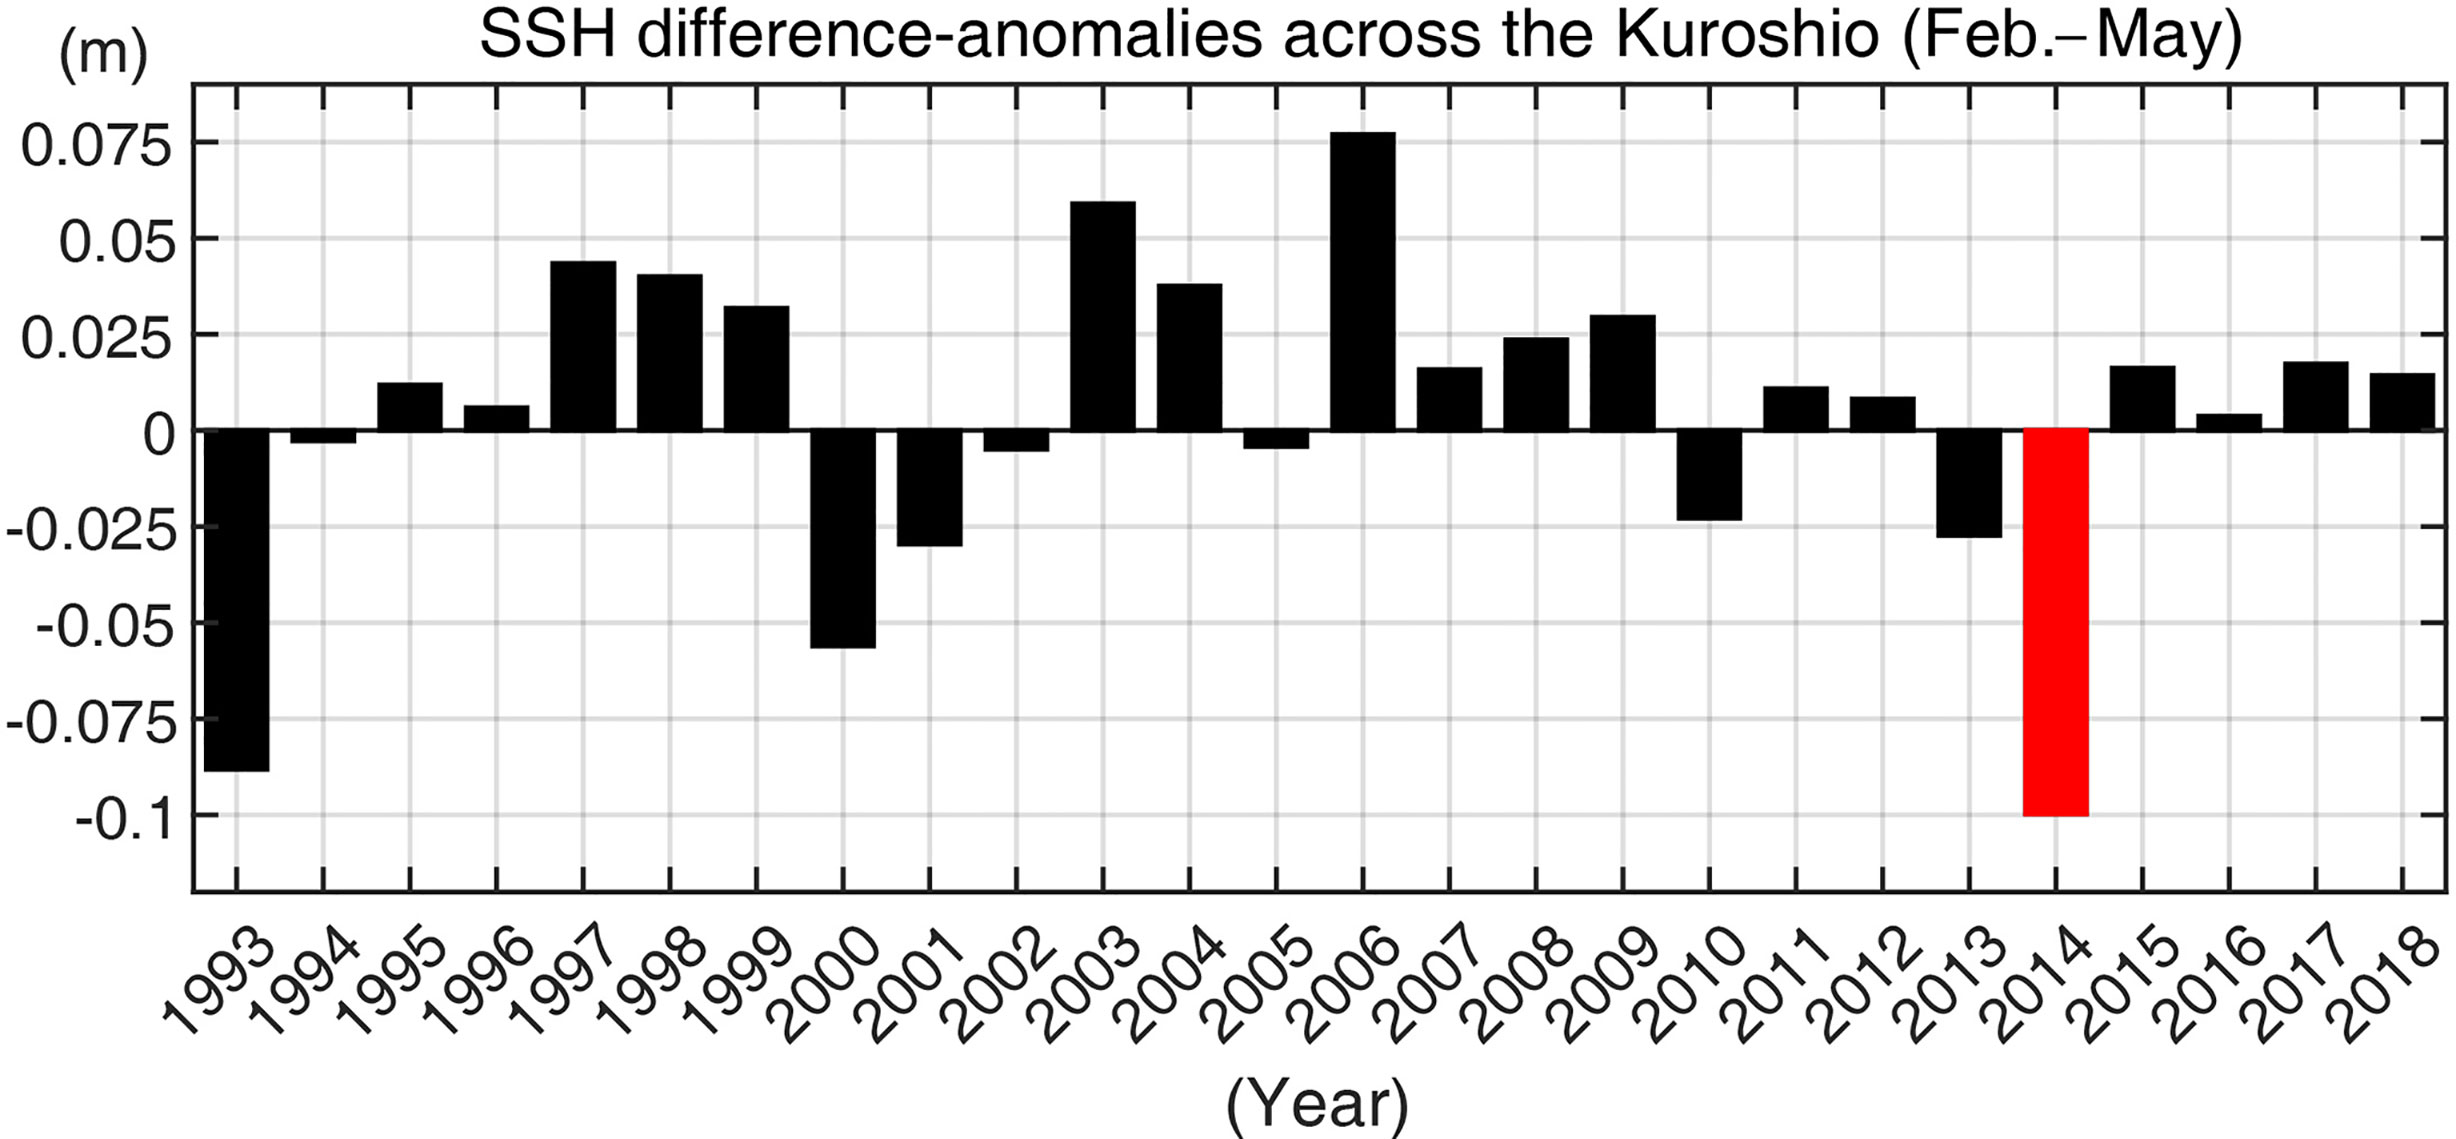
Figure 7 Anomalies in climatological SSH gradients averaged over February–May from 1993 to 2018 in the Kuroshio upstream indicated by red line in Figure 1. Note that the SSH gradient in the Kuroshio for 26 years is estimated with the two-satellite ADT product from CMEMS.
A previous study using long-term satellite measurements found that the intensifying Pacific-typhoon activities strengthen the Kuroshio transport due to typhoon-induced increasing of positive potential vorticities in overall wide eddy fields (Zhang et al., 2020). Our result provides a case opposite to their outcome, which suggests that the typhoon-enhanced cold eddies can act to weaken the Kuroshio intensity when they collide with the Kuroshio several months later.
Conclusions
In October 2013, three consecutive typhoons (Danas, Wipha, and Francisco) passed over the pre-existing cold eddies from southeast to northwest, in the region spanning from 12 to 26°N and 132 to 144°E. In situ PIES moorings and satellite altimetry measurements revealed that pre-existing cold eddies were notably reinforced by the typhoons, producing substantial sea level drops of 0.1–0.3 m. The typhoon-enhanced cold eddies propagated westward over approximately 1,000 kilometers and met the Kuroshio upstream approximately 4 months after the typhoon passages. The cold eddies significantly reduced the Kuroshio intensity in February–May 2014, recording the lowest intensity over the last 26 years and corresponding to a 24% decrease from the mean Kuroshio intensity.
Our work can provide a new mechanism linking typhoon-to-eddy-to-Kuroshio variability through the long-term oceanic memory. In a warming climate, the typhoon intensity in wind and rainfall will increase (Knutson et al., 2010; Patricola & Wehner, 2018), implying that intensified typhoons may have more chances to produce oceanic memories and their impacts on the western boundary currents such as the Kuroshio. Therefore, this new mechanism is maybe likely to play a role in Kuroshio variability in the future.
Data Availability Statement
Typhoon track is at https://www.metoc.navy.mil/jtwc/jtwc.html?western-pacific. Two-satellite ADT (SEALEVEL_GLO_PHY_CLIMATE_L4_REP_OBSERVATIONS_008_057) and all-satellite ADT (SEALEVEL_GLO_PHY_L4_REP_OBSERVATIONS_008_047) are available at https://resources.marine.copernicus.eu/product-detail/SEALEVEL_GLO_PHY_CLIMATE_L4_REP_OBSERVATIONS_008_057/INFORMATION and https://resources.marine.copernicus.eu/product-detail/SEALEVEL_GLO_PHY_L4_REP_OBSERVATIONS_008_047/INFORMATION, respectively. The SST is found at https://data.remss.com/SST/daily/mw_ir/. Historical hydrocasts (EN4.2.1) are at https://www.metoffice.gov.uk/hadobs/en4/. PIES-derived SSH can be downloaded https://github.com/PADOLab1/NEC_PIES.git.
Author Contributions
CJ: primary writing, in situ observation, data processing, and calculations. DRW, HSM, SKK, and I-JM: discussion. DGK: in situ observation and discussion. J-HP: overall coordination, discussion, in situ observation. All authors modify the manuscript. All authors contributed to the article and approved the submitted version.
Funding
This work was supported by “Study on Northwestern Pacific Warming and Genesis and Rapid Intensification of Typhoon” funded by the Korean Ministry of Oceans and Fisheries(20220566)” and “The study for the cooperative use of the research vessel” funded by Korea Institute of Ocean Science and Technology”, and also supported by Pusan National University Research Grant, 2021.
Conflict of Interest
The authors declare that the research was conducted in the absence of any commercial or financial relationships that could be construed as a potential conflict of interest.
Publisher’s Note
All claims expressed in this article are solely those of the authors and do not necessarily represent those of their affiliated organizations, or those of the publisher, the editors and the reviewers. Any product that may be evaluated in this article, or claim that may be made by its manufacturer, is not guaranteed or endorsed by the publisher.
References
Ando K., Lin X., Villanoy C., Danchenkov M., Lee J.-H., He H.-J., et al. (2021). Half-Century of Scientific Advancements Since the Cooperative Study of the Kuroshio and Adjacent Regions (CSK) Programme - Need for a New Kuroshio Research. Prog. Oceanogr. 193, 102513. doi: 10.1016/j.pocean.2021.102513
Sea Surface Height Product User Manual (CMEMS-SL-PUM-008-056-058). Available at: http://marine.copernicus.eu/documents/PUM/CMEMS-SL-PUM-008-056-058.pdf.
Babin S. M., Carton J. A., Dickey T. D., Wiggert J. D. (2004). Satellite Evidence of Hurricane-Induced Phytoplankton Blooms in an Oceanic Desert. J. Geophys. Res. C.: Ocean. 109 (3), 1–21. doi: 10.1029/2003jc001938
Chacko N. (2017). Chlorophyll Bloom in Response to Tropical Cyclone Hudhud in the Bay of Bengal: Bio-Argo Subsurface Observations. Deep. Sea. Res. Part I.: Oceanogr. Res. Paper. 124, 66–72. doi: 10.1016/j.dsr.2017.04.010
Chavas D. R., Lin N., Emanuel K. (2015). A Model for the Complete Radial Structure of the Tropical Cyclone Wind Field. Part I: Comparison With Observed Structure. J. Atmosph. Sci. 72 (9), 3647–3662. doi: 10.1175/JAS-D-15-0014.1
Chelton D. B., Schlax M. G., Samelson R. M. (2011). Global Observations of Nonlinear Mesoscale Eddies. Prog. Oceanogr. 91 (2), 167–216. doi: 10.1016/j.pocean.2011.01.002
Dare R. A., McBride J. L. (2011). Sea Surface Temperature Response to Tropical Cyclones. Month. Weath. Rev. 139 (12), 3798–3808. doi: 10.1175/mwr-d-10-05019.1
D’Asaro E. A., Black P. G., Centurioni L. R., Chang Y. T., Chen S. S., Foster R. C., et al. (2014). Impact of Typhoons on the Ocean in the Pacific. Bull. Am. Meteorol. Soc. 95 (9), 1405–1418. doi: 10.1175/BAMS-D-12-00104.1
D’Asaro E. A., Sanford T. B., Niiler P. P., Terrill E. J. (2007). Cold Wake of Hurricane Frances. Geophys. Res. Lett. 34 (15), 2–7. doi: 10.1029/2007GL030160
Donohue K. A., Kennelly M. A., Cutting A. (2016). Sea Surface Height Variability in Drake Passage. J. Atmosph. Ocean. Technol. 33 (4), 669–683. doi: 10.1175/JTECH-D-15-0249.1
Emanuel K. A. (1986). An Air-Sea Interaction Theory for Tropical Cyclones. Part I: Steady-State Maintenance. J. Atmosph. Sci. 43 (6), 585–605. doi: 10.1175/1520-0469(1986)043<0585:AASITF>2.0.CO;2
Faghmous J. H., Frenger I., Yao Y., Warmka R., Lindell A., Kumar V. (2015). A Daily Global Mesoscale Ocean Eddy Dataset From Satellite Altimetry. Sci. Data 2, 1–16. doi: 10.1038/sdata.2015.28
Gelaro R., McCarty W., Suárez M. J., Todling R., Molod A., Takacs L., et al. (2017). The Modern-Era Retrospective Analysis for Research and Applications, Version 2 (MERRA-2). J. Climate 30 (14), 5419–5454. doi: 10.1175/JCLI-D-16-0758.1
Gentemann C., Minnett P., Sienkiewicz J., DeMaria M., Cummings J., Jin Y., et al. (2009). The Multi-Sensor Improved Sea Surface Temperature (MISST) Project. Oceanography 22 (2), 76–87. doi: 10.5670/oceanog.2009.40
Gong G. C., Shiah F. K., Liu K. K., Chuang W. S., Chang J. (1996). Effect of the Kuroshio Intrusion on the Chlorophyll Distribution in the Southern East China Sea During Spring 1993. Continent. Shelf. Res. 17 (1), 79–94. doi: 10.1016/0278-4343(96)00022-2
Good S. A., Martin M. J., Rayner N. A. (2013). EN4: Quality Controlled Ocean Temperature and Salinity Profiles and Monthly Objective Analyses With Uncertainty Estimates. J. Geophys. Res.: Ocean. 118, 6704–6716. doi: 10.1002/2013JC009067
Jacob S. D., Shay L. K., Mariano A. J., Black P. G. (2000). The 3d Oceanic Mixed Layer Response to Hurricane Gilbert. J. Phys. Oceanogr. 30 (6), 1407–1429. doi: 10.1175/1520-0485(2000)030<1407:TOMLRT>2.0.CO;2
Jaimes B., Shay L. K., Uhlhorn E. W. (2015). Enthalpy and Momentum Fluxes During Hurricane Earl Relative to Underlying Ocean Features. Month. Weath. Rev. 143 (1), 111–131. doi: 10.1175/MWR-D-13-00277.1
Jan S., Mensah V., Andres M., Chang M. H., Yang Y. J. (2017). Eddy-Kuroshio Interactions: Local and Remote Effects. J. Geophys. Res.: Ocean. 122 (12), 9744–9764. doi: 10.1002/2017JC013476
Jeon C., Park J., Kim D. G., Kim E., Jeon D. (2018). Comparison of Measurements From Pressure-Recording Inverted Echo Sounders and Satellite Altimetry in the North Equatorial Current Region of the Western Pacific. Ocean. Sci. J. 53 (2), 207–213. doi: 10.1007/s12601-018-0012-4
Jeon C., Park J., Nakamura H., Nishina A., Zhu X., Kim D. G., et al. (2019). Poleward-Propagating Near-Inertial Waves Enabled by the Western Boundary Current. Sci. Rep. 9 (1), 9955. doi: 10.1038/s41598-019-46364-9
Kang J., Na H. (2022). Long-Term Variability of the Kuroshio Shelf Intrusion and Its Relationship to Upper-Ocean Current and Temperature Variability in the East China Sea. Front. Mar. Sci. 9 (February). doi: 10.3389/fmars.2022.812911
Kennelly M., Tracey K. L., and Watts D. R (2007). Inverted Echo Sounder Data Processing Manual. Environ. Sci. Environ. Sci. doi: 10.21236/ada477328
Knutson T. R., McBride J. L., Chan J., Emanuel K., Holland G., Landsea C., et al. (2010). Tropical Cyclones and Climate Change. Nat. Geosci. 3 (3), 157–163. doi: 10.1038/ngeo779
Large W. G., Pond S. (1981). Open Ocean Momentum Flux Measurements in Moderate to Strong Winds. J. Phys. Oceanogr. 11, 324–336. doi: 10.1175/1520-0485(1981)011<0324:OOMFMI>2.0.CO;2
Lee J. H., Moon J. H., Kim T. (2020). Typhoon-Triggered Phytoplankton Bloom and Associated Upper-Ocean Conditions in the Northwestern Pacific: Evidence From Satellite Remote Sensing, Argo Profile, and an Ocean Circulation Model. J. Mar. Sci. Eng. 8 (10), 1–12. doi: 10.3390/jmse8100788
Lin I., Liu W. T., Wu C.-C., Wong G. T. F., Hu C., Chen Z., et al. (2003). New Evidence for Enhanced Ocean Primary Production Triggered by Tropical Cyclone. Geophys. Res. Lett. 30, 1718. doi: 10.1029/2003GL017141
Lin I.-I, Wu C.-C., Emanuel K. A., Lee I. H., Wu C.-R., Pun I-F., et al. (2005). The Interaction of Supertyphoon Maemi (2003) With a Warm Ocean Eddy. Mon. Weather Rev. 133, (9) 2635–2649. doi: 10.1175/MWR3005.1
Lin Y.-C., Oey L.-Y. (2016). Rainfall-Enhanced Blooming in Typhoon Wakes. Sci. Rep. 6 (1), 31310. doi: 10.1038/srep31310
Lin S., Zhang W. Z., Shang S. P., Hong H. S. (2017). Ocean Response to Typhoons in the Western North Pacific: Composite Results From Argo Data. Deep-Sea. Res. Part I.: Oceanogr. Res. Paper. 123 (March), 62–74. doi: 10.1016/j.dsr.2017.03.007
Liu Z., Gan J., Hu J., Wu H., Cai Z., Deng Y. (2021). Progress of Studies on Circulation Dynamics in the East China Sea: The Kuroshio Exchanges With the Shelf Currents. Front. Mar. Sci. 8 (February). doi: 10.3389/fmars.2021.620910
Liu S.-S., Sun L., Wu Q., Yang Y.-J. (2017). The Responses of Cyclonic and Anticyclonic Eddies to Typhoon Forcing: The Vertical Temperature-Salinity Structure Changes Associated With the Horizontal Convergence/Divergence. J. Geophys. Res.: Ocean. 122 (6), 4974–4989. doi: 10.1002/2017JC012814
Lu Z., Wang G., Shang X. (2020). Strength and Spatial Structure of the Perturbation Induced by a Tropical Cyclone to the Underlying Eddies. J. Geophys. Res.: Ocean. 125 (5), 1–19. doi: 10.1029/2020JC016097
Malkus J. S., Riehl H. (1960). On the Dynamics and Energy Transformations in Steady-State Hurricanes. Tellus 12 (1), 1–20. doi: 10.1111/j.2153-3490.1960.tb01279.x
Mei W., Primeau F., McWilliams J. C., Pasquero C. (2013). Sea Surface Height Evidence for Long-Term Warming Effects of Tropical Cyclones on the Ocean. Proc. Natl. Acad. Sci. 110 (38), 15207–15210. doi: 10.1073/pnas.1306753110
Nam S., Kim D. J., Moon W. M. (2012). Observed Impact of Mesoscale Circulation on Oceanic Response to Typhoon Man-Yi, (2007). Ocean. Dynam. 62 (1), 1–12. doi: 10.1007/s10236-011-0490-8
Pan J., Huang L., Devlin A., Lin H. (2018). Quantification of Typhoon-Induced Phytoplankton Blooms Using Satellite Multi-Sensor Data. Remote Sens. 10 (2), 318. doi: 10.3390/rs10020318
Park J. J., Kwon Y.-O., Price J. F. (2011). Argo Array Observation of Ocean Heat Content Changes Induced by Tropical Cyclones in the North Pacific. J. Geophys. Res. 116 (C12), C12025. doi: 10.1029/2011JC007165
Park J.-H., Watts D. R., Donohue K. A., Tracey K. L. (2012). Comparisons of Sea Surface Height Variability Observed by Pressure-Recording Inverted Echo Sounders and Satellite Altimetry in the Kuroshio Extension. J. Oceanogr. 68 (3), 401–416. doi: 10.1007/s10872-012-0108-x
Park J.-H., Yeo D. E., Lee K. J., Lee H., Lee S.-W., Noh S., et al. (2019). Rapid Decay of Slowly Moving Typhoon Soulik, (2018) Due to Interactions With the Strongly Stratified Northern East China Sea. Geophys. Res. Lett. 46 (24), 14595–14603. doi: 10.1029/2019GL086274
Patricola C. M., Wehner M. F. (2018). Anthropogenic Influences on Major Tropical Cyclone Events. Nature 563 (7731), 339–346. doi: 10.1038/s41586-018-0673-2
Potter H. (2018). The Cold Wake of Typhoon Chaba, (2010). Deep-Sea. Res. Part I.: Oceanogr. Res. Paper. 140 (August), 136–141. doi: 10.1016/j.dsr.2018.09.001
Prasad T. G., Hogan P. J. (2007). Upper-Ocean Response to Hurricane Ivan in a 1/25° Nested Gulf of Mexico HYCOM. J. Geophys. Res.: Ocean. 112 (4), 1–18. doi: 10.1029/2006JC003695
Price J. F. (1981). Upper Ocean Response to a Hurricane. J. Phys. Oceanogr. 11 (2), 153–175. doi: 10.1175/1520-0485(1981)011<0153:UORTAH>2.0.CO;2
Price J. F., Sanford T. B., Forristall G. Z. (1994). Forced Stage Response to a Moving Hurricane. J. Phys. Oceanogr. 24 (2), 233–260. doi: 10.1175/1520-0485(1994)024<0233:FSRTAM>2.0.CO;2
Qiu B. (1999). Seasonal Eddy Field Modulation of the North Pacific Subtropical Countercurrent: TOPEX/Poseidon Observations and Theory. J. Phys. Oceanogr. 29 (10), 2471–2486. doi: 10.1175/1520-0485(1999)029<2471:SEFMOT>2.0.CO;2
Shay L. K., Goni G. J., Black P. G. (2000). Effects of a Warm Oceanic Feature on Hurricane Opal. Month. Weath. Rev. 128 (5), 1366–1383. doi: 10.1175/1520-0493(2000)128<1366:EOAWOF>2.0.CO;2
Shi Q., Wang G. (2021). Meander Response of the Kuroshio in the East China Sea to Impinging Eddies. J. Geophys. Res.: Ocean. 126 (9). doi: 10.1029/2021JC017512
Trenberth K. E., Large W. G., Olson J. G. (1990). The Mean Annual Cycle in Global Ocean Wind Stress. J. Phys. Oceanogr. 20 (11), 1742–1760. doi: 10.1175/1520-0485(1990)020<1742:TMACIG>2.0.CO;2
Tsai C. J., Andres M., Jan S., Mensah V., Sanford T. B., Lien R. C., et al. (2015). Eddy-Kuroshio Interaction Processes Revealed by Mooring Observations Off Taiwan and Luzon. Geophys. Res. Lett. 42 (19), 8098–8105. doi: 10.1002/2015GL065814
Walker N. D., Leben R. R., Balasubramanian S. (2005). Hurricane-Forced Upwelling and Chlorophyll a Enhancement Within Cold-Core Cyclones in the Gulf of Mexico. Geophys. Res. Lett. 32 (18), 1–5. doi: 10.1029/2005GL023716
Wu R., Li C (2018). Upper Ocean Response to the Passage of Two Sequential Typhoons. Deep Sea Research Part I: Oceanographic Research Papers. 132, 68–79. doi: 10.1016/j.dsr.2017.12.006
Wu C., Wang Y., Lin Y., Chao S. (2017). Intrusion of the Kuroshio Into the South and East China Seas. Sci. Rep. 7 (1), 7895. doi: 10.1038/s41598-017-08206-4
Yan X., Zhu X. H., Pang C., Zhang L. (2016). Effects of Mesoscale Eddies on the Volume Transport and Branch Pattern of the Kuroshio East of Taiwan. Journal of. Geophys. Res.: Ocean. 121 (10), 7683–7700. doi: 10.1002/2016JC012038
Yue X., Zhang B., Liu G., Li X., Zhang H., He Y (2018). Upper Ocean Response to Typhoon Kalmaegi and Sarika in the South China Sea from Multiple-Satellite Observations and Numerical Simulations. Remote Sens. 10 (3), 348. doi: 10.3390/rs10020348
Zhang H., Chen D., Zhou L., Liu X., Ding T., Zhou B. (2016). Upper Ocean Response to Typhoon Kalmaegi, (2014). J. Geophys. Res.: Ocean. 121 (8), 6520–6535. doi: 10.1002/2016JC012064
Keywords: typhoon, oceanic cold eddies, Kuroshio, typhoon-to-eddy-to-Kuroshio link, Kuroshio weakening
Citation: Jeon C, Watts DR, Min HS, Kim DG, Kang SK, Moon I-J and Park J-H (2022) Weakening of the Kuroshio Upstream by Cyclonic Cold Eddies Enhanced by the Consecutive Passages of Typhoons Danas, Wipha, and Francisco (2013). Front. Mar. Sci. 9:884768. doi: 10.3389/fmars.2022.884768
Received: 27 February 2022; Accepted: 02 May 2022;
Published: 16 June 2022.
Edited by:
Zhiyu Liu, Xiamen University, ChinaReviewed by:
Xiaohui Ma, Ocean University of China, ChinaAkira Nagano, Japan Agency for Marine-Earth Science and Technology (JAMSTEC), Japan
Copyright © 2022 Jeon, Watts, Min, Kim, Kang, Moon and Park. This is an open-access article distributed under the terms of the Creative Commons Attribution License (CC BY). The use, distribution or reproduction in other forums is permitted, provided the original author(s) and the copyright owner(s) are credited and that the original publication in this journal is cited, in accordance with accepted academic practice. No use, distribution or reproduction is permitted which does not comply with these terms.
*Correspondence: Jae-Hun Park, amFlaHVucGFya0BpbmhhLmFjLmty