 Eldar Lien*
 Geir Valsvik
 Jan Vidar Nordstrand
 Vincent Martinez
 Vegard Rogne
 Ola Hafsås
 Sara Queralt
 Behnood Sjåstad Fathi
 Morten Aga
- Research and Development (R&D) Department, SeaRAS AS, Bergen, Norway
Hydrogen sulfide (H2S) is toxic to all species used in aquaculture. The extensive fish mortalities inflicted by H2S-poisoning can cause significant direct economic losses. Called the silent killer among scholars and fish farmers, H2S is highly soluble in aquatic environments and has significant damage potential; once detected, the time for mitigation actions is limited as fish stocks are rapidly impacted by the gas. The detection of H2S at low concentrations is challenging with the state-of-the-art sensors used today. Despite its significant damage potential, the industry has not been able to provide a reliable yet user-friendly system to address this. The aim of this paper is to provide a step forward in this direction by introducing a system for real-time monitoring of H2S at sub µg/L levels in RAS. The SeaRAS AquaSense System (AQS) utilizes real-time monitoring of H2S in parallel with other water quality parameters, such as CO2, O2, pH, and temperature, through a set of autonomous wireless-based sensor units installed in multiple locations in RAS. The system is calibrated and verified further by an autonomous calibration system where substrates of known values are brought to the sensor at a defined interval, offering the user data confidence that is exceptional and of high value. The H2S levels are measured in real-time at high-temporal resolution (down to 0.05 µg/L). By having units located in distinct locations in the water treatment loop, a true real-time monitoring of water treatment processes in RAS is given. Preliminary results provide new insights to the mechanisms behind H2S formation in operational RAS, and, more important, provide a basis for the development of risk-reducing actions and means for risk mitigation through degassing processes. By measuring real time simultaneously in multiple locations and in the exhaust of the degasser, a true mass balance of the system can be formulated by the given amount of feed, measured parameters by sensors and the known flow rate. By using the SeaRAS AquaSense System it is also possible to track the amount of H2S that leaks to the recirculating water per m2 of biofilm in RAS. This is a critical parameter and of high priority to be considered in the context of coping with the H2S-induced risks in RAS. The finding of this work highlights that the formation of toxic H2S is inevitable in RAS-process, ergo, the focus of the industry should instead go toward how to cope with it. In this regard, the SeaRAS AquaSense System provides a step forward towards a practical solution for managing H2S-poisoning risk in aquaculture. This work suggests a need for future research on determining acceptable limits for H2S in water quality context in RAS and investigating a new insight on interaction between H2S and other water quality parameters such as CO2.
1 Introduction
The formation of hydrogen sulfide, H2S (also known as dihydrogen sulfide, sulfane, hydrosulfuric acid, dihydrogen monosulfide, sulfurated hydrogen, sewer gas and sulfur hydride) is of major concern in aquatic environment nowadays; especially, within the recent growing trend in marine land-based recirculating aquaculture systems (RAS) (Rojas-Tirado et al., 2021). In recent years, H2S-poisoning in RAS has caused severe fish mortality in Atlantic salmon (Salmo salar) in Norway (Hjeltnes et al., 2019; Sommerset et al., 2020). These extensive fish mortalities impose direct significant economic losses and high damage potential within the market (Åtland and Stenberg, 2019). The increasing use of saline water in post-smolt RAS may explain the increasing trend in H2S-induced fish mortalities. The sulfate concentration in seawater is about 1000 times higher than that found in freshwater (Letelier-Gordo et al., 2020); this elevated sulfate level in RAS, in turn, may lead to more H2S formation. This makes post-smolt RAS and grow-out fish size productions vulnerable to H2S outbreaks, since seawater is used to prevent desmoltification and to prepare the post-smolt for a transfer to the sea (Rojas-Tirado et al., 2021).
The rotten-egg odorous H2S known as silent killer among scholars and fish farmers is highly soluble in aquatic environment [4000 mg/L (at 20°C)] (Duan et al., 2007; Barton et al., 2014); once appears, the time for mitigation actions is limited as fish stocks are rapidly impacted by the toxic gas. The gas is flammable, colorless, and slightly heavier than air (specific gravity 1.19 at 15°C) with molar mass of 34.08 g/mol (Rubright et al., 2017). In aqueous solution, similar to that of water, it always equilibrates with its anions: bisulfide (HS-) and sulfide (S2-) – see equation 1-1 (Li and Lancaster, 2013). Unlike H2S and S2- that are substantially toxic, the anion HS- is not toxic by nature (Tanudjaja, 2021). Aqueous H2S is volatile, in other words, it inevitably equilibrates between the aquatic and gas phases (Li and Lancaster, 2013) – first left equilibrium in Equation 1-1. The dissociation process of H2S(aq) [with pKa1 equals to 7.04 at 25°C and pKa2 from 12 to 15 – see Li and Lancaster (2013) for a review] highly depends on the pH of that solution (the bond dissociation energy is 90 kcal/mol). In other words, pH determines the concentration of H2S(aq). The RAS, in particular smolt and post-smolt production, is typically run under pH ranges between 6 and 8, hence, in theory, containing H2S fraction in the form of both H2S(aq) and HS- - Figure 1.
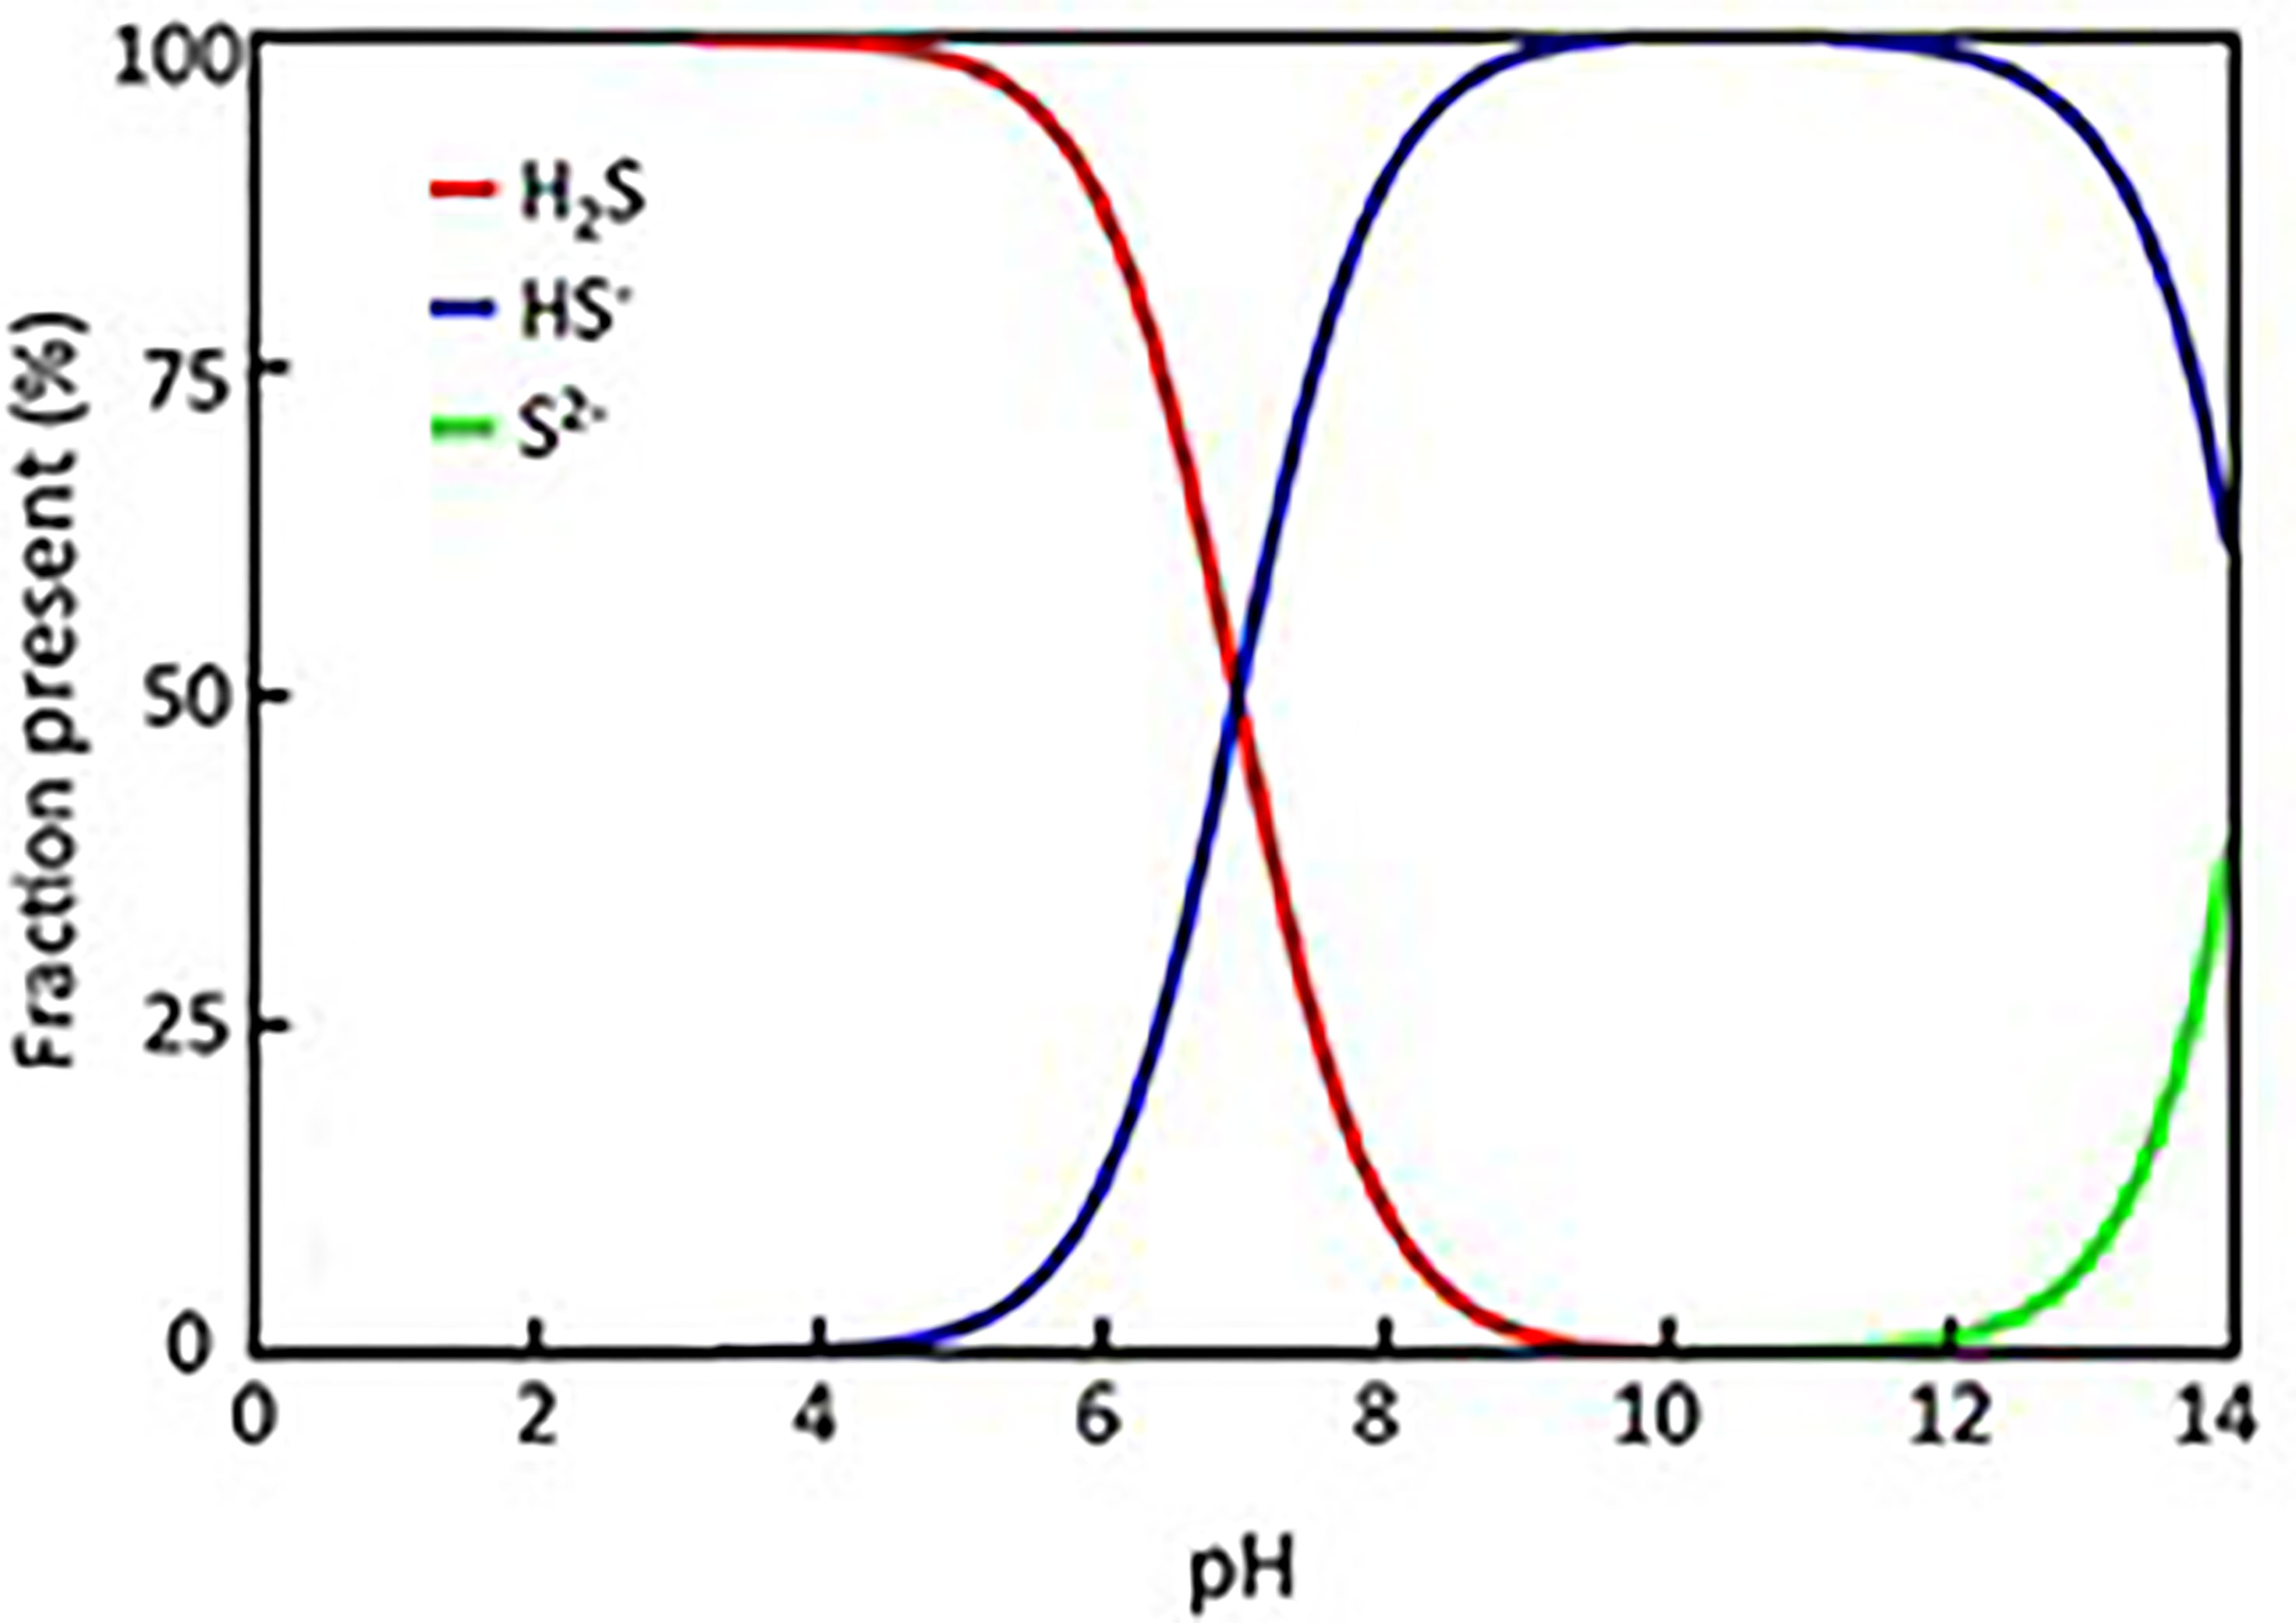
Figure 1 The equilibrium speciation of aqueous hydrogen sulfide at different pH [taken from (Holmer and Hasler-Sheetal, 2014)].
The H2S toxicity threshold is approximated to be as low as 0.002 mg/L for fish; although, there is no exact threshold defined for Atlantic salmon, nor for RAS as of today (Hjeltnes et al., 2019; Sommerset et al., 2020). The H2S 96-hour LC50 (lethal concentration 50) values for freshwater species found to be in range 20-50 µg/L, while, for marine species this is 50-500 µg/L (Boyd, 2014) – this is a measure that reflects the concentration of the toxic gas in water that killed 50% of test animals in 96 hours of testing time. Although there is no certain regulation set by the Norwegian Food Safety Authority (Mattilsynet) for H2S toxicity in aquaculture (Rosten et al., 2004), it is recommended that freshwater and marine species are exposed to no more than 2 µg/L and 5 µg/L of H2S gas respectively (Boyd, 2014). Tanudjaja (2021) suggested that this may be explained by the lack of enough measured H2S data during RAS process, while Rojas-Tirado et al. (2021) pointed the lack of understanding H2S formation mechanism, in particular, the importance of biofilter as potential hotspots to produce the gas. Long term exposure to H2S can lead to growth reduction, fecundity, swimming performance and a great stress on fish as it disrupts the respiration process that lead to cellular anoxia (Kiemer et al., 1995). To fully investigate reasoning behind an H2S-poisoning incident, collecting data before the incident from different potential hotspots in RAS is essential in analyzing the involving factors. In addition, a system that collects data throughout RAS-process can be an important tool for further setting proper early-warning alarms in occurrence of H2S-spikes. Real-time monitoring of H2S at sub µg/L levels, parallel to other water quality parameters has not been available and therefore not yet practiced for commercial purposes. This left researchers and experts to not being able to find out the formation mechanism of sudden H2S-induced fish mortalities with the track of possible involving factors (Dalsgaard, 2019), leading to ultimately more unreliable outcomes to be further analyzed (Cämmerer et al., 2020). Many fish farms, as of today, measure several water quality parameters at fixed times and in selected tanks, leading often to mislead the results captured from peaks, and the rhythmic patterns. More frequent measuring points with higher sampling rate together with a systematic data analysis are thus needed to obtain specifically the knowledge of H2S-formation. This would also enable the industry to implement warning’s alarms for such incidents that start escalating. A real-time monitoring system that can measure H2S in sub µg/L in important potential hotspots in RAS should thus be of priority to be practiced in industry.
Possible mechanisms to explain H2S formation are linked to several factors: i) the natural sulfate content in both freshwater (~5–50 mg/L) and higher in seawater (~2700 mg/L) – therefore higher chance of the incident in seawater (Letelier-Gordo et al., 2020), ii) the existence of carbon-based compound like methane in water, iii) biodegradation processes governed by reduction-oxidation (redox) chemical reactions mainly under anoxic (absence of oxygen) conditions in presence of accumulated organic matters and bacteria e.g., sulfate-reducing bacteria (SRB), and methane-reducing bacteria (MRB) (Li and Lancaster Jr., 2013), iv) environmental chemical conditions of the aquatic environment (water) including mobility of major anions and cations, pH, temperature, alkalinity and redox potential (Tanudjaja, 2021), v) physical properties of the aquatic environment in favor of H2S accumulation such as high turbidity, low water flow, and dirt sedimentation inside of the pipelines (Yu and Bishop, 2001; Prema, 2020) and lastly vi) technical problems that may trigger water backlash around the sediments, ergo, release all formed accumulated H2S at once (Tanudjaja, 2021). The presence of carbon-based (C-based) compounds like methane or organic matters as result of both feeding fish and waste solids produced by fish may play a key role in understanding the formation mechanism of toxic H2S. The C-based compounds reacts with sulfate content in water and form HS- which reacts later with existing dissociated hydrogen ion (H+) in water to form the toxic H2S. This reaction can be either directed naturally via chemical thermodynamics (Equation 1-2, in presence of methane) or via bacteria under an anoxic condition (Table 1). The source of methane in water may have resulted from either deep-lying and oxygen-free, yet carbon-rich sediment stores at bottom of fjords or river-streams that interacted with geologic carbon-rich formations. One may argue that, in the case of land-based post-smolt RAS in Norway, since the intake waters are often taken from the deep fjord due to its optimal stable water quality, it may contain more methane and therefore be more prone to form H2S – Equation 1-2.
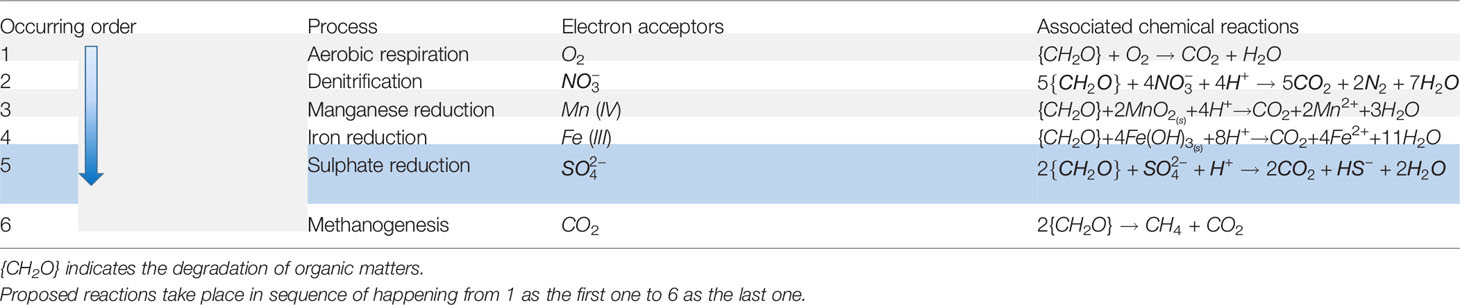
Table 1 Possible redox reactions as biodegradation process that together may describe the formation of the toxic H2S.
The presence of organic matter in process of RAS may also contribute to the formation of toxic H2S through biodegradation process. This chemical breakdown process of organic matters is governed by redox reactions where electrons from organic carbon (electron donor) to other compounds (electron acceptor) are transferred. Redox reactions occur in order of highest-to-lowest chemical energy thermodynamics obtained by bacteria to degrade organic matters as well as the availability of these electron acceptors in sequence: O2, , Mn (IV), Fe (III), , and CO2 (Mougin et al., 2007; Weiner, 2008). The greatest amount of energy obtained by bacteria is from O2, hence, the aerobic (oxic) respiration takes always place prior to anaerobic (anoxic) one and it continues until all dissolved O2 is consumed. Once O2 consumed, the bacteria start consuming , Mn (IV), Fe (III), , CO2 in sequence – Table 1. This basically means the formation of H2S in biodegradation process via sulphate-reducing bacteria (SRB) may be favored by the presence of organic matter and the absence of oxygen, , Mn (IV), and Fe (III). Given this order sequence in the complex RAS setup with the dynamic fluctuation of the involving elements, it is important to monitor mass-balance changes throughout the system for further analysis. This may not only help us understand the change dynamics, but also may give us a chance to prevent such incidents via mitigation actions.
Overall, there can be two main contributions to form H2S in RAS:
1. The constant formation of the toxic H2S in the anaerobic part of the biofilm where bio-elements provide large amount of surface area (Rojas-Tirado et al., 2021). This explains the root cause for the steady-state H2S-level measured in RAS as a result of the constant diffusion-out rate through biofilm.
2. Encapsulation of sedimented or dead organic material/loads (Rosten et al., 2004). Mechanical damage of this causes the often-deadly H2S spikes in RAS.
Furthermore, one liter of water at the standard temperature and pressure (STP) typically contains approximately. 4.5 g H2S gas at 100% saturation. One may argue that by releasing one liter water at 100% H2S-saturation into 1000 m3 of water, it gives the concentration of 4.5 µg/L in theory, which is at the upper limit of what today is reckoned to be acceptable.
Although the monitoring of mass balances of key factors involved is important for taking mitigation actions, it may not be enough to control and prevent H2S poisoning incidents, as H2S spike occurs fast, and more important, impacts the fish quickly. Therefore, there is a need for a feasible and viable solution that can predict such potential deadly incidents that can be formed in matter of seconds anywhere in RAS. In this study, the aim was to develop a real-time monitoring of H2S that can measure the gas down to sub levels µg/L in different potential hotspots in RAS together with the track of some other important water quality parameters and offer this as a tool to the industry for further gaining knowledge around formation of H2S. The proposed system in this study can let industry predict the future deadly spikes of H2S and, hence, allow for mitigation measures in advance.
2 Materials and Methods
RAS comprises a series of treatment processes to maintain water quality in intensive fish farming. These treatments include in general: i) mechanical filter such as drum filter used to remove particulate organic matter larger than 20 µm, ii) biofilter to convert toxic ammonia , excreted by the fish into nitrate , iii) trickling filter to degas CO2 and N2 followed by usually a protein skimmer to remove less than 20 µm of particulate organic matter from the water through foam coagulation process and iv) oxygen enrichment system to increase dissolved oxygen content before water gets back into the tank – Figure 2A.
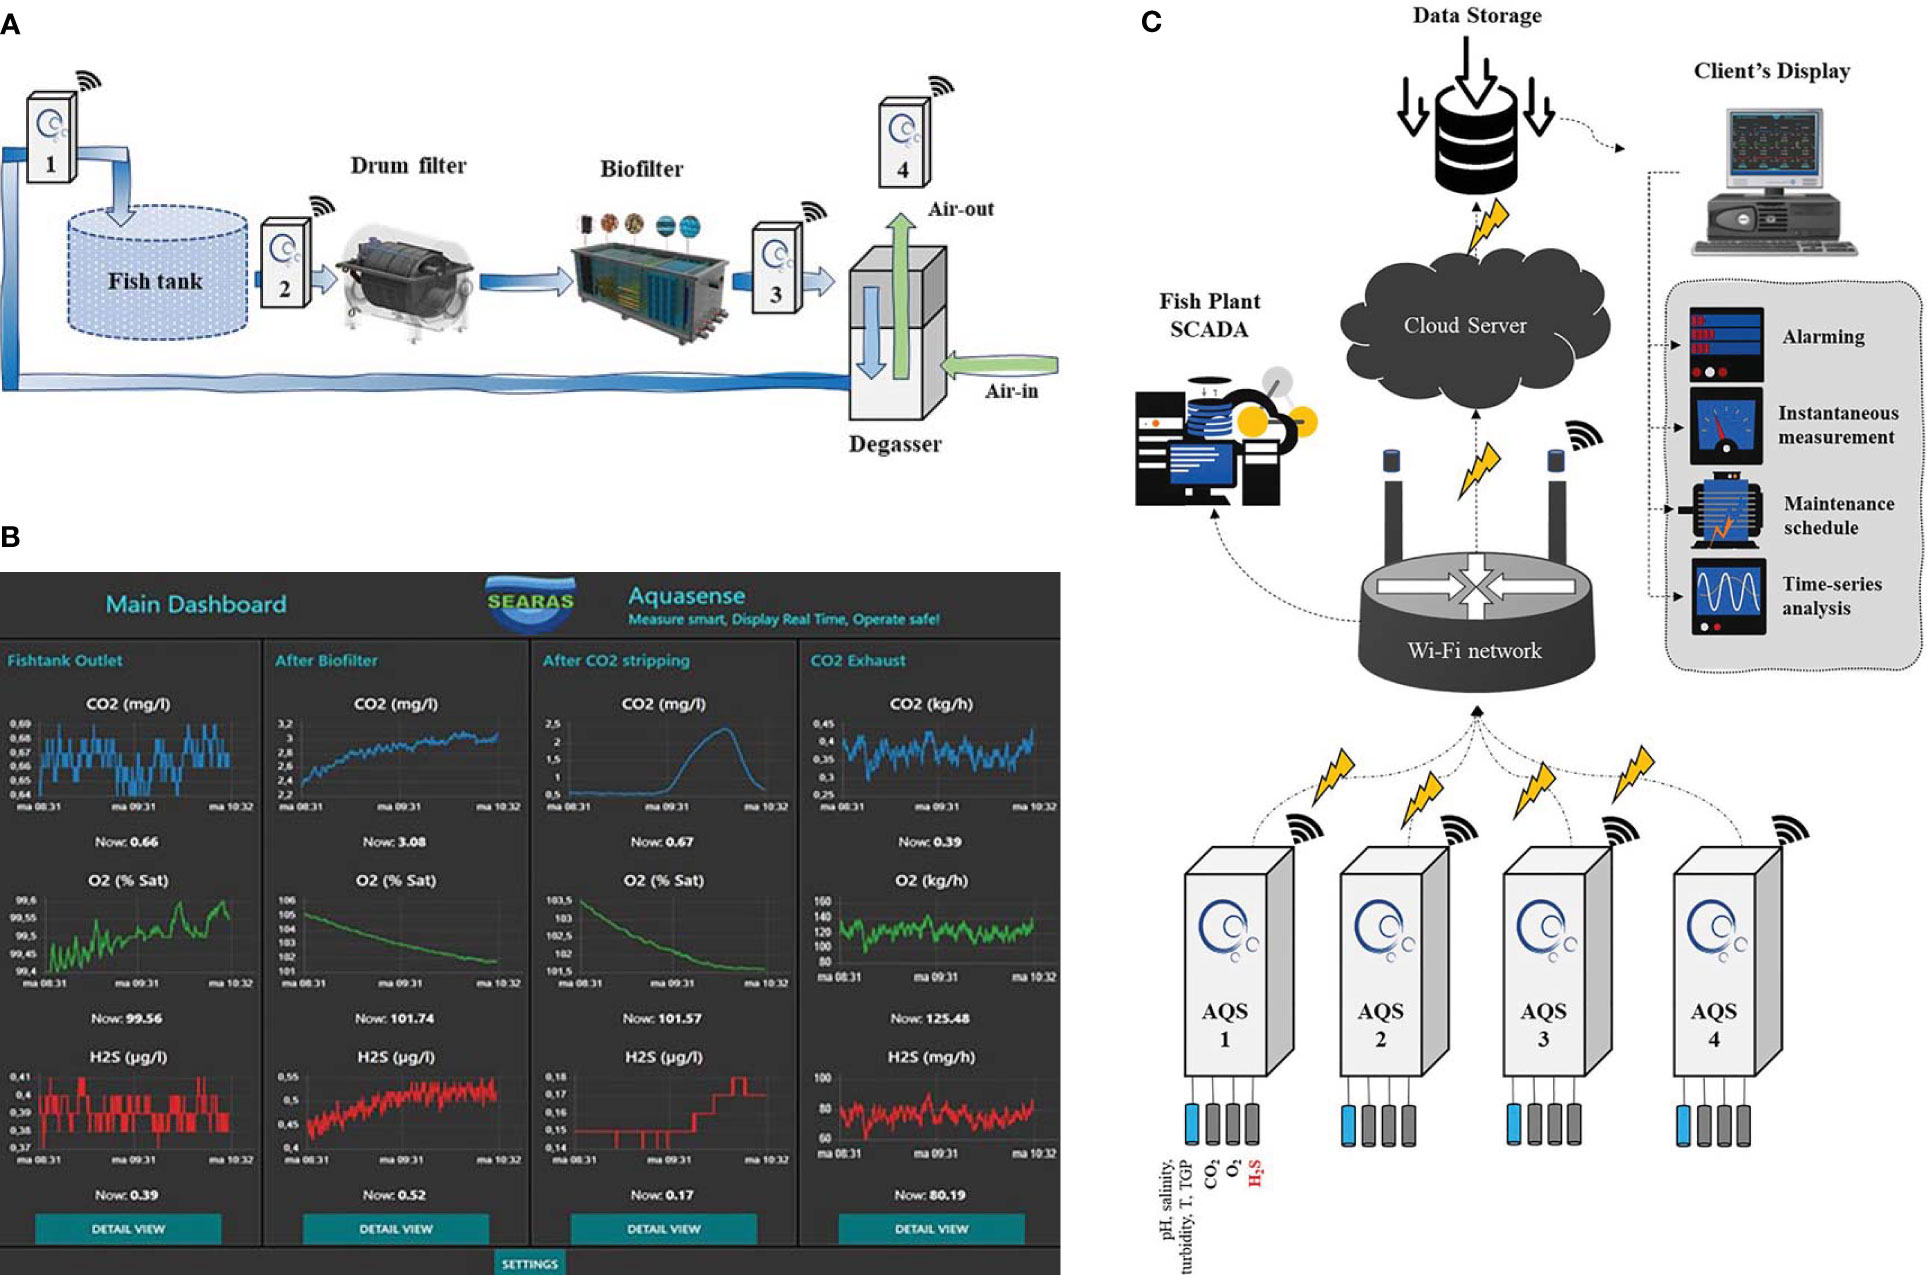
Figure 2 (A) AQS consists of four units per RAS that are setup in four potential hotspots: 1) before the fish tank, 2) after the fish tank and before the drum filter, 3) after biofilter and 4) after degasser. (B) Example of installed AQS in RAS, and the main dashboard to present time-series of real-time monitored data for water quality parameters like O2, CO2 and H2S as presented in panel (A). (C) Data flow schematic diagram of AQS.
2.1 AquaSense System (AQS)
AquaSense system (AQS) is a mobile, wireless-based, and real-time monitoring system for measuring water quality parameters such as CO2 (mg/L), O2 (mg/L), H2S (µg/L), pH, salinity (S) (ppt or g/kg or ‰), temperature (T) (°C), total gas pressure (TGP) (%), and turbidity (NTU). It was explicitly designed to measure H2S at high-temporal resolution (down to 0.05 µg/L) with a sampling rate of 1 Hz (one cycle per second) and is attributed to different locations in the closed fish tank. The sensors are not directly exposed to water, ensuring low maintenance as well as high accuracy. A system for automatic verification of calibration is implemented by bringing a calibrated gas to the sensor at regular time intervals. The typical setup for AQS would be four units per RAS to be installed in four different important hotspots – they are hereby referred as AQS1, AQS2, AQS3 and AQS4 in the text. The first unit locates before the fish tank and after degassing. The second one is setup after the fish tank before the drum filter. The third unit is installed after the biofilter. The fourth unit is installed after degasser and measures the air out of it – Figure 2A. Smart autonomous wireless-based sensors communicate together through an open standard network and collect data to be later stored in a shared cloud or locally. This lets the system exchange data with other system in an easy manner. Figure 2B shows an example of the installed AQS with the customized dashboard for the client. Data are represented in a web-based interface with options to transmit data or alarms to external systems like supervisory control and data acquisition (SCADA) – Figure 2C. Data is sent through Wi-Fi network to a cloud server or a fish plant SCADA. Stored data can be linked to the client’s display for further analyzing, offering options to display time series analysis of measured water quality parameters or the instantaneous measurements with defined alarms – Figure 2C. Note that the dashboard can be setup based on customer’s needs, providing more options to analyze upon request. Sensor calibration is verified at regular intervals by comparing to a reference calibrated source. This offers the user the data confidence that is exceptional and of high value.
AQS covers the ranges 0-80 µg/L and 2-430 µg/L of H2S to be measured – these ranges are valid under following condition: T = 15°C, S = 20 ‰, pH = 7, pressure = 1 atm. AQS should not be performed close to downstream of ozone (O3).
2.2 Mass Balance in AQS
By measuring water quality parameters in different locations in water flow in RAS (see Figure 2A), mass-balance change of these parameters can be simply computed. The biomass, amount of feeding, O2, CO2 and H2S are measured and are thus known values, hence, can be used to formulate the mass-balance changes over the system. In particular, production or consumption in fish tank, in biofilter and in degasser are all calculated based on registered data in the different AQS’s as well as the known flow rate. An example of mass-balance calculations can be seen in Figure 3B.
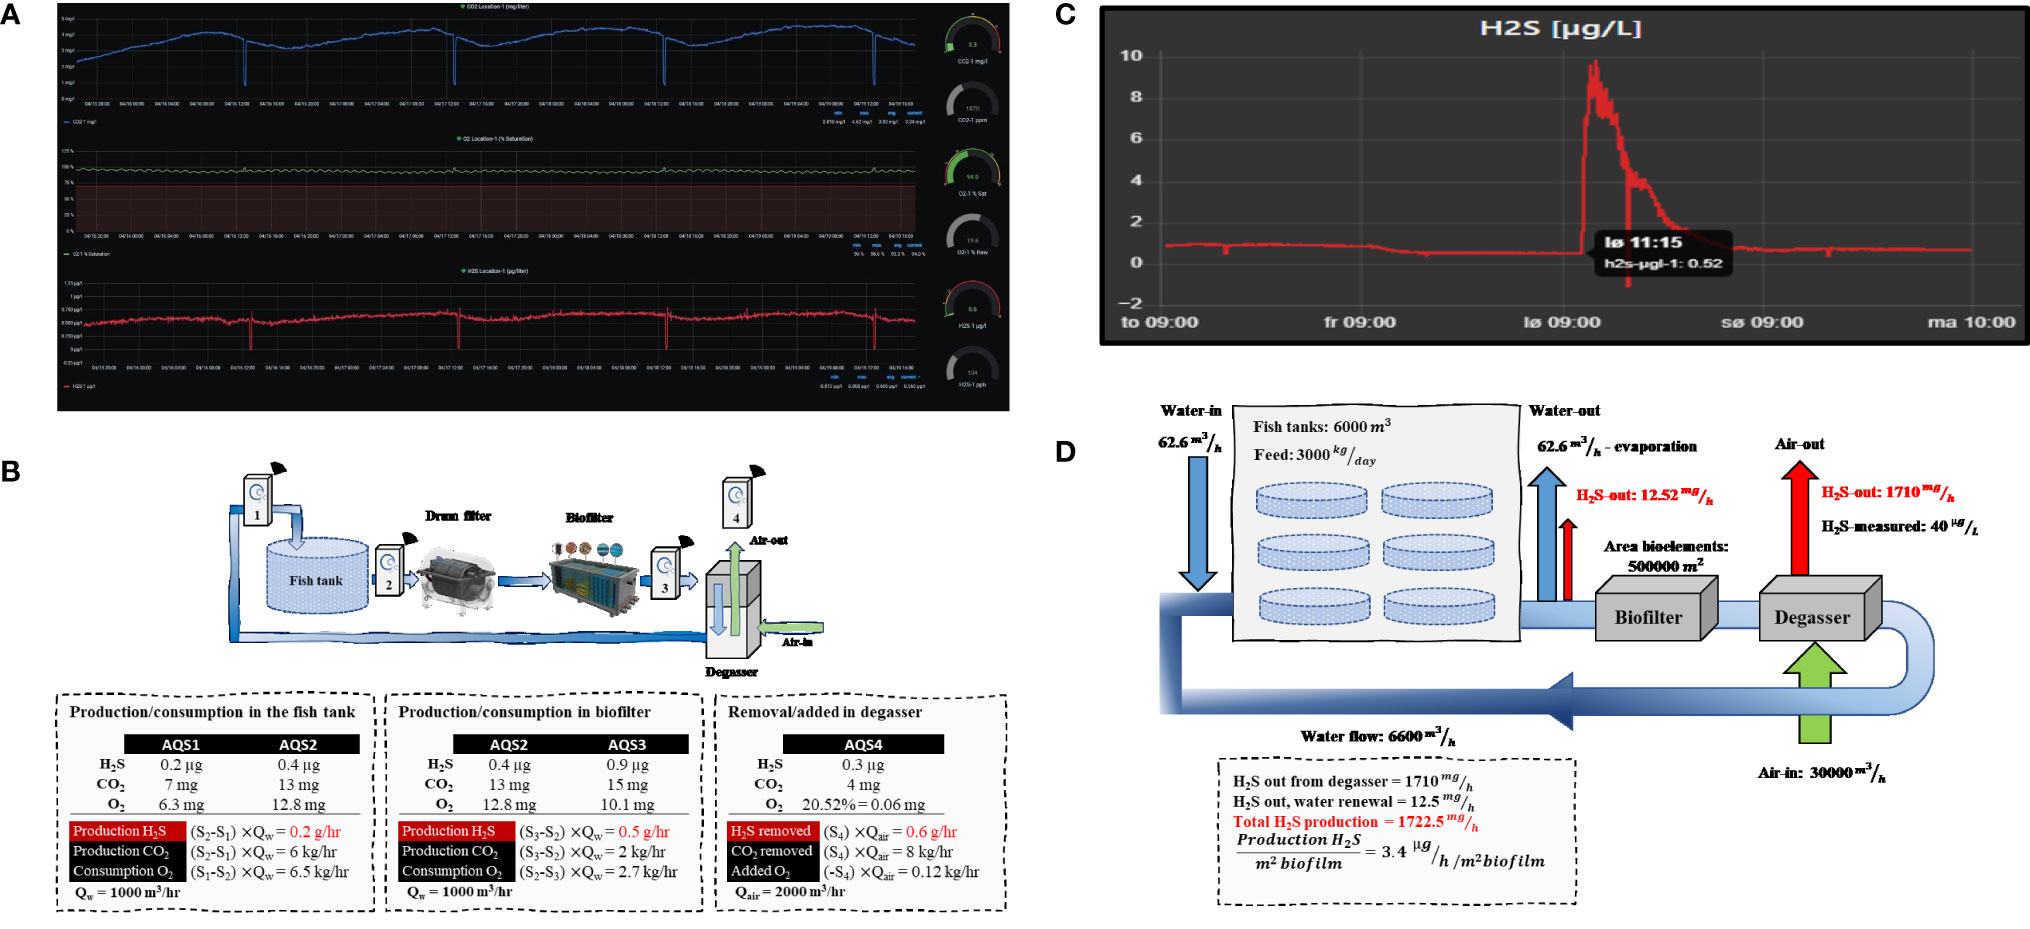
Figure 3 (A) An example of AQS dashboard representing time-series for H2S (µg/L), CO2 (mg/L), O2 (% saturation), pH, temperature (˚C), and salinity (‰).The rapid spikes represent the calibration verification when the sensor was exposed to the calibrated source. (B) The overall calculation of mass balance changes in RAS. (C) The captured H2S sudden spike in the morning in the system, which was gradually removed through degassing process. (D) The calculation of H2S formation rate based on the area of biofilm per unit of time.
Individual alarm levels can be set on each of the sensors (low and high). Color codes can be defined in the display with green, yellow, and red to help decision makers (e.g., technicians) for more efficient response taking. Trends can be displayed to present increasing or decreasing tendency of the measured parameters. Together all of these options are designed to facilitate controlling dynamic factors in the complex environment of RAS. The AQS units let industry learn from its failures, study critical factors in more efficient running of RAS and more important gain knowledge about each RAS. Ultimately, this may help industry gain more accurate insight of incidents so that early warnings can be triggered to predict possible H2S-spike releases in the system.
3 Results
3.1 Real-Time Monitoring of Water Quality Parameters in RAS
The AquaSense system (AQS) consists of four units installed in four locations in the RAS: 1) AQS1 (inlet before water gets to the fish tank), 2) AQS2 (outlet water after the fish tank and before the drum filter), 3) AQS3 (after moving bed biofilter reactor), and 4) AQS4 (air out of degasser). Sensors in AQSs measure H2S (µg/L), O2 (% saturation), and CO2 (mg/L) over time with continuous track of pH, salinity (‰), alkalinity (mg/L), turbidity (NTU) and temperature (T) (°C). The result shows a continuous dynamic change in water quality parameters (H2S, O2 and CO2 concentrations) throughout RAS-process.
3.1.1 Measuring and Monitoring of H2S at Sub µg/L Levels in RAS
Through the setup of AQSs in RAS we were able to measure H2S at sub µg/L levels. Figure 3A shows the dashboard for measured and monitored data (H2S, CO2, and O2) in the RAS where we were able to successfully measure low concentration of formed H2S in the system. Time series of CO2, O2 and H2S are shown for 4 days. As can be seen, H2S is continuously formed in low concentration, and the gas was successfully measured at the level of 0.5 µg/L. There is a diurnal pattern for CO2. Similar cyclic variation can also be seen for H2S.
3.2 Mass Balance in AQSs
By installing the AQSs in potential critical hotspots in the water treatment loop in RAS, we were able to obtain mass balance of key parameters of the system. Figure 3B shows an example of mass balance calculation in RAS. Mass balance were calculated to demonstrate three hotspots in RAS: i) production or consumption in the fish tank, ii) production and consumption in biofilter, and iii) removal or addition in degasser. More details of the calculations can be found in Figure 3B. The values represent typical values found in post-smolt RAS with salinity around 13 ppt (‰).
As can be seen in Figure 3B, the degassing capacity is of outmost importance to control the sudden increasing H2S levels in RAS. In a steady-state situation, the production of H2S equalizes the removal one.
As discussed earlier in introduction, the main production of constant H2S forms in the anaerobic part of the biofilm due to the large amount of surface area provided by the bio-elements. This diffusion rate of H2S through the biofilm is the root cause of the steady-state H2S concentration level in the RAS and it is mainly controlled by the degassing capacity of the system. The exchange of water provides only a minor contribution – this will be discussed in the next section.
3.3 The Impact of Degassing in Controlling H2S Spike
H2S can be released in a matter of seconds and causes a spike in the system – it is known as bomb effect. Such incidents are associated with high risks in fish farming industry today. Figure 3C shows such H2S incident, where a stable H2S concentration level under 1 µg/L suddenly jumped to 10 µg/L, and then gradually was aerated out of the system after 15 hours, and eventually the water was back to normal steady-state condition. This incident was captured by the AQS and highlights the responsiveness of the system in occurrence of H2S spikes. As can be seen in Figure 3C, the spike was controlled by smooth removal of the gas through the degassing process. It can be seen from the registered data that there is continuous H2S formation throughout RAS-processes, ergo, the only way to cope with it, it is either through degassing or at minor extent by the water exchange.
This sudden release of H2S-spike may have been caused by mechanical breakage of the relatively small volume (some liters) of the anaerobic dead materials saturated at 100% H2S. Although conclusive remarks regarding the formation mechanism of H2S cannot be made, immediate actions can be performed in time once warning are triggered in occurrence of such spikes. This can help the industry to control and then reduce the impact of H2S-spike by means of degassing. Therefore, It is critical to have emergency procedures in action as every minute matters. AQS would then be a useful tool to let industry gain enough knowledge on H2S-spikes so that such incidents can be predicted, and hence immediate mitigation measures can be taken in advance.
3.4 H2S Formation Rate
It has been shown that there is a constant production rate of H2S in RAS. This may vary depending on many factors that the industry today may have not full overview of. Figure 3D highlights the caluclation of H2S formation rate based on given amount of formed H2S per area of biofim per unit of time. This ratio (criteria) is a specific parameter for each RAS and it is important to be followed in each RAS over time. It can also be an important criteria to consider in process of desiging a RAS. As can be seen in Figure 3D, the main contribution to control H2S in RAS is through degassing and just to a minor extent through water exchange. This means reducing degassing capacity when CO2 levels are low may not be a valuable idea as poses a risk of H2S-accumulation in the system unless there is full controll on the H2S levels to avoid such incidents.
4 Discussion and Conclusion
The formation of toxic H2S known as the silent killer, is of major concern in aquatic environments, especially within RAS, as it appears fast, leaves its impact fast and is the cause for the growing trend of reported H2S-induced fish mortalities. Despite its high toxicity, authorities have not yet set a regulation to address the toxicity level of the gas in aquaculture – freshwater and marine species are recommended to not being exposed to more than 2 µg/L and 5 µg/L respectively in literature. Although H2S-induced fish mortalities is a well-known issue, there is still scarce information regarding its formation mechanism, the potential forming spots, its toxicity threshold, and the relationship to other water quality parameters with regards to the kinetic of its formation mechanism. To answer all of these, collecting data from potential hotspots through a real-time monitoring system, studying those data in occurrence of H2S spikes, and ultimately analysis the accidents and the variation in production rates over time, should be regarded in the context of bridging this industry gap. To this end, we developed a sensor that can detect the gas in sub (µg/L) with high precision given the fact that the gas toxicity threshold proposed to be as low as 2 µg/L. This helps the researchers, experts, and fish farmers to have more concrete understanding of the gas formation mechanism to consider possible mitigation strategies for further preventing such incidents. Furthermore, since AQS can measure very low concentration of the formed H2S in the system, it can be a useful tool to let authorities find out and later set toxicity threshold for both freshwater and marine species in RAS with regards to H2S. Typical SeaRAS AquaSense system (AQS) consists of four units that were installed, in this work, in four potential hotspots in RAS: before and after fish tank, after biofilter, and in the exhaust of the degasser. Each unit measured H2S (µg/L), O2 (% saturation), and CO2 (mg/L) in real-time with continuous track of pH, salinity (‰), alkalinity (mg/L), turbidity (NTU) and temperature (T) (°C). The autonomous wireless-based sensors used in AQS units collects and stores data in time-resolution of one second in the water treatment loop (covering range for measuring H2S concentration in AQS are 0-80 µg/L and 2-430 µg/L – these are valid under following condition: T = 15°C, S = 20 ‰, pH = 7, pressure = 1 atm). AQS should not be performed near to downstream of ozone (O3). AQS provides valuable information, on how H2S is produced and controlled and how such spikes disperse in the loop. This real-time measuring and monitoring of water quality parameters let us calculate the mass-balance change throughout RAS, providing a new insight on production and removal ratio of different parameters in the process including H2S. The first finding of this work highlights that the formation of H2S in RAS is inevitable as there is continuous production of the gas in the anaerobic part of the biofilm where a large surface is provided by bio-elements. H2S is something that exist in all systems, and hence the industry must learn instead how to cope with it. One may argue that the formed H2S, although low, may be still enough to lead to H2S-poisinng once accumulated in the system. The calculation of mass balance changes based on measured data in sensors in AQS units showed a significant removal of H2S gas through degassing. Degassing was demonstrated in this work as a powerful tool to control the continuous H2S formation in RAS process. The results also showed the importance of the ratio of the formed H2S per area of biofilm in the course of time. Although conclusive remarks regarding the variation of H2S per area of biofilm cannot be made, this work suggests that a thorough investigation may yields answers in future research. More research is also needed to investigate acceptable limits to control H2S-poisoning in the context of water quality in RAS and to provide insight on the interaction between H2S and other water quality parameters such as CO2.
Data Availability Statement
The datasets presented in this article are not readily available because the authors do not have permission to share data. Requests to access the datasets should be directed to www.searas.no.
Author Contributions
This research is the result of the work of all authors. The main credit goes to SeaRAS AS as the main founder and funder of the research.
Funding
This research was funded by SeaRAS AS.
Conflict of Interest
Authors in this article were employed by SeaRAS. The funder had the following involvement with the study: design, collection, analysis, interpretation of data, the writing of this article or the decision to submit it for publication.
Publisher’s Note
All claims expressed in this article are solely those of the authors and do not necessarily represent those of their affiliated organizations, or those of the publisher, the editors and the reviewers. Any product that may be evaluated in this article, or claim that may be made by its manufacturer, is not guaranteed or endorsed by the publisher.
Acknowledgments
Special thanks to all SeaRAS team for all the efforts they have put to develop such system.
References
Åtland Å., Stenberg S. K. (2019). “Water Quality,” in The Health Situation in Norwegian Aquaculture 2018. Eds. Hjeltnes B., Bang-Jensen B., Bornø G., Haukaas A., Walde C. S. (Norway: Norwegian Veterinary Institute 2019), 96–99.
Barton L. L., Fardeau M. L., Fauque G. D. (2014). Hydrogen Sulfide: A Toxic Gas Produced by Dissimilatory Sulfate and Sulfur Reduction and Consumed by Microbial Oxidation. Mets. lon. Life Sci. 14, 237–277. doi: 10.1007/978-94-017-9269-1_10
Boyd C. E. (2014). Hydrogen Sulfide, Toxic But Manageable (Auburn, Alabama USA: Global Aquaculture Advocate), 34–36.
Cämmerer M., Mayer T., Penzel S., Rudolph M., Borsdorf H. (2020). Application of Low-Cost Electrochemical Sensors to Aqueous Systems to Allow Automated Determination of NH3 and H2S in Water. Sensors 20 (10), 2814. doi: 10.3390/s20102814
Dalsgaard J. (Ed.) (2019). “5th NordicRAS Workshop on Recirculating Aquaculture Systems,” in Book of Abstracts (Berlin, Germany: DTU Aqua, Danmarks Tekniske Universitet).
Duan Z., Sun R., Liu R., Zhu C. (2007). Accurate Thermodynamic Model for the Calculation of H2S Solubility in Pure Water and Brines. Energy Fuel. 21 (4), 2056–2065. doi: 10.1021/ef070040p
Hjeltnes B., Bang-Jensen B., Bornø G., Haukaas A., Walde C. (2019). The Health Situation in Norwegian Aquaculture 2018 (Ås, Norway: Norwegian Veterinary Institute), 132. (ISSN 1893-1480).
Holmer M, Hasler-Sheetal H (2014). Sulfide Intrusion in Seagrasses Assessed by Stable Sulfur Isotopes—A Synthesis of Current Results. Front. Mar. Sci. 1, 64. doi: 10.3389/fmars.2014.00064
Kiemer M. C., Black K. D., Lussot D., Bullock A. M., Ezzi I. (1995). The Effects of Chronic and Acute Exposure to Hydrogen Sulphide on Atlantic Salmon (Salmo Salar L.). Aquaculture 135 (4), 311–327. doi: 10.1016/0044-8486(95)01025-4
Letelier-Gordo C. O., Aalto S. L., Suurnäkki S., Pedersen P. B. (2020). Increased Sulfate Availability in Saline Water Promotes Hydrogen Sulfide Production in Fish Organic Waste. Aquacul. Eng. 89, 102062. doi: 10.1016/J.AQUAENG.2020.102062
Li Q., Lancaster J. R. Jr. (2013). Chemical Foundations of Hydrogen Sulfide Biology. Nitric. Oxide 35, 21–34. doi: 10.1016/J.NIOX.2013.07.001
Mougin P., Lamoureux-Var V., Bariteau A., Huc A. Y. (2007). Thermodynamic of Thermochemical Sulphate Reduction. J. Petrol. Sci. Eng. 58 (3-4), 413–427. doi: 10.1016/j.petrol.2007.01.005
Prema D. (2020). “Water Quality Management in Aquaculture,” in The Blue Bonanza: A Manual for on the Job Training Programme for VHSE Students on Advances in Fisheries & Aquaculture Techniques (Kochi: ICAR-Central Marine Fisheries Research Institute), pp 4–pp78. Available at: http://eprints.cmfri.org.in/14147/.
Rojas-Tirado P., Aalto S. L., Åtland Å., Letelier-Gordo C. (2021). Biofilters are Potential Hotspots for H2S Production in Brackish and Marine Water RAS. Aquaculture 536, 736490. doi: 10.1016/J.AQUACULTURE.2021.736490
Rosten T., Åtland Å, Kristensen T., Braaten B., Rosseland B. O., Winther U. (2004). Vannkvalitet Og Dyrevelferd I Oppdrett. Utredning for Mattilsynet (Trondheim, Norway: KPMG Senter for havbruk og fiskeri).
Rubright S. L. M., Pearce L. L., Peterson J. (2017). Environmental Toxicology of Hydrogen Sulfide. Nitric. Oxide.: Biol. Chem. 71, 1. doi: 10.1016/J.NIOX.2017.09.011
Sommerset I., Bang Jensen B., Bornø G., Haukaas A., Brun E. (2020). The Health Situation in Norwegian Aquaculture 2020 (Ås, Norway: Norwegian Veterinary Insitute).
Tanudjaja Y. (2021). Early Warning Signs and Dynamics of H2S Production In Recirculating Aquaculture System (Trondheim: Norwegian University of Science and Technology (NTNU).
Weiner E. R. (2008). Applications of Environmental Aquatic Chemistry: A Practical Guide. 2nd ed (Boca Raton: CRC Press).
Keywords: RAS, hydrogen sulfide (H2S), fish mortality, real-time measuring, sustainability, aquaculture, water quality
Citation: Lien E, Valsvik G, Nordstrand JV, Martinez V, Rogne V, Hafsås O, Queralt S, Fathi BS and Aga M (2022) The SeaRAS AquaSense™ System: Real-Time Monitoring of H2S at Sub µg/L Levels in Recirculating Aquaculture Systems (RAS). Front. Mar. Sci. 9:894414. doi: 10.3389/fmars.2022.894414
Received: 11 March 2022; Accepted: 08 April 2022;
Published: 06 May 2022.
Edited by:
Olav Vadstein, Norwegian University of Science and Technology, NorwayReviewed by:
Maria Elena Giordano, University of Salento, ItalyCarlo C. Lazado, Fisheries and Aquaculture Research (Nofima), Norway
Copyright © 2022 Lien, Valsvik, Nordstrand, Martinez, Rogne, Hafsås, Queralt, Fathi and Aga. This is an open-access article distributed under the terms of the Creative Commons Attribution License (CC BY). The use, distribution or reproduction in other forums is permitted, provided the original author(s) and the copyright owner(s) are credited and that the original publication in this journal is cited, in accordance with accepted academic practice. No use, distribution or reproduction is permitted which does not comply with these terms.
*Correspondence: Eldar Lien, ZWxkYXIubGllbkBzZWFyYXMubm8=