 Doug Klink
 Axel Peytavin1
 Laurent Lebreton
- 1The Ocean Cleanup Foundation, Rotterdam, Netherlands
- 2The Modelling House Limited, Raglan, New Zealand
Plastic has been detected in the ocean in most locations where scientists have looked for it. While ubiquitous in the environment, plastic pollution is heterogeneous, and plastics of varying composition, shape, and size accumulate differently in the global ocean. Many physical and biological processes influence the transport of plastics in the marine environment. Here we focus on physical processes and how they can naturally sort floating plastics at the ocean surface and within its interior. We introduce a new open-source GPU-accelerated numerical model, ADVECT, which simulates the three-dimensional dispersal of large arrays of modelled ocean plastics with varying size, shape, and density. We use this model to run a global simulation and find that buoyant particles are sorted in the ocean according to their size, both at the surface due to wind-driven drift and in the water column due to their rising velocity. Finally, we compare our findings with recent literature reporting the size distribution of plastics in the ocean and discuss which observations can and cannot be explained by the physical processes encoded in our model.
Introduction
Plastics are everywhere in the global ocean, with observations of accumulation near coastlines (Lavers & Bond, 2017; Olivelli et al., 2020), in offshore regions spanning from the surface (Law et al., 2010) to the deep sea (Egger et al., 2020b) and from equatorial (Garcia et al., 2020) to polar waters (Cózar et al., 2017; Suaria et al., 2020; Ross et al., 2021). Characteristics of plastics such as size, shape and polymer differ among observational reports and often depend on where and how sampling was conducted. For example, plastics with density larger than seawater naturally accumulate on the seabed while positively buoyant plastics can be transported by currents and winds to different regions around the world (van Sebille et al., 2020). The floating fraction is particularly problematic due to its negative impact on a wide array of marine species (Gall and Thompson, 2015), its role transporting invasive species across different regions (García-Gómez et al., 2021) and its constant degradation into smaller particles from UV induced weathering and fragmentation (Andrady, 2011).
Early attempts to quantify the total mass of plastic at the surface of the ocean coupled data collected from sea surface nets with dispersal and accumulation model outputs for floating marine debris (Cozar et al., 2014; Eriksen et al., 2014; van Sebille et al., 2015). One conclusion of these studies was that there was less small debris at the surface than expected based on the amount of large debris. These results suggested size selective removal processes for floating plastics at the surface of the ocean. Sampling bias related to mesh size contributes to this discrepancy (Lindeque et al., 2020), but is insufficient to explain the several orders of magnitude gap (Cozar et al., 2014). Differences in relative concentration of larger debris from coastal environments to offshore areas also suggest different fates for different sizes of floating plastics (Ryan, 2015; Morales-Caselles et al., 2021). The scarcity of small plastic particles found in trawl nets deployed in the Eastern North Pacific Ocean also varied between different locations of the subtropical gyre, with smaller particles (0.5 - 5 mm) appearing more abundant in the center of the accumulation zone (Egger et al., 2020a).
This abundance could be explained by several mechanisms. First, through biofouling, floating plastics can increase in density and eventually lose buoyancy (Fazey & Ryan, 2016); this process impacts small floating particles more rapidly due to their large surface area to volume ratio. However, the oligotrophic environment in subtropical gyres may prevent the growth of organisms responsible for biofouling and substantially increase sinking timescales (Lobelle et al., 2021), explaining the abundance of smaller floating particles in these regions. Second, the transport of floating plastics in the ocean likely varies with size, shape and density of debris. For example, these quantities impact the rising velocity of debris, which in turn alters transport due to turbulent mixing (Kukulka et al., 2012) or wind driven drift current (van der Mheen et al., 2020). Small particles should experience a smaller wind-driven drift current, and indeed, the gradient of concentration observed accross the North Pacific subtropical gyre was better represented in a dispersal model simulation when debris was advected with no wind drag (L. Lebreton et al., 2018). Thus, physical processes may also explain the variation in debris size reported by observations at sea.
Understanding the transport and long-term fate of plastics, and most particularly floating plastics, in the ocean is necessary for risk assessments and the design of efficient mitigation strategies. While field observations show that different plastics will know different fates in the ocean, attempts at quantifying the mass of plastics accumulated at the surface of the ocean generally consider plastics as a whole and fail to differentiate transport as a function of debris characteristics such as size, shape and density. In this study we investigate how size-dependent physical transport processes influence the distribution of positively buoyant plastics in the global ocean. We present a new GPU-accelerated numerical model, ADVECT, which computes three dimensional trajectories of plastic particles with individually varying size, shape, and density. These trajectories are derived from advection due to oceanic currents, surface wind-driven drift, wave induced vertical mixing, and vertical transport due to buoyancy. We conduct a simple experiment with randomly spawned particles with a wide range of sizes, shapes and densities and show how the modelled global ocean physically distributes and sorts particles based on their size at the surface, ocean interior and seabed over a duration of 20 years. We then discuss our findings and compare with recent field observations.
Methods
Simulations are performed using a newly developed software, ADVECT (open-source code at DOI: 10.5281/zenodo.6301282). ADVECT simulates Lagrangian advection of marine debris in the entire three-dimensional ocean domain. Debris is modeled as sphere-like particles with variable size, density, and shape. Transport is modeled as a combination of advection due to ocean currents, sinking/rising due to buoyancy, windage based on emerged surface area, near-surface vertical mixing due to wind, and random diffusion in three dimensions. Particles are constrained to the ocean, meaning they cannot be entrained into bathymetry or beached onto shorelines. To properly sample the new per-particle parameters, simulations must process a huge number of particles, which is computationally challenging. One way to increase computational capability is to use GPUs to compute particle trajectories in parallel (van Sebille et al., 2018), as GPU computing power has been significantly outpacing that of CPUs in the last decade (Sun et al., 2019). With these considerations in mind, we designed ADVECT to compute its simulations on GPUs via the OpenCL framework (Stone et al., 2010). Though others efforts have used GPUs to model Lagrangian trajectories in the ocean (Gelderloos et al., 2016), ADVECT is the first to do so in an offline manner (i.e., without being coupled to an ocean model). The other primary computational concern in offline Lagrangian particle tracking is the ever-increasing size of model inputs, particularly the three-dimensional ocean currents (van Sebille et al., 2018). To address this challenge, ADVECT dynamically divides its simulation into temporal chunks based on available memory, allowing support for arbitrarily large datasets. These characteristics differentiate ADVECT from other models and represent a new computational approach to offline particle tracking in the ocean.
Model Description
Particles are modeled as sphere-like objects with three key properties: size, shape, and density. Shape is parameterized using Corey Shape Factor (hereafter CSF), which ranges from 0 to 1, and is defined as:
Where a, b, and c are the short, medium, and long dimensions of the particle respectively (Dietrich, 1982). Decreasing the CSF below 1 can be envisioned as either flattening or elongating an initially spherical particle. Many definitions of size exist when speaking of irregularly shaped particles. Our model uses nominal radius, defined as the radius of a sphere with equivalent volume as the particle for consistency with our settling velocity equations (see equation 2).
Particles are advected through a time-evolving 3D velocity field of ocean currents according to a 3D adaptation of the second-order Taylor-expansion scheme used in (L. C.-M. Lebreton et al., 2012). The full equations can be found in Supplementary Material. This scheme eliminates erroneous radial drift from particle trajectories along circular streamlines (Black & Gay, 1990).
Each particle moves vertically according to a buoyancy-driven terminal sinking (or rising) velocity ws, calculated according to Dietrich (1982):
Where ρ is the density of the particle, ρs is the density of surrounding seawater, g is the acceleration due to gravity, ν is the kinematic viscosity of the surrounding seawater, and W* is a “dimensionless settling velocity.” W* depends on the particle’s radius, shape, and density, as well as the density and kinematic viscosity of surrounding seawater, and is calculated from further equations in Dietrich (1982) which we omit here for brevity. Dietrich’s method has been verified to accurately model ws for spherical and cylindrical plastic particles ranging in diameter from. 5-5 mm (Khatmullina & Isachenko, 2017) (Note: W* is undefined for CSF ≤.15, so ADVECT does not support particles with CSF ≤.15). We neglect any inertial effects, and assume the particle is always traveling at this terminal sinking (rising) velocity due to the relatively large model timesteps in practice, which are generally on the order of hours.
Particles at the ocean surface are further transported horizontally using wind velocity estimated at 10 cm above sea level. The transport is derived from the particle’s emerged surface area according to Richardson (1997) and van der Mheen et al. (2020). Wind velocity at 10 cm above sea level is estimated from 10-meter wind data by assuming a log-wind profile (Charnock, 1955).
Near-surface particles are mixed vertically by the action of wind-driven waves. Local significant wave height is estimated from 10-meter wind velocity according to Kukulka et al. (2012). Rather than being transported according to equation (2), buoyant near-surface particles are randomly displaced according to a concentration profile predicted by Kukulka et al. (2012, eq. 4). The shape of this profile is determined by both a particle’s rising velocity and wind speed. Further details on this algorithm can be found in Supplementary Material.
Transport due to sub-mesoscale eddies is parameterized through random eddy diffusion, represented as a Wiener process. In the ocean, sub-mesoscale eddy diffusivity varies temporally as well as with region and depth (Cole et al., 2015). This temporal and regional variation is not resolved by ocean models by definition, and observations are scarce. However, there are some observations and theories showing significant and systematic variation of diffusivity with depth, as well as a marked difference between vertical and horizontal diffusivities (Gargett, 1984; Groeskamp et al., 2020). As such, we decompose eddy diffusion into its horizontal and vertical components and define a vertical diffusivity profile for each. The horizontal diffusivity profile is based on sub-mesoscale eddy diffusivity observations, and is defined to decay with depth as follows:
Where z is measured in meters, Kh(z=0) = 50 m2s-1, a typical value from estimates over the Argentinian shelf (Capet et al., 2008), and the half-life depth ζ is set to 1000 m based on Groeskamp et al. (2020). The vertical diffusivity profile also decays with depth and is based on estimates of vertical eddy diffusivity from bottle casts in the North Pacific (Gargett, 1984). It is defined as follows:
Where ao = 1e-7 m2s-2, N0 = 5e-4 s-1, B = b = -1000 m, and z is positive-up.
Particles cannot leave the ocean, whose domain is defined to match that of the ocean current data. This means ADVECT does not include the processes of beaching or sedimentation. Instead, when particles are pushed against coastline or bathymetry, they flow along the boundary. This boundary handling scheme was chosen because beaching and seafloor entrainment processes are not well-understood (van Sebille et al., 2020).
Experimental Setup
The simulation was run for 20 years, from January 1, 1993 to December 31, 2012, with a timestep of one hour. Three million particles are released at uniformly random locations on the ocean surface, at uniformly random times during the first 10 years of the simulation. The simulation then carries on for an additional 10 years with no new releases. Particle properties were set randomly according to the following distributions:
Zonal and meridional ocean currents are sourced from the GLORYS12V1 ocean reanalysis (Lellouche et al., 2018) at 1/12 degree horizontal resolution, 50 depth levels, and daily temporal sampling. GLORYS12V1 is based on NEMO coupled with atmospheric forcing from ERA-interim/ERA5 and assimilates many observational datasets. We compute our own vertical ocean currents from the provided data by integrating the continuity equation via the adjoint method (Luettich Richard et al., 2002). Our seawater density data is gridded at ¼ degree horizontal resolution, 75 depth levels, and monthly temporal sampling. It is calculated using GSW-Python (Firing et al., 2021) from monthly-mean ocean salinity and temperature, which are sourced from the Global Ocean Ensemble Physics Reanalysis, a product of Copernicus Marine Environment Monitoring Service (CMEMS, doi:10.48670/moi-00024). 10-meter wind data are sourced from the ERA5 atmospheric reanalysis (Hersbach et al., 2020) at ¼ degree horizontal resolution and daily-mean temporal sampling. All forcing datasets span the same temporal range as the experiment.
Results
After 20 years of model simulation, we observe significant variations in the distribution of buoyant particles in our ocean model based on particle characteristics. The size of particles had the largest influence on particle transport and fate. At the near surface (Figure 1), small particles (diameter < 1 mm) appear to be highly concentrated in a few select areas, leaving the rest of the ocean to be dominated by larger particles (diameter > 1 mm). The Pacific and Atlantic subtropical gyres each have a gradient of size, with smaller particles accumulating toward the tropics and larger particles towards the poles. Smaller particles also dominate in the Eastern Indian Ocean, the West Greenland sea, and the majority of the Mediterranean. Large particles dominate in a small but highly concentrated coastal zone in the Eastern Mediterranean, creating a gradient in size across the basin; a similar and stronger gradient is present in the Red Sea. Since there is still a great diversity of size among the large particles (>1 mm), one might expect a pattern similar to Figure 1 to emerge when analyzing the distribution of particles within this size class. However, this is not the case. Instead, particles larger than 1 mm appear not to preferentially accumulate in specific regions based on their size, but instead are distributed somewhat uniformly across the ocean surface (Figure S8).
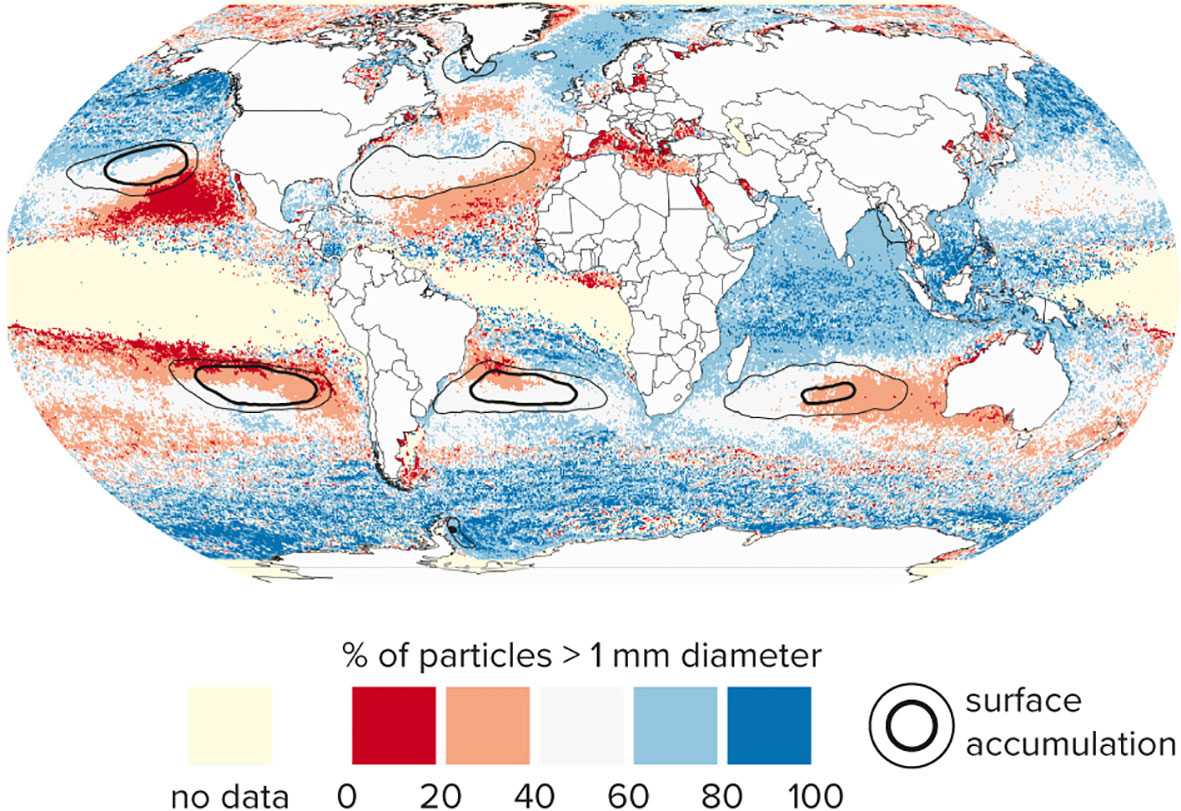
Figure 1 Size sorting of floating plastic particles in the top 10 meters of the global ocean. Distribution is an average over the 20th model year. Cells with < 5 samples are marked as “no data.” Contours show highest-concentration regions, containing 50% (thin line) and 25% (thick line) of the global particle total, respectively (c.f. Figure 2A). Diameter is defined as 2 * nominal radius.
With densities ranging between 800 kgm−3 and 1,000 kgm−3 (reflecting the variation among buoyant plastic polymers; Kooi & Koelmans, 2019), the vast majority of large particles (diameter > 1mm) remained at the surface (Figure 2). However, smaller particles with their smaller rising velocities were more easily entrained into deeper layers, resulting in larger particles dominating the surface distribution. Figures 2A–C show the spatial variation in sub-1mm particle concentration within three non-overlapping depth domains: respectively the “Ocean Surface” (the region above -10 m depth), the “Ocean Seafloor” (the region within 50 m of local bathymetry, not extending past -10 m depth in shallow regions), and the “Ocean Interior” (the region between the other two domains). As expected with buoyant particles, the surface is by far the domain with the highest overall concentration, and the spatial pattern in this domain follows the general pattern found by models and observations (Cozar et al., 2014; Eriksen et al., 2014; van Sebille et al., 2015), with high concentrations in subtropical gyres and near-zero concentration in the equatorial divergence zone. The ocean interior exhibits significantly lower concentration than the surface, with a much more uniform spatial pattern. There is some evidence of fallout below subtropical gyres, particularly in the South Pacific, but the most concentrated zones tend to be near coastlines, as well as the Western portions of the North and South Atlantic Oceans, and the Labrador Basin. The seafloor exhibits a similar spatial pattern to the interior, although particle concentrations are almost universally around two orders of magnitude greater.
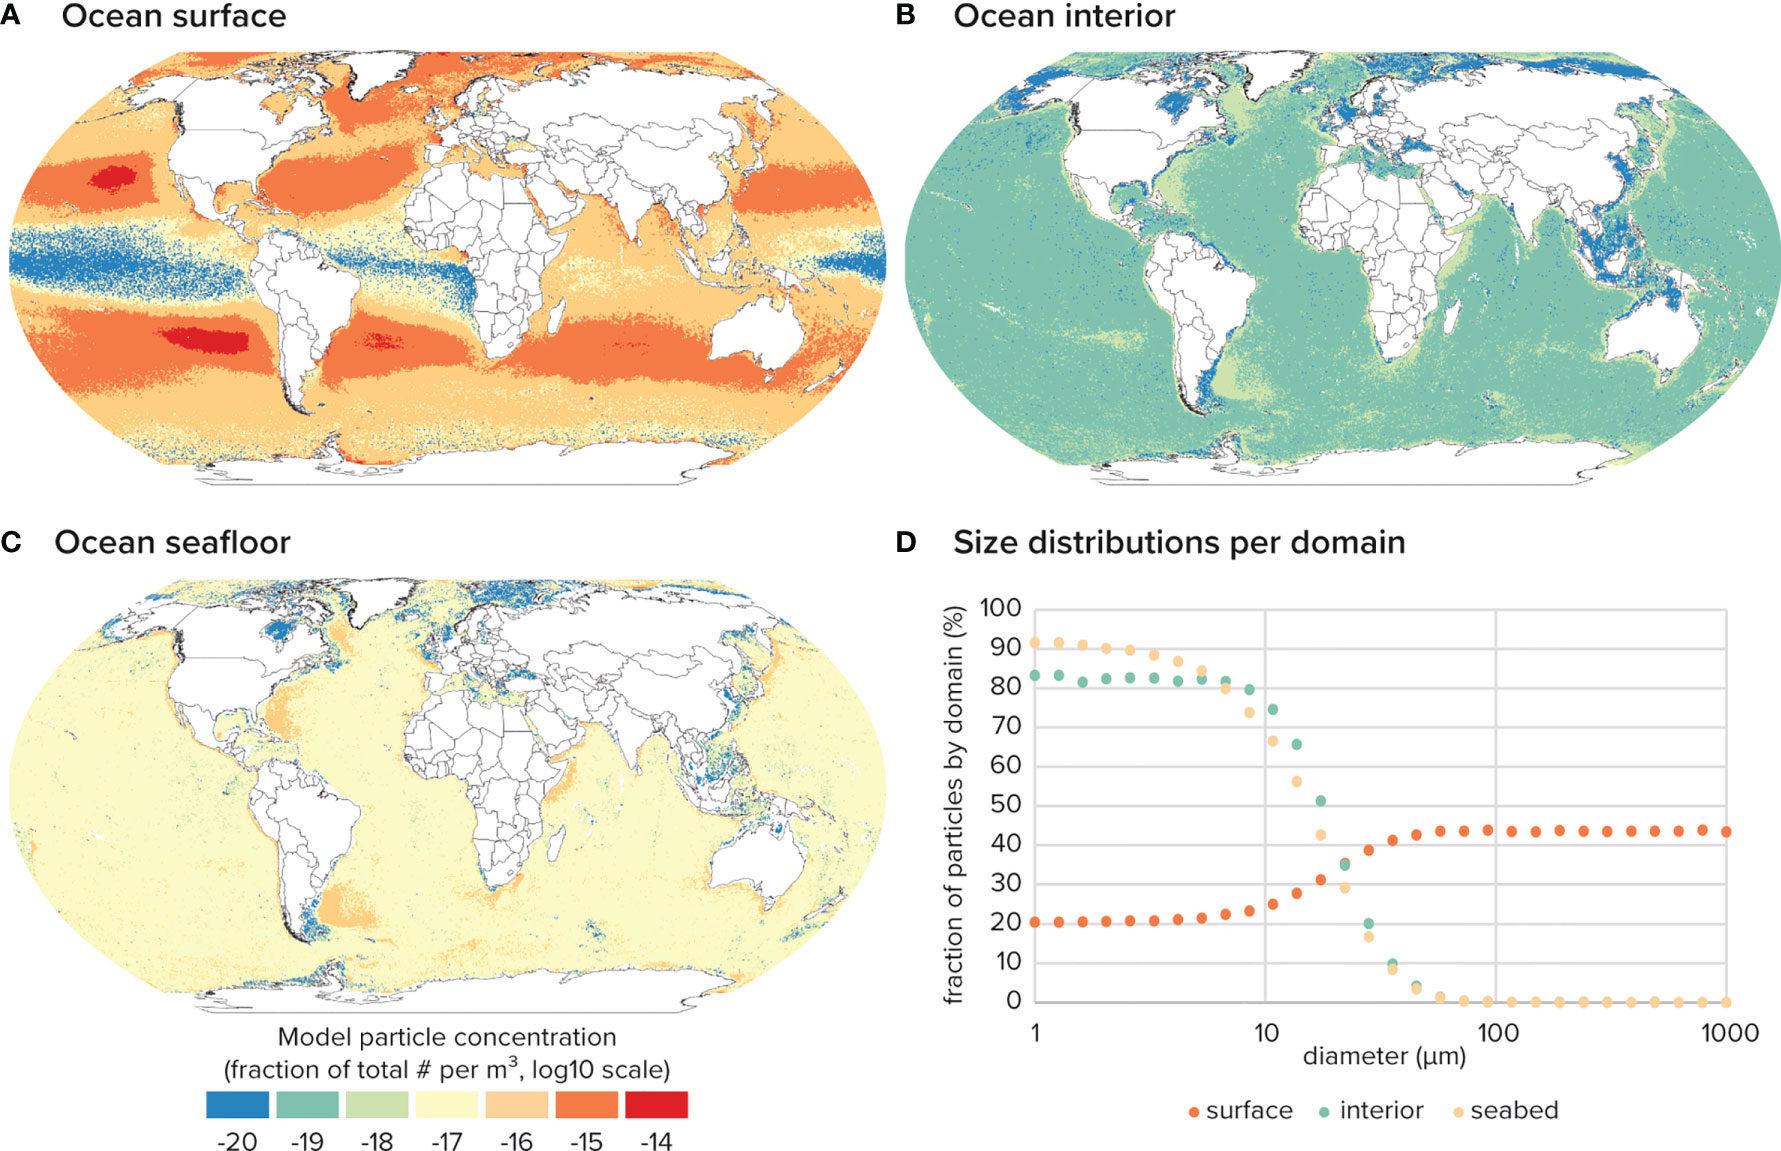
Figure 2 Modelled distribution of small plastic particles (diameter < 1 mm) across different depth domains, average of 20th model year. (A) Horizontal distribution at the “Ocean Surface.” (B) Horizontal distribution in the “Ocean Interior.” (C) Horizontal distribution at the “Ocean Seafloor.” (D) Comparison of size distribution between domains. Diameter is defined as 2*nominal radius.
Figure 2D shows the size distribution of particle size within each ocean domain. After 20 years, roughly half the particles below 100 micrometers are lost from the surface to the interior and seafloor. This figure also shows that essentially zero particles larger than 100 micrometers escape the surface. The interior distribution slightly favors larger particles compared to the distribution at the seafloor. Figure 2D demonstrates that particles smaller than 100 micrometers can be removed from the ocean surface by downwelling currents, wind-driven mixing, and eddy diffusion, whose mean downward transport velocity is small, but still larger than the rising velocity of such small particles.
Discussion
Analysis of Results
In this study, we present ADVECT, a new three-dimensional dispersal model for plastic in the global ocean. With this numerical model, we show how physical transport mechanisms alone can disperse particles of different characteristics to different oceanic regions. For example, the observed size distributions at the surface (Figure 1) can be mainly explained by surface wind patterns, due to the greater impact of wind on larger particles, both due to their increased surface area and stronger tendency to float at the surface as a result of their high rising velocity. Together, the yearly average wind pattern of the ERA5 wind data (Figure S3) and its temporal variability (Figure S4) can explain many features of the surface distribution of modelled particles presented in Figure 1. One such feature is the gradient of size across each subtropical gyre. The strong and consistent trade winds pass over the more equatorial region of each gyre, sweeping the larger objects away and leaving a region dominated by micro (<1 mm) debris. The Indian Ocean has a different pattern, with the eastern gyre retaining a high concentration of micro (<1 mm) debris, while macro (>1 mm) debris is dominating the rest of the basin. Figures S3, S4 show a consistent south-easterly wind over the eastern gyre, which again serves to selectively remove large debris. The modelled size gradient across the Mediterranean and Red seas is similarly explained by consistent winds from the west and northwest, respectively. Finally, modelled micro (<1 mm) debris also dominates the western Greenland sea. Not only are there consistent Northwest winds blowing off Greenland (Figure S3), but Figure S5 shows a consistent downwelling in this region. The combination of these factors can explain the aggregation of micro (<1 mm) debris in this region of our model, as particles of all sizes are attracted towards Eastern Greenland by the action of the downwelling, but the larger debris is pushed away by the prevailing wind.
The distributions found at depth (Figure 2) can be explained in large part by the mean upwelling/downwelling (Figure S5), as well as its variability (Figure S6). Firstly, it is important to note that only the very smallest particles escape the surface (Figure 2D); their small size results in a near-zero rising velocity, allowing them to be entrained by downwelling and diffusion. The relative uniformity of concentration in the ocean interior and seabed implies that the dominant transport mechanism is diffusion, since our modeled diffusion does not vary geographically. Further, the mean downwelling under the subtropical gyres (roughly 1e-7 m/s) is not sufficiently strong to transport modeled particles to the seabed. Velocities of that order could only transport neutrally buoyant particles 100s of meters over the timespan of this simulation (20 years). Yet, Figure 2 shows many regions of increased concentration in both the interior and at the seafloor, including the Western North Atlantic, Argentine Basin, Labrador Sea, coast of South Africa, and coast of Somalia. Figure S4 shows that in these regions, downwelling is highly variable, with standard deviations on order 1e-5 m/s. Transient downwellings of this magnitude are strong enough to transport particles to the seafloor within the timespan of our simulation.
Our model results also show a hundredfold higher concentration of particles at the seafloor than in the interior (Figure 2). This could be due to several factors. First, we observe that modeled particles accumulate at the seafloor whenever there is downwelling in the deepest layers of our ocean current data. Second, the movement of particles may be restricted by bathymetric obstacles, which may help trap the particles near the seabed. Though it is reasonable to expect both these processes may occur in the global ocean, it is important to recognize the limited resolution of our ocean current data at the seabed: roughly 10km horizontally at the equator, and 500m vertically in the deep ocean. This limited resolution combined with complex bathymetry can lead to a great deal of uncertainty in the modeled flows near the seafloor.
In terms of model convergence, we found the horizontal distribution of particles at all depth levels (Figure 2) stabilizes around year 15, five years after the final particles are released. The vertical distribution of particles through the water column also stabilizes around year 15 (Figure S8). This means the distributions we present in Figures 1, 2 are close to being converged. However, the number of particles below -4000 m in the final year of our simulation is notably still increasing. This tells us that under our modeled processes, it can take decades for surface debris to significantly accumulate in the deep ocean.
Comparison to Field Observations
Our predicted spatial variation in the size distribution of debris (Figure 1) is in good agreement with several observational studies, though it disagrees with some others. This is expected, since ADVECT does not model all physical processes which transport plastic debris in the ocean. The agreement or disagreement between our results and observations is useful in understanding what mechanisms are or are not able to explain a pattern of observations. First, Egger et al. (2020a) reported on a scarcity of sub-5 mm debris in the Gulf of Alaska that decreases towards the center of the subtropical gyre. Our results agree with these observational findings as the proportion of small objects in Figure 1 increases steadily from the Gulf of Alaska to the center of the subtropical gyre. While Egger and Nijhof suggested a micro-debris removal mechanism as the cause of this size scarcity, our model demonstrates that size-dependent windage may be sufficient to explain the observations. Next, (Morales-Caselles et al., 2021), found that small fragments were notably more frequent in oceanic accumulation zones, in contrast to large objects found in coastal waters, a pattern our results share (Figure 1). They suggest the size-dependent sorting they observed could be explained by larger objects with higher buoyancy being ejected from accumulation zones due to their larger windage; our results show that these processes can indeed produce the sorting they observed. Additionally, in the Hawaiian Archipelago, O’ahu and Hawai’i are known as hotspots for microplastic accumulation (Young & Elliott, 2016; Rey et al., 2021) while the Northwestern Hawaiian Islands are known as hotspots of larger debris, notably derelict fishing gear (Dameron et al., 2007). Our results share this pattern, with Figure 1 showing very small debris in the waters around the main Hawaiian Islands, but much larger debris to the northwest. Finally, Ryan (2015) observed the distribution of macro-debris (1 cm – 1 m) off the coast of South Africa, finding that the debris tended to be larger further from the coast. Our results suggest a modest increase in debris size along their cruise track (Figure 1), but in general do not agree well with their observations. Ryan attributed their observations to biofouling and argued that windage alone was insufficient to explain their results. Since we do not model biofouling, but windage alone, the fact that our respective results disagree lends support to his conclusions.
Several studies have sampled the vertical distribution of plastic in the ocean. Egger et al. (2020b) analyzed debris from a wide size range (.5 – 50 mm) taken at various depths in the North Pacific and found a three or four order of magnitude decrease in concentration from the surface to the ocean interior. Figure 2 shows a four or five order of magnitude decrease between the concentration of sub-1 mm particles at the surface and in the ocean interior in the North Pacific, which is roughly in accord with their result. Further, half of the samples they found below the surface were in their smallest measured size class (.5-1.5 mm) (Table S4 in Egger et al., 2020b). This higher prevalence of objects with smaller size agrees with our modeled results. Yet, our results suggest that few objects larger than 0.1 mm should be found below the surface, in disagreement with their observations. However, we note that the larger (5 – 50 mm) objects they found in deeper water were fibrous fragments from ropes and nets. These are not representative of the pseudo spherical particles we modeled, and fibers are expected to have the smallest rising velocities of all shapes (see section below discussing size definitions). We also acknowledge that larger debris could be sinking due to processes not modeled in ADVECT. Some possibilities could be strong downwelling due to sub-mesoscale eddies, unresolved by our forcing data (Lévy et al., 2018), or density-increasing mechanisms such as biofouling or chemical weathering (van Sebille et al., 2020).
Pabortsava and Lampitt (2020) also examined the vertical distribution of micro (<1 mm) debris along a transect through the South and North Atlantic. They reported a strong preference for smaller objects in the ocean interior, with the average size near 100 micrometers. This roughly agrees with our prediction (Figure 2D), suggesting that hydrodynamical processes alone could explain this result. However, Pabortsava and Lampitt also found that the concentration of micro (<1 mm) debris at 50-100 meter depth is similar to that at 10 meters, and still within an order of magnitude at 100-270 meters. Our results differ significantly, predicting a hundredfold decrease in concentration from 10 to 100 meters in the North and South Atlantic (see Figure S5). This suggests ADVECT over-estimates the impact of wind-driven mixing below 10 meters.
Discussion of Size Definitions
Our results show that size has a strong impact on the distribution of plastic objects at sea. Comparisons with observational studies, however, are confounded by the numerous and vague methodologies used to report the size of plastic particles collected at sea. Observational studies often report size by binning objects into “size classes” based on the catchments of differently sized meshes. While this is a natural and efficient way to describe size observationally, it is challenging to use this description to estimate an object’s three-dimensional form, which is necessary to accurately model its rising velocity. We find that the volume of an object has the strongest impact on its rising velocity, stronger than its shape or density. Unfortunately, given a measurement of an irregularly shaped object’s “size class,” estimates of volume vary dramatically depending on the object’s shape. For example, the volume of a 1 cm diameter sphere could be 50x larger than the volume of a 1 cm-long filament or 20x larger than a 1 cm-wide flake. Yet, all these objects might be caught by a 1 cm trawl, and thus recorded in the same size class. In order to test our model against observational data, it is imperative for studies to record enough information on objects to recover their volume. For example, (Pabortsava & Lampitt, 2020) recorded images of all their samples, and were later able to recover their volume by coupling the 2D areas in the images with assumptions of simple three-dimensional morphologies. Such a method is not too labor-intensive, and can result in good volume estimates.
Limitations of Model
ADVECT does not model particle removal at boundaries, both at coastlines and the seabed, yet real marine plastic is often stranded on land or entrained in seafloor sediments (van Sebille et al., 2020). This behavior is omitted for the sake of simplicity, and because permanent beaching and sedimentation can be modeled in post-processing by simply truncating trajectories, e.g. (Kaandorp et al., 2020). We do not perform any such analyses here in order to limit the scope of the study. We believe coastal processes are a key component in the lifecycle of ocean plastics and emphasize that the results of this study must be interpreted with their absence in mind. Additionally, ADVECT does not attempt to incorporate every transport mechanism for ocean plastics. We focused on the few mechanisms which we believe to be most relevant for the three-dimensional transport of plastic in the ocean; for this reason, we notably left out transport by marine Stokes Drift, both because it can be approximated by artificially increasing windage (which our model supports), and because its effect is relatively small compared to transport due to currents and wind (van Sebille et al., 2020). We also focused on mechanisms which are well-developed and empirically validated; for this reason, we omitted biofouling, and interactions with biota more generally.
We would like to specifically discuss our decision to omit biofouling from ADVECT. Bioufouling has been an active area of research recently (Fazey & Ryan, 2016; Kaiser et al., 2017; Kooi et al., 2017; Lobelle et al., 2021), and it most likely plays an important role in removing floating plastic objects from the sea surface. However, we find the current models to be insufficiently developed to include at this time. In particular, the behavior of fouled objects below the euphotic zone is uncertain; while several studies roughly agree in the rate at which pristine objects accumulate biology and subsequently sink (Fazey & Ryan, 2016; Kaiser et al., 2017; Amaral-Zettler et al., 2021), few studies have investigated what happens to objects after they are removed from the surface. In fact, we are only aware of a single study on this topic (Ye & Andrady, 1991). Different assumptions about the rate of subsurface defouling lead to drastically different three dimensional trajectories for modeled particles, and due to a lack of observations, current biofouling models cannot resolve this process well. For example, the model introduced in (Kooi et al., 2017) has been incorporated into a global circulation model (Lobelle et al., 2021), yet its defouling dynamics are mainly driven by a constant 39% decrease in algal mass per day, regardless of environmental conditions. For these reasons, we feel the fouling and defouling of ocean plastics must be studied in a wider range of conditions before it can be included in our global model. Though we do not include bioufouling, our model can still determine what observations are explainable without it (e.g. size-selective sorting at surface, removal of sub-100 micron particles from surface), and what measurements are unexplainable without some such density-increasing process (e.g. presence of >.1mm particles of initially buoyant polymers in the ocean interior). These findings can help to focus future research.
Future Work and Recommendations
We intend to improve our model as research on the transport of ocean plastic continues. For example, an improved methodology for incorporating wind-driven mixing based on (Kukulka et al., 2012) into a Lagrangian particle tracking model such as ours is currently under review (Onink et al., 2021b); we plan to update our methodology to reflect theirs, as it has stronger physical motivation. Also, the work of (Ruiz et al., 2004) suggests wind-driven mixing could paradoxically serve to increase the concentration of micro (<1 mm) debris at the surface, since turbulent conditions can increase the rising velocity of these small particles. This effect could be a crucial element of mixing dynamics, and we intend to investigate its impact by introducing it into our model.
In addition to updating the existing dynamics, we intend to expand ADVECT in two important directions. First, while the importance of subsurface plastic is becoming clear, there remains a huge amount of debris, we suspect, at the sea-land boundary (L. Lebreton et al., 2019; Onink et al., 2021a). Further, the impact of this debris is potentially outsized, given the importance of coastal regions for both humans and ecosystems. Therefore, we would like to incorporate more coastal dynamics and model the effect of beaching in particular. Though recent research has made strong headway towards a preliminary understanding of the nearshore behavior of plastic debris (L. Lebreton et al., 2019; Olivelli et al., 2020; Morales-Caselles et al., 2021; Onink et al., 2021a; Ryan & Perold, 2021), these processes are still not well observed on a global scale. Coastal processes are complex, and more observation is essential to assess what mechanisms most strongly govern the nearshore behavior of plastic debris, and thus what mechanisms should be incorporated into global dispersal models such as ADVECT.
Second, as research progresses, we intend to include a biofouling framework. However, we must again emphasize the need for further observational studies which extend beyond the ocean surface and the importance of recording more detailed and diverse particle properties. Particularly, in order to inform future modeling, observational studies should record all properties which impact the rising velocity of objects: namely their volume, shape, and in-situ density, if possible. Comparing in-situ density to pristine density on plastic samples will also be helpful in identifying the role of biofouling or other density-altering mechanisms and will help determine not just where plastic objects are, but how and why they arrived there.
Data Availability Statement
The raw data supporting the conclusions of this article will be made available by the authors, without undue reservation.
Author Contributions
DK and LL designed the study and model. DK and AP wrote the source code. DK ran the model simulations and analyzed the results. DK and LL wrote the manuscript and prepared the figures. All authors reviewed the manuscript. All authors contributed to the article and approved the submitted version.
Funding
All funding for this research was provided by The Ocean Cleanup.
Conflict of Interest
DK, AP, and LL were employed by The Ocean Cleanup at the time of this research, a not-for-profit organization developing and scaling technology to rid the ocean of plastic. LL was employed by The Modelling House Limited.
Publisher’s Note
All claims expressed in this article are solely those of the authors and do not necessarily represent those of their affiliated organizations, or those of the publisher, the editors and the reviewers. Any product that may be evaluated in this article, or claim that may be made by its manufacturer, is not guaranteed or endorsed by the publisher.
Acknowledgments
The authors are thankful to all donors who support The Ocean Cleanup. We would also like to acknowledge Tim Jansen for his early contribution in formulating the three-dimensional advection equations as part of his master’s thesis: A Lagrangian 3D Dispersal Model for Plastic Debris in the Eastern North Pacific. Finally, we thank Dr. Matthias Egger for his input and review of an earlier version of the manuscript.
Supplementary Material
The Supplementary Material for this article can be found online at: https://www.frontiersin.org/articles/10.3389/fmars.2022.903134/full#supplementary-material
References
Amaral-Zettler L. A., Zettler E. R., Mincer T. J., Klaassen M. A., Gallager S. M. (2021). Biofouling Impacts on Polyethylene Density and Sinking in Coastal Waters: A Macro/Micro Tipping Point? Water Res. 201, 117289. doi: 10.1016/J.WATRES.2021.117289
Andrady A. L. (2011). Microplastics in the Marine Environment. Mar. pollut. Bull. 62 (8). 1596–1605, doi: 10.1016/j.marpolbul.2011.05.030
Black K. P., Gay S. L. (1990). “A Numerical Scheme for Determining Trajectories in Particle Models,” in Acanthaster and the Coral Reef: A Theoretical Perspective. Ed. Bradbury R. ( Springer:Berlin Heidelberg), 151–156. doi: 10.1007/978-3-642-46726-4_9
Capet X., Campos E. J., Paiva A. M. (2008). Submesoscale activity over the Argentinian shelf.Geophys. Res. Lett. 35, L15605. doi: 10.1029/2008GL034736
Charnock H. (1955). Wind Stress on a Water Surface. Q. J. R. Meteorological. Soc. 81 (350), 639–640. doi: 10.1002/qj.49708135027
Cole S. T., Wortham C., Kunze E., Owens W. B. (2015). Eddy Stirring and Horizontal Diffusivity From Argo Float Observations: Geographic and Depth Variability. Geophysical. Res. Lett. 42 (10), 3989–3997. doi: 10.1002/2015GL063827
Cozar A., Echevarria F., Gonzalez-Gordillo J. I., Irigoien X., Ubeda B., Hernandez-Leon S., et al. (2014). Plastic Debris in the Open Ocean. Proc. Natl. Acad. Sci. 111 (28), 10239–10244. doi: 10.1073/pnas.1314705111
Cózar A., Martí E., Duarte C. M., García-de-Lomas J., van Sebille E., Ballatore T. J., et al. (2017). The Arctic Ocean as a dead end for floating plastics in the North Atlantic branch of the Thermohaline Circulation.Sci. Adv. 3, e1600582. doi:10.1126/sciadv.1600582
Dameron O. J., Parke M., Albins M. A., Brainard R. (2007). Marine Debris Accumulation in the Northwestern Hawaiian Islands: An Examination of Rates and Processes. Mar. Pollut. Bull. 54 (4), 423–433. doi: 10.1016/j.marpolbul.2006.11.019
Dietrich W. E. (1982). Settling Velocity of Natural Particles. Water Resour. Res. 18 (6), 1615–1626. doi: 10.1029/WR018i006p01615
Egger M., Nijhof R., Quiros L., Leone G., Royer S.-J., McWhirter A. C., et al. (2020a). A Spatially Variable Scarcity of Floating Microplastics in the Eastern North Pacific Ocean. Environ. Res. Lett. 15 (11), 114056. doi: 10.1088/1748-9326/abbb4f
Egger M., Sulu-Gambari F., Lebreton L. (2020b). First Evidence of Plastic Fallout From the North Pacific Garbage Patch. Sci. Rep. 10 (1), 7495. doi: 10.1038/s41598-020-64465-8
Eriksen M., Lebreton L. C. M., Carson H. S., Thiel M., Moore C. J., Borerro J. C., et al. (2014). Plastic Pollution in the World’s Oceans: More Than 5 Trillion Plastic Pieces Weighing Over 250,000 Tons Afloat at Sea. PLoS One 9 (12), e111913. doi: 10.1371/journal.pone.0111913
Fazey F. M. C., Ryan P. G. (2016). Biofouling on Buoyant Marine Plastics: An Experimental Study Into the Effect of Size on Surface Longevity. Environ. Pollut. 210, 354–360. doi: 10.1016/j.envpol.2016.01.026
Firing E., Filipe, Barna A., Abernathey R. (2021). TEOS-10/GSW-Python: V3.4.1.Post0. Zenodo. doi: 10.5281/ZENODO.5214122
Gall S. C., Thompson R. C. (2015). The Impact of Debris on Marine Life.Marine Pollution Bulletin 92, 170–179. doi: 10.1016/j.marpolbul.2014.12.041
Garcia T. M., Campos C. C., Mota E. M. T., Santos N. M. O., Campelo R. P., de S., et al. (2020). Microplastics in Subsurface Waters of the Western Equatorial Atlantic (Brazil). Mar. Pollut. Bull. 150, 110705. doi: 10.1016/j.marpolbul.2019.110705
García-Gómez J. C., Garrigós M., Garrigós J. (2021). Plastic as a Vector of Dispersion for Marine Species With Invasive Potential. A Review. Front. Ecol. Evol. 9. doi: 10.3389/fevo.2021.629756
Gargett A. E. (1984). Vertical Eddy Diffusivity in the Ocean Interior. J. Mar. Res. 42 (2), 359–393. doi: 10.1357/002224084788502756
Gelderloos R., Szalay A. S., Haine T. W. N., Lemson G. (2016). “A Fast Algorithm for Neutrally-Buoyant Lagrangian Particles in Numerical Ocean Modeling,” in 2016 IEEE 12th International Conference on E-Science (e-Science). 381–388. doi: 10.1109/eScience.2016.7870923
Groeskamp S., LaCasce J. H., McDougall T. J., Rogé M. (2020). Full-Depth Global Estimates of Ocean Mesoscale Eddy Mixing From Observations and Theory. Geophysical. Res. Lett. 47 (18), e2020GL089425. doi: 10.1029/2020GL089425
Hersbach H., Bell B., Berrisford P., Hirahara S., Horányi A., Muñoz-Sabater J., et al. (2020). The ERA5 Global Reanalysis. Q. J. R. Meteorological. Soc. 146 (730), 1999–2049. doi: 10.1002/qj.3803
Kaandorp M. L. A., Dijkstra H. A., van Sebille E. (2020). Closing the Mediterranean Marine Floating Plastic Mass Budget: Inverse Modeling of Sources and Sinks. Environ. Sci. Technol. 54 (19), 11980–11989. doi: 10.1021/acs.est.0c01984
Kaiser D., Kowalski N., Waniek J. J. (2017). Effects of Biofouling on the Sinking Behavior of Microplastics. Environ. Res. Lett. 12 (12), 124003. doi: 10.1088/1748-9326/AA8E8B
Khatmullina L., Isachenko I. (2017). Settling Velocity of Microplastic Particles of Regular Shapes. Mar. Pollut. Bull. 114 (2), 871–880. doi: 10.1016/j.marpolbul.2016.11.024
Kooi M., Koelmans A. A. (2019). Simplifying Microplastic via Continuous Probability Distributions for Size, Shape, and Density. Environ. Sci. Technol. Lett. 6 (9), 551–557. doi: 10.1021/acs.estlett.9b00379
Kooi M., Nes E. H., Scheffer M., Koelmans A. A. (2017). Ups and Downs in the Ocean: Effects of Biofouling on Vertical Transport of Microplastics. Environ. Sci. Technol. 51 (14), 7963–7971. doi: 10.1021/acs.est.6b04702
Kukulka T., Proskurowski G., Morét-Ferguson S., Meyer D. W., Law K. L. (2012). The Effect of Wind Mixing on the Vertical Distribution of Buoyant Plastic Debris. Geophysical. Res. Lett. 39 (7), 7601. doi: 10.1029/2012GL051116. n/a-n/a.
Lavers J. L., Bond A. L. (2017). Exceptional and Rapid Accumulation of Anthropogenic Debris on One of the World’s Most Remote and Pristine Islands. Proc. Natl. Acad. Sci. 114 (23), 6052–6055. doi: 10.1073/pnas.1619818114
Law K. L., Morét-Ferguson S., Maximenko N. A., Proskurowski G., Peacock E. E., Hafner J., et al. (2010). Plastic Accumulation in the North Atlantic Subtropical Gyre. Science 329 (5996), 1185–1188. doi: 10.1126/science.1192321
Lebreton L., Egger M., Slat B. (2019). A Global Mass Budget for Positively Buoyant Macroplastic Debris in the Ocean. Sci. Rep. 9 (1), 12922. doi: 10.1038/s41598-019-49413-5
Lebreton L. C.-M., Greer S. D., Borrero J. C. (2012). Numerical Modelling of Floating Debris in the World’s Oceans. Mar. Pollut. Bull. 64 (3), 653–661. doi: 10.1016/j.marpolbul.2011.10.027
Lebreton L., Slat B., Ferrari F., Sainte-Rose B., Aitken J., Marthouse R., et al. (2018). Evidence That the Great Pacific Garbage Patch is Rapidly Accumulating Plastic. Sci. Rep. 8 (1), 4666. doi: 10.1038/s41598-018-22939-w
Lellouche J.-M., Le Galloudec O., Greiner E., Garric G., Regnier C., Drevillon M., et al (2018). The Copernicus Marine Environment Monitoring Service global ocean 1/12° physical reanalysis GLORYS12V1: description and quality assessment.19806. Available at: https://ui.adsabs.harvard.edu/abs/2018EGUGA..2019806L [Accessed July 3, 2022]
Lévy M., Franks P. J. S., Smith K. S. (2018). The Role of Submesoscale Currents in Structuring Marine Ecosystems. Nat. Commun. 9 (1), 4758. doi: 10.1038/s41467-018-07059-3
Lindeque P. K., Cole M., Coppock R. L., Lewis C. N., Miller R. Z., Watts A. J. R., et al. (2020). Are We Underestimating Microplastic Abundance in the Marine Environment? A Comparison of Microplastic Capture With Nets of Different Mesh-Size. Environ. pollut. 265, 114721. doi: 10.1016/j.envpol.2020.114721
Lobelle D., Kooi M., Koelmans A. A., Laufkötter C., Jongedijk C. E., Kehl C., et al. (2021). Global Modeled Sinking Characteristics of Biofouled Microplastic. J. Geophysical. Research.: Oceans. 126 (4), e2020JC017098. doi: 10.1029/2020JC017098
Luettich Richard J., Muccino J., Foreman M. (2002). Considerations in the Calculation of Vertical Velocity in Three-Dimensional Circulation Models. J. Atmospheric. Oceanic. Technol. - J. ATMOS. OCEAN. Technol. 19, 2063–2076. doi: 10.1175/1520-0426(2002)019<2063:CITCOV>2.0.CO;2
Morales-Caselles C., Viejo J., Martí E., González-Fernández D., Pragnell-Raasch H., González-Gordillo J. I., et al. (2021). An Inshore–Offshore Sorting System Revealed From Global Classification of Ocean Litter. Nat. Sustainability. 4 (6), 484–493. doi: 10.1038/s41893-021-00720-8
Olivelli A., Hardesty B. D., Wilcox C. (2020). Coastal Margins and Backshores Represent a Major Sink for Marine Debris: Insights From a Continental-Scale Analysis. Environ. Res. Lett. 15 (7). 484–493 doi: 10.1088/1748-9326/ab7836
Onink V., Jongedijk C. E., Hoffman M. J., van Sebille E., Laufkötter C. (2021a). Global Simulations of Marine Plastic Transport Show Plastic Trapping in Coastal Zones. Environ. Res. Lett. 16 (6). doi: 10.1088/1748-9326/abecbd
Onink V., van Sebille E., Laufkötter C. (2021b). Empirical Lagrangian Parametrization for Wind-Driven Mixing of Buoyant Particles at the Ocean Surface. Geoscientific. Model. Dev. Discussions 2021, 1–19. doi: 10.5194/gmd-2021-195
Pabortsava K., Lampitt R. S. (2020). High Concentrations of Plastic Hidden Beneath the Surface of the Atlantic Ocean. Nat. Commun. 11 (1), 4073. doi: 10.1038/s41467-020-17932-9
Rey S. F., Franklin J., Rey S. J. (2021). Microplastic Pollution on Island Beaches, Oahu, Hawai`I. PLoS One 16 (2), e0247224. doi: 10.1371/JOURNAL.PONE.0247224
Richardson P. L. (1997). Drifting in the Wind: Leeway Error in Shipdrift Data. Deep. Sea. Res. Part I.: Oceanographic. Res. Papers. 44 (11), 1877–1903. doi: 10.1016/S0967-0637(97)00059-9
Ross P. S., Chastain S., Vassilenko E., Etemadifar A., Zimmermann S., Quesnel S.-A., et al. (2021). Pervasive Distribution of Polyester Fibres in the Arctic Ocean Is Driven by Atlantic Inputs. Nat. Commun. 12 (1), 106. doi: 10.1038/s41467-020-20347-1
Ruiz J., Macías D., Peters F. (2004). Turbulence Increases the Average Settling Velocity of Phytoplankton Cells. Proc. Natl. Acad. Sci. 101 (51), 17720–17724. doi: 10.1073/pnas.0401539101
Ryan P. G. (2015). Does Size and Buoyancy Affect the Long-Distance Transport of Floating Debris? Environ. Res. Lett. 10 (8), 84019. doi: 10.1088/1748-9326/10/8/084019
Ryan P. G., Perold V. (2021). Limited Dispersal of Riverine Litter Onto Nearby Beaches During Rainfall Events. Estuarine. Coast. Shelf. Sci. 251, 117729. doi: 10.1016/j.ecss.2021.107186
Stone J. E., Gohara D., Shi G. (2010). OpenCL: A Parallel Programming Standard for Heterogeneous Computing Systems. Computing. Sci. Eng. 12 (3), 66–73. doi: 10.1109/MCSE.2010.69
Suaria G., Perold V., Lee J. R., Lebouard F., Aliani S., Ryan P. G. (2020). Floating Macro- and Microplastics Around the Southern Ocean: Results From the Antarctic Circumnavigation Expedition. Environ. Int. 136, 105494. doi: 10.1016/j.envint.2020.105494
Sun Y., Agostini N. B., Dong S., Kaeli D. (2019). Summarizing CPU and GPU Design Trends With Product Data. arXiv.
van der Mheen M., Pattiaratchi C., Cosoli S., Wandres M. (2020). Depth-Dependent Correction for Wind-Driven Drift Current in Particle Tracking Applications. Front. Mar. Sci. 7. doi: 10.3389/fmars.2020.00305
van Sebille E., Aliani S., Law K. L., Maximenko N., Alsina J. M., Bagaev A., et al. (2020). The Physical Oceanography of the Transport of Floating Marine Debris. Environ. Res. Lett. 15 (2), 023003. doi: 10.1088/1748-9326/ab6d7d
van Sebille E., Griffies S. M., Abernathey R., Adams T. P., Berloff P., Biastoch A., et al. (2018). Lagrangian Ocean Analysis: Fundamentals and Practices. Ocean. Model. 121, 49–75. doi: 10.1016/j.ocemod.2017.11.008
van Sebille E., Wilcox C., Lebreton L., Maximenko N., Hardesty B. D., van Franeker J. A., et al. (2015). A Global Inventory of Small Floating Plastic Debris. Environ. Res. Lett. 10 (12), 124006. doi: 10.1088/1748-9326/10/12/124006
Ye S., Andrady A. L. (1991). Fouling of Floating Plastic Debris Under Biscayne Bay Exposure Conditions. Mar. Pollut. Bull. 22 (12), 608–613. doi: 10.1016/0025-326X(91)90249-R
Keywords: marine debris, variable size, whole ocean, computational model, Lagrangian trajectories, three-dimensional, parallel hardware, GPU
Citation: Klink D, Peytavin A and Lebreton L (2022) Size Dependent Transport of Floating Plastics Modeled in the Global Ocean. Front. Mar. Sci. 9:903134. doi: 10.3389/fmars.2022.903134
Received: 23 March 2022; Accepted: 07 June 2022;
Published: 20 July 2022.
Edited by:
José Antonio López-López, University of Cádiz, SpainCopyright © 2022 Klink, Peytavin and Lebreton. This is an open-access article distributed under the terms of the Creative Commons Attribution License (CC BY). The use, distribution or reproduction in other forums is permitted, provided the original author(s) and the copyright owner(s) are credited and that the original publication in this journal is cited, in accordance with accepted academic practice. No use, distribution or reproduction is permitted which does not comply with these terms.
*Correspondence: Doug Klink, ZC5rbGlua0B0aGVvY2VhbmNsZWFudXAuY29t