 Rebecca L. Jackson
 Matthew T. Woodhouse2
 Albert J. Gabric
 Roger A. Cropp
- 1School of Environment and Science, Griffith University, Gold Coast, QLD, Australia
- 2Climate Science Centre, Oceans and Atmosphere, Commonwealth Scientific and Industrial Research Organisation, Aspendale, VIC, Australia
Coral reefs are important regional sources of biogenic sulfur to the tropical marine atmosphere, through stress-induced emissions of dimethylsulfide (DMS). Recent estimates suggest that the Great Barrier Reef (GBR), Australia emits 0.02-0.05 Tg yr-1 of DMS (equivalent to 0.010-0.026 Tg yr-1 S), with potential implications for local aerosol-cloud processes. However, the impact of ocean warming on DMS emissions from coral reefs remains uncertain, complicating efforts to improve the representation of coral reefs in DMS climatologies and climate models. We investigate the influence of predicted changes in sea surface temperature (SST), photosynthetically active radiation (PAR) and wind speed on contemporary DMS emissions from the GBR using model output from the Coupled Model Intercomparison Project Phase 6 (CMIP6). A multiple linear regression is used to calculate seawater surface DMS (DMSw) concentration in the GBR in a contemporary (2001-2020) and end-of-century (2081-2100) scenario, as simulated by CMIP6 models under a SSP2-4.5 and SSP5-8.5 Shared Socioeconomic Pathway. By the end of this century, a 1.5-3.0°C rise in annual mean SST and a 1.1-1.7 mol m-2 d-1 increase in PAR could increase DMSw concentration in the GBR by 9.2-14.5%, leading to an increase in DMS flux of 9.5-14.3%. Previous model studies have suggested that the aerosol system has a low sensitivity to relatively large changes in coral reef-derived DMS. Therefore, the predicted change in contemporary DMS emissions is unlikely to influence the regional atmosphere. Further research is needed to understand the combined effects of temperature, light, pH, salinity and ecosystem structure on DMS production in coral reefs to better predict potential changes in emissions. Nevertheless, the findings provide insight into how predicted ocean warming may affect present-day DMS emissions and the source-strength of the GBR to the atmospheric sulfur budget.
1 Introduction
Coral reefs are strong regional sources of biogenic sulfur through stress-induced emissions of dimethylsulfide (DMS). The atmospheric oxidation products of DMS are important sulfate aerosol precursor compound which can influence non-sea salt sulfate (nss-SO4) aerosol properties (Gabric et al., 2013; Woodhouse et al., 2013; Fiddes et al., 2018; Sanchez et al., 2018; Jackson et al., 2020). It has been hypothesised that DMS emissions from coral reefs may facilitate aerosol nucleation and growth to cloud condensation nuclei (CCN), influencing the lifetime and albedo of low-level clouds (LLC) over coral reefs via aerosol direct and indirect effects on the radiation budget (Fischer & Jones, 2012; Jones, 2015; Jones et al., 2017). The potential for DMS-derived sulfates to influence aerosol-cloud processes over coral reefs is dependent on the rate of DMS emission, oxidation and subsequent atmospheric processing (such as nucleation, condensation or coagulation) (Andreae & Crutzen, 1997). However, the impact of ocean warming on the source-strength of coral reefs to the atmospheric sulfur budget remains uncertain.
The precursor of DMS, dimethylsulfoniopropionate (DMSP), is produced by a number of organisms including marine algae (Sunda et al., 2002), corals and endosymbiotic dinoflagellates (Raina et al., 2013). Catabolism of DMSP by endosymbiotic and free-living microbes occurs via the demethylation and cleavage pathways, with the latter producing DMS (Bullock et al., 2017).
When dissolved DMS is present in excess, seawater surface DMS (DMSw) is ventilated to the marine boundary layer where it is rapidly oxidised to nss-SO4 aerosol precursor compounds including sulfur dioxide (SO2), methanesulfonic acid, hydroperoxymethyl thioformate and sulfuric acid (H2SO4) (Andreae & Crutzen, 1997; Berndt et al., 2019; Hodshire et al., 2019; Veres et al., 2020). These nss-SO4 aerosol precursors may condense onto existing particles or nucleate to form new secondary marine aerosols (Andreae & Crutzen, 1997). Both processes can influence the number concentration and growth of aerosols to CCN and cloud droplets (Korhonen et al., 2008; Woodhouse et al., 2013; Sanchez et al., 2018). When high concentrations of fine-mode aerosol grow rapidly to CCN, cloud droplet number increases, cloud droplet size decreases (assuming constant cloud liquid water content) and the albedo and lifetime of LLC is enhanced (Andreae & Rosenfeld, 2008; Dave et al., 2019).
Various field studies, remotely sensed observations and model simulations have identified a significant link between atmospheric DMS (DMSa), nss-SO4 aerosol formation and growth, CCN and cloud droplet radius over the remote ocean (Korhonen et al., 2008; Woodhouse et al., 2013; Fiddes et al., 2018; Gabric et al., 2018; Sanchez et al., 2018). A mesocosm experiment found that submicron secondary marine aerosols primarily consisted of biogenic nss-SO4 (> 50%) and organic species, and had a higher hygroscopicity and CCN potential than sea spray aerosols (Mayer et al., 2020). These findings suggest an important biogenic influence on cloud microphysical properties.
Globally, DMS emission estimates range from 17.6-34.4 Tg yr-1 S (Kettle & Andreae, 2000; Lana et al., 2011; Land et al., 2014). The total contribution of coral reefs to the atmospheric sulfur budget is not yet certain. However, it is estimated that the Great Barrier Reef (GBR), Australia, emits 0.02-0.05 Tg yr-1 of DMS (0.010-0.026 Tg yr-1 S) from approximately 347,000 km2 of coral reefs and lagoon waters (Jones et al., 2018; Jackson et al., 2021). Assuming that DMS production and sea-air flux is consistent across coral reefs, tropical coral reefs and lagoon waters (~600,000 km2) could emit 0.08 Tg yr-1 of DMS (0.041 Tg yr-1 S).
Estimates of DMS emissions from coral reefs are comparable to those from other highly productive regions. In polar waters, DMS production is closely related to phytoplankton productivity, particularly during seasonal sea ice melting which can induce ice algae blooms (Gabric et al., 2018; Gali et al., 2021). The Austral Polar biogeographic region (south of 59°S) is estimated to release 1.1 Tg yr-1 S (Webb et al., 2019), representing 3-6% of global emission estimates from ~3% of the ocean surface. Normalising the above estimates by area, the GBR and Antarctic waters release ~0.4 Tg yr-1 S per 1% of the ocean surface.
In corals, DMSP biosynthesis and cleavage to DMS is upregulated in response to oxidative stress caused by exposure to high sea surface temperature (SST), irradiance (Jones et al., 2007; Deschaseaux et al., 2014) and low salinity (Gardner et al., 2016). Oxidative stress is caused by the release of reactive oxygen compounds (ROS) by coral mitochondria and zooxanthellae photosystems (Weis, 2008; Lesser, 2011). The rate of photosynthesis in zooxanthellae increases linearly with photosynthetically active radiation (PAR) until Photosystem II (PS II) becomes saturated (Anderson et al., 1995; Gorbunov et al., 2001; Winters et al., 2003). Beyond this threshold, excess light energy is dissipated as heat via various photoprotective mechanisms (Melis, 1999; Gorbunov et al., 2001). However, when not all excess light energy is dissipated, photodamage can occur to PS II, inhibiting electron transport and damaging protein structure. High SST can exacerbate irradiance stress by lowering the PAR absorption capacity (Jones et al., 2000; Jones et al., 2002). Accumulating photodamage results in the release of ROS into coral tissues (Weis, 2008; Lesser, 2011) and if conditions persist, can result in corals expelling their zooxanthellae and becoming bleached (Downs et al., 2002; Yakovleva et al., 2009).
Irradiance stress can be exacerbated in corals when exposed to air at low tide (Buckee et al., 2020). During aerial exposure, corals produce a layer of mucous which has been reported to contain up to 54 μmol DMSP and 18 μmol DMS (Broadbent & Jones, 2004). Given the strong concentration gradient between coral mucous and the atmosphere, large plumes of DMS can be exchanged directly from the coral surface to the atmosphere (Andreae et al., 1983; Jones et al., 2007; Hopkins et al., 2016; Swan et al., 2017). This mechanism of direct coral-air DMS flux distinguishes coral reefs from open ocean regions, where DMS flux is solely driven by diffusive mixing across the sea-air interface (Yang et al., 2011).
DMSa concentrations above aerially exposed coral reefs can exceed 500 ppt (~23 nmol m-3) (Jones et al., 2007), and on one occasion reached 1122 ppt (45.9 nmol m-3). The latter was measured over Heron Island in the southern GBR in the winter of 2013, when the coral was apparently osmotically and thermally shocked by rainfall while exposed to air at low tide (Swan et al., 2017). These plumes of DMSa can persist for around eight hours and are significantly more concentrated than the background DMSa signal, which seasonally averages ~25 ppt (1 nmol m-3) in winter to ~100 ppt (4 nmol m-3) in summer (Swan et al., 2017).
DMS(P) can alleviate oxidative stress in corals by scavenging ROS and forming dimethyl sulfoxide (DMSO) (Deschaseaux et al., 2014; Jones & King, 2015). When oxidative stress exceeds coral thermal stress thresholds, DMS(P) oxidation increases and a decline in ambient DMSw concentration occurs (Jones et al., 2007; Fischer & Jones, 2012; Deschaseaux et al., 2014). DMS(O) may also be formed via photoreactions at the sea surface (Gabric et al., 2008; Galí et al., 2013) and by algal and microbial metabolic processes (Spiese et al., 2009; Bourne et al., 2016), highlighting the complexity in the cycling of dimethylated sulfur compounds. The concentration of DMS in coral reef waters is therefore dependent on the rate of DMS(P)(O) biosynthesis, which is often related to coral oxidative stress.
Ocean warming poses one of the greatest threats to coral reefs (Ainsworth et al., 2016; Hughes et al., 2019). In addition to more frequent and severe coral bleaching events, warmer oceans may lead to a change in DMS production and emissions (Jackson et al., 2020). Given that DMS(P) production in the coral holobiont is upregulated in response to thermal stress (Raina et al., 2013), rising SST could increase coral DMS(P) biosynthesis. However, dissolved DMS concentrations have been found to decline when coral physiological stress thresholds are exceeded (Jones et al., 2007; Fischer and Jones, 2012), possibly due to a coral antioxidant response where DMS(P) scavenge reactive oxygen to form DMSO (Deschaseaux et al., 2014). Therefore, rising SST may increase stress-induced production of DMS(P), followed by oxidation to DMSO in temperature sensitive coral species, leading to a decline in ambient DMS concentrations and emissions. A decline in DMS emissions could be further exacerbated by increased coral bleaching and mortality. Conversely, if coral reefs are able to acclimate to rising ocean temperatures via natural or assisted means, such as the recruitment of temperature-tolerant zooxanthellae species (Berkelmans & Van Oppen, 2006; Bay et al., 2016), coral reef DMS emissions may not change significantly at all.
Here, we explore the impact of changes in SST, PAR and wind speed on DMSw and DMS emissions from the GBR by the end of this century. A linear regression (described in Jackson et al., 2021) is used to calculate DMSw, and the parameterisation of Liss and Slater (1974) is used to calculate DMS sea-air flux for a contemporary (2001-2020) and two end of century (2081-2100) scenarios, as simulated by Coupled Model Intercomparison Project Phase 6 (CMIP6) models under a SSP2-4.5 and SSP5-8.5 Shared Socioeconomic Pathway (SSP) (Moss et al., 2010; Gidden et al., 2019). The SSP2-4.5 scenario assumes a medium positive radiative forcing by 2100 (~4.5 W m-2) (Fricko et al., 2017), while the SSP5-8.5 scenario assumes a high positive radiative forcing by 2100 (~8.5 W m-2) (Kriegler et al., 2017). The influence of the predicted change in DMS emissions on the regional atmosphere is then discussed.
2 Methods
2.1 Calculation of seawater DMS concentration
The GBR spans 2,300 km of the north-eastern Australian coastline, with the Great Barrier Reef Marine Park (GBRMP) covering an area of approximately 347,000 km2. DMSw and DMS sea-air flux is calculated for the GBRMP region (10.5-25°S; 142-154°E) shown in Figure 1.
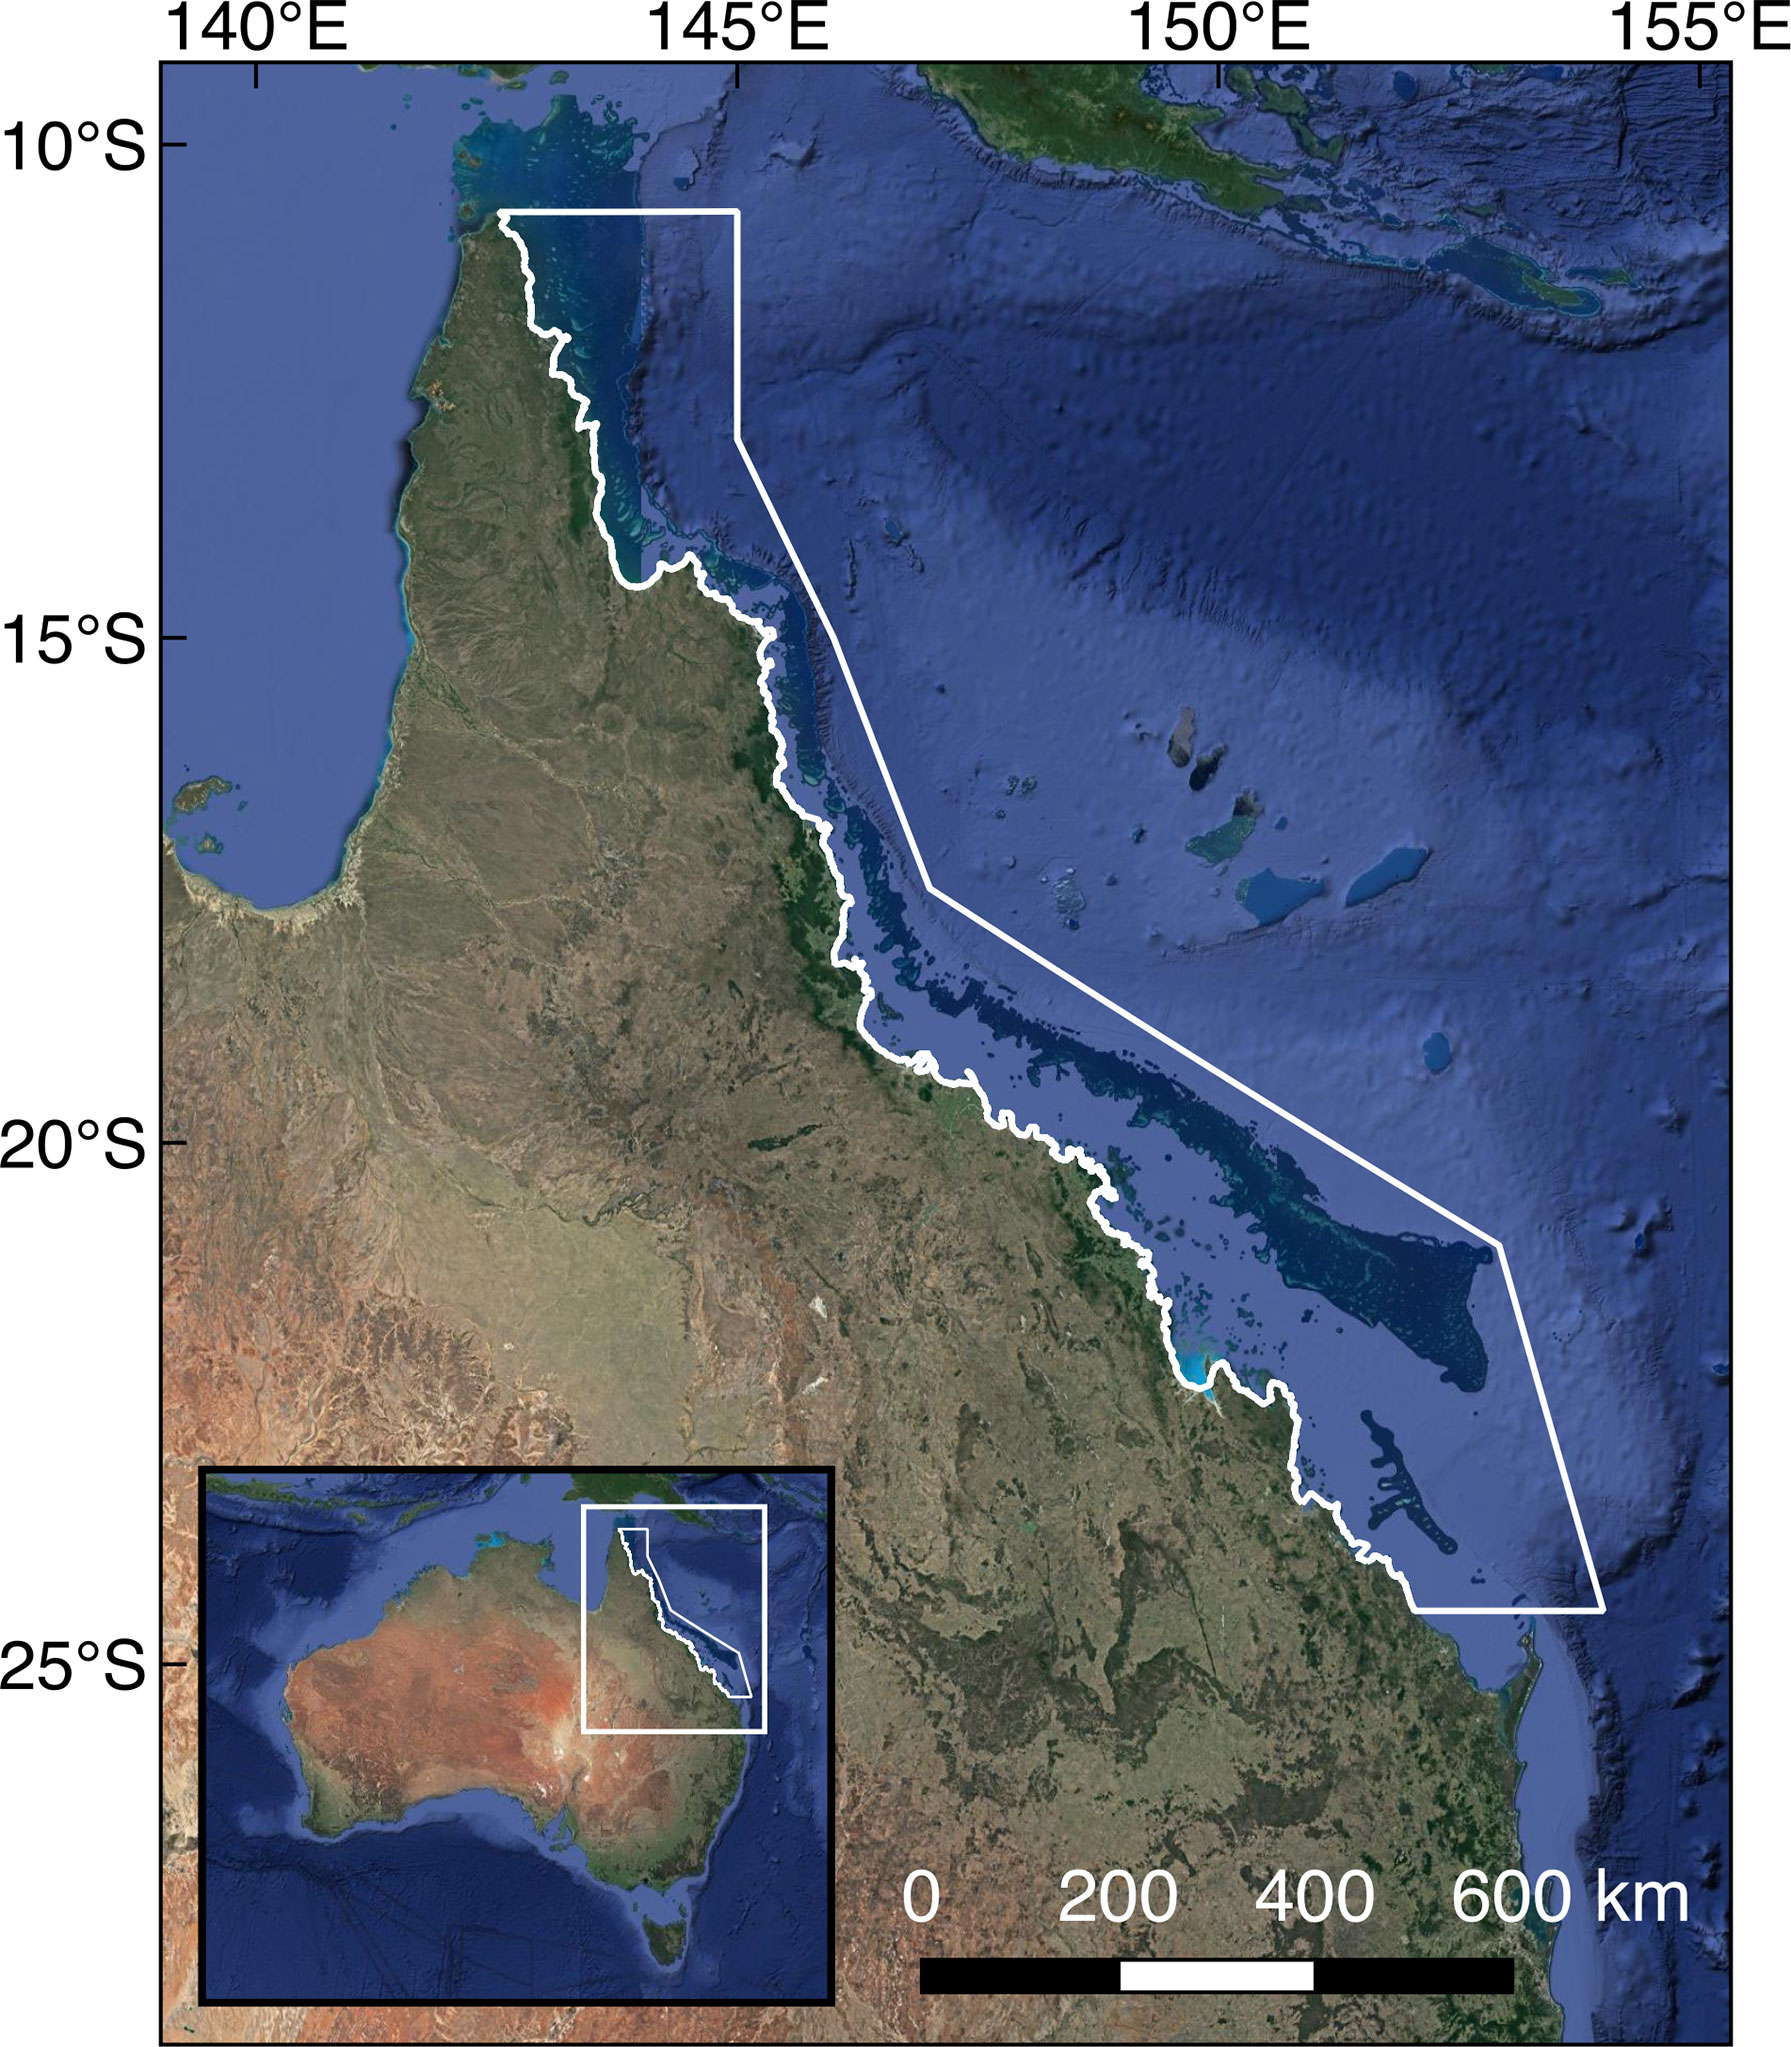
Figure 1 Map of north-eastern Australia, showing the boundary of the Great Barrier Reef Marine Park for which the change in each variable was investigated (white outline). Base map © Google Earth 2020.
Jackson et al. (2021) used a multiple linear regression to predict DMSw (Eq. 1.1) from measurements taken during Marine National Facility RV Investigator voyage IN2016_V06 (RVI) from September to October 2016 in the southern and central GBR. The RVI voyage was undertaken as part of the Australian Research Council Discovery Project ‘The Great Barrier Reef as a significant source of climatically relevant aerosol particles’. The regression is used to calculate DMSw (nmol L-1) concentration from standardized SST and daily total PAR at 5 m (Eq. 1.1).
Water clarity affects the amount of solar irradiance which penetrates the sea surface and is accounted for by reducing surface PAR by the corresponding diffuse attenuation coefficient (k490: m-1) for a depth of 5 m (where PAR at 5 m=PAR×e−5 k490 ). This depth was chosen because DMSw samples were taken between 0-5 m during the RVI surveys. The regression derived in Jackson et al. (2021) explained 71% of the variance in observed DMSw (p<0.001, n=24) and reproduced seasonal and spatial (reef flat versus lagoon) variability in observed concentrations moderately well for the GBR (summarised in Jones et al., 2018). The calculated DMSw climatology represents average seawater surface DMS concentration derived from corals, algae and other DMS producing organisms in GBR waters.
DMSw in coral reefs does not linearly increase with SST when corals experience high levels of thermal stress (Jones et al., 2007; Fischer & Jones, 2012). To account for this, a coral thermal stress threshold was calculated as 1°C above the local climatological maximum monthly mean (MMM) SST (i.e. the warmest monthly average SST) (Liu et al., 2006). SST anomalies above the MMM+1°C threshold can be used to calculate accumulated coral thermal stress and predict the risk of coral bleaching using metrics such as Degree Heating Weeks (DHW) (Liu et al., 2006) or the Light Stress Index (Skirving et al., 2018). Ecologically significant coral bleaching typically occurs when DHW > 4°C-weeks (where SST has remained 1°C above the MMM for four consecutive weeks, or 4°C above the MMM for 1 week). Several studies have shown that indices calculated from the MMM+1°C threshold can predict the extent and severity of coral bleaching well in the GBR (Bainbridge, 2017; Hughes et al., 2018; Skirving et al., 2018). Therefore, the MMM+1°C threshold can be used as a good indication of coral thermal stress.
Corals are assumed to be experiencing thermal stress (but not necessarily bleaching) when SST ≥ MMM+1°C (Liu et al., 2006). When corals are thermally stressed, reactive oxygen concentrations can increase (Lesser, 2011). DMS(P) scavenge ROS, forming DMSO (Deschaseaux et al., 2014), which can result in a decline in ambient DMS concentrations (Jones et al., 2007). We therefore assume that for days when SST ≥ MMM+1°C DMSw no longer continues to increase with SST.
To avoid overestimating DMSw on days when this threshold was exceeded, the SST terms in Eq. 1.1 were replaced with the calculated coral thermal stress threshold (MMM+1°C) (Eq. 1.2). Calculated DMSw may still vary with PAR on these days. Capping the influence of SST on calculated DMSw reduced daily mean concentration by less than 0.1 nmol L-1.
The coral thermal stress threshold was recalculated for the contemporary and each end of century climate scenario, making an optimistic assumption that corals will acclimate to rising ocean temperatures. The coral thermal stress threshold for the contemporary period ranged from 26.8°C in the southern GBR to 31.0°C in the northern GBR (mean 28.9°C), and was most commonly exceeded between late January to March. For the end of the century, the coral thermal stress threshold ranged from 28.7-32.6°C (mean 30.7°C) for the SSP2-4.5 scenario and from 30.2-34.1°C (mean 32.2°C) for the SSP5-8.5 scenario.
It is assumed that the empirical relationship derived between DMSw, SST and PAR in the southern and central GBR can be used to estimate DMSw beyond the region for which Eq. 1 was defined. We acknowledge that this may not be an accurate representation of DMSw in the northern GBR or under future climate scenarios, however further research is needed to establish the validity of the observed relationship in other regions and time-periods. Further, the ability of corals to acclimate to rising SST, ocean acidification, sea-level rise, changes in water quality and ecosystem structure are uncertain, and we do not attempt to assume how corals will respond to such changes here. The purpose of this analysis is to investigate how predicted changes in SST, PAR and wind speed may affect contemporary DMSw and sea-air flux from the GBR.
2.2 Calculation of DMS sea-air and coral-air flux
2.2.1 DMS sea-air flux
DMS sea-air flux was calculated as a function of wind speed at 10 m (U10), SST and calculated DMSw. DMS concentration is typically several orders of magnitude lower in the atmosphere than at the sea surface. Therefore, DMS sea-air flux is calculated as the product of the total gas transfer velocity (Kw: cm hr-1) and the concentration of DMS at the sea surface (Cw: nmol L-1) using Eq. 2 (Liss & Slater, 1974). Sea-air flux is then converted from units of μmol cm-2 hr-1 to μmol m-2 d-1.
DMS sea-air flux is calculated using two parameterisations for Kw. The water-side transfer velocity (kw) parameterisation of Nightingale et al. (2000) was derived for carbon dioxide and is normalized to the SST-dependent Schmidt number of 660 for DMS (ScDMS), calculated as follows: ScDMS=2674−147.2 SST+ 3.726 SST2−0.038 SST3 (Saltzman et al., 1993). For this parameterisation, kw increases with U10 (Eq. 3).
Kw is then calculated using Eq. 4 (McGillis et al., 2000; Nightingale et al., 2000). The atmospheric gradient fraction (γa) is defined by γa= 1/(1+ ka/αkw,600) (McGillis et al., 2000), where α is the solubility coefficient for DMS (11.4 at 26°C) and ka is the airside transfer velocity, calculated as a function of U10 and the molecular weight of DMS and water as follows: ka = 659 U10 (62.13/18.02)-0.5 (Kondo, 1975)
The second parameterization of kw provides a more conservative estimate of Kw, by accounting for non-linearity in the DMS transfer velocity at high wind speeds (> 10 m s-1). This is done by including an attenuation of the Henry’s Law constant (Hatten) calculated using Eq. 5 (Vlahos & Monahan, 2009). H is the Henry’s Law constant in seawater (0.089) (Przyjazny et al., 1983), ϕB is the surface area of bubbles under the sea surface given by ϕB=0.09 (U10/10)3 and Cmix/Cw is the solubility enhancement of DMS (~40) from Vlahos and Monahan (2009).
Kw is then calculated using Eq. 6 as a function of Hatten, kw= 4×10⁻⁴+ 4×10⁻⁵(U10)2 and ka= 0.2 U10+0.3 (Schwarzenbach et al., 2005; Vlahos & Monahan, 2009). The parameterizations of kw and ka are given in units of cm s-1 and are converted to cm hr-1 in order to calculate the total DMS transfer velocity (Eq. 6).
2.2.2 DMS sea-air + coral-air flux
Current DMS sea-air flux parameterisations do not account for direct coral-air DMS flux from corals that are exposed to air at low tide. This is an important, albeit intermittent, source of DMSa over coral reefs. Hopkins et al. (2016) estimate that Acropora corals exposed to air for an average of 12 hours per month release 9-35 μmol m-2 d-1 (mean 22 μmol m-2 d-1). Given that Acropora are the dominant coral genus in the GBR, we add a fraction of the mean estimate to the DMS sea-air flux (Eq. 2), scaled by the percentage cover of coral reefs within each grid cell (where DMS flux= KwCw+[0.22×reef cover]). The fraction of reef cover was calculated as the number of reef pixels within a 0.25-degree grid (as determined in Jackson et al., 2021), using a database of coral reef locations obtained from ReefBase (https://www.reefbase.org) and MATLAB R2020a. Inclusion of the direct coral-air DMS flux estimate added 0.2-7.7 μmol m-2 d-1 (mean 1.6 μmol m-2 d-1) to the calculated DMS sea-air flux from coral reefs in the GBR.
The approach used to estimate coral-air DMS flux is limited because it assumes that Acropora spp. are the sole source of direct coral-air DMS flux and it does not account for seasonal, diurnal or spatial variability in the extent of coral exposure, or the complexity of the reef environment (Hopkins et al., 2016). Further research is needed to reduce the uncertainty in this estimate and to accurately scale laboratory-derived fluxes to the natural coral reef environment. Nevertheless, inclusion of coral-air DMS flux improves the representation of coral reefs in DMS flux climatologies.
2.3 CMIP6 model output
CMIP6 model output was obtained from the Australian Community Climate and Earth-System Simulator Coupled Model (ACCESS-CM2) (Dix et al., 2019) and the ACCESS Earth System Model (ACCESS-ESM 1.5) (Ziehn et al., 2019) for the CMIP6 historical, SSP2-4.5 and SSP5-8.5 experiments. For the historical simulations, solar variability, volcanic aerosols and anthropogenic-driven changes in atmospheric composition (greenhouse gases and aerosol) are forced by datasets which are largely based on observations up to 2014 (Eyring et al., 2016). For the SSP scenario experiments, variables are simulated from 2015 onwards under the respective SSP trajectories. Model output from both models was used to ensure that data for all required physical and biological variables was available. These data are available from the Earth System Grid Federation (https://esfg-node.llnl.gov/search/cmip6/).
ACCESS-CM2 is a global physical climate model, consisting of the Met Office physical atmosphere Unified Model (UM) version 10.6 (Walters et al., 2019), the Modular Ocean Model version 5 (MOM5), the Community Atmosphere Biosphere Land Exchange version 2.5 (CABLE2.5) land surface model and the CICE5 sea ice model, coupled by the OASIS3-MCT numerical coupler. A detailed description of the ACCESS-CM2 configuration is provided in Bi et al. (2020). ACCESS-ESM 1.5 consists of a previous version of ACCESS (ACCESS 1.3), which uses the CABLE version 2.4 land surface model, along with coupled terrestrial (CASA-CNP) and ocean biogeochemistry (WOMBAT) models (Ziehn et al., 2020). ACCESS model output for CMIP6 historical simulations predicted spatial and interannual variability in observations and reanalysis data well for a range of variables, including over the Australian region (Bodman et al., 2020; Ziehn et al., 2020). Therefore, the ACCESS-CM2 and ACCESS-ESM1.5 model output was chosen for this analysis.
Atmospheric variables are resolved at a horizontal resolution of 1.25° latitude x 1.875° longitude, with 38 vertical levels for ACCESS-ESM1.5 and 85 vertical levels for ACCESS-CM2. Oceanic variables are resolved at a horizontal resolution of 1°, with 50 vertical levels. Each model provided various ensembles and model run variations. For this analysis, the most commonly available r1i1p1f1 ensemble is used for each scenario.
Model output was obtained for the GBRMP region (Figure 1) for the contemporary (2001-2020) and end of century (2081-2100) time periods. SST and wind speed at 10 m were downloaded at daily frequency. While using daily mean wind speed to calculate DMS sea-air flux can average out the influence of high wind speeds, daily mean wind speed was used to calculate flux consistently across all model scenarios, allowing the relative change in DMS sea-air flux to be determined. Downwelling shortwave radiation at the sea surface (SWR: W m-2), chlorophyll-a at 5 m depth (CHL: mg m-3) as a proxy for water clarity, and cloud cover (%) were downloaded at the provided monthly frequency. SWR was used to estimate total daily PAR (mol m-2 d-1), using a conversion factor of 2.1 μmol m-2 s-1 PAR per W m-2 of total SWR (Howell et al., 1983). Monthly mean variables were linearly interpolated to a daily mean time-series at each pixel.
Data for k490 was not available from the two ACCESS models. Satellite-derived k490 products are derived from the normalized water-leaving radiance at 490 nm and 555 nm, calculated from top-of-atmosphere radiances in the absence of atmospheric perturbations (Wang et al., 2009). Given that k490 values in the GBR are typically less than 0.05 m-1, the attenuation of PAR at 5 m is less than 10 mol m-2 d-1. We derive a simple linear regression to predict k490 from CHL using a 20-year climatology of Moderate Resolution Imaging Spectroradiometer (MODIS) Aqua and Terra observations, area-averaged over the GBR (Eq. 7). The regression accounted for 73.5% (p<0.001, n=365) of the variance in MODIS k490 and is used to estimate k490 at each pixel for the contemporary and end of century CMIP6 model output. Calculated k490 is then used to derive daily total PAR at 5 m (henceforth PAR).
The coarse resolution model output was linearly interpolated to a 0.25-degree grid (for consistency with Jackson et al., 2021) to enable spatiotemporal variability in each variable to be investigated, including along coastal regions. A multi-model average of each variable was then calculated and used to calculate a climatology of DMSw (Eq. 1) and DMS flux (Eq. 2 + coral-air DMS flux) for the contemporary and end of century scenarios. The model source of each variable is listed in Table 1.
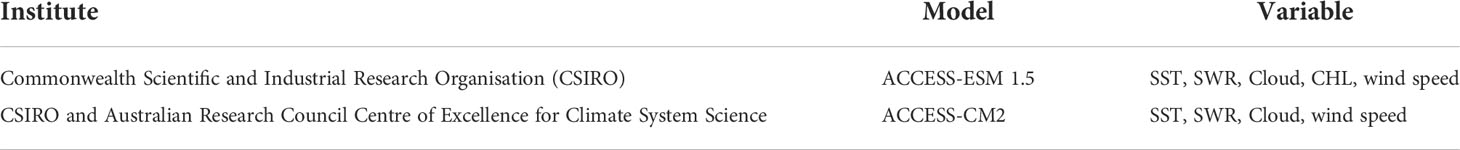
Table 1 CMIP6 models and output used in this analysis.
2.4 Remotely sensed observations
The historical CMIP6 model output was compared with a climatology of MODIS observations and ERA-5 reanalysis data (2001-2020) to evaluate how well the models predicted each variable for the GBR region. Daily mean SST, PAR, k490 and cloud cover were obtained from the MODIS sensor aboard the Aqua and Terra satellites, which both pass over the GBR at approximately noon local time (UTC+10 hr). A daily average at each pixel was calculated from the Aqua and Terra observations (n=7300). SST, PAR and k490 were downloaded at 0.04-degree resolution from NASA OceanColor (https://oceancolor.gsfc.nasa.gov). Cloud cover was downloaded at 1-degree resolution from the NASA Level-1 Atmosphere and Distribution System (http://laadsweb.modaps.eosdis.nasa.gov). Light attenuation at the surface was accounted for by reducing PAR by the corresponding k490 value for a depth of 5 m. Daily mean wind speed at 10 m was calculated from hourly ERA-5 100 m u- and v-wind vector components (Copernicus Climate Change Service, 2019). An area-average of each variable was calculated for the GBRMP region shown in Figure 1.
2.5 Analysis
The change in annual and seasonal mean SST, PAR, cloud cover (to investigate change in PAR), k490, wind speed, Kw, DMSw and DMS flux between the contemporary (2001-2020) and end of century (2081-2100) climatologies was investigated for the GBRMP (Figure 1). A contemporary climatology for each variable was calculated from CMIP6 historical model output from 2001 to 2014, extended to 2020 using an average of the SSP2-4.5 and SSP5-8.5 model output. Two end of century (2081-2100) climatologies were calculated for each variable under the respective SSP scenario.
3 Results
3.1 Comparison of model output and remotely sensed observations
To ensure the models adequately simulated contemporary conditions in the GBR, the CMIP6 contemporary climatology was compared with MODIS-derived SST, PAR at 5 m and cloud cover, and ERA-5 reanalysis wind speed data for the same time period (Figure 2). The CMIP6 model average overestimated MODIS-derived SST by approximately 1°C from February to September, underestimated PAR by up to 10 mol m-2 d-1 from October to May, and underestimated cloud cover by approximately 10% (Figure 2). The model average overestimated ERA-5 wind speed by approximately 1 m s-1 (Figure 2). The differences between the modelled and observed data are small in magnitude (< 20%), and are likely consistent between contemporary and future time periods. It is therefore assumed that the models simulated the relevant variables with enough confidence for this study.
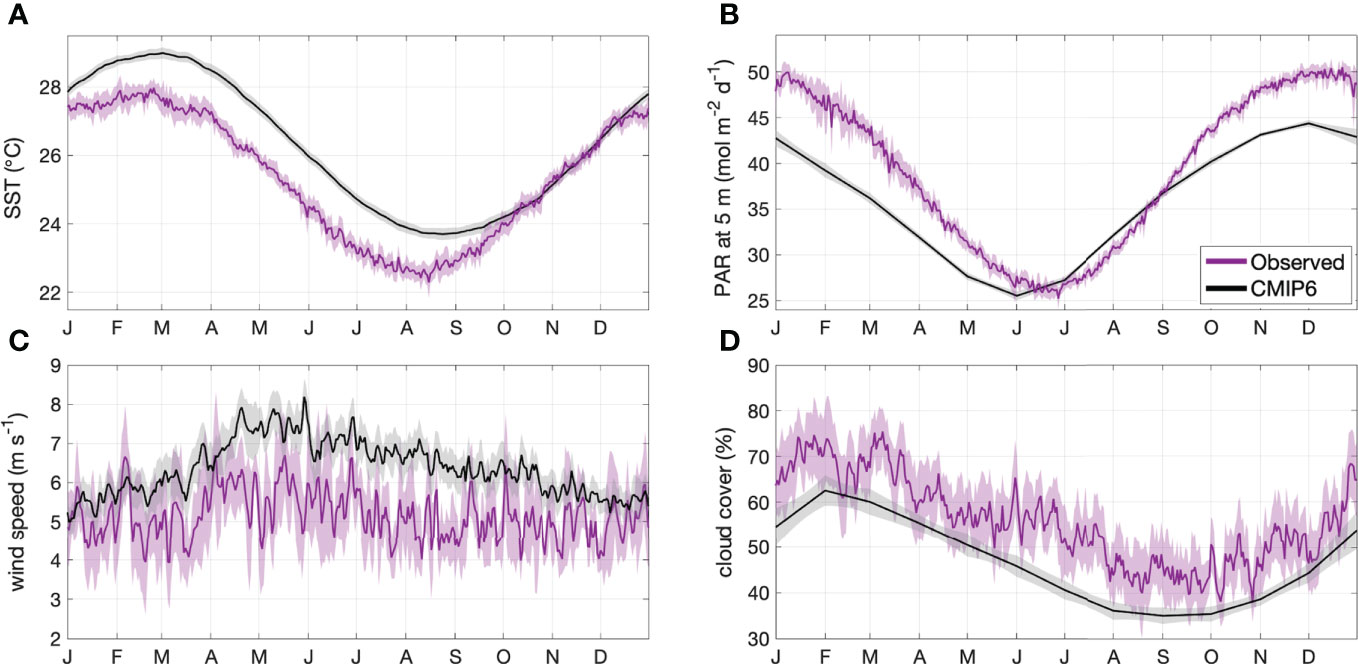
Figure 2 Area-averaged climatology ± 2 SE (shaded area) of contemporary (2001-2020) (A) SST, (B) PAR at 5 m, (C) wind speed and (D) cloud cover for the GBRMP. Climatologies are calculated from MODIS or ERA-5 reanalysis data (magenta) and CMIP6 model output (black).
3.2 Change in modelled SST, PAR, U10 and cloud cover
By the end of the century, annual mean SST increased by a respective 1.5°C (5.7%) and 3.0°C (11.4%) for the SSP2-4.5 and SSP5-8.5 scenarios (Table 2). The change in SST was relatively consistent year-round (Figure 3A), with minimal spatial variability (< 0.8°C) in the annual and seasonal mean change for the GBRMP (Supplementary Information Figure 1).
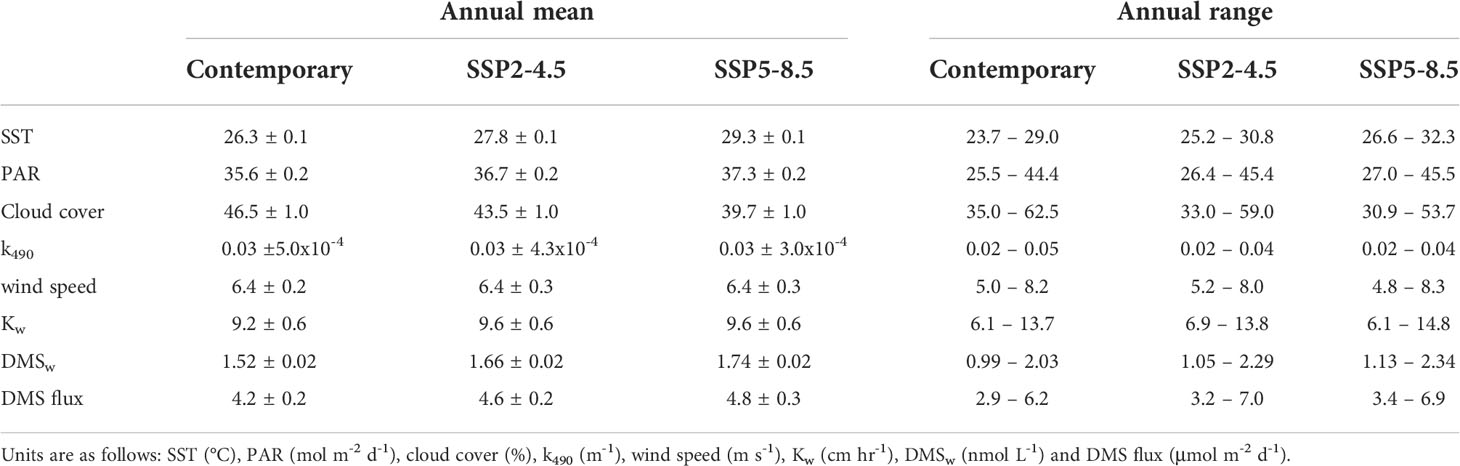
Table 2 Climatological annual mean (± 2 standard errors) and range for variables area-averaged over the GBRMP for the contemporary (2001-2020) and end of century (2081-2100) scenarios.
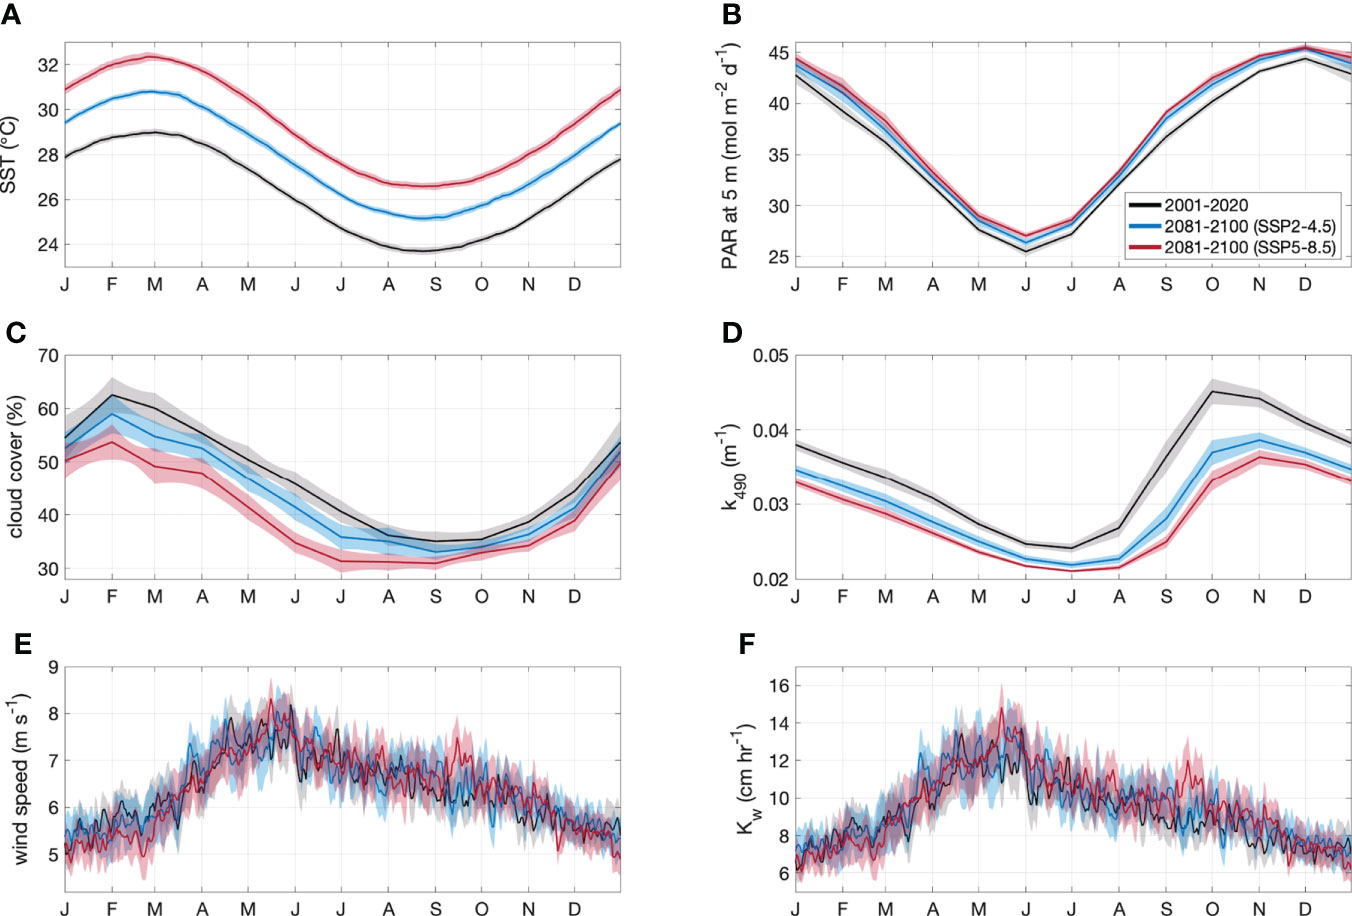
Figure 3 Area-averaged climatology ± 2 SE (shaded area) of (A) SST, (B) PAR at 5 m, (C) cloud cover, (D) k490, (E) wind speed and (F) Kw for the GBRMP. Climatologies are derived from CMIP6 contemporary (black) and end of century model output for SSP2-4.5 (blue) and SSP5-8.5 (red) scenarios.
Annual mean PAR increased by a respective 1.1 mol m-2 d-1 (3.1%) and 1.7 mol m-2 d-1 (4.8%) for the SSP2-4.5 and SSP5- 8.5 scenarios (Table 2). The increase in PAR (Figure 3B) coincided with a decrease in cloud cover (Figure 3C) and k490 (Figure 3D). The change in annual and seasonal PAR was most pronounced in the southern half of the GBR (Supplementary Information Figure 2), following the zonal changes in cloud cover (Supplementary Information Figure 3) and k490 (Supplementary Information Figure 4). Annual mean cloud cover decreased by a respective 3.0% and 6.8% for the SSP2-4.5 and SSP5-8.5 scenarios (Table 2). Annual mean k490 decreased by < 0.015 m-1 by 2100 (Table 2; Figure 3D), which for a given depth of 5 m, contributed up to 7% of the predicted change in PAR.
The change in annual mean wind speed was minimal (<0.1 m s-1) (Table 2; Figure 3E), but showed opposing seasonal trends. Wind speed increased throughout the GBR in winter, yet decreased in summer in the southern GBR under the SSP2-4.5 scenario, extending throughout the GBR under the SSP5-8.5 scenario (Supplementary Information Figure 5). The change in Kw was also minimal (<0.4 cm hr-1) (Table 2; Figure 3F), with spatial changes (Supplementary Information Figure 6) that approximately correspond to those for wind speed.
In ACCESS, DMS sea-air flux is simulated using the Liss and Merlivat (1986) parameterisation, using monthly varying DMSw concentrations prescribed by the Lana et al. (2011) climatology and evolving wind speed and SST. While DMSw concentration does not change between model years, DMS sea-air flux can evolve with changes in SST and wind speed. Previous model studies have demonstrated that large perturbations in DMS sea-air flux do not substantially influence cloud cover or surface SWR in ACCESS (Fiddes et al., 2018). Therefore, we can assume that the influence of evolving DMS sea-air flux between the contemporary and end of century scenarios has a negligible influence on modelled cloud cover, PAR, SST and calculated DMSw. While it has been hypothesised that DMS emissions can influence cloud properties (Fischer & Jones, 2012; Jones, 2015; Jones et al., 2017), the change in cloud cover is only reported here to investigate changes in surface PAR.
3.3 Change in calculated DMSw
For the contemporary scenario, annual mean DMSw area-averaged over the GBR was 1.52 ± 0.02 nmol L-1 (Table 2), ranging from 0.99 ± 0.003 nmol L-1 in winter to 2.03 ± 0.02 nmol L-1 in summer (Figure 4). By the end of the century, annual mean DMSw increased by a respective 0.14 nmol L-1 (9.2%) and 0.22 nmol L-1 (14.5%) for the SSP2-4.5 and SSP5-8.5 scenarios. Seasonal changes ranged from a 6.1%-14.1% (SSP2-4.5 - SSP5-8.5) increase in the winter minimum, and a 12.8%-15.3% (SSP2-4.5 - SSP5-8.5) increase in the summer maximum concentration (Table 2; Figure 4). There was minimal spatial variability in the contemporary annual and seasonal mean DMSw (<0.4 nmol L-1), and in changes in DMSw by the end of this century (<0.1 nmol L-1) (Figure 5).
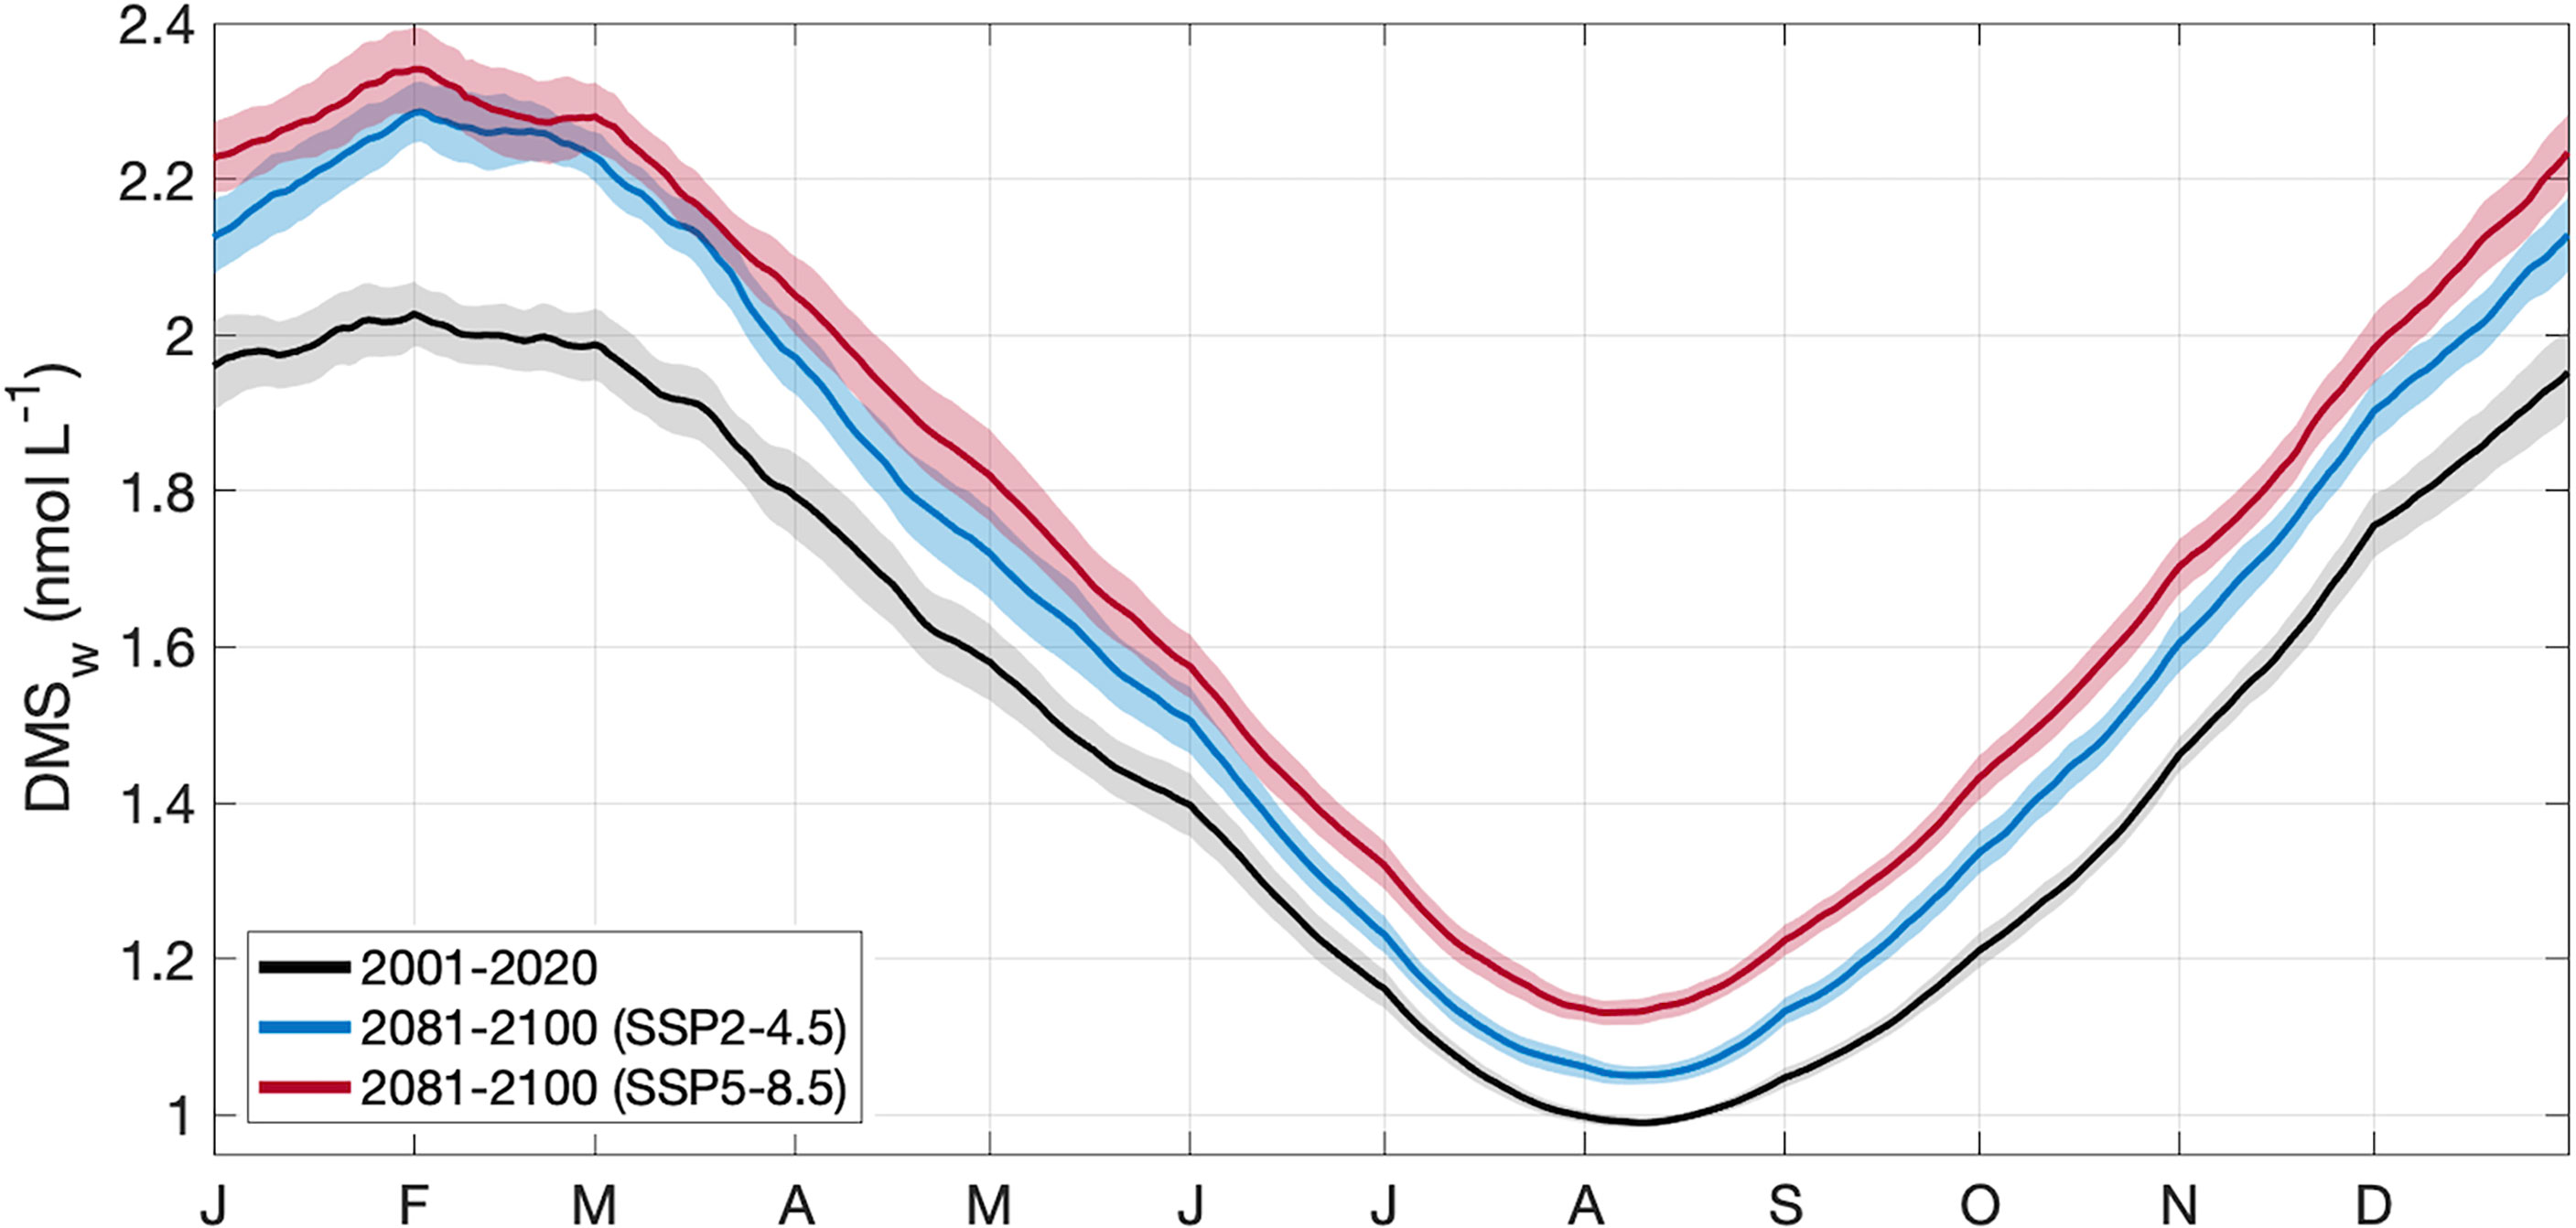
Figure 4 Area-averaged climatology ± 2 SE (shaded area) of DMSw in the GBRMP, derived from CMIP6 contemporary (black) and end of century model output for SSP2-4.5 (blue) and SSP5-8.5 (red) scenarios.
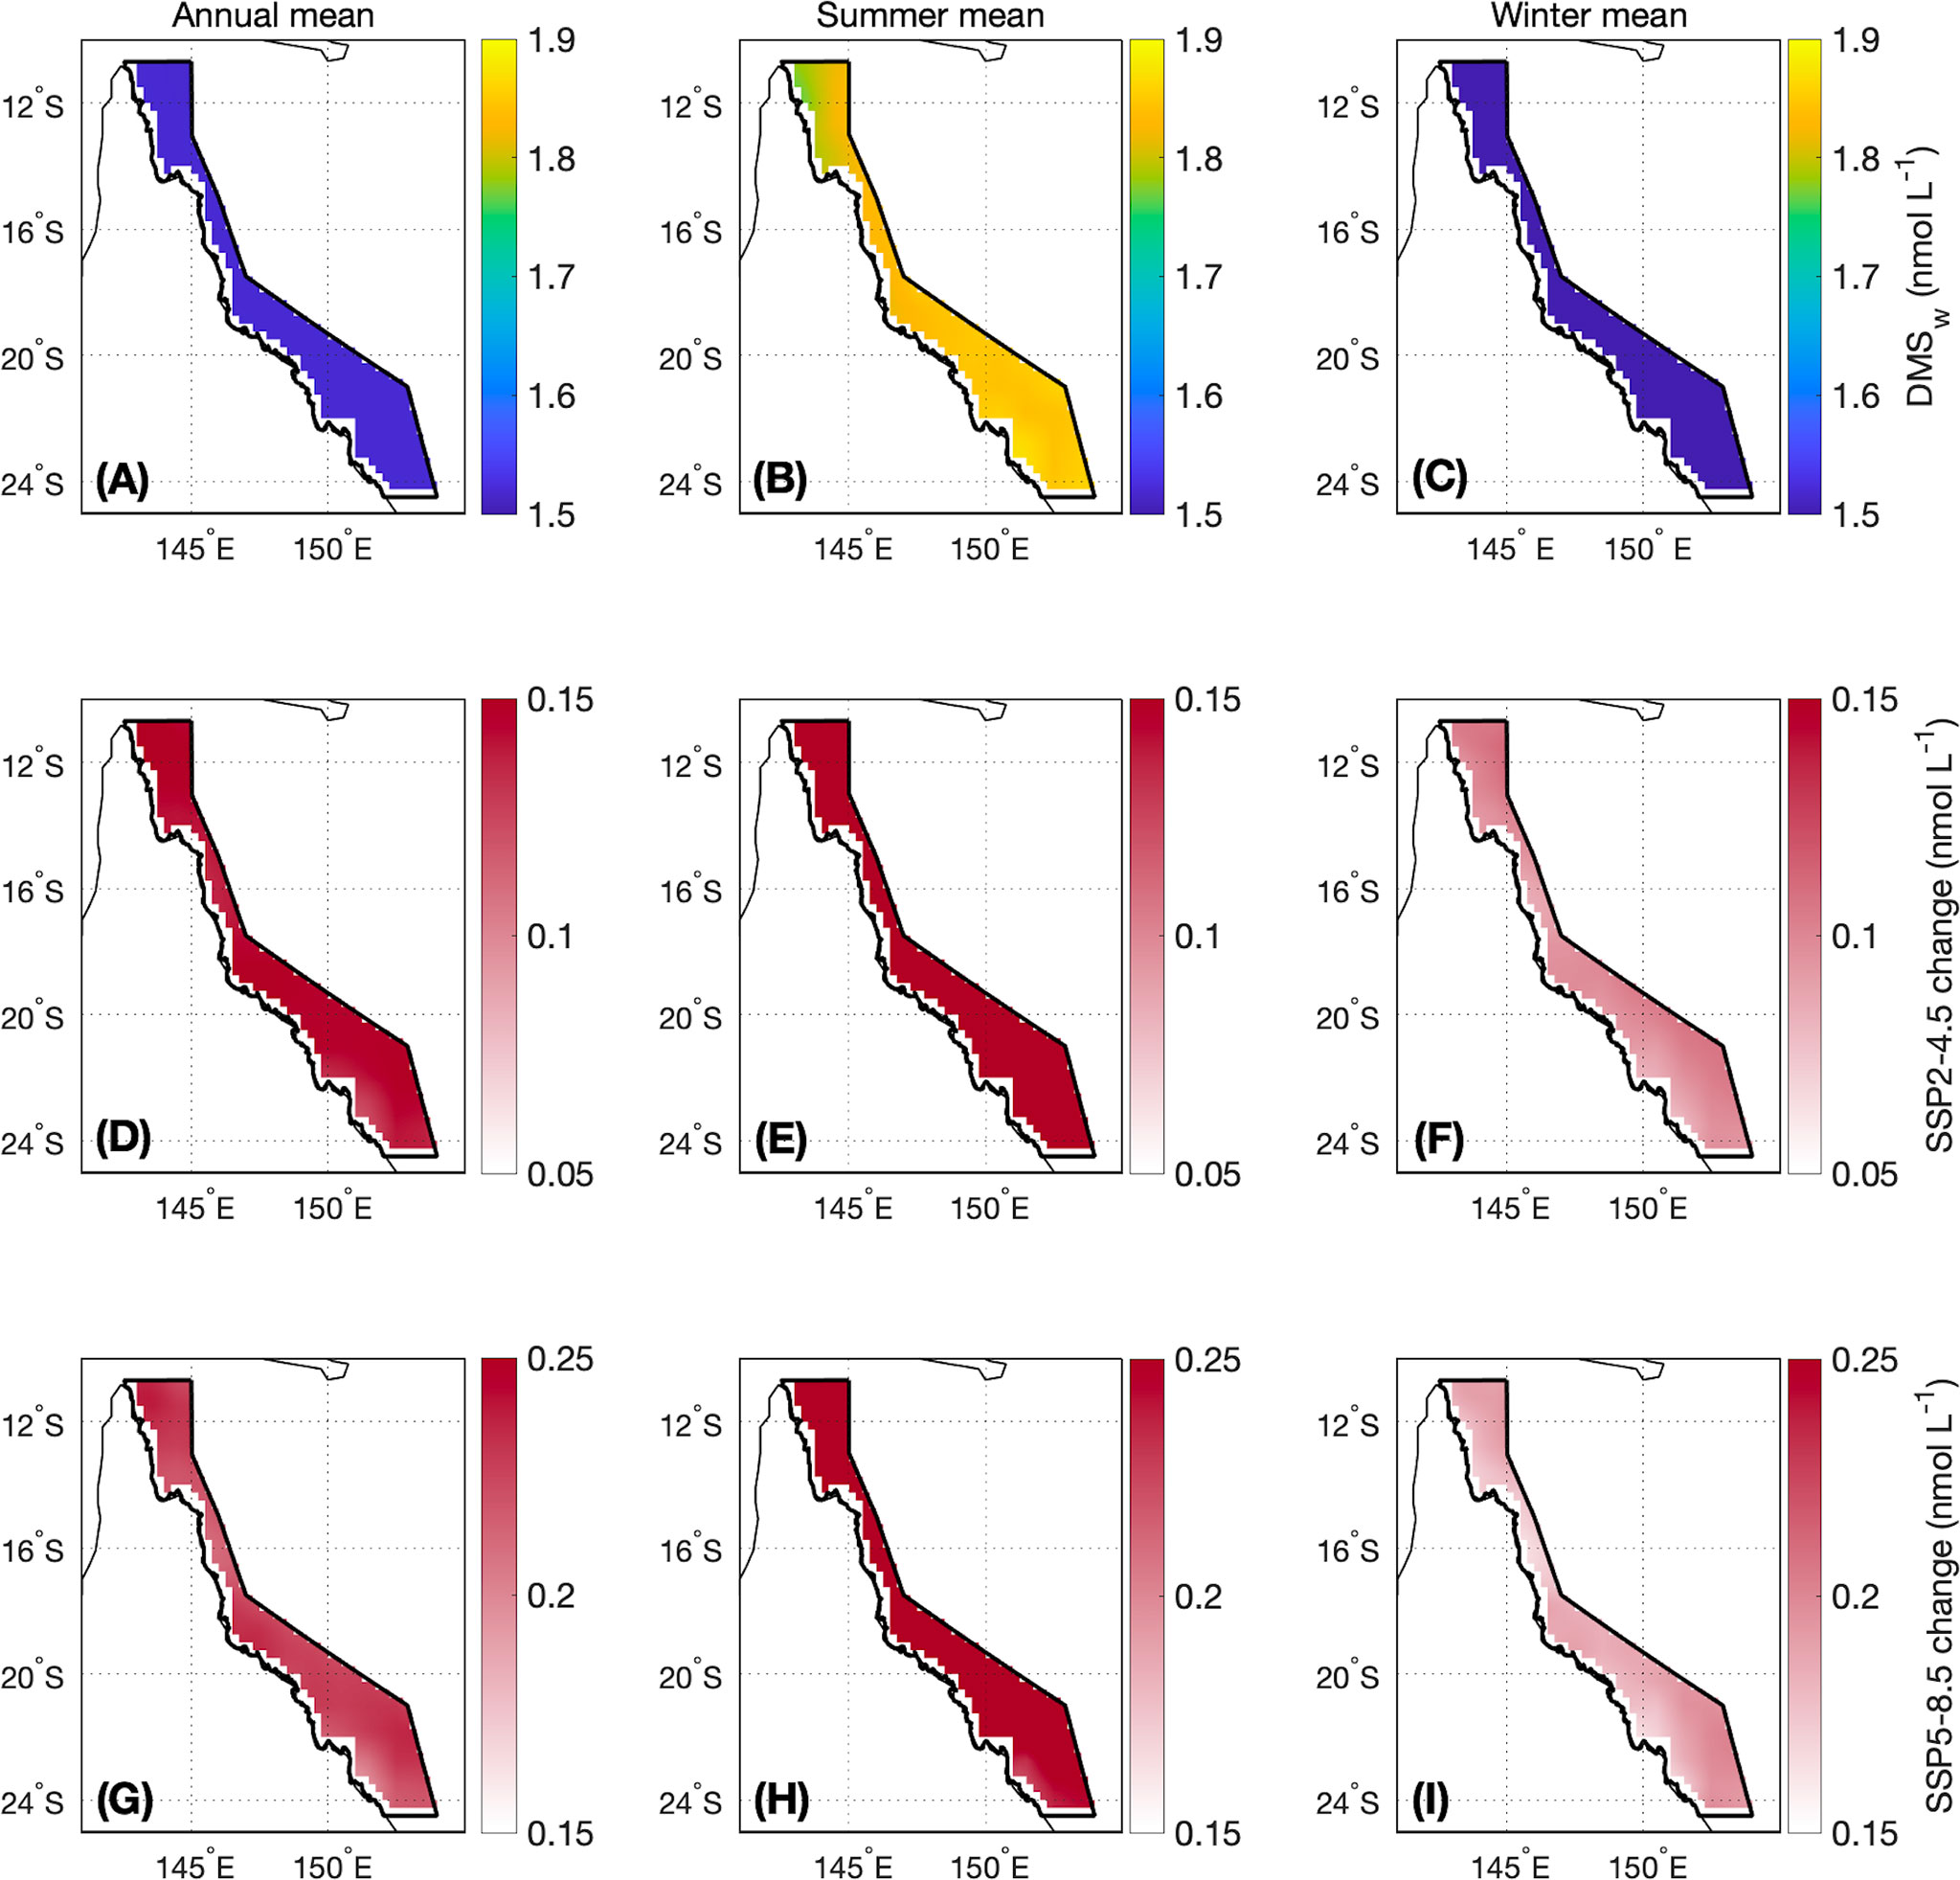
Figure 5 Contemporary (A) annual, (B) summer (November-April) and (C) winter (May-October) mean DMSw and the change in (D, G) annual, (E, H) summer and (F, I) winter mean DMSw by the end of this century modelled under a (middle panels) SSP2-4.5 and (lower panels) SSP5-8.5 scenario. The boundary of the GBRMP for which the area-averaged climatologies are calculated is shown as the bold black outline in each panel. Note that the colour scales differ between the SSP2-4.5 and SSP5-8.5 changes.
The sensitivity of calculated DMSw to SST and PAR was 0.013 and 0.003, respectively, where a 1% increase in SST or PAR resulted in a respective 1.3% or 0.3% increase in DMSw. Annual mean SST increased by 5.7-11.4% (Table 2), driving > 95% of the change in calculated DMSw. Annual mean PAR increased by 3.1-4.8% (Table 2), contributing < 5% to the change in DMSw. Calculated DMSw was highest from February to March for all climate scenarios, when SST is highest and the calculated coral thermal stress threshold was most often exceeded. During days when this threshold was exceeded, the influence of SST was capped at the thermal stress threshold (Eq. 1.2), resulting in a plateau in the calculated summer DMSw concentration.
3.4 Change in calculated DMS sea-air flux
For the contemporary scenario, annual mean DMS flux was 4.2 ± 0.2 μmol m-2 d-1 (Table 2), ranging from 2.9 ± 0.1 μmol m-2 d-1 in winter to 6.2 ± 0.3 μmol m-2 d-1 in summer (Figure 6). Annual and seasonal mean DMS flux was consistently highest over coral reefs in the GBR (up to 12.6 mol m-2 d-1) (Figure 7) due to the addition of direct coral-air DMS flux, which is an important source of emissions leading to significantly higher DMSa concentrations over coral reefs (Jones et al., 2007; Swan et al., 2017). By the end of the century, annual mean DMS flux increased by a respective 0.4 μmol m-2 d-1 (9.5%) and 0.6 μmol m-2 d-1 (14.3%) for the SSP2-4.5 and SSP5-8.5 scenarios (Table 2; Figure 6). Minimal spatial variability occurred for the change in DMS flux (<0.8 μmol m-2 d-1) under these future scenarios (Figure 7).
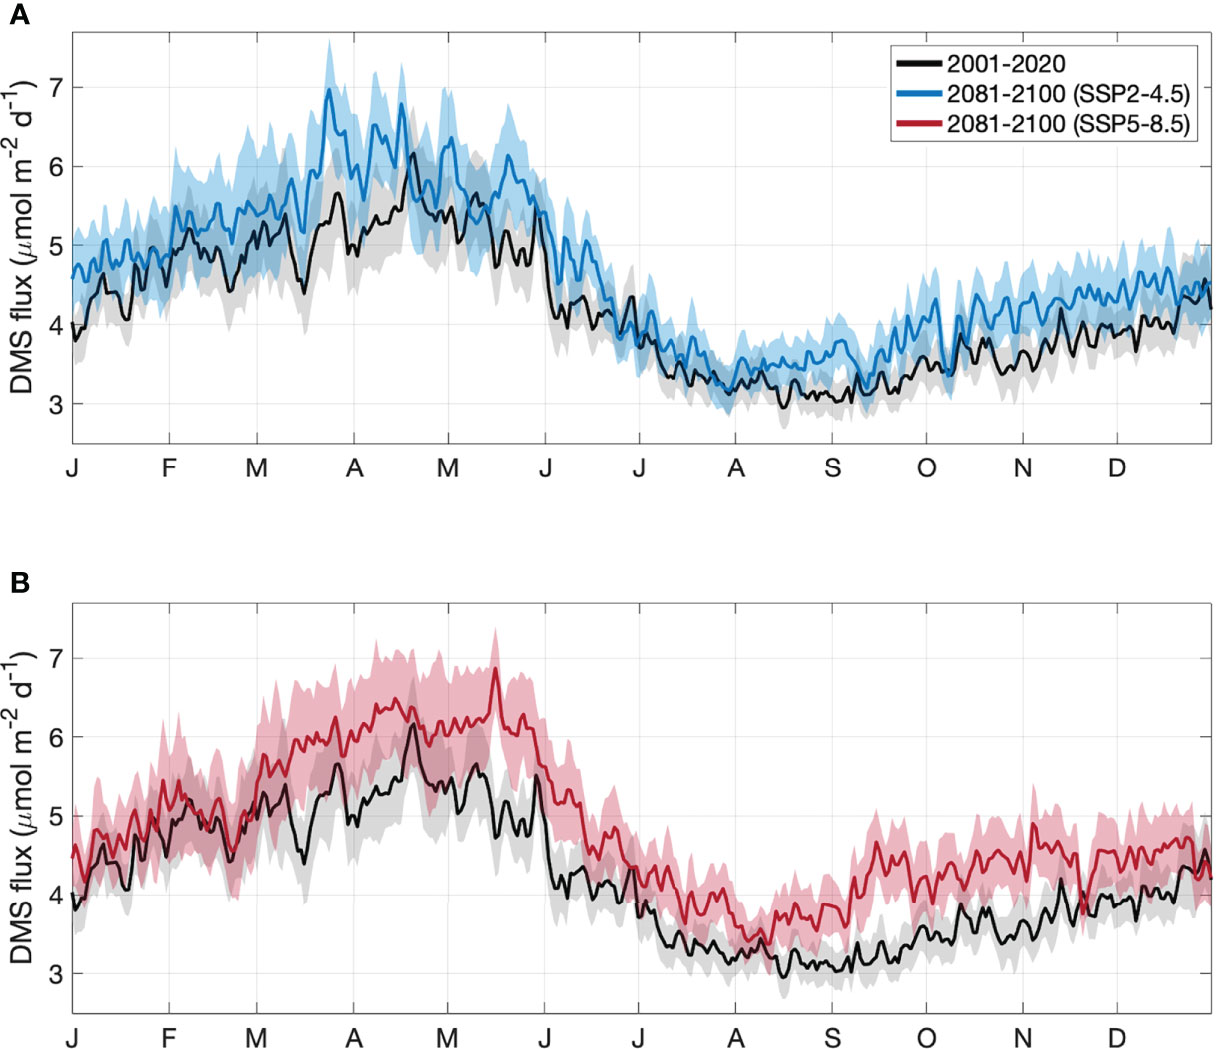
Figure 6 Area-averaged climatology of DMS sea-air flux in the GBR, derived from CMIP6 contemporary (black) and end of century model output for the (A) SSP2-4.5 (blue) and (B) SSP5-8.5 (red) climate.
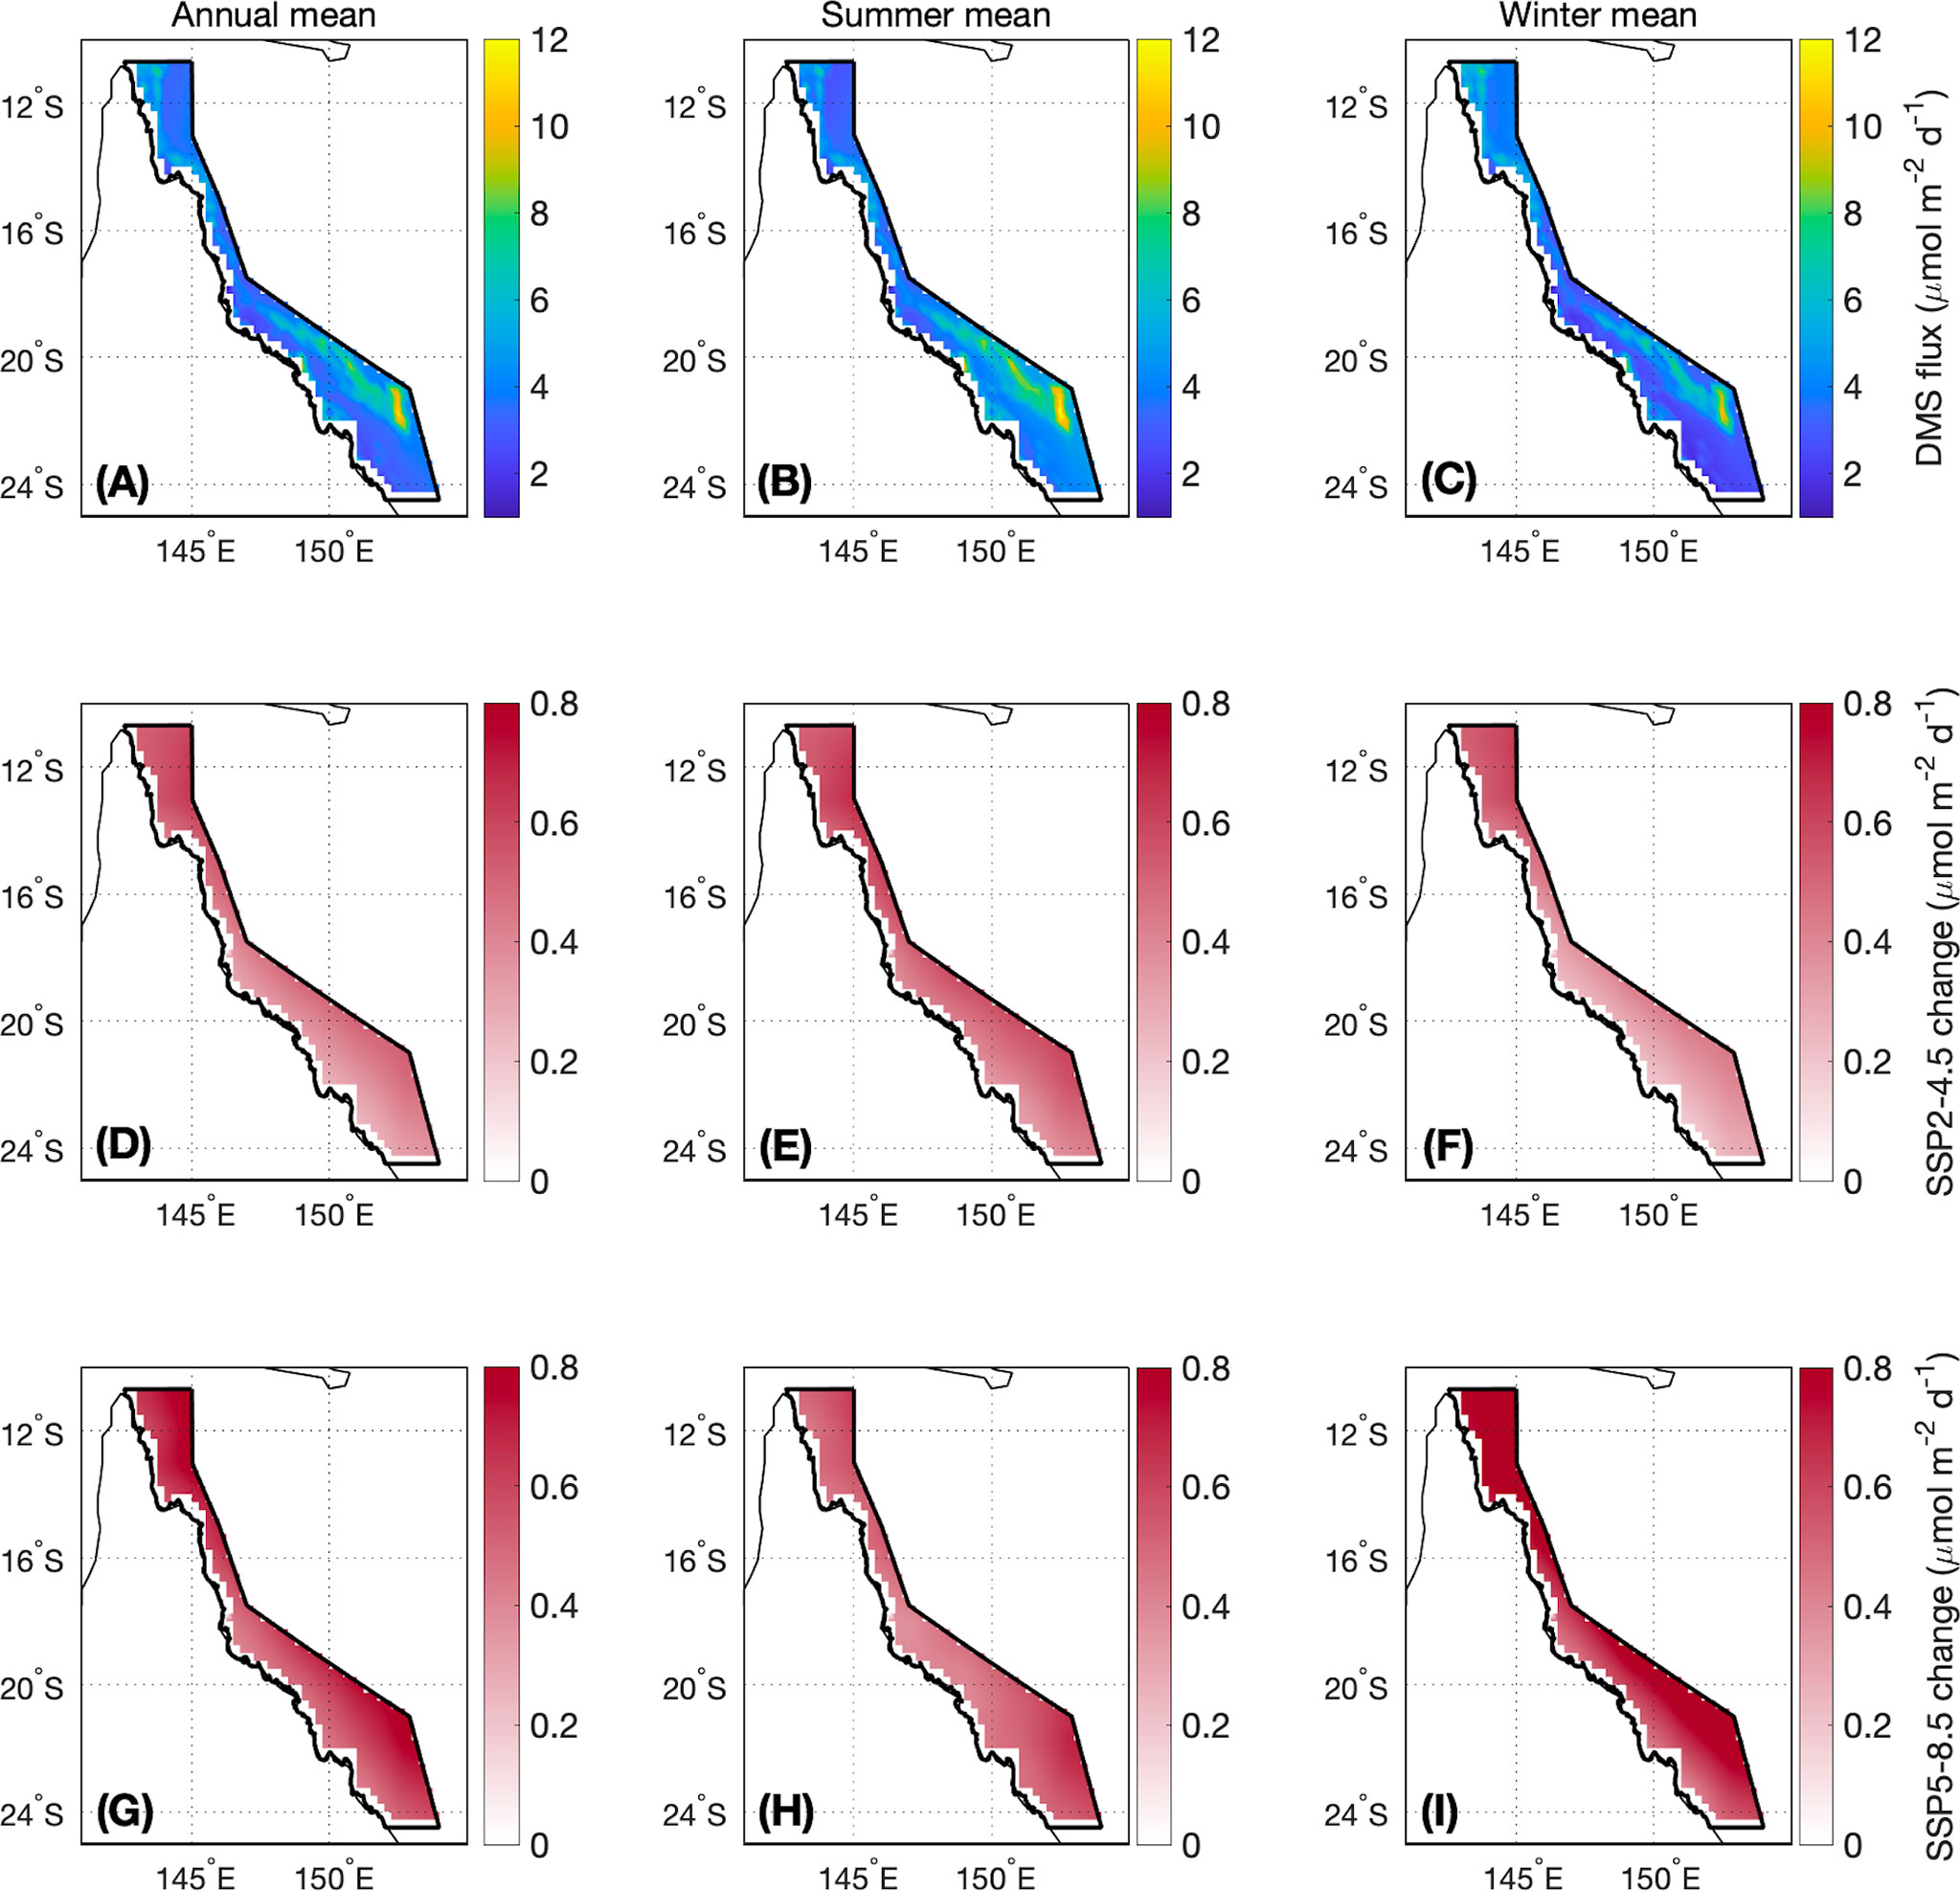
Figure 7 As for Figure 5, but for DMS flux.
From the mean of the Nightingale et al. (2000) and Vlahos and Monahan (2009) parameterisations (Figure 6), contemporary DMS emissions from the GBR range from 0.028-0.038 Tg yr-1 of DMS (1297-1771 mol km2 yr-1). For the SSP2-4.5 and SSP5-8.5 end of century scenarios, DMS emissions are respectively estimated to be 0.030-0.043 Tg yr-1 of DMS (1403-1990 mol km2 yr-1) and 0.031-0.045 Tg yr-1 (1435-2086 mol km2 yr-1), representing a 7.1-13.2% and 10.7-18.4% increase in total annual DMS emissions.
DMS sea-air flux was calculated from DMSw (Eq. 1) and Kw (a function of SST and wind speed, Eq. 4 and Eq. 6). The sensitivity of DMS flux to DMSw, SST and wind speed was 0.008, 0.003 and 0.015, respectively, where a 1% change in DMSw, SST or wind speed would result in a respective 0.8%, 0.3% or 1.5% change in DMS sea-air flux. Annual mean DMSw increased by 9.2-14.5%, SST increased by 5.7-11.4% and wind speed changed by less than 0.1%. Therefore, the change in DMSw, SST and wind speed contributed up to 77.5%, 23.9% and 1.0% of the change in annual mean DMS flux. Given that DMSw is almost entirely dependent on SST (> 95%) and Kw is partially dependent on SST, more than 97.5% of the change in calculated DMS flux is driven by changes in SST, with the remaining 2.5% driven by changes in PAR (used to calculate DMSw) and wind speed.
4 Discussion
Annual mean DMSw in the GBR is estimated to be 1.52 nmol L-1. The predicted rise in SST and PAR under an optimistic (SSP2-4.5) and worst-case (SSP5-8.5) end of century scenario may increase average DMSw concentration in the GBR by a respective 9.2% and 14.5%. DMSw was calculated as a function of SST and PAR, which respectively increased by 5.7-11.4% (SSP2-4.5 - SSP5-8.5), and 3.1-4.8% (SSP2-4.5 - SSP5-8.5). The increase in PAR was in part due to a decrease in and k490, and a decrease in cloud cover which has been predicted to occur in the tropics and subtropics under future greenhouse gas warming (Schneider et al., 2019). The sensitivity of Eq. 1 to SST was greater than PAR and consequently, the increase in SST drove more than 95% of the change in calculated DMSw.
Contemporary DMS emissions from the GBR ranged from 0.028-0.038 Tg yr-1, equivalent to 0.015-0.020 Tg yr-1 of sulfur as DMS. By the end of this century, increased DMSw concentration and predicted changes in wind speed could increase annual mean DMS emissions by a respective 9.5% and 14.3% under an optimistic (SSP2-4.5) and worst-case (SSP5-8.5) scenario.
In the Southern Hemisphere, the sensitivity of CCN to oceanic DMS sea-air flux is estimated to be 0.07 (Woodhouse et al., 2010). From this estimate, the predicted 9.5-14.3% increase in annual mean DMS flux from the GBR could result in only a 0.7-1.0% increase in annual mean CCN. Previous model studies have demonstrated that DMS emissions from coral reefs that are an order of magnitude larger than estimated in the current study (0.3 Tg yr-1), do not significantly influence aerosol or cloud processes (Fiddes et al., 2021; Fiddes et al., 2022). Therefore, a 9.5-14.3% increase in DMS flux is unlikely to influence the regional atmosphere. However, observational studies suggest that local biogeophysical processes in the GBR could be more sensitive to changes in DMS emissions (Jones et al., 2007; Modini et al., 2009; Fischer & Jones, 2012; Jones et al., 2017; Cropp et al., 2018). This is an important question for future research.
Field and laboratory studies have observed an increase in DMS concentration in coral tissues and in reef seawaters with rising SST, until SST exceeds the coral thermal stress threshold (Jones et al., 2007; Fischer & Jones, 2012; Jones et al., 2017). For example, Jones et al. (2007) observed a ~50% decrease in DMSw when SST exceeded 30°C and caused coral bleaching in the central GBR. The observed decrease in DMSw may have been due to enhanced biochemical oxidation of DMS(P) to DMSO and a decline in DMS(P) biosynthesis as corals bleached (Jones et al., 2007; Fischer & Jones, 2012). To avoid overestimating calculated DMSw concentration in this study, a coral thermal stress threshold was calculated and substituted into Eq. 1 for days when SST exceeded the threshold. Imposing an upper limit on the influence of SST on calculated DMSw reduced calculated concentration by < 0.1 nmol L-1.
Re-calculating the coral bleaching threshold for the end of the century assumes that living corals will be able to cope with rises in SST. This may occur through natural means such as the recruitment of temperature-tolerant zooxanthellae species (Berkelmans & Van Oppen, 2006; Bay et al., 2016), through assisted evolution (Van Oppen et al., 2015) or via solar radiation management strategies which can reduce surface irradiance and temperature (Kwiatkowski et al., 2015; Zhang et al., 2017).
If corals do not acclimate to the predicted increase in SST, the frequency of coral bleaching and mortality events will continue to reduce coral cover (Hughes et al., 2019), leading to a decline in coral-derived DMSw. A decline in coral-derived DMSw could be exacerbated by increased biochemical oxidation of DMS(P) to DMSO in surviving corals exposed to high temperatures (e.g. Fischer & Jones, 2012). While it is not possible to distinguish between coral and algal-derived DMSw from observations of dissolved DMS concentration alone, increases in DMS-producing marine algae in degraded coral reef ecosystems (McCook and Diaz-Pilido, 2002; De’ath & Fabricius, 2010) could counteract a decline in coral-derived DMSw (as discussed in Jackson et al., 2020). More research is required to determine whether corals can acclimate to rising SST and how DMSw in coral reefs will be affected by changes in surface temperature, irradiance and coral-algal interactions.
Further research is also needed to determine the synergistic impacts of ocean acidification on DMS(P) biosynthesis. In comparison to coral DMS(P) biosynthesis, the impact of ocean acidification on algal DMS(P) production has been relatively well studied (Hopkins et al., 2020). Given that DMS concentration in coral reef waters is partially driven by algal and microbial cycling of DMSP (Raina et al., 2009), changes in DMS concentration in the GBR may have similar responses to those reported for algal communities.
The impact of ocean acidification on algal DMS(P) production varies with location, season and community structure (Hopkins et al., 2020). In the subtropical North Atlantic, mesocosm experiments revealed a decrease in algal-derived DMS with lower pH due to reduced rates of microbial catabolism of DMSP (Archer et al., 2018). Conversely, the response of surface ocean micro-algae to acidification in the temperature north-western European shelf resulted in 110-225% increases in dissolved DMS concentrations in response to atmospheric CO2 concentrations of 550-1,000 μatm, respectively (Hopkins & Archer, 2014). Other studies in the Artic and Southern Ocean have reported no significant impacts of short-term ocean acidification on micro-algal DMS production (Hopkins et al., 2020). Further complicating the matter, one study demonstrated that temperature had a stronger influence on DMS production in algae than pH, where increased production in response to temperature outweighed the decline in biosynthesis due to acidification (Arnold et al., 2013). Further research is needed to understand the influence of ocean acidification on DMS(P) biosynthesis in the global ocean and in coral reefs.
Sea level rise and the rate of coral reef vertical accretion is also likely to affect coral physiological stress and DMS emissions. Global mean sea level is predicted to rise by 40-80 cm under an end of century climate (Sanborn et al., 2020). In the late Holocene in the GBR, fast-growing branching corals (such as Acropora spp.) grew in relatively shallow, clear waters, which are representative of conditions which are still found in parts of the contemporary GBR. During this time, coral reef vertical accretion occurred at a rate of 0.2-1.1 cm yr-1 (mean 0.5 cm yr-1) (Sanborn et al., 2020). Therefore, if sea level rise in the GBR remains below ~1 cm yr-1, coral vertical accretion could keep pace with the rate of sea level rise.
Short-term processes such as El Nino Southern Oscillation (ENSO) can also influence regional sea level. During strong El Nino events, regional sea level in the tropical western Pacific can decline by up to 30 cm, leading to more frequent extreme low tides and coral air exposure (Becker et al., 2012; Widlansky et al., 2015). El Nino events are charactersied by a weakening or reversal of easterly trade winds and subsequent thermocline shoaling in the western Pacific and deepening in eastern Pacific. Regional sea level anomalies typically mirror these thermocline shifts (Widlansky et al., 2015). More frequent and prolonged coral exposure to air could increase direct coral-air DMS flux and concerningly, increase coral oxidative stress. In the western Pacific, El Nino events are associated with clear skies, high solar irradiance and high SST. When combined with increased aerial exposure of corals, these conditions could result in more frequent and severe coral bleaching (Buckee et al., 2020). Alternatively, rising sea levels could facilitate increased coral cover, due to reduced temperature, irradiance and coral physiological stress at depth, and less (if any) aerial exposure of corals at low tide (Brown et al., 2019).
The impacts of climate change on coral reef biogeochemical processes are complex and difficult to predict. This study assumes that corals will acclimate to rising ocean temperatures and predicts that DMS emissions from the GBR will increase as a result. However, further research is needed to understand the effects of temperature, light, ocean acidification, salinity, and changing sea level, water quality and ecosystem structure on DMS production and emissions in coral reefs before the change in DMS emissions by the end of this century can be more accurately determined. Nevertheless, we suggest that ocean warming could increase present-day DMS emissions and the source strength of the GBR to the atmospheric sulfur budget, if corals can acclimate to their changing environment.
5 Conclusions
Coral reefs are important regional sources of DMS, with potential implications for local aerosol and cloud processes. By the end of this century, a 1.5-3.0°C rise in annual mean SST and a 1.1-1.7 mol m-2 d-1 increase in PAR is predicted to increase calculated DMSw by a respective 9.2% to 14.5%, leading to an increase in calculated DMS flux of 9.5% to 14.3% under an optimistic and worst-case emissions scenario, as simulated by ACCESS models for CMIP6. Previous model studies using ACCESS have demonstrated little to no sensitivity to larger fluctuations in coral reef DMS emissions. Therefore, a 9.5-14.3% increase in DMS emissions from the GBR is unlikely to significantly influence the regional atmosphere. However, anthropogenic aerosol emissions may decline in future with initiatives to shift towards renewable energy, in which case aerosol-cloud processes may become more sensitive to small changes in DMS flux, particularly at the local scale. Understanding the complex coral reef sulfur cycle and how the atmospheric aerosol system responds to changes in emission will require further research. The predicted increase in DMSw and DMS flux from the GBR by the end of this century assumes that corals will acclimate to rising SST, and does not account for the impact of ocean acidification, changes to water quality, sea level or other factors associated with climate change. Nevertheless, the findings presented here provide insight into the effects of ocean warming on contemporary DMS emissions from the GBR and the contribution of the GBR to the atmospheric sulfur budget.
Data availability statement
The model output used in this analysis is available from the Earth System Grid Federation (https://esgf-node.llnl.gov/projects/cmip6/). MODIS sensor observations are available from NASA’s OceanColor (https://oceancolor.gsfc.nasa.gov) and Level-1 Atmosphere and Distribution System (https://ladsweb.modaps.eosdis.nasa.gov/). ERA5 u and v-wind vector components are available from the Copernicus Climate Change Service (https://cds.climate.copernicus.eu/).
Author contributions
RJ completed the data analysis and prepared the manuscript. All authors contributed to the interpretation of results, and review and finalisation of the manuscript.
Funding
RJ was supported by an Australian Government Research Training Program Scholarship, Commonwealth Scientific and Industrial Research Organisation post-graduate scholarship, and the Griffith University School of Environment and Science.
Acknowledgments
We gratefully acknowledge the World Climate Research Programme’s Working Group on Coupled Modelling, which is responsible for CMIP, and we thank the climate modelling groups listed in Table 1 for producing and making available their model output (Dix et al., 2019; Ziehn et al., 2019). The U.S. Department of Energy’s Program for Climate Model Diagnosis and Intercomparison provides coordinating support for CMIP and led development of software infrastructure in partnership with the Global Organization for Earth System Science Portals. We gratefully acknowledge the NASA Goddard Space Flight Center, Ocean Ecology Laboratory, Ocean Biology Processing Group, and associated MODIS mission scientists, for the provision of MODIS ocean color data, and the Copernicus Climate Change Service for wind speed reanalysis data used in this analysis. The work forms part of RJ’s PhD thesis, entitled ‘Coral reefs as a source of dimethylsulfide (DMS) and the influence on the atmosphere of the Great Barrier Reef’, which will be available on the Griffith University online repository (https://research-repository.griffith.edu.au) from 14 June 2023.
Conflict of interest
The authors declare that the research was conducted in the absence of any commercial or financial relationships that could be construed as a potential conflict of interest.
Publisher’s note
All claims expressed in this article are solely those of the authors and do not necessarily represent those of their affiliated organizations, or those of the publisher, the editors and the reviewers. Any product that may be evaluated in this article, or claim that may be made by its manufacturer, is not guaranteed or endorsed by the publisher.
Supplementary material
The Supplementary Material for this article can be found online at: https://www.frontiersin.org/articles/10.3389/fmars.2022.910420/full#supplementary-material
References
Ainsworth T. D., Heron S. F., Ortiz J. C., Mumby P. J., Grech A., Ogawa D., et al. (2016). Climate change disables coral bleaching protection on the Great Barrier Reef. Science 352 (6283), 338–342. doi: 10.1126/science.aac7125
Anderson J. M., Chow W. S., Park Y.-I. (1995). The grand design of photosynthesis: acclimation of the photosynthetic apparatus to environmental cues. Photosynthesis Res. 46 (1), 129–139. doi: 10.1007/BF00020423
Andreae M. O., Barnard W. R., Ammons J. M. (1983). The biological production of dimethylsulfide in the ocean and its role in the global atmospheric sulfur budget. Ecological Bulletins 35, 167–177.
Andreae M. O., Crutzen P. J. (1997). Atmospheric aerosols: Biogeochemical sources and role in atmospheric chemistry. Science 276 (5315), 1052–1058. doi: 10.1126/science.276.5315.1052
Andreae M. O., Rosenfeld D. (2008). Aerosol–cloud–precipitation interactions. part 1. the nature and sources of cloud-active aerosols. Earth-Science Rev. 89 (1–2), 13–41. doi: 10.1016/j.earscirev.2008.03.001
Archer S. D., Suffrian K., Posman K. M., Bach L. T., Matrai P. A., Countway P. D., et al. (2018). Processes that contribute to decreased dimethyl sulfide production in response to ocean acidification in subtropical waters. Front. Mar. Sci. 5. doi: 10.3389/fmars.2018.00245
Arnold H. E., Kerrison P., Steinke M. (2013). Interacting effects of ocean acidification and warming on growth and DMS-production in the haptophyte coccolithophore E. miliania huxleyi. Global Change Biol. 19 (4), 1007–1016. doi: 10.1111/gcb.12105
Bainbridge S. J. (2017). Temperature and light patterns at four reefs along the Great Barrier Reef during the 2015–2016 austral summer: understanding patterns of observed coral bleaching. J. Operational Oceanography 10 (1), 16–29. doi: 10.1080/1755876X.2017.1290863
Bay L. K., Doyle J., Logan M., Berkelmans R. (2016). Recovery from bleaching is mediated by threshold densities of background thermo-tolerant symbiont types in a reef-building coral. R. Soc. Open Sci. 3 (6), 160322. doi: 10.1098/rsos.160322
Becker M., Meyssignac B., Letetrel C., Llovel W., Cazenave A., Delcroix T. (2012). Sea Level variations at tropical pacific islands since 1950. Global Planetary Change 80, 85–98. doi: 10.1016/j.gloplacha.2011.09.004
Berkelmans R., Van Oppen M. J. H. (2006). The role of zooxanthellae in the thermal tolerance of corals: a ‘nugget of hope’for coral reefs in an era of climate change. Proc. R. Soc. B: Biol. Sci. 273 (1599), 2305–2312. doi: 10.1098/rspb.2006.3567
Berndt T., Scholz W., Mentler B., Fischer L., Hoffmann E. H., Tilgner A., et al. (2019). Fast peroxy radical isomerization and OH recycling in the reaction of OH radicals with dimethyl sulfide. J. Phys. Chem. Lett. 10 (21), 6478–6483. doi: 10.1021/acs.jpclett.9b02567
Bi D., Dix M., Marsland S., O’Farrell S., Sullivan A., Bodman R., et al. (2020). Configuration and spin-up of ACCESS-CM2, the new generation Australian community climate and earth system simulator coupled model. J. South. Hemisphere Earth Syst. Sci. 70 (1), 225–251. doi: 10.1071/ES19040
Bodman R. W., Karoly D. J., Dix M. R., Harman I. N., Srbinovsky J., Dobrohotoff P. B., et al. (2020). Evaluation of CMIP6 AMIP climate simulations with the ACCESS-AM2 model. J. South. Hemisphere Earth Syst. Sci. 70, 166–179. doi: 10.1071/ES19033
Bourne D. G., Morrow K. M., Webster N. S. (2016). Insights into the coral microbiome: underpinning the health and resilience of reef ecosystems. Annu. Rev. Microbiol. 70, 317–340. doi: 10.1146/annurev-micro-102215-095440
Broadbent A. D., Jones G. B. (2004). DMS and DMSP in mucus ropes, coral mucus, surface films and sediment pore waters from coral reefs in the Great Barrier Reef. Mar. Freshw. Res. 55 (8), 849–855. doi: 10.1071/MF04114
Brown B. E., Dunne R. P., Somerfield P. J., Edwards A. J., Simons W. J. F., Phongsuwan N., et al. (2019). Long-term impacts of rising sea temperature and sea level on shallow water coral communities over a~ 40 year period. Sci. Rep. 9 (1), 1–12. doi: 10.1038/s41598-019-45188-x
Buckee J., Pattiaratchi C., Verduin J. (2020). Partial mortality of intertidal corals due to seasonal daytime low water levels at the houtman abrolhos islands. Coral Reefs 39 (3), 537–543. doi: 10.1007/s00338-019-01887-5
Bullock H. A., Luo H., Whitman W. B. (2017). Evolution of dimethylsulfoniopropionate metabolism in marine phytoplankton and bacteria. Front. Microbiol. 8. doi: 10.3389/fmicb.2017.00637
Copernicus Climate Change Service (2019) ERA5 fifth generation of ECMWF atmospheric reanalyses of the global climate: Hourly u and v-wind components on single levels from 1979 to present. Available at: https://cds.climate.copernicus.eu/.
Cropp R. A., Gabric A. J., van Tran D., Jones G., Swan H., Butler H. (2018). Coral reef aerosol emissions in response to irradiance stress in the Great Barrier Reef, Australia. Ambio 47 (6), 671–681. doi: 10.1007/s13280-018-1018-y
Dave P., Patil N., Bhushan M., Venkataraman C. (2019). “Aerosol influences on cloud modification and rainfall suppression in the south Asian monsoon region,” in Climate change signals and response. Eds. Venkataraman C., Mishra T., Ghosh S., Karmakar S. (Singapore: Springer), 21–37. doi: 10.1007/978-981-13-0280-0_2
De’ath G., Fabricius K. (2010). Water quality as a regional driver of coral biodiversity and macroalgae on the Great Barrier Reef. Ecol. Appl. 20 (3), 840–850. doi: 10.1890/08-2023.1
Deschaseaux E. S. M., Beltran V. H., Jones G. B., Deseo M. A., Swan H. B., Harrison P. L., et al. (2014). Comparative response of DMS and DMSP concentrations in symbiodinium clades C1 and D1 under thermal stress. J. Exp. Mar. Biol. Ecol. 459, 181–189. doi: 10.1016/j.jembe.2014.05.018
Deschaseaux E. S. M., Jones G. B., Deseo M. A., Shepherd K. M., Kiene R. P., Swan H. B., et al. (2014). Effects of environmental factors on dimethylated sulfur compounds and their potential role in the antioxidant system of the coral holobiont. Limnology Oceanography 59 (3), 758–768. doi: 10.4319/lo.2014.59.3.0758
Dix M., Bi D., Dobrohotoff P., Fiedler R., Harman I., Law R., et al. (2019). CSIRO-ARCCSS ACCESS-CM2 model output prepared for CMIP6. Earth System Grid Federation. doi: 10.22033/ESGF/CMIP6.4321
Downs C. A., Fauth J. E., Halas J. C., Dustan P., Bemiss J., Woodley C. M. (2002). Oxidative stress and seasonal coral bleaching. Free Radical Biol. Med. 33 (4), 533–543. doi: 10.1016/S0891-5849(02)00907-3
Eyring V., Bony S., Meehl G. A., Senior C. A., Stevens B., Stouffer R. J., et al. (2016). Overview of the coupled model intercomparison project phase 6 (CMIP6) experimental design and organization. Geoscientific Model. Dev. 9, 1937–1958. doi: 10.5194/gmd-9-1937-2016
Fiddes S. L., Woodhouse M. T., Lane T. P., Schofield R. (2021). Coral-reef-derived dimethyl sulfide and the climatic impact of the loss of coral reefs. Atmospheric Chem. Phys. 21 (8), 5883–5903. doi: 10.5194/acp-21-5883-2021
Fiddes S. L., Woodhouse M. T., Nicholls Z., Lane T. P., Schofield R. (2018). Cloud, precipitation and radiation responses to large perturbations in global dimethyl sulfide. Atmospheric Chem. Phys. 18 (14), 10177–10198. doi: 10.5194/acp-18-10177-2018
Fiddes S. L., Woodhouse M. T., Utembe S., Schofield R., Alexander S. P., Alroe J., et al. (2022). The contribution of coral-reef-derived dimethyl sulfide to aerosol burden over the Great Barrier Reef: A modelling study. Atmospheric Chem. Phys. 22 (4), 2419–2445. doi: 10.5194/acp-22-2419-2022
Fischer E., Jones G. B. (2012). Atmospheric dimethysulphide production from corals in the Great Barrier Reef and links to solar radiation, climate and coral bleaching. Biogeochemistry 110 (1), 31–46. doi: 10.1007/s10533-012-9719-y
Fricko O., Havlik P., Rogelj J., Klimont Z., Gusti M., Johnson N., et al. (2017). The marker quantification of the shared socioeconomic pathway 2: A middle-of-the-road scenario for the 21st century. Global Environ. Change 42, 251–267. doi: 10.1016/j.gloenvcha.2016.06.004
Gabric A. J., Matrai P. A., Jones G. B., Middleton J. (2018). The nexus between sea ice and polar emissions of marine biogenic aerosols. Bull. Am. Meteorological Soc. 99 (1), 61–81. doi: 10.1175/BAMS-D-16-0254.1
Gabric A. J., Matrai P. A., Kiene R. P., Cropp R. A., Dacey J. W. H., DiTullio G. R., et al. (2008). Factors determining the vertical profile of dimethylsulfide in the Sargasso Sea during summer. Deep Sea Res. Part II: Topical Stud. Oceanography 55 (10–13), 1505–1518. doi: 10.1016/j.dsr2.2008.02.002
Gabric A. J., Qu B., Rotstayn L., Shephard J. M. (2013). Global simulations of the impact on contemporary climate of a perturbation to the sea-to-air flux of dimethylsulfide. Aust. Meteorological Oceanographic J. 63 (3), 365–376.
Galí M., Lizotte M., Kieber D. J., Randelhoff A., Hussherr R., Xue L., et al. (2021). DMS emissions from the Arctic marginal ice zone. Elementa: Sci. Anthroposcene 9 (1), 113. doi: 10.1525/elementa.2020.00113
Galí M., Simó R., Vila-Costa M., Ruiz-González C., Gasol J. M., Matrai P. (2013). Diel patterns of oceanic dimethylsulfide (DMS) cycling: Microbial and physical drivers. Global Biogeochemical Cycles 27 (3), 620–636. doi: 10.1002/gbc.20047
Gardner S. G., Nielsen D. A., Laczka O., Shimmon R., Beltran V. H., Ralph P. J., et al. (2016). Dimethylsulfoniopropionate, superoxide dismutase and glutathione as stress response indicators in three corals under short-term hyposalinity stress. Proc. R. Soc. B: Biol. Sci. 283 (1824), 20152418. doi: 10.1098/rspb.2015.2418
Gidden M. J., Riahi K., Smith S. J., Fujimori S., Luderer G., Kriegler E., et al. (2019). Global emissions pathways under different socioeconomic scenarios for use in CMIP6: a dataset of harmonized emissions trajectories through the end of the century. Geoscientific Model. Dev. 12 (4), 1443–1475. doi: 10.5194/gmd-12-1443-2019
Gorbunov M. Y., Kolber Z. S., Lesser M. P., Falkowski P. G. (2001). Photosynthesis and photoprotection in symbiotic corals. Limnology Oceanography 46 (1), 75–85. doi: 10.4319/lo.2001.46.1.0075
Hodshire A. L., Campuzano-Jost P., Kodros J. K., Croft B., Nault B. A., Schroder J. C., et al. (2019). The potential role of methanesulfonic acid (MSA) in aerosol formation and growth and the associated radiative forcings. Atmospheric Chem. Phys. 19 (5), 3137–3160. doi: 10.5194/acp-19-3137-2019
Hopkins F. E., Archer S. (2014). Consistent increase in dimethyl sulfide (DMS) in response to high CO2 in five shipboard bioassays from contrasting NW European waters. Biogeosciences 11 (18), 4925–4940. doi: 10.5194/bg-11/4925-2014
Hopkins F. E., Bell T. G., Yang M., Suggett D. J., Steinke M. (2016). Air exposure of coral is a significant source of dimethylsulfide (DMS) to the atmosphere. Sci. Rep. 6 (1), 1–11. doi: 10.1038/srep36031
Hopkins F. E., Nightingale P. D., Stephens J. A., Moore C. M., Richier S., Cripps G. L., et al. (2020). A meta-analysis of microcosm experiments shows that dimethyl sulfide (DMS) production in polar waters is insensitive to ocean acidification. Biogeosciences 17 (1), 163–186. doi: 10.5194/bg-17-163-2020
Howell T. A., Meek D. W., Hatfield J. L. (1983). Relationship of photosynthetically active radiation to shortwave radiation in the San Joaquin valley. Agric. Meteorology 28 (2), 157–175. doi: 10.1016/0002-1571(83)90005-5
Hughes T. P., Kerry J. T., Baird A. H., Connolly S. R., Chase T. J., Dietzel A., et al. (2019). Global warming impairs stock–recruitment dynamics of corals. Nature 568 (7752), 387–390. doi: 10.1038/s41586-019-1081-y
Hughes T. P., Kerry J. T., Baird A. H., Connolly S. R., Dietzel A., Eakin C. M., et al. (2018). Global warming transforms coral reef assemblages. Nature 556 (7702), 492–496. doi: 10.1038/s41586-018-0041-2
Jackson R. L., Gabric A. J., Cropp R. A., Woodhouse M. T. (2020). Dimethylsulfide (DMS), marine biogenic aerosols and the ecophysiology of coral reefs. Biogeosciences 17 (8), 2181–2204. doi: 10.5194/bg-17-2181-2020
Jackson R. L., Gabric A. J., Matrai P. A., Woodhouse M. T., Cropp R. A., Jones G. B., et al. (2021). Parameterizing the impact of seawater temperature and irradiance on dimethylsulfide (DMS) in the Great Barrier Reef and the contribution of coral reefs to the global sulfur cycle. J. Geophysical Research: Oceans 126 (3), e2020JC016783. doi: 10.1029/2020JC016783
Jones G. B. (2015). “The reef sulphur cycle: Influence on climate and ecosystem services,” In Narchi N., Price L. (Eds.), Ethnobiology of corals and coral reefs (Denmark: Springer), 27–57. doi: 10.1007/978-3-319-23763-3_3
Jones G. B., Curran M., Broadbent A., King S., Fischer E., Jones R. (2007). Factors affecting the cycling of dimethylsulfide and dimethylsulfoniopropionate in coral reef waters of the Great Barrier Reef. Environ. Chem. 4 (5), 310–322. doi: 10.1071/EN06065
Jones G. B., Curran M., Deschaseaux E. S. M., Omori Y., Tanimoto H., Swan H. B., et al. (2018). The flux and emission of dimethylsulfide from the Great Barrier Reef region and potential influence on the climate of NE Australia. J. Geophysical Research: Atmospheres 123 (24), 13835–13856. doi: 10.1029/2018JD029210
Jones G. B., Curran M., Swan H. B., Deschaseaux E. S. M. (2017). Dimethylsulfide and coral bleaching: Links to solar radiation, low level cloud and the regulation of seawater temperatures and climate in the Great Barrier Reef. Am. J. Climate Change 6 (02), 328. doi: 10.4236/ajcc.2017.62017
Jones R., Hoegh-Guldberg O., Larkum A. W. D., Schreiber U. (2002). Temperature-induced bleaching of corals begins with impairment of the CO2 fixation mechanism in zooxanthellae. Plant Cell Environ. 21 (12), 1219–1230. doi: 10.1046/j.1365-3040.1998.00345.x
Jones G. B., King S. (2015). Dimethylsulphoniopropionate (DMSP) as an indicator of bleaching tolerance in scleractinian corals. J. Mar. Sci. Eng. 3 (2), 444–465. doi: 10.3390/jmse3020444
Jones R., Ward S., Amri A. Y., Hoegh-Guldberg O. (2000). Changes in quantum efficiency of photosystem II of symbiotic dinoflagellates of corals after heat stress, and of bleached corals sampled after the 1998 Great Barrier Reef mass bleaching event. Mar. Freshw. Res. 51 (1), 63–71. doi: 10.1071/MF99100
Kettle A. J., Andreae M. O. (2000). Flux of dimethylsulfide from the oceans: A comparison of updated data sets and flux models. J. Geophysical Research: Atmospheres 105 (D22), 26793–26808. doi: 10.1029/2000JD900252
Kondo J. (1975). Air-sea bulk transfer coefficients in diabatic conditions. Boundary-Layer Meteorology 9 (1), 91–112. doi: 10.1007/BF00232256
Korhonen H., Carslaw K. S., Spracklen D. V., Mann G. W., Woodhouse M. T. (2008). Influence of oceanic dimethyl sulfide emissions on cloud condensation nuclei concentrations and seasonality over the remote southern hemisphere oceans: A global model study. J. Geophysical Res.: Atmospheres 113 (D15), D15204. doi: 10.1029/2007JD009718
Kriegler E., Bauer N., Popp A., Humpenöder F., Leimbach M., Strefler J., et al. (2017). Fossil-fueled development (SSP5): an energy and resource intensive scenario for the 21st century. Global Environ. Change 42, 297–315. doi: 10.1016/j.gloenvcha.2016.05.015
Kwiatkowski L., Cox P., Halloran P. R., Mumby P. J., Wiltshire A. J. (2015). Coral bleaching under unconventional scenarios of climate warming and ocean acidification. Nat. Climate Change 5 (8), 777–781. doi: 10.1038/nclimate2655
Lana A., Bell T. G., Simó R., Vallina S. M., Ballabrera-Poy J., Kettle A. J., et al. (2011). An updated climatology of surface dimethlysulfide concentrations and emission fluxes in the global ocean. Global Biogeochemical Cycles 25 (1), GB1004. doi: 10.1029/2010GB003850
Land P. E., Shutler J. D., Bell T. G., Yang M. (2014). Exploiting satellite earth observation to quantify current global oceanic DMS flux and its future climate sensitivity. J. Geophysical Research: Oceans 119 (11), 7725–7740. doi: 10.1002/2014JC010104
Lesser M. P. (2011). “Coral bleaching: causes and mechanisms,” in Coral reefs: An ecosystem in transition. (Dordrecht: Springer), 405–419.
Liss P. S., Merlivat L. (1986). “Air-sea gas exchange rates: Introduction and synthesis,” in The role of air-sea exchange in geochemical cycling. (Dordrecht: Springer) 113–127. doi: 10.1007/978-94-009-4738-2_5
Liss P. S., Slater P. G. (1974). Flux of gases across the air-sea interface. Nature 247 (5438), 181–184.
Liu G., Strong A. E., Skirving W., Arzayus L. F. (2006). Overview of NOAA coral reef watch program’s near-real time satellite global coral bleaching monitoring activities. Proc. 10th Int. Coral Reef Symposium 1793, 1783–1793.
Mayer K. J., Wang X., Santander M. V., Mitts B. A., Sauer J. S., Sultana C. M., et al. (2020). Secondary marine aerosol plays a dominant role over primary sea spray aerosol in cloud formation. ACS Cent. Sci. 6 (12), 2259–2266. doi: 10.1021/acscentsci.0c00793
McCook L. J., Diaz-Pulido G. (2002). The fate of bleached corals: patterns and dynamics of algal recruitment. Mar. Ecol. Prog. Ser. 232, 115–128. doi: 10.3354/meps232115
McGillis W. R., Dacey J. W. H., Frew N. M., Bock E. J., Nelson R. K. (2000). Water-air flux of dimethylsulfide. J. Geophysical Research: Oceans 105 (C1), 1187–1193. doi: 10.1029/1999JC900243
Melis A. (1999). Photosystem-II damage and repair cycle in chloroplasts: what modulates the rate of photodamage in vivo? Trends Plant Sci. 4 (4), 130–135. doi: 10.1016/S1360-1385(99)01387-4
Modini R. L., Ristovski Z. D., Johnson G. R., He C., Surawski N., Morawska L., et al. (2009). New particle formation and growth at a remote, sub-tropical coastal location. Atmospheric Chem. Phys. 9 (19), 7607–7621. doi: 10.5194/acp-9-7607-2009
Moss R. H., Edmonds J. A., Hibbard K. A., Manning M. R., Rose S. K., Van Vuuren D. P., et al. (2010). The next generation of scenarios for climate change research and assessment. Nature 463 (7282), 747–756. doi: 10.1038/nature08823
Nightingale P. D., Malin G., Law C. S., Watson A. J., Liss P. S., Liddicoat M. I., et al. (2000). In situ evaluation of air-sea gas exchange parameterizations using novel conservative and volatile tracers. Global Biogeochemical Cycles 14 (1), 373–387. doi: 10.1029/1999GB900091
Przyjazny A. W., Janicki W., Chrzanowski W., Staszewki R. (1983). Headspace gas chromatogroahpic determination coefficients of selected organosulphur compounds and their dependence of some parameters. J. Chromatogr. 280, 249–260. doi: 10.1016/S0021-9673(00)91567-X
Raina J. B., Tapiolas D. M., Forêt S., Lutz A., Abrego D., Ceh J., et al. (2013). DMSP biosynthesis by an animal and its role in coral thermal stress response. Nature 502 (7473), 677–680. doi: 10.1038/nature12677
Raina J. B., Tapiolas D., Willis B. L., Bourne D. G. (2009). Coral-associated bacteria and their role in the biogeochemical cycling of sulfur. Appl. Environ. Microbiol. 75 (11), 3492–3501. doi: 10.1128/AEM.02567-08
Saltzman E. S., King D. B., Holmen K., Leck C. (1993). Experimental determination of the diffusion coefficient of dimethylsulfide in water. J. Geophysical Research: Oceans 98 (C9), 16481–16486. doi: 10.1029/93JC01858
Sanborn K. L., Webster J. M., Webb G. E., Braga J. C., Humblet M., Nothdurft L., et al. (2020). A new model of Holocene reef initiation and growth in response to sea-level rise on the southern Great Barrier Reef. Sediment. Geo. 397, 105556. doi: 10.1016/j.sedgeo.2019.105556
Sanchez K. J., Chen C.-L., Russell L. M., Betha R., Liu J., Price D. J., et al. (2018). Substantial seasonal contribution of observed biogenic sulfate particles to cloud condensation nuclei. Sci. Rep. 8 (1), 1–14. doi: 10.1038/s41598-018-21590-9
Schneider T., Kaul C. M., Pressel K. G. (2019). Possible climate transitions from breakup of stratocumulus decks under greenhouse warming. Nat. Geosci. 12 (3), 163–167. doi: 10.1038/s41561-019-0310-1
Schwarzenbach R. P., Gschwend P. M., Imboden D. M. (2005). Environmental organic chemistry (New York: John Wiley & Sons).
Skirving W., Enríquez S., Hedley J. D., Dove S., Eakin C. M., Mason R. A. B., et al. (2018). Remote sensing of coral bleaching using temperature and light: progress towards an operational algorithm. Remote Sens. 10 (1), 18. doi: 10.3390/rs10010018
Spiese C. E., Kieber D. J., Nomura C. T., Kiene R. P. (2009). Reduction of dimethylsulfoxide to dimethylsulfide by marine phytoplankton. Limnology Oceanography 54 (2), 560–570. doi: 10.4319/lo.2009.54.2.0560
Sunda W., Kieber D. J., Kiene R. P., Huntsman S. (2002). An antioxidant function for DMSP and DMS in marine algae. Nature 418 (6895), 317–320. doi: 10.1038/nature00851
Swan H. B., Jones G. B., Deschaseaux E. S. M., Eyre B. D. (2017). Coral reef origins of atmospheric dimethylsulfide at heron island, southern Great Barrier Reef, Australia. Biogeosciences 14 (1), 229–239. doi: 10.5194/bg-14-229-2017
Van Oppen M. J. H., Oliver J. K., Putnam H. M., Gates R. D. (2015). Building coral reef resilience through assisted evolution. Proc. Natl. Acad. Sci. 112 (8), 2307–2313. doi: 10.1073/pnas.1422301112
Veres P. R., Neuman J. A., Bertram T. H., Assaf E., Wolfe G. M., Williamson C. J., et al. (2020). Global airborne sampling reveals a previously unobserved dimethyl sulfide oxidation mechanism in the marine atmosphere. Proc. Natl. Acad. Sci. 117 (9), 4505–4510. doi: 10.1073/pnas.1919344117
Vlahos P., Monahan E. C. (2009). A generalized model for the air-sea transfer of dimethyl sulfide at high wind speeds. Geophysical Res. Lett. 36 (21), L21605. doi: 10.1029/2009GL040695
Walters D., Baran A. J., Boutle I., Brooks M., Earnshaw P., Edwards J., et al. (2019). The met office unified model global atmosphere 7.0/7.1 and JULES global land 7.0 configurations. Geoscientific Model. Dev. 12 (5), 1909–1963. doi: 10.5194/gmd-12-1909-2019
Wang M., Son S., Harding L. W. Jr. (2009). Retrieval of diffuse attenuation coefficient in the Chesapeake bay and turbid ocean regions for satellite ocean color applications. J. Geophysical Research: Oceans 114 (C10), C10011. doi: 10.1029/2009JC005286
Webb A. L., van Leeuwe M. A., den Os D., Meredith M. P., Venables H. J., Stefels J. (2019). Extreme spikes in DMS flux double estimates of biogenic sulfur export from the Antarctic coastal zone to the atmosphere. Sci. Rep. 9 (2233), 2233. doi: 10.1038/s41598-019-38714-4
Weis V. M. (2008). Cellular mechanisms of cnidarian bleaching: stress causes the collapse of symbiosis. J. Exp. Biol. 211 (19), 3059–3066. doi: 10.1242/jeb.009597
Widlansky M. J., Timmermann A., Cai W. (2015). Future extreme sea level seesaws in the tropical pacific. Sci. Adv. 1 (8), e1500560. doi: 10.1126/sciadv.1500560
Winters G., Loya Y., Röttgers R., Beer S. (2003). Photoinhibition in shallow-water colonies of the coral stylophora pistillata as measured in situ. Limnology Oceanography 48 (4), 1388–1393. doi: 10.4319/lo.2003.48.4.1388
Woodhouse M. T., Carslaw K. S., Mann G. W., Vallina S. M., Vogt M., Halloran P. R., et al. (2010). Low sensitivity of cloud condensation nuclei to changes in the sea-air flux of dimethyl-sulphide. Atmospheric Chem. Phys. 10 (16), 7545–7559. doi: 10.5194/acp-10-7545-2010
Woodhouse M. T., Mann G. W., Carslaw K. S., Boucher O. (2013). Sensitivity of cloud condensation nuclei to regional changes in dimethyl-sulphide emissions. Atmospheric Chem. Phys. 13 (5), 2723–2733. doi: 10.5194/acp-13-2723-2013
Yakovleva I. M., Baird A. H., Yamamoto H. H., Bhagooli R., Nonaka M., Hidaka M. (2009). Algal symbionts increase oxidative damage and death in coral larvae at high temperatures. Mar. Ecol. Prog. Ser. 378, 105–112. doi: 10.3354/meps07857
Yang M., Blomquist B. W., Fairall C. W., Archer S. D., Huebert B. J. (2011). Air-sea exchange of dimethylsulfide in the southern ocean: Measurements from SO GasEx compared to temperate and tropical regions. J. Geophysical Res. Oceans 116 (C4), C00F05. doi: 10.1029/2010JC006526
Zhang Z., Jones A., Crabbe M. J. C. (2017). Impacts of stratospheric aerosol geoengineering strategy on Caribbean coral reefs. Int. J. Climate Change Strategies Manage 10 (4), 523–532. doi: 10.1108/IJCCSM-05-2017-0104
Ziehn T., Chamberlain M. A., Law R. M., Lenton A., Bodman R. W., Dix M., et al. (2020). The Australian earth system model: ACCESS-ESM1. 5. J. South. Hemisphere Earth Syst. Sci. 70 (1), 193–214. doi: 10.1071/ES19035
Keywords: coral reef, dimethylsulfide (DMS), sea surface temperature, climate change, CMIP6
Citation: Jackson RL, Woodhouse MT, Gabric AJ and Cropp RA (2022) CMIP6 projections of ocean warming and the impact on dimethylsulfide emissions from the Great Barrier Reef, Australia. Front. Mar. Sci. 9:910420. doi: 10.3389/fmars.2022.910420
Received: 01 April 2022; Accepted: 31 August 2022;
Published: 29 September 2022.
Edited by:
Rafel Simó, Institut de Ciències del Mar (ICM-CSIC), SpainReviewed by:
Hakase Hayashida, Japan Agency for Marine-Earth Science and Technology, JapanTereza Jarnikova, University of East Anglia, United Kingdom
Copyright © 2022 Jackson, Woodhouse, Gabric and Cropp. This is an open-access article distributed under the terms of the Creative Commons Attribution License (CC BY). The use, distribution or reproduction in other forums is permitted, provided the original author(s) and the copyright owner(s) are credited and that the original publication in this journal is cited, in accordance with accepted academic practice. No use, distribution or reproduction is permitted which does not comply with these terms.
*Correspondence: Rebecca L. Jackson, cmViZWNjYS5qYWNrc29uQGNzaXJvLmF1
†Present address: Rebecca L. Jackson, Coasts and Ocean Research, Oceans and Atmosphere, Commonwealth Scientific and Industrial Research Organisation, Canberra, ACT, Australia