 Franz Philip Tuchen1,2*
 Peter Brandt1,3*
 Johannes Hahn4
 Rebecca Hummels1
 Gerd Krahmann1
 Bernard Bourlès5
 Christine Provost6
 Michael J. McPhaden7
 John M. Toole8
- 1GEOMAR Helmholtz Centre for Ocean Research Kiel, Kiel, Germany
- 2NOAA/Atlantic Oceanographic and Meteorological Laboratory, Miami, FL, United States
- 3Faculty of Mathematics and Natural Sciences, Kiel University, Kiel, Germany
- 4Federal Maritime and Hydrographic Agency, Hamburg, Germany
- 5Centre IRD de Bretagne, IMAGO, Technopole Pointe du Diable, Plouzané, France
- 6Laboratoire LOCEAN-IPSL, Sorbonne Université, Paris, France
- 7NOAA/Pacific Marine Environmental Laboratory, Seattle, WA, United States
- 8Woods Hole Oceanographic Institution, Woods Hole, MA, United States
Introduction
Regional climate variability in the tropical Atlantic, from interannual to decadal time scales, is inevitably connected to changes in the strength and position of the individual components of the tropical current system with impacts on societally relevant climate hazards such as anomalous rainfall or droughts over the surrounding continents (Bourlès et al., 2019; Foltz et al., 2019). Furthermore, the lateral supply of dissolved oxygen in the tropical Atlantic upper-ocean is closely linked to the zonal current bands (Brandt et al., 2008; Brandt et al., 2012; Burmeister et al., 2020) and especially to the Equatorial Undercurrent (EUC) and its long-term variations with potential implications for regional marine ecosystems (Brandt et al., 2021). The eastward flowing EUC is located between 70 to 200 m depth and forms one of the strongest tropical currents with maximum velocities of up to 1 m s-1 and maximum variability on seasonal time scales (Brandt et al., 2014; Johns et al., 2014). In the intermediate to deep equatorial Atlantic, variability on longer time scales is mainly governed by alternating, vertically-stacked, zonal currents (equatorial deep jets (EDJs); Johnson and Zhang, 2003). At a fixed location, the phases of these jets are propagating downward with time, implying that parts of their energy must propagate upward towards the surface (Brandt et al., 2011). In fact, a pronounced interannual cycle of about 4.5 years, that is associated with EDJs, is projected onto surface parameters such as sea surface temperature or precipitation (Brandt et al., 2011) further demonstrating the importance of understanding equatorial circulation variability and its role in tropical climate variability.
While variability in the zonal velocity component on the equator is focused on seasonal to interannual time scales (Brandt et al., 2016; Claus et al., 2016; Kopte et al., 2018), meridional velocity fluctuations dominate the intraseasonal period range (20 to 50 days) due to the presence and passage of westward propagating Tropical Instability Waves (TIWs; Grodsky et al., 2005; Bunge et al., 2007; Wenegrat and McPhaden, 2015; Tuchen et al., 2018; Specht et al., 2021). In general, intraseasonal variability in the central equatorial Atlantic is mainly attributed to TIWs in the upper ocean (Athie and Marin, 2008), while intraseasonal variability in the deep ocean is associated with the signature of equatorial Yanai waves (Ascani et al., 2015; Tuchen et al., 2018, Körner et al., 2022). The observed and modelled interaction between intraseasonal equatorial waves and the aforementioned EDJs was found to maintain the deep equatorial circulation against dissipation (Greatbatch et al., 2018; Bastin et al., 2020) pointing toward the importance of intraseasonal variability for equatorial ocean dynamics.
These findings are largely based on, or underpinned by a unique and steadily expanding data set of current velocity observations in the central equatorial Atlantic Ocean. Since 2001, current velocities have been measured almost continuously as part of a multilateral collaboration, the Prediction and Research Moored Array in the Tropical Atlantic (PIRATA), that regularly services a moored observatory located at 0°N/23°W (Bourlès et al., 2019). The significance of this data set is characterized by the length of the time series and by the full-depth coverage of current velocity observations which allow for a detailed analysis of both upper-ocean and deep-ocean dynamics on a wide range of time scales and frequencies. For instance, it enables the decomposition of the current velocity time series into vertical modes pointing toward the existence of resonant basin modes and identifying different sources of deep intraseasonal variability (Brandt et al., 2016; Claus et al., 2016; Greatbatch et al., 2018; Tuchen et al., 2018; Körner et al., 2022).
Here, we present 20 years of full-depth current velocity observations at 0°N/23°W. The aim of this study is to provide the scientific community with a publicly available reference data set that could be used in manifold ways, including, for instance, the validation of ocean models or reanalysis products.
Data and Methods
Moored Observatory Design
The 0°N/23°W moored observatory consists of a moored surface buoy, as part of the multilaterally-operated PIRATA array that was initiated in 1997 (Servain et al., 1998; Bourlès et al., 2008; Bourlès et al., 2019) and, within a few nautical miles of this mooring, a subsurface mooring that underwent several changes of design since its first deployment in 2001. To date, a total of 13 mostly successive subsurface moorings have been deployed and recovered between December 2001 and July 2021 (Table 1). From December 2001 to June 2006, current velocity measurements were acquired by the subsurface mooring as part of the French contribution to PIRATA. Since June 2006, after a total of three mooring periods (see Table 1), the existing subsurface mooring has been continued by GEOMAR. While the shallow acoustic Doppler current profiler (ADCP) remained a part of the PIRATA program, all other instrumentation has since been provided by GEOMAR. Additional current velocity data were acquired at the PIRATA surface buoy to which a current meter is attached at a depth of 10 to 12 m since 2005, as well as a downward-looking ADCP between 2008 to 2009 located just below the surface (Wenegrat et al., 2014; Wenegrat and McPhaden, 2015). The combined data set presented here is a combination of all available measurements from the subsurface mooring and the PIRATA moored surface buoy in close proximity to it.
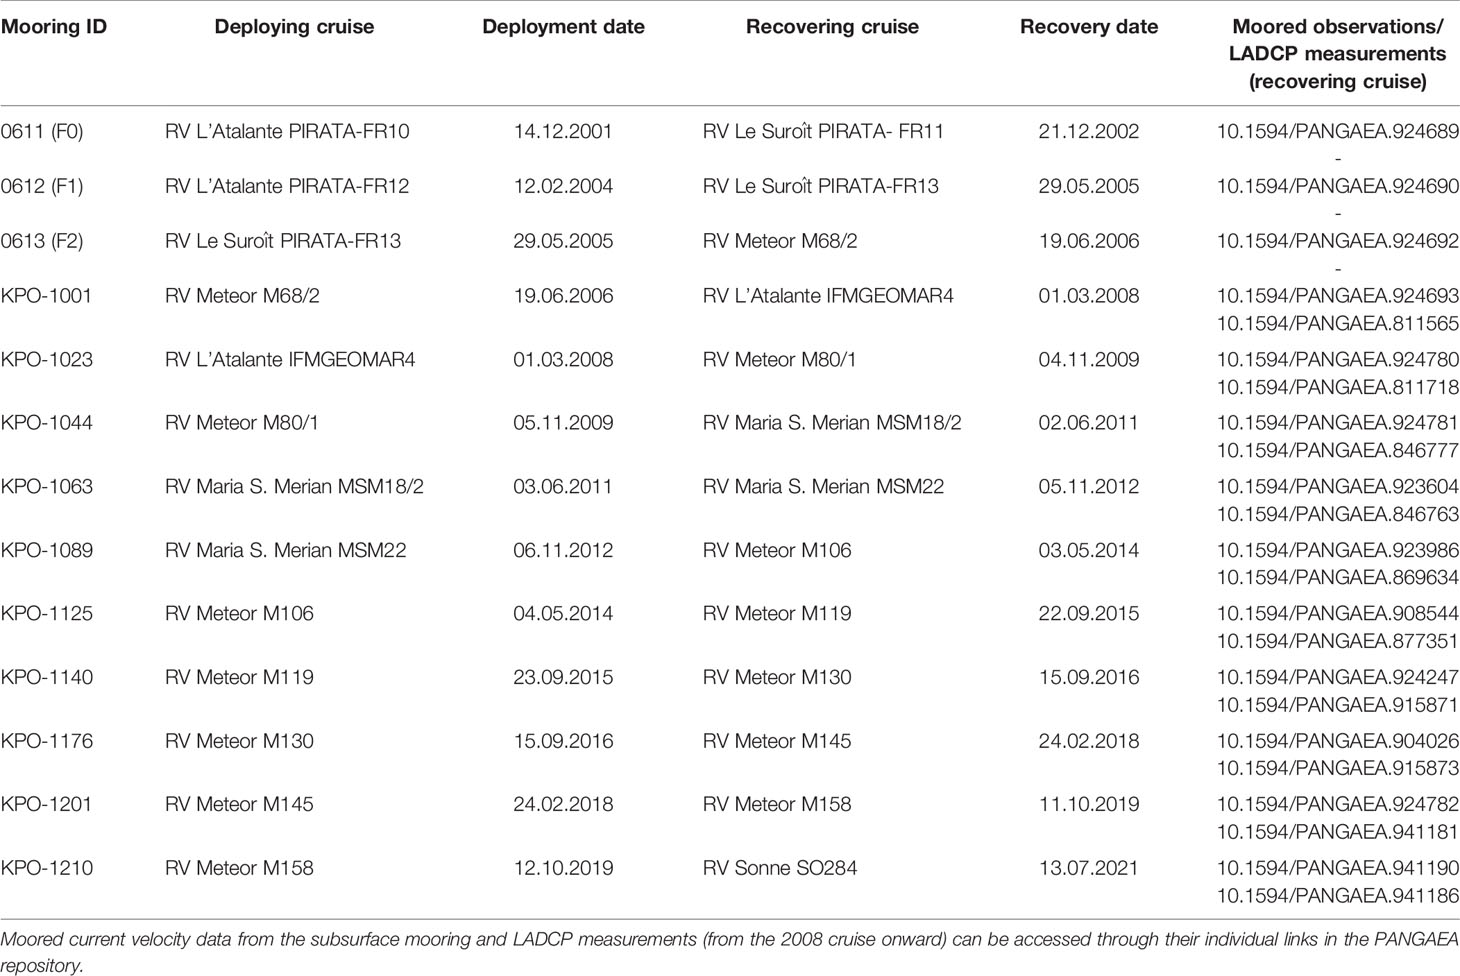
Table 1 List of the subsurface moorings at 0°N, 23°W as well as the deploying and recovering research cruises, and the start and end dates of the individual mooring periods.
The general design of the subsurface mooring consists of current velocity measurements from moored ADCPs covering the upper 500 to 900 m of the water column and, since 2006, from a McLane moored profiler (MMP) covering depths between 1000 to 3500 m (since September 2016: 850 to 3350 m). These two main components of the subsurface mooring are complemented by current meters in between the vertical range of the ADCP and the MMP or, since September 2016, below the lower end of the MMP range. In addition, lowered ADCP (LADCP) profiles, carried out during the mooring service cruises, were included in the presented data set.
In the following, we provide a brief description of these individual mooring components. A more detailed assessment of the processing methods of the individual instruments is beyond the scope of this data report.
Moored ADCP Measurements
Upper-ocean current velocity data were mainly acquired by moored ADCPs. From December 2001 to December 2002 an upward-looking 300-kHz ADCP was installed at about 150 m. After a gap of 14 months, the subsurface mooring was re-established in February 2004 with the deployment of two ADCPs: one upward-looking 300-kHz ADCP located at a nominal depth of about 90 m and one downward-looking 75-kHz ADCP at a nominal depth of about 110 m. During the following mooring period from 2005 to 2006 this setup did not change, but the nominal depths were adjusted to about 50 m and 60 m, respectively. The first two moorings operated by GEOMAR included one 150-kHz and one 75-kHz upward-looking ADCP located at about 130 m (200 m) and 620 m (700 m) between 2006 to 2008 (2008 to 2009). The upper ADCP of the mooring period between 2008 to 2009 was later identified by the manufacturer to have electronic problems and could not be used after an evaluation of the data records. Unfortunately, the very same ADCP was also installed between 2004 to 2005. Therefore, data from the shallow ADCP during both mooring periods were excluded. In 2009, the design has been changed to include one upward-looking 150-kHz ADCP monitoring the full EUC depth range and one downward-looking 75-kHz ADCP monitoring the intermediate levels. Both ADCPs have been installed at a depth of about 210 to 220 m, separated only by a few meters along the mooring cable.
The depth resolution of the ADCPs is defined by vertical bins prior to the mooring deployment in the instrument settings. The extent of these vertical bins was generally set to 8 m for the upward-looking and to 8 or 16 m for the downward-looking ADCP. While velocities were not corrected during processing, the bin depths were corrected by applying a climatological sound speed profile for the instrument’s geographical position (Krahmann et al., 2021). Post-processed data were interpolated to a vertical resolution of 10 m and current velocities were 40-hour low-pass filtered to remove tidal velocities and then subsampled to a temporal resolution of 12 hours. The vertical gap that occurs between adjacent ADCPs was filled by linear interpolation.
Current velocity data from the upward-looking ADCP of the most recent Kiel Physical Oceanography (KPO) mooring KPO-1210 is still under examination since the instrument compass was found to have not worked properly. Consequently, these data are not included in the data set presented here, but will potentially be included in a future update, once a satisfactory solution is found.
As part of a case study to investigate the transfer of wind momentum across the air-sea interface and the diurnal cycle of the upper ocean, a downward-looking 600-kHz ADCP was attached to the PIRATA moored surface buoy for eight months between October 2008 to June 2009 (Wenegrat et al., 2014; Wenegrat and McPhaden, 2015). This ADCP covered a depth range between about 4 to 35 m with vertical resolution of 0.75 m and hourly temporal resolution. Since data from the upward-looking KPO ADCP is generally limited to data below 20 m due to reflection at the ocean surface, the shallow ADCP provides a valuable addition.
Current Meter Measurements
An efficient way to complement long-range current velocity measurements is the deployment of current meters at discrete depths. The first moorings were usually equipped with three to four mechanical Rotor Current Meters (RCMs) which have been gradually replaced by acoustic current meters such as Argonauts or Aquadopps. Mechanical current meters occasionally failed and are generally more vulnerable to physical obstructions than acoustic current meters. Consequently, since February 2018, only Aquadopps are being installed in the subsurface mooring providing reliable records of horizontal current velocity with a high temporal resolution of 1 or 2 hours. During the first three deployments, current meters were used more extensively to cover depths between 800 to 1500 m (Bunge et al., 2008).
For the final data product, only quality-controlled current meter data were included leading to an exclusion of five RCMs between 2006 to 2014. Analogously to ADCP data, current meter velocities were 40-hour low-pass filtered to remove tidal velocities and then interpolated to a 12-hour temporal resolution. Several current meters were equipped with a pressure sensor. If pressure was recorded, the temporal mean of the pressure time series sets the equivalent depth at which the current meter data were included in the final data product. Otherwise, the nominal depth/pressure was used. Furthermore, current meter data were excluded if they substantially intersected with ADCP data. This was the case for one RCM, three Argonauts, and three Aquadopps all located between 750 to 850 m. In Uncertainty Assessment, we use these overlapping velocity time series to assess the uncertainty of the current velocity measurements.
The same steps of filtering and interpolation have been applied to current meter data from the PIRATA moored surface buoy located at 10 or 12 m from 2005 to the present. Like the shallow PIRATA ADCP data, these data provide a valuable contribution to filling the data gap near the surface where upward-looking ADCP measurements are corrupted due to the strong surface reflection.
MMP Measurements
At 0°N/23°W, the deep ocean is covered by vertical profiles of the McLane moored profiler (MMP). The MMP was first deployed in June 2006 and forms an integral part of the KPO moorings ever since. However, no MMP was installed during mooring deployment KPO-1023 and, unfortunately, during mooring deployment KPO-1063 the instrument failed. Apart from that, the MMP provides an overall good data coverage and improved full-depth coverage in comparison to current meter data as installed before 2006 (see Figure 1).
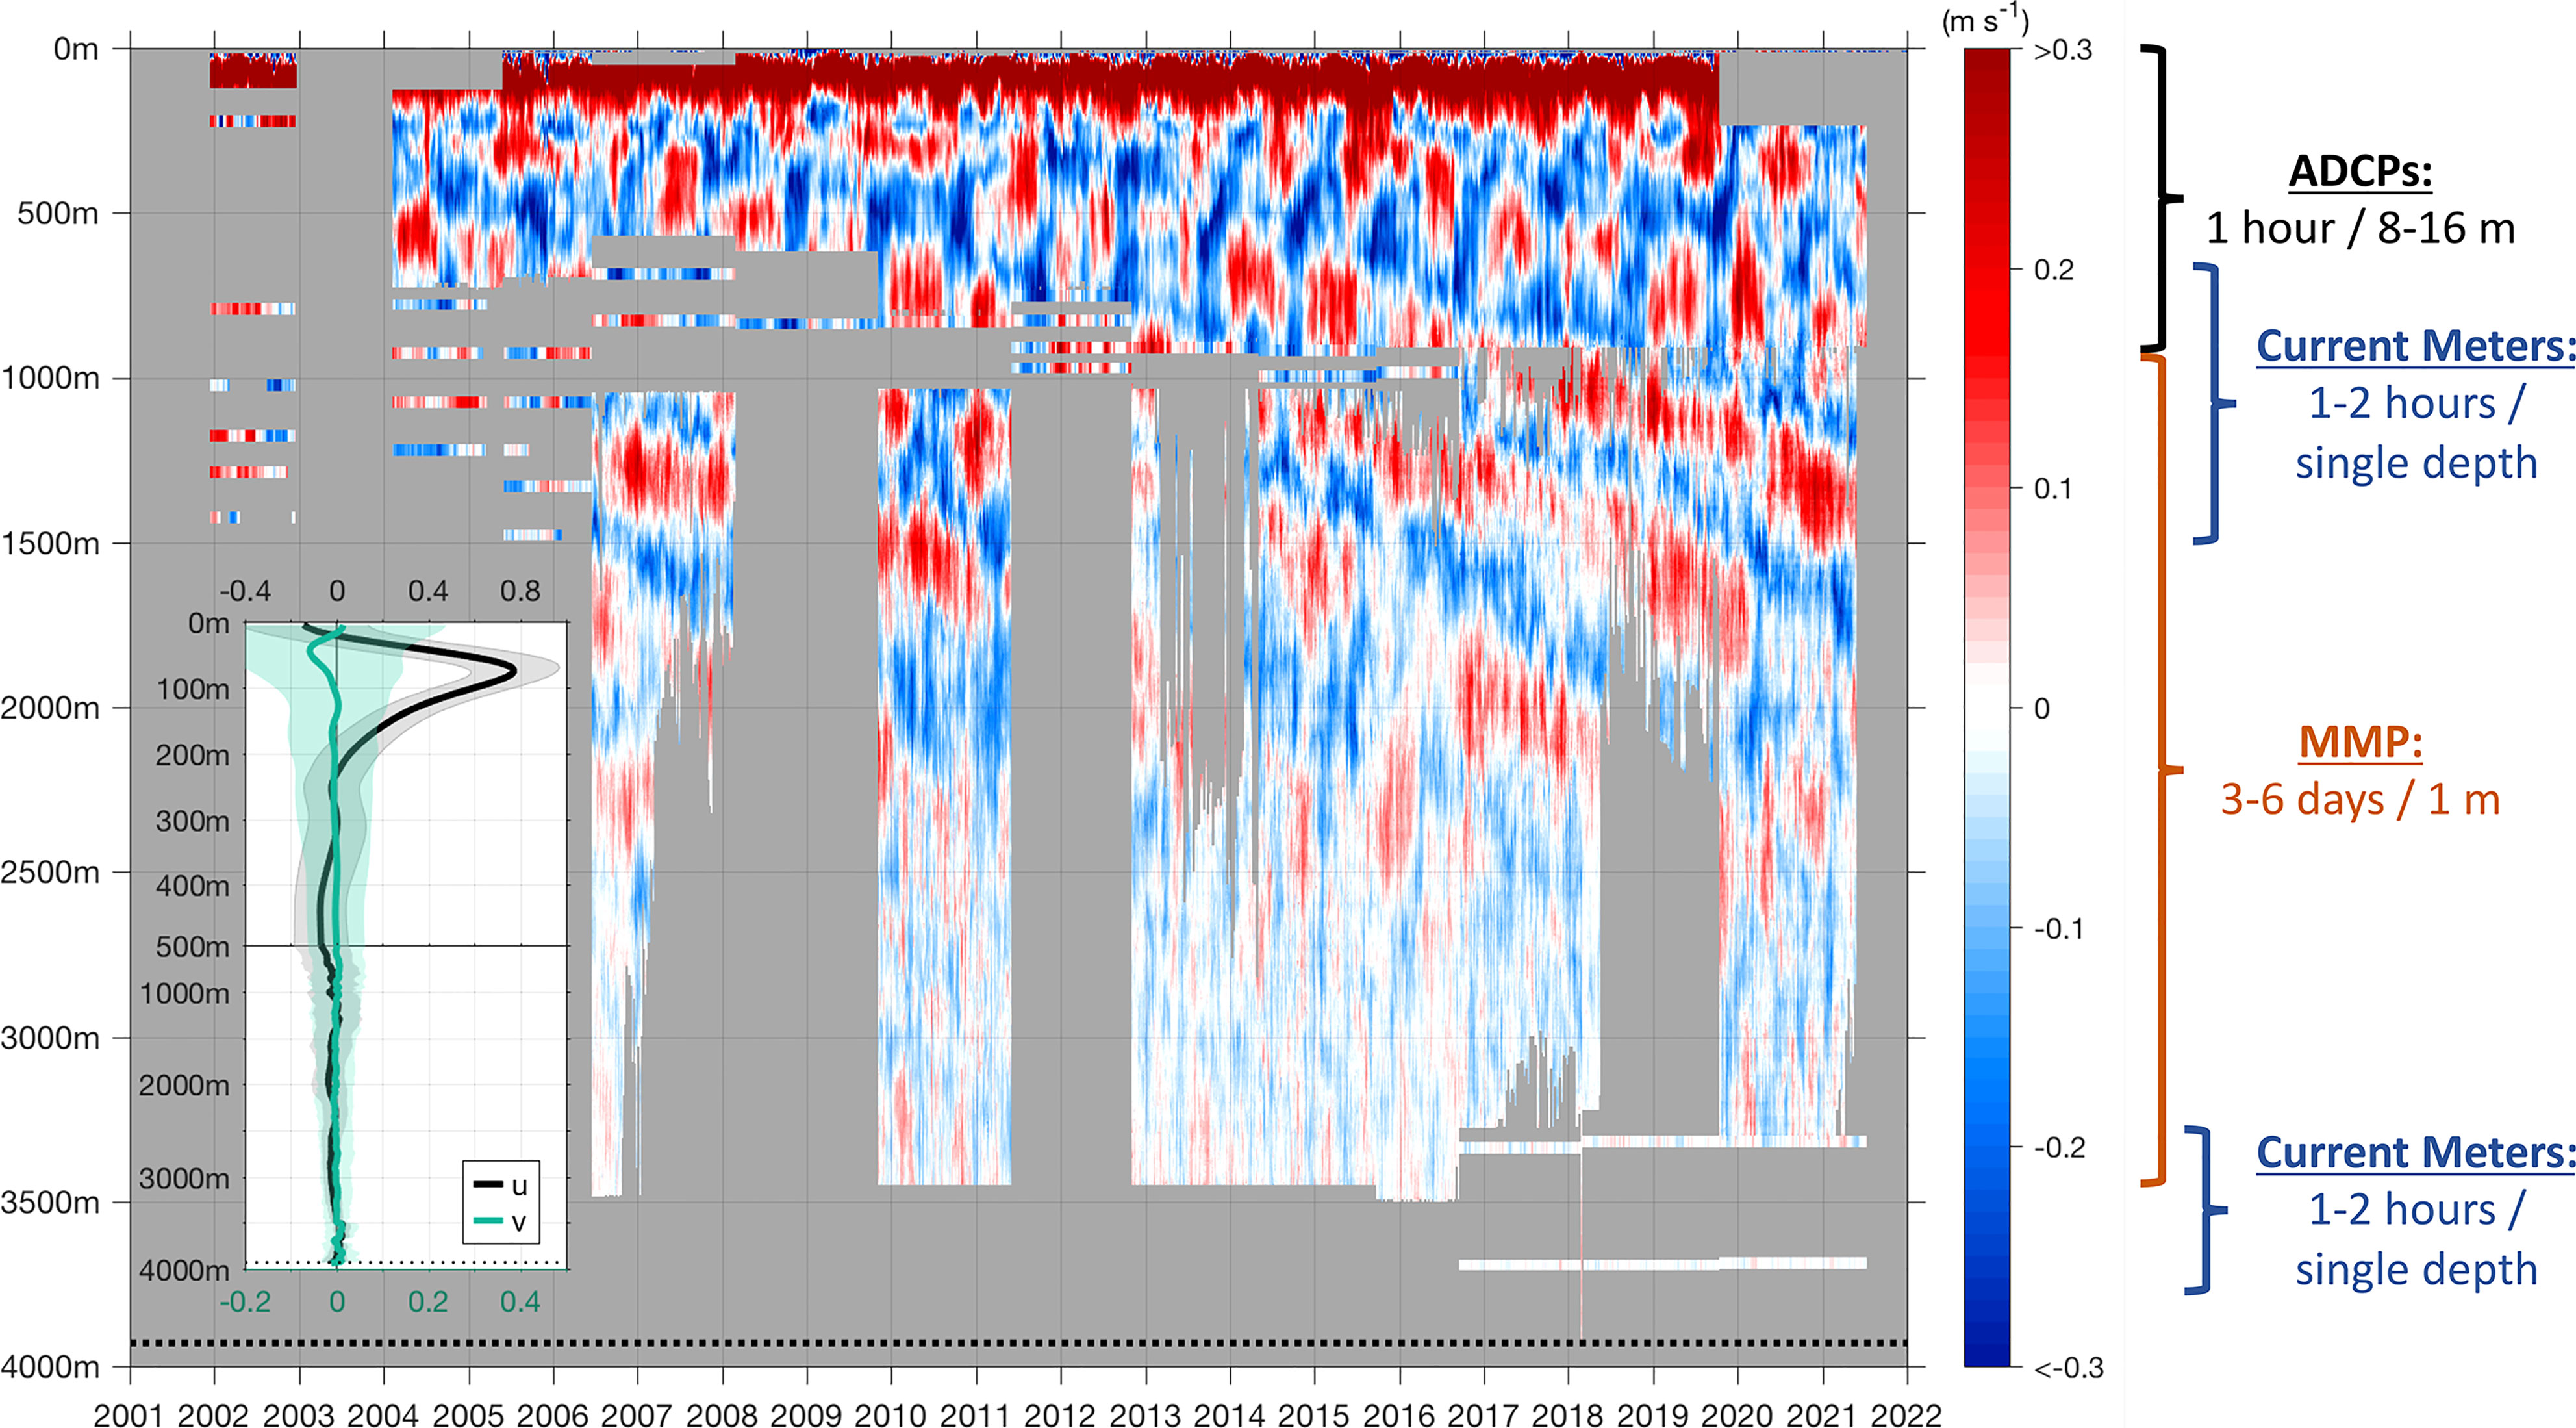
Figure 1 Zonal current velocity time series from the moored observatory at 0°N, 23°W. For reference, the original temporal and vertical resolutions of the different instrument types are indicated on the right side. Current meter data below the ADCP range are stretched ±15 m about the nominal depth of the instrument. Note that the color bar is limited to velocities of up to ±0.3 m s-1 in order to visualize the deep equatorial circulation. The Equatorial Undercurrent (EUC) in the upper 200 m generally exceeds eastward velocities of 0.8 m s-1. Also shown are the vertical mean profiles of zonal (u) and meridional (v) velocity (in m s-1) in the inset (thick lines) and their standard deviation (shaded envelopes). Please note the different axes for zonal velocity (black; top axis) and meridional velocity (green; bottom axis). The dashed lines indicate the water depth at the mooring location at approximately 3930 m.
In general, the MMPs are equipped with an acoustic current meter (ACM) and a conductivity-temperature-depth (CTD) sonde (Doherty et al., 1999). From June 2006 to September 2016, the MMP was installed to measure current velocities between about 1000 to 3500 m. It was then moved up to cover the water column between 850 and 3350 m and to further close the gap between ADCP and MMP measurements. The MMPs were programmed to provide one pair of up- and down-profile every 3 to 6 days depending on the length of the mooring deployment due to battery consumption. With a vertical speed of about 0.20 to 0.25 m s-1, an average profile covering the full range of 2500 m takes about 3 to 4 hours. Considering the sampling frequency of 3 to 4 measurements per second (for CTD and ACM, respectively), the vertical resolution is comparably fine and is averaged onto a 1-dbar vertical grid during processing. After each pair of profiles, the MMP rests for 3 to 6 days. Hence, the temporal resolution is considerably lower when compared to velocity data from moored ADCPs and current meters (see also Combining Current Velocity Measurements).
The processing of the MMP current velocities includes a correction for high-frequency horizontal velocity fluctuations due to instrument vibrations during the up- and downcasts, as well as a correction for the horizontal movement of the instrument during the up- and downcasts that is due to the tilt of the mooring cable that is generally <0.01 m s-1.
LADCP Measurements
The final data product is complemented by 10 full-depth vertical profiles of LADCP measurements carried out during the subsurface mooring service cruises (see Table 1) and another 10 deep LADCP profiles carried out during the annual service cruises of the moored surface buoy (PIRATA-FR-22 to PIRATA-FR-31). LADCP profiles were recorded as part of the CTD casts by attaching an upward-looking and a downward-looking 300-kHz ADCP to the CTD rosette frame. The processing of raw data followed the inverse solution approach developed by Visbeck (2002).
Combining Current Velocity Measurements
The final data product is defined on a grid with 12-hour temporal and 5-dbar vertical resolution. In a first step, ADCP measurements prescribe the time dimension and are interpolated onto the 5-dbar vertical grid. In a second step, pairs of MMP profiles are placed at consecutive time steps of the 12-hour temporal grid since the time difference between the start of up- and down-profiles within one profile pair is 6 hours.
Due to several overlaps of velocity measurements, it is important to state the hierarchy of data chosen at one grid point, if more than one instrument provided data at the same depth and time: ADCP data overwrite current meter data and MMP data. MMP data and current meter data do not overlap as the MMP is bounded by physical stoppers on the mooring cable and current meters are located outside of this range. LADCP data are used when no other velocity data are available.
In a third and final step, linear interpolation in time is applied at each depth of the combined data set to fill temporal gaps of up to 6 days. However, this method is mainly effective at the MMP depth range and used to fill the temporal gaps in between pairs of MMP profiles.
The resulting zonal velocity time series as well as mean vertical profiles of zonal and meridional velocity are presented in Figure 1.
Uncertainty Assessment
For the error of the ADCP measurements, it is assumed that the observed variability of current velocities on seasonal to interannual time scales exceeds the instrument accuracy. The uncertainty that arises due to the compass calibration of the individual moored ADCPs is assumed to be unsystematic (Brandt et al., 2021) and is therefore negligible when addressing research questions on climate relevant time scales covering several mooring periods.
During a total of seven deployments, the ADCP data coverage extended deep enough to overlap with data from the shallowest installed current meter at depths between 750 to 850 m. The overlap is used to assess the uncertainty by comparing these two independent measurements. For five deployments, the cross correlation (r) between the zonal velocity component from ADCP measurements and from current meter data is above r=0.92 demonstrating the coherence between different instruments. The correlation for the meridional velocity component is generally lower, but still exceeds r=0.71. During two deployments (KPO-1125 and KPO-1210), current meter data were partially out of the ADCP range. Although high correlations between the horizontal velocity components are observed for those periods (r>0.9 and r>0.7 for zonal and meridional velocity, respectively), the root mean squared (RMS) differences were significantly higher than during deployments with full overlap. RMS differences during the deployments with full overlap are in the range of 0.02 to 0.04 m s-1 for both velocity components. A comparison between overlapping ADCP and MMP data during KPO-1210 shows good agreement as well (not shown).
As another assessment of uncertainty, the relative compass error between ADCP and current meter observations was derived by rotating the current velocity components of one instrument in such a way that the highest correlation between both current velocity time series was found. Those optimal rotation angles lie within ±3° (corresponding to an uncertainty of about 0.05 m s-1 for a velocity of 1 m s-1) for the five deployments with full overlap.
During the processing of MMP velocities, no compass bias correction was applied. However, in the special case for the equator, it is assumed that the highest standard deviation of a vertical profile occurs in the zonal velocity component due to the high baroclinic structure. Both velocity components are rotated towards the angle of maximum standard deviation in the zonal component. The applied rotation angles were of the order of 3-5° and within the range of typical error estimates of compass angles.
Concluding Remarks
With the presented current velocity data product, we aim to provide an important and accessible reference data set against which models and reanalyses output could be validated. The time series will be helpful for studies focusing on long-term climate variability to search for connections with changes in the equatorial circulation over the last 20 years. Earlier versions of this data product have already been used in a variety of studies and provided a significant contribution to an overall improved understanding of equatorial ocean dynamics. The moored observatory at 0°N/23°W is an ongoing example of a successful multilateral collaboration extending over more than two decades. The authors commit to regularly update the data set after future mooring recoveries of which the next one is scheduled for 2023.
Data Availability Statement
The combined current velocity data set (v1.0) generated for this study (including zonal (U) and meridional (V) current velocity, datenum time (DTIME), julian time (JTIME), pressure (P) and depth (Z), as well as instrument type (IT)) is provided as a NetCDF file. Together with a list of the individual data sets as described in Table 1 it is stored in the PANGAEA data repository under: https://doi.pangaea.de/10.1594/PANGAEA.941042. Future updates of this data set will also be published through the PANGAEA repository and linked to the initial version (v1.0) of the data set presented in this data report with successive version numbering after each mooring recovery. The MATLAB code and detailed instructions how to load, merge, combine and interpolate the individual data sets are provided via zenodo: https://doi.org/10.5281/zenodo.6000560. PIRATA-FR LADCP data and processing protocols are provided by the IRD IMAGO team via: https://www.seanoe.org/data/00601/71295/. PIRATA moored surface buoy current meter data can be accessed via: https://www.pmel.noaa.gov/tao/drupal/disdel/ and high vertical resolution PIRATA ADCP data between October 2008 and June 2009 can be accessed via: www.pmel.noaa.gov/tao/drupal/disdel/adcp_0n23w/index.html.
Author Contributions
FPT and PB conceived the study. FPT wrote the manuscript, handled the MMP data, and produced the final data product and figure. PB acquired project funding and ship time on research cruises to maintain the subsurface mooring. JH, RH, and GK handled the KPO (L)ADCP and current meter data. BB and CP provided PIRATA (L)ADCP and current meter measurements. MM provided additional PIRATA ADCP data. JT developed the MMP processing toolbox and helped with early MMP deployments. All authors contributed to the discussion of the data report, read, and approved the submitted version.
Funding
This study was funded by EU H2020 under grant agreement 817578 TRIATLAS project, by the Deutsche Forschungsgemeinschaft as part of the Sonderforschungsbereich754 “Climate–Biogeochemistry Interactions in the Tropical Ocean” and through several research cruises with RV Meteor, RV Maria S. Merian, RV L'Atalante, and RV Sonne and by the Deutsche Bundesministerium für Bildung und Forschung (BMBF) as part of the projects RACE (03F06518) and by the European Union 7th Framework Programme (FP7) under Grant Agreement 603521. Moored velocity observations were acquired in cooperation with the PIRATA project supported by NOAA (USA), IRD and Meteo-France (France), INPE (Brazil) and the Brazil Navy. This research was performed while FPT held an NRC Research Associateship Award at NOAA’s Atlantic Oceanographic and Meteorological Laboratory. FPT, PB, JH, RH, and GK are grateful for continuing support from GEOMAR Helmholtz Centre for Ocean Research Kiel. MM acknowledges the support of NOAA; PMEL contribution no. 5359. JT's contributions to this study were supported by the U.S. National Science Foundation.
Conflict of Interest
The authors declare that the research was conducted in the absence of any commercial or financial relationships that could be construed as a potential conflict of interest.
Publisher’s Note
All claims expressed in this article are solely those of the authors and do not necessarily represent those of their affiliated organizations, or those of the publisher, the editors and the reviewers. Any product that may be evaluated in this article, or claim that may be made by its manufacturer, is not guaranteed or endorsed by the publisher.
Acknowledgments
We thank the captains, crews, scientists and technical groups involved in several research cruises to the tropical Atlantic that contributed to collecting shipboard and moored data and making them freely available. We thank M. Dengler, S.-H. Didwischus, J. Fischer, A. Funk, V. Hormann, R. Kopte and the IRD IMAGO team for their help with acquiring and processing parts of the velocity data. We further thank R. C. Perez for comments on an early draft of the manuscript and two reviewers for their helpful feedback.
References
Ascani F., Firing E., McCreary J. P., Brandt P., Greatbatch R. J. (2015). The Deep Equatorial Ocean Circulation in Wind-Forced Numerical Solutions. J. Phys. Oceanography 45 (6), 1709–1734. doi: 10.1175/JPO-D-14-0171.1
Athie G., Marin F. (2008). Cross-Equatorial Structure and Temporal Modulation of Intraseasonal Variability at the Surface of the Tropical Atlantic Ocean. J. Geophys. Res. 113, C08020. doi: 10.1029/2007JC004332
Bastin S., Claus M., Brandt P., Greatbatch R. J. (2020). Equatorial Deep Jets and Their Influence on the Mean Equatorial Circulation in an Idealized Ocean Model Forced by Intraseasonal Momentum Flux Convergence. Geophys. Res. Lett. 47, e2020GL087808. doi: 10.1029/2020GL087808
Bourlès B., Araujo M., McPhaden M. J., Brandt P., Foltz G. R., Lumpkin R., et al. (2019). PIRATA: A Sustained Observing System for Tropical Atlantic Climate Research and Forecasting. Earth Space Sci. 6 (4), 577–616. doi: 10.1029/2018EA000428
Bourlès B., Lumpkin R., McPhaden M. J., Hernandez F., Nobre P., Campos E., et al. (2008). The PIRATA Program: History, Accomplishments, and Future Directions. Bull. Am. Meteorol. Soc. 89 (8), 1111–1126. doi: 10.1175/2008BAMS2462.1
Brandt P., Claus M., Greatbatch R. J., Kopte R., Toole J. M., Johns W. E., et al. (2016). Annual and Semiannual Cycle of Equatorial Atlantic Circulation Associated With Basin-Mode Resonance. J. Phys. Oceanography 46 (10), 3011–3029. doi: 10.1175/JPO-D-15-0248.1
Brandt P., Funk A., Hormann V., Dengler M., Greatbatch R. J., Toole J. M. (2011). Interannual Atmospheric Variability Forced by the Deep Equatorial Atlantic Ocean. Nature 473, 497–500. doi: 10.1038/nature10013
Brandt P., Funk A., Tantet A., Johns W. E., Fischer J. (2014). The Equatorial Undercurrent in the Central Atlantic and Its Relation to Tropical Atlantic Variability. Climate Dynamics 43, 2985–2997. doi: 10.1007/s00382-014-2061-4
Brandt P., Greatbatch R. J., Claus M., Didwischus S.-H., Hormann V., Funk A., et al. (2012). Ventilation of the Equatorial Atlantic by the Equatorial Deep Jets. J. Geophys. Res. 117, C12015. doi: 10.1029/2012JC008118
Brandt P., Hahn J., Schmidtko S., Tuchen F. P., Kopte R., Kiko R., et al. (2021). Atlantic Equatorial Undercurrent Intensification Counteracts Warming-Induced Deoxygenation. Nat. Geosci. 14, 278–282. doi: 10.1038/s41561-021-00716-1
Brandt P., Hormann V., Bourlès B., Fischer J., Schott F. A., Stramma L., et al. (2008). Oxygen Tongues and Zonal Currents in the Equatorial Atlantic. J. Geophys. Res. 113, C04012. doi: 10.1029/2007JC004435
Bunge L., Provost C., Hua B. L., Kartavtseff A. (2008). Variability at Intermediate Depths at the Equator in the Atlantic Ocean in 2000-06: Annual Cycle, Equatorial Deep Jets, and Intraseasonal Meridional Velocity Fluctuations. J. Phys. Oceanography 38 (8), 1794–1806. doi: 10.1175/2008JPO3781.1
Bunge L., Provost C., Kartavtseff A. (2007). Variability in Horizontal Current Velocities in the Central and Eastern Equatorial Atlantic in 2002. J. Geophys. Res. 112, C02014. doi: 10.1029/2006JC003704
Burmeister K., Lübbecke J. F., Brandt P., Claus M., Hahn J. (2020). Fluctuations of the Atlantic North Equatorial Undercurrent and Associated Changes in Oxygen Transports. Geophys. Res. Lett. 47, e2020GL088350. doi: 10.1029/2020GL088350
Claus M., Greatbatch R. J., Brandt P., Toole J. M. (2016). Forcing of the Atlantic Equatorial Deep Jets Derived From Observations. J. Phys. Oceanography 46 (12), 3549–3562. doi: 10.1175/JPO-D-16-0140.1
Doherty K. W., Frye D. E., Liberatore S. P., Toole J. M. (1999). A Moored Profiling Instrument. J. Atmospheric Oceanic Technol. 16 (11), 1816–1829. doi: 10.1175/1520-0426(1999)016<1816:AMPI>2.0.CO;2
Foltz G. R., Brandt P., Richter I., Rodriguez-Fonseca B., Hernandez F., Dengler M., et al. (2019). The Tropical Atlantic Observing System. Front. Marine Sci. 6 (206). doi: 10.3389/fmars.2019.00206
Greatbatch R. J., Claus M., Brandt P., Matthießen J.-D., Tuchen F. P., Ascani F., et al. (2018). Evidence for the Maintenance of Slowly Varying Equatorial Currents by Intraseasonal Variability. Geophys. Res. Lett. 45, 1923–1929. doi: 10.1002/2017GL076662
Grodsky S. A., Carton J. A., Provost C., Servain J., Lorenzzetti J. A., McPhaden M. J. (2005). Tropical Instability Waves at 0°N, 23°W in the Atlantic: A Case Study Using Pilot Research Moored Array in the Tropical Atlantic (PIRATA) Mooring Data. J. Geophys. Res. 110, C08010. doi: 10.1029/2005JC002941
Johns W. E., Brandt P., Bourlès B., Tantet A., Papapostolou A., Houk A. (2014). Zonal Structure and Seasonal Variability of the Atlantic Equatorial Undercurrent. Climate Dynamics 43, 3047–3069. doi: 10.1007/s00382-014-2136-2
Johnson G. C., Zhang D. (2003). Structure of the Atlantic Ocean Equatorial Deep Jets. J. Phys. Oceanography 33 (3), 600–609. doi: 10.1175/1520-0485(2003)033<0600:SOTAOE>2.0.CO;2
Kopte R., Brandt P., Claus M., Greatbatch R. J., Dengler M. (2018). Role of Equatorial Basin-Mode Resonance for the Seasonal Variability of the Angola Current at 11°S. J. Phys. Oceanogr. 48 (2), 261-281. doi: 10.1175/JPO-D-17-0111.1
Körner M., Claus M., Brandt P., Tuchen F. P. (2022). Sources and Pathways of Intraseasonal Meridional Kinetic Energy in the Equatorial Atlantic Ocean. J. Phys. Oceanography. doi: 10.1175/JPO-D-21-0315.1
Krahmann G., Arévalo-Martínez D. L., Dale A. W., Dengler M., Engel A., Glock N., et al. (2021). Climate-Biogeochemistry Interactions in the Tropical Ocean: Data Collection and Legacy. Front. Marine Sci. 8. doi: 10.3389/fmars.2021.723304
Servain J., Busalacchi A. J., McPhaden M. J., Moura A. D., Reverdin G., Vianna M., et al. (1998). A Pilot Research Moored Array in the Tropical Atlantic (PIRATA). Bull. Am. Meteorol. Soc. 79 (10), 2019–2031. doi: 10.1175/1520-0477(1998)079<2019:APRMAI>2.0.CO;2
Specht M. S., Jungclaus J., Bader J. (2021). Identifying and Characterizing Subsurface Tropical Instability Waves in the Atlantic Ocean in Simulations and Observations. J. Geophys. Res.: Oceans 126, e2020JC017013. doi: 10.1029/2020JC017013
Tuchen F. P., Brandt P., Claus M., Hummels R. (2018). Deep Intraseasonal Variability in the Central Equatorial Atlantic. J. Phys. Oceanography 48 (12), 2851–2865. doi: 10.1175/JPO-D-18-0059.1
Visbeck M. (2002). Deep Velocity Profiling Using Lowered Acoustic Doppler Current Profilers: Bottom Track and Inverse Solution. J. Atmospheric Oceanic Technol. 19, 794–807. doi: 10.1175/1520-0426(2002)019<0794:DVPULA>2.0.CO;2
Wenegrat J. O., McPhaden M. J. (2015). Dynamics of the Surface Layer Diurnal Cycle in the Equatorial Atlantic Ocean (0°N, 23°W). J. Geophys. Res.: Oceans 120, 563–581. doi: 10.1002/2014JC010504
Keywords: ocean observations, physical oceanography, equatorial Atlantic circulation, ocean currents, moored observations, climate variability
Citation: Tuchen FP, Brandt P, Hahn J, Hummels R, Krahmann G, Bourlès B, Provost C, McPhaden MJ and Toole JM (2022) Two Decades of Full-Depth Current Velocity Observations From a Moored Observatory in the Central Equatorial Atlantic at 0°N, 23°W. Front. Mar. Sci. 9:910979. doi: 10.3389/fmars.2022.910979
Received: 01 April 2022; Accepted: 18 May 2022;
Published: 30 June 2022.
Edited by:
Sabrina Speich, École Normale Supérieure, FranceReviewed by:
Riccardo Farneti, The Abdus Salam International Centre for Theoretical Physics (ICTP), ItalyIgor V. Polyakov, University of Alaska Fairbanks, United States
Copyright © 2022 Tuchen, Brandt, Hahn, Hummels, Krahmann, Bourlès, Provost, McPhaden and Toole. This is an open-access article distributed under the terms of the Creative Commons Attribution License (CC BY). The use, distribution or reproduction in other forums is permitted, provided the original author(s) and the copyright owner(s) are credited and that the original publication in this journal is cited, in accordance with accepted academic practice. No use, distribution or reproduction is permitted which does not comply with these terms.
*Correspondence: Franz Philip Tuchen, ZnJhbnoucGhpbGlwLnR1Y2hlbkBub2FhLmdvdg==; Peter Brandt, cGJyYW5kdEBnZW9tYXIuZGU=