 Abigail Uribe-Martínez1
 Diana Berriel-Bueno2
 Valeria Chávez3*
 Eduardo Cuevas4Karla L. Almeida3
 Jassiel V. H. Fontes5
 Brigitta I. van Tussenbroek6
 Ismael Mariño-Tapia7
 Maria de los Ángeles Liceaga-Correa2
 Elena Ojeda8D. Gerardo Castañeda-Ramírez9
 Rodolfo Silva3*
- 1Harte Research Institute Furgason Fellow, Mérida, Mexico
- 2Departamento Recursos del Mar, Centro de Investigación y de Estudios Avanzados del Instituto Politécnico Nacional, Unidad Mérida, Mérida, Mexico
- 3Instituto de Ingeniería, Universidad Nacional Autónoma de México, Mexico City, Mexico
- 4Consejo Nacional de Ciencia y Tecnología, Universidad Autónoma del Carmen, Ciudad del Carmen, Mexico
- 5Departamento de Engenharia Naval, Escola Superior de Tecnologia, Universidade do Estado do Amazonas, Manaus, Brazil
- 6Unidad Académica de Sistemas Arrecifales - Puerto Morelos, Instituto de Ciencias del Mar y Limnología, Universidad Nacional Autónoma de México, Puerto Morelos, Mexico
- 7Escuela Nacional de Estudios Superiores, Universidad Nacional Autónoma de México, Mérida, Mexico
- 8Laboratoire de Morphodynamique Continentale et Côtière (M2C), Normandie Université, Caen, France
- 9Gerencia Corporativa Ambiental, Moon Palace Resort, Cancún, Mexico
As the biomass of pelagic Sargassum spp. increased across the North Atlantic equatorial recirculation region from 2011 onwards, massive rafts of sargasso appeared in the Western Caribbean in 2015, 2018, 2019, and 2020. These events raised concerns regarding their negative consequences on the environment, local income, and human wellbeing. As adequate monitoring and analysis tools are needed for designing in-water and on-beach control strategies to reduce potential negative impacts, more robust and spatially explicit information is needed in order to improve sargasso management and focus restoration efforts. In this paper, we offer a spatiotemporal multiscale description of sargasso distribution and dynamics for 2014–2020 in the Mexican Caribbean: (1) for the entire region (millions of km2); (2) at the local scale (thousands of km2) evaluating the dynamics inside the reef lagoon at Puerto Morelos, Mexico; and finally, (3) specific beach observations (hundreds of km2) derived from data on beach cleaning volumes. Fifteen areas in the Mexican Caribbean, with different sargasso dispersions and on-shore accumulations, were evaluated. The areas around Tulum, Solidaridad, and Puerto Morelos have the most extreme and most frequent episodes but also exhibited the greatest seasonal variability. Extreme sargasso presence can occur in the Western Caribbean in any season, albeit with increasing coverage and recurrence in the summer. Images from a coastal video monitoring station at Puerto Morelos showed that massive sargasso beaching was associated with low energy conditions (Hs< 0.25 m, wind speed<4 m/s, neap tide), while non-accumulation of sargasso on the beach occurred under high energy conditions (Hs >0.4 m, wind speed = 8 m/s, spring tide). Time-series analyses of sargasso beaching showed different periods of historic maximum sargasso coverage over July–October 2018 and others in January–February 2019. Wind and wave regimes influenced sargasso in distinct ways, depending on the coastal section, probably related to coastline morphology, oceanic regime, or the extent of the continental platform. This work presents the longest systematic time series (2014-2020) of high resolution satellite detected sargasso in Mexico. Spatial and temporal patterns are proposed as fundamental steps for managing sargasso accumulations.
Introduction
The study of the holopelagic Sargassum species (S. natans and S. fluitans, Phylum Ochrophyta, Class Phaeophyceae; referred to as sargasso from hereon) in the NW Atlantic dates back to the 1830s, with the discovery of the Sargasso Sea (Butler et al., 1983). Sargasso is the only seaweed that passes its complete life cycle drifting on the ocean surface. It has elongated, highly ramified thalli, up to 0.5 m in length, with numerous blades and vesicles, that allow the thalli to float either singly, or in floating, entangled masses (rafts) that can extend up to several km at sea (see Supplementary Material 1).
The size and spatial configuration of sargasso aggregations (rafts) depend on its growth but also on the spatiotemporal dynamics of oceanic and atmospheric forces, such as wind, wave, and surface marine currents (Butler et al., 1983; Brooks et al., 2018; Putman et al., 2020; Marsh et al., 2021; Skliris et al., 2022). In the Western Caribbean, close to the Yucatan Channel, sargasso rafts are shaped like cyclonic and anticyclonic gyres, drops, compact mats, linear formations, or raft aggregations caused by Langmuir circulation (several short, parallel lines of sargasso arranged perpendicular to the shore, moving in the same direction as the wind), their size varying from centimeters to kilometers, the former found mainly as string lines and spirals (Guzmán-Ramírez et al., 2020). In the north-central Gulf of Mexico, Powers et al. (2013) reported different types of aggregations of sargasso: scattered clumps when the winds were high, small and mesoscale convergence lines, and larger circular-like rafts that may persist for several weeks or even months while drifting in the ocean. These pelagic rafts of sargasso have key ecological roles, serving as a refuge for marine life, hosting species such as sea turtles, fish (of which several are commercially important), invertebrates, and birds, which use the sargasso ecosystem as a refuge, feeding ground, nursery, and breeding habitat, either permanently or temporarily (Pendleton et al., 2014).
Unusually large concentrations of sargasso in the tropical Atlantic near the Equator and SW Caribbean Sea were reported for the first time in 2011 (Smetacek and Zingone, 2013). Since then, several studies have reported a sustained increase in the biomass of pelagic sargasso in this region (Hu et al., 2016; Xing et al., 2017; Wang et al., 2018) (Figure 1). Schell et al. (2015) estimated that the concentration of sargasso in the Western Atlantic in 2014 was approximately 10 times greater than that of 2011 and 300 times higher than that of previous decades. In 2016 and 2017, the sargasso coverage decreased, but in 2018 and 2019 it rose again (Wang et al., 2019). In 2020 and 2021, the volume of sargasso cover was moderate to high in the Caribbean (Marsh et al., 2021). The peak sargasso year in the Caribbean Sea and central Western Atlantic was 2018, with the highest biomass in June, the rafts covering almost 3,000 km2 in the area bounded by 8°–23°N and 89°–58° W (Wang et al., 2019). Wang et al. (2019) named this new area of sargasso concentration, extending from Equatorial Africa to the Gulf of Mexico, the Great Atlantic Sargasso Belt (Figure 1A).
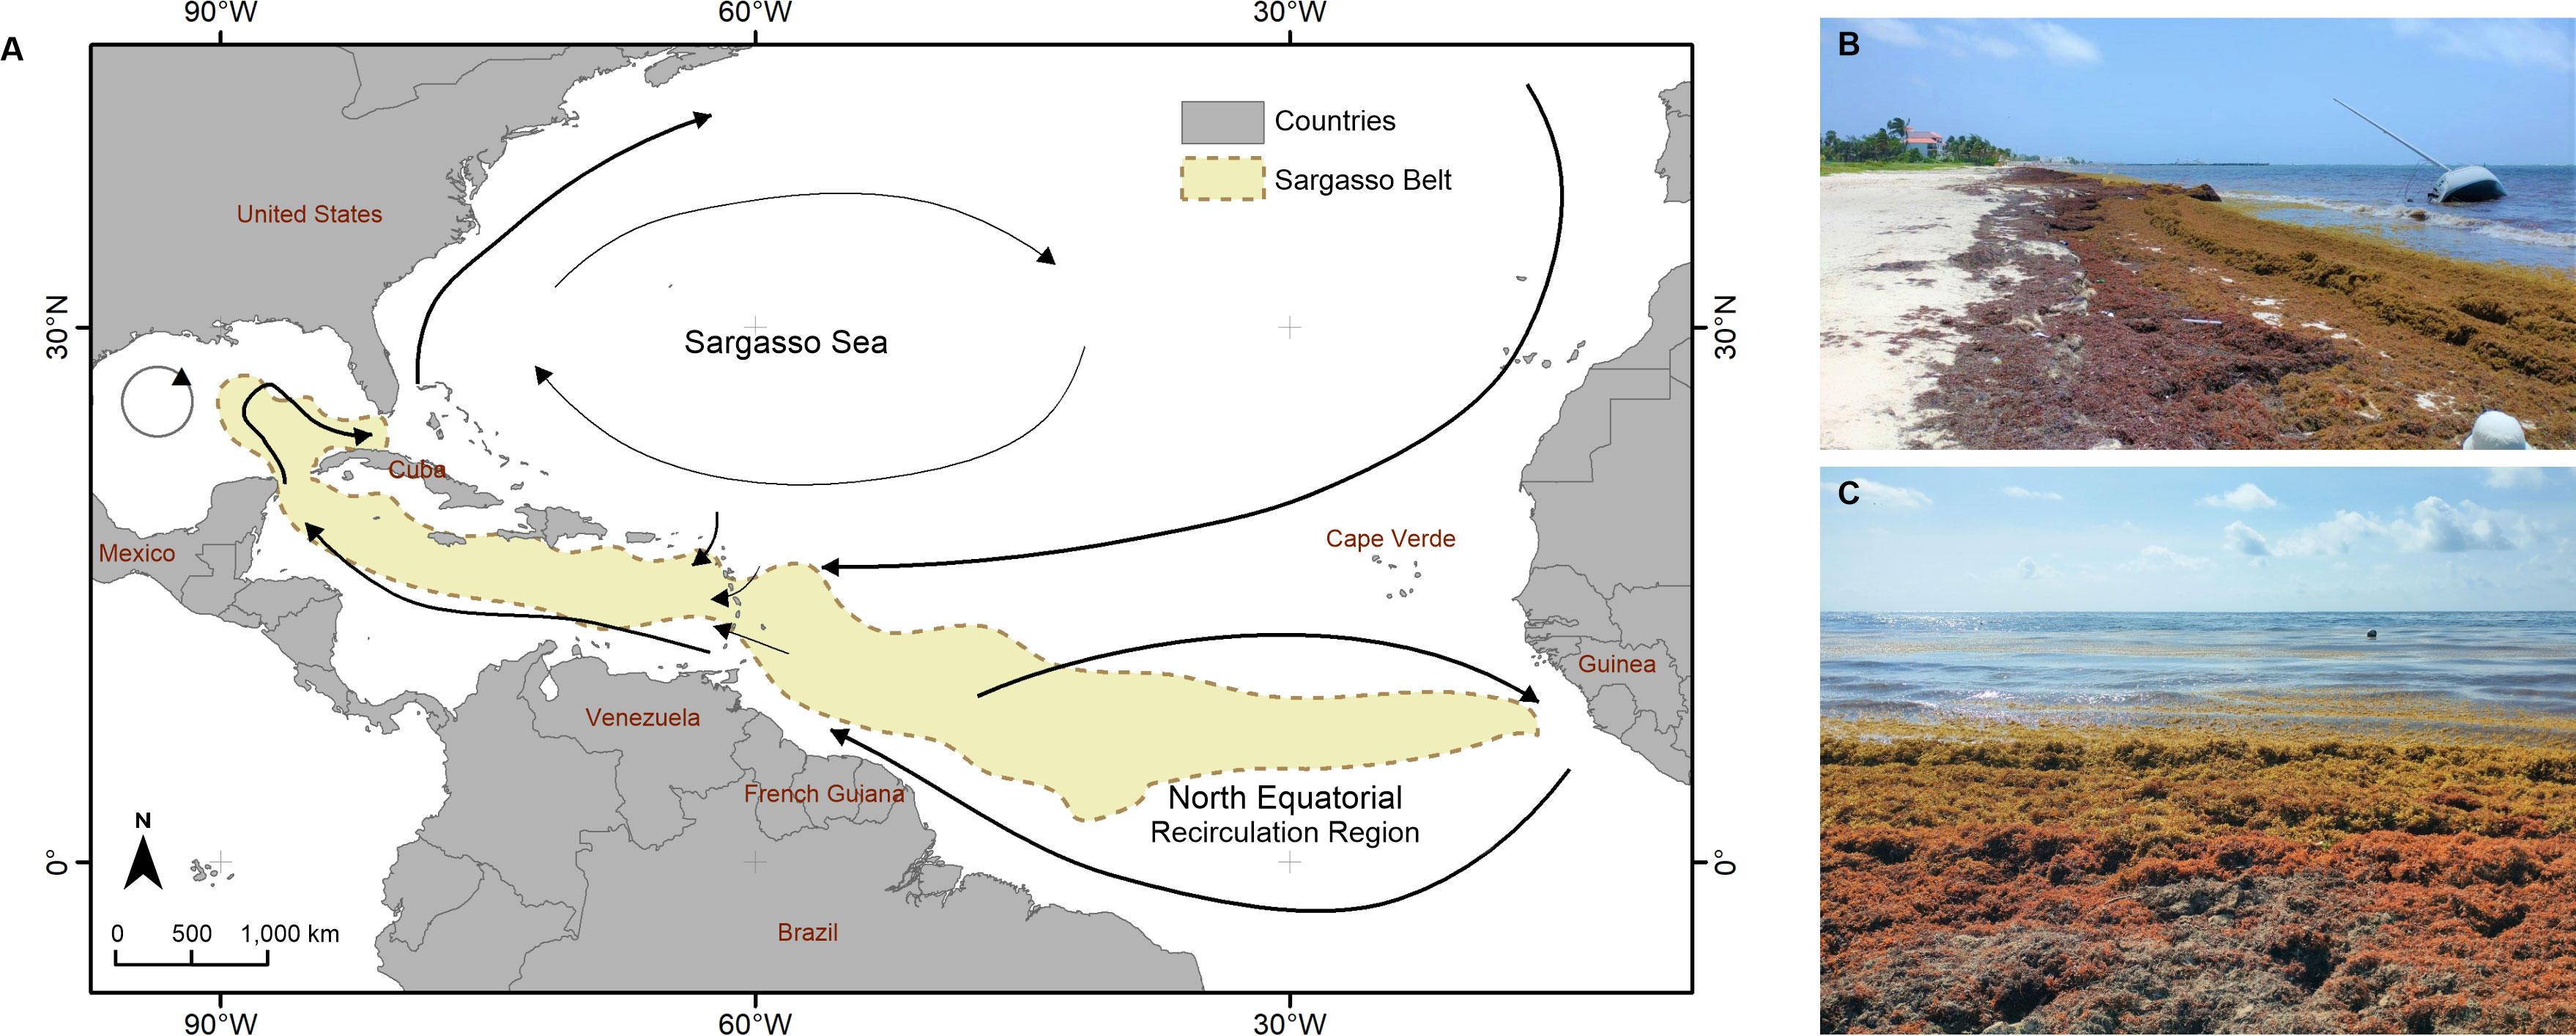
Figure 1 (A) Schematic representation of the main ocean current patterns and areas of sargasso accumulation in the Atlantic Ocean. (The Great Atlantic Sargasso Belt; July 2011–2018 configuration; made by the authors, using information from Wang et al. (2019). (B, C) Accumulation of beach-cast sargasso at Puerto Morelos, Mexican Caribbean (June 2021, Photographs by Laura Ribas).
According to Cuevas et al. (Cuevas et al., 2018), the first massive arrival of sargasso in the Mexican Caribbean, recorded with satellite imagery, began in late 2014, reaching a first peak in September 2015. In 2015, an average of ~2,360 m3 of sargasso was removed per kilometre of coastline in the north, between Cancun and Puerto Morelos (Rodríguez-Martínez et al., 2016) (Figure 1B). After a decrease in 2016 and 2017, the influx of sargasso resumed in February 2018 and continued until September 2019 (Chávez et al., 2020; Rodriguez-Martínez et al., 2022). Even though those are the last published time series, it is known that large amounts of sargasso were collected in 2020 and 2021.
Sargasso concentrations (abundance and distribution) in the tropical Atlantic vary greatly both seasonally and interannually. Johns et al. (2020) offered a concise, plausible theory regarding the seasonality of this phenomenon in the Atlantic, suggesting that the new sargasso aggregations recirculate in the North Equatorial Recirculation Region (NERR) and that in early spring (March–April) some masses move south, causing a summer bloom in the Caribbean. Once released from the NERR and transported towards the northern coast of South America, the sargasso flows through the Caribbean and the Gulf of Mexico (Putman et al., 2018). However, it is more difficult to understand the large interannual variations in the abundance of the sargasso aggregations, as these occur at different spatial and temporal scales, under distinct environmental forces. Skliris et al. (2022) recently suggested that in 2015 and 2018, the years with the highest sargasso bloom, the Intertropical Convergence Zone (ITZ), an area of maximal trade wind convergence and sargasso accumulation, shifted southward, thereby enriching the seawater with nutrients flowing from the Amazon, and equatorial upwelling in this zone stimulated the growth of sargasso. The easterly trade winds also transport Sahara dust into the tropical Atlantic, possibly fertilizing seaweeds in the Great Atlantic Sargasso belt, although the importance of this fertilization is still unknown (supplements Wang et al., 2019).
Gower et al. (2013) suggested that the sudden increase in the sargasso masses may have been the result of the water discharging from the Amazon containing more fertilizers in the runoff from agricultural lands in the interior.
However, Jouanno et al. (2021) showed that there was no significant increase in riverine influence in areas where sargasso proliferated. On the other hand, Johns et al. (2020) have proposed that increased winds, created by an anomaly in the North Atlantic Oscillation in 2010, may have transported large masses of sargasso from the Sargasso Sea into the NERR. Wang et al. (2019) and Johns et al. (2020) suggested a regime change in the NERR, together with changes in the Canaries upwelling, or discharges from the Amazon, resulting in recurrent blooms of sargasso and promoting the spatial pattern known as the Great Atlantic Sargasso Belt (Figure 1). The sargasso aggregation showed enhanced growth thanks to nutrients entrained in the upper water column (Johns et al., 2020).
Part of the pelagic sargasso at sea is destined to arrive on Caribbean shores, causing diverse negative impacts on coastal ecosystems (Silva et al., 2016; van Tussenbroek et al., 2017; Chávez et al., 2020; Bartlett and Elmer, 2021; Maurer et al., 2021; Rodríguez-Muñoz et al., 2021), local and regional economics (Solarin et al., 2014; Milledge and Harvey, 2016), and human health (Devault et al., 2021). The impacts include aesthetics (of the previously pristine white beaches), additional organic matter input, light attenuation, anoxia, and leaching (van Tussenbroek et al., 2017; Chávez et al., 2020). The consequences are mortality of near-shore benthos, including seagrass and coral (Silva et al., 2016), beach erosion (van Tussenbroek et al., 2017; Silva et al., 2020), the modification of sediment structure (Maurer, 2019), changes in the trophic relationships (Cabanillas-Terán et al., 2019), respiratory and skin health issues in humans (Resiere et al., 2018), and economic losses for the tourist industry. Although the latter has not been fully assessed, losses are estimated to be substantial as the beaches lost their attractiveness due to the unsightly accumulations of sargasso (Langin, 2018). In Mexico, enormous human and financial resources have been invested in preventing the sargasso reaching the coast, or in removing it from the beaches; most of these efforts have been insufficient due to the huge volumes involved.
Understanding the spatial movement patterns of sargasso in the open sea, as related to oceanographic conditions, is needed. This knowledge should be a part of the toolbox of decision makers and stakeholders, to help them when implementing mitigation strategies and embarking upon restoration actions (Casas-Beltrán et al., 2020). Coastal and marine management requires a comprehensive, integral perspective and feasible environmental frameworks (El Mahrad et al., 2020; Silva et al., 2020; Guimarais et al., 2021; Silva et al., 2021). Remote sensing has been shown to be a key piece of any timely detection tool, furthering the understanding of patterns of sargasso circulation and accumulation (Wang and Hu, 2017; Brooks et al., 2018; Berline et al., 2020; Johns et al., 2020; Putman et al., 2020; Wang and Hu, 2021). While sargasso rafts can be detected during oceanographic expeditions or using advanced unmanned vehicles (Butler et al., 1983; Lapointe, 1995; Huffard et al., 2014), high-resolution imagery from free satellite sensing inputs is essential for systematic long-term and regional coverage if we are to understand the ocean-scale dynamics behind the movements of sargasso (Hu et al., 2015; Wang and Hu, 2017; Xing et al., 2017 Supplementary Material 2).
Remote sensing techniques can help in establishing early warning systems that are strategic tools for emergency planning. They also provide long-term data series with high-resolution delimitation of the sargasso rafts, necessary for a comprehensive management plan. A spatially explicit time-series analysis can contribute to regionalization and prioritization criteria that can be incorporated in integral marine spatial planning schemes (Ogden, 2010; Shucksmith et al., 2014; Domínguez-Tejo et al., 2016). Remote sensing images are essentially input for influx trend assessment and to understand the regional and local dynamics of sargasso that can respond to distinct atmospheric and ocean forcing variables. In addition to understanding sargasso circulation in the Central Atlantic basin, regional and local knowledge of the spatiotemporal dynamics is necessary for appropriate decision making, preparedness, and adaptive management (López-Miranda et al., 2021; Oxenford et al., 2021). Information on the spatial and temporal patterns of Sargasso would allow more appropriate monitoring, and in-sea and on-shore recollection efforts, as well as promote protection and restoration initiatives in the areas most affected, or areas considered to be of special social, economic, or ecological value.
In this study, we aim to fill knowledge gaps on the distribution patterns of sargasso at regional and local scales in the Mexican Caribbean and to describe the oceanographic and atmospheric features associated with the spatial and temporal patterns of massive influxes of sargasso, through a multiple-spatial- and temporal-scale approach. The underlying premises are that the spatiotemporal patterns of sargasso distribution, beaching, and accumulation are locally and regionally driven by atmospheric (wind) and oceanographic (tides, wave power) conditions operating at different spatial scales. These drive the sargasso dynamics onshore and offshore and the intra- and interannual variability of sargasso flux which are the result of similar variance in patterns of the driving forces.
We adopted different spatial and temporal scales to appraise sargasso distribution: (a) a regional evaluation (Mexican Caribbean) using high-resolution remotely sensed imagery; (b) a local-scale evaluation in the Puerto Morelos reef lagoon; (c) a beach-scale evaluation considering wrack collection (usually mostly sargasso) from two beach sections at Puerto Morelos, Quintana Roo, Mexico; and (d) a time-specific comparison of detected sargasso rafts captured by both means (satellite and aerial platform).
Materials and methods
Through a multi-scale analysis, we described and documented the spatiotemporal distribution patterns of the sargasso rafts in the Mexican Caribbean at various scales, from detection of sargasso at sea with satellite imagery to modelling its movements inside a reef lagoon (Puerto Morelos) (Figure 2). Our aim was to provide a comprehensive overview of the spatiotemporal patterns of the sargasso at regional, local, and micro scales in the northern Mexican Caribbean.
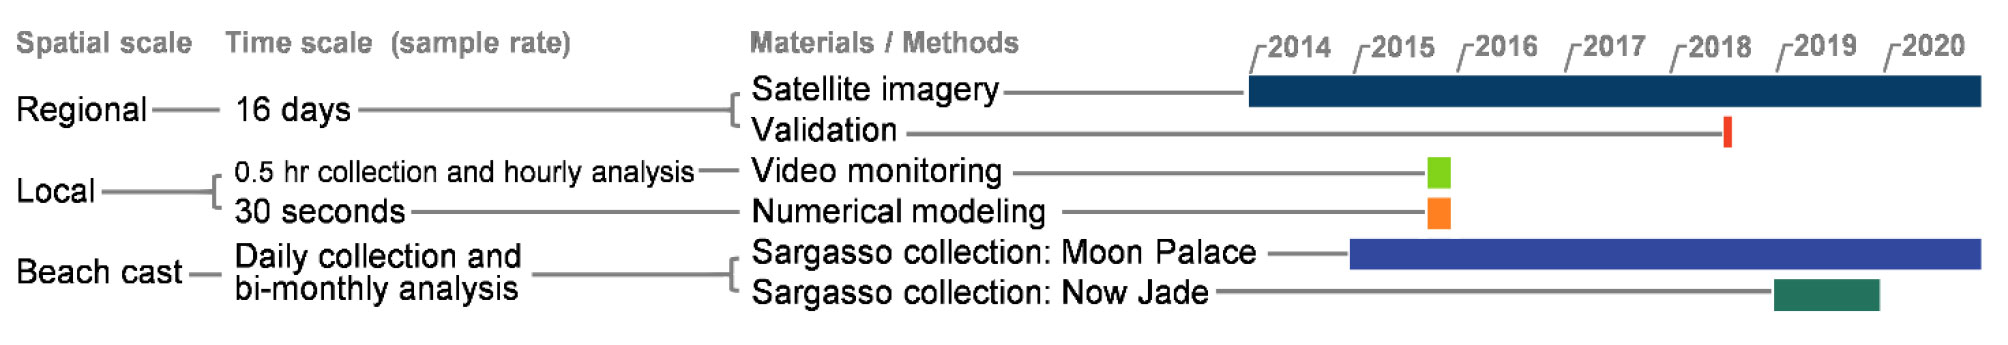
Figure 2 Timeline of the multi-scale analyses conducted into sargasso patterns.
Study area
The Mexican Caribbean, on the east side of the Yucatan Peninsula (see Figure 3), is a biodiverse area with key ecosystems, such as coral reefs, seagrass meadows, calcareous sandy beaches, complex dune vegetation, mangroves, and submarine springs from one of the most intricate subterraneous aquifers in the world (Guimarais et al., 2021).
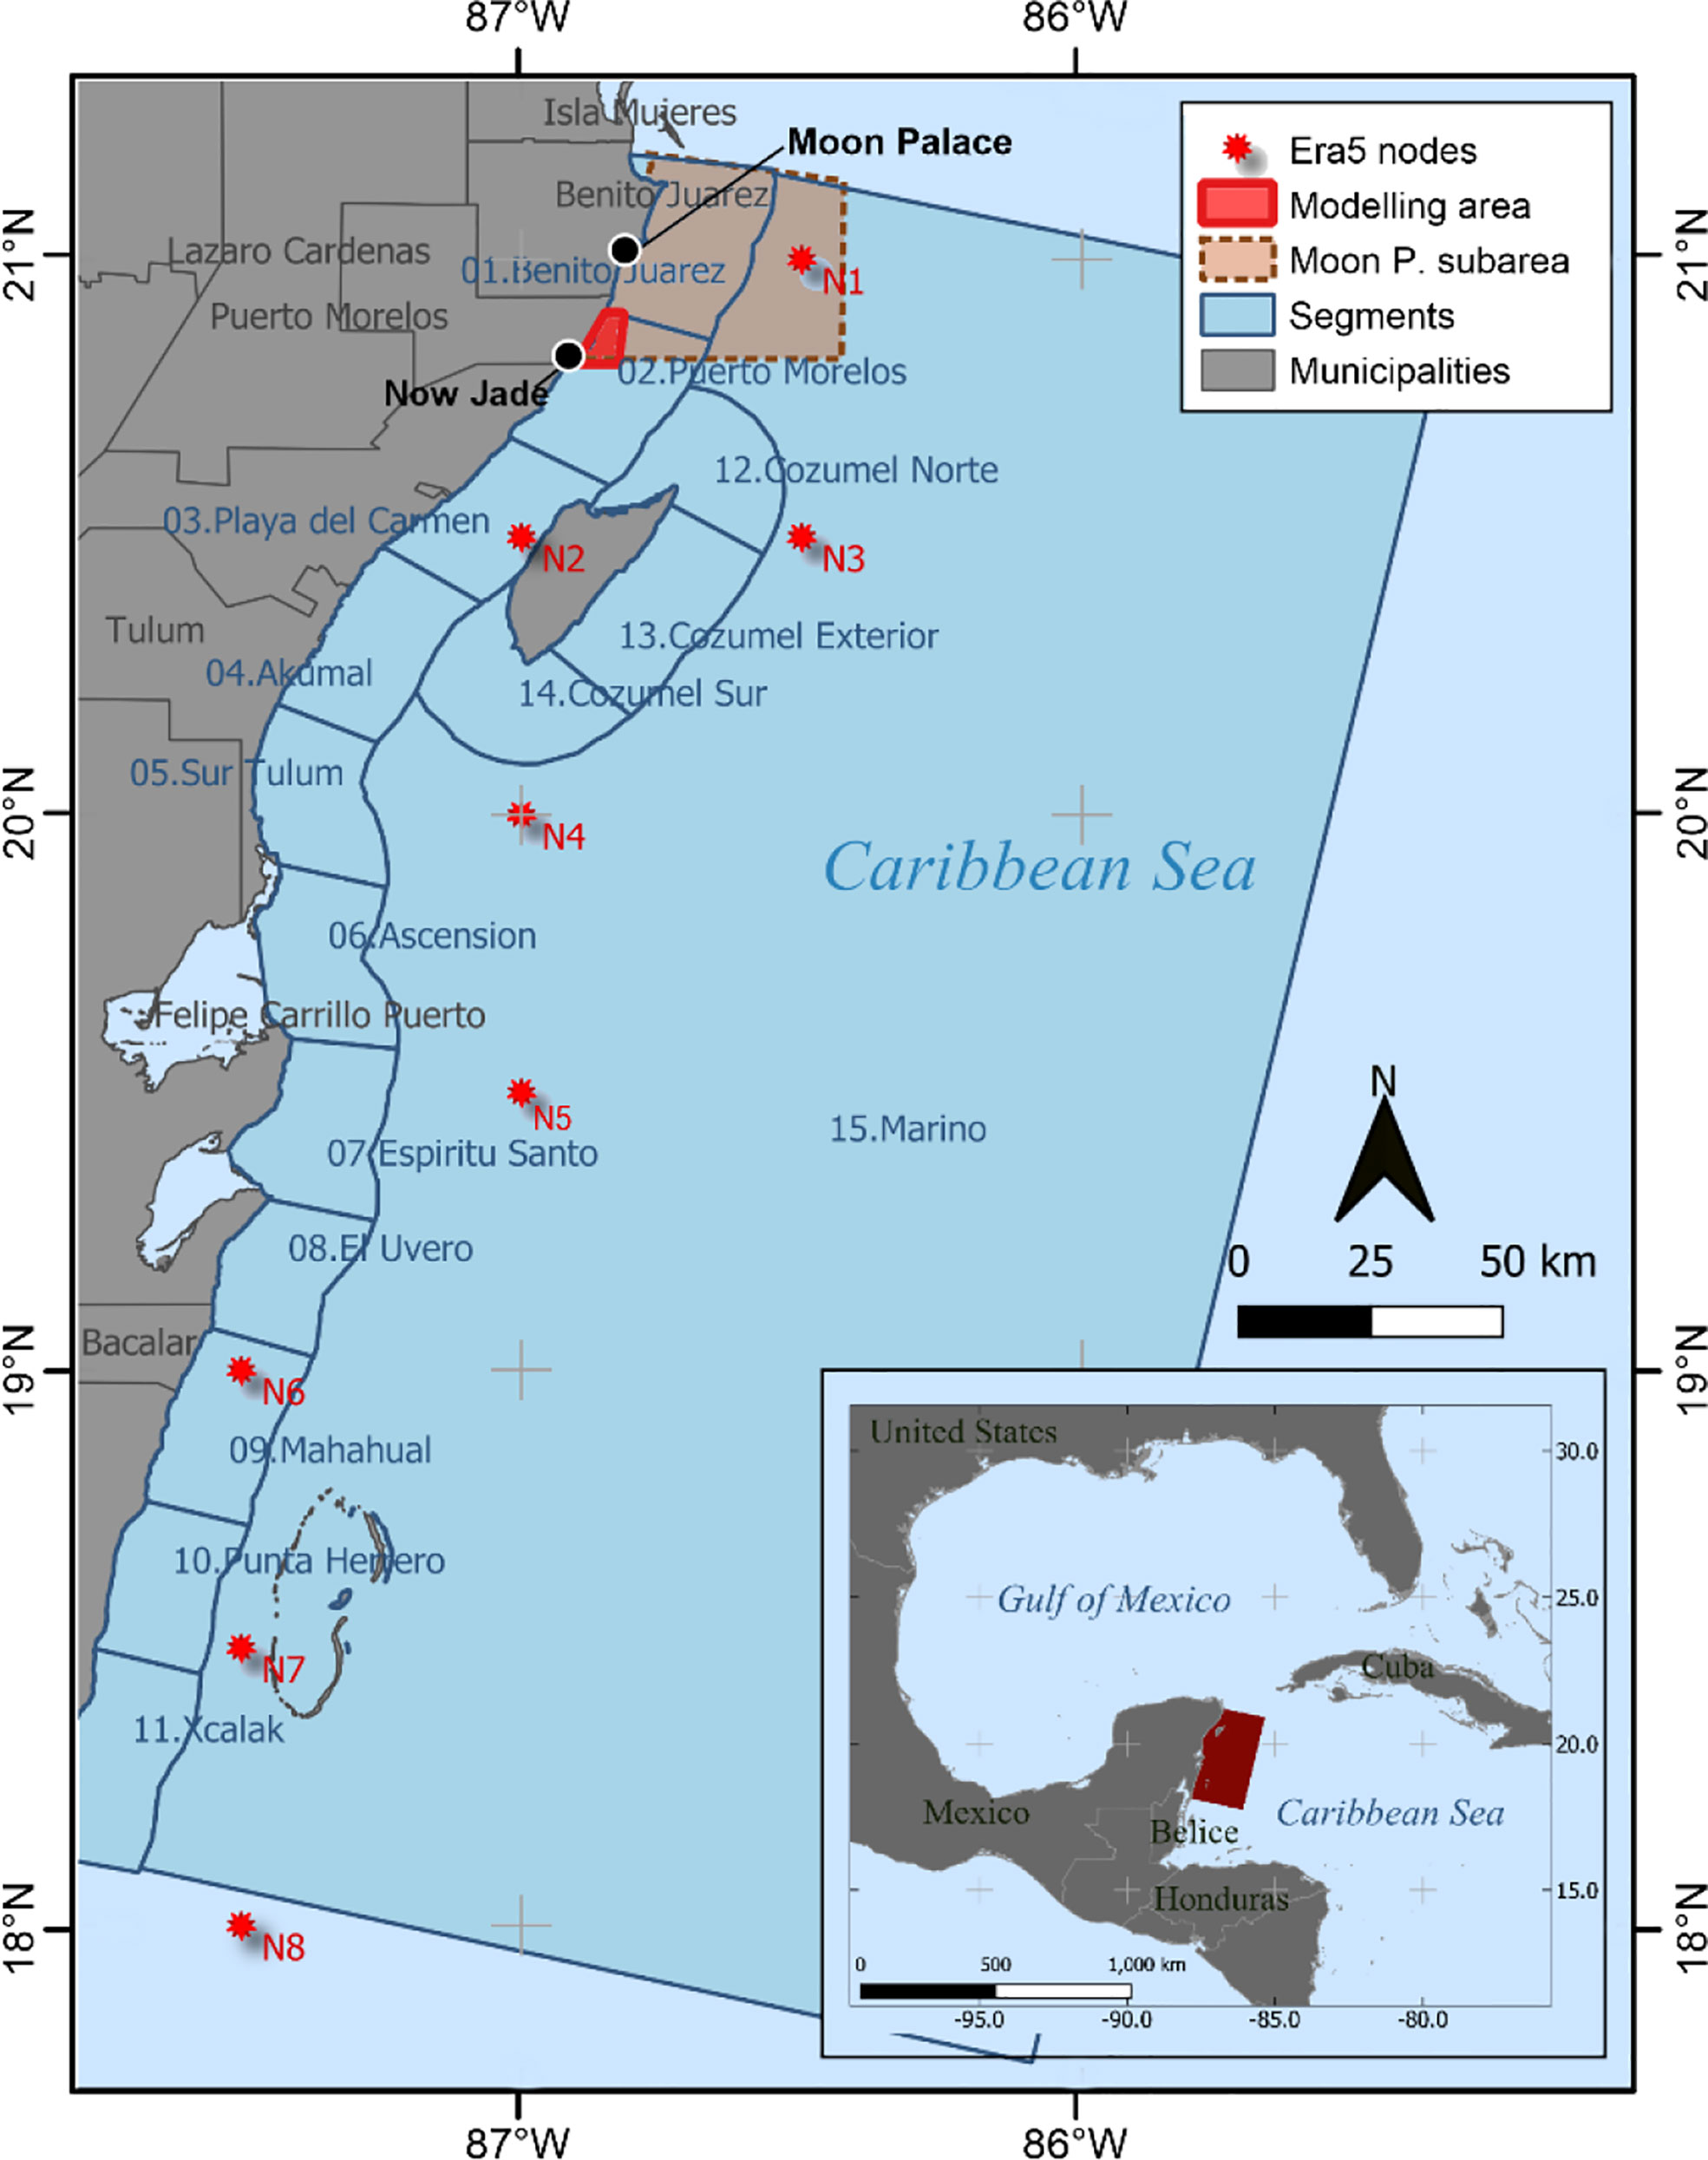
Figure 3 Study area within the Caribbean region. The solid blue lines delimit the 15 coastal segments (see 2.2). The bright-red polygon shows the area of the local-scale analysis, where circulation modelling was conducted (see 2.4); the black dots show locations for the beach-scale analysis, where time-series analyses of wrack were obtained (see 2.5); the red stars are the nodes for the oceanographic analysis (see 2.3); and the area shaded brown is in front of the Moon Palace Hotel, where sargasso detected was compared with beach-cast sargasso (see 2.5).
The region has a tropical climate, with two seasons (winter and summer) reflected in distinct wind patterns and air temperatures. Winter conditions occur approximately from November to April, with mean monthly air temperatures of 24°C–25°C, although the diurnal minima can fall briefly during the passage of cold fronts, known as “Nortes”. Northeastern winds prevail from October to February, while northerly and southeasterly winds occur following the passage of cold fronts. In summer, easterly trade winds predominate with speeds of 3–9 m s–1. The maximum air temperature is in August, with a monthly average of 29°C, raising to above 33.5°C (Coronado et al., 2007). Sea surface temperatures are between 25°C and 31°C (SAMMO, 2015). Measurements at buoy 42056 (NDBC-NOAA), in the Caribbean basin, at a water depth of 4,446 m, show that swell propagates from the Caribbean Sea (SSE direction), driven by the dominant winds, with an average significant wave height (Hs) of 0.8 m and a relatively short dominant wave period (Tp) of 6–8 s in summer (Coronado et al., 2007; Mariño-Tapia et al., 2011). As for the wave patterns, in winter, higher-energy waves (Hs >1.75 m) occur as a consequence of the passage of cold fronts. In summer, Hs is typically small (Hs<0.3 m) but can reach 7 m during a hurricane event.
The region has a microtidal regime, with semidiurnal oscillations averaging 0.40 m. The Yucatan Current has a strong influence in the region. Its direction varies from northeastward to northwestward from south of Cozumel Island and along the western side of Yucatan Channel into the Gulf of Mexico, where it becomes the Loop Current. From April to November, there are more intense currents, up to 2 m s–1, with a decrease in its intensity of 0.9 m s–1 during winter. The average velocity is 1.5 m s–1 near the surface (Coronado et al., 2007; Athié et al., 2011).
Puerto Morelos is a small coastal town, in the north of the Mexican Caribbean (Figure 3). The National Park of Puerto Morelos Reef has a well-developed fringing reef that delimits a 0.4–3-km-wide reef lagoon. Dense seagrass meadows cover the bottom of the reef lagoon, which are habitat for local and regional key species (McHenry et al., 2021). The reef has two main openings: in the north, a reef discontinuity gives an entrance 300 m wide and 6 m deep, and in the south there is a navigational channel 400 m wide and 8 m deep (Coronado et al, 2007). Inside the lagoon, under normal conditions, the average Hs is 0.3 m. Circulation conditions in reef lagoons normally consist of a surface wave-induced flow, entering the lagoon over the shallow reef flat, with strong flows exiting through both channels. The wave-induced flow in the reef lagoon is modulated by a low-frequency sea-level change related to a geostrophic response to the variability of the Yucatan Current, with less influence of tides and direct wind on the sea surface (Coronado et al., 2007). Odériz et al. (2020) mentions that the physical components and dynamics of this lagoon have been extensively studied over several years. The average current speed is ~0.10 m/s with a predominantly northward direction and little tidal influence. In the northern and southern inlets, the mean current speed is ~0.20 m/s, reaching maximum values of ~1 m/s (Coronado et al., 2007; Mariño-Tapia et al., 2011; Torres-Freyermuth et al., 2012).
Regional scale using satellite imagery
The Operational Land Imager (OLI) sensor launched with Landsat 8 mission has proven to be reliable in detecting sargasso, with high spatial resolution, and this imagery is freely available, making it a very good option for long-term sargasso detection (Wang and Hu, 2021). We used Landsat 8 OLI imagery to compile a time series (2014–2020) of sargasso distribution at the regional scale for the Mexican Caribbean (Hu et al., 2016; Cuevas et al., 2018; Hardy et al., 2018; Chávez et al., 2020; Uribe-Martínez et al., 2020). The imagery has a spatial resolution of 30 m and a systematic revisiting time of 16 days.
The satellite detection covers 7 years (January 2014 to December 2020), including observations before the first anomalous high sargasso influx in this region. A total of 432 Landsat 8 OLI images were processed, using the semi-automated multi-index classification of Cuevas et al. (2018), for detection of pixels with and without sargasso. This approach uses the normalized difference vegetation index (NDVI), atmospherically resistant vegetation index (ARVI), soil-adjusted vegetation index (SAVI), enhanced vegetation index (EVI), and floating algae index (FAI)), plus band 2 Blue (0.452–0.512 μm) and band 5 near infrared (NIR) (0.851–0.879 μm).
The preprocessing of the images was done using the open-source software QGIS (QGIS-Association, 2021) starting with atmospheric correction, using the Semi-Automatic Classification Plugin (Congedo, 2021). The land was masked using the Global Administrative Areas as reference (https://gadm.org/), and finally, the clouds were masked using the codified quality assessment bands (BQA). Training polygons were drawn using the following categories: sargasso, clouds, shadows, saturated bright sea, and open sea, on a false-colour composition (red = NIR, green = blue; blue = coastal blue/violet). These datasets were used in a supervised classification process with the random forest algorithm.
The quantification of detected sargasso in each Landsat image was standardized to the effective analysis area in the images, excluding the cloud cover. The area was divided into 2-km-diameter hexagons in a lattice that covered the complete swath of Landsat 8 OLI paths (approximately 150 km). There are about two monthly observations, so the satellite sargasso detection per month was averaged for subsequent analysis. Based on the sargasso coverage detected by satellite for 2014–2020 per hexagon, we were able to:
(i) Build a time-series plot and boxplots indicating sargasso coverage in the sea each month
(ii) Perform an autocorrelation analysis through an autocovariance function, to evaluate possible correlations between detected sargasso during a certain month with sargasso coverage in following months, i.e., to assess different time lags of association
(iii) Sum all detected coverage along the time series per hexagon and create a cumulative sargasso cover map
(iv) Classify cumulative sargasso cover in four coverage categories: low, moderate, high, and very high, based on the Jenks ranking method that maximizes the variability between categories and minimizes the variability within delimited areas (North, 2009)
(v) Create a sargasso recurrence map, i.e., the number of times that a sargasso raft occurred in each hexagon, and classify these recurrence values (see iv)
(vi) Classify the spatial patterns of the sargasso, based on both cumulative sargasso cover and recurrence categorizations, to spatially identify areas from no sargasso to extreme sargasso cover (Table 1). This analysis was done for the entire period and per season.
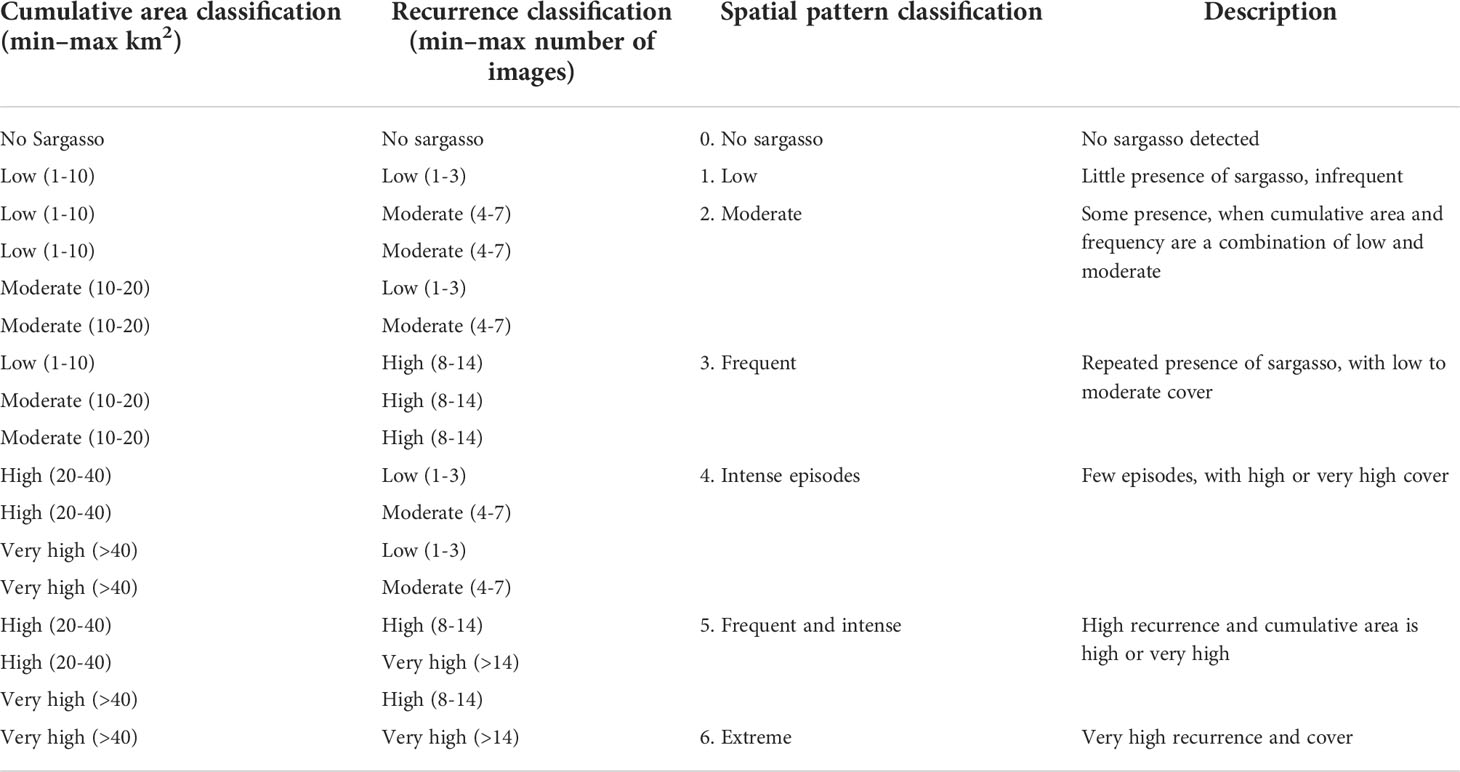
Table 1 Classification criteria of sargasso presence, based on the cumulative sargasso area and recurrence from 2014 to 2020.
The sea off the Mexican Caribbean coastline was divided into 15 segments (≈30 km long and 20 km wide), based on the influx patterns of sargasso on the shore (Chávez et al., 2020; Uribe-Martínez et al., 2020) (Figure 3). For each segment, we estimated the cumulative sargasso coverage area and recurrence based on the proportion of the hexagons intersected by the polygonal segments. This analysis was made for the entire period and per season. A non-parametric variance test (Kruskal–Wallis) was performed to evaluate the significance of possible differences between the regions.
Putman et al. (2020) and Rutten et al. (2021) explained the influence of waves, wind, and tides on the sargasso dynamics close to shore and governing its beach casting; we described graphically the mean oceanographic conditions (wind and wave power). To do this, daily mean wave, wind power, and direction were obtained for eight sampling nodes along the Mexican Caribbean coast (N1: 21°N 86.5°W; N2: 20.5°N 87°W; N3: 20.5°N 86.5°W; N4: 20°N 87°W; N5: 19.5°N 87°W; N6: 19°N 87.5°W; N7: 18.5°N 87.5°W and N8: 18°N 87.5°W; Figure 3) from ERA5 climate reanalysis (https://climate.copernicus.eu/climate-reanalysis) using marine climate data for 2018 and 2019.
Cross-validation of satellite detected sargasso
Pelagic sargasso is constantly moving on the ocean surface and changing its form as winds and waves force sargasso, giving very difficult conditions for a typical cross-validation assessment.
In order to validate the location and form of a sargasso raft, it is necessary to fly over an area known to be covered by a Landsat 8 scene, to find a sargasso raft at the same time that the satellite will acquire the image, so the location and the form of the raft is not significantly altered. It is also crucial that there is no cloud between the raft and the satellite at the time the image is acquired.
Therefore, a flight was planned, at a maximum height of about 300 m, to coincide with the passing of the Landsat 8 OLI satellite on 13 July 2018. Sargasso rafts in the northern Mexican Caribbean were photographed from the air at around 11:00 a.m. (CST) corresponding with the approximate time of passage of the satellite, and the geographic coordinates of the raft photos were recorded. We built a multi-index composite (FAI, NDVI, SAVI) of the Landsat 8 OLI satellite image for that day, following Cuevas et al. (2018), and visually validated the presumed sargasso aggregations in the satellite product with the aerial photographs. To complement the verification using Landsat 8 OLI in sargasso detection at different spatial scales and methods, we overlaid the areas of detected sargasso using MODIS (Wang and Hu, 2016) and Landsat 8 imagery (Cuevas et al., 2018).
For this comparison, we selected some clear cases that had occurred on a date when the two images had the least possible time difference (~2 h). The georeferenced images were added to the software QGIS for image compositions. Both detection approaches were based on the “red-edge” spectral feature of the sargasso, and the MODIS image were processed based on thresholds of the alternative floating algae index (AFAI) (Wang and Hu, 2016).
Local beached sargasso dynamics
The possible relationship between the wrack beaching and near-shore oceanographic features were evaluated at the Puerto Morelos reef lagoon, in the north of the Mexican Caribbean (Figure 4A, see also Figure 3). The daily accumulation of sargasso was estimated using data from a coastal video monitoring station located at the Reef Systems Academic Unit (Unidad Académica de Sistemas Arrecifales, UASA) of the National Autonomous University of Mexico (Universidad Nacional Autónoma de México, UNAM) (Figure 4B). Image analysis techniques were used to evaluate the cover of beached plant material (mainly sargasso). This information was integrated in datasets to evaluate the arrival and departure of sargasso and wind, waves, or tides.
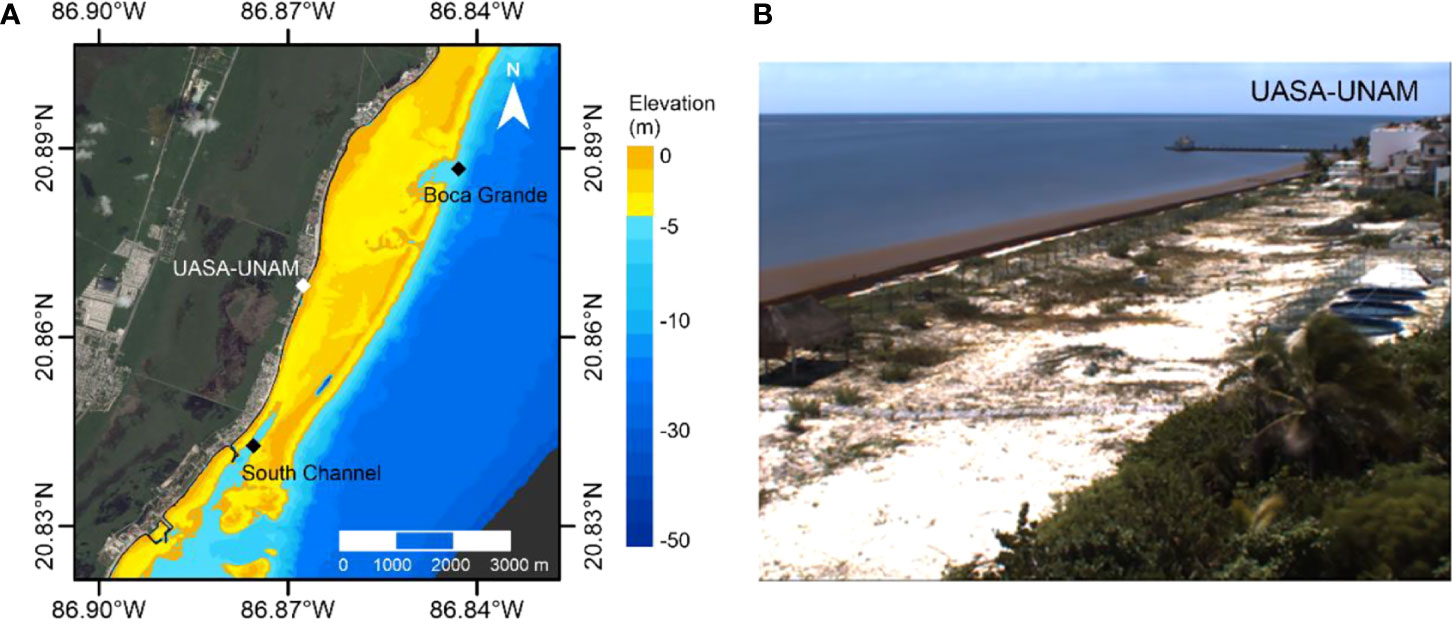
Figure 4 (A) Puerto Morelos reef lagoon, adapted from Parra et al. (2015). This map also shows the domain of the numerical model (see Figure 3). (B) Targeted beach section of ~210 m, of the fixed video monitoring.
Time average images (timex) were calculated with video images that were captured at 3.75 frames per second, for 10 min, every 0.5 h, from September to December 2015. The sargasso coverage was calculated on the beach section of approximately 210 × 21 m. Detection of sargasso on the beach was performed using segmentation techniques and the optimal thresholding methodology (Otsu, 1979). The analysis was systematized through a series of routines to process the images, where the colour scale of the area was transformed from RGB (red–green–blue) to HSV (hue–saturation–value), to improve detection and better solve colour variations of the sargasso caused by daylight changes and the degradation of the algae. The segmentation of the area covered by sargasso was done by optimal thresholding, and the sargasso coverage polygons were estimated and transformed to geographic coordinates using georeferenced control points following Simarro et al. (2017) and Rutten et al. (2021), showing that this kind of analysis provides a very valuable insight on the dynamics (arrival and separation) of onshore sargasso.
The correlation between sargasso cover with wind, wave, and tidal data was evaluated using daily average offshore wind and offshore wave power calculated from ERA5 data for Puerto Morelos (N1: 21°N 86.5°W). The direction corresponds to where the waves and wind come from and is relative to the geographic location of the north pole. The local wind and tide data were obtained at a frequency of 60 s from the records of the Meteorological and Oceanographic Academic Service (Servicio Académico de Monitoreo Meteorológico y Oceanográfico, SAMMO) of UNAM in Puerto Morelos. Finally, the offshore significant wave height (Hsoff) was taken from NOAA buoy 42056 (19°55′6″N, 84°56′18″W) in the Yucatan Basin. To estimate the significant wave height inside the lagoon, Hslag, the following transfer function was used.
To link the video-derived observations with the forcing variables responsible for sargasso movement, a numerical model was implemented (see map in Figure 4A). The sargasso dynamics inside the reef lagoon were simulated by reducing the process to two basic stages: “inflow” and “outflow.” The Delft3D model was implemented in 2D mode with a grid resolution of 50 m, which was forced with the observations of wind, tides and waves obtained from the measured conditions described above. The model was able to reproduce the general circulation of the lagoon, as reported in Coronado et al. (2007).
Sargasso inflow into the model domain was simulated using the “discharges” feature of the hydrodynamic module of Delft3D-FLOW. This works like a dye, with a given concentration and discharge rate that spreads through the modelling area at a specific time, following the hydrodynamics resulting from the flow–wave coupling. Every “sargasso discharge” had a concentration of 84 kg/m3 and a constant discharge rate of 0.01 m3/s for a simulation period of 7 days. This concentration gave a visualization of the dispersion.
From inspection of the video-derived sargasso coverage and the measured met-ocean data, the “inflow” scenario was implemented with mild winds of 3.5 m/s, and low-energy wave conditions, Hsoff = 0.3 m, Tp = 6 s, from the dominant direction (SE, 135° according to the Nautical convention). The “separation” scenario consisted of exacerbated hydrodynamic conditions with Hsoff = 1.0 m, Tp = 10 s, and a direction of 135°. In this scenario, two conditions were considered, one assuming a continuous inflow of sargasso from offshore (4 additional days of the simulation, 11 days in total) and the second with sargasso inflow for only the first days of the simulation, assuming a subsequent absence of offshore sargasso.
Beach cast dynamics
Since 2015, when the first massive sargasso beach casting occurred, many owners of land on the beach front have undertaken beach cleaning actions. A few have kept a systematic log of the volume of sargasso collected every day or, at least, the accumulated monthly volumes. These data have given us key temporal patterns at a very fine spatial resolution, at the local scale (<10 km), and are considered a direct sample of the proportion of casted sargasso.
Two hotels in Puerto Morelos, Now Jade and Moon Palace, contributed data on collected vegetation volumes from their beach cleaning for a combined distance of 3 km, for 2015 to 2020. The main aim of the beach cleaning in front of resorts is to have a comfortable, visually attractive, and smell-free beach. Therefore, the beached sargasso on the Moon Palace property is collected, mostly mechanically, and a detailed composition of the collected matter is not possible. Nevertheless, the log books of the collected sargasso include a qualitative indicator of what was the dominant material (seagrass or sargasso), so it contributes to the interpretation of the long-term sargasso beaching in this locality.
The time-series analysis of these data was done bimonthly, to standardize both data sources and make them comparable to satellite detected sargasso cover in time steps. We identified the spatiotemporal coincidences and divergences between the patterns of satellite-detected sargasso inside a 20-km in-water strip and the sargasso collected on the beach at Puerto Morelos, similar to Trinanes et al. (2021). The oceanic and atmospheric conditions were taken into account to analyse the temporal patterns. This comparison gives a better understanding of the association between the sargasso detected in the open sea and the coasting volumes, and volumes collected on the beach, in order to establish an indicative reference for sargasso influxes in the context of regional-scale systematic detection.
Results
Structured spatiotemporal patterns at different spatial and temporal scales were seen in the sargasso influx occurring along the Mexican Caribbean.
Regional-scale, high-resolution satellite detections
This systematic time series of medium-to-high spatial-resolution satellite detected sargasso coverage data from 2014 to 2020 for the Western Caribbean Sea. The observations start a year before the massive sargasso arrivals became recurrent, setting a baseline. The minimum coverage values were recorded from July to November of 2014, from March 2016 to December 2017, and then from October 2019 to May 2020. The highest sargasso coverage at sea was detected from the summer of 2018 to May 2019. In 2019, three peaks were detected: in January, April, and August, with minimum values in the period October 2019 to May 2020, close to zero, which meant 140 times less satellite detected sargasso than in the previous year. For 2020, there was a very clear summer peak (June–August), slightly more than half that of the historical maximum (≈160 km2) (Figure 5A).
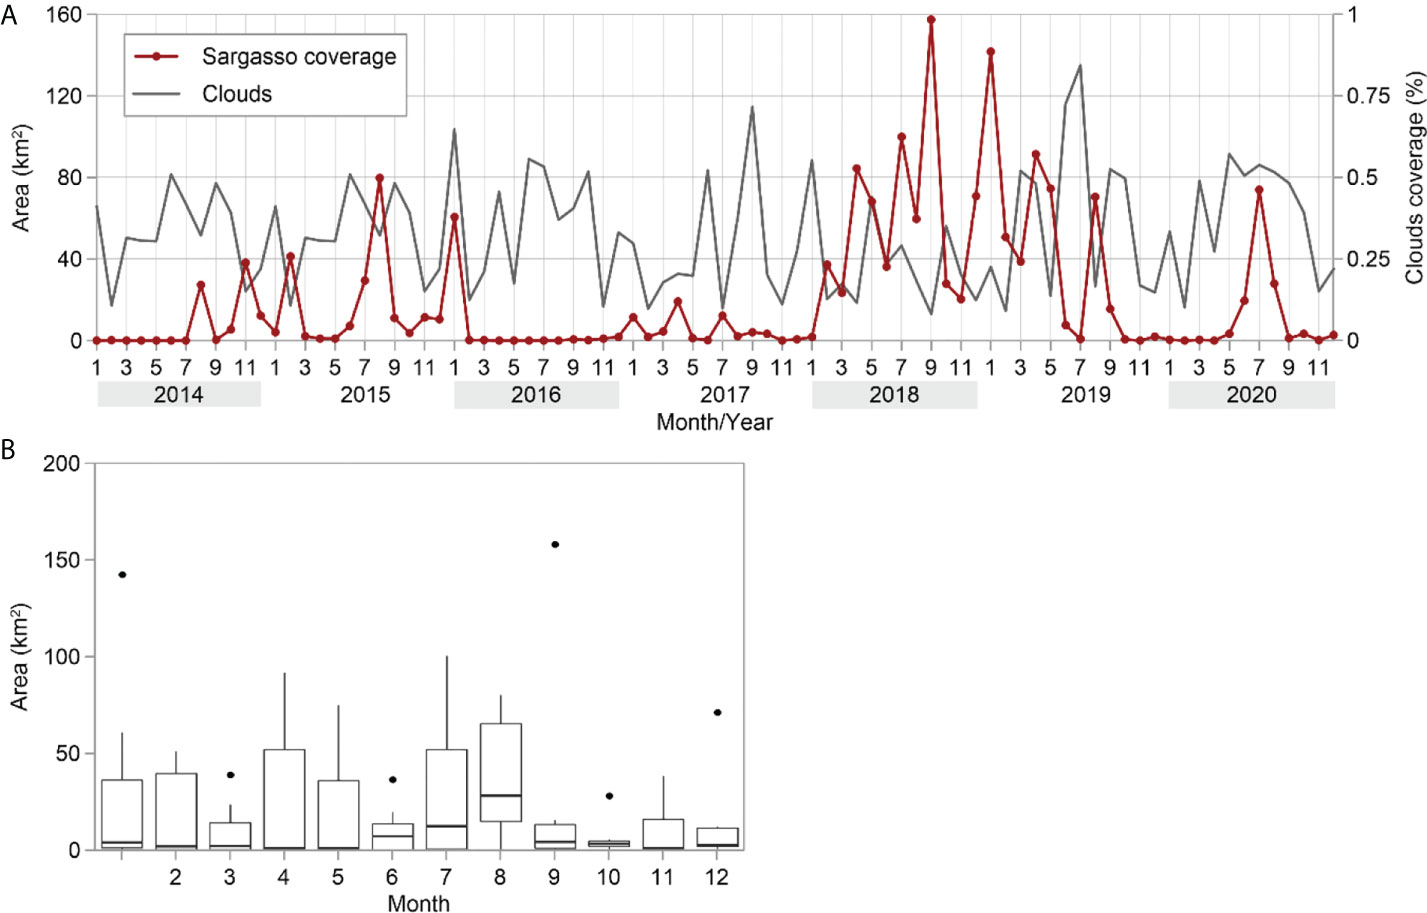
Figure 5 (A) Coverage of satellite-detected sargasso in the Mexican Caribbean, 2014 2020, and cloud coverage. (B) Area covered by sargasso each month. Rectangles represent the first and third quartiles, the middle line represents the median, the upper whisker represents maximum values, and black dots are outliers.
Even though the maximum medians occur in summer (Figure 5B), there is great variability throughout the year, meaning that medium to high sargasso coverage is possible in any month. This was the case for the sargasso peaks detected in December 2018 and January 2019, which were almost as high as the peak of September 2018. Excluding the summer months, April has the most variability in sargasso coverage, as it usually has low sargasso volumes, but in 2018 and 2019 there were large areas covered by the algae. Variability was also high in January and February, the former to a lesser degree but with the highest median of both.
Autocorrelation analysis through the autocovariance function shows that the coverage of sargasso in 1 month is significantly correlated with the sargasso in lags of 1 to 4 months (coefficient > 0.2; p< 0.05), with lag = 4 higher than the although the correlation of lag = 4 is higher than the second and third lags (Supplementary 3; Figure 1).
The accumulated sargasso coverage varied significantly between regions in the Mexican Caribbean (H = 36.04, N = 24, p = 0.0001). The near-shore segments tended to have higher sargasso coverage and recurrence than areas offshore. The segments in the north and centre, 04 (Akumal), 02 (Puerto Morelos), and 03 (Playa del Carmen), had the highest cumulative sargasso coverage during the analysis period (Figure 6C). In these segments, some hexagons had over 40-km2 coverage.
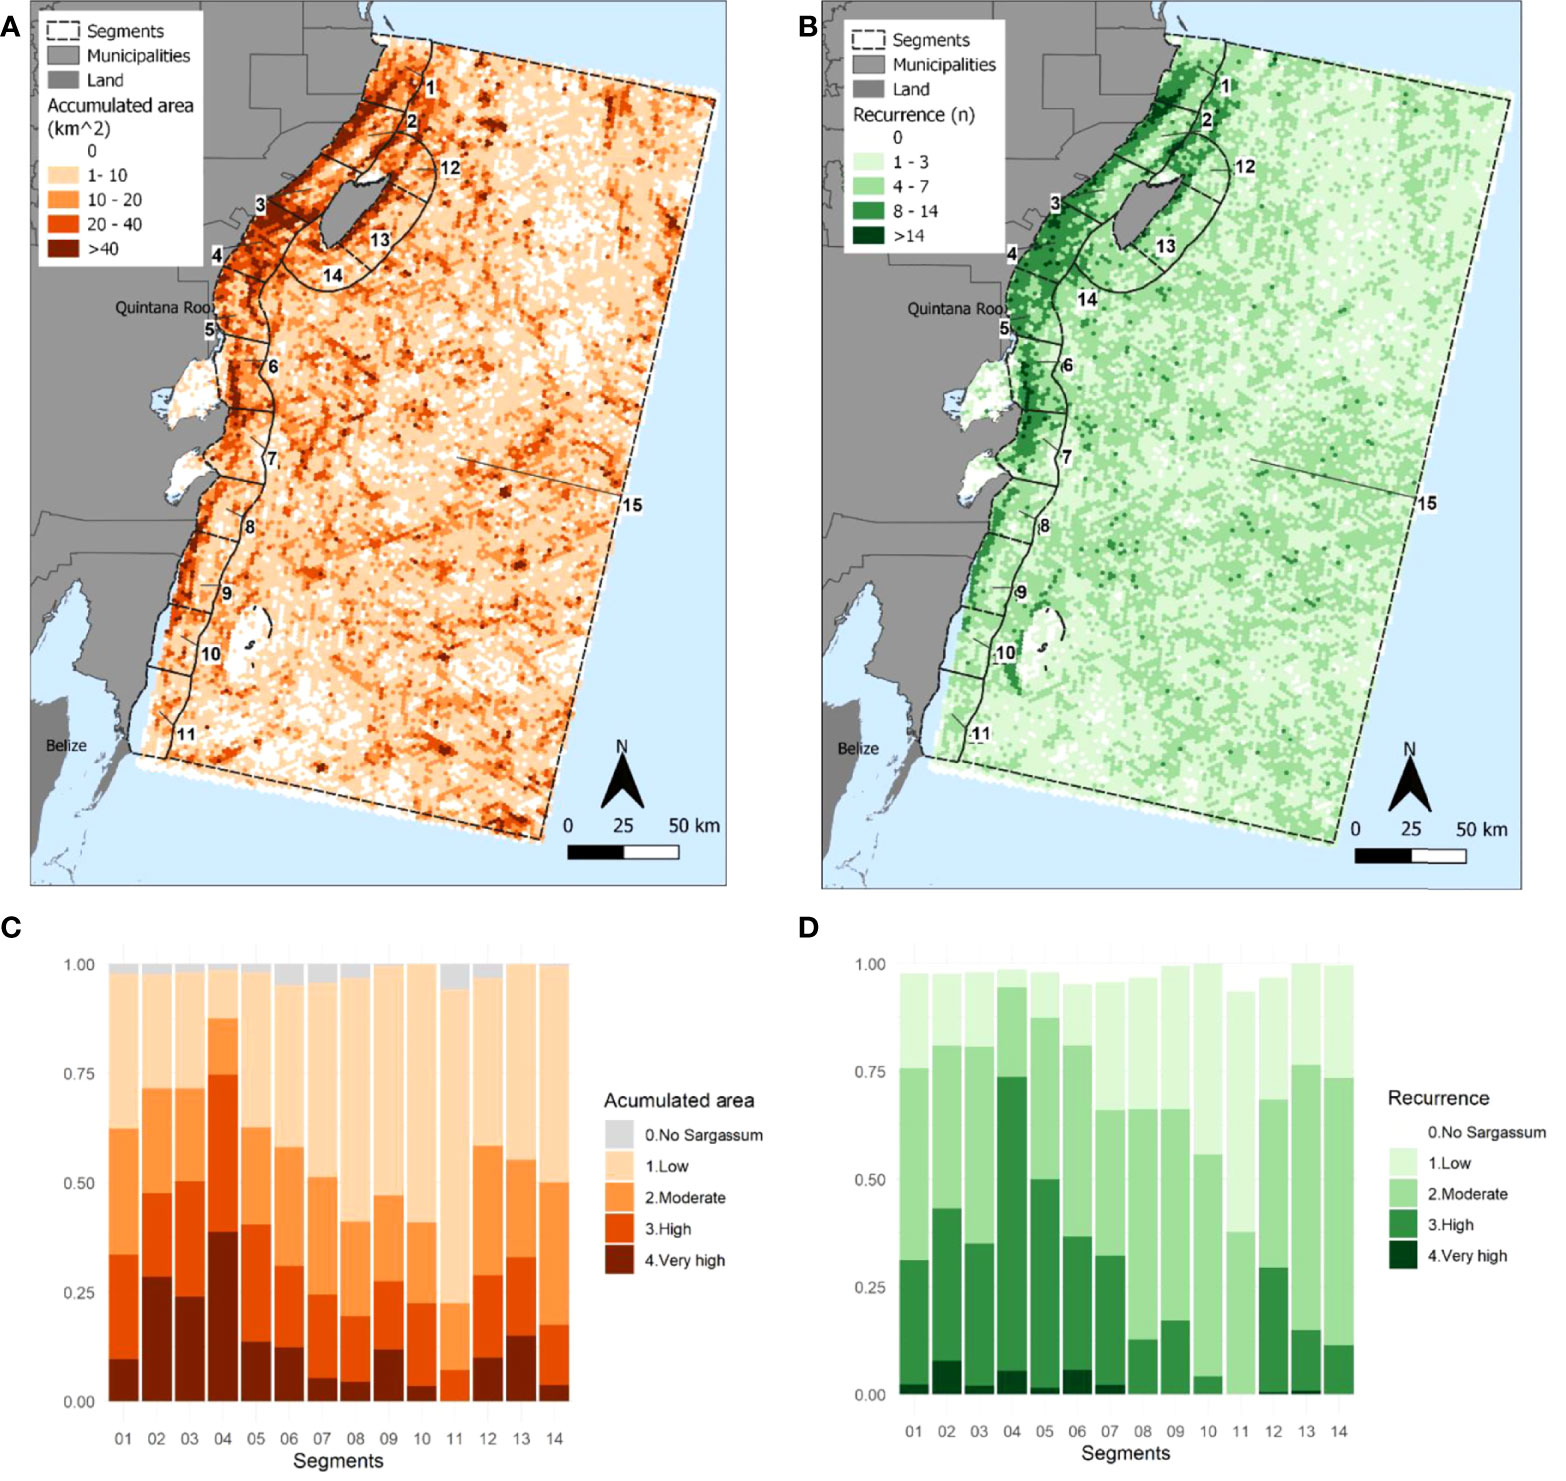
Figure 6 Sargasso coverage (2014–2020) off the Mexican Caribbean coast; the numbered areas are coastal segments ≈30 km long. (A) Accumulated area, (B) recurrence, (C) categories of accumulated area of sargasso in the coastal segments, and (D) categories recurrence of sargasso per coastal segment.
Based on the categories of cumulative sargasso coverage (Figure 6C; Table 1) segment 04, central-northern Tulum and southern Solidaridad municipalities, had the largest proportion of very high and high cumulative areas, totalling almost 75%, with 25% of the area having moderate and low accumulated coverage (Figure 6A). In segments 02 and 03, about 50% of the area had very high and high sargasso coverage.
The lowest cumulative sargasso coverages per segment were recorded in the south of the study area (segments 08, 10, and 11), with less than 25% of area covered with very high and high cumulative sargasso coverage, although segment 09 (Mahahual) had very high accumulations in more areas than in the adjacent segments. It is important to notice that this study did not cover all of the in-water area of segments 9–11, so their values may be underestimated. However, different patterns are not expected, as only a very small part was not accounted for (Figures 6A, B).
Most of the segments have an area of high cumulative coverage, less than 10 km from shore. There were a few exceptions, such as at the entrance to the Cozumel channel, where a strip of areas with more than 40 km2 of accumulated sargasso was detected, but this was the only segment where the whole polygon had a high cumulative coverage (Figure 6A) and the only one to have a strip of over 20 km of high coverage. Segment 01 (Benito Juarez) also has a different spatial pattern, with large amounts of sargasso in a shore-divergent strip and a small amount of accumulated sargasso on the north shore.
Sargasso was detected in at least 8 months (10% of the time series) on almost all of the coast, with >17% recurrence (14 months) in the area in front of Puerto Morelos and Tulum (segments 02 and 04), as well as part of the Felipe Carrillo Puerto coast (segments 06 and 07) (Figure 6D; Table 1). Almost 75% of the segments were covered by the classes high and very high recurrence (Figure 6D). Nevertheless, in segments 02 (Puerto Morelos) and 06 (Ascension) very high recurrences were recorded, as in segment 04 (≈45% of very high–high categories). The segment with the least cumulative sargasso coverage and recurrence was segment 11, followed by its northern neighbour, segment 10, although the underestimation here must be considered (Figure 6D).
In the open sea, high cumulative sargasso coverages were recorded along disperse and intricate sargasso streams (Figure 6A), where recurrence values were mostly less than 7 (months), although north of Cozumel island in the central eastern area, the sargasso was found more frequently (Figure 6B). In the central eastern area, the sargasso was more frequent (four to seven times, i.e., 5% to 8% of the time) than the southwest and in the north of segment 15 (Marine area) (Figures 6B, D). It is also important to notice that high recurrence values were recorded (8—over 14 times) north of Cozumel island, similar to those in the coastal fringe.
Combining the accumulated coverage and recurrence values of sargasso (Table 1; Figure 7), segments with frequent and high coverages of sargasso are found, mainly segments 01 to 06. Off Puerto Morelos (the north of segment 02 and south of segment 01), and in the inlet of Ascension Bay (06, Ascension), these extreme sargasso patterns have a well-defined spatial configuration (Supplementary 3; Figure 2). Classification also showed areas with frequent, intense events, particularly in segment 04 (Akumal).
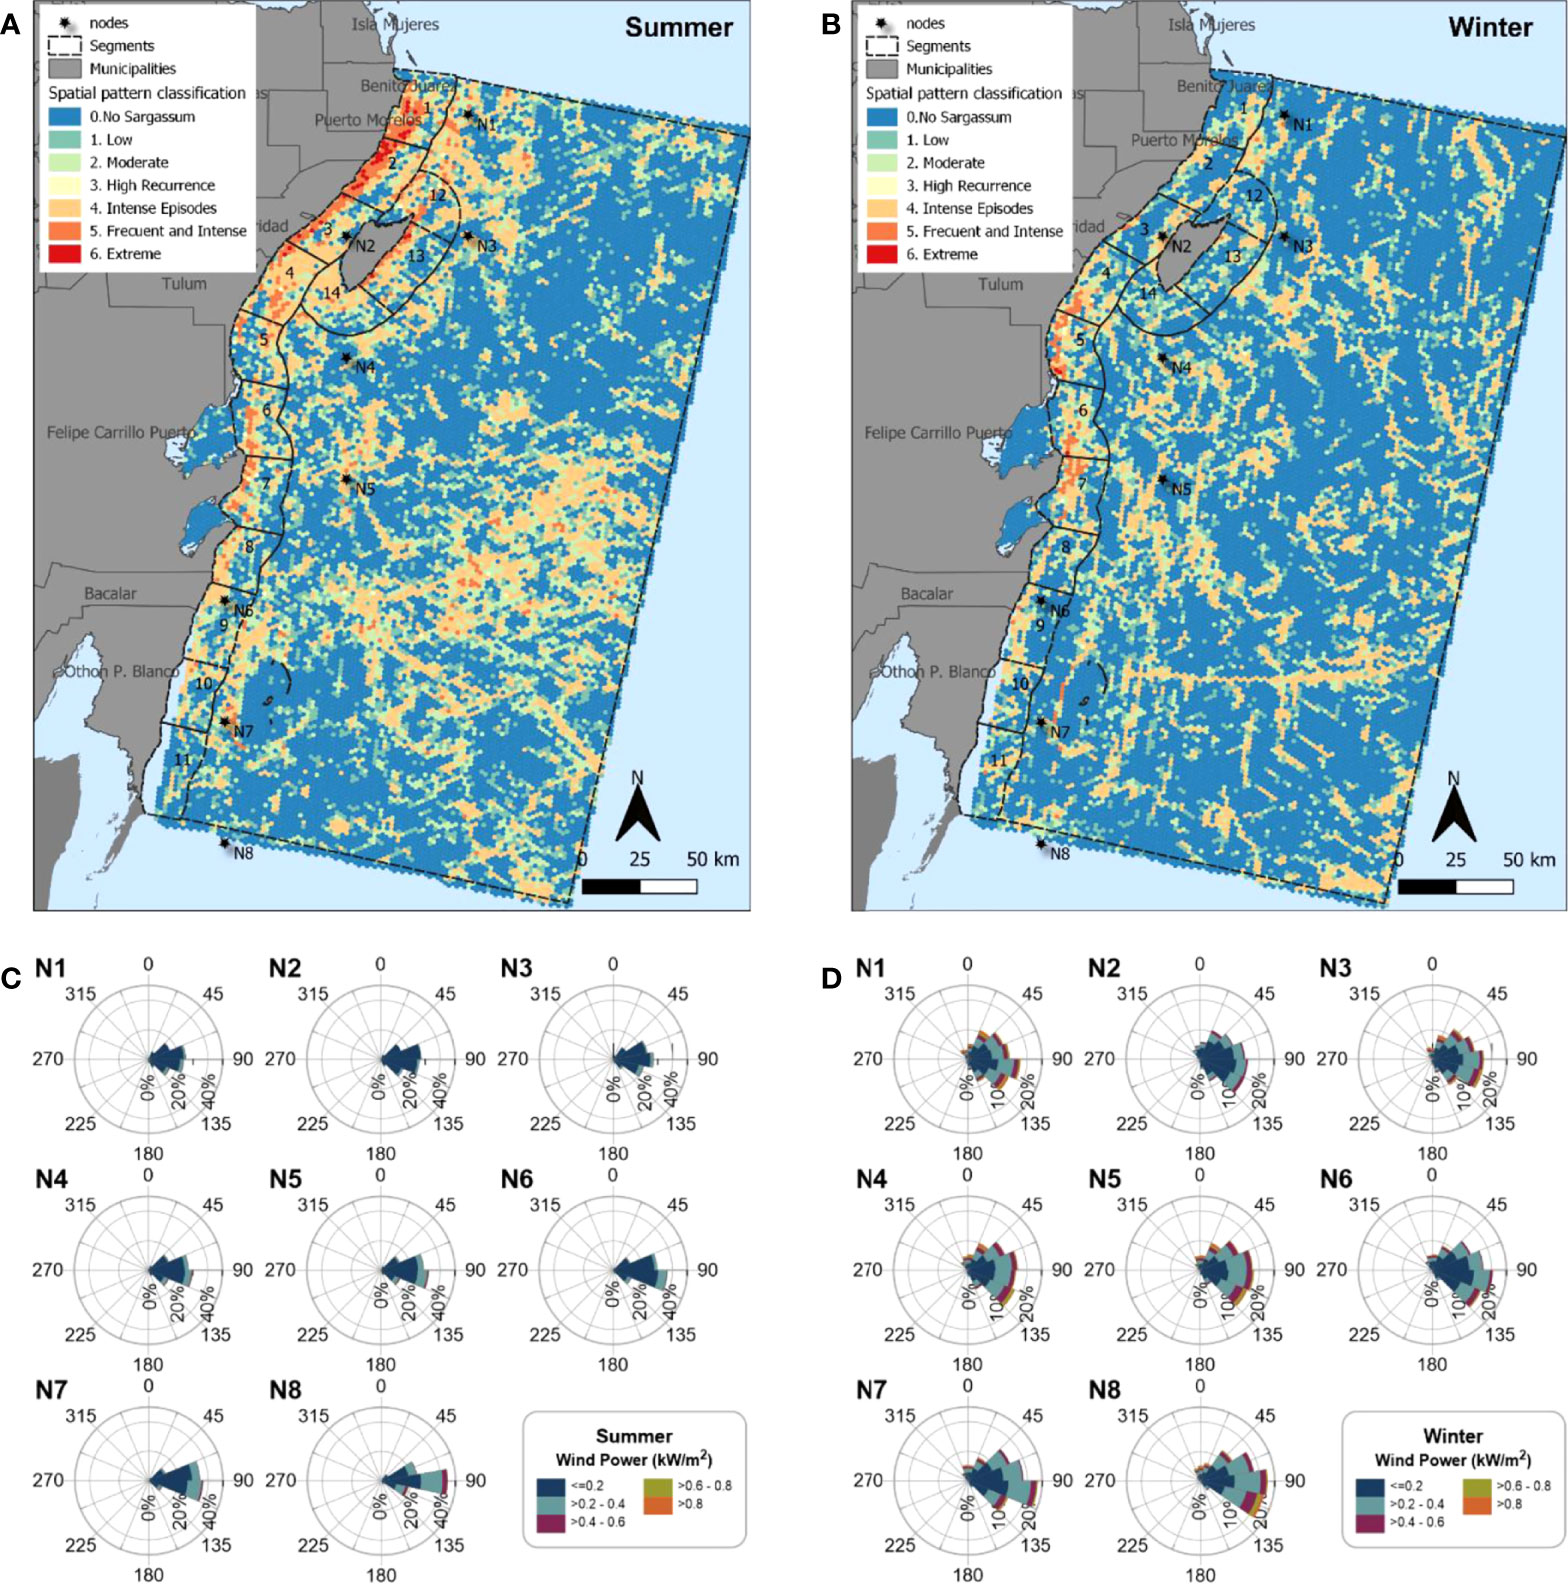
Figure 7 Spatial sargasso pattern classifications for (A) summer and (B) winter. The black stars show the nodes where climate data were recorded. Wind power charts for 2014–2021 in (C) summer and (D) winter.
The seasonal dynamics of sargasso coverage in the coastal segments, with maxima in the summer, are influenced by the dominant winds, ≤0.2 kW/m2 (≤6.9 m/s), coming from the east/east–southeast (67.5°–112.5°) and which are stronger in the south (nodes 5–8) (Figure 7C). In spring, frequent and intense events were also quite common, as high as summer values in segment 04 (Akumal) (Supplementary 3; Figure 3). The strong influence of more powerful winds >0.2–0.4 kW/m2 (>6.9–8.7 m/s) from east/southeast–east (90°–135°) was also observed in spring.
In winter (Figure 7B), sargasso was seen less frequently and with lower coverage in most of the segments, with only a few areas in the extreme category (very high recurrence and coverage), south of Tulum (segments 5–7), where similar or even larger areas had more frequent and intense sargasso coverage than in summer. Areas without sargasso were observed in segments 01–04 and 12–14, increasing from ≈25% of the area in summer, to more than 50% in the winter, including areas very close to the shore, a change that occurred to a lesser degree in segments 05–08. This can be explained by the high variability in wind direction in winter, from 67.5° to 135°, with prevailing wind power of 0.2–0.4 kW/m2, commonly reaching >0.4–0.6 kW/m2 and even >0.6–0.8 kW/m2 (Figure 7D).
There were intense episodes (Table 1), however, all along the coastline. The spatial pattern of these intense episodes differs from those of the summer, in the open sea mainly but also around Cozumel Island (segments 12–14), Puerto Morelos, and Solidaridad.
Cross-validation of satellite-detected sargasso and beached sargasso
On 13 July 2018, from 9 a.m. to 12 p.m. (local time), we flew over an area covered by the Landsat scene path 018, row 045, spanning the satellite acquisition time of around 11 a.m. We took over 800 geolocalized photographs of sargasso rafts, from the Cancun to the open sea. A subset of well-consolidated sargasso rafts that were observed from the plane at approximately 11 a.m., in a cloud-free area, was chosen to compare with the sargasso multi-index of this site. The selected rafts were positively detected in the satellite image (Figure 8), and the spectral features of the objects detected as sargasso in the Landsat 8 images were radiometrically similar to the sargasso rafts photographed from the plane. The third largest area of sargasso detected in this study (Figure 5A), and one of the largest sargasso volumes collected from the beach (see Section 3.3), coincided with the date of the aerial observations.
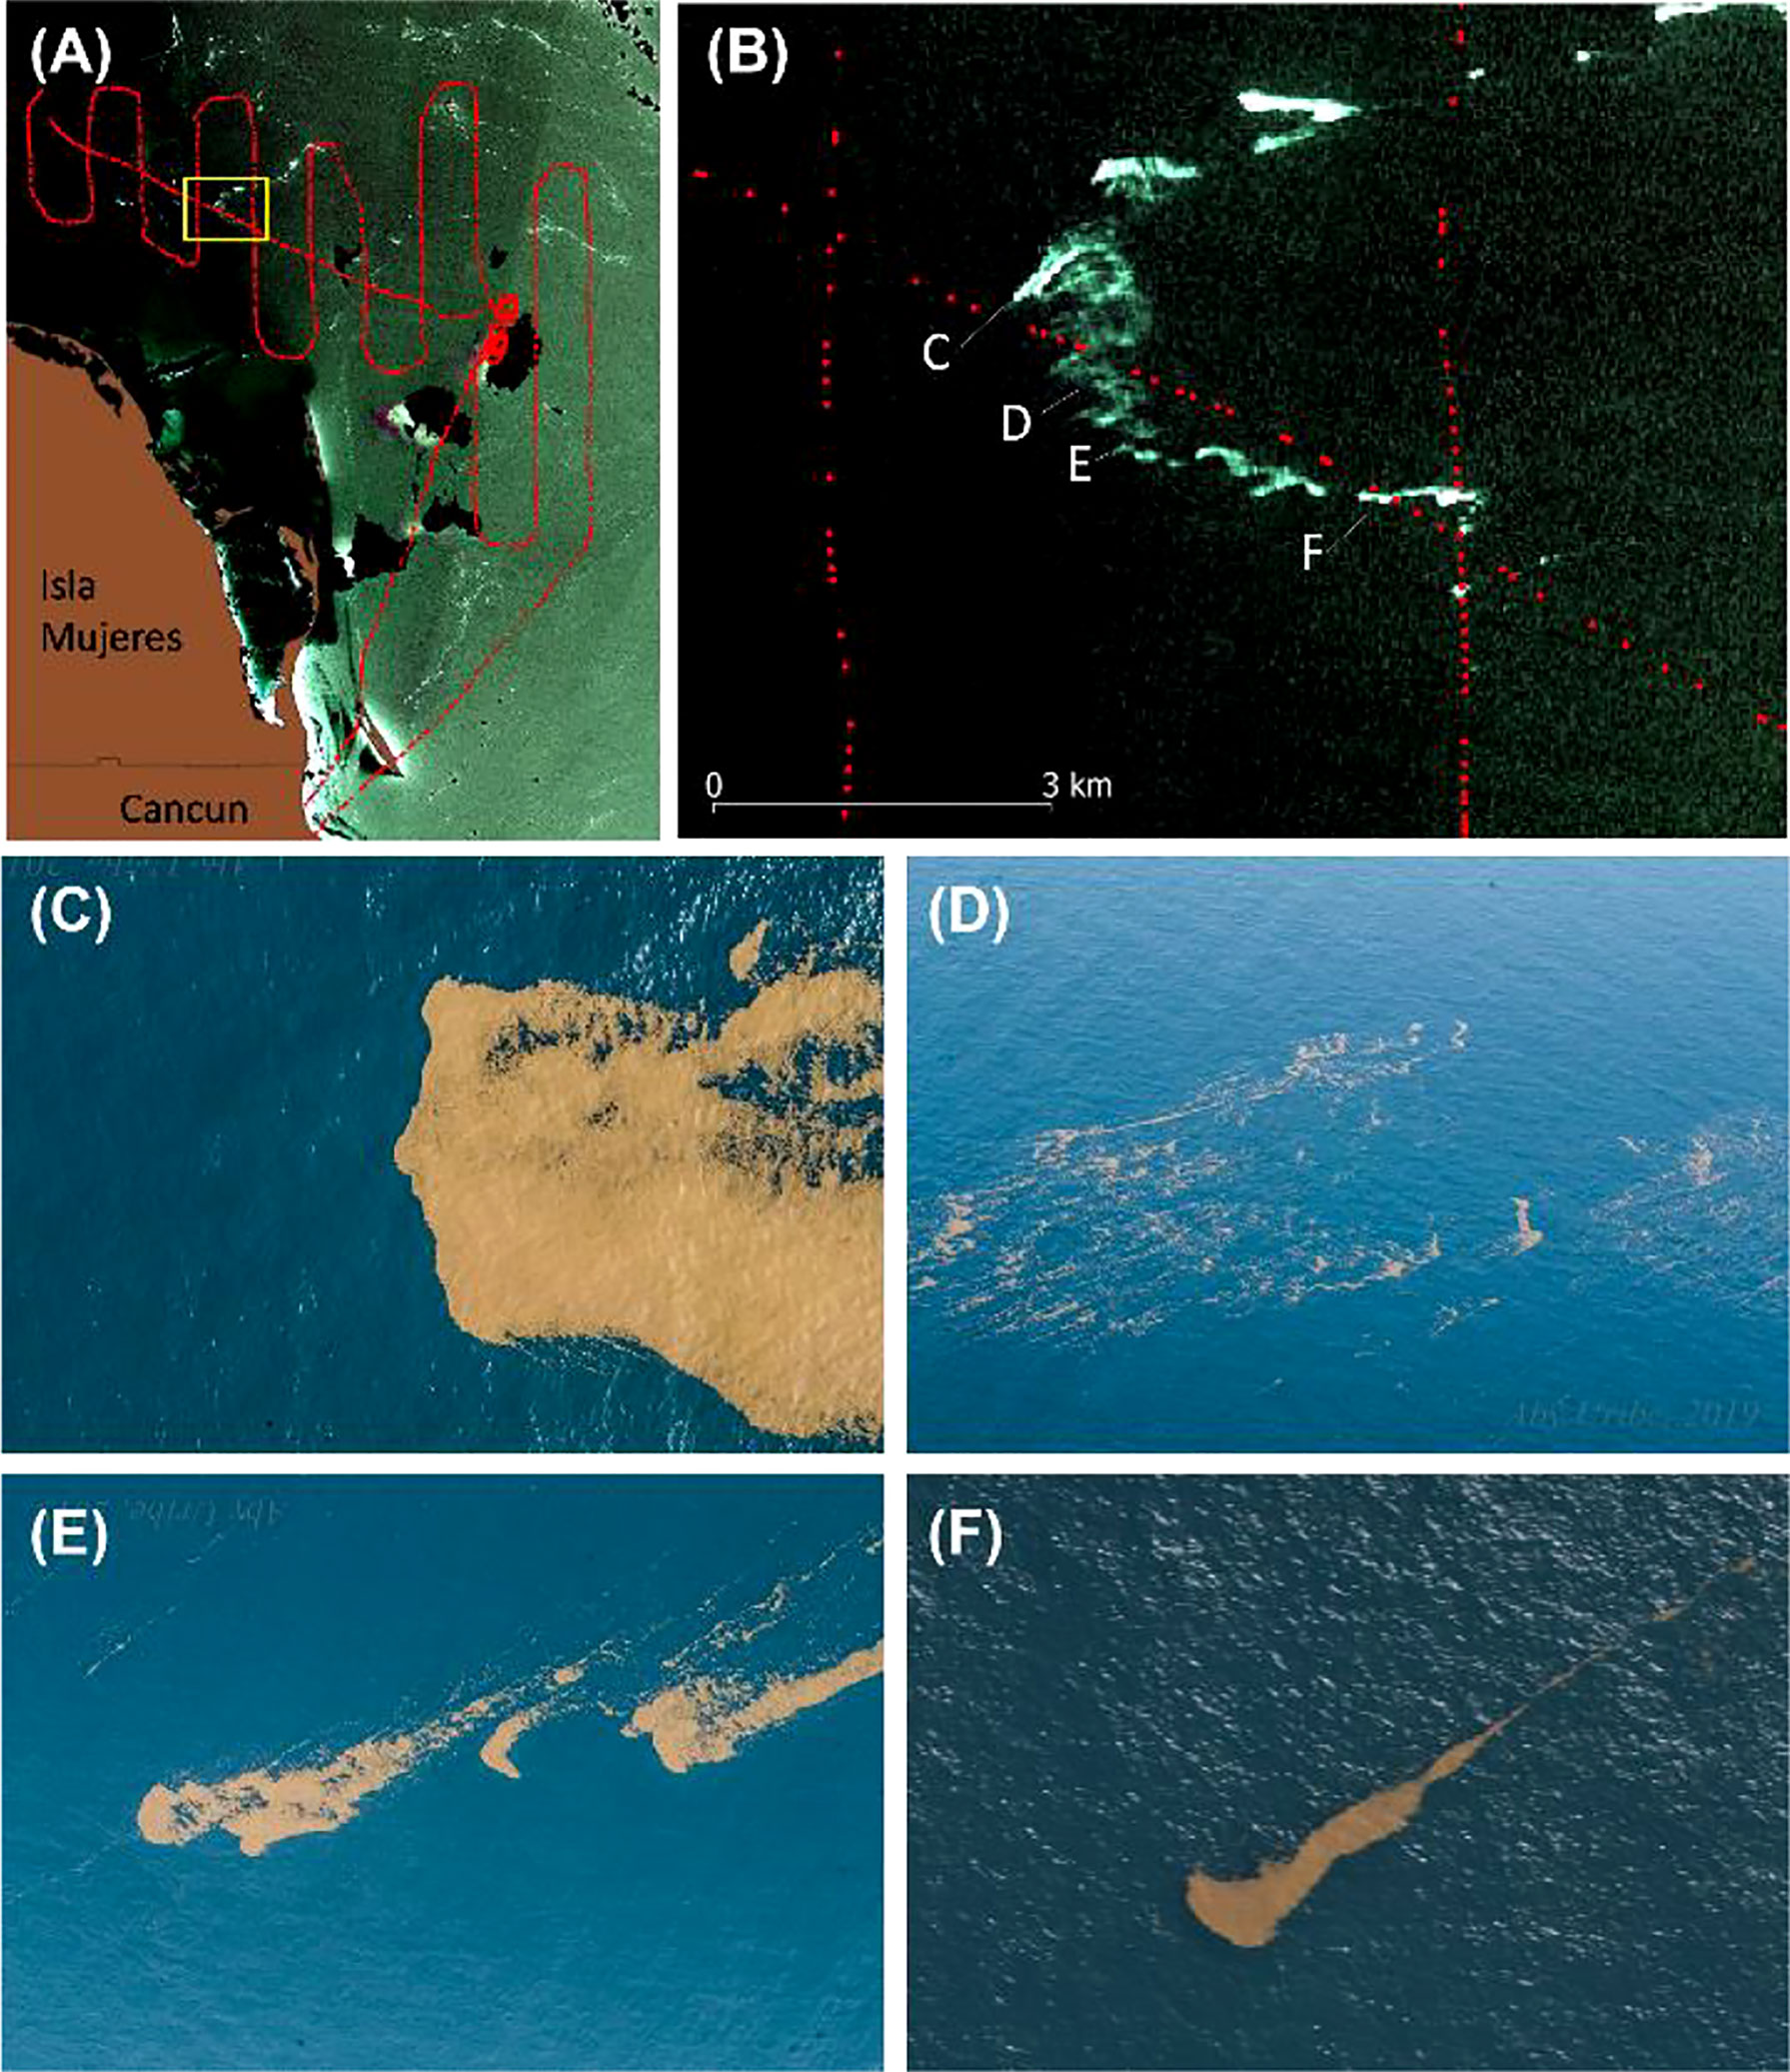
Figure 8 (A) A multi-index composite of a Landsat 8 OLI satellite image and aerial photographs of the same sargasso rafts, from 13 July 2018. (B) Close-up of the area observed at the time of the image acquisition (11:06 a.m.). Red dots show the photograph locations, and the white to light green shows the sargasso multi-index detection; (C–F), aerial photographs of sargasso rafts photographed at approximately the time the satellite passed overhead.
Local beached sargasso dynamics-video images
Analysis of 1,019 images of the 210-m beach section, September to December 2015, showed that the largest accumulation of beach-cast vegetation (mostly sargasso) along the beach (area ~4,200 m2) was in September, covering an area of ≈1,600 m2 (Figure 9). This area subsequently decreased, to less than 400 m2, by late October.
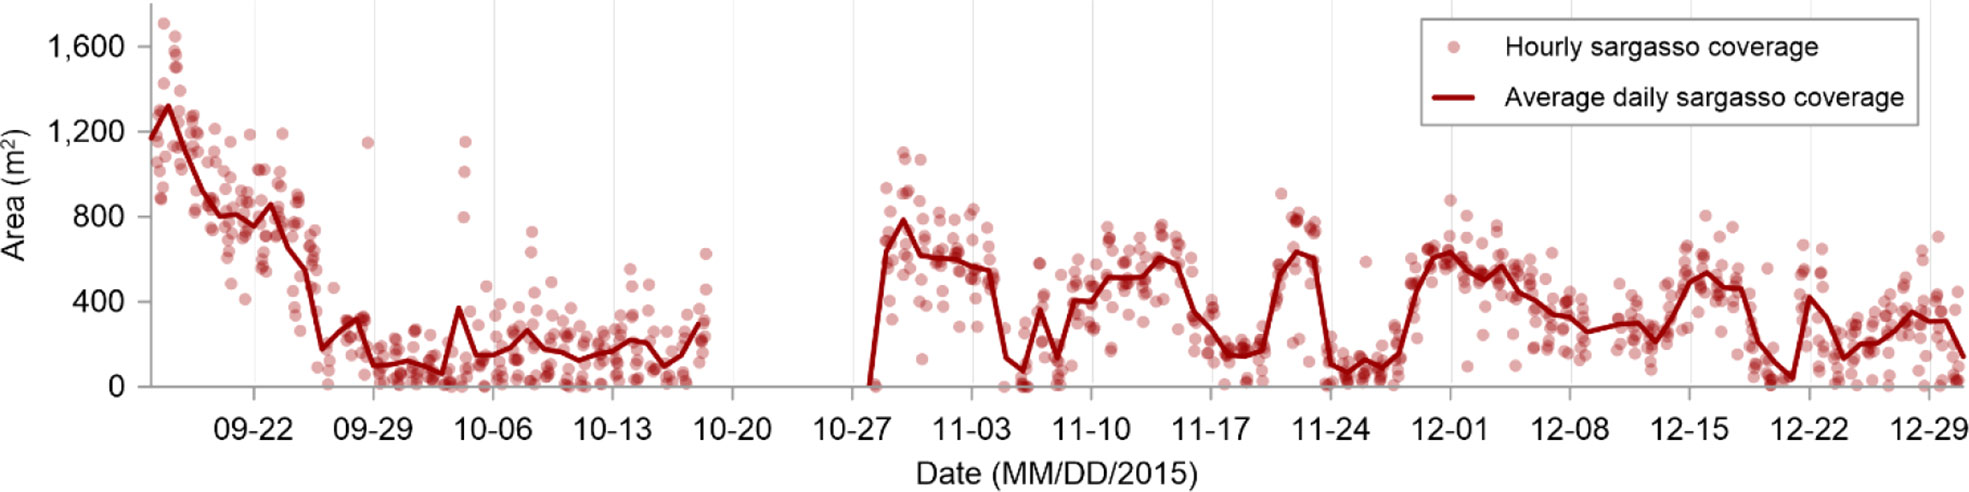
Figure 9 Time series of the coverage of beach-cast vegetation (mostly sargasso) for the beach section studied, at Puerto Morelos, September–December, 2015. There are no data in mid-October due to camera failure.
Although the amount of beach wrack varied daily, a pattern between the oceanographic parameters and wrack coverage was observed in this period (Figure 10). When there was over 500-m2 wrack coverage on the beach for more than 3 days, the average wind speed was<4 m/s, Hslag ≤0.3 m, and tidal range ≤0.25 m, conditions favourable to arrival. This occurred eight times in the study period (red boxes in Figure 10), with September being the month with most wrack coverage. These low-energy conditions, with gentle winds, low Hs, and neap tides, are typical summer conditions in the region; this is the season when the massive arrivals of sargasso have occurred most often in the last 5 years.
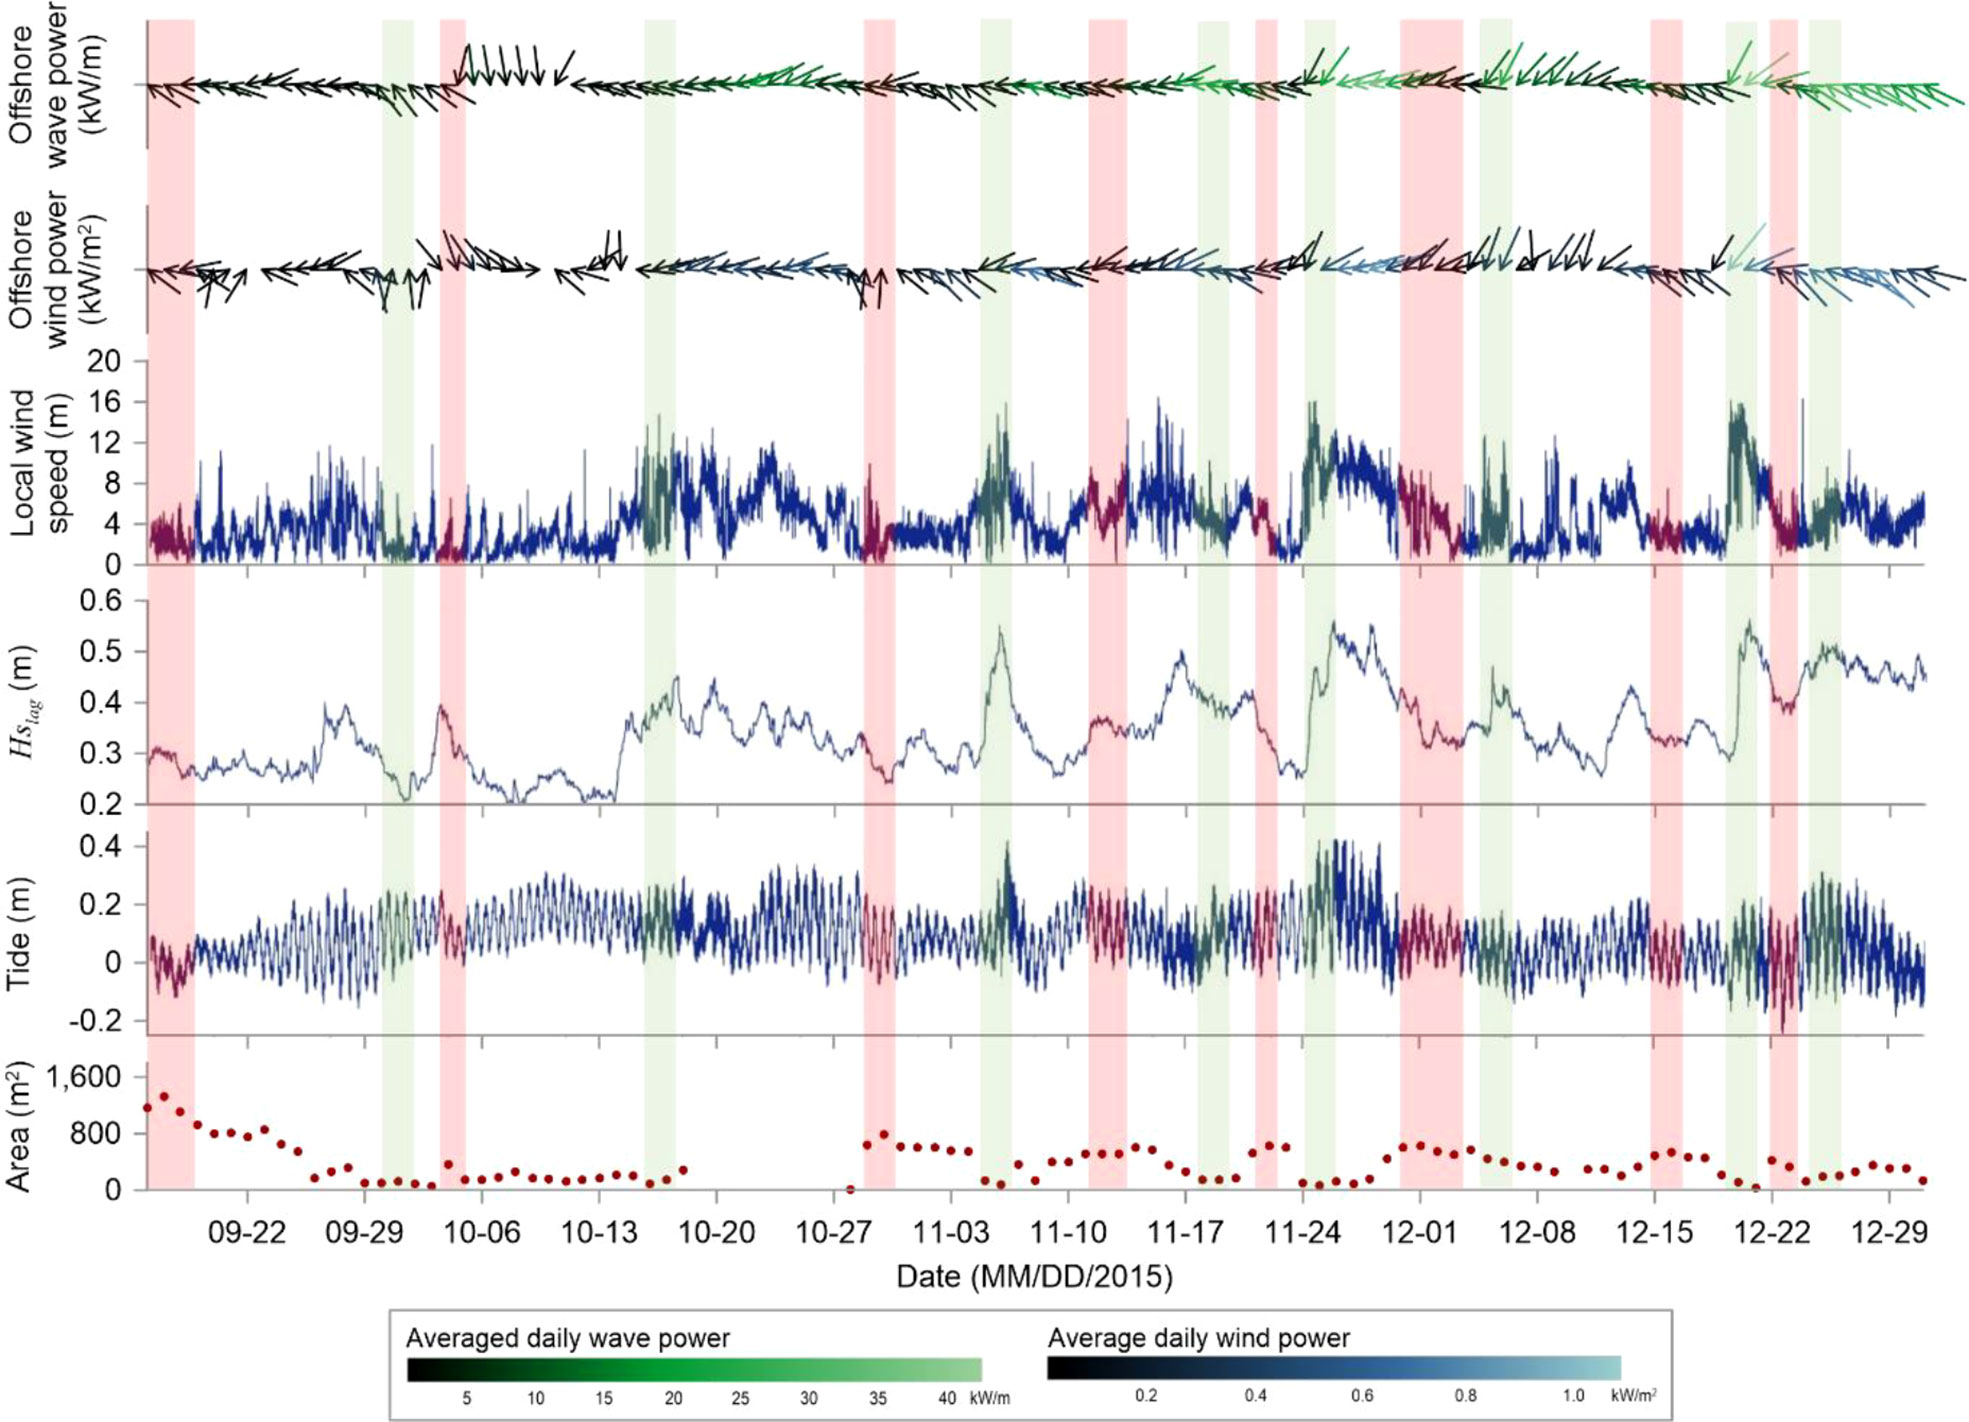
Figure 10 Time series of oceanographic variables and wrack coverage for the beach at Puerto Morelos, September–December, 2015. The red boxes show arrival events, and the green boxes separation events.
Wrack event separation (natural removal), shown by green boxes in Figure 10, was seen when wrack coverage was less than 160 m2 for 2 or 3 consecutive days and was related to high-energy conditions—wind speeds over 10 m/s and Hslag > 0.4 m in the reef lagoon. These high-intensity sporadic events activate the circulation in the reef lagoon, reducing the residence time of the wrack and favouring its movement towards the open sea. The resuspension of beached wrack is induced by spring tides and waves, which create a wide swash zone where the wrack is pushed offshore into the reef lagoon, and its eventual exit.
These results were partly confirmed by hydrodynamic modelling. The arrival scenario (Figure 11A) of low-energy winds and waves showed cross-reef (onshore) transport of the dye through the reef tops, with a maximum velocity of 0.01 m/s. Two major pathways were observed, in the north and south of the lagoon, and the interaction caused great accumulations in the central part of the lagoon. In this scenario, by day 2 of the simulation, there are inflows from both offshore sources. Day 3 shows the lagoon partially covered with sargasso, and by day 7 the lagoon is completely covered (see Figure 11A). Even though it is known that sargasso arrives as patches or strands, the discharge feature does not permit modification of the shape of the discharge (dye) as it spreads through the area. Therefore, as an approximation of the dynamics of sargasso inside the lagoon, it was assumed that the lagoon was fully covered with the algae.
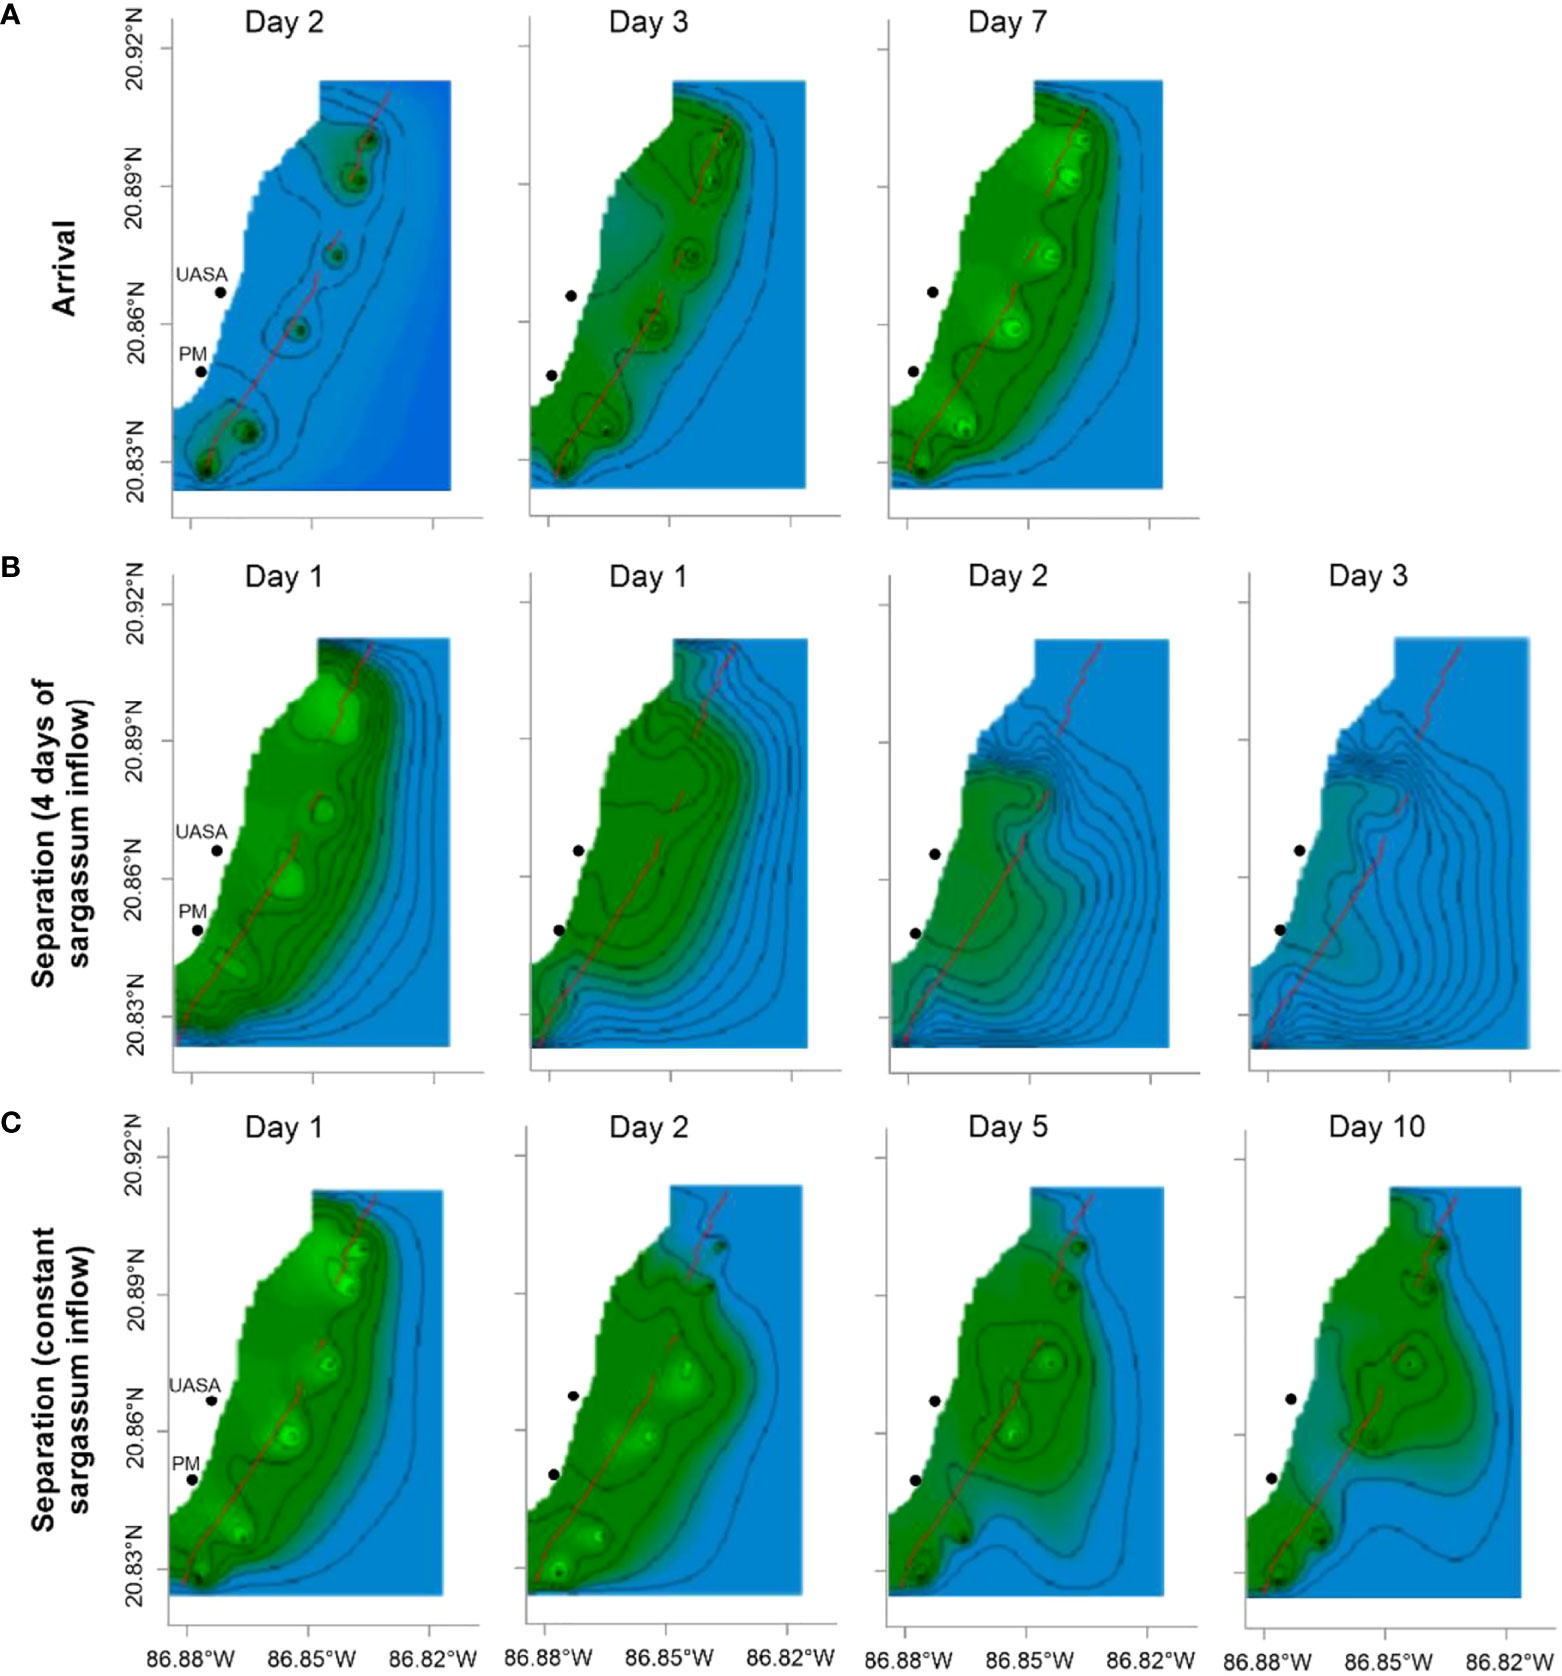
Figure 11 Concentrations of drifting rafts obtained by numerical modelling of the arrival and separation of sargasso in Puerto Morelos. Lighter (darker) green shows larger (lower) sargasso concentrations. (A). Arrival scenario;(B) Separation scenario for 4 days of sargasso inflow. (C) Separation scenario with a constant inflow of sargasso. The black dots in all the panels show the location of the UASA-UNAM (top) and the town of Puerto Morelos (bottom). The red line indicates the position of the reef crest.
On the other hand, in the separation scenario, with more dynamic hydrodynamic conditions, the main outflow is through the main discontinuities of the reef (mouths), to the south and northeast of the lagoon. Figure 11B shows the first separation scenario: 4 days of inflow and then a stop. On day 1, the lagoon is fully covered, especially in the north and centre (light green). Then, also on day 1, the outflow starts through the reef openings (southern and northeast regions). On day 2, the north is completely free of dye, and there is only a minor accumulation in the south. Finally, on day 3, the lagoon outflow is complete, sargasso-free, showing that the high-energy conditions can clear the lagoon of sargasso.
However, this is not always the case: sometimes the sargasso arrivals are constant and accumulation continues, mainly in the north and in zones of flow convergence, despite high-energy conditions. Figure 11C shows that on day 1 of the second separation scenario, with high-energy conditions and a constant inflow, sargasso rafts occurred throughout the reef lagoon. On day 2, an outflow of sargasso through the mouths is observed. The northern region seems to clear, but by day 5 of the simulation, sargasso rafts are present everywhere again, until the end of the simulation. On day 10, only the central region was clear and there were two main concentrations of sargasso, in the north and south of the lagoon.
The simulations only give an approximation of the dynamics of drifting wrack (sargasso) within the lagoon, since the dye concentrations do not behave in exactly the same way as the sargasso rafts, although it helps to understand the potential cover of the algae and its dispersion.
Beach cast dynamics
In 2019, when data were available for the beaches at both Moon Palace and Now Jade, the dynamics of the beach-cast wrack had the same pattern at both sites. The largest amounts of beach-cast wrack were collected in May and June, >10,000–>20,000 m3/km from the Moon Palace Beach (Figure 12A). Another peak in beach cast occurred in May–June 2018, although the volume was lower (<10,000 m3/km) (Figure 12A). Although there were marked differences showing a knowledge gap in the offshore–inshore transition (Figure 12B), the satellite-detected sargasso observed in the subarea and the beach-cast wrack at Moon Palace episodically showed similar temporal patterns throughout the period.
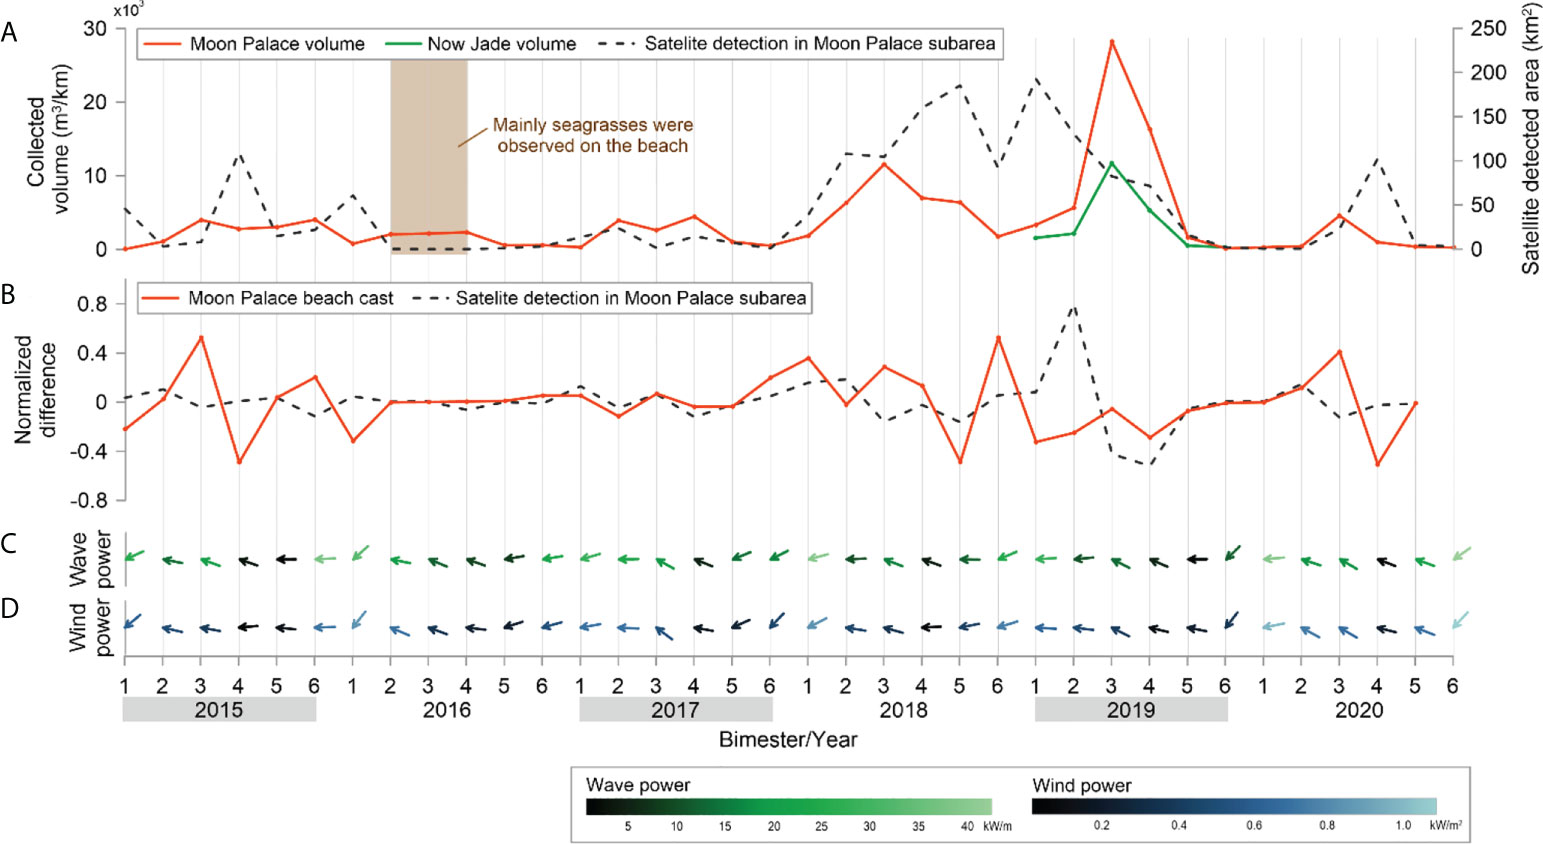
Figure 12 Bimonthly analysis of the beach-cast vegetation and sargasso quantification from satellite detection. (A) The collected wrack from the beaches at Moon Palace and Now Jade, and the satellite-detected sargasso rafts in the area adjacent to the Moon Palace (for location see Figure 3). (B) instantaneous normalized difference (t2 – t1) of sargasso quantification from satellite detection and data on Moon Palace collection; (C) bimonthly mean wave power; (D) bimonthly mean wind power. Both (C, D) were calculated for the nearest ERA5 node (N1: 21.0°N, 86.5°W) (for location see Figure 3).
The beach-cast wrack at Moon Palace is mostly a combination of seagrasses with sargasso (i.e., sargasso being less abundant), followed by a mix of sargasso and seagrasses (Supplementary 3; Figure 4). A cast of pure sargasso occurs mainly in summer but also in January and to a lesser degree in December, then the influxes start in April, when a mainly sargasso collection was recorded, coinciding with the peaks in the satellite detections (see section 3.1).
For March to July 2017, discrepancies between the wrack collected from the beach and the satellite detected sargasso were observed, which may be attributable to differences in wrack composition. Logbook records indicate that in these months most wrack was seagrass. The largest discrepancies were found for the time of the highest sargasso fluxes, September–October 2018 and May–August 2019.
Discussion
While there are numerous published works on ocean-scale monitoring and forecasting sargasso spread and dynamics (Brooks et al., 2018; Putman et al., 2018; Wang et al., 2019; Trinanes et al., 2021; Wang and Hu, 2021), local and regional patterns in countries affected by sargasso in the Caribbean is limited, when such information is key for management and decision making. This is the longest (2014–2020) systematic time series of medium-to-high spatial-resolution satellite-detected sargasso coverage data for the Western Caribbean Sea to be published.
Satellite-detected sargasso is the most effective and efficient strategy for long-term monitoring (Marsh et al., 2021; Wang and Hu, 2021). There is still room for improvement in this strategy, as with any methodological approach, but as it is standardized and systematic, the spatiotemporal patterns give a robust background and a tool for decision making, management, and ecological restoration. As the ocean hydrodynamics are a key driver of sargasso distribution and dynamics (Brooks et al., 2018; Putman et al., 2020), knowledge of local and regional hydrodynamics is essential. By combining analysis of satellite images at the regional scale, with local observations on sargasso beaching, and hydrodynamic modelling, we increased our understanding of the dynamics and potential drivers of the beaching of sargasso biomass. It is also important to be able to recognise knowledge gaps in the understanding of variability closer to the coast, where the transition from oceanic to coastal dynamics occurs.
The present study offers spatial and seasonal patterns of sargasso coverage, together with wave and wind climates, to give a general panorama of the phenomenon, where atmospheric and oceanographic conditions drive sargasso distribution and beaching in different ways, depending on the spatial and temporal observation scales, as well as the location of the observations. This study did not reveal any particular area of aggregation of sargasso in open waters, although some complex shapes of cumulative coverage were detected, presumably underlining the paths of the dominant ocean currents. The spatial recurrence patterns of sargasso distribution in the open sea show no major recurrent areas, maybe because of the highly dynamic oceanic conditions. The highest cumulative sargasso coverage and the highest recurrence rates occur on the coast, mainly in the centre and north of the Mexican Caribbean. How the maritime climate drives the sargasso influx onto the beaches is still patchy, however, and is the subject of several local-scale oceanographic works.
There are several studies on the hydrodynamics of the Yucatan Current (Ochoa et al., 2001; Candela et al., 2002; Candela et al., 2003; Ochoa et al., 2005; Cetina et al., 2006), but the maritime climate at the local scale has been little studied. Carrillo et al. (2015) studied the coastal circulation off the Mesoamerican Barrier Reef System, including the Mexican Caribbean, and described the influence of the Cayman Current on the Yucatan and other local currents. This depends on the latitude where the former encounters the Mexican Caribbean continental shelf.
The Cozumel island splits the Yucatan Current into two, while its western shore lies in the highly dynamic Ascencion-Cozumel Coastal Eddy (Carrillo et al., 2015) and the eastern shore has oceanic regimes more similar to the Yucatan Current, with stronger and more focused flows (Chávez et al., 2003; Ochoa et al., 2005; Athié et al., 2011; Alcérreca-Huerta et al., 2019) that induce on each side of the island a specific sargasso spatial configuration. In the present work, the area south of the Cozumel island was seen to have the highest cumulative satellite-detected sargasso coverage at sea (Figures 6A, B), presumably because of the slowing in the speed of the current in this area. North of Cozumel, where the Yucatan Current is fully developed (current speeds of approximately 1 m/s), sargasso is transported by more steady currents, inducing differences in the accumulations on the east and west shores of Cozumel.
Sargasso can be found in the Western Caribbean in all months, with increased coverage and recurrence in the summer, when the impact on the coasts was severe, mainly in the north of Quintana Roo (van Tussenbroek et al., 2017; Casas-Beltrán et al., 2020; Chávez et al., 2020; Rodríguez-Muñoz et al., 2021). Despite this clear seasonal pattern, intense episodes are seen all along the coast in fall and winter, except on the western side of the Cozumel Channel. The numerical modelling of the Puerto Morelos lagoon showed that sargasso cast is more likely to occur in summer due to lower wave energy, while in winter there are stronger energy pulses with higher magnitudes and a northeastern wind direction. Onshore sargasso dynamics had already been described before for Puerto Morelos by Garcia-Sanchez et al. (2020) and Rutten et al. (2021) who reported similar interannual variability in the influx to that reported in this work, although over shorter observation periods. Rutten et al. (2021) reported that the greatest sargasso beachings were in 2018 and 2019 and that 2016 was a mild year; this pattern is mostly consistent with the sargasso coverage time series reported, although in 2020 offshore sargasso coverages are comparable to those of 2019 (Figure 5).
The higher onshore accumulation of sargasso biomass in the summer months can be explained by various factors. In summer (July–September), the greatest and most frequent sargasso coverage occurs offshore, coinciding with onshore beaching events. The greatest sargasso coverages close to shore were found in calm maritime conditions (≤0.2-kW/m2 winds), with the dominant winds coming from east/east–southeast (Rutten et al., 2021; this study). However, when oceanographic conditions are more variable, there are notable differences between sargasso available at sea and the wrack cast. The smallest sargasso coverage and beaching events in winter are related with the most variable wind direction recorded, as well as the most powerful winds and waves in the region (Figures 12C, D). These rough atmospheric and maritime conditions could break up the sargasso rafts and put them below the detectable threshold for Landsat 8 OLI imagery, as Wang and Hu (2021) suggested, and a northward offshore transport could also be the cause of the low observation of sargasso in the coastal area.
Beaching events were associated with low-energy conditions (Hs< 0.25 m, wind speed<4m/s, neap tide), and separation events occurred during high-energy conditions (Hs > 0.4 m, wind speed = 8 m/s, spring tide), with a great accumulation in the middle of the lagoon at Puerto Morelos during arrival events. During separation events, the main outflow of sargasso is the main opening in the reef, to the centre and south of the lagoon. A considerable sargasso biomass remain in the lagoon, if the rafts continue to arrive, and only when the wrack input ceases the energetic hydrodynamic conditions flush out the wrack from the lagoon, over a period of days. However, flushing during higher-energy events also pushes part of the wrack up to the beach dune or drives it partially offshore where it settles on the lagoon floor, especially when it is already in a partially decomposed state (Rutten et al., 2021).
The greatest sargasso coverage has tended to be in the northern Mexican Caribbean, an area of major tourism. Some places here, such as Cancun, depend on tourism almost entirely for their income and local employment (World Travel and Tourism Council, https://wttc.org/Research/Economic-Impact/Cities ); management of the sargasso influx is vital if tourists are to keep visiting. While evidence shows a decrease in profits over vacation periods of -3% to -8%, there was a general increase in revenue (0.4%–2.3%) in the region, prior to COVID-19, suggesting that the negative impact had not been devastating until then. Maybe the sargasso was not a relevant factor in touristic demand or perhaps management strategies to contain the phenomena have been successful locally (Espinosa and Li-Ng, 2020).
The information provided here can be used by the tourism industry and decision makers to plan and prioritize their monitoring, recollecting, and restoration efforts and also to allow them to be prepared for anomalous arrivals of sargasso at any time in the year, correcting strict assumptions regarding temporal or other patterns, due to the high variability of the sargasso distribution in the Western Caribbean.
Final remarks
In the present work, the spatial and temporal patterns of sargasso coverage at different scales were studied, together with wave and wind climates, to give a general panorama of the phenomenon, where such atmospheric and oceanographic conditions drive sargasso distribution and beaching in different ways. These findings reinforce the need for ongoing work in accurately detecting sargasso, using freely available satellite data (Cuevas et al., 2018). These data were used in this work not just as a monitoring system, but to better understanding the situation, as a fundamental step in managing sargasso accumulations, nearshore and onshore. The on-site planning and operation of sargasso deflection, collection, and management are complex tasks that depend on a multifactorial context that must respond to changes in the atmospheric and oceanographic conditions.
The spatiotemporal patterns presented in this study contribute to understand sargasso dynamics. They offer additional robust reference information for the recent acquis in regional knowledge that is providing the basis for public policy makers tasked with developing technical guidelines for the crises caused by the sargasso influxes in the Mexican Caribbean.
Even though seasonal and spatial patterns were noted, high variability was observed in them. The flow of sargasso from the open sea towards the shore, and then onto the beaches, is due to complex interactions between the amount and location of the sargasso accumulations with oceanic and atmospheric conditions at different scales. Caution is therefore needed in decision making because, under certain conditions, substantial on- and offshore sargasso accumulations can be found in almost any season of the year in this region. In situ monitoring combined with numerical modelling should be carried out at different spatial scales; numerical assumptions can better address if field data are available, so as to understand more fully sargasso dynamics. Further fine-scale modelling is still needed for the area, in order to forecast accurately, in a resolution at hundreds of metres. Then, local authorities and other interested parties can formulate beach cleaning plans and other management actions more confidently.
Not only should building integral guidelines for sargasso management contain biological, ecological, and physical information, but also the integral analyses must include operative capabilities of the on-site operators, including harbour location, vessels’ autonomy, and collecting capacity, length, and type of the different barriers, among other operative criteria. Only by integrally analysing all these multiple factors will we reach a complete system capable of emitting direct recommendations in terms of sargasso contention, collection, and management, and this more complete analysis spaces the scope of this study.
Finally, linking the dynamics of beach-cast wrack to sargasso raft coverage in the sea using satellite images showed that peak events in both generally coincide, but not always, because the wrack may consist of other material, such as seagrass. It is important to target research and management efforts to effectively count the volume of beach-cast sargasso, so that this can be more directly associated with the rafts detected at sea. Beached sargasso datasets should also be gattered systematically in other areas of the region.
The recent sargasso phenomenon has attracted the attention of the scientific community. However, the economic resources invested in research to fully understand this complex phenomenon are scarce. If we are to have more effective and efficient management of the sargasso on- and offshore, a more concerted effort must be made to monitor/record and make data public in the Caribbean region.
Data availability statement
The raw data supporting the conclusions of this article will be made available by the authors, without undue reservation.
Author contributions
Conceptualization, AU-M, VC, EC, IM-T, BT, and RS. Methodology, AU-M, DB-B, VC, EC, ML-C, IM-T, and EO. Software, AU-M, DB-B, VC, and EC. Validation, AU-M and DB-B. Formal analysis, AU-M, DB-B, VC, EC, and IM-T. Investigation, AU-M, DB-B, VC, KA, JH, EC, and BT. Resources, AU-M, DB-B, VC, EC, IM-T, ML-C, DC-R, and VC. Data curation, AU-M, DB-B, VC, and EC. Writing—original draft preparation, AU-M, DB-B, VC, KA, JH, and EC. Writing—review and editing, AU-M, DB-B, VC, KA, JH, EC, ML-C, IM-T, BT, EO, DC-R, and RS. Visualization, AU-M, DB-B, VC, and EC. Supervision, VC and RS. Project administration, AU-M, EC, CE, IM-T, and RS. Funding acquisition, AU-M, EC, ML-C, VC, IM-T, and RS. All authors contributed to the manuscript revision and read and approved the submitted version.
Funding
This research was partially funded by the Mexican Centre for Ocean Energy Innovation (CEMIE-Océano, Centro Mexicano de Innovación en Energía del Océano) CONACYT-SENER Sustentabilidad Energética project: FSE-2014-06-249795. This research has been also partially funded by CONACyT - SENER - Hydrocarbon Fund (project 201441) as a contribution of the Gulf of Mexico Research Consortium (CIGoM). CONACYT and Universidad Nacional Autónoma de México provided financial support through projects INFR-2014-01-225561 and Proyectos Internos Instituto de Ingeniería 5341 ‘Implementación de estación de video monitoreo para la obtención de indicadores de vulnerabilidad a la erosión’.
Acknowledgments
We want to thank Sandra Gallegos and Jorge Trujillo for the coordination of the detection team at the Spatial Ecology and Movement Lab. We acknowledge Gonzalo Uriel Martín Ruiz and Juan Alberto Gómez Liera for technical support with the video monitoring system installation. Thanks are given to the Servicio Académico de Monitoreo Meteorológico y Oceanográfico (SAMMO) of the Academic Unit of Reef Systems Puerto Morelos (UASAPM) of the ICML of UNAM, and Edgar Escalante Mancera, Miguel Ángel Gómez Reali, and Maria Guadalupe Barba Santos, for sharing environmental information. Finally, special thanks are given to the Furgason Fellowship Program which partially supported this research.
Conflict of interest
DC-R works at the Hotelera Palace Resorts, S.A.P.I de C.V., from which sargasso collection data were used in this study.
The remaining authors declare that the research was conducted in the absence of any commercial or financial relationships that could be construed as a potential conflict of interest.
Publisher’s note
All claims expressed in this article are solely those of the authors and do not necessarily represent those of their affiliated organizations, or those of the publisher, the editors and the reviewers. Any product that may be evaluated in this article, or claim that may be made by its manufacturer, is not guaranteed or endorsed by the publisher.
Supplementary material
The Supplementary Material for this article can be found online at: https://www.frontiersin.org/articles/10.3389/fmars.2022.920339/full#supplementary-material
References
Alcérreca-Huerta J. C., Encarnacion J. I., Ordoñez-Sánchez S., Callejas-Jiménez M., Gallegos Diez Barroso G., Allmark M., et al. (2019). Energy yield assessment from ocean currents in the insular shelf of cozumel island. J. Mar. Sci. Eng. 7 (5), 147. doi: 10.3390/jmse7050147
Athié G., Candela J., Sheinbaum J., Badanf A., Ochoa J. (2011). Yucatan Current variability through the cozumel and Yucatan channels. Cienc. Marinas 37 (4a), 471–492.doi: 10.7773/cm.v37i4A.1794
Bartlett D., Elmer F. (2021). The impact of sargassum inundations on the Turks and Caicos islands. Phycology 1 (2), 83–104. doi: 10.3390/phycology1020007
Berline L., Ody A., Jouanno J., Chevalier C., André J.-M., Thibaut T., et al. (2020). Hindcasting the 2017 dispersal of sargassum algae in the tropical north Atlantic. Mar. pollut. Bull. 158, 111431. doi: 10.1016/j.marpolbul.2020.111431
Brooks M. T., Coles V. J., Hood R. R., Gower J. F. R. (2018). Factors controlling the seasonal distribution of pelagic sargassum. Mar. Ecol. Prog. Ser. 599, 1–18. doi: 10.3354/meps12646
Butler J. N., Morris B. F., Cadwallader J., Stoner A. W. (1983). “Studies of sargassum and the sargassum community,” in Bermuda Biological station, vol. 22. (St. George, Bermuda:Special Publication), 259.
Cabanillas-Terán N., Hernández-Arana H. A., Ruiz-Zárate M.-Á., Vega-Zepeda A., Sanchez-Gonzalez A. (2019). Sargassum blooms in the Caribbean alter the trophic structure of the sea urchin diadema antillarum. PeerJ 7, e7589. doi: 10.7717/peerj.7589
Candela J., Sheinbaum J., Ochoa J., Badan A., Leben R. (2002). The potential vorticity flux through the Yucatan channel and the loop current in the gulf of Mexico. Geophysical Res. Lett. 29 (22), 16–11-16-14. doi: 10.1029/2002GL015587
Candela J., Tanahara S., Crepon M., Barnier B., Sheinbaum J. (2003). Yucatan Channel flow: Observations versus CLIPPER ATL6 and MERCATOR PAM models. J. Geophysical Research: Oceans 108 (C12), 15/1–15/24. doi: 10.1029/2003JC001961
Carrillo L., Johns E., Smith R., Lamkin J., Largier J. (2015). Pathways and hydrography in the mesoamerican barrier reef system part 1: Circulation. Continental Shelf Res. 109, 164–176. doi: 10.1016/j.csr.2015.09.014
Casas-Beltrán D. A., Gallaher C. M., Hernandez Yac E., Febles Moreno K., Voglesonger K., Leal-Bautista R. M., et al. (2020). Seaweed invasion! temporal changes in beach conditions lead to increasing cenote usage and contamination in the Riviera Maya. Sustainability 12 (6), 1–24. doi: 10.3390/su12062474
Cetina P., Candela J., Sheinbaum J., Ochoa J., Badan A. (2006). Circulation along the Mexican Caribbean coast. J. Geophysical Research: Oceans 111 (C8), 1–19. doi: 10.1029/2005JC003056
Chávez G., Candela J., Ochoa J. (2003). Subinertial flows and transports in cozumel channel. J. Geophysical Research: Oceans 108 (C2), 1–11. doi: 10.1029/2002JC001456
Chávez V., Uribe-Martínez A., Cuevas E., Rodríguez-Martínez R. E., van Tussenbroek B. I., Francisco V., et al. (2020). Massive influx of pelagic sargassum spp. on the coasts of the Mexican Caribbean 2014–2020: Challenges and opportunities. Water 12 (10), 1–24. doi: 10.3390/w12102908
Congedo L. (2021). Semi-automatic classification plugin: A Python tool for the download and processing of remote sensing images in QGIS. J. Open Source Software 6 (64), 3172. doi: 10.21105/joss.03172
Coronado C., Candela J., Iglesias-Prieto R., Sheinbaum J., López M., Ocampo-Torres F. J. (2007). On the circulation in the Puerto morelos fringing reef lagoon. Coral Reefs 26 (1), 149–163. doi: 10.1007/s00338-006-0175-9
Cuevas E., Uribe-Martínez A., Liceaga-Correa M.D.L.Á. (2018). A satellite remote-sensing multi-index approach to discriminate pelagic sargassum in the waters of the Yucatan peninsula, Mexico. Int. J. Remote Sens. 39 (11), 3608–3627. doi: 10.1080/01431161.2018.1447162
Devault D. A., Modestin E., Cottereau V., Vedie F., Stiger-Pouvreau V., Pierre R., et al. (2021). The silent spring of sargassum. Environ. Sci. pollut. Res. 28 (13), 15580–15583. doi: 10.1007/s11356-020-12216-7
Domínguez-Tejo E., Metternicht G., Johnston E., Hedge L. (2016). Marine spatial planning advancing the ecosystem-based approach to coastal zone management: A review. Mar. Policy 72, 115–130. doi: 10.1016/j.marpol.2016.06.023
El Mahrad B., Newton A., Icely J. D., Kacimi I., Abalansa S., Snoussi M. (2020). Contribution of remote sensing technologies to a holistic coastal and marine environmental management framework: A review. Remote Sens. 12 (14), 1–47. doi: 10.3390/rs12142313
Espinosa L. A., Li-Ng J. J. (2020). El Riesgo del sargazo para la economía y turismo de quintana roo y méxico. BBVA Res. 20 (2), 1–35
García-Sánchez M., Graham C., Vera E., Escalante-Mancera E., Alvarez-Filip L., Tussenbroek B. (2020). Temporal changes in the composition and biomass of beached pelagic Sargassum species in the Mexican Caribbean. Aquatic Botany 167 (103275). doi: 10.1016/j.aquabot.2020.103275
Gower J., Young E., King S. (2013). Satellite images suggest a new sargassum source region in 2011. Remote Sens. Lett. 4 (8), 764–773. doi: 10.1080/2150704X.2013.796433
Guimarais M., Zúñiga-Ríos A., Cruz-Ramírez C. J., Chávez V., Odériz I., van Tussenbroek B. I., et al. (2021). The conservational state of coastal ecosystems on the Mexican Caribbean coast: Environmental guidelines for their management. Sustainability 13 (5), 1–24. doi: 10.3390/su13052738
Guzmán-Ramírez A. A., Uribe-Martínez A., García-Castro C., Cuevas E. (2020). “Caracterización espacial de figuras de sargazo pelágico formadas por El viento en El canal de yucatán,” in Abstract book of the 5th conference on aquatic resources of the gulf of Mexico and Caribbean sea. ciudad del Carmen, Mexico, November 27th – 29th (Ciudad Del Carmen, Mexico: Universidad Autónoma Del Carmen-CONACYT).
Hardy R. F., Hu C., Witherington B., Lapointe B., Meylan A., Peebles E., et al. (2018). Characterizing a Sea turtle developmental habitat using landsat observations of surface-pelagic drift communities in the Eastern gulf of Mexico. IEEE J. Selected Topics Appl. Earth Observations Remote Sens. 11, 3646–3659. doi: 10.1109/JSTARS.2018.2863194
Hu C., Feng L., Hardy R. F., Hochberg E. J. (2015). Spectral and spatial requirements of remote measurements of pelagic sargassum macroalgae. Remote Sens. Environ. 167, 229–246. doi: 10.1016/j.rse.2015.05.022
Huffard C. L., von Thun S., Sherman A. D., Sealey K., Smith K. L. (2014). Pelagic sargassum community change over a 40-year period: temporal and spatial variability. Mar. Biol. 161 (12), 2735–2751. doi: 10.1007/s00227-014-2539-y
Hu C., Hardy R., Ruder E., Geggel A., Feng L., Powers S., et al. (2016). Sargassum coverage in the northeastern gulf of Mexico during 2010 from landsat and airborne observations: Implications for the deepwater horizon oil spill impact assessment. Mar. pollut. Bull. 107 (1), 15–21. doi: 10.1016/j.marpolbul.2016.04.045
Johns E. M., Lumpkin R., Putman N. F., Smith R. H., Muller-Karger F. E., T. Rueda-Roa D., et al. (2020). The establishment of a pelagic sargassum population in the tropical Atlantic: Biological consequences of a basin-scale long distance dispersal event. Prog. Oceanography 182, 102269. doi: 10.1016/j.pocean.2020.102269
Jouanno J., Moquet J.-S., Berline L., Radenac M.-H., Santini W., Changeux T., et al. (2021). Evolution of the riverine nutrient export to the tropical Atlantic over the last 15 years: is there a link with sargassum proliferation? Environ. Res. Lett. 16 (3), 034042. doi: 10.1088/1748-9326/abe11a
Langin K. (2018). Seaweed masses assault Caribbean islands. Science 360 (6394), 1157. doi: 10.1126/science.360.6394.1157
Lapointe B. E. (1995). A comparison of nutrient-limited productivity in sargassum natans from neritic vs. oceanic waters of the western north Atlantic ocean. Limnology Oceanography 40 (3), 625–633. doi: 10.4319/lo.1995.40.3.0625
López-Miranda J. L., Celis L. B., Estévez M., Chávez V., Van Tussenbroek B. I., Uribe-Martínez A., et al. (2021). Commercial potential of pelagic sargassum spp. in Mexico. Front. Mar. Science. 8, 768470. doi: 10.3389/fmars.2021.7684
Mariño-Tapia I., Silva-Casarín C., Enriquez-Ortiz E., Mendoza-Baldwin E., Escalante-Mancera F., Ruiz-Rentería F (2011). Wave transformation and wave-driven circulation on natural reefs under extreme hurricane conditions. Coast. Eng. Proc. 1 (32), 1–9. doi: 10.9753/icce.v32.waves.28
Marsh R., Addo K. A., Jayson-Quashigah P.-N., Oxenford H. A., Maxam A., Anderson R., et al. (2021). Seasonal predictions of holopelagic sargassum across the tropical Atlantic accounting for uncertainty in drivers and processes: The SARTRAC ensemble forecast system. Front. Mar. Sci. 8. doi: 10.3389/fmars.2021.722524
Maurer A. S. (2019). Impacts of the Caribbean sargassum influx on Sea turtle nesting ecology. In Proc. Proc. 71st Gulf Caribbean Fisheries Institute 71, 327–329.
Maurer A. S., Stapleton S. P., Layman C. A., Burford Reiskind M. O. (2021). The Atlantic sargassum invasion impedes beach access for nesting sea turtles. Climate Change Ecol. 2, 100034. doi: 10.1016/j.ecochg.2021.100034
McHenry J., Rassweiler A., Hernan G., Uejio C. K., Pau S., Dubel A. K., et al. (2021). Modelling the biodiversity enhancement value of seagrass beds. Diversity Distributions 27 (11), 2036–2049. doi: 10.1111/ddi.13379
Milledge J. J., Harvey P. J. (2016). Golden tides: Problem or golden opportunity? the valorisation of sargassum from beach inundations. J. Mar. Sci. Eng. 4 (3), 1–19. doi: 10.3390/jmse4030060
North M. A. (2009). “A method for implementing a statistically significant number of data classes in the jenks algorithm,” in 2009 sixth international conference on fuzzy systems and knowledge discovery (Tianjin, China: IEEE), 35–38.
Ochoa J., Candela J., Badan A., Sheinbaum J. (2005). A geostrophic fluctuations in cozumel channel. J. Geophysical Research: Oceans 110 (C2), 1–16. doi: 10.1029/2004JC002408
Ochoa J., Sheinbaum J., Badan A., Candela J., Wilson D. (2001). Geostrophy via potential vorticity inversion in the Yucatan channel. J. Mar. Res. 59 (5), 725–747. doi: 10.1357/002224001762674917
Odériz I., Gómez I., Ventura Y., Díaz V., Escalante A., Gómez D. T., et al. (2020). Understanding drivers of connectivity and resilience under tropical cyclones in coastal ecosystems at Puerto morelos, Mexico. J. Coast. Res. 95 (sp1), 128–132. doi: 10.2112/SI95-025.1
Ogden J. C. (2010). Marine spatial planning (MSP): a first step to ecosystem-based management (EBM) in the wider Caribbean. Rev. Biol. Trop. 58 Suppl 3, 71–79.
Otsu N. (1979). A threshold selection method from Gray-level histograms. IEEE Trans. Systems Man Cybernetics 9 (1), 62–66. doi: 10.1109/TSMC.1979.4310076
Oxenford H. A., Cox S.-A., van Tussenbroek B. I., Desrochers A. (2021). Challenges of turning the sargassum crisis into gold: Current constraints and implications for the Caribbean. Phycology 1 (1), 27–48. doi: 10.3390/phycology1010003
Parra S. M., Valle-Levinson A., Mariño-Tapia I., Enriquez C. (2015). Salt intrusion at a submarine spring in a fringing reef lagoon. J. Geophysical Research: Oceans 120 (4), 2736–2750. doi: 10.1002/2014JC010459
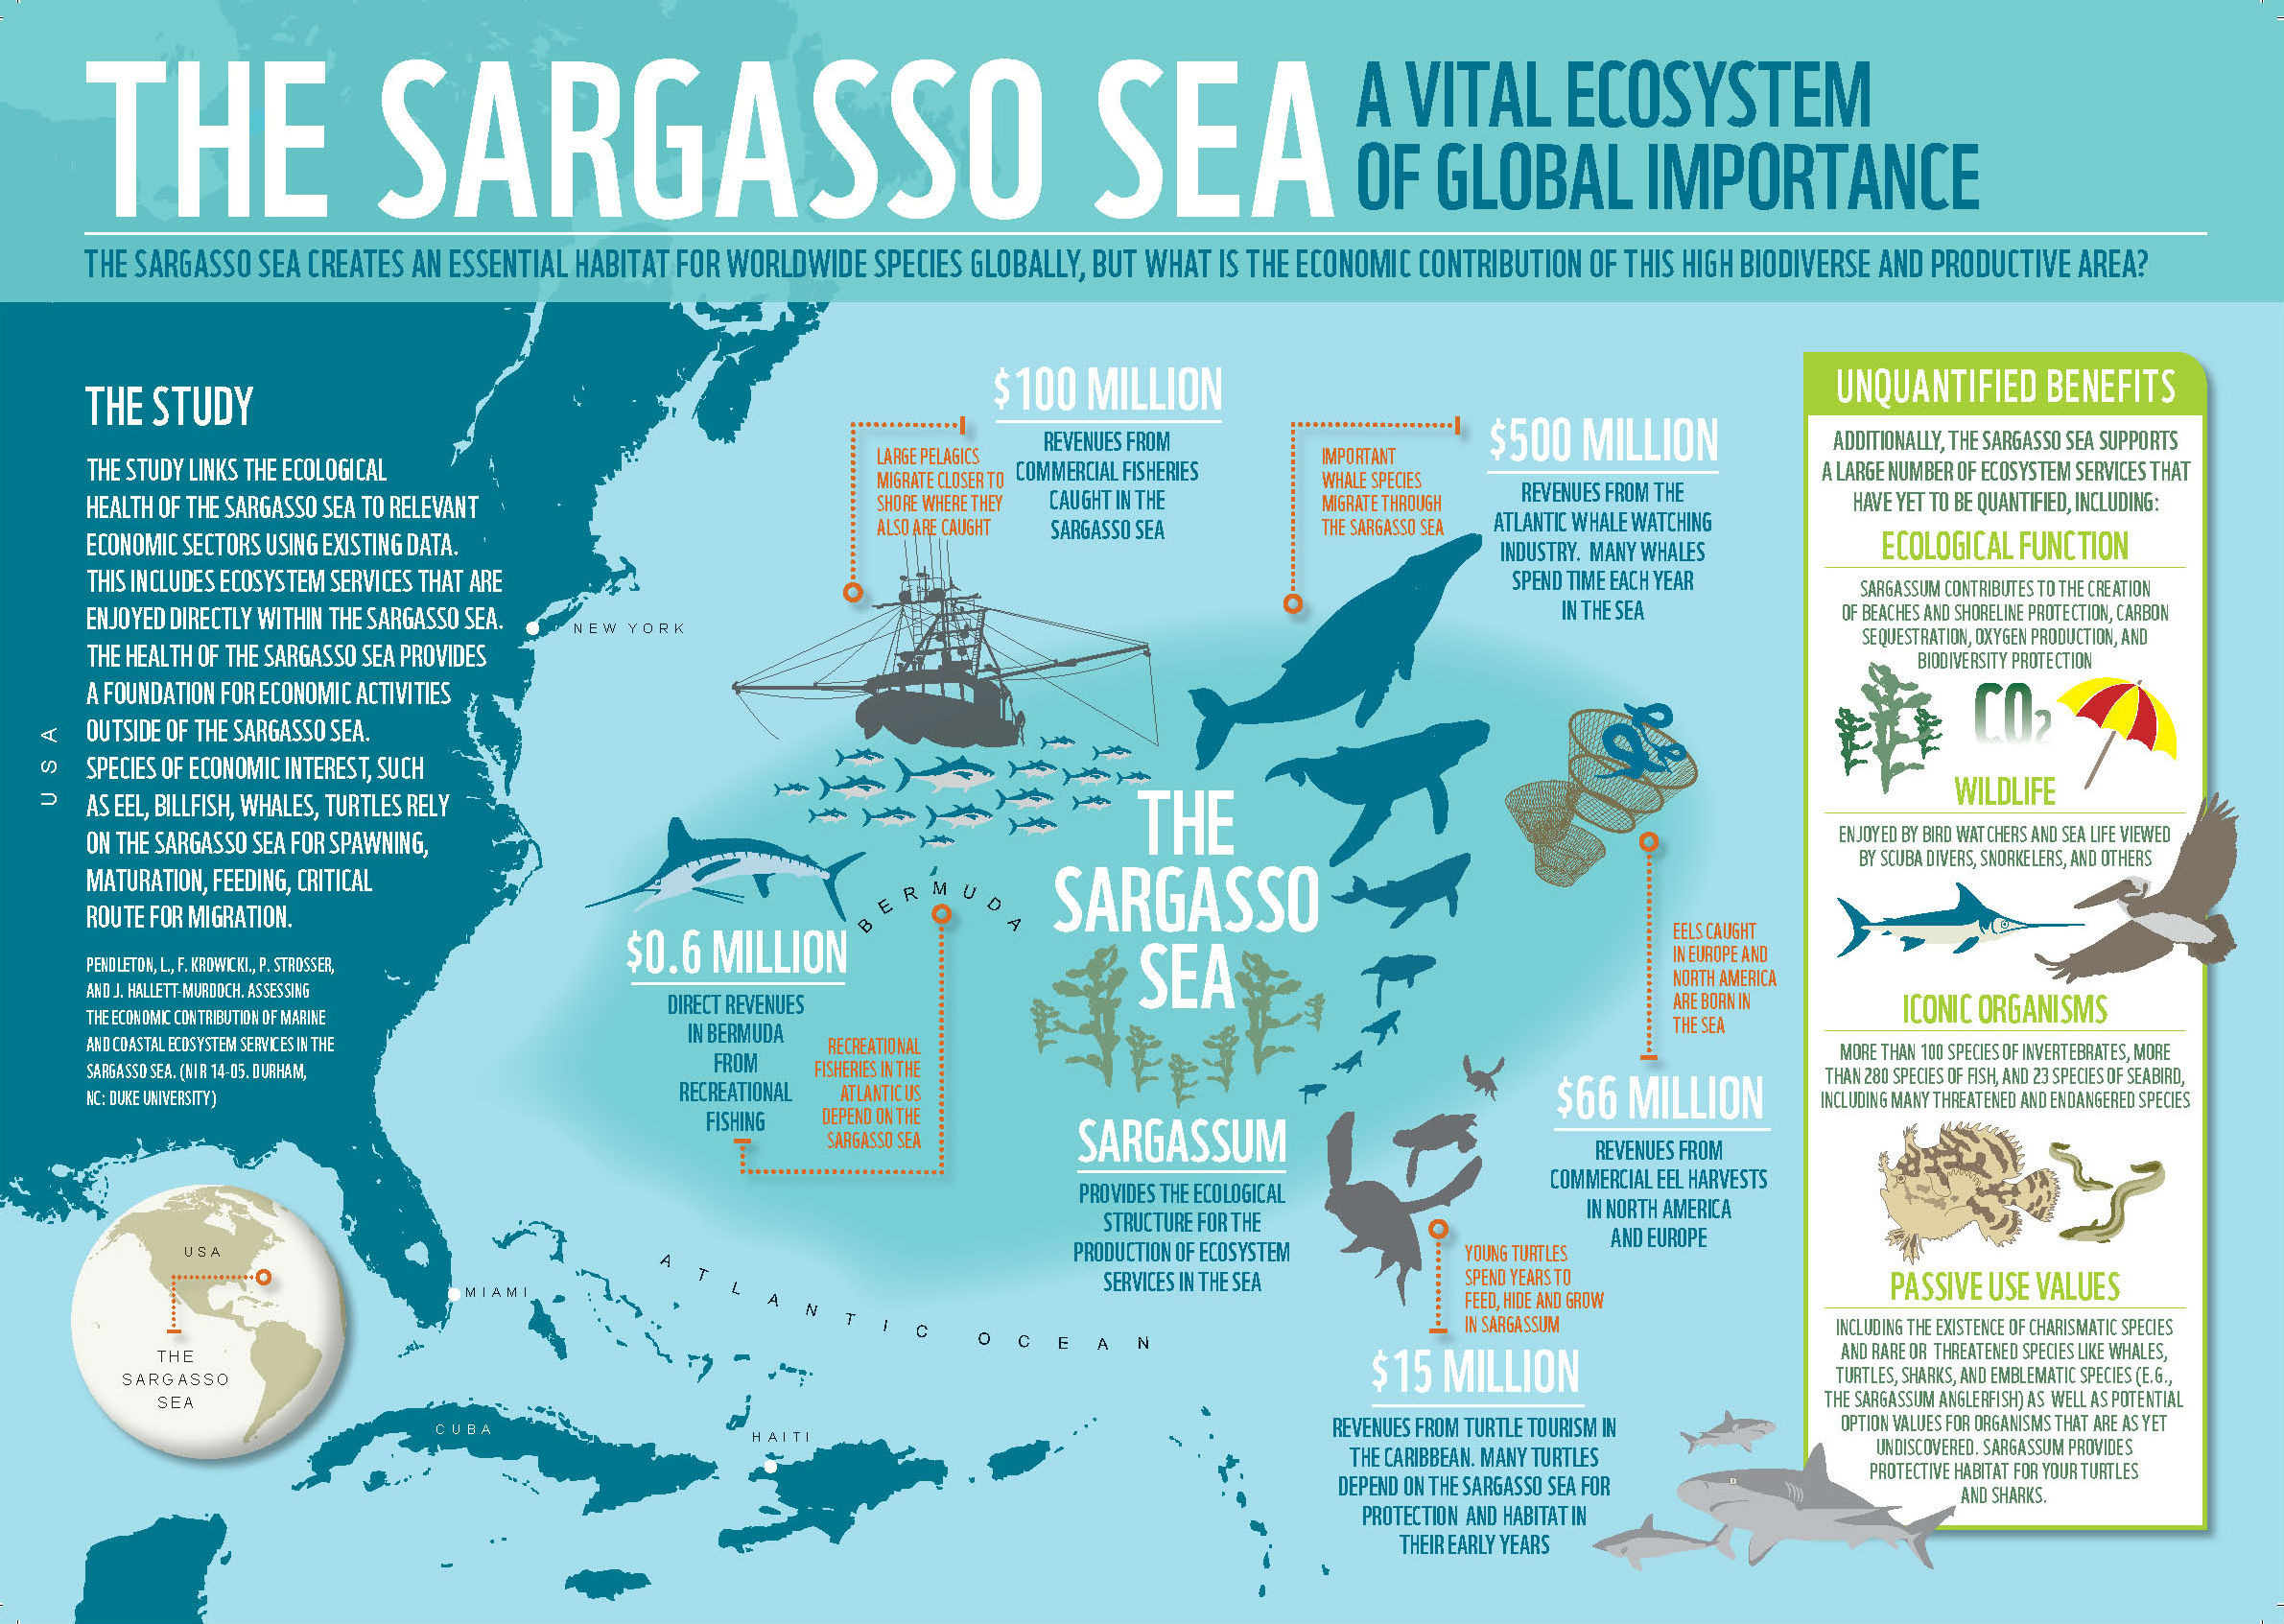
Pendleton L., Krowicki F., Strosser P., Hallett-Murdoch J. (2014) The Sargasso Sea - a vital ecosystem of global importance [Online. Available at: https://clmeplus.org/app/uploads/2020/03/Sargasso-Sea-Infographic-Valuation.jpg (Accessed July 9, 2021).
Powers S. P., Hernandez F. J., Condon R. H., Drymon J. M., Free C. M. (2013). Novel pathways for injury from offshore oil spills: Direct, sublethal and indirect effects of the deepwater horizon oil spill on pelagic sargassum communities. PloS One 8 (9), e74802. doi: 10.1371/journal.pone.0074802
Putman N. F., Goni G. J., Gramer L. J., Hu C., Johns E. M., Trinanes J., et al. (2018). Simulating transport pathways of pelagic sargassum from the equatorial Atlantic into the Caribbean Sea. Prog. Oceanography 165, 205–214. doi: 10.1016/j.pocean.2018.06.009
Putman N. F., Lumpkin R., Olascoaga M. J., Trinanes J., Goni G. J. (2020). Improving transport predictions of pelagic sargassum. J. Exp. Mar. Biol. Ecol. 529, 151398. doi: 10.1016/j.jembe.2020.151398
QGIS-Association (2021). Available at: http://www.qgis.org (Accessed January 6, 2021).
Resiere D., Valentino R., Nevière R., Banydeen R., Gueye P., Florentin J., et al. (2018). Sargassum seaweed on Caribbean islands: an international public health concern. Lancet 392 (10165), 2691. doi: 10.1016/s0140-6736(18)32777-6
Rodríguez-Martínez R. E., van Tussenbroek B., Jordán-Dahlgren E. (2016). Afluencia masiva de sargazo pelágico a la costa del caribe mexicano, (2014–2015). Florecimientos Algales Nocivos en México. Ensenada: CICESE 352, 352–365.
Rodríguez-Muñoz R., Muñiz-Castillo A. I., Euán-Avila J. I., Hernández-Núñez H., Valdés-Lozano D. S., Collí-Dulá R. C., et al. (2021). Assessing temporal dynamics on pelagic sargassum influx and its relationship with water quality parameters in the Mexican Caribbean. Regional Stud. Mar. Sci. 48, 102005. doi: 10.1016/j.rsma.2021.102005
Rodríguez-Martínez R.E., Jordán-Dahlgren E., Hu C. (2022). Spatiotemporal variability of pelagic Sargassum landings on the northern Mexican Caribbean. Remote Sensing Applications: Society and Environment 27 (100767), 2352–9385. doi: 10.1016/j.rsase.2022.100767
Rutten J., Arriaga J., Montoya L. D., Mariño-Tapia I. J., Escalante-Mancera E., Mendoza E. T., et al. (2021). Beaching and natural removal dynamics of pelagic sargassum in a fringing-reef lagoon. J. Geophysical Research: Oceans 126 (11), e2021JC017636. doi: 10.1029/2021JC017636
SAMMO (2015) "Universidad nacional autónoma de méxico, instituto de ciencias del mar y limnología, servicio académico de monitoreo meteorológico y oceanográfico, Puerto morelos q. roo méxico. Available at: http://www.sammo.icmyl.unam.mx.
Schell J. M., Goodwin D. S., Siuda A. N. S. (2015). Recent sargassum inundation events in the Caribbean shipboard observations reveal dominance of a previously rare form. Oceanography 28 (3), 8–11. doi: 10.5670/oceanog.2015.70
Shucksmith R., Gray L., Kelly C., Tweddle J. F. (2014). Regional marine spatial planning – the data collection and mapping process. Mar. Policy 50, 1–9. doi: 10.1016/j.marpol.2014.05.012
Silva R., Martínez M. L., van Tussenbroek B. I., Guzmán-Rodríguez L. O., Mendoza E., López-Portillo J. (2020). A framework to manage coastal squeeze. Sustainability 12 (24), 1–20. doi: 10.3390/su122410610
Silva R., Mendoza E., Mariño-Tapia I., Martínez M. L., Escalante E. (2016). An artificial reef improves coastal protection and provides a base for coral recovery. J. Coast. Res. 75 (10075), 467–471. doi: 10.2112/SI75-094.1
Silva R., Oumeraci H., Martínez M. L., Chávez V., Lithgow D., van Tussenbroek B. I., et al. (2021). Ten commandments for sustainable, safe, and W/Healthy sandy coasts facing global change. Front. Mar. Sci. 8 (126). doi: 10.3389/fmars.2021.616321
Simarro G., Ribas F., Álvarez A., Guillén J., Chic Ó., Orfila A. (2017). ULISES: An open source code for extrinsic calibrations and planview generations in coastal video monitoring systems. J. Coast. Res. 33 (5), 1217–1227. doi: 10.2112/JCOASTRES-D-16-00022.1
Skliris N., Marsh R., Appeaning Addo K., Oxenford H. (2022). Physical drivers of pelagic sargassum bloom interannual variability in the central West Atlantic over 2010–2020. Ocean Dynamics 72 (6), 383–404. doi: 10.1007/s10236-022-01511-1
Smetacek V., Zingone A. (2013). Green and golden seaweed tides on the rise. Nature 504 (7478), 84–88. doi: 10.1038/nature12860
Solarin B., Bolaji D., Fakayode O., Akinnigbagbe R. (2014). Impacts of an invasive seaweed sargassum hystrix var. fluitans (borgesen 1914) on the fisheries and other economic implications for the nigerian coastal waters. IOSR J. Agric. Veterinary Sci. 7 (7), 1–6. doi: 10.9790/2380-07710106
Torres-Freyermuth A., Mariño-Tapia C., Coronado P., Salles G., Medellín A., Pedrozo-Acuña R., et al. (2012). Wave-induced extreme water levels in the Puerto morelos fringing reef lagoon. Natural Hazards Earth System Sci. 12, 3765–3773. doi: 10.5194/nhess-12-3765-2012
Trinanes J., Putman N., Goni G., Hu C., Wang M. (2021). Monitoring pelagic sargassum inundation potential for coastal communities. J. Operational Oceanography 1, 1–12. doi: 10.1080/1755876X.2021.1902682
Uribe-Martínez A., Guzmán-Ramírez A., Arreguín-Sánchez F., Cuevas E. (2020). “El Sargazo en el caribe mexicano, revisión de una historia impensable,” in Gobernanza y manejo de las costas y mares ante la incertidumbre. Eds. Rivera-Arriaga E., Azuz-Adeath I., Cervantes Rosas O. D., Espinoza-Tenorio A., Silva Casarín R., Ortega-Rubio A., et al, (Campeche, Mexico: Universidad Autónoma de Campeche, RICOMAR) 743–768.
van Tussenbroek B. I., Hernández Arana H. A., Rodríguez-Martínez R. E., Espinoza-Avalos J., Canizales-Flores H. M., González-Godoy C. E., et al. (2017). Severe impacts of brown tides caused by sargassum spp. on near-shore Caribbean seagrass communities. Mar. pollut. Bull. 122 (1), 272–281. doi: 10.1016/j.marpolbul.2017.06.057
Wang M., Hu C. (2016). Mapping and quantifying sargassum distribution and coverage in the central West Atlantic using MODIS observations. Remote Sens. Environ. 183, 350–367. doi: 10.1016/j.rse.2016.04.019
Wang M., Hu C. (2017). Predicting sargassum blooms in the Caribbean Sea from MODIS observations. Geophysical Res. Lett. 44 (7), 3265–3273. doi: 10.1002/2017GL072932
Wang M., Hu C. (2021). Satellite remote sensing of pelagic sargassum macroalgae: The power of high resolution and deep learning. Remote Sens. Environ. 264, 112631. doi: 10.1016/j.rse.2021.112631
Wang M., Hu C., Barnes B. B., Mitchum G., Lapointe B., Montoya J. P. (2019). The great Atlantic sargassum belt. Science 365 (6448), 83. doi: 10.1126/science.aaw7912
Wang M., Hu C., Cannizzaro J., English D., Han X., Naar D., et al. (2018). Remote sensing of sargassum biomass, nutrients, and pigments. Geophysical Res. Lett. 45 (22), 12,359–312,367. doi: 10.1029/2018GL078858
Keywords: satellite detection, numerical model, beach cast, surface drift, Quintana Roo
Citation: Uribe-Martínez A, Berriel-Bueno D, Chávez V, Cuevas E, Almeida KL, Fontes JVH, van Tussenbroek BI, Mariño-Tapia I, Liceaga-Correa MdlÁ, Ojeda E, Castañeda-Ramírez DG and Silva R (2022) Multiscale distribution patterns of pelagic rafts of sargasso (Sargassum spp.) in the Mexican Caribbean (2014–2020). Front. Mar. Sci. 9:920339. doi: 10.3389/fmars.2022.920339
Received: 14 April 2022; Accepted: 04 August 2022;
Published: 02 September 2022.
Edited by:
Mouncef Sedrati, Université Bretagne Sud, FranceReviewed by:
Leonel Pereira, University of Coimbra, PortugalLuci Pereira, Federal University of Pará, Brazil
Copyright © 2022 Uribe-Martínez, Berriel-Bueno, Chávez, Cuevas, Almeida, Fontes, van Tussenbroek, Mariño-Tapia, Liceaga-Correa, Ojeda, Castañeda-Ramírez and Silva. This is an open-access article distributed under the terms of the Creative Commons Attribution License (CC BY). The use, distribution or reproduction in other forums is permitted, provided the original author(s) and the copyright owner(s) are credited and that the original publication in this journal is cited, in accordance with accepted academic practice. No use, distribution or reproduction is permitted which does not comply with these terms.
*Correspondence: Rodolfo Silva, cnNpbHZhY0BpaW5nZW4udW5hbS5teA==; Valeria Chávez, dmNoYXZlemNAaWluZ2VuLnVuYW0ubXg=