 Subrata Sarker
 Deen Mohammad2
- 1Department of Oceanography, Shahjalal University of Science and Technology, Sylhet, Bangladesh
- 2Department of Mathematics, Shahjalal University of Science and Technology, Sylhet, Bangladesh
Variability in physical and chemical processes in the marine ecosystem significantly influences the niche ecology of primary producers. However, studies are limited to understand the role of variability in environmental conditions on the niche dynamics of phytoplankton. Therefore, in this study we aimed to understand the role of environmental noise on the niche dynamics of phytoplankton species. This study performed numerical simulations by extending the classic Rosenzweig–MacArthur, predator–prey model for multiple species. We considered the characteristics timescale of seasonal sea surface temperature as environmental noise. Our study found that the oscillatory fluctuation of biomass, variation in carrying capacity, no competitive exclusion, and non-equilibrium state in periodic fluctuation of species biomass enables species to coexist in a noise-induced system. In addition, a high amplitude in species biomass fluctuation at a higher environmental noise was found as another potential coexistence mechanism. Our simulations found that the mean niche and niche width of species are significantly related to environmental noise (R2 = 0.93 and 0.98, respectively). We observed a shift in mean niche conditions of species with the change in environmental noise. Niche overlapping between species decreased significantly with the increase in environmental noise (R2 = 0.95). Our study will serve as a baseline to understand the complexity of phytoplankton niche dynamics in a variable environment.
Introduction
Planktons are a group of aquatic organisms which comprise both phytoplankton and zooplankton (Sarker et al., 2020). Among the plankton community, phytoplankton are floating marine organisms and are considered as the primary input of energy for the oceanic ecosystem (Trefault et al., 2021). Phytoplankton serves as food for zooplankton and herbivore fish species. Thus, the variability in phytoplankton community composition and biomass controls the zooplankton composition which ultimately affects the fisheries production (Schroeder, 1983). The diversity of phytoplankton in marine and coastal waters controls the ecosystem functionality through carbon exporting and nutrient cycling (Goebel et al., 2013). In addition, phytoplankton influences the flux of elements, controls the biogeochemical cycles, and fixes the atmospheric CO2 (Charlson et al., 1987; Andreae and Crutzen, 1997). Therefore, knowledge of the phytoplankton community dynamics is important.
In the coastal ecosystem, variation in interannual and intra-annual environmental conditions characterizes the phytoplankton community dynamics (Winder and Cloern, 2010). Phytoplankton communities are highly sensitive to the fluctuations of environmental conditions. This is due to the capacity of phytoplankton’s daily cell division in optimum environmental conditions (Cloern and Jassby, 2008). In marine and coastal habitats, the concentration of micronutrients and the carrying capacity of the ecosystem control the distribution of phytoplankton (Wiltshire et al., 2015; Pitchaikani and Lipton, 2016; Sarker and Wiltshire, 2017). Water temperature controls the metabolic activities of phytoplankton species and thus influences their ecology (Sarker et al., 2020). In addition, pollution controls the occurrence of phytoplankton species in coastal waters (Jakhar, 2013). Hydrodynamic conditions, water current (Dickie and Trites, 1983), diseases, and predation by zooplankton (Wiltshire and Boersma, 2016) also play key roles in determining the phytoplankton community composition.
The health of a marine ecosystem is largely dependent on primary productivity (Pitchaikani and Lipton, 2016). The primary productivity of the ecosystem is largely dependent on the availability of phytoplankton in the ecosystem. Since the phytoplankton community significantly responds to the changes in environmental conditions, they are considered as a vital indicator for global warming and pollution assessment (Heneash et al., 2022). For example, phytoplankton bloom intensity, community composition, and cell size and abundance are widely used to classify the water quality in coastal ecosystems (Facca and Sfriso, 2009; Lugoli et al., 2012). The concentration of chlorophyll-a in combination with nutrients, macrophytes, water column transparency, and dissolved oxygen is used to classify the trophic status in coastal waters (Facca and Sfriso, 2009; Giordani et al., 2009).The phytoplankton dynamics in a marine ecosystem is linked with the change in environmental conditions which substantially alter their niche ecology (Ajani et al., 2018). Phytoplankton niche is the environmental conditions (i.e., physical and chemical factors) that allow their growth (Hutchinson, 1957). This means that each species operates within a range of environmental conditions, which is favorable for their reproduction and growth (Caracciolo et al., 2020). The niche of species is characterized by their dispersal ability and interspecific and intraspecific competition (Brun et al., 2015). Niche determines the spatial distribution of species, phenology, and temporal fluctuation in abundance. Environmental variability significantly influences the niche dynamics of phytoplankton. For example, warming of the sea surface leads to a niche partitioning of species (Irwin and Oliver, 2009). A shift in temperature can modify the timing of species peak abundance, and this indicates that a change in environmental conditions leads to a shift in the niche dynamics of species (Freund et al., 2006). A change in nutrient levels and pollutants in the ecosystem also leads to a shift in the mean niche condition of species (Brun et al., 2015). The niche partitioning of phytoplankton driven by a change in environmental conditions also influences the functionality of the phytoplankton community (Duerschlag et al., 2022). Thus, the role of environmental change on the niche dynamics of phytoplankton is important to explore. A large number of studies are available on the role of biotic and abiotic conditions on the phytoplankton dynamics. The role of stochastic fluctuations on the phytoplankton community composition is also well studied (Sarker et al., 2020). However, studies on the role of environmental noise on phytoplankton niche dynamics are very rare.Therefore, this study aimed to understand the role of environmental noise on the niche dynamics of phytoplankton. More specifically, we analyzed the dynamics of phytoplankton in a noise-induced system. In addition, we also examined the role of environmental noise on the mean niche condition and niche overlapping of phytoplankton species.
Materials and Methods
Modeling Approach
The prime objective of this study was to understand the role of environmental fluctuations on the phytoplankton niche dynamics. Thus, we performed numerical simulations by utilizing a predator–prey model. We extended the classic Rosenzweig–MacArthur, predator–prey model to generate the dynamics of multiple species of plankton (Rosenzweig and MacArthur, 1963). The extension of the model was performed by formulating species growth (r), mortality (m), carrying capacity (K), and grazing (g) as the function of sea surface temperature (SST). Let Ni and Rk denote the biomass of i phytoplankton and k zooplankton species. Mathematically, the model was then formulated as:
Equation (1) defines the phytoplankton dynamics where species grow logistically with specific growth rates (ri) and carrying capacities (Ki). We assumed that the species are competing with each other and thus defined the competition coefficients between two species i and j as αij. We described the dynamics of zooplankton in the model by a multispecies Holling type II (Equation 2) functional response. In Equation (2), Hk is the half saturation constant, gk is the maximum grazing rate of zooplankton, Sik is the selectivity coefficient of zooplankton species k for phytoplankton species i, βk is the efficiency of zooplankton species k feed on phytoplankton, and mk is the mortality of zooplankton species k. We assumed that small levels of immigration (u) of species are occurring in the system.We formulated the growth and carrying capacity of phytoplankton, and the mortality and grazing of zooplankton as the function of SST following the metabolic theory of ecology (MTE). Phytoplankton growth was formulated as the function of body mass and SST by using Equation (3).
In Equation (3) T = SST, r0i = normalization constant for phytoplankton species i, Mi = body mass of species i, a = fixed allometric exponent, Er = activation energy for phytoplankton growth rate r, and R = Boltzmann constant.We also formulated the carrying capacity of phytoplankton K, mortality of zooplankton m, and zooplankton grazing gk as the function SST by using Equations (4), (5), and (6), respectively.
In Equations (4) and (5), K0i = normalization constant for the carrying capacity of phytoplankton, m0k = mortality of zooplankton, Mk = zooplankton species body mass, b = allometric exponents for the carrying capacity of phytoplankton, and c = allometric exponents for mortality of zooplankton. Both EK and Em are defined as the activation energy coefficients. In Equation (6), g0k = zooplankton grazing normalization constant, Eg = activation energy of zooplankton grazing, and q = allometric exponent.For seasonal SST (T) in the model, we relied on SST data using the advanced very-high-resolution radiometer (AVHRR) sensor for the Bay of Bengal (BoB) region. The AVHRR data were downloaded via the ERDDAP server (https://coastwatch.pfeg.noaa.gov/erddap/index.html). The BoB is a subtropical marine ecosystem located in the northeastern part of the Indian Ocean. This area is very dynamic and receives a large volume of freshwater discharge from the surrounding river systems. Freshwater discharges from the upstream area carry a large volume of sediments. In addition, BoB is considered thermally stratified and thus less productive compared to the Arabian Sea. This area is under the pressure of both climate and anthropogenic pressure. However, the BoB received very little attention from scientific communities (Hood et al., 2013). Details of the SST data are described in Kilpatrick et al. (2001). For this study, the daily SST data for the time period between 1985 and 2017 were analyzed. The seasonal SST data of BoB usually show two peaks in a year (Figure 1). Thus, we used the linear combination of Sin and Cos to formulate SST function as described in Equation (7).
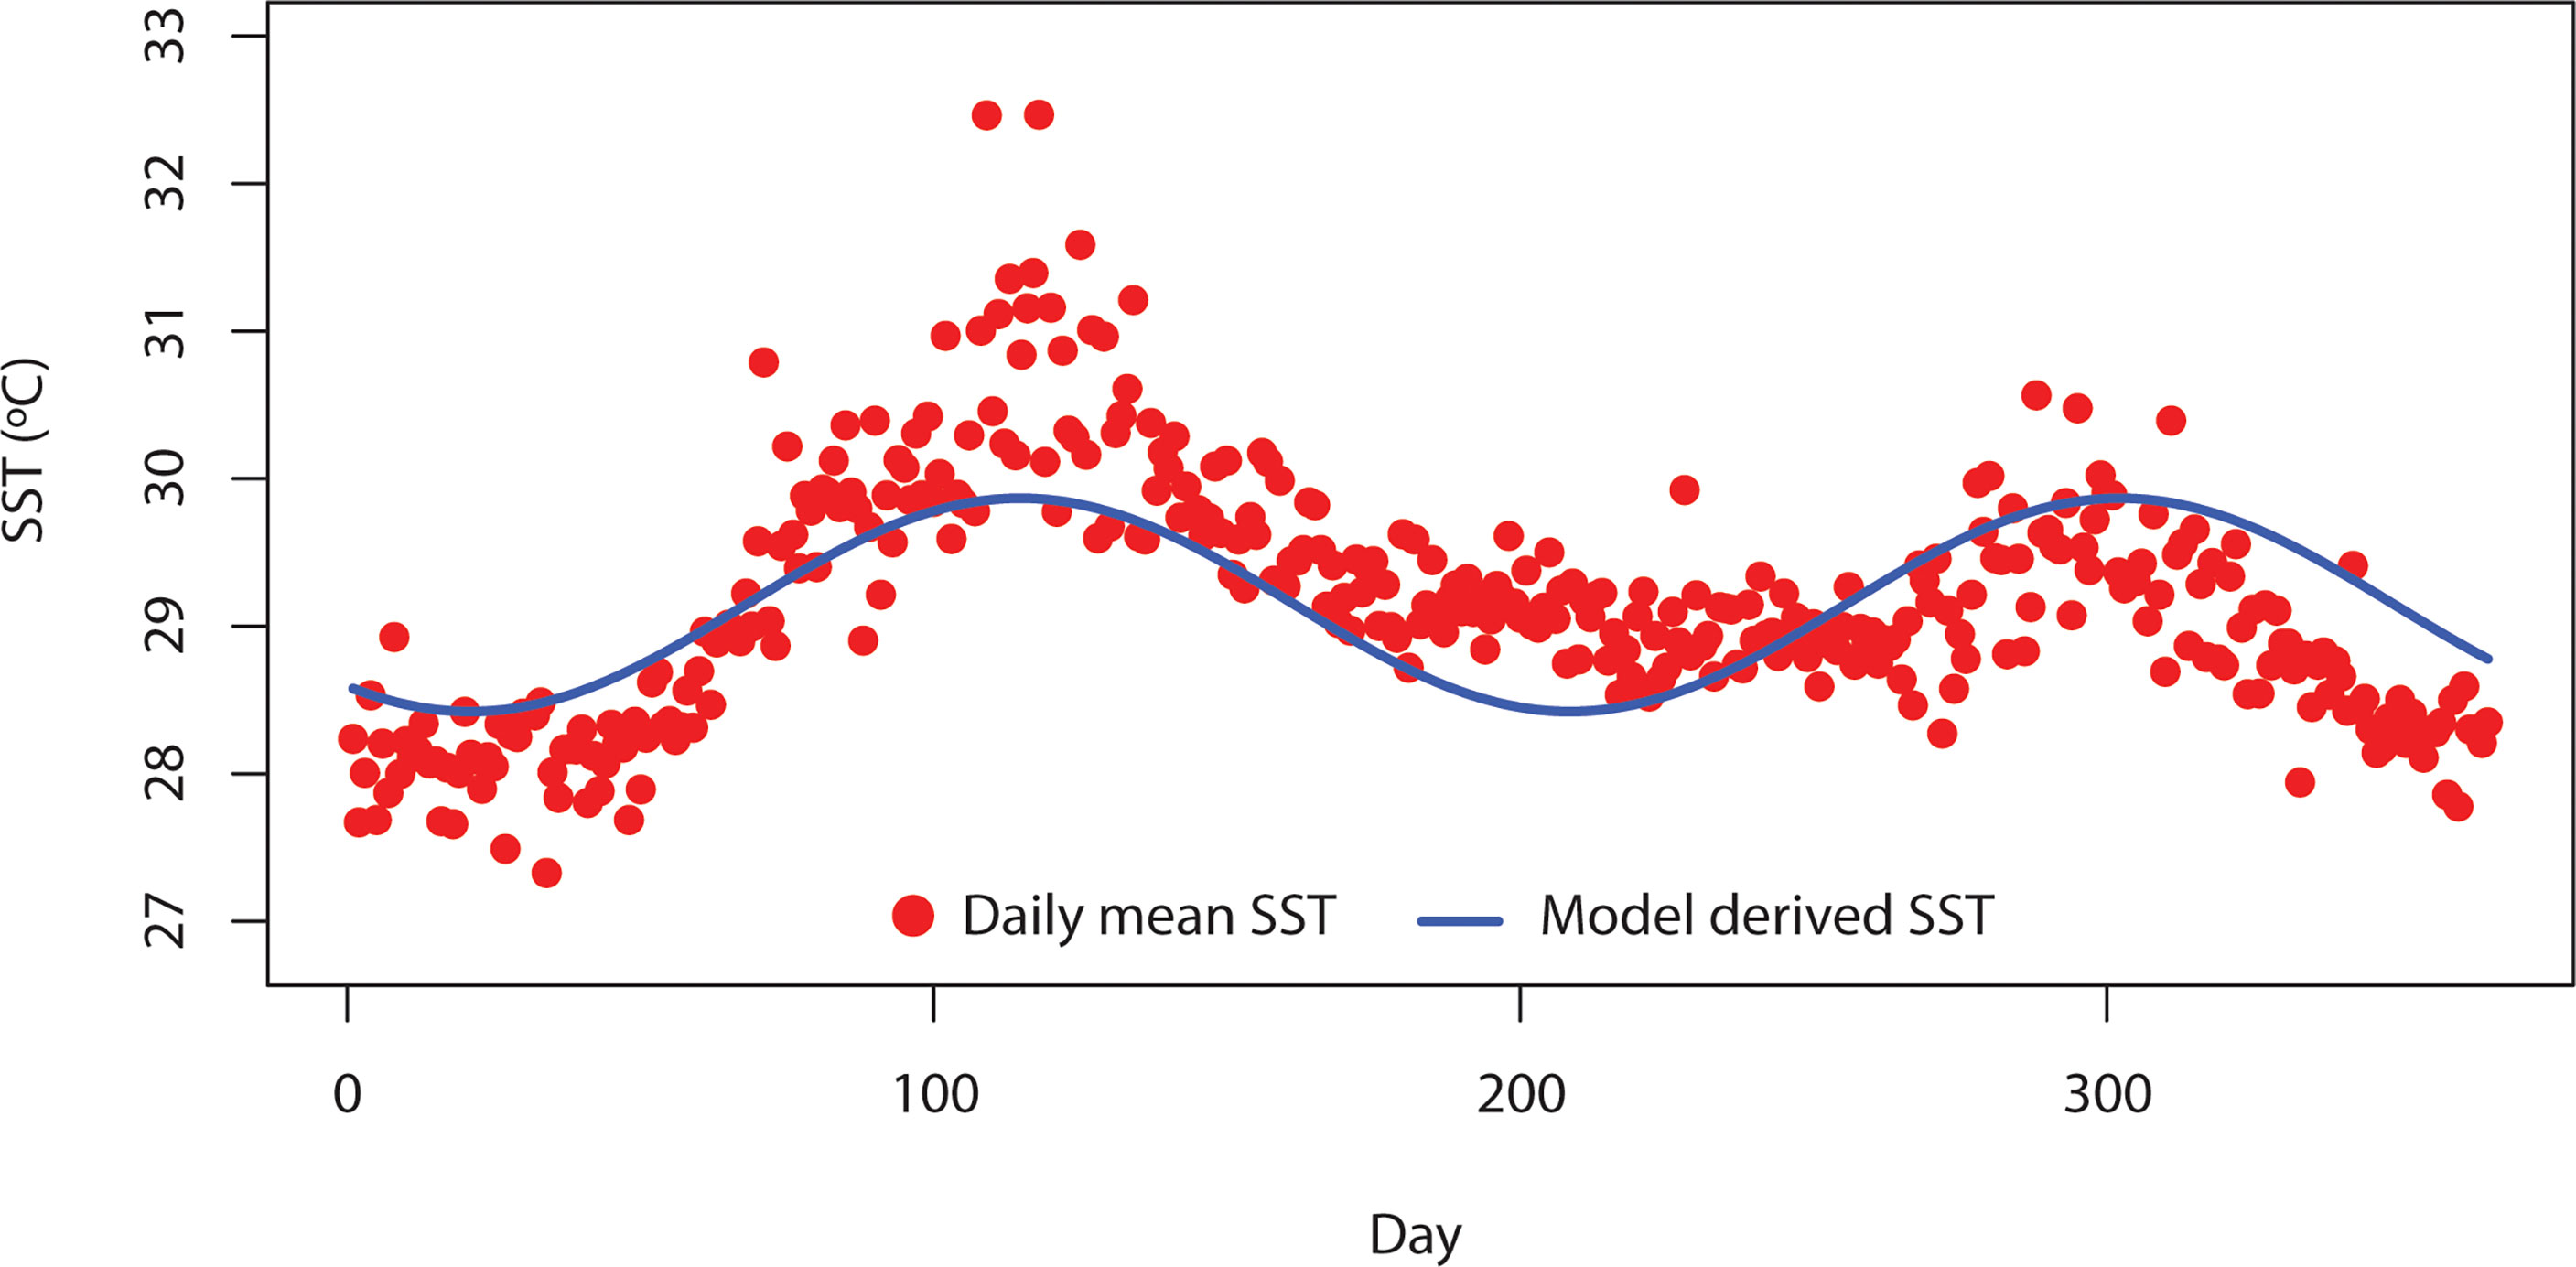
Figure 1 Daily mean variation of sea surface temperature (SST) in the Bay of Bengal (BoB) from 1985 to 2007. Red-filled points indicate the daily SST over BoB derived from a satellite source. Blue solid line indicates the daily SST derived from Equation (7).
In Equation (7), Tm = mean SST and t = time. We adopted the parameters ∅1, ∅2, ∅3, ∅4, and σ through the fitting of daily SST data from AVHRR to Equation (7). Data fitting to estimate the parameters was performed in R (R studio core team, 2005) using a linear function.
Inclusion of Environmental Noise in the Model
Environmental noise is the unpredictable fluctuation in environmental conditions at both spatial and temporal scales (Fujiwara and Takada, 2017). Unpredictability refers to the inability of the precise prediction of the future state of environmental conditions, which is usually a set of abiotic and biotic variables (Adler and Drake, 2008). Fluctuation of temperature in marine ecosystems usually shows persistence in time (Steele, 1985; Roe, 2009; Beninc et al., 2011). We introduced the characteristics time scale of SST fluctuation as red noise in the model. Red noise in the model was introduced by adding a term nt with seasonal SST as described in Equation (8), which was previously described in Freund et al. (2006) and Sarker et al. (2020).
In Equation (8), Tn = SST with red noise.We used a first-order autoregressive model to define red noise nt by using Equation (9) as described in Box et al. (2015)
In Equation (9), = autocorrelation coefficient (the values of γ vary from -1 to 1) and δϵ = magnitude of environmental noise. We defined red noise when γ was found positively auto-correlated. The stochastic term ϵt was drawn randomly at each time step which follows a Gaussian distribution. In this study, we considered a time step of 1 day for simulations. The coefficient of autocorrelation γ was formulated as the function of the characteristic timescale of SST fluctuation τ (Equation 10) which was determined by fitting the data to Equation (10).
We performed a number of simulations to achieve the objectives of this study. We first performed a simulation without adding noise in SST function. We then performed simulations to generate the phytoplankton dynamics by varying the environmental noise. For this, we varied the characteristic timescale of SST fluctuation τ. In this study, τ was found 4 days after analyzing the SST data. In this study, we varied τ from 4 to 8 days to generate different noise scenarios.
Parameterization of the Model
To understand the role of environmental noise on phytoplankton niche dynamics, 10 phytoplankton and 7 zooplankton species were considered in this study. Therefore, to perform the numerical simulations we chose the range of parameter values from the literatures. Parameter values related to phytoplankton growth, carrying capacity, zooplankton mortality, grazing rate, assimilation efficiency, half-saturation constant, body mass of phytoplankton, body mass of zooplankton, allometric exponent, and activation energy were derived from field- and experiment-based studies as described in Sarker et al. (2018). However, parameter values related to species competition, selectivity coefficient of zooplankton, and immigration rate were chosen randomly by following Dakos et al. (2009). Coefficients of the intraspecific competition of phytoplankton species αii were set as 1. Coefficients of the interspecific competition of phytoplankton species αij were drawn randomly between 0.5 and 1.5. Selectivity coefficients Sik were also drawn randomly between 0 and 1. After selecting the range of all model parameters, a Monte Carlo search was performed to identify an ideal parameter set. We defined a parameter set ideal when all 10 phytoplankton species and 7 zooplankton species can coexist. Details of parameters are given in Table S1. For simulations, we did not specify any species; however, the parameter values were within the realistic range.
Model Sensitivity Test
The value of each parameter was changed by ±50% to test the sensitivity of the model. For example, if in an ideal parameter set, a species had the specific growth rate 1, we simulated the dynamics of species by varying the growth rate of that species from 0.5 to 1.5. If the coexistence of all species persists even within this change in parameter values, we considered that the model is not sensitive to large variation in parameter values.
Statistical Analyses of Model Outputs
The prime objective of this study was to understand the role of environmental noise on the niche dynamics of phytoplankton species. Therefore, we simulated the dynamics of 10 phytoplankton species. We then analyzed the dynamics of these phytoplankton species. We analyzed the coexistence mechanism of phytoplankton species in a noise-induced system and the role of noise on species niche dynamics. To understand the coexistence mechanism of phytoplankton species in a noise-induced system, we analyzed species competition, biomass of dominant species, and oscillation and amplitude of species biomass. To understand the role of noise on phytoplankton niche dynamics, we estimated the niche width and niche overlapping of species from each simulation. We used the Levins (1968) measure to estimate the niche width of species by using Equation (11).
In Equation (11), B = Levins measure of niche breadth and Pi = proportion of individuals found using resource i. In this case, i is the SST. We used Equation (12) to measure the niche overlapping among the species.
In Equation (12), μi = mean (= mode = median) of the distribution of species i, μj = mean of the distribution of species j, = variance of the distribution of species i, and = variance of the distribution of species j.
Results
How Do Phytoplankton Species Coexist in a Noise-Induced System?
We examined the dynamics of 10 phytoplankton species under different environmental conditions. We formulated the species growth as a function of temperature. First, we created a system where 10 species of phytoplankton can coexist without any environmental noise in temperature-dependent species growth (Figure 2). We then simulated the biomass of phytoplankton species by adding noise in temperature-dependent growth function. Later, we analyzed the drivers of species coexistence in the noise-induced ecosystem (Figure 3). Analysis of our model outputs found that an oscillatory state of phytoplankton biomass exists over time in the system without noise (Figure 4A). This periodic oscillation also exists in the system with environmental noise (Figure 4B). This oscillatory fluctuation of biomass is related to seasonal fluctuation in SST. The interspecific competitions of considered phytoplankton species were identical. This indicates that species shared the same niche when no noise was added to the system. Although species shared the same niche, we did not observe any competitive exclusion. This enabled the species to coexist in both the system with noise and that without noise by preventing competitive exclusion. We observed a non-equilibrium state in periodic fluctuation of phytoplankton species biomass which allowed them to coexist in a noise-induced ecosystem. Analysis of long-term dynamics of simulated phytoplankton biomass found that at a time several species show a peak in their biomass while some species show low biomass. This variation of species biomass at the same time enabled them to coexist in the noise-induced system. The noise-induced seasonal temperature-dependent growth of phytoplankton species results in a periodical fluctuation of biomass. This periodicity repeats every 1 to some year later. This types of succession of species biomass results in the coexistence of 10 phytoplankton species in noise-induced environmental conditions. Phytoplankton species considered in this study had different carrying capacities (3 to 70 mg/m3). Diverse carrying capacities also enabled species to coexist in a system where they had an identical niche. We observed variation in amplitude of species biomass over time. This fluctuation in biomass amplitude is correlated with environmental noise. We found that the total amplitude of the simulated plankton biomass increased with the increase in environmental noise (R2 = 1, p< 0.001). This fluctuation in amplitude in species biomass is also found as one of the coexistence mechanisms of phytoplankton species.
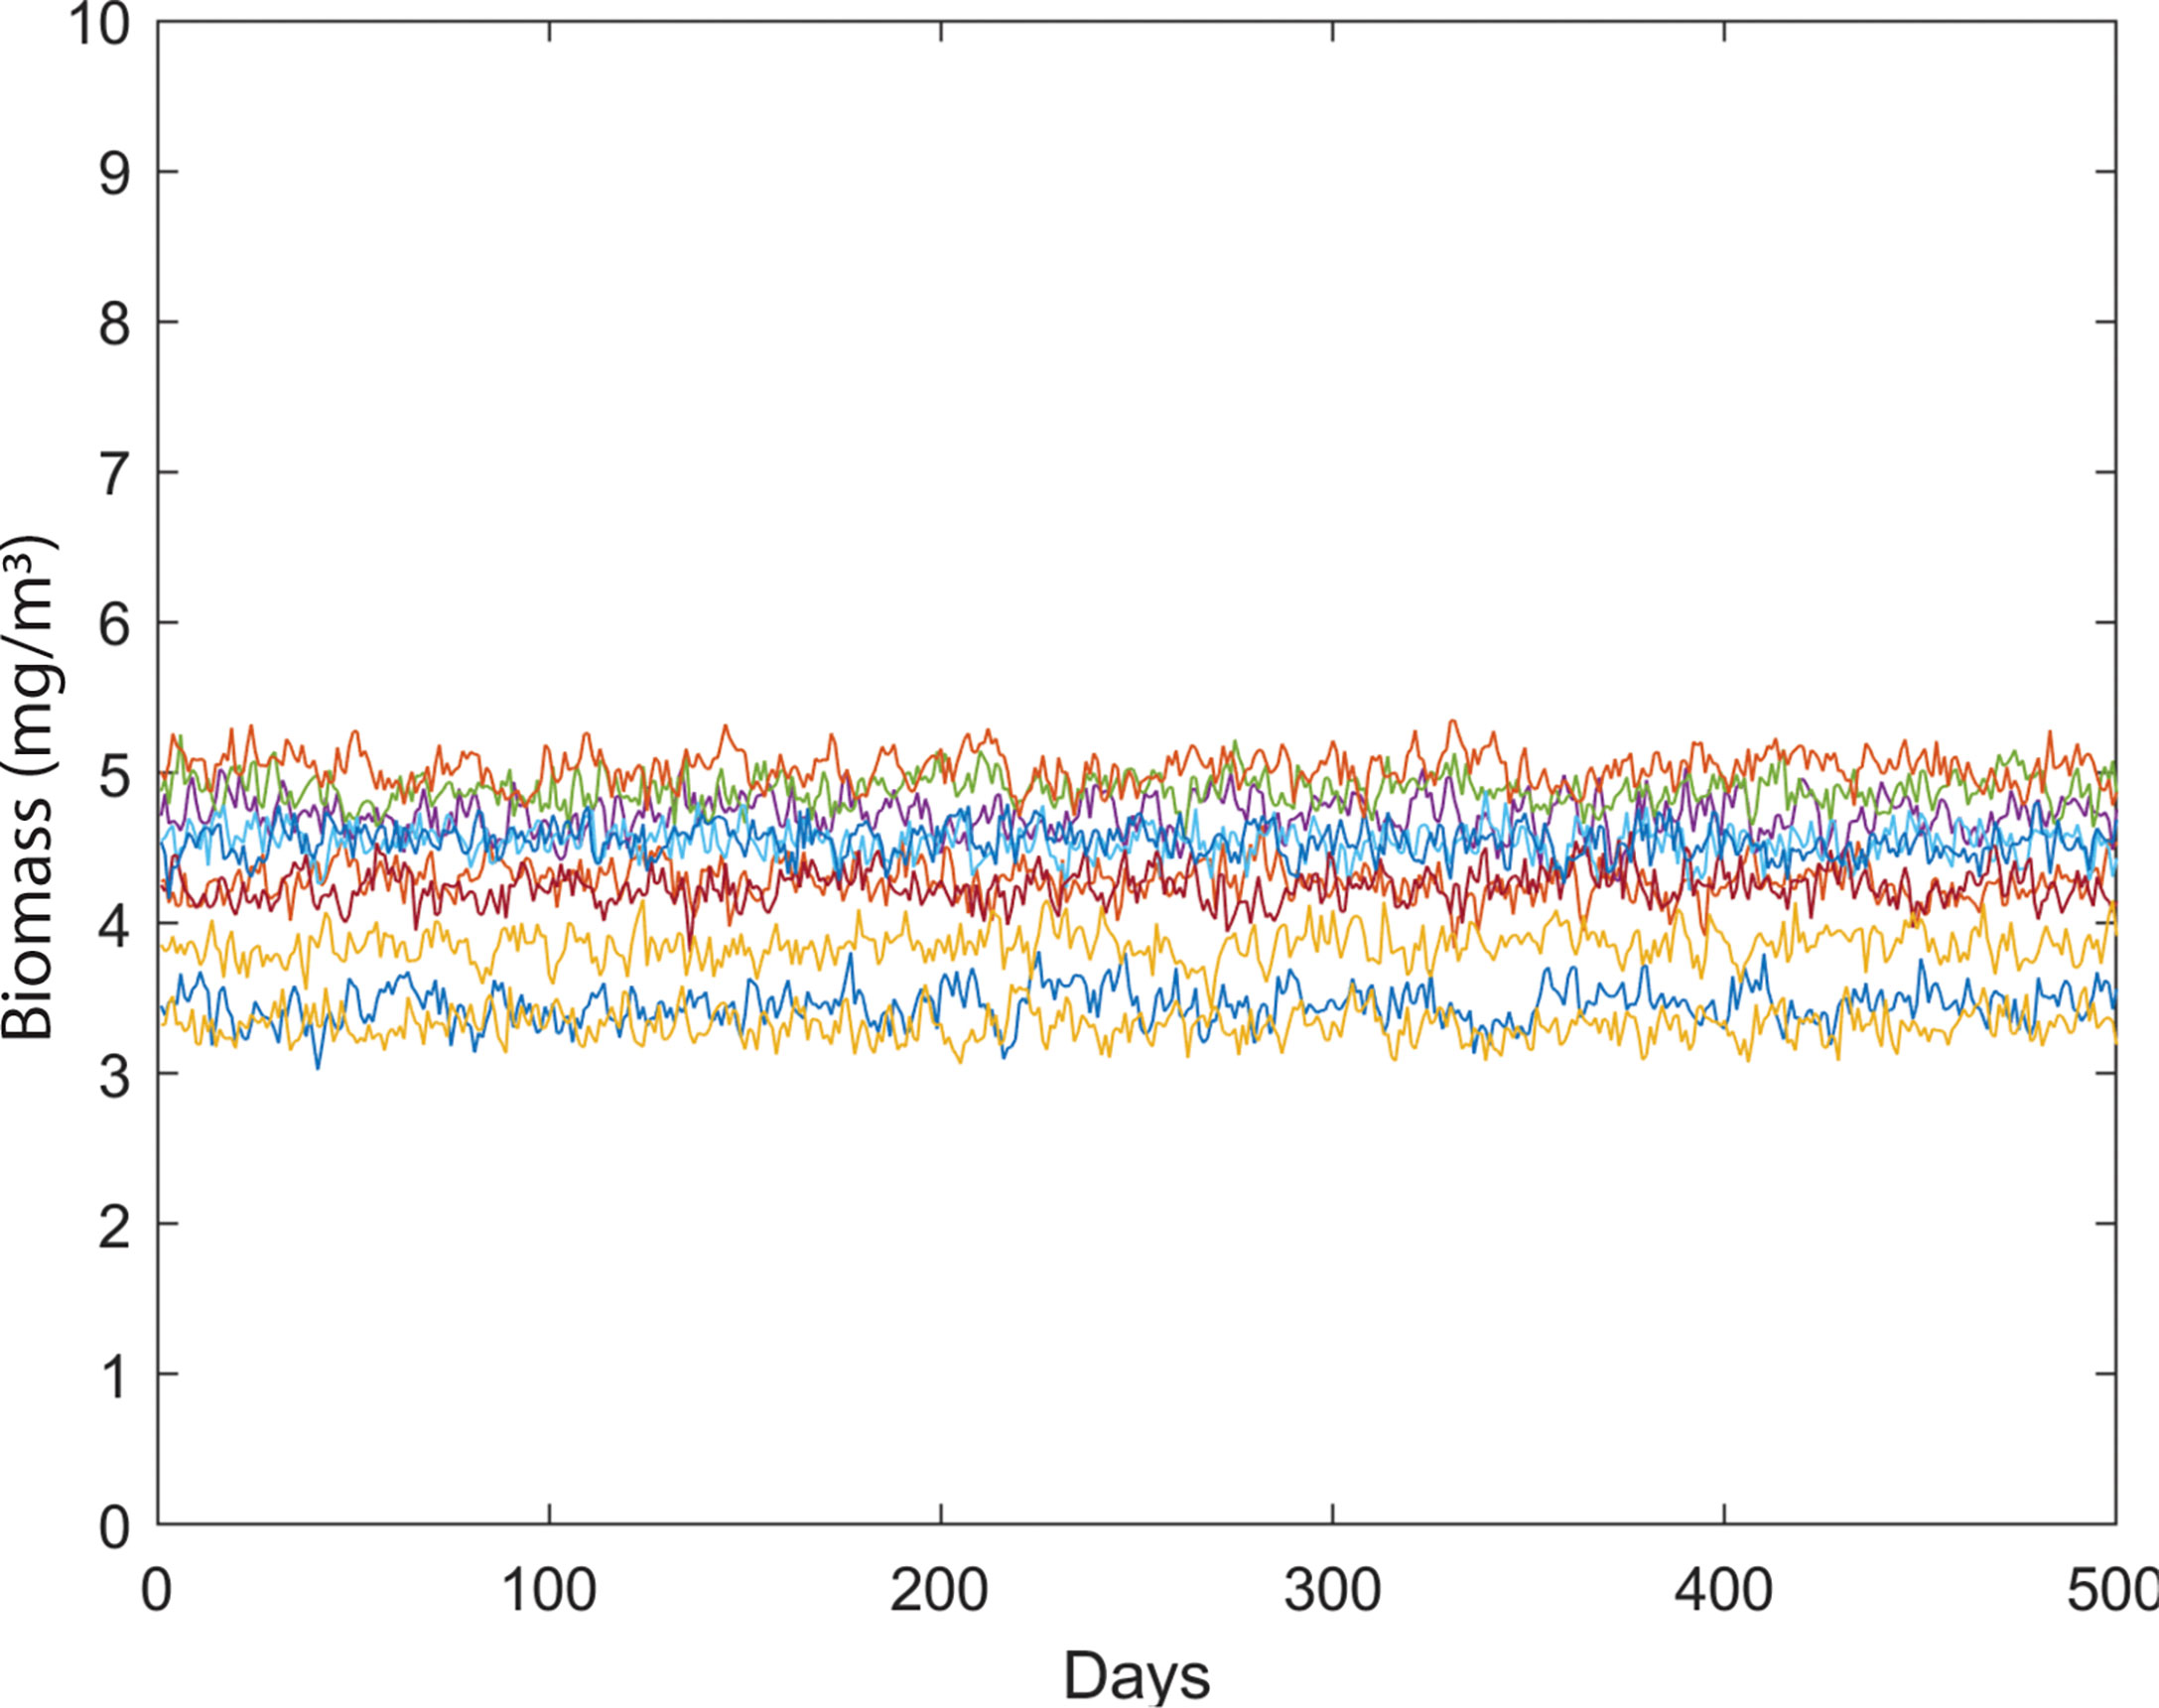
Figure 2 Variability in phytoplankton biomass (mg/m3) over time in a system without temperature-induced noise.

Figure 3 Variability of phytoplankton biomass over time at different noise conditions. Noise conditions were generated by varying the characteristics time scale of temperature fluctuation over the BoB. Solid lines indicate the mean biomass of 10 phytoplankton species from each simulation.
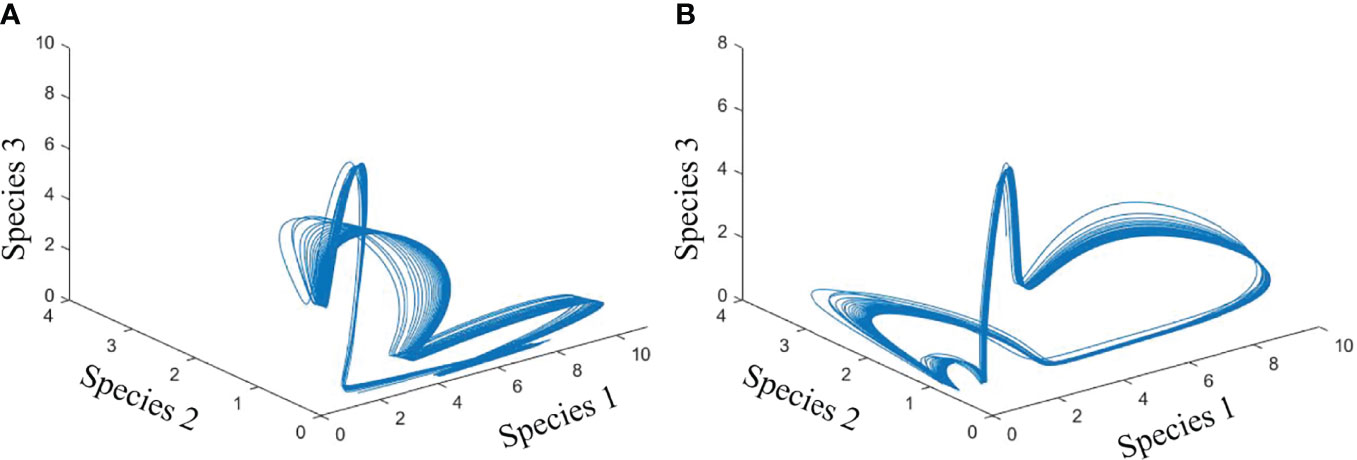
Figure 4 Phase plane diagram showing the cyclic fluctuation of biomass of species 1, 2, and 3 in a system without noise (A) and with noise (B).
Role of Noise on Species Niche Dynamics
The daily variation of SST in the BoB after removing the seasonal trend is shown in Figure 5. We estimated the characteristic timescale of SST fluctuation by fitting the exponential decay of the autocorrelation function (Figure 5). We found that SST fluctuations in the BoB can be described by a red-noise process with a characteristic timescale τ of about 8 days. When long-term biomass of phytoplankton species was simulated without adding any noise in the temperature-dependent growth function, we found that niche is identical for all species (Figure 6). This suggests that all species shared the same niche (mean niche was found at nt = 0). However, when we added noise in the growth function, a significant change in niche configuration of species was observed (Figure 7). Variation of mean noise conditions changed the mean niche and niche width of species significantly. Mean niche was found at nt = 0 for species 1. However, the mean niche of the same species shifted at nt = 0.5 when the characteristic timescale of SST fluctuation τ was considered 15 days (Figure 7). Similar shifts were also observed for the other species. When a species showed a narrow niche width at the low environmental noise, the same species showed a very wide niche width at higher environmental noise conditions. For example, at nt = 0 species 1 had a narrow niche width (-0.5 to 0.5). On the other hand, after adding noise with a characteristic timescale of SST fluctuation τ 15 days, species 1 showed a wider niche width (-1 to 1).
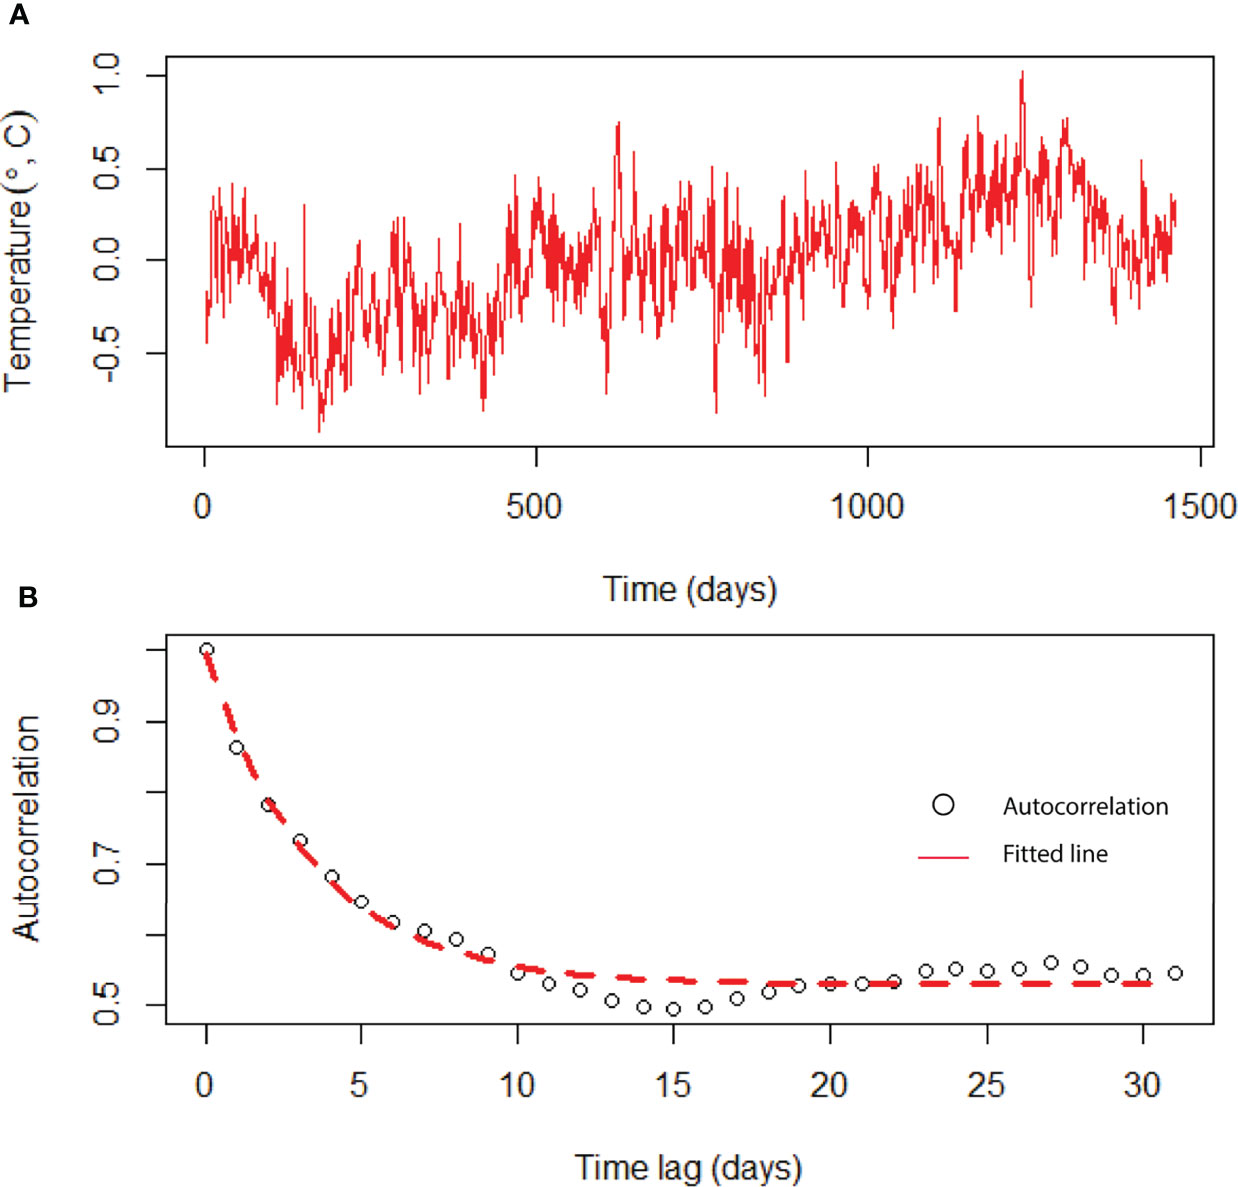
Figure 5 Time-series analysis of temperature fluctuations using data from the BoB. (A) Time series of daily surface water temperatures after the seasonal trend was removed from the original data, and (B) autocorrelation function of the seasonally detrended temperature data (circles). Red dashed line is an exponential decay fit.
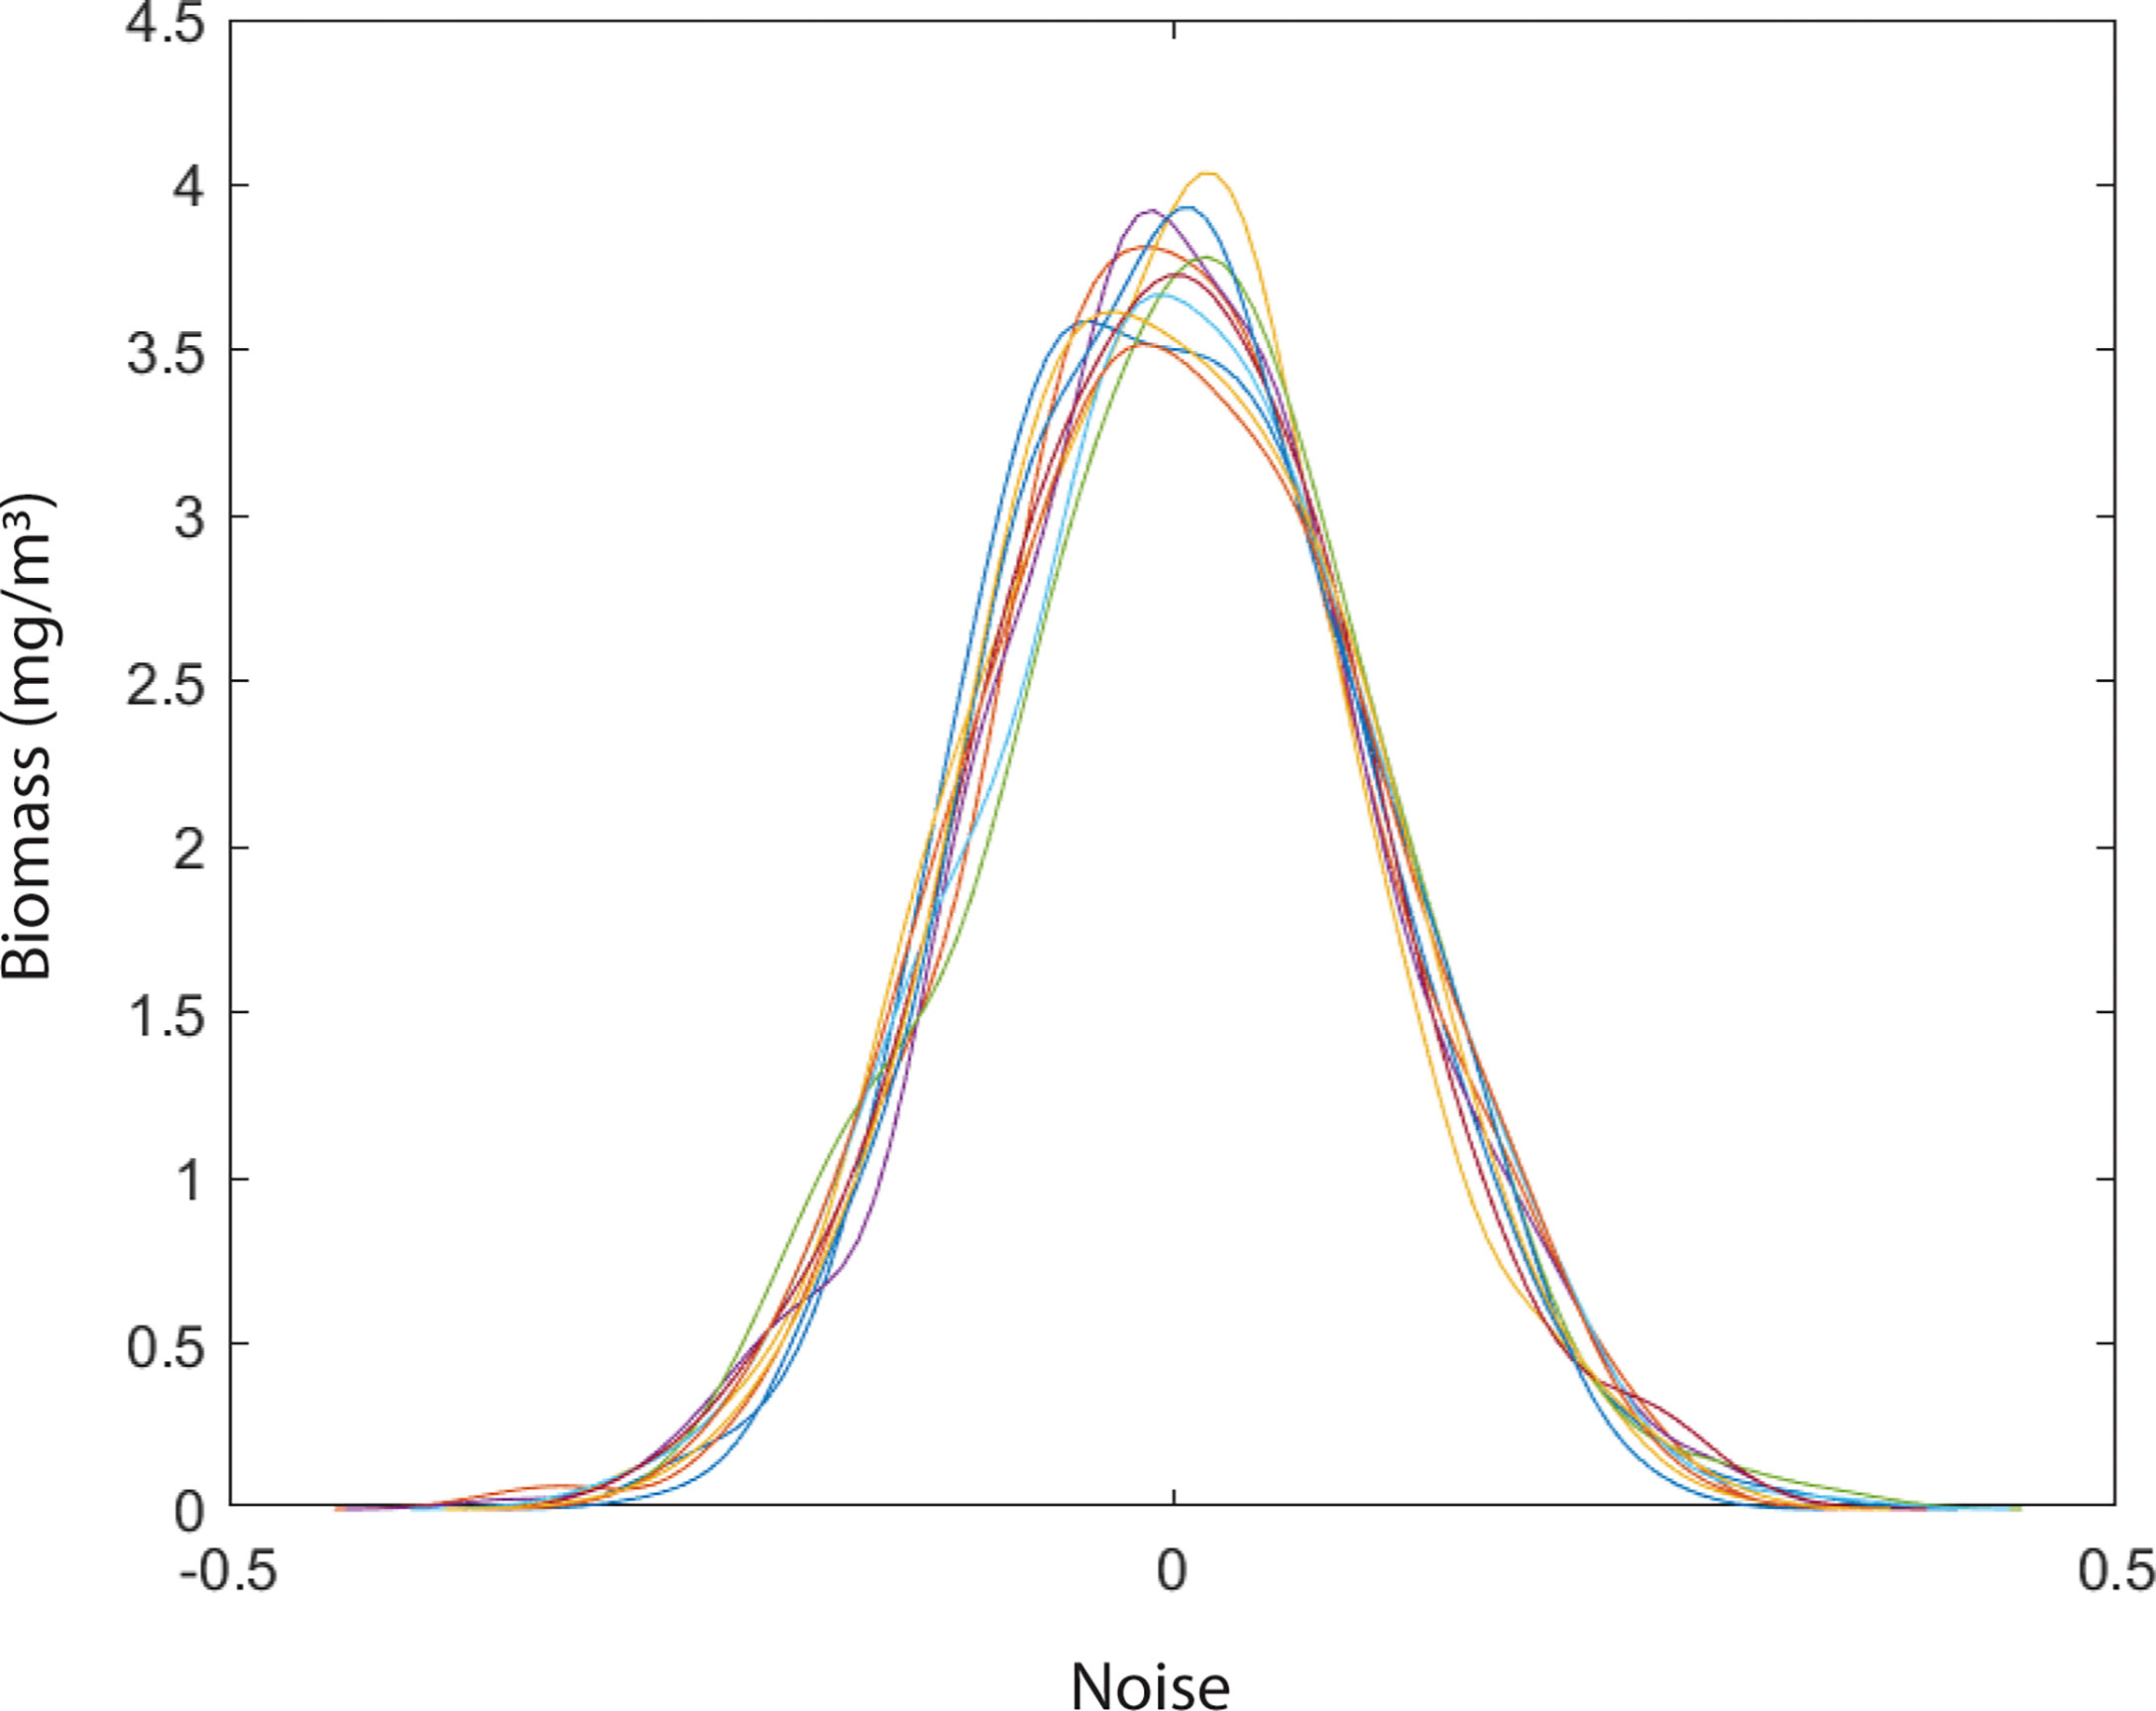
Figure 6 Variation in niche dynamics of phytoplankton species in a system without environmental noise.
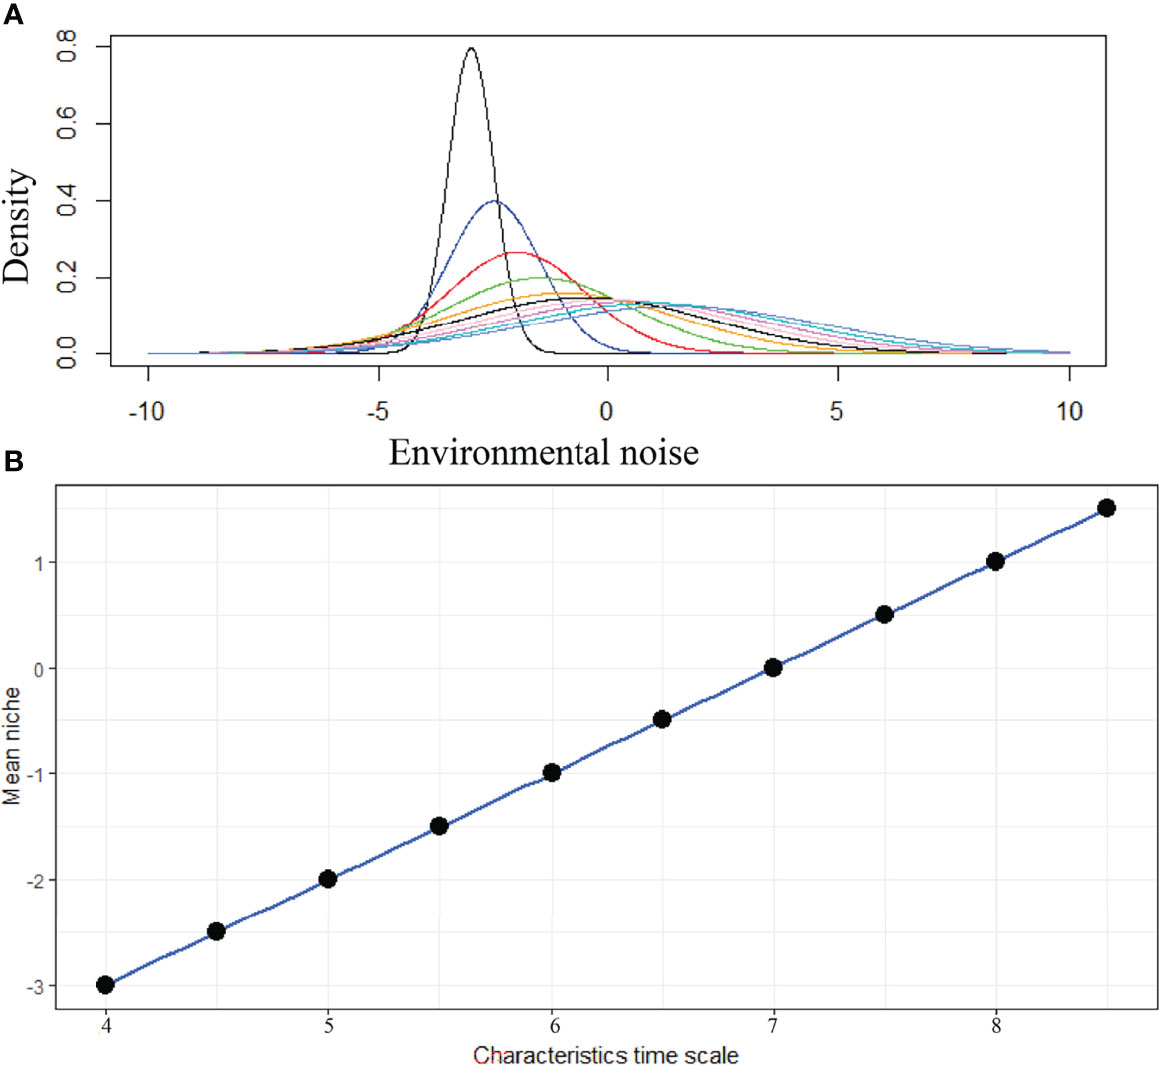
Figure 7 Variation of species niche configuration at different environmental noise. In this figure, niche dynamics in response to environmental variability is shown for species 1. (A) Changes in niche configuration of species 1 with environmental variability and (B) linear relationship between mean niche condition of species 1 and different characteristics time scales of SST change.
The biomass density of that species was found higher (5 mg/m3) in mean niche conditions when the noise was low. However, the density of biomass was comparatively low in mean niche conditions when the noise was higher (3.5 mg/m3) (Figure 8). Environmental noise also significantly influenced the niche overlap between species. We observed high niche overlapping at the low environmental noise conditions. Niche overlapping between species decreased significantly with the increase in environmental noise (Figure 9). For example, species 1 had a high level of overlapping with other nine species when the noise was low. On the other hand, species 1 showed low overlapping with other species when the noise was increased gradually (Figure 9).
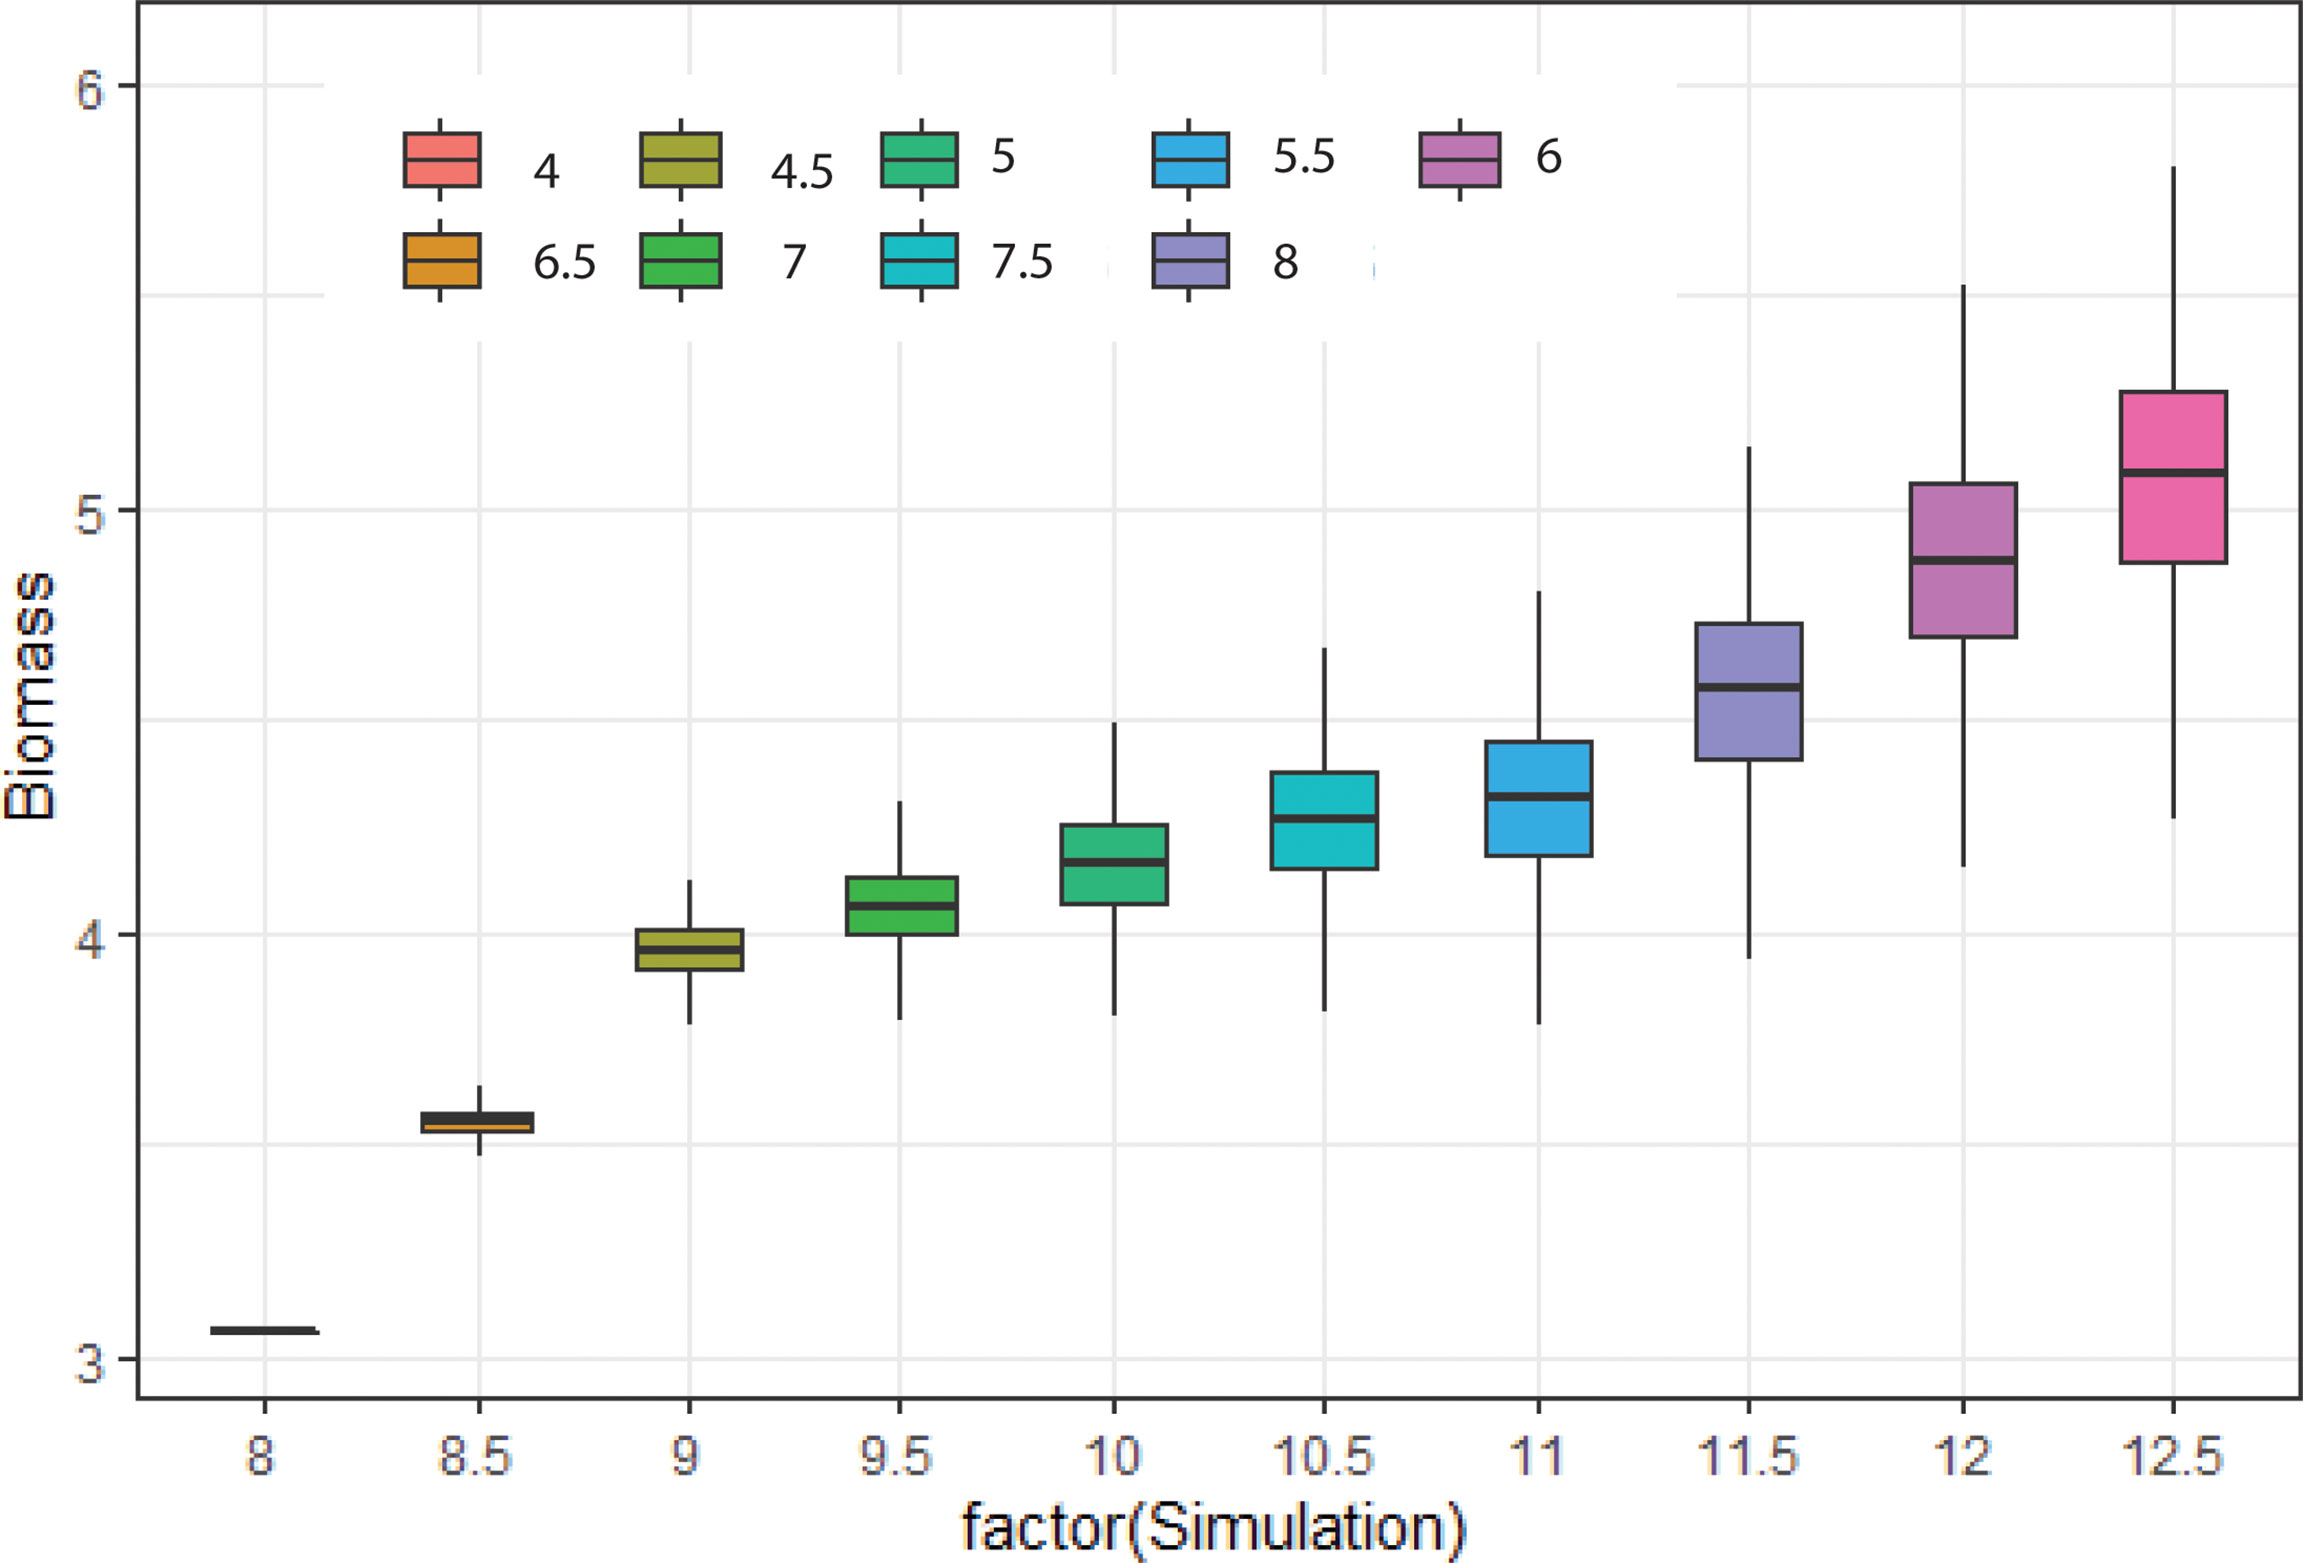
Figure 8 Change in biomass of 10 phytoplankton species considered for simulations at different characteristics time scales of SST change.
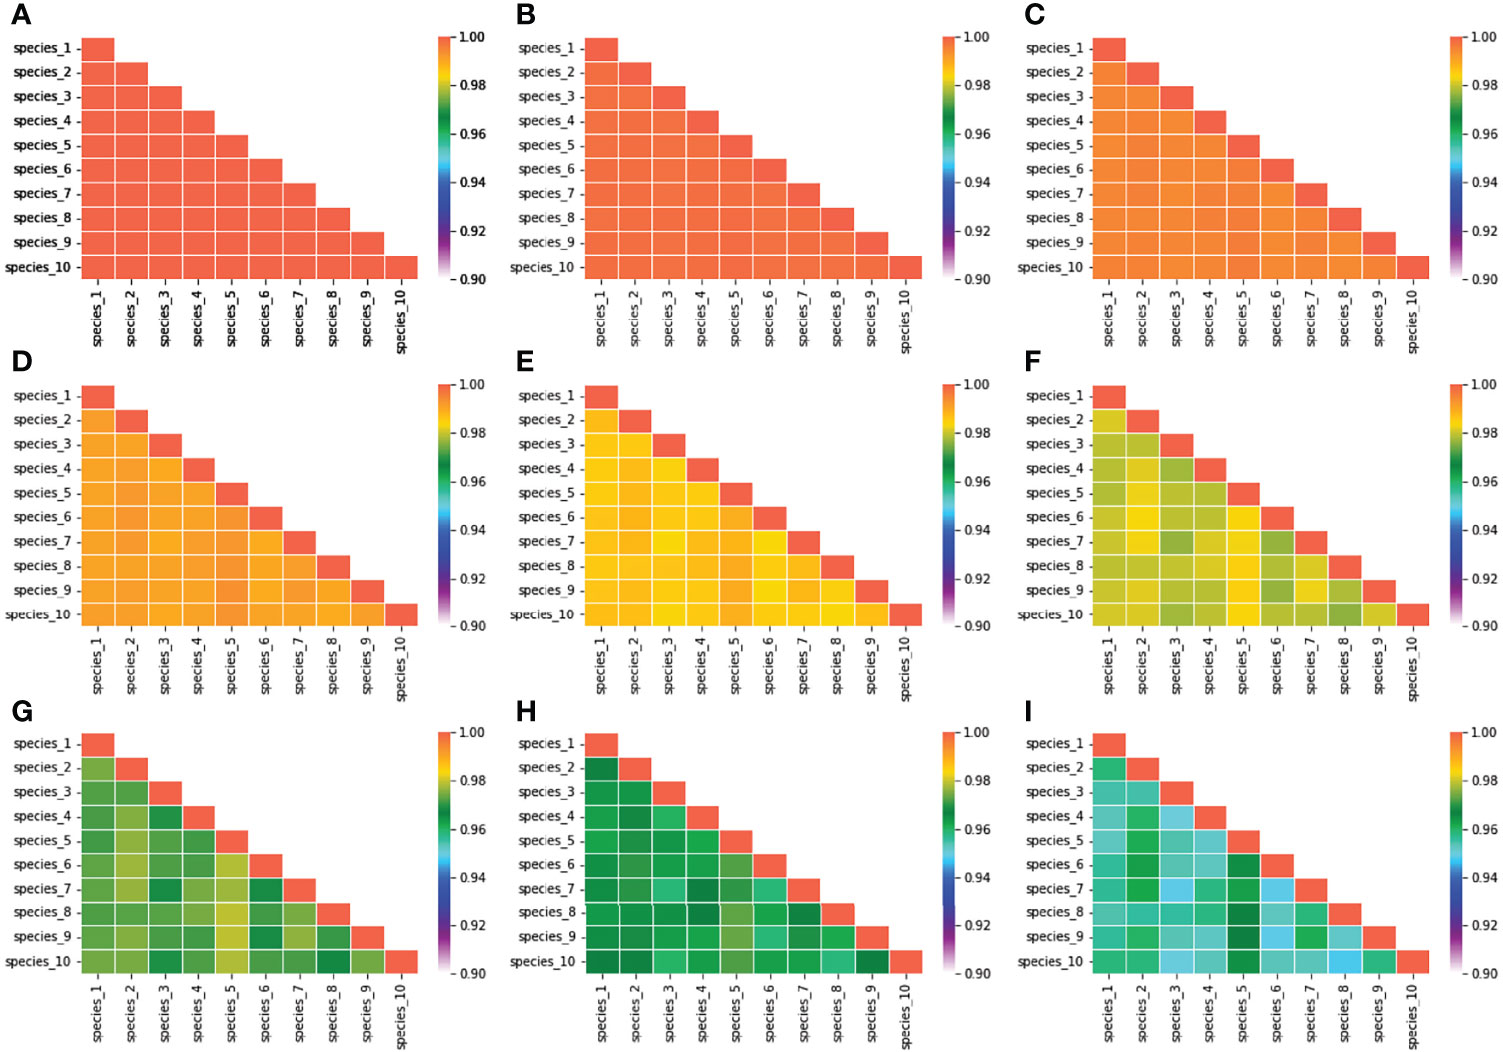
Figure 9 Variation in species niche overlap estimated at different environmental conditions. (A) When the characteristics time scale of SST change was considered 4 days, and (B–I) when the characteristics time scales of SST change were considered 4.5, 5, 5.5, 6, 6.5, 7, and 7.5 days, respectively.
Discussion
The present study aimed to understand the role of environmental noise on phytoplankton niche dynamics. We based our study using a multispecies competition model and formulated the growth, carrying capacity, mortality, and grazing of species as the function of SST. We included red noise in the model by incorporating the characteristics time scale of SST fluctuation of the Bay of Bengal. We first created an ecosystem where 10 phytoplankton species can coexist with the change in environmental forcing and noise. Later, we analyzed the species’ biomass and niche dynamics in relation to environmental change.
We found that oscillatory fluctuation of biomass, variation in carrying capacity, no competitive exclusion, non-equilibrium state in periodic fluctuation of species biomass, and periodic fluctuation in biomass enable phytoplankton species to coexist. In addition, a high amplitude in species biomass fluctuation at a higher environmental noise was found to be another potential coexistence mechanism of phytoplankton species. Multiple-species coexistence is considered a long-term puzzle in a community ecology study (Segura et al., 2011). The major challenge to resolve this puzzle lies in the principle of competitive exclusion (Laird and Schamp, 2006). The competitive exclusion principle suggests that identical niches among the species prevent their coexistence in the ecosystem (Hardin, 1960). According to this principle, the competition limits the number of coexisting phytoplankton species in the ecosystem (Benincà et al., 2008). However, Hutchinson (1961) pointed that in nature, thousands of phytoplankton species can coexist while they have identical niches (i.e., they compete for the same resources). Multiple-species coexistence driven by competition is reported by the studies of Huisman and Weissing (1999); Huisman et al. (2001); Baer et al. (2006), and Sarker et al. (2018). In this study, we considered a seasonally driven system with environmental noise. Species competition plays an evolutionary role in speciation and thus increases the diversity (Brännström et al., 2012). In addition, competition governs the interactions among the species through which biodiversity is regulated (Chesson, 2000). The joint influence of competition and seasonality causes a periodical succession of species one after another. This mechanism causes species coexistence in a noise-induced ecosystem which is also in line with the findings of Sarker et al. (2018) and Sarker et al. (2020) for subtropical and temperate marine ecosystems. Our study also found that the turnover time of species also changes with the change in noise in environmental conditions. This is also found true in the studies conducted by Dutta et al. (2014) and Huisman and Weissing (1999). Field-based studies of Sarker et al. (2018) and Dakos et al. (2009) also found similar results. Carrying capacity is the maximum phytoplankton biomass that can occur in a given environmental condition (Sarker and Wiltshire, 2017). Variation in carrying capacity indicates that each species has a specific biomass limit in the system (Franks, 2001). Therefore, when one species attains the carrying capacity, biomass of other species might be in the condition of undercarrying capacity. This causes the biomass peak of one species and low biomass of another species which enable them to coexist. In our study, we found that at high environmental noise conditions the amplitude of species biomass variation is higher. This is related to periodic succession which is a well-known coexistence mechanism of species (Sarker et al., 2018).
The range of environmental conditions under which a species can persist is known as fundamental niche (Ajani et al., 2018). The ecological niche of phytoplankton is driven by a number of factors, i.e., competition, dispersal ability, disease, and predation (Brun et al., 2015). In addition, changes in environmental conditions are also responsible for the change in the niche configuration of phytoplankton. Addition of noise leads to a change in phenology of species which results in a change in optimal niche conditions (Velthuis et al., 2017). Therefore, species optimal niche conditions may shift from the original. Our study also found the optimal niche of species changes with the change in environmental noise conditions. Several studies also reported similar findings on the species niche and environmental relationship. For example, Adrianet al. (2006), Mazaris et al. (2008), and Stefanescuet al. (2003) found similar findings for zooplankton, turtles, and Mediterranean butterflies, respectively. Our study found that mean niche, niche width, and niche overlapping among the species significantly changed with the variation of noise in the temperature-dependent growth function. These changes are the adaptation options of species in variable environmental conditions (Sarker et al., 2020). There will be an extinction risk if species do not adapt with the changing environment. Field-based studies confirmed such types of adaptation strategies. For example, Edwards and Richardson (2004) found similar adaption strategies of species in the central North Sea. The shift in mean niche condition of species is also related to their nature, i.e., generalists and specialists. In this study, all species were generalist in nature. Therefore, they showed a wider habitat demand and are less sensitive to environmental fluctuations (Preston et al., 2008). For example, temperature rise is less effective for generalist species (Sarker et al., 2020). Thus, this group of species can survive within a wide range of temperature changes (Ranius and Nilsson, 1997).
Conclusion
We simulated the phytoplankton dynamics using a competition model. We formulated species growth as a function of the stochastic fluctuation of temperature. Our study found that stochastic fluctuation of temperature changes the species niche configuration. So, how will this study contribute in marine and coastal environmental quality monitoring? Human society is largely dependent on the ocean. For example, the ocean provides half of the global oxygen, food, and means of transportation and livelihood. In addition, the ocean absorbs atmospheric CO2 significantly and thus plays a vital role in facing the global climate change challenges. However, increasing human dependence on the ocean is making the marine ecosystem vulnerable. Thus, monitoring of the marine ecosystem is important. Globally, the ocean is under the threat of climate change. Temperature rise is a consequence of global climate change. This study will help to monitor the species dynamics under the situation of climate change. Here, we developed a methodology to monitor the ecological niche of species in relation to environmental noise. This methodology can be adopted to explore the impacts of environmental degradation (i.e., pollution) on the phytoplankton niche. This study gives an idea how species will behave if environmental conditions fluctuate randomly. Taking this study as a base, one can formulate the framework to model the role of anthropogenic stressors (i.e., eutrophication and pollution) on phytoplankton ecology which helps to develop coastal monitoring and management systems.
Data Availability Statement
The original contributions presented in the study are included in the article/supplementary material. Further inquiries can be directed to the corresponding author.
Author Contributions
SS and MK deigned the study. SS performed the numerical simulations and wrote the manuscript. DM and SN performed the numerical simulations. DM, SN, and MK edited the draft manuscript. All authors contributed to the article and approved the submitted version.
Conflict of Interest
The authors declare that the research was conducted in the absence of any commercial or financial relationships that could be construed as a potential conflict of interest.
Publisher’s Note
All claims expressed in this article are solely those of the authors and do not necessarily represent those of their affiliated organizations, or those of the publisher, the editors and the reviewers. Any product that may be evaluated in this article, or claim that may be made by its manufacturer, is not guaranteed or endorsed by the publisher.
Supplementary Material
The Supplementary Material for this article can be found online at: https://www.frontiersin.org/articles/10.3389/fmars.2022.925796/full#supplementary-material
References
Adler P. B, Drake J. M. and . (2008). Environmental Variation, Stochastic Extinction, and Competitive Coexistence. Am. Nat. 172, E186–E195. doi: 10.1086/591678
Ajani P. A., McGinty N., Finkel Z. V., Irwin A. J. (2018). Phytoplankton Realized Niches Track Changing Oceanic Conditions at a Long-Term Coastal Station Off Sydney Australia. Front. Mar. Sci. 5. doi: 10.3389/fmars.2018.00285
Andreae M. O., Crutzen P. J. (1997). Atmospheric Aerosols: Biogeochemical Sources and Role in Atmospheric Chemistry. Science 276, 1052–1058. doi: 10.1126/science.276.5315.1052
Baer S. M., Li B., Smith H. L. (2006). Multiple Limit Cycles in the Standard Model of Three Species Competition for Three Essential Resources. J. Math. Biol. 52, 745–760. doi: 10.1007/s00285-005-0367-x
Benincà E., Huisman J., Heerkloss R., Jöhnk K. D., Branco P., Van Nes E. H., et al. (2008). Chaos in a Long-Term Experiment With a Plankton Community. Nature 451, 822–825. doi: 10.1038/nature06512
Beninc x. E., Dakos V., Van Nes E. H., Huisman J., et al. (2011). Resonance of Plankton Communities With Temperature Fluctuations. Am. Nat. 178, E85–E95. doi: 10.1086/661902
Box G. E., Jenkins G. M., Reinsel G. C., Ljung G. M. (2015). Time Series Analysis: Forecasting and Control (Hoboken:John Wiley & Sons).
Brännström Å, Johansson J., Loeuille N., Kristensen N., Troost T. A., Lambers R. H. R., et al. (2012). Modelling the Ecology and Evolution of Communities: A Review of Past Achievements, Current Efforts, and Future Promises. Evolutionary. Ecol. Res. 14, 601–625.
Brun P., Vogt M., Payne M. R., Gruber N., O’Brien C. J., Buitenhuis E. T., et al. (2015). Ecological Niches of Open Ocean Phytoplankton Taxa. Limnology. Oceanography. 60, 1020–1038. doi: 10.1002/lno.10074
Caracciolo M., Beaugrand G., Hélaouët P., Gevaert F., Edwards M., Lizon F., et al. (2020). Annual Phytoplankton Succession Results From Niche-Environment Interaction. J. Plankton. Res. 43, 85–102. doi: 10.1093/plankt/fbaa060
Charlson R. J., Lovelock J. E., Andreae M. O., Warren S. G. (1987). Oceanic Phytoplankton, Atmospheric Sulphur, Cloud Albedo and Climate. Nature 326, 655–661. doi: 10.1038/326655a0
Chesson P. (2000). Mechanisms of Maintenance of Species Diversity. Annu. Rev. Ecol. Systematics. 31, 343–366. doi: 10.1146/annurev.ecolsys.31.1.343
Cloern J. E., Jassby A. D. (2008). Complex Seasonal Patterns of Primary Producers at the Land–Sea Interface. Ecol. Lett. 11, 1294–1303. doi: 10.1111/j.1461-0248.2008.01244.x
Dakos V., Benincà E., van Nes E. H., Philippart C. J. M., Scheffer M., Huisman J. (2009). Interannual Variability in Species Composition Explained as Seasonally Entrained Chaos. Proc. R. Soc. B.: Biol. Sci. 276, 2871–2880. doi: 10.1098/rspb.2009.0584
Dickie L., Trites R. (1983). The Gulf of St. Lawrence403–.p.425. In Ecosystems of the World, 26: Estuaries and Semi-Enclosed Seas.Elsevier Sci. Pub., Amsterdam.
Duerschlag J., Mohr W., Ferdelman T. G., LaRoche J., Desai D., Croot P. L., et al. (2022). Niche Partitioning by Photosynthetic Plankton as a Driver of CO2-Fixation Across the Oligotrophic South Pacific Subtropical Ocean. ISME. J. 16, 465–476. doi: 10.1038/s41396-021-01072-z
Dutta P. S., Kooi B. W., Feudel U. (2014). Multiple Resource Limitation: Nonequilibrium Coexistence of Species in a Competition Model Using a Synthesizing Unit. Theor. Ecol. 7, 407–421. doi: 10.1007/s12080-014-0228-6
Facca C., Sfriso A. (2009). Phytoplankton in a Transitional Ecosystem of the Northern Adriatic Sea and its Putative Role as an Indicator for Water Quality Assessment. Mar. Ecol. 30, 462–479. doi: 10.1111/j.1439-0485.2009.00347.x
Franks P. J. S. (2001). Phytoplankton Blooms in a Fluctuating Environment: The Roles of Plankton Response Time Scales and Grazing. J. Plankton. Res. 23, 1433–1441. doi: 10.1093/plankt/23.12.1433
Freund J. A., Mieruch S., Scholze B., Wiltshire K., Feudel U. (2006). Bloom Dynamics in a Seasonally Forced Phytoplankton–Zooplankton Model: Trigger Mechanisms and Timing Effects. Ecol. Complexity. 3, 129–139. doi: 10.1016/j.ecocom.2005.11.001
Fujiwara M., Takada T. (2017). Environmental Stochasticity. eLS, John Wiley and Sons, Ltd (Ed.). doi: 10.1002/9780470015902.a0021220.pub2
Giordani G., Zaldívar J. M., Viaroli P. (2009). Simple Tools for Assessing Water Quality and Trophic Status in Transitional Water Ecosystems. Ecol. Indic. 9, 982–991. doi: 10.1016/j.ecolind.2008.11.007
Goebel N., Edwards C., Zehr J., Follows M., Morgan S. (2013). Modeled Phytoplankton Diversity and Productivity in the California Current System. Ecol. Model. 264, 37–47. doi: 10.1016/j.ecolmodel.2012.11.008
Hardin G. (1960). The Competitive Exclusion Principle. Science 131, 1292–1297. doi: 10.1126/science.131.3409.1292
Heneash A. M., Alprol A. E., El-Naggar H. A., Gharib S. M., Hosny S., El-Alfy M. A., et al. (2022). Multivariate Analysis of Plankton Variability and Water Pollution in Two Highly Dynamic Sites, Southeastern Mediterranean (Egyptian Coast). Arabian. J. Geosciences. 15, 330. doi: 10.1007/s12517-022-09595-1
Huisman J., Johansson A. M., Folmer E. O., Weissing F. J. (2001). Towards a Solution of the Plankton Paradox: The Importance of Physiology and Life History. Ecol. Lett. 4, 408–411. doi: 10.1046/j.1461-0248.2001.00256.x
Huisman J., Weissing F. J. (1999). Biodiversity of Plankton by Species Oscillations and Chaos. Nature 402, 407–410. doi: 10.1038/46540
Hutchinson G. (1957). Concluding Remarks-Cold Spring Harbor Symposia on Quantitative Biology. Reprinted in 1991: Classics in Theoretical Biology. Bull. Math. Biol. 53, 193–213. doi: 10.1007/BF02464429
Irwin A. J, Oliver M. J2009Are ocean deserts getting larger?Geophys. Res. Lett.36, L18609. doi: 10.1029/2009GL039883
Jakhar P. (2013). Role of Phytoplankton and Zooplankton as Health Indicators of Aquatic Ecosystem: A Review. Int. J. Innovation Res. Study. 2, 489–500.
Kilpatrick K. A., Podestá G. P., Evans R. (2001). Overview of the NOAA/NASA Advanced Very High Resolution Radiometer Pathfinder Algorithm for Sea Surface Temperature and Associated Matchup Database. J. Geophysical. Research.: Oceans. 106, 9179–9197. doi: 10.1029/1999JC000065
Laird Robert A., Schamp Brandon S. (2006). Competitive Intransitivity Promotes Species Coexistence. Am. Nat. 168, 182–193. doi: 10.1086/506259
Lugoli F., Garmendia M., Lehtinen S., Kauppila P., Moncheva S., Revilla M., et al. (2012). Application of a New Multi-Metric Phytoplankton Index to the Assessment of Ecological Status in Marine and Transitional Waters. Ecol. Indic. 23, 338–355. doi: 10.1016/j.ecolind.2012.03.030
Pitchaikani J. S., Lipton A. P. (2016). Nutrients and Phytoplankton Dynamics in the Fishing Grounds Off Tiruchendur Coastal Waters, Gulf of Mannar, India. SpringerPlus 5, 1405. doi: 10.1186/s40064-016-3058-8
Preston K. L., Rotenberry J. T., Redak R. A., Allen M. F. (2008). Habitat Shifts of Endangered Species Under Altered Climate Conditions: Importance of Biotic Interactions. Global Change Biol. 14, 2501–2515. doi: 10.1111/j.1365-2486.2008.01671.x
Ranius T., Nilsson S. G. (1997). Habitat of Osmoderma Eremita Scop. (Coleoptera: Scarabaeidae), a Beetle Living in Hollow Trees. J. Insect Conserv. 1, 193–204. doi: 10.1023/A:1018416000766
Roe G. (2009). Feedbacks, Timescales, and Seeing Red. Annu. Rev. Earth Planetary. Sci. 37, 93–115. doi: 10.1146/annurev.earth.061008.134734
Rosenzweig M. L., MacArthur R. H. (1963). Graphical Representation and Stability Conditions of Predator-Prey Interactions. Am. Nat. 97, 209–223. doi: 10.1086/282272
Sarker S., Feudel U., Meunier C. L., Lemke P., Dutta P. S., Wiltshire K. H. (2018). To Share or Not to Share? Phytoplankton Species Coexistence Puzzle in a Competition Model Incorporating Multiple Resource-Limitation and Synthesizing Unit Concepts. Ecol. Model. 383, 150–159. doi: 10.1016/j.ecolmodel.2018.05.021
Sarker S., Wiltshire K. H. (2017). Phytoplankton Carrying Capacity: Is This a Viable Concept for Coastal Seas? Ocean. Coast. Manage. 148, 1–8. doi: 10.1016/j.ocecoaman.2017.07.015
Sarker S., Yadav A. K., Akter M., Shahadat Hossain M., Chowdhury S. R., Kabir M. A., et al. (2020). Rising Temperature and Marine Plankton Community Dynamics: Is Warming Bad? Ecol. Complexity. 43, 100857. do: 10.1016/j.ecocom.2020.100857
Schroeder G. L. (1983). Sources of Fish and Prawn Growth in Polyculture Ponds as Indicated by δc Analysis. Aquaculture 35, 29–42. doi: 10.1016/0044-8486(83)90068-6
Segura A. M., Calliari D., Kruk C., Conde D., Bonilla S., Fort H. (2011). Emergent Neutrality Drives Phytoplankton Species Coexistence. Proc. R. Soc. B.: Biol. Sci. 278, 2355–2361. doi: 10.1098/rspb.2010.2464
Steele J. H. A. (1985). Comparison of Terrestrial and Marine Ecological Systems. Nature 313, 355–358. doi: 10.1038/313355a0
Trefault N., de la Iglesia R., Moreno-Pino M., Lopes dos Santos A., Gérikas Ribeiro C., Parada-Pozo G., et al. (2021). Annual Phytoplankton Dynamics in Coastal Waters From Fildes Bay, Western Antarctic Peninsula. Sci. Rep. 11, 1368. doi: 10.1038/s41598-020-80568-8
Velthuis M., de Senerpont Domis L. N., Frenken T., Stephan S., Kazanjian G., Aben R., et al. (2017). Warming Advances Top-Down Control and Reduces Producer Biomass in a Freshwater Plankton Community. Ecosphere 8, e01651. doi: 10.1002/ecs2.1651
Wiltshire K. H., Boersma M. (2016). “Meeting in the Middle: On the Interactions Between Microalgae and Their Predators or Zooplankton and Their Food,” in Aquatic Microbial Ecology and Biogeochemistry: A Dual Perspective. Eds. Glibert P. M., Kana T. M. (Cham: Springer International Publishing), 215–223.
Wiltshire K. H., Boersma M., Carstens K., Kraberg A. C., Peters S., Scharfe M. (2015). Control of Phytoplankton in a Shelf Sea: Determination of the Main Drivers Based on the Helgoland Roads Time Series. J. Sea. Res. 105, 42–52. doi: 10.1016/j.seares.2015.06.022
Keywords: temperature, co-existence, fluctuation, ecology, marine
Citation: Sarker S, Mohammad D, Nabil SA and Kabir MA (2022) Modelling the Role of Temperature-Induced Environmental Noise on Phytoplankton Niche Dynamics. Front. Mar. Sci. 9:925796. doi: 10.3389/fmars.2022.925796
Received: 21 April 2022; Accepted: 20 June 2022;
Published: 25 July 2022.
Edited by:
Dilip Kumar Jha, National Institute of Ocean Technology, IndiaReviewed by:
Gopalakrishnan Thilagam, Pachaiyappa’s College for Men, IndiaSubrat Naik, National Centre for Coastal Research, India
Biraja Kumar Sahu, Council of Scientific and Industrial Research (CSIR), India
Copyright © 2022 Sarker, Mohammad, Nabil and Kabir. This is an open-access article distributed under the terms of the Creative Commons Attribution License (CC BY). The use, distribution or reproduction in other forums is permitted, provided the original author(s) and the copyright owner(s) are credited and that the original publication in this journal is cited, in accordance with accepted academic practice. No use, distribution or reproduction is permitted which does not comply with these terms.
*Correspondence: Subrata Sarker, c3VicmF0YXNyay1vY2dAc3VzdC5lZHU=