 Geraint A. Tarling1*
 Anna Belcher1
 Mayleen Blackwell2
 Claudia Castellani3
 Kathryn Barbara Cook4
 Finlo R. Cottier5,6Victoria Dewar-Fowler1
 Jennifer J. Freer1Laura Gerrish1
 Magnus L. Johnson7
 Kim S. Last5
 Penelope Kate Lindeque3
 Daniel J. Mayor4Helen E. Parry3
 Gabriele Stowasser1
 Marianne Wootton8
- 1British Antarctic Survey, High Cross, Cambridge, United Kingdom
- 2University of Franche-Comté, Besançon, France
- 3Marine Ecology and Biodiversity, Plymouth Marine Laboratory, Plymouth, United Kingdom
- 4National Oceanography Centre, Southampton, United Kingdom
- 5Scottish Association for Marine Science, Oban, United Kingdom
- 6Department for Arctic and Marine Biology, UiT, The Arctic University of Norway, Tromsø, Norway
- 7Department of Biological and Marine Sciences, University of Hull, Hull, United Kingdom
- 8Marine Biological Association, The Laboratory, Plymouth, United Kingdom
The boreal copepod Calanus finmarchicus sequesters substantial amounts of carbon (C) in the deep layers of the North Atlantic Ocean through their contribution to the “lipid pump.” This pump is driven by these zooplankton descending from the surface layers to spend prolonged periods at depth during which time they metabolise substantial lipid reserves and a fraction suffer mortality. C. finmarchicus is principally a boreal species but is expatriated by currents flowing northwards into Arctic regions such as the Fram Strait, where it is now able to complete its life cycle. We considered how this expansion to its distributional range adds to the estimated magnitude of the lipid pump. Field sampling in the Fram Strait found C. finmarchicus abundance to be spatially variable with high values, equivalent to those reported for core distributional areas further south, found mainly in the eastern region. Lipid reserve levels were sufficient for many individuals to survive the overwintering period and reproduce the following spring. In accordance with abundance patterns, lipid pump magnitude was greater in the Eastern Fram Strait (2.04 g C m−2 year−1) compared to the Western Fram Strait (0.33 g C m−2 year−1). At least for the eastern region, these rates are similar to those reported for this species elsewhere (average of 4.35 g C m−2 year−1). When extrapolated to the wider spatial area of the Fram Strait, the lipid pump generated by this species in this ocean sector amounts to 0.3 Mt C year−1. Although constituting a modest proportion of the total C. finmarchicus lipid pump of 19.3 Mt C year−1, it indicates that the continued northwards expansion of this species will act to increase the size of its lipid pump, which may counteract that lost through the northwards retreat of its Arctic congeners, Calanus glacialis and Calanus hyperboreus.
Introduction
The Arctic is experiencing the strongest warming on the planet and, in recent decades, a loss of sea ice unprecedented in observations (Carmack et al., 2015; Onarheim et al., 2018; Stroeve and Notz, 2018). Large-scale re-organisation of Arctic marine communities is expected as a result of these changes (Sunday et al., 2011; Wassmann, 2011; Fossheim et al., 2015; Kortsch et al., 2015), and the structure and function of these communities have already been affected (Wassmann et al., 2011; Wiedmann et al., 2014; Fossheim et al., 2015; Thomas et al., 2022). A warmer, ice-free Arctic will increase the phytoplankton growth season and thus the total primary production, which in turn provides better growth conditions and a longer growth season for marine zooplankton (Ji et al., 2012). The Arctic Ocean is significantly influenced by advection, especially from the Atlantic (Wassmann et al., 2015), and is constantly receiving expatriates from lower latitudes. With more favourable environmental conditions, plankton more typical of lower latitudes may become increasingly successful in establishing themselves at higher latitudes, potentially outcompeting resident species that are generally stenothermal and already have to deal with the stress of sub-optimal abiotic conditions (Pinsky et al., 2013; Orkney et al., 2020; Daase et al., 2021). Such impacted regions will experience shifts in plankton community species composition, food-web dynamics, and biogeochemical cycles.
The known impacts of climate-driven changes to marine zooplankton communities are often centred on copepods (Pierson et al., 2013). In the Arctic and sub-Arctic pelagic ecosystems, copepods of the genus Calanus are key, dominating the biomass of the mesozooplankton (Smith and Schnack-Schiel, 1990; Ashjian et al., 2003; Falk-Petersen et al., 2009) and being the prime herbivores (Conover and Huntley, 1991; Mauchline, 1998; Søreide et al., 2008). Calanus is also an important high-quality food source for pelagic fish species such as capelin, herring, and pollock and can also be a key part of the diet for larval and juvenile demersal fishes such as cod (Wassmann et al., 2006). In effect, Calanus sit at a trophic nexus since its population biology has important consequences on both higher and lower trophic levels. This may be referred to as a “wasp-waist” ecosystem, in that the intermediate trophic level, in this case Calanus, controls the abundance of predators through a bottom-up interaction and the abundance of prey through a top-down interaction (Fauchald et al., 2011; Renaud et al., 2018). In the Arctic and sub-Arctic sectors adjacent to the Atlantic, three species of Calanus co-occur, making up 50%–80% of the total mesozooplankton biomass (Søreide et al., 2008). However, their respective core distributions align with different water masses, with Calanus hyperboreus being a high-Arctic oceanic species, Calanus glacialis being associated with the relatively shallow and fresher water on the Arctic shelves, and Calanus finmarchicus dominating the inflowing warm Atlantic water (AW) (Ershova et al., 2021). Of these three species, the last one stands to benefit most from ocean warming and perennial ice retreat.
One of the key life-history traits of pelagic copepods is a form of seasonal dormancy called diapause (Dahms, 1995). Diapause usually takes place below the deep convection layer, out of the reach of predators where temperatures are generally low (Krumhansl et al., 2018). This deep habitat allows these organisms to remain quiescent, reduce basal metabolic rate, and minimise energy expenditure (Jónasdóttir et al., 2019). In C. finmarchicus, dormancy generally occurs in later developmental stages (CIII to CVI) during winter (Kattner and Krause, 1987; Tande and Henderson, 1988; Hygum et al., 2000; Heath et al., 2000b; Heath et al., 2004). In these stages, assimilated food is increasingly channelled towards lipid production (Jónasdóttir et al., 2019; Hygum et al., 2000). These lipids form the energy reserves required to sustain the animals through the winter. Towards late summer and autumn, the population descends en masse to depths of 600–1,400 m to overwinter. In the spring, the survivors migrate back to the surface and develop into sexually-differentiated CVI adults, mate, and spawn, initiating the next generation.
The key to successful overwintering is the size of an individual’s lipid reserve. The reserve serves a number of purposes (Visser et al., 2017), fuelling metabolic costs during diapause (Hirche, 1996; Lee et al., 2006), providing for moulting and capital breeding during spring (Varpe et al., 2009; Sainmont et al., 2014), and facilitating neutral buoyancy at depth so as to minimise energy expenditure (Visser and Jonasdottir, 1999; Pond and Tarling, 2011). Lipids are stored in a membrane-bound organ, the lipid sac, which extends from near the back of the abdominal region (metasome) forward into the head (cephalosome). The greater the amount of stored lipid, the farther the sac extends towards the anterior end, eventually filling over half of the volume of the prosome (Sargent and Falk-Petersen, 1988; Miller et al., 1998; Miller et al., 2000; Lee et al., 2006). At its full capacity, the lipid reserve may account for over 50% of individual dry weight (Kattner and Hagen, 2009). The principal lipid class in this reserve is wax ester, which is rich in polyunsaturated fatty acids (PUFAs), particularly the long-chain fatty acids C20:5n−3 and C22:6n−3. These PUFAs enable the lipid to remain liquid at high pressure and low temperature, which assists with neutral buoyancy (Yayanos et al., 1978; Pond and Tarling, 2011). As well as lipid sac size, the duration of diapause is also influenced by overwintering temperatures, which influence respiration rate and hence the rate of energy expenditure during diapause (Wilson et al., 2016). Those individuals with insufficient reserves to outlast the winter period will likely suffer mortality while still at depth (Visser et al., 2017).
An important feature of this life-cycle pattern is that it transports carbon (C) directly to the deep ocean with very little loss on the way (Visser et al., 2017) in a process termed the “lipid pump” (Jónasdóttir et al., 2015). The lipid pump is an efficient means of C sequestration, relative to the passive flux of detrital material because it transports little or no nutrient elements (nitrogen, phosphorus, iron, etc.) that are required by primary producers in surface waters. Nevertheless, estimation of this flux is complex and must be based on stage-specific abundances of the overwintering individuals, their respiration integrated over their respective overwintering durations, and estimates of the level of mortality at depth. The size of the lipid pump was initially dismissed as insignificant by Longhurst and Williams (1992), who have since been shown to have based their estimates on a region where deep winter convection made deep diapause in copepods less effective than in other areas (Visser et al., 2017). Heath et al. (2000b) comprehensively mapped the North Atlantic population of C. finmarchicus and facilitated Jónasdóttir et al. (2015) to reveal the true magnitude of the lipid pump. At 1 to 4 g C m−2 year−1, Jónasdóttir et al. (2015) showed this pump to sequester C at a rate equivalent to that of the passive flux, at 2 to 8 g C m−2 year−1 (Giering et al., 2014; Marsay et al., 2015). Subsequent analyses of additional data alongside an updated overwintering respiration model by Jónasdóttir et al. (2019) put upper estimates of the Atlantic C. finmarchicus lipid pump even higher (up to 11.5 g C m−2 year−1). So far, the rate of C flux by the “Arctic” C. finmarchicus population has not been considered.
The Fram Strait is the only deep-water gateway to the Arctic and comprises the main outflow and inflow of Arctic water and AW masses (Figure 1). On the west side of the Fram Strait is the dominant outflow of the Arctic Ocean, comprising the East Greenland Current (EGC), which follows the east Greenland coast southwards, and a deeper outflow from the Arctic basin. To the east of this is an inflow of warm and saline AW from the Norwegian Sea, constituting the West Spitsbergen Current (WSC), a branch of which flows north past the west coast of Svalbard and onwards into the high Arctic Ocean (Beszczynska-Moeller et al., 2011; Rudels, 2015), while another branch recirculates to the west and flows south (Hattermann et al., 2016). The Fram Strait has warmed as a result of increased Atlantic inflow into the region (Schauer et al., 2004), which has diminished the extent of seasonal sea-ice and lengthened the productive season (Kahru et al., 2011; Polyakov et al., 2020). The distribution and abundance of C. finmarchicus in the Fram Strait are directly influenced by these two major currents with the highest inputs of this species being associated with the inflow of the WSC into the region (Gluchowska et al., 2017).
In this study, we determine the horizontal and vertical distributions of C. finmarchicus in a spatially comprehensive survey of the Fram Strait region during the late summer period, when the population is entering diapause. Measurements of body condition considering body size, lipid sac size, and total C weight are made within the various oceanographic regimes of this region. These are used alongside environmental measurements to estimate respiration rate and diapause duration by applying a metabolic model developed by Visser et al. (2017). This model estimates the C flux due to overwintering C. finmarchicus respiration to which is added the contribution from minimum expected overwintering mortality (which is further subdivided into the storage lipid and structural C fractions). Together, the C released at depth through respiration and mortality constitutes the lipid pump. Further context is provided by comparing our results to other biogeographic regions where the magnitude of the lipid pump has already been estimated. Lastly, we provide a value for the C sequestered by this species that encompasses all regions where the magnitude of the pump has so far been made.
Methods
Field Sampling
A multidisciplinary field campaign was carried out in the Fram Strait region during late summer 2019 (JR18007, 04/08/2019 to 28/08/2019) aboard RRS James Clark Ross. Sampling for Calanus copepods was carried out at a total of 14 stations spread across the region encompassing both deep basin and shelf locations (Figure 1; Table 1). A motion-compensated Bongo net fitted with 200-µm mesh was deployed at all stations to provide the widest possible spatial coverage of the region. The device was lowered and hauled vertically at ~0.22 m s−1 to a maximum depth of 200 m or to within 10 m of the seabed. A flow meter was not used to record the volume swept by the nets, as the slow hauling speed was at the bottom end of the calibration range of available flow meters. Instead, it was assumed that the filtration was 100% efficient, and the volume swept was determined by calculating the mouth area and multiplying by the vertical sampling interval. For a 200-m water column, this represented ~58 m3. The outcome of each deployment was a pair of quasi-identical samples, of which one was preserved in 4% borax buffered formaldehyde for visual taxonomic analysis and the other in 99% ethanol for molecular analysis.
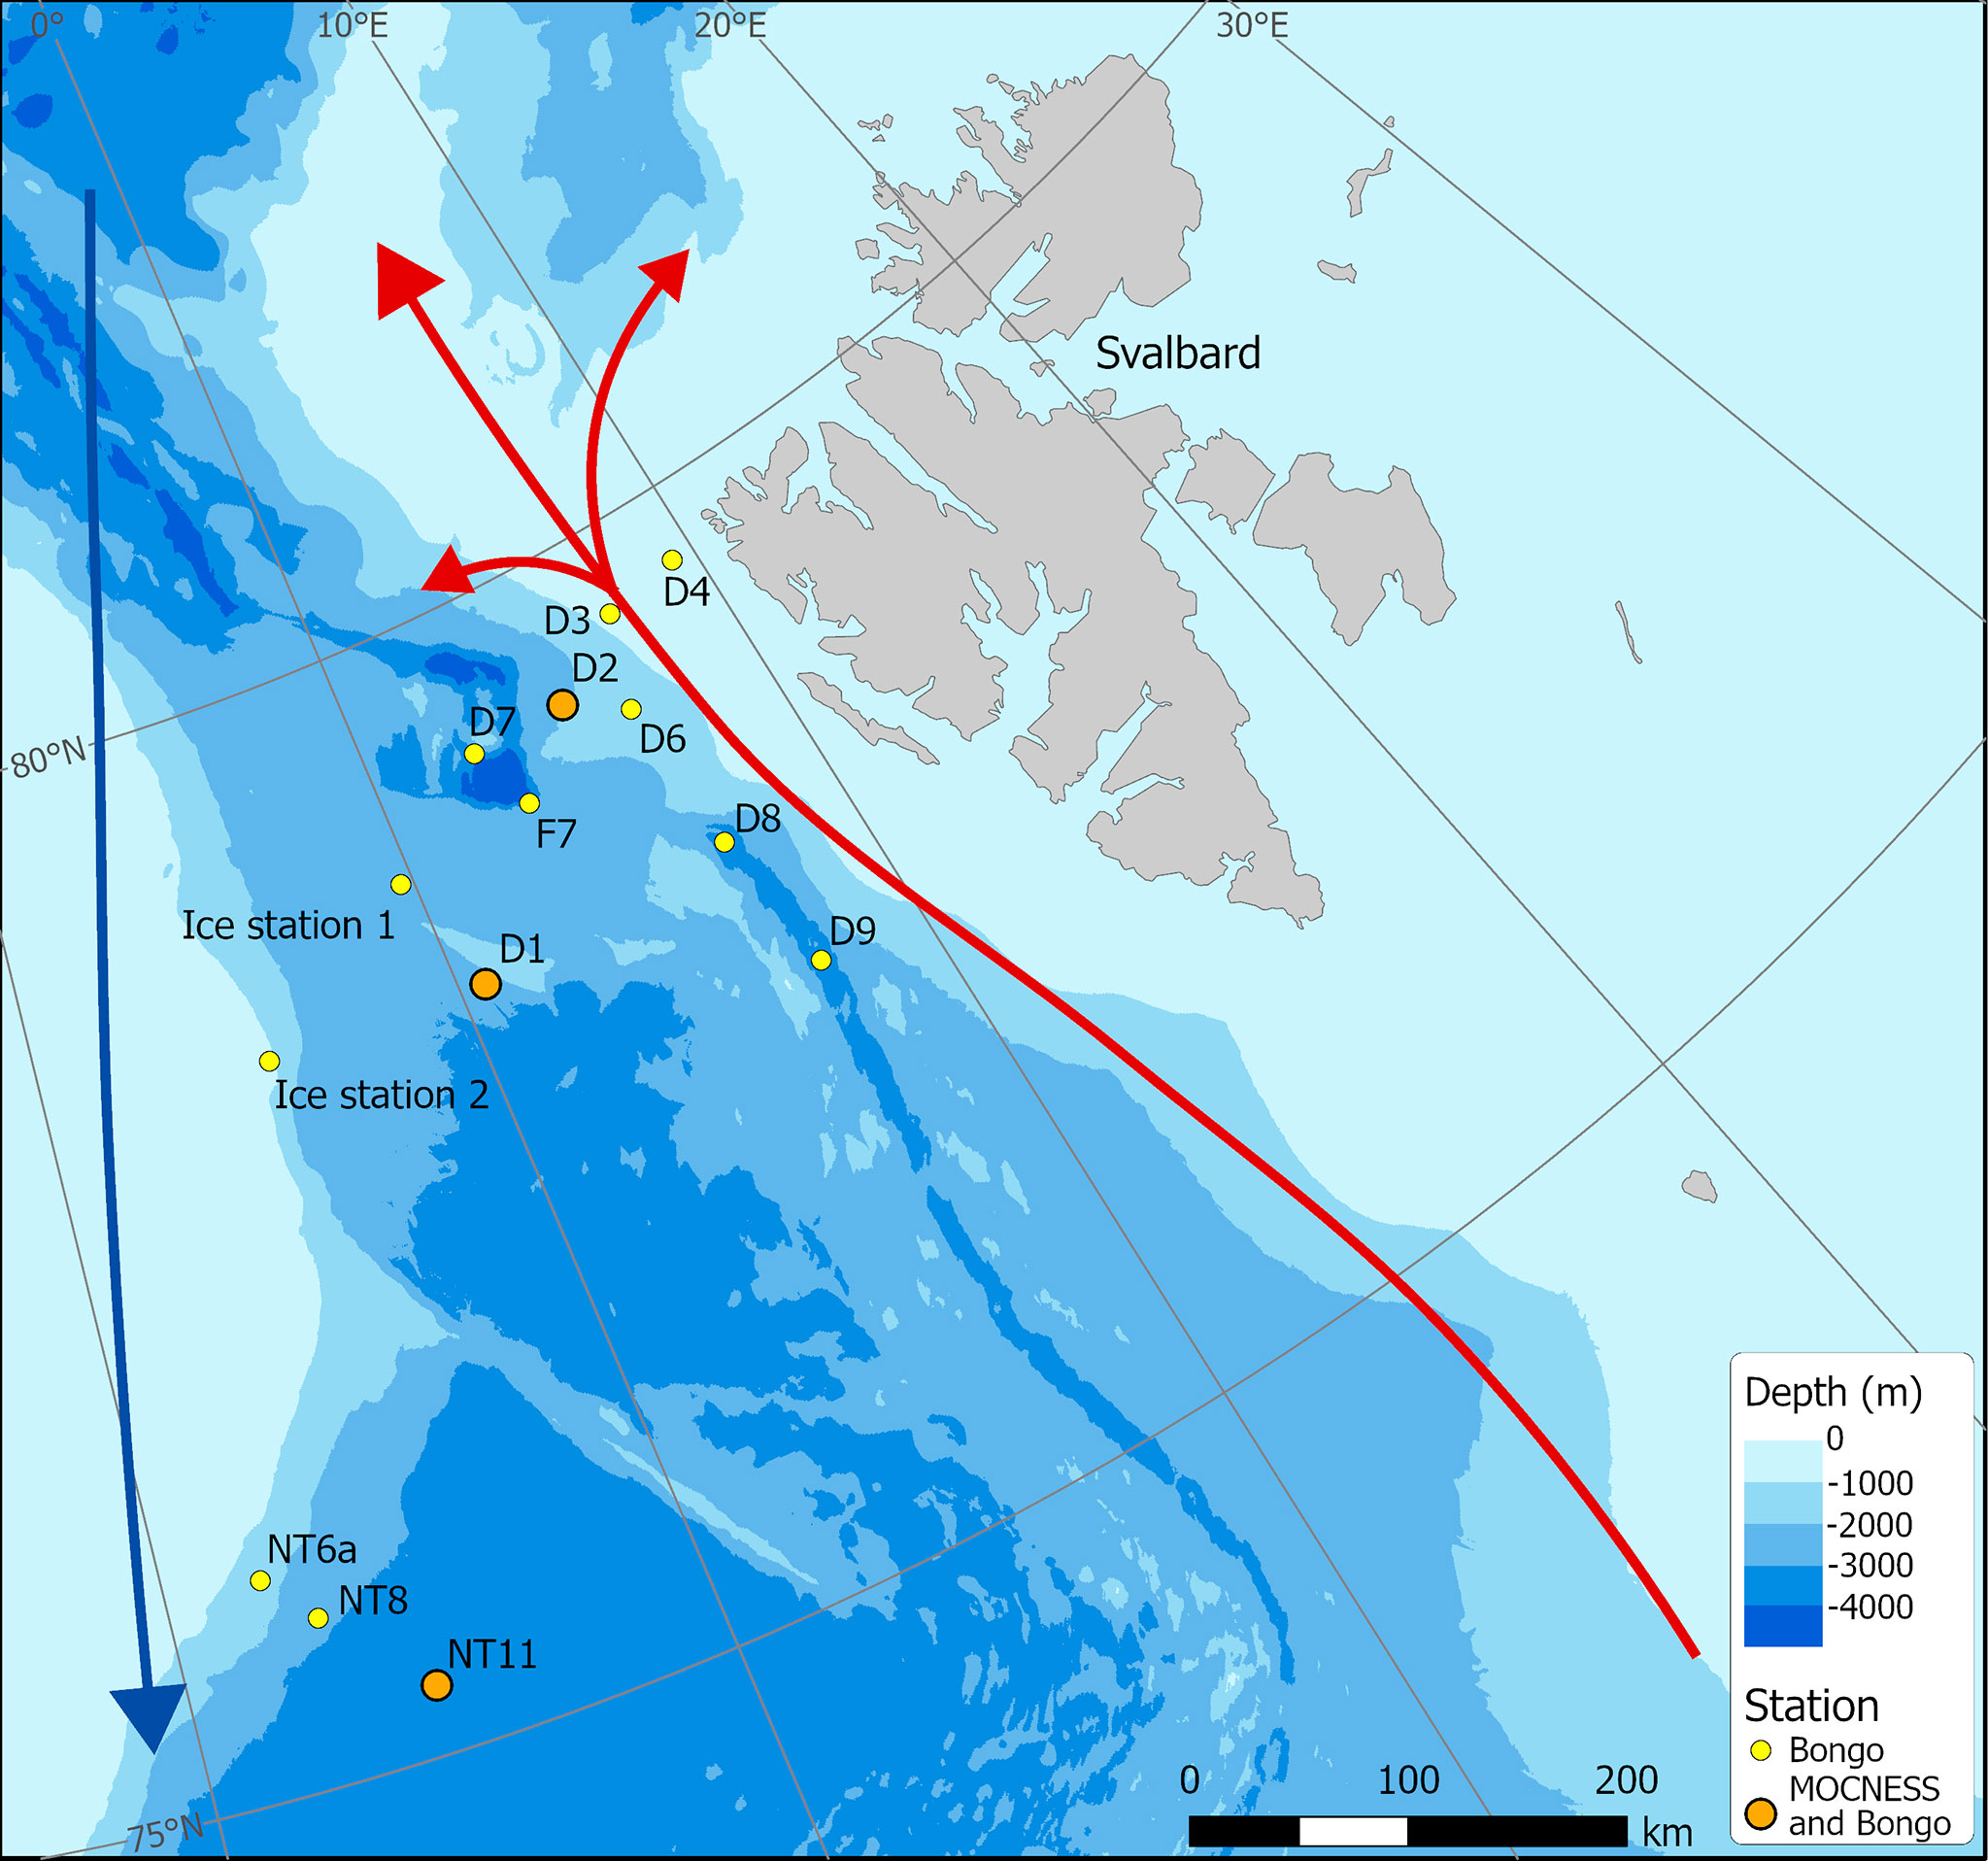
Figure 1 Sampling station locations in Fram Strait carried out during cruise JR18007 (August 2019). (Red – northward flowing Atlantic Water; Blue – southward flowing Polar Surface Water).
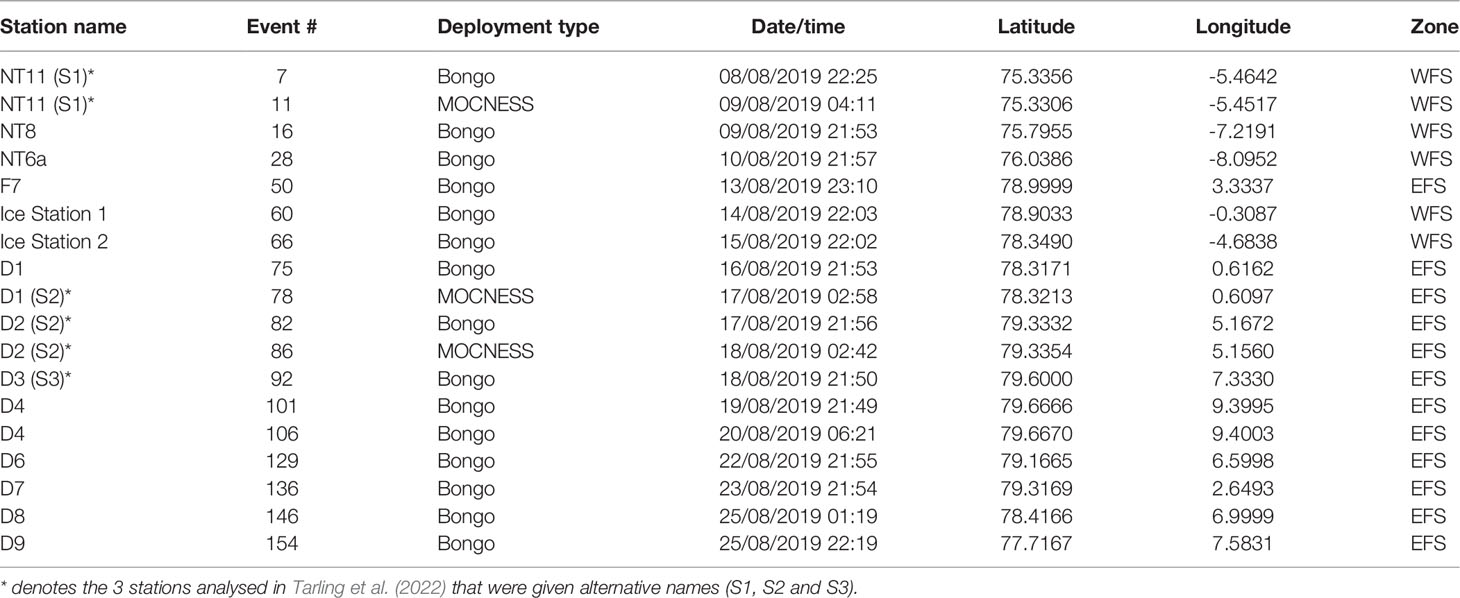
Table 1 Details of net sampling deployments during cruise JR18007 to the Fram Strait by RRS James Clark Ross.
Full water column environmental profiles were also obtained at each of the 14 stations using a calibrated Sea-Bird SBE911plus conductivity–temperature–depth (CTD). These profiles provided information both to predict in situ respiration rates of C. finmarchicus and to determine the location of the principal water masses that prevail within the Fram Strait region.
At 3 of the 14 stations (NT11, D1, and D2), time and conditions were sufficient to deploy a 1-m2 MOCNESS multinet system in order to resolve the vertical distribution of mesozooplankton to mesopelagic depths. The system was fitted with 330-µm mesh nets and was deployed between the surface and a maximum depth of 1,000 m. The tow speed was approximately 2 knots, and the nets incremented on hauling every 125 m, hence dividing the water column into 8 equal depth intervals. On average, each net swept ~800 m3 of water. Two MOCNESS deployments were made at each station as close in time to each other as practicable (usual intervening period of 1 to 2 h). Samples from the first deployment were subsampled immediately to extract specimens for body condition analysis. All samples from the second deployment were directly preserved in borax-buffered 4% formaldehyde without any subsampling and were used to determine taxonomic composition and abundance.
Taxonomic and Body Condition Analysis
Bongo Net Samples
The formalin-preserved samples were subsampled, where necessary, diluted to 1 L using filtered seawater, and pumped through a FlowCam Macro, fitted with a 5-mm flow cell, at a flow rate of 700 ml min−1. A second subsample was analysed if fewer than 2,000 particles were counted. Images were collected using auto-image mode at a rate of 10 frames per second and were classified manually into taxonomic groups using Visual spreadsheet software (Version 4.3.55). The total abundance of taxa within a sample was divided by the filtered volume of the respective net and multiplied by maximum net depth to derive NBongo, the number of individuals m−2 (ind m−2) in the upper 200 m or, if shallower, maximum water depth minus 10 m. For the present study, it was assumed that all C. finmarchicus copepodite stages CIV, CV, and CVI adults fell within the “3 mm to 6 mm (total length) Calanus” FlowCam taxonomic category. This category could also contain the equivalent life stages of C. glacialis and earlier life stages of C. hyperboreus. Hence, the proportions of these three species in each deployment were established through molecular analysis of the paired ethanol preserved sample. Subsamples of the ethanol sample were analysed using a 16S ribosomal RNA gene barcode (16SAR, 16SB2R primers) (Lindeque et al., 1999) following an adapted protocol (Lindeque et al., 2013). Amplified DNA was sequenced using Illumina high-throughput sequencing (HTS) platform. Resultant sequences were processed through the Qiime pipeline and clustered into Operational Taxonomic Units at 97% homology, and taxonomy was assigned using BLASTn (National Center for Biotechnology Information (NCBI)). Sequences were uploaded to the BioProject portal with accession number PRJNA838801 (www.ncbi.nlm.nih.gov/sra/PRJNA838801).
MOCNESS Samples
The objectives of the MOCNESS net analysis were 1) to obtain a detailed perspective of C. finmarchicus stage abundance and distribution through the water column and 2) to carry out body condition analyses on late-stage C. finmarchicus specimens. For item 1, the formaldehyde preserved samples were subsampled to obtain quantifiable fractions and then examined under a light microscope. Calanus species were identified as species for the CIV, CV, and CVI adult stages following size classes established by Hirche (1997). The total abundance of each stage within a sample was divided by the filtered volume of the respective net and multiplied by net depth interval to derive Ni, ind m−2 per depth stratum (i). For item 2, approximately 10 C. finmarchicus CV and 10 CVI females (where possible) were extracted from each depth interval, placed on a calibrated ridged sorting dish, and photographed using an Olympus SZX16 optical microscope fitted with a Canon D6 camera. These images were subsequently analysed by using “ImageJ” software to determine prosome length, lipid sac length, and lipid sac area (mm). After images were collected, each specimen was transferred to an individual tin capsule and frozen at −80°C. Elemental (carbon, hydrogen, and nitrogen) analysis of these specimens was carried out at the home laboratory using a CE440 Elemental Analyser (Exeter Analytical Limited, Coventry, UK). For some analyses, depth strata were combined to reduce the number down to three: surface (0 to 250 m), mid water column (250 to 500 m), and deep (500 to 1,000 m).
As described above, four body condition metrics were measured directly, namely, total body C (M, µg C), prosome length (PL, mm), lipid-sac length (L, mm), and lipid sac area (A, mm2; see Table 2 for a list of all terms). To facilitate the calculation of diapause duration, as well as to compare with other studies of C. finmarchicus body condition, some further metrics were also derived, as follows. Lipid sac volume (V, mm3) was calculated following Eq. 1 (see Table 3 for a list of all equations) as derived by Miller et al. (1998). The mass of wax ester (WE, µg) was calculated using Eq. 2 following Vogedes et al. (2010). Wax ester C, otherwise termed the lipid reserve (w, µg C), was estimated with Eq. 3 provided by Jónasdóttir et al. (2019). From this, Eq. 4 can be used to determine the amount of structural C (m, µg C).
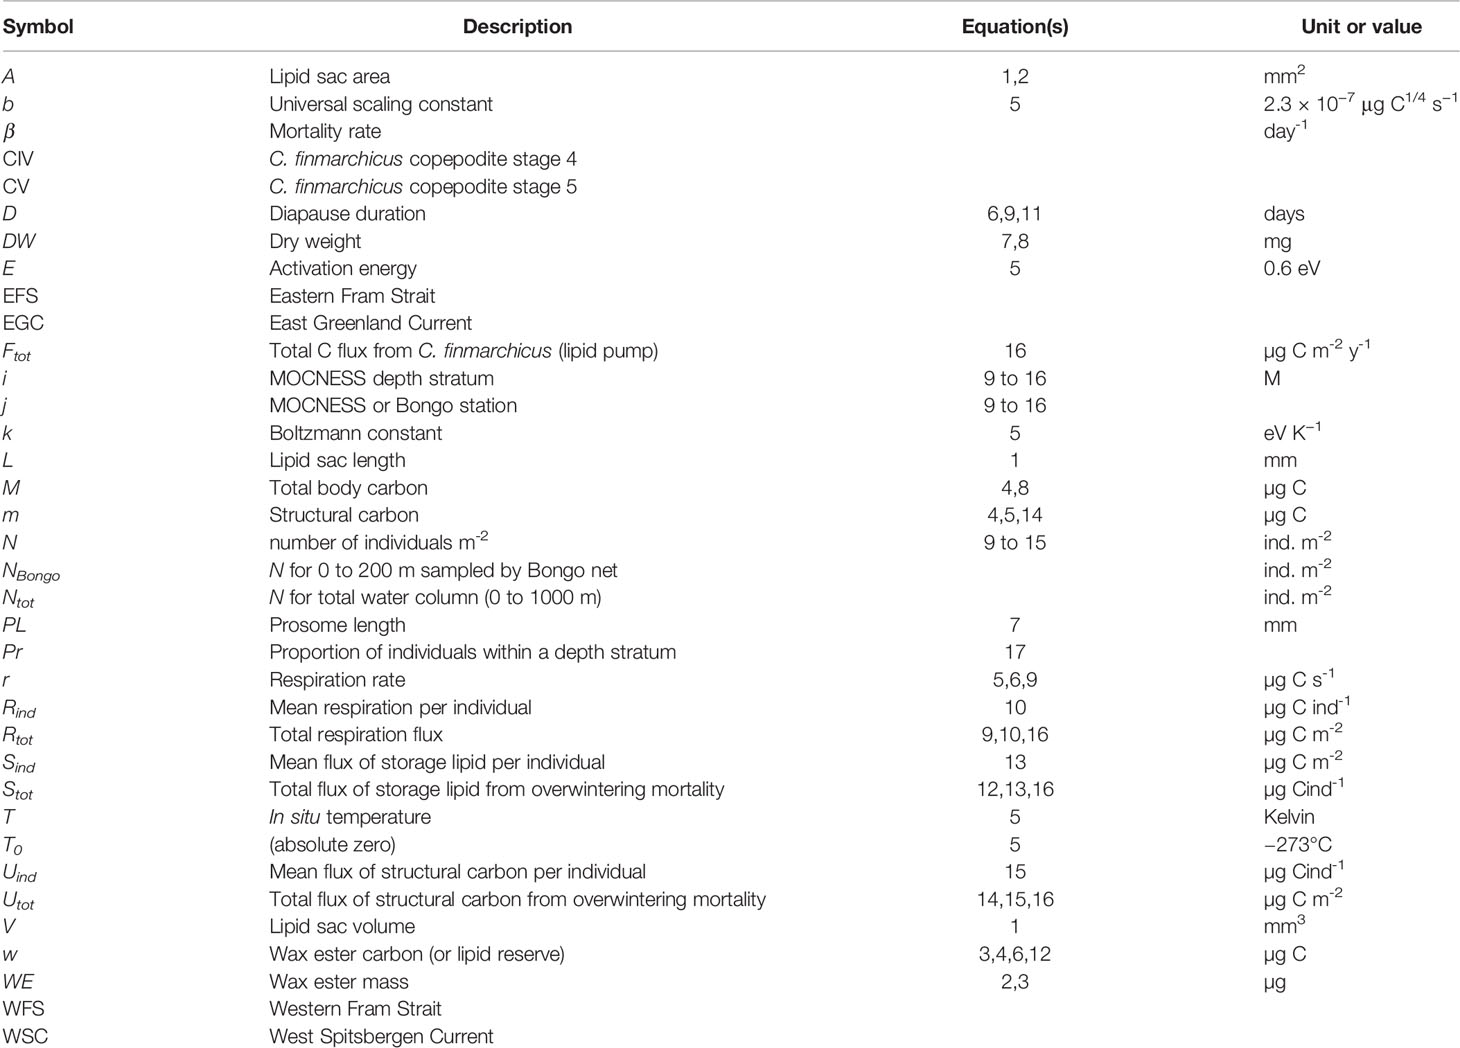
Table 2 Symbols, descriptions, units and constants used in equations and analyses.
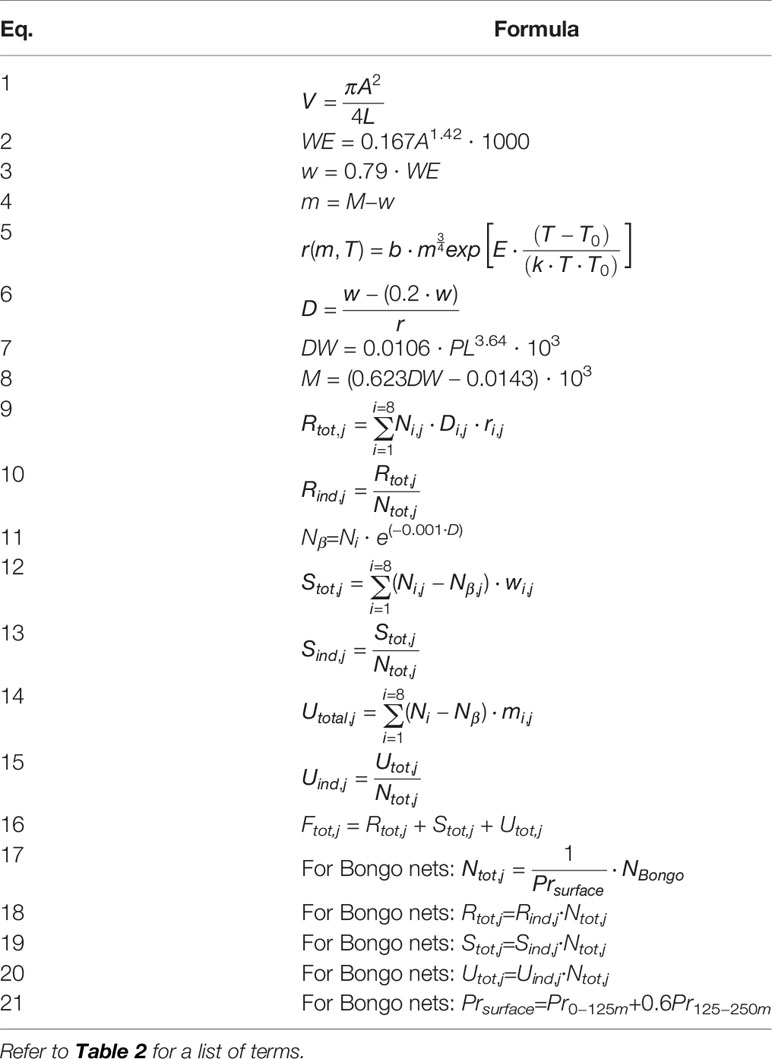
Table 3 Equations used to determine body condition factors, respiration rates, mortality rates and rates of C flux that contribute to the lipid pump.
Life-Cycle Modelling
Determining Respiration and Diapause Duration
To determine the potential amount of C sequestered by the Calanus lipid pump in the Fram Strait, we followed the calculation approach of Kahru et al. (2011). The calculation was carried out for each of the three stations where MOCNESS deployments were performed. First, it was necessary to determine the diapause duration of the specimens extracted from the MOCNESS catches and to analyse for body condition. Diapause duration is defined here as the time it would take to respire the lipid reserve to 20% of its pre-diapause mass, following Saumweber and Durbin (2006). The model is C based and includes estimates of structural mass, m, which we distinguish from the lipid reserve, w (see Eq. 4). It is assumed that only m is responsible for the active metabolism that determines respiration rate. m was calculated by applying Eqs. 2, 3, and 4 to data for total body C (M) and lipid sac area (A).
The respiration rate of a diapausing C. finmarchicus (r) was calculated based on metabolic theory and the isomorphism model (Eq. 5) presented in Visser et al. (2017). r was converted from μg C s−1 to μg C day−1 by multiplying by seconds per day (86,400). Eq. 5 also requires in situ temperature, which was taken from the respective CTD profile, averaging values across the equivalent depth interval (i) in which the specimen was captured.
Diapause duration (D) was derived as a function of w and r, as defined by Eq. 6.
Inferring Body Condition of CIV Stage
Jónasdóttir et al. (2019) included C. finmarchicus CIV stage in their calculations. Although CIV specimens were enumerated in the present study, they were not included in the image capture and elemental analyses to determine body condition. Therefore, we inferred body condition values for CIV using relative indices derived from data provided by Jónasdóttir et al. (2019) (Table 3). According to Jónasdóttir et al. (2019), when averaged across all ocean basin sectors, CIV prosome length (PL, mm) was 82.4% of the CV. This percentage value was applied to the average CV PL value per depth stratum (i) at each location (j). Based on Ingvarsdóttir et al. (1999) for overwintering copepods in the Norwegian Sea, CIV PL was converted to dry weight (DW, mg) using Eq. 7. Total body carbon (M, µg C) for CIV was then determined by applying Eq. 8, also from Ingvarsdóttir et al. (1999). It was further necessary to infer CIV WE C (w, µg C) as being 34.13% of DW, as extracted from Jónasdóttir et al. (2019). m, r, and D were then derived by applying the same equations as detailed above.
Determining Carbon Flux
MOCNESS
For each station (j), the flux of C resulting from the overwintering respiration (Rtot,j, µg C m−2) across all depth strata (i = 1 to 8) was determined by multiplying abundance (N), diapause duration (D), and respiration rate (r) for each depth strata i and then summing across all depth strata, as defined in Eq. 9. We also derived the mean respiration C flux per individual (Rind,j, µg C ind−1, Eq. 10) to facilitate the calculation of C flux in Bongo net samples (see below).
In addition to respiration, a fraction of the overwintering population will contribute to C flux through natural mortality. Like Jónasdóttir et al. (2019), we assigned an overwintering mortality rate (β) of −0.001 day−1 specifically representing non-predatory mortality (Eq. 11). Stot,j (µg C m−2), the amount of C flux from the storage lipid (w) contained within the fraction of the population lost to natural mortality, is then defined by Eq. 12 and the mean storage lipid C flux per individual Sind,j (µg C ind−1) by Eq. 13. Similarly, Utot,j (µg C m−2), the amount of C flux from the structural C (m) within the natural mortality fraction, is defined by Eq. 14 and the mean storage structural C flux per individual Uind,j (µg C ind−1) by Eq 15.
Total C flux per station (Ftot,j, µg C m−2 year−1) was accordingly the sum of Rtot,j, Stot,j and Utot,j (Eq. 16). Ftot,j can otherwise be considered the C. finmarchicus lipid pump per station.
Bongo
Bongo net samples determined depth-integrated abundance to a maximum depth of 200 m (NBongo). To estimate C flux for these deployments, it was first necessary to infer the amount of individuals that were likely to be found below that depth interval. We derived this through reference to corresponding MOCNESS samples by determining the proportion of individuals that occurred in the upper water layers (i.e., equivalent to the Bongo sampling interval; Prsurface). The respective NBongo was multiplied by 1/Prsurface to derive total water column abundance (Ntot,j) for that Bongo net deployment (Eq. 17). Ntot,j was then multiplied by Rind,j, Sind,j, or Uind,j from the corresponding MOCNESS deployment to determine Rtot,j, Stot,j, and Utot,j, respectively (Eqs. 18 to 20), which were summed (Eq. 16) to determine Ftot,j.
To establish which MOCNESS deployments corresponded to which Bongo deployments, we referred to analyses performed on the environmental profiles (see Results), which distinguished two oceanographic zones within the sampling area, which we termed Western Fram Strait (WFS) and Eastern Fram Strait (EFS). WFS contained the MOCNESS Station NT11, while EFS contained MOCNESS Stations D1 and D2. Accordingly, all Bongo deployments in WFS corresponded to the MOCNESS at NT11, while all Bongo deployments in EFS corresponded to D1 and D2. D1 and D2 were averaged to give single mean values of Rind,j, Sind,j, or Uind,j for EFS.
The MOCNESS was sampled in intervals of 125 m, while the Bongo net was sampled between 0 and 200 m. To derive Prsurface, the overlapping MOCNESS strata (Pri,j for 0–125 m and 125–250 m strata) were treated as in Eq. 21, where abundance in the deeper of the two strata was multiplied by a factor of 0.6 to be equivalent to the maximum Bongo depth of 200 m.
Statistical Tests
Comparisons between life stages, sample depths, and locations were carried out using a combination of t-tests and 1-way ANOVA tests, first performing tests for normality (Shapiro–Wilk) and equal variance (Brown–Forsythe). The non-parametric Mann–Whitney rank-sum test and Kruskal–Wallis 1-way ANOVA on rank test were applied when either of these prior tests failed. Where significant differences were found, either a Holk–Sidak (parametric) or Dunn’s method (non-parametric) post-hoc test was performed to identify which categories were significantly different from each other at p < 0.05 level. All tests were performed in Sigmaplot v14.
Results
Water Masses and Biogeographic Zones
We designated water masses based on the vertical water mass descriptions of Rudels et al. (2005) but made no distinction between the numerous deep water types that can be classified. Overall, there were two major water types within the study region. In the first water type, present at Stations NT11, NT8, NT6a, Ice Station 1, and Ice Station 2 (Figure 2), there was a low salinity surface layer (which is fresher closer to the shelf) of Polar Surface Water (PSW) with Arctic Intermediate Water and Arctic Deep Water (ADW) masses below. These features reflect a dominant influence of the cold EGC flowing southwards from the Arctic in the upper 100 m (Figure 1). The variation between stations in this water type was most likely through the presence of some recirculated AW approximately 200 m close to the shelf slope at Ice Station 2, the presence of shallow, short-lived warming of the PSW, and the influence of sea ice-melt on the shallow layers at Ice Station 1 and Ice Station 2. The second water type, containing Stations F7, D1, D2, D3, D4, D6, D7, D8, and D9, showed evidence of the influence of AW inflow below the surface layers, as characterised by salinities > 34.8. This reflects the dominant influence of the warm WSC flowing northwards from the Atlantic (Figure 1). As with the first water type, there was some variation between stations due to local surface warming and/or proximity to the ice edge. For the purposes of the present analysis, we designated sample locations to biogeographic zones, with those located in the first water type as being within the WFS zone and those in the second water type, within the EFS zone (Table 1).
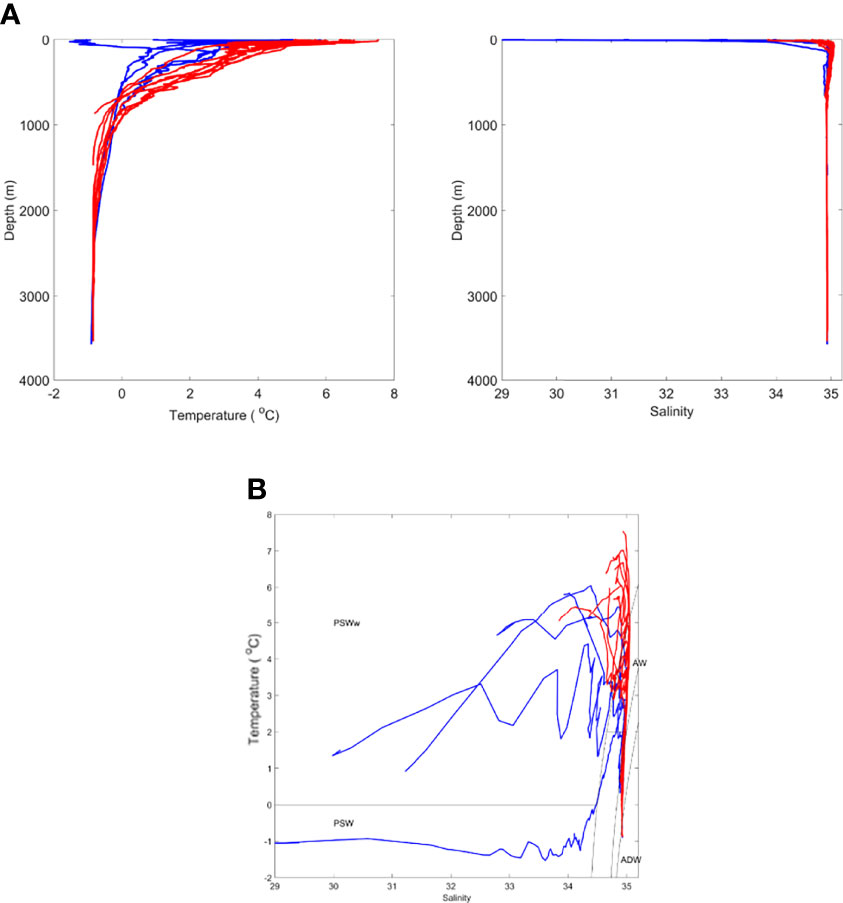
Figure 2 Oceanographic conditions during time of sampling showing (A) temperature and salinity profiles and (B) TS plot [divided into two oceanographic zones. denoting Western Fram Strait (WFS; blue) and Eastern Fram Strait (EFS; red)]. PSWw - Polar Surface Water (warm) due to solar heating. See text for all other terms.
Spatial Distribution
FlowCam Macro analysis quantified the number of Calanus individuals (3–6 mm) within all Bongo net samples. This was cross-checked with Calanus specific 16S ribosomal RNA gene barcoding to determine the proportion of late-stage C. finmarchicus versus other possible Calanus species in this category (principally C. hyperboreus CIII and late-stage C. glacialis). C. finmarchicus was the exclusive Calanus species at almost all locations with the exception of Ice Station 2, D4, and D8, where it comprised 96%, 97%, and 98%, respectively, of all individuals (Figure 3). We therefore assumed that FlowCam abundances provided reliable estimates of population sizes of late-stage C. finmarchicus in the surface layers of all sampled locations.
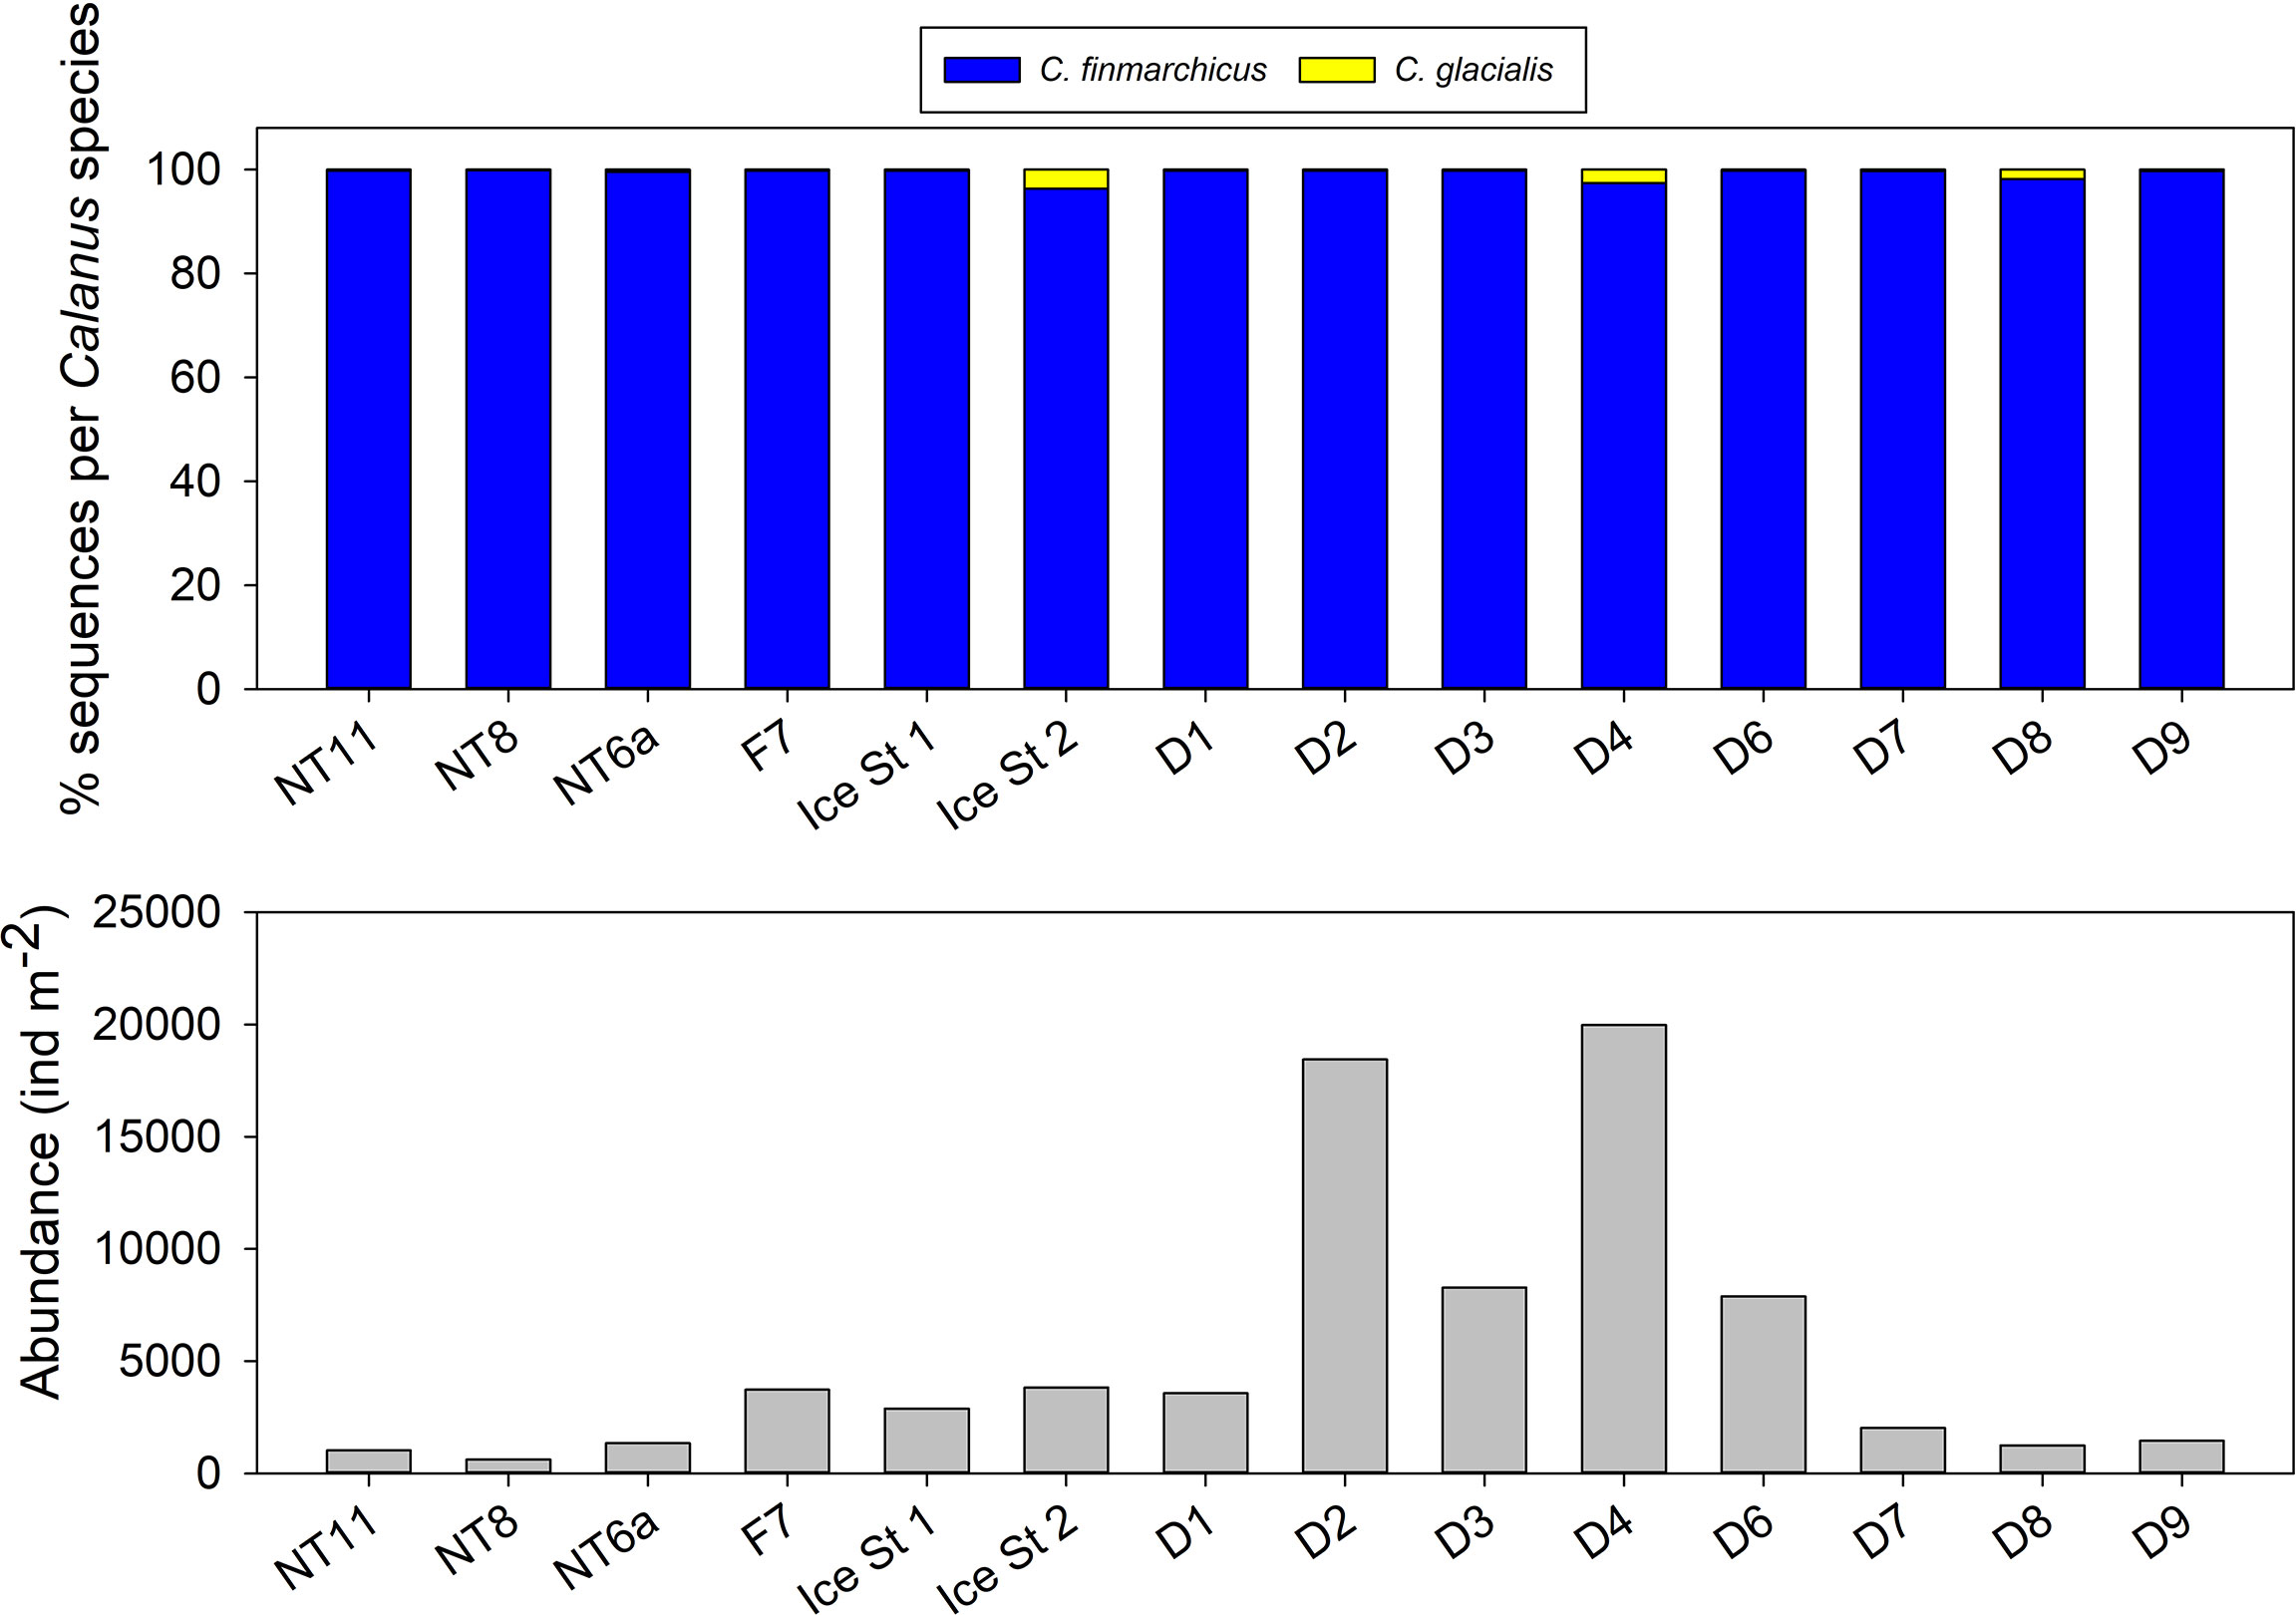
Figure 3 Top: relative percentage of 16S sequences attributed to Calanus finmarchicus and Calanus glacialis in Bongo net samples. Bottom: abundance of Calanus between 3,000 and 6,000 µm prosome length in Bongo net samples as determined from Flowcam CMacro analysis.
Median abundance was almost double in the EFS versus the WFS (respectively 3,731 vs 1,348 ind m−2, 0–200 m; Figure 3), although there was a high level of variability between locations, which resulted in the difference not being statistically significant (Mann–Whitney rank-sum test, n(large) = 9, n(small) = 5, p = 0.083). The highest abundances were observed at EFS Stations D2 and D4, both with values in excess of 18,000 ind m−2 (0–200 m). The maximum abundance observed in the WFS was at Ice Station 1 with 3,825 ind m−2 (0–200 m).
Depth Distribution
Depth-discrete MOCNESS samples were analysed from three locations, one in the WFS and two in the EFS (Figure 4). Abundances of C. finmarchicus were greatest in the top 250 m across all three locations, with the percentage of the population in this upper layer being the highest at Station NT11 (86%) and the lowest at Station D2 (58%; Table 4). CIV was the dominant developmental stage in this upper layer at Stations NT11 and D2, while CV dominated at Station D1. However, CV became the dominant stage below 250 m in all stations. Adult females were present at all three locations but only found below 250 m at abundances sufficient to count at Stations D1 and D2. Abundances were almost an order of magnitude higher at Station D2 (44,760 ind m−2, 0–1,000 m) compared to Station NT11 (6,711 ind m−2, 0–1,000 m), with Station D1 being midway between the two (19,886 ind m−2, 0–1,000 m). Station D2 was also notable in having almost a quarter of the population below 500 m as compared to 1% and 2% in Stations NT11 and D1, respectively.
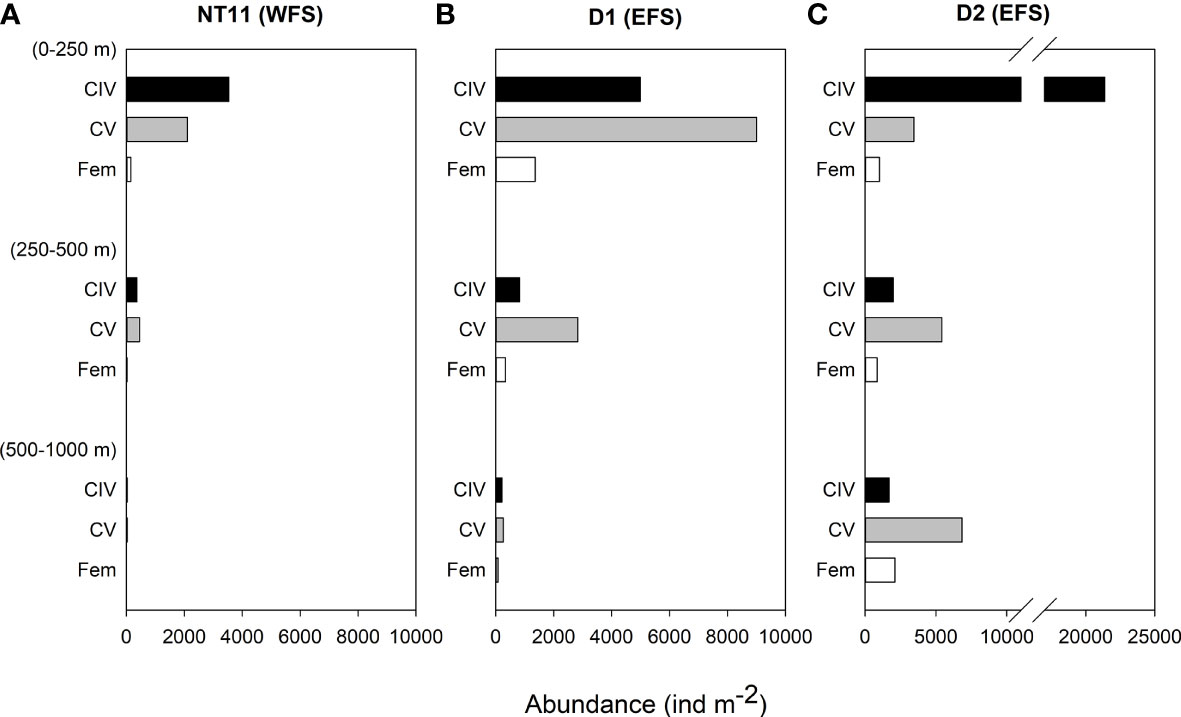
Figure 4 Calanus finmarchicus: depth distribution of CIV, CV, and females in depth-stratified MOCNESS samples at (A) station NT11, (B) station D1, and (C) station D2. See Table 1 for station location details.
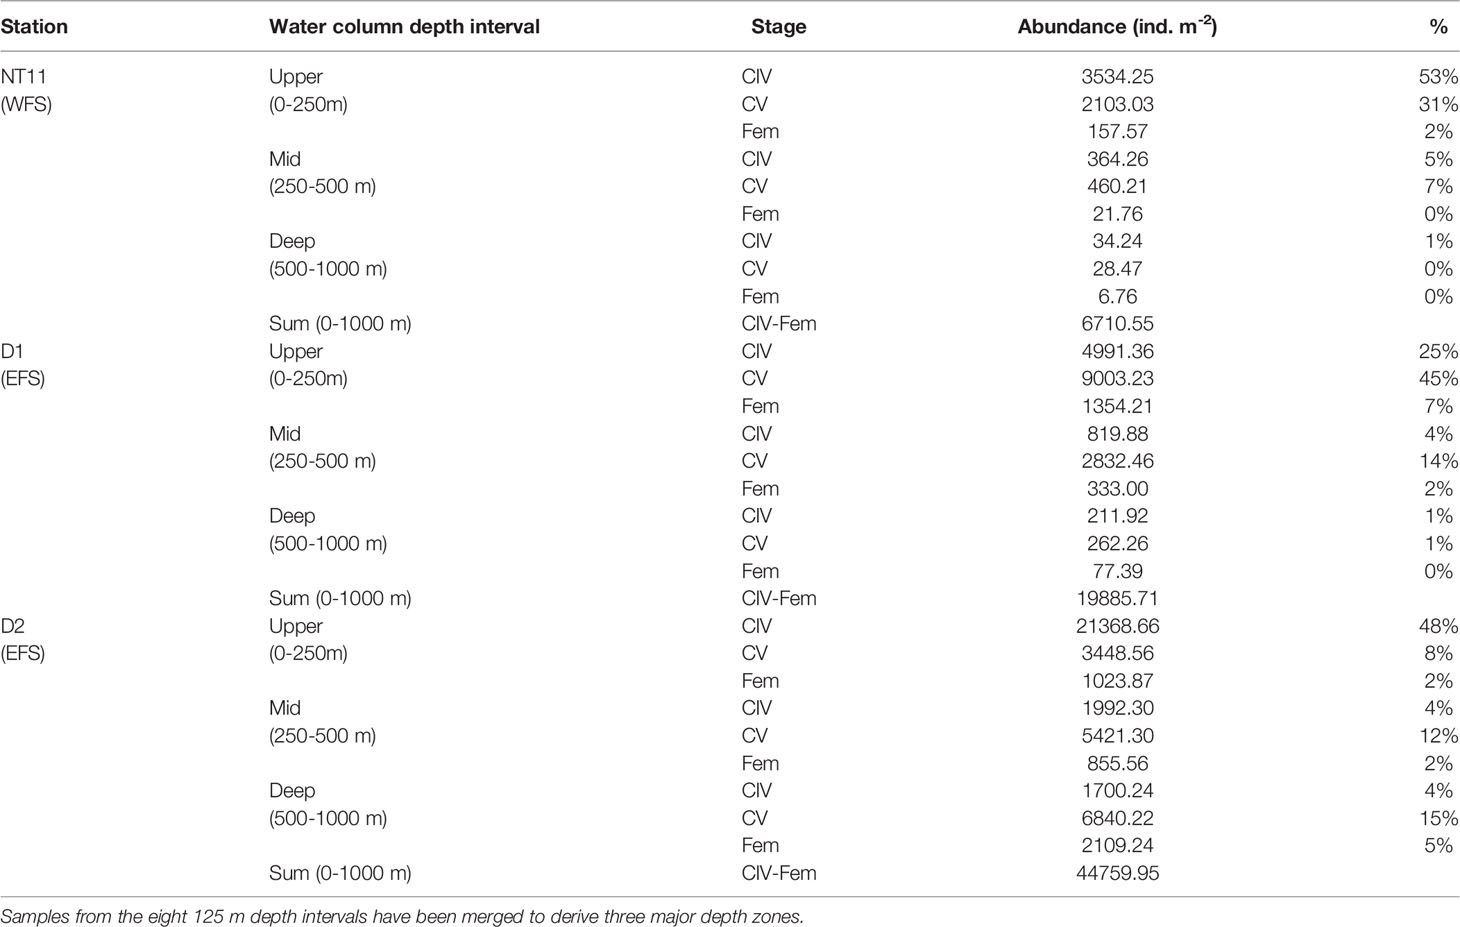
Table 4 Calanus finmarchicus: Abundance and percentage contribution of late development stages in MOCNESS deployments at three locations in the Fram Strait.
Body Condition
Mean prosome length was the highest in CVs in the surface waters of Station D2 at 2.91 mm (SD 0.29), while the smallest mean prosome lengths were found in deep CVs of Station D1 at 2.49 mm (SD 0.18) (Table 5). The amount of C per individual spanned a range of between 100 and 600 µg C (Table 5; Figure 5). Across all three locations, the average CV was 317.98 µg C (SD 103.14), and the average female was 270.05 µg C (SD 68.97). The C content of CVs was significantly higher in Stations D1 and D2 compared to NT11 (Kruskal–Wallis 1-way ANOVA on ranks, H = 6.06, 2 df, p = 0.048), with a difference in medians of approximately 30 µg C. Female values did not differ significantly between stations (1-way ANOVA, F = 1.187, 114 df, p = 0.309). Between depths, CV total body C was significantly higher in the surface depth interval compared to the deep depth interval (1-way ANOVA, F = 3.737, 207 df, p = 0.025), with a median difference of approximately 50 µg C. The mid depth interval had C values midway between the other two. There were no significant differences between depth intervals in females.
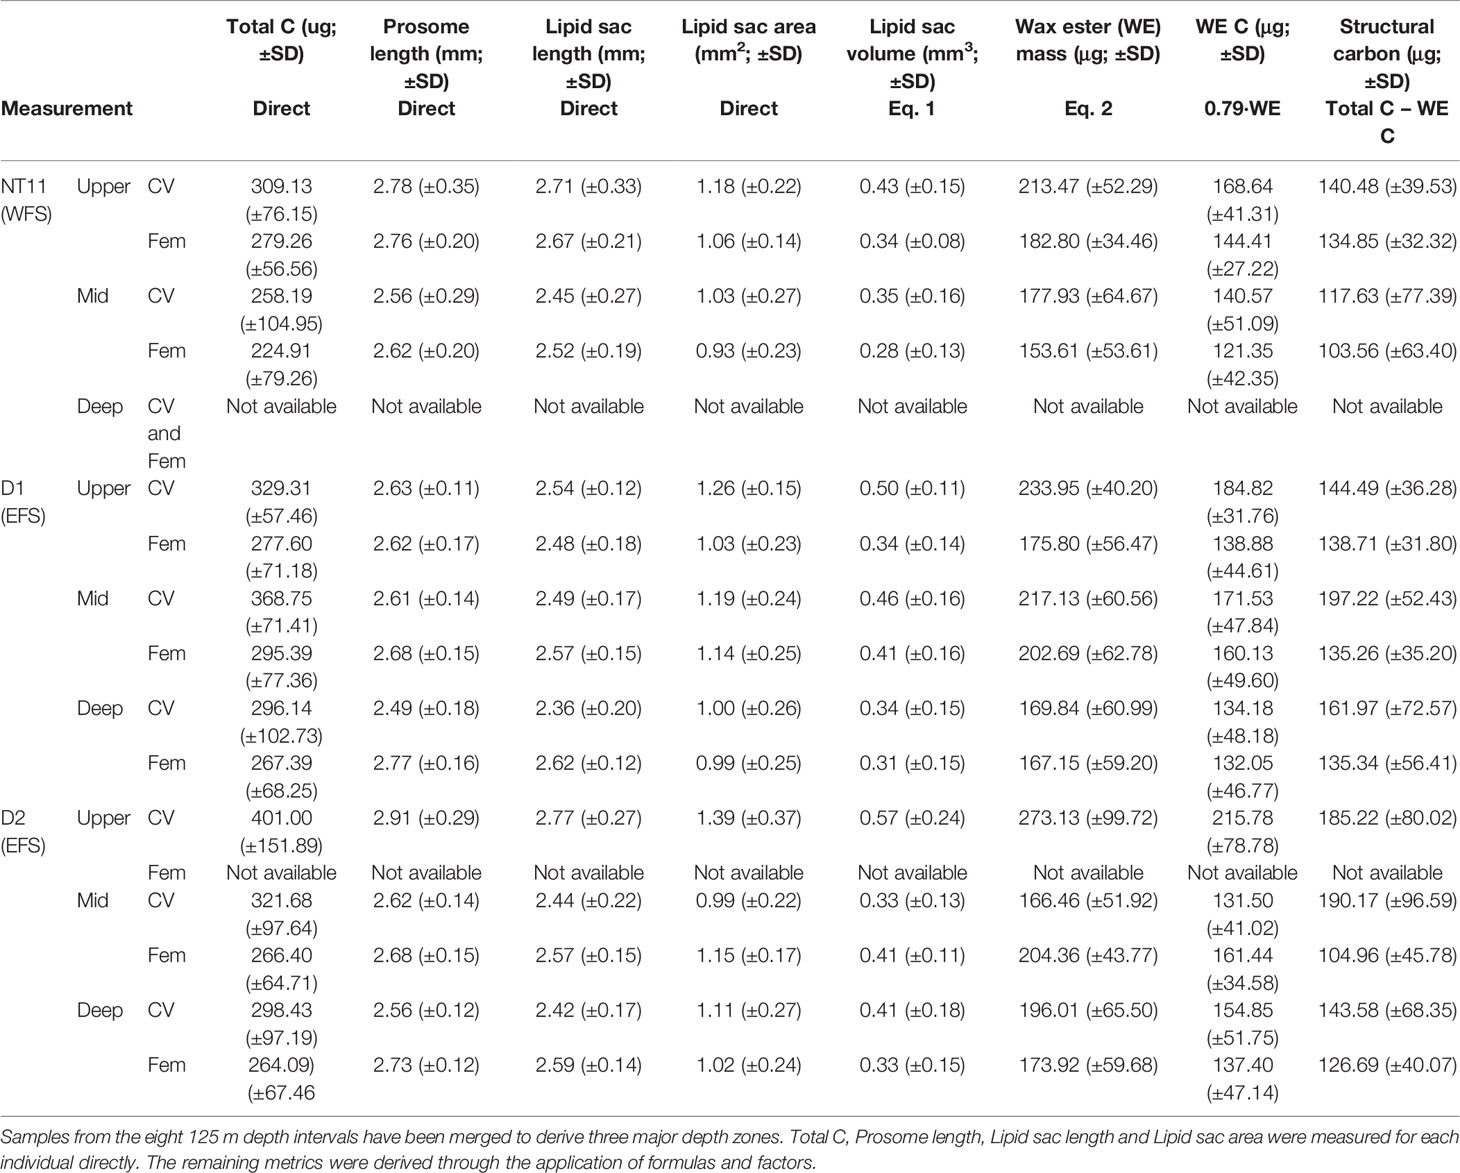
Table 5 Calanus finmarchicus: Body conditions metrics for CV and females captured at three locations in the Fram Strait.
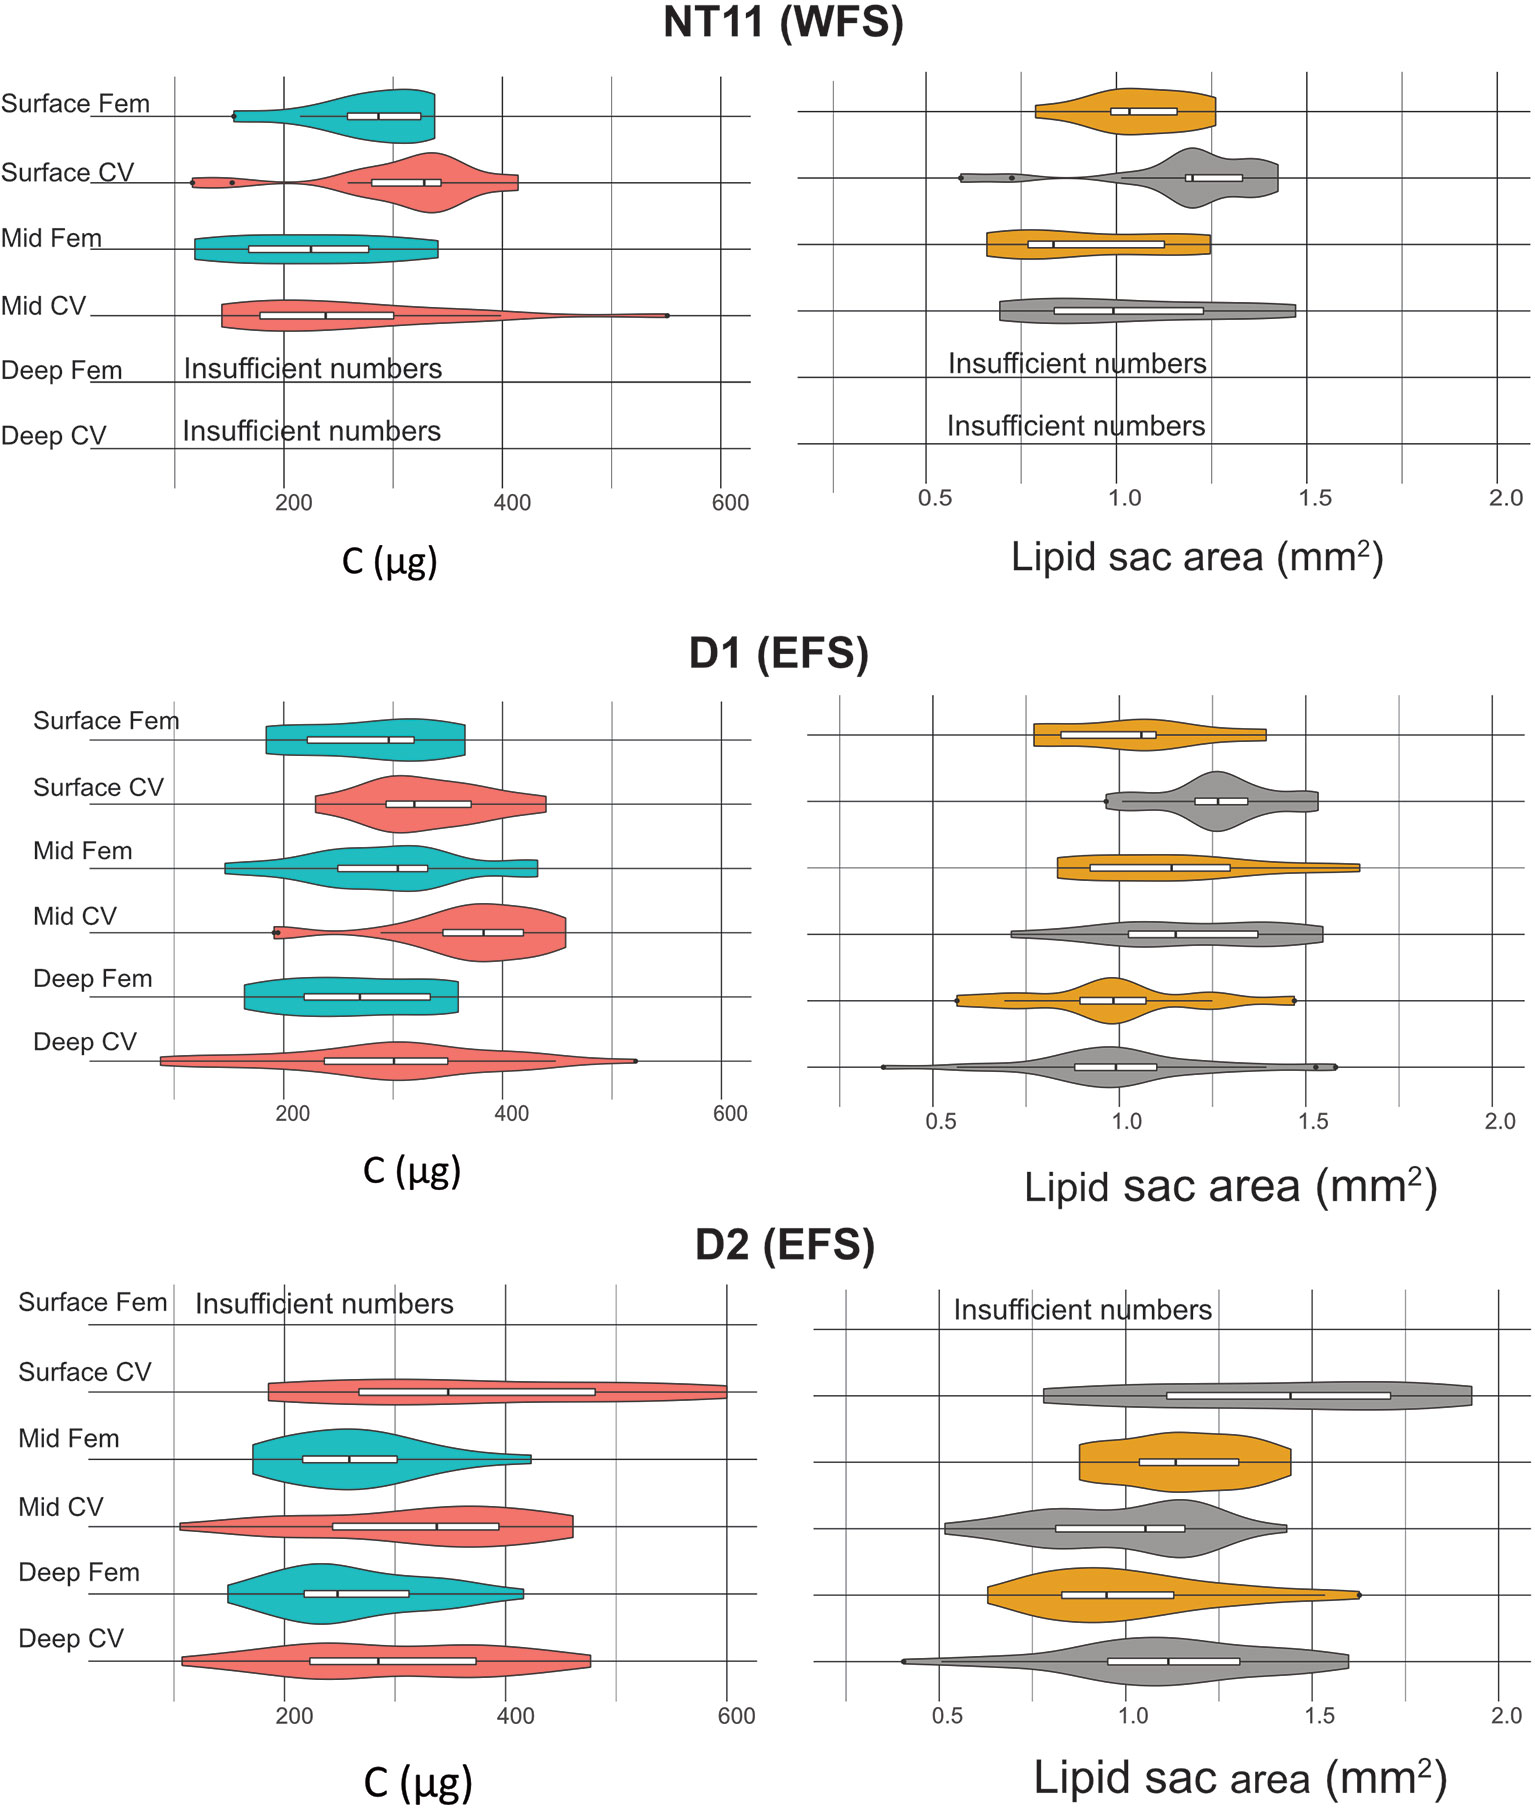
Figure 5 Calanus finmarchicus: distribution of carbon total weight (µg, left) and lipid sac area (mm2, right) in CV and females in the upper, mid, and deep depth strata at stations NT11, D1 and D2.
In terms of lipid sac area, CVs had a significantly larger lipid sac than females (Welch’s t-test, t = 2.235, 276.8 df, p = 0.0262), although the difference amounted to only approximately 6% (Figure 5). There was no significant difference in lipid sac area between stations in either CVs or females. Across all stations, CVs found on the surface had a significantly higher lipid sac area than those found in the mid or deep depth intervals (1-way ANOVA, F = 13.548, 207 df, p < 0.001), with the difference being approximately 20%. There was no such depth-related difference in females.
With regard to body condition metrics estimated through conversion factors, CVs on the surface at Station D2 had the highest lipid sac volume, at 0.57 mm3 (SD 0.24), and wax ester C, at 215 µg (SD 79). The lowest mean values were observed in females on the surface at Station NT11, with 0.28 mm3 (SD 0.13) of lipid sac volume and 121 µg (SD 42) of wax ester C. The lowest mean amount of structural C was observed in mid water column females at Station NT11 (104 µg, SD 63), while the highest values were seen in mid water column CVs at Station D1 (197 µg, SD 52).
Carbon Flux
Depth-Integrated Assessment
An estimate of C flux resulting from the life-cycle behaviour of C. finmarchicus was derived for the three MOCNESS locations where a depth-discrete perspective to 1,000 m was obtained (Table 6). Based on the model of Visser et al. (2017), we estimated the rate of individual respiration to vary between 0.73 µg C ind−1 day−1 (SD 0.17) at Station NT11 and 1.01 µg C ind−1 day−1 (SD 0.28) at Station D2. The predicted length of diapause was the longest at Station NT11, at 126 days (SD 43) and the shortest at Station D2 at 103 days (SD 43). Despite the longer diapause, the lower respiration rate at NT11 resulted in those individuals contributing the lowest amount to respiration flux across the three locations, at 72.75 µg C ind−1 year−1 as compared to a high of 111.36 µg C ind−1 year−1 at Station D1. Stations D1 and D2 also contributed the highest storage lipid and structural C flux, which reflects the fact that mean lipid sac area and total C were the highest in the EFS.
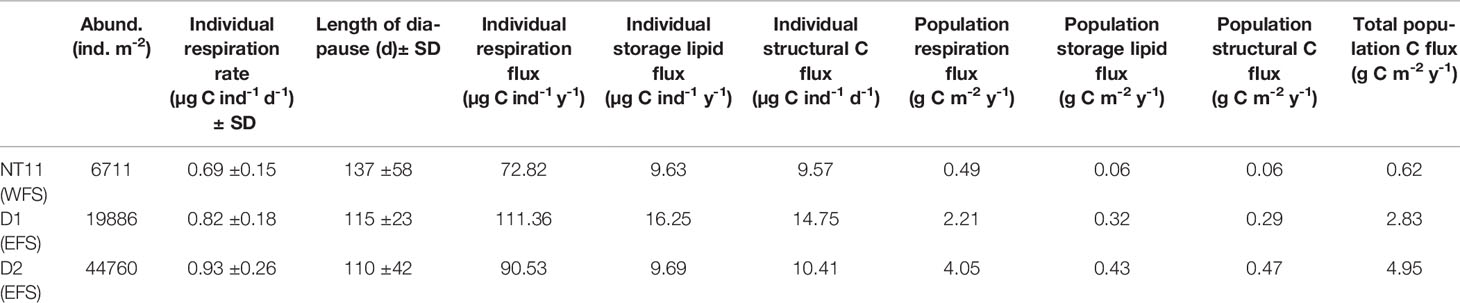
Table 6 Calanus finmarchicus: Life-cycle parameters influencing C flux by individuals and the population at each of the three station locations where MOCNESS deployments were made.
The difference in flux between the EFS and WFS is further amplified at the population level given that the former had higher abundances than the latter. The highest population flux rates were found at Station D2, where respiration flux was 4.05 g C m−2 year−1, storage lipid flux was 0.43 g C m−2 year−1, and structural C flux was 0.47 g C m−2 year−1. By comparison, values at Station NT11 were almost an order of magnitude lower at 0.49, 0.06, and 0.06 g C m−2 year−1, respectively.
Spatial Extrapolation
The spatial distribution of these fluxes was inferred by multiplying individual fluxes from the above analysis by the abundance levels determined from Bongo net samples (Eqs. 18 to 20) factoring in the likely size of the population between 200 and 1,000 m (Eqs. 17 and 21). Individual fluxes from Station NT11 were used for all locations in the WFS, while an average of individual fluxes from Stations D1 and D2 was used for all locations in the EFS. Spatial variation in C flux is visualised in Figure 6, which shows the large difference in the magnitude of the flux between the WFS and EFS. The maximum flux in the WFS was 0.61 g C m−2 year−1 at Station NT11, with the average across the WFS being 0.31 g C m−2 year−1 (SD 0.22). In the EFS, the maximum flux was 5.92 g C m−2 year−1 at Station D4, with both sampling efforts at Station D2 also generating flux estimates greater than 3 g C m−2 year−1. Nevertheless, there were also regions in the EFS where flux was below 0.5 g C m−2 year−1, such as at Stations D7, D8, and D9. Hence, the average across the EFS, of 2.04 g C m−2 year−1 (SD 1.90), was much lower than the maximum. Furthermore, the influence of patchiness on flux estimates is illustrated well by the contrast between the two sampling efforts at Station D4 where the second sampling effort generated a flux estimate that was less than half of the first.
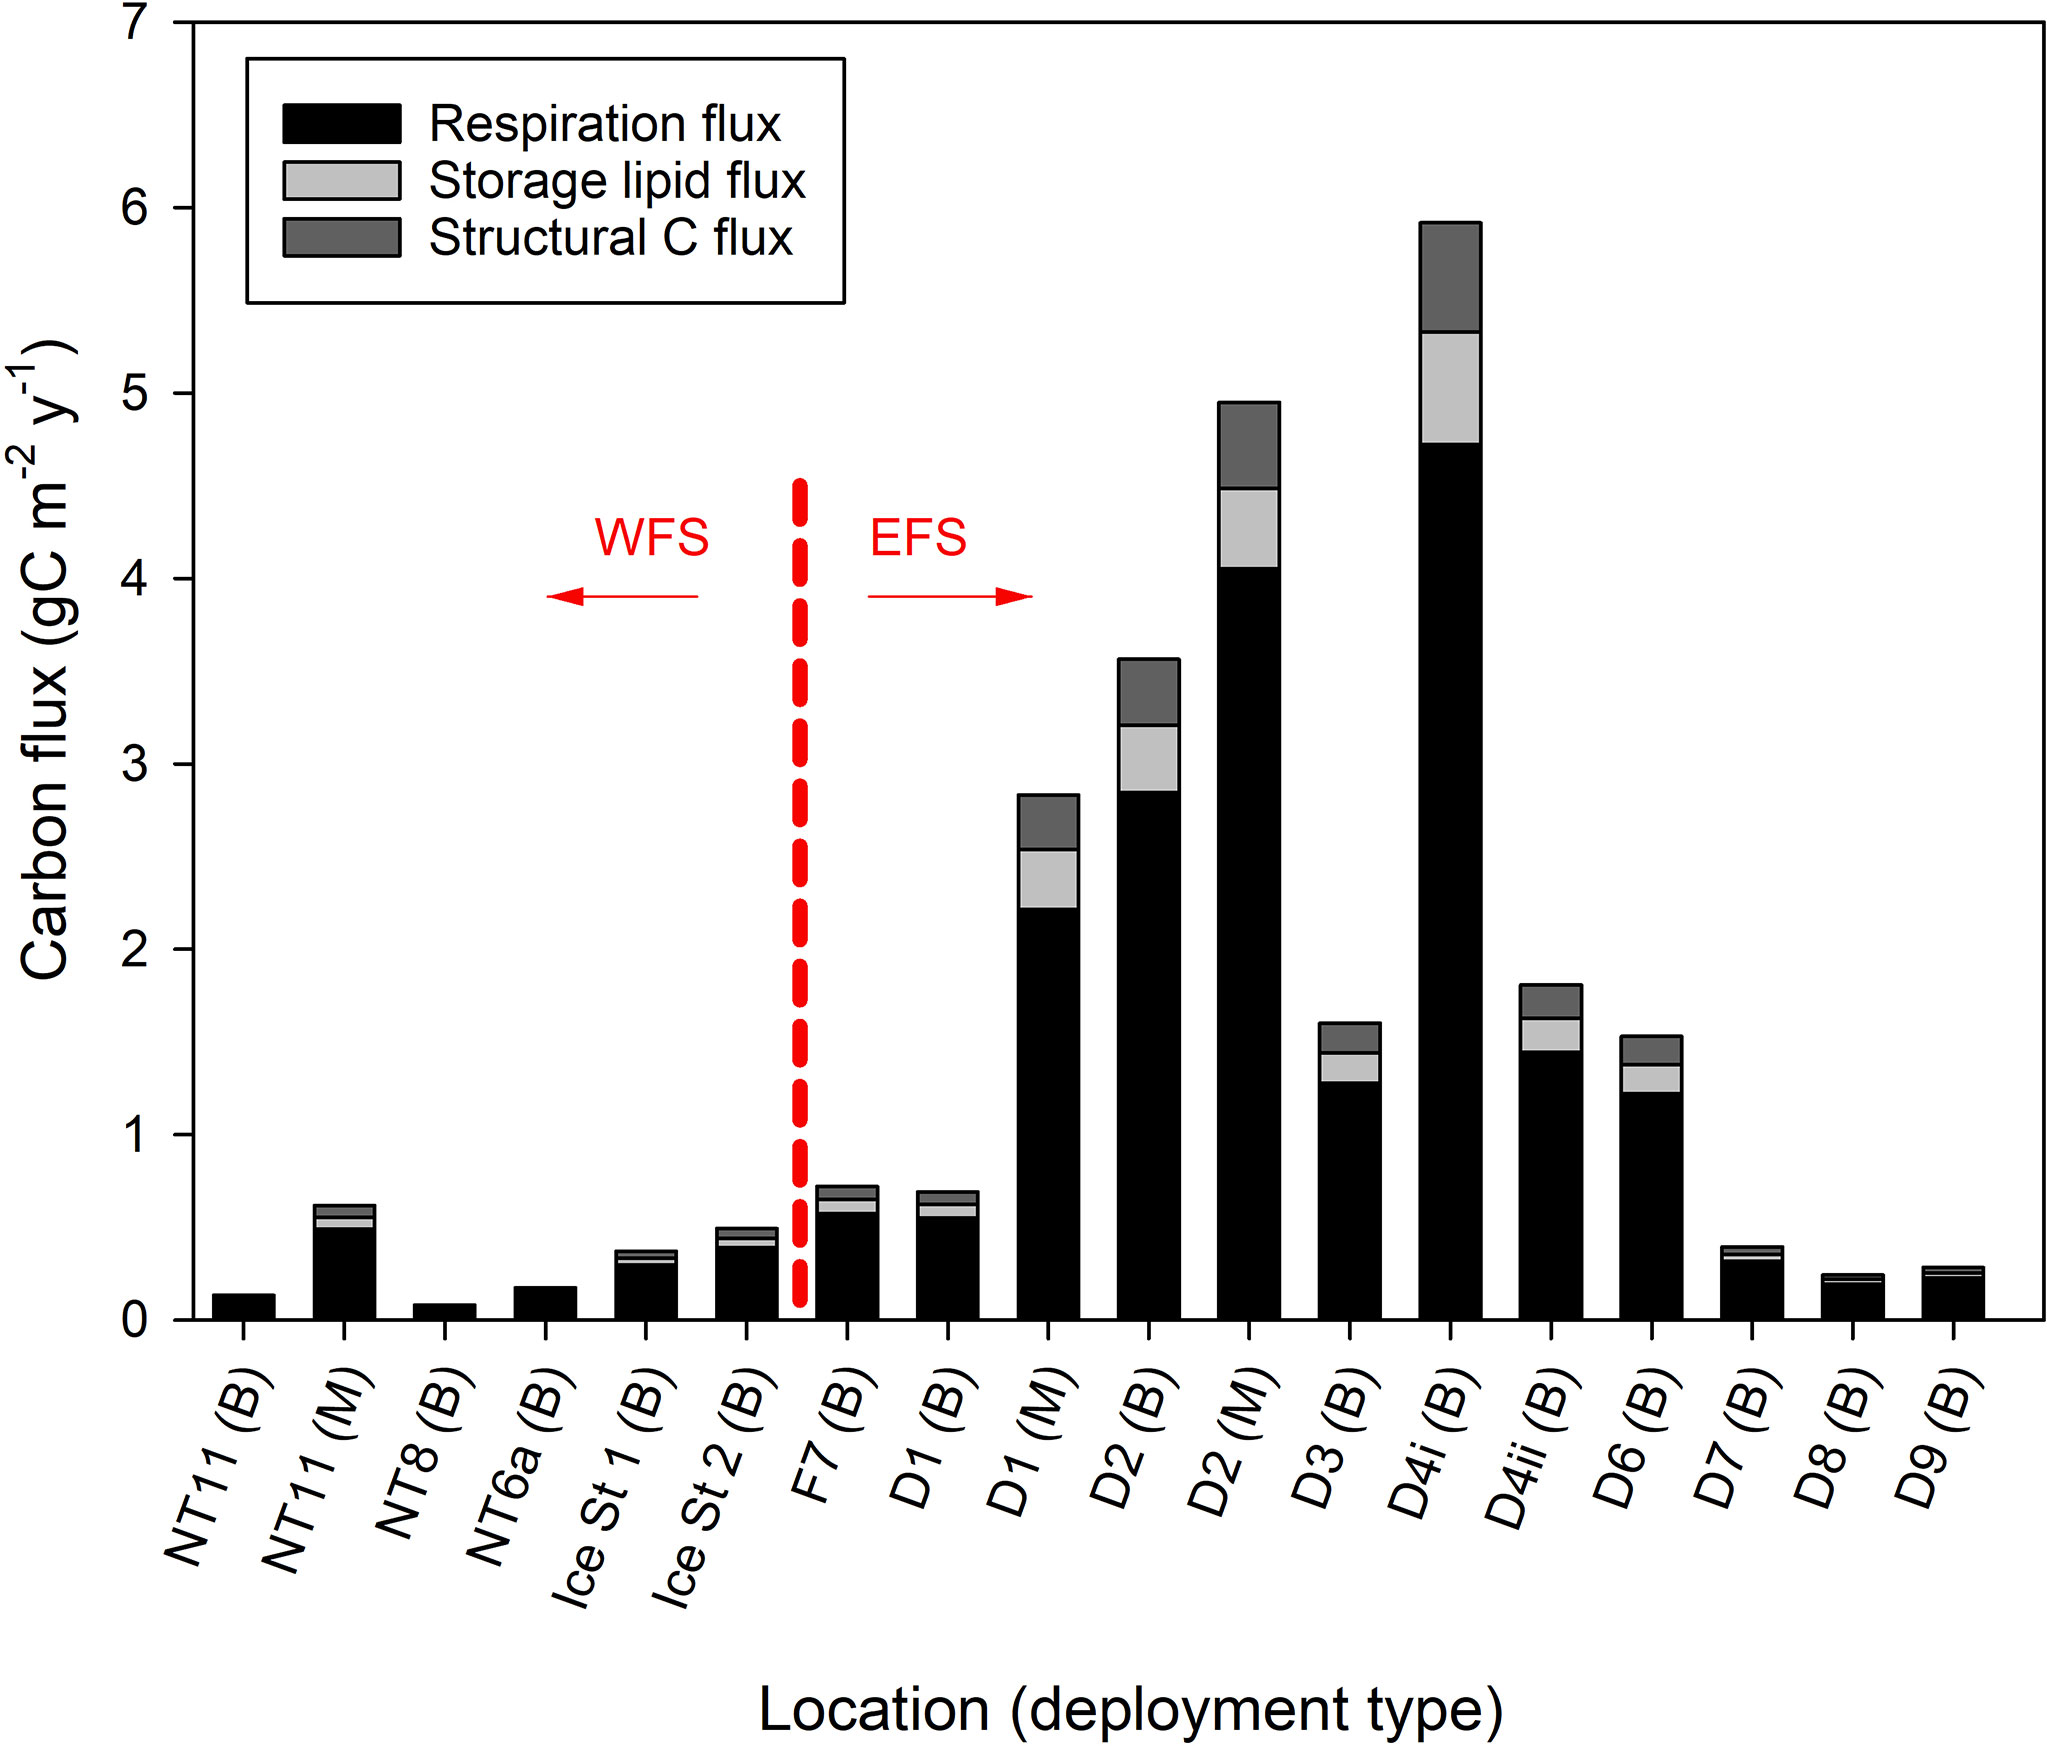
Figure 6 Calanus finmarchicus: carbon flux (gC m−2 year−1) as a result of respiration during diapause and mortality (divided into storage lipid and structural carbon) at locations sampled in the Fram Strait either by MOCNESS (M) or Bongo (B). Station locations are arranged according to whether they occur in the West Fram Strait (WFS) and East Fram Strait (EFS) zones.
Discussion
Field sampling of the Fram Strait found C. finmarchicus abundance to be spatially variable, with high values occurring mainly in the eastern region (EFS). Individual copepods were generally large in size but not necessarily high in levels of lipid reserve. Nevertheless, for many, these reserves were sufficient to survive the overwintering period and reproduce the following spring (Tarling et al., 2022). Although many individuals had already descended to depth by the time of sampling in late summer and early autumn, a substantial fraction of the population was still in the surface layers, with individuals often containing larger lipid reserves than those in the deeper layers. Altogether, we calculated that the rate of C flux generated by this entire population, assuming all enter diapause, was equivalent to that in many boreal areas considered to be distributional epicentres of this species. Below, we consider further the patterns and variability in our observations and provide some wider context to our findings.
Species Distribution
According to our molecular analyses, we found that C. finmarchicus was the dominant Calanus species in the surface layer (0–200 m) across the majority of the Fram Strait. In any of the surface layer samples, C. glacialis made up less than 4% of the total 16S sequence reads. C. hyperboreus was mainly found in the mid and deep water column (data not shown) with few, if any, present in the surface layers. While, at the time of sampling, the C. finmarchicus population appeared to be transitioning between the summer and overwintering life-cycle phase, most C. hyperboreus had already undertaken seasonal migration to depth, consistent with previous studies (Hirche, 1997; Scott et al., 2000; Visser et al., 2017). The relative absence of C. glacialis in our samples most likely reflects that most sample locations were open ocean and away from the preferred shelf habitat of this species (Weydmann et al., 2016; Feng et al., 2018). Melle et al. (2014) proposed that maximum C. finmarchicus abundances occur within, or close to, deep ocean basins. High abundances are also often close to overwintering centres (Heath et al., 2000a; Speirs et al., 2004; Torgersen and Huse, 2005; Heath et al., 2008; Head et al., 2013). Major C. finmarchicus epicentres that neighbour the Fram Strait are the Labrador Sea and the sub-polar gyre of the Norwegian Sea (Melle et al., 2014). It is unlikely that the Labrador Sea is a major source of C. finmarchicus to the Fram Strait given that the two regions are separated by the southwards flowing EGC that would act to move Labrador Sea expatriates away from the Fram Strait. Input of C. finmarchicus into the Fram Strait from the Norwegian Sea via northwards transport of AW by the WSC and then recirculation is more likely (Ringuette et al., 2002; Hirche and Kosobokova, 2007). Indeed, models have estimated that 1.5 Mt C year−1 of C. finmarchicus are fluxed into the Fram Strait by the WSC (Gluchowska et al., 2017). This is consistent with our further finding that C. finmarchicus showed the highest abundances towards the east of the Fram Strait, where the influence of the WSC is the greatest. Nevertheless, although these inputs are likely to dominate total population abundance of C. finmarchicus in the Fram Strait, Tarling et al. (2022) proposed that local recruitment also takes place. They found early developmental stages of C. finmarchicus in the region during early summer that could not have originated from remote epicentres.
Population Abundance
Across all stages (CIV, CV, and CVI female), total water column abundance varied between 878 and 45,000 ind m−2, with the average value for the EFS being 15,644 ind m−2 (15,363 SD) and the WFS being 3,387 ind m−2 (2,352 SD). For the EFS, abundances are comparable to those of overwintering populations found in C. finmarchicus epicentres further south. For instance, in the Eastern and Central Norwegian Sea, Dale et al. (1999) and Heath et al. (2004) estimated abundances between 35,000 to 56,000 ind m−2, while in Nova Scotia and Newfoundland Basins, Gulf of Maine, and Iceland Sea, densities regularly fall in the range of 15,000 to 60,000 ind m−2 (Head and Pepin, 2008; Gislason and Silva, 2012; Runge et al., 2015). This emphasises that the EFS is no longer a marginal environment for C. finmarchicus but is a region where this species now thrives. Nevertheless, the comparatively low abundances in the WFS show that not all parts of this Arctic region are equally favourable to this species, with differences in seasonality in primary production and sea-ice (Freer et al., 2021) and advective inputs (Wassmann et al., 2015) being major factors. Therefore, it is necessary to make a biogeographic distinction between Fram Strait regions primarily influenced by the EGC and those by the WSC.
Body Condition and Lipid Reserves
There was a high level of variance between individuals across a number of body condition metrics (prosome length, total body C, and lipid sac area). Nevertheless, there were also some consistent patterns, such as a significant difference between CVs and females, with values across these metrics being approximately 10% higher in CVs. This may be explained by the cost of maturation (Rey-Rassat et al., 2002). There was also a significant difference between stations, with body condition metrics in the EFS being higher than those in the WFS by approximately 9%. The highest body condition values principally occurred in the surface depth interval, particularly in CVs, while the lowest values occurred mainly in the deep depth interval, although sometimes also evident in the mid water column.
The mean prosome length of Fram Strait C. finmarchicus CVs varied between 2.5 and 2.9 mm. These values are towards the upper end of C. finmarchicus sizes in populations found elsewhere. In a collation of a large number of boreal sectors by Jónasdóttir et al. (2019), the mean prosome length of C. finmarchicus CVs was 2.3 mm, with a range of 2.2 to 2.5 mm. Indeed, prosome lengths of 2.9 mm for CV are at the upper size limit of this species, beyond which they are designated as C. glacialis according to morphological and pigmentation studies (Lindeque et al., 2022; Kwasniewski et al., 2003; Arnkværn et al., 2005; Gabrielsen et al., 2012). Nevertheless, we are confident in our species designation given the accompanying molecular analyses confirming that C. finmarchicus made up >95% of all Calanus specimens captured (see above). Large body size likely reflects the adherence of this species to the temperature-size rule (Atkinson, 1995) where individuals are generally larger at lower temperatures, although the ecophysiological mechanisms that drive this phenomenon are far from fully agreed upon (Angilletta et al., 2003; Hoefnagel and Verberk, 2015; Verberk et al., 2021).
Despite the large body sizes, estimated levels of storage lipid in Fram Strait individuals were not exceptional. We found mean lipid sac areas of between 0.9 and 1.4 mm2. This compares to the 50th centile of 1.0 mm2 and the 95th centile of 2.0 mm2 for individuals in the Newfoundland continental shelf and Labrador Sea (Pepin and Head, 2009). Converting our lipid sac areas into volume (Miller et al., 1998), we obtain a range of 0.28 to 0.57 mm3. When scaled according to prosome length, these values are well within the maximum limits of lipid sac volume for this species as determined by Saumweber and Durbin (2006). For instance, for an individual with a prosome length of 2.5 mm, the maximum lipid sac volume is 0.49 mm3, while for a 2.9-mm individual, it is approximately 0.83 mm3. Hence, many Fram Strait C. finmarchicus individuals have not reached their full potential to store lipid. This may reflect the brevity of the productive season in this region compared to their distributional epicentres further south (Melle et al., 2014).
A further notable feature in our sampling campaign was that individuals with the highest levels of storage lipid were within the surface layers. The impending end of the productive season means these individuals are unlikely to increase the size of their lipid reserves much further. Nevertheless, our observation of a progressive decrease in lipid sac volume of CVs with depth contrasts with observations of Jónasdóttir (1999); Miller et al. (2000), and Pasternak et al. (2002), who found that deep-dwelling individuals had greater lipid levels than those in surface waters throughout most of the year. However, our observations do match those of the Pepin and Head (2009) in the Labrador Sea, showing that the depth structure of the population can be quite variable depending on location and time of year.
The fact that deep individuals in the Fram Strait do not have the highest body condition does not comply with one prevailing hypothesis that descent and entry to diapause is a physiologically induced hormonal response triggered by reaching a storage threshold (Rey-Rassat et al., 2002; Irigoien, 2004). For such a mechanism to be correct, we would expect to find that the majority of CVs that have already descended are at the upper end of the range of storage lipid volumes. It therefore appears that these deep individuals have responded to a different or additional cue to descend and enter diapause. What these cues may be remain uncertain since none have yet been identified that can explain the array of diapause entry and exit times observed over the wide distributional range of this species (Hirche, 1996; Johnson et al., 2008; Bandara et al., 2021).
Diapause Duration
Following the calculation method of Jónasdóttir et al. (2019), we estimated the mean diapause duration to be 126 days (SD 43) in the WFS and up to 106 days (SD 22) in the EFS. The longer duration in the WFS is somewhat surprising given that storage lipid levels were lower in that sector. However, this is countered by the considerably lower mean respiration rate in the WFS (0.73 µg C ind−1 day−1 SD 0.17) than in the EFS (0.89 µg C ind−1 day−1 SD 0.20 at Station D1 and 1.01 µg C ind−1 day−1 SD 0.28 at Station D2) driven by lower individual structural body mass and lower in situ temperatures in the WFS. The result is that reserves are used up at a slower rate in the WFS. Our calculated diapause durations are below the median estimate of 144 days made by Jónasdóttir et al. (2019) across a broad range of boreal sectors. Notably, however, at least in the case of the WFS, our calculated diapause durations are very similar to their estimates for the Iceland Basin (119 days for CV) and the Irminger Sea (122 days for CV), both of which are in close vicinity to the Fram Strait. Hence, our estimated diapause durations appear realistic within their respective spatial context. Nevertheless, at 126 days, individuals that have already entered diapause by the time of sampling will be exiting diapause in early January, while at 106 days, the exit will be in December. Reproduction would therefore have to rely on using up the remaining lipid reserves since levels of food availability at that time of year is likely to be low. The calculation method of Jónasdóttir et al. (2019) generally estimates diapause duration to be shorter than other methods such as that of Saumweber and Durbin (2006) and Johnson et al. (2008) and can be considered to be conservative.
Ecosystem Impacts
Tarling et al. (2022) provided the first evidence that C. finmarchicus is now within the Fram Strait, and over time, its dominance in the region may increase at the expense of its more Arctic congeners, C. hyperboreus and C. glacialis. C. finmarchicus is the smallest of the three species, and this may impact predators that target individual Calanus, such as little auks (Alle alle), which actively select larger Calanus (Karnovsky et al., 2003; Kwasniewski et al., 2012; Vogedes et al., 2014). However, Amélineau et al. (2016) found that chick growth and adult body condition could be maintained on a diet of smaller prey.
The present study also demonstrates that a shift in Calanus species may bring further changes in terms of the timing and duration of diapause. In turn, this will alter when reproduction and spawning occur and the subsequent appearance of eggs and early larval stages. Boreal fish species, such as capelin, Atlantic cod, and mackerel, thrive on eggs and larvae of C. finmarchicus (Bjørke, 1976; Heath and Lough, 2007), and their capability to synchronise their life cycles with those of C. finmarchicus in the Fram Strait will determine whether they too will become a dominant component of this environment. Given that many C. finmarchicus fish predators are commercially harvested, this may in turn lead to a northwards migration of the fishing fleet. Meanwhile, the fate of resident Arctic species, such as Arctic cod, may be one of further poleward retreat if they are to maintain their preference for C. glacialis prey (Bouchard and Fortier, 2020).
C Flux Components
We found the flux of C generated by the seasonal vertical migration of C. finmarchicus in the Fram Strait to be dominated by the respiration of individuals at depth during diapause. The average population respiration flux amounted to 0.25 g C m−2 year−1 (SD 0.17) in the WFS and 1.64 g C m−2 year−1 (SD 1.53) in the EFS. By comparison, C flux resulting from the mortality of overwintering individuals at depth was an order of magnitude lower, at 0.03 g C m−2 year−1 (SD 0.02) for both storage lipid and structural C flux in the WFS and 0.21 g C m−2 year−1 (SD 0.19) and 0.20 g C m−2 year−1 (SD 0.19), respectively, in the EFS. A major sensitivity in the estimation of respiration flux is the rate of respiration during the overwintering period. In the present study, we calculated this following the method of Visser et al. (2017), who applied metabolic theory. This also allowed direct comparison with the respiration flux estimates of Jónasdóttir et al. (2019) across the boreal North Atlantic. Nevertheless, there are alternative methods for calculating overwintering respiration rate, such as that proposed by Saumweber and Durbin (2006) and since applied by Pierson et al. (2013). We found very similar rates when applying this alternative method to our data (mean across all individuals of 1.08 µg C ind−1 day−1 (SD 0.37) for Saumweber and Durbin (2006) method compared to 1.06 µg C ind−1 day−1 (SD 0.38) for the Visser et al. (2017) method used in the present study). Even so, varying the metabolic rate or diapause length has the effect of using up the same reserves at a different rate with little impact on the final estimate of annual C flux.
A further major assumption in our calculations was that natural mortality during overwintering was set at −0.001 day−1. This value represents loss from the population through natural causes (e.g., disease, parasitism, and senescence) where the individual decays in the same deep water mass. This rate does not include predation mortality where there is the potential for the C mass to be metabolised and egested in other parts of the water column above sequestration depth. Nevertheless, −0.001 day−1 is conservative compared to other estimates of overwintering mortality in this species, such as that by Bagoien et al. (2001) of −0.007 day−1 and Gislason et al. (2007) of −0.004 day−1, although neither study partitioned this total rate into predation and non-predation mortality.
Total Population C Flux
We found that the total population C flux generated by the combination of respiration and mortality over winter amounted to 0.31 g C m−2 year−1 (SD 0.22) in the WFS and 2.04 g C m−2 year−1 (SD 1.90) in the EFS. These values fall within the range estimated for C. finmarchicus in other sectors of the boreal North Atlantic, as collated by Jónasdóttir et al. (2019). In the case of the WFS, similarly low values were found for the Rockall Basin and the North Sea (Table 7). For the EFS, rates were in the same order as those in the Irminger Basin (3.18 g C m−2 year−1), Iceland Basin (4.28 g C m−2 year−1), and West Norwegian Sea (4.69 g C m−2 year−1). Moreover, EFS rates fall in the broad range of those reported for different species. In the Nordic Seas, Visser et al. (2017) found rates of between 3 and 5 g C m−2 year−1 for C. hyperboreus. In the Southern Ocean, Bradford-Grieve et al. (2001) reported values of between 2 and 9 g C m−2 year−1 for Neocalanus tonsus, while in the Pacific sub-Arctic, Kobari et al. (2003) and Kobari et al. (2008) reported values in the range of 2 and 4 g C m−2 year−1 across all Neocalanus species.
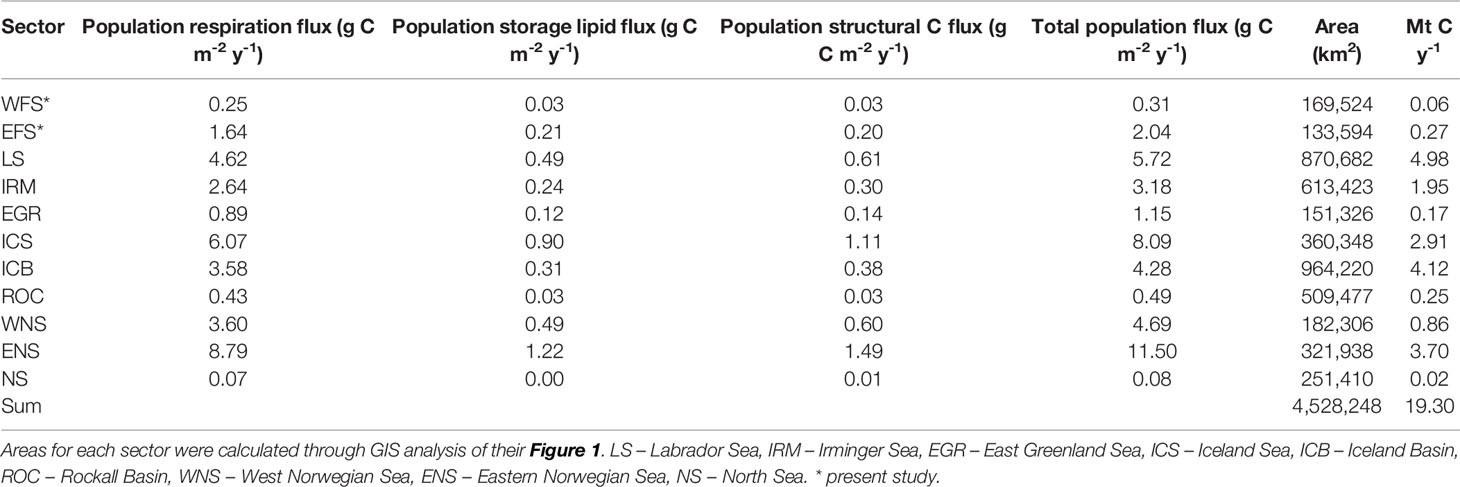
Table 7 Calanus finmarchicus: Spatially-discrete (g C m-2 y-1) and spatially integrated (Mt C y-1) population C flux for the West Fram Strait (WFS), East Fram Strait (EFS) and different ocean sectors as calculated by Jónasdóttir et al. (2019).
Further context to the relative contribution of the Fram Strait to total C. finmarchicus C flux can be gained by calculating the spatially integrated flux (Mt C year−1) for the different ocean sectors (Table 7; Figure 7). From a total flux of 19.3 Mt C year−1, it is evident that the greatest contributions are made in regions considered epicentres of C. finmarchicus distribution, such as the Labrador Sea (5.0 Mt C year−1), Iceland Basin (4.1 Mt C year−1), and Eastern Norwegian Sea (3.7 Mt C year−1). By comparison, the combined contribution of the two Fram Strait regions is rather modest at 0.3 Mt C year−1. Hence, although the spatially discrete rate of C flux generated by this species in the Fram Strait can be equivalent to rates elsewhere, its comparatively small area means that its spatially integrated contribution is marginal.
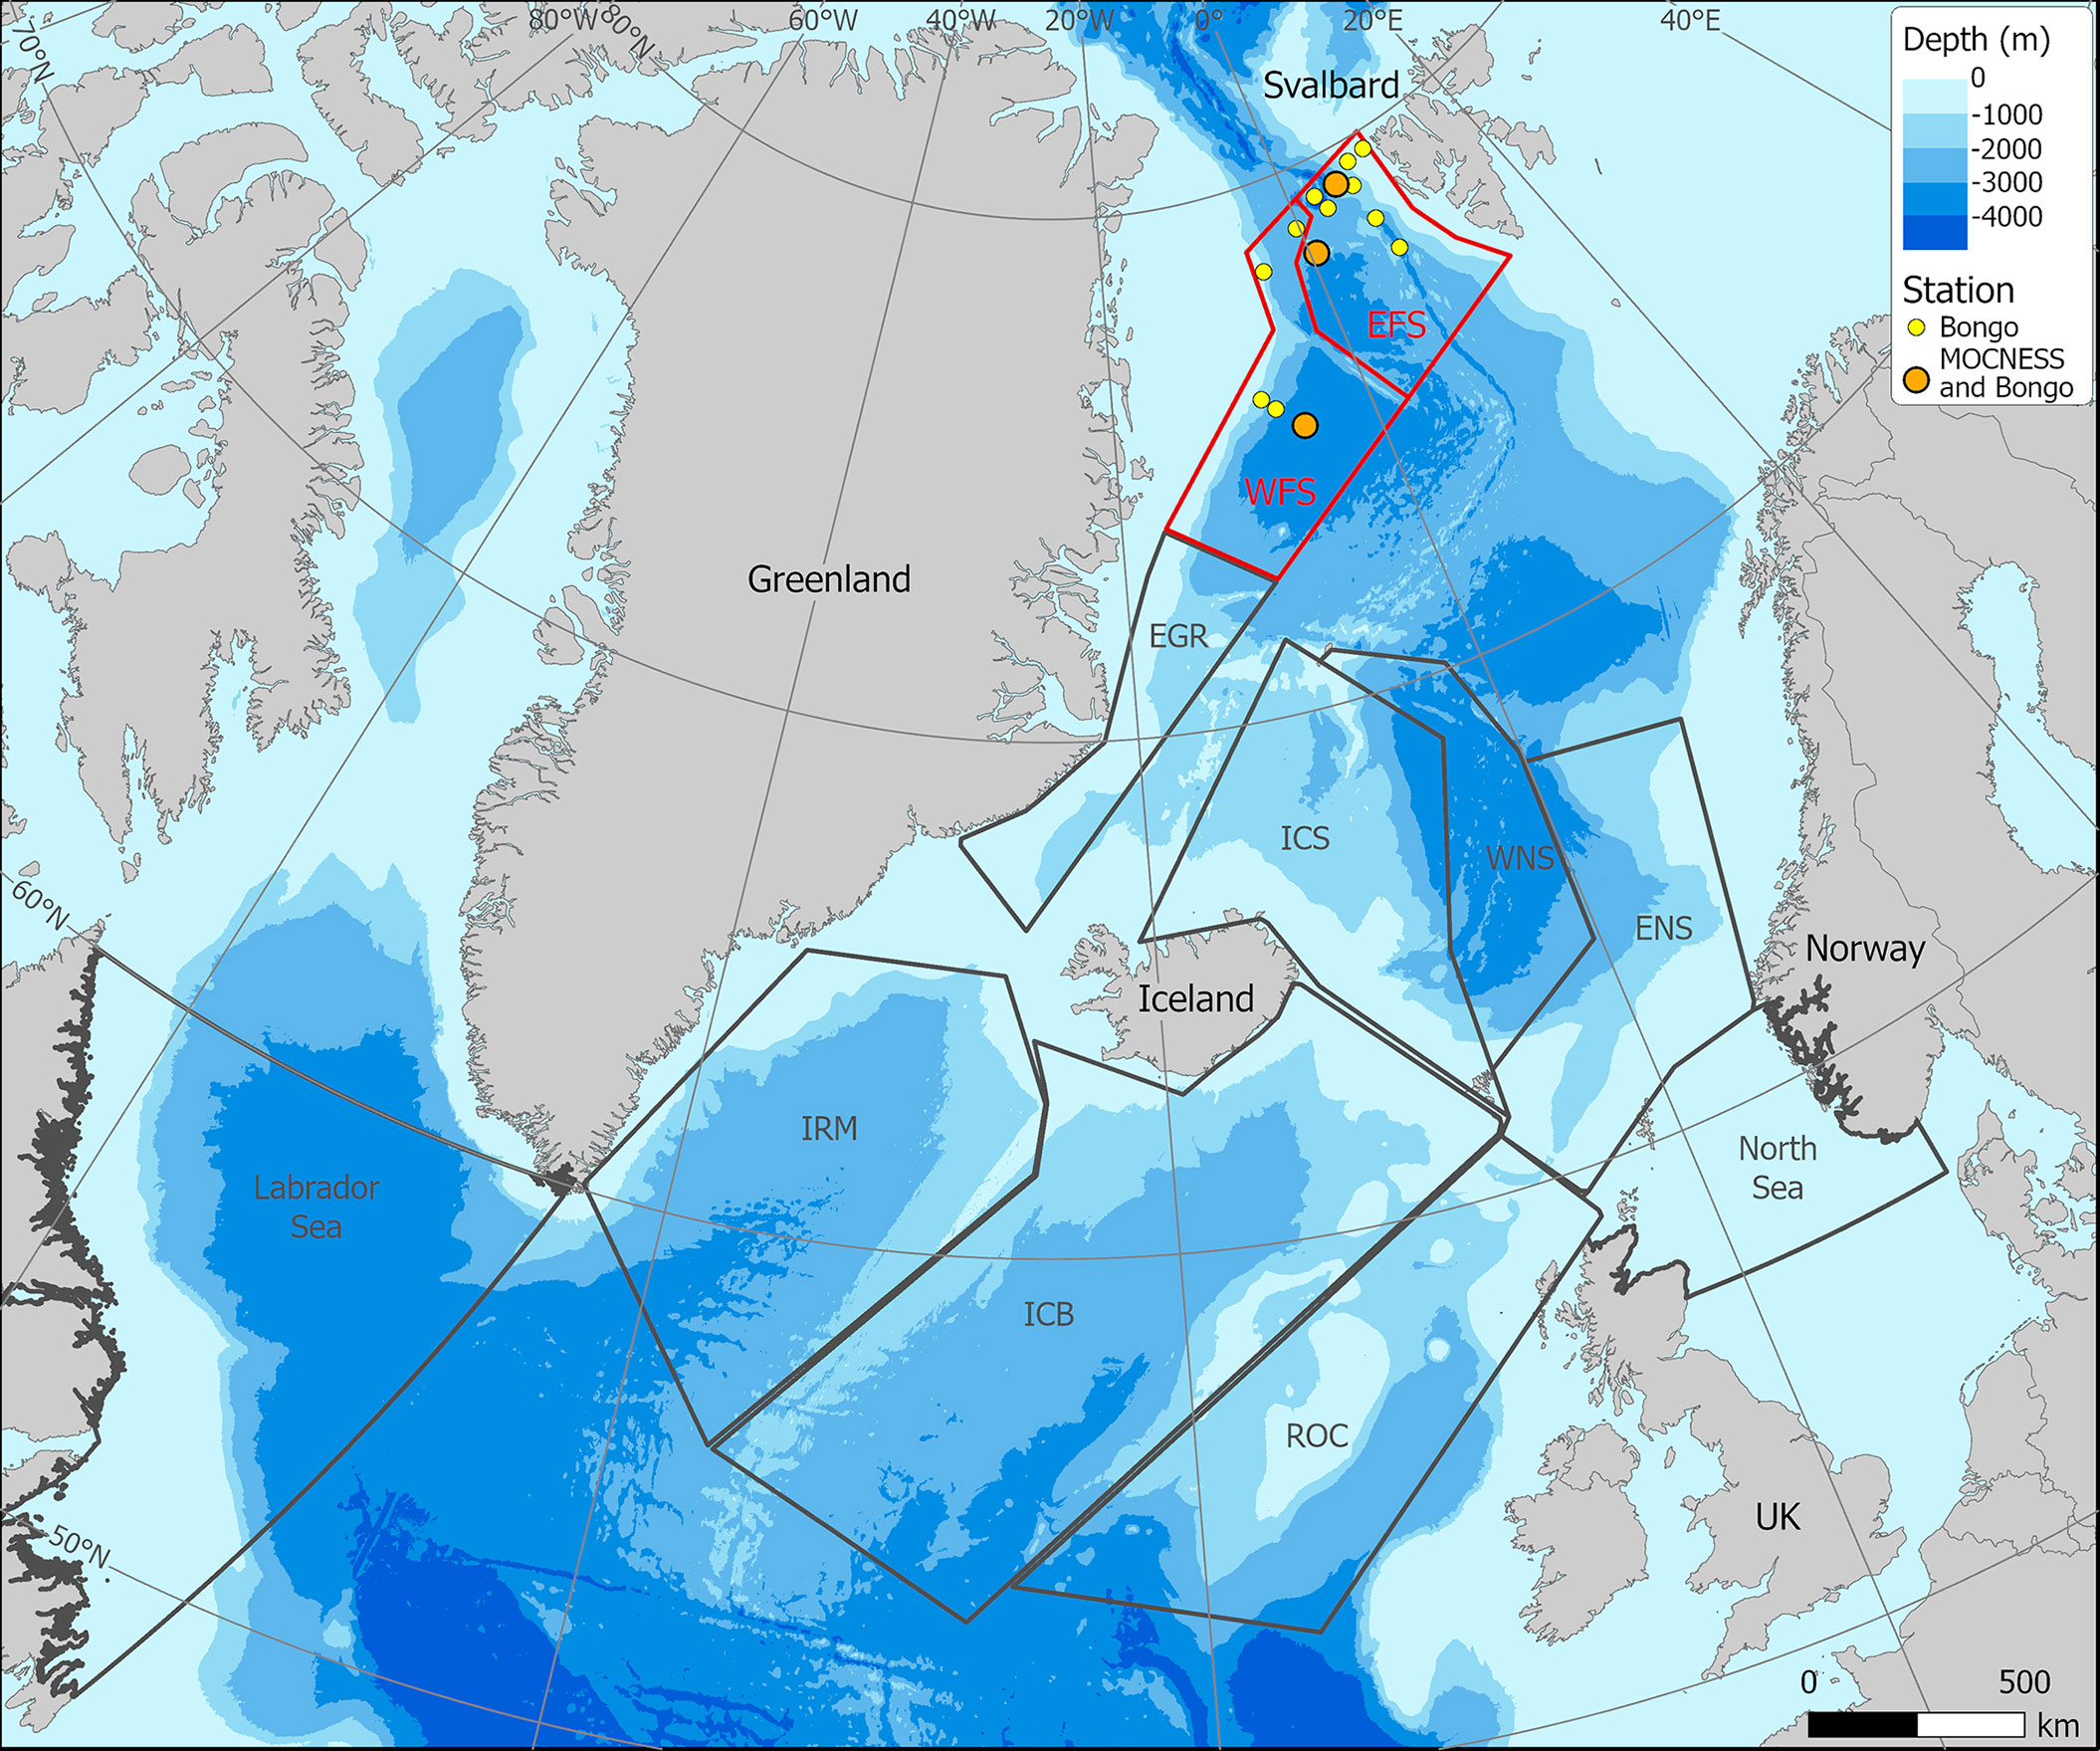
Figure 7 Oceanographic zones designated by Jónasdóttir et al. (2019) to determine spatial variation in Calanus finmarchicus lipid content and carbon flux. Zones for the West Fram Strait (WFS) and East Fram Strait (EFS) have been added by the present study.
C. finmarchicus is not the only species contributing to the lipid pump within the Fram Strait since it co-occurs with the true Arctic conspecifics C. glacialis and C. hyperboreus. As already mentioned above, C. hyperboreus has been estimated to generate a flux of 3 to 6 g C m−2 year−1 across the Fram Strait, Greenland Sea, and Iceland Sea (Visser et al., 2017), which is of the same order as that determined for C. finmarchicus in the EFS by the present study. C flux generated by C. glacialis is yet to be determined but, given its similar size and overwintering lifestyle, may also be equivalent to the other two. Hence, the total contribution to C flux in this region from all Calanus species could likely be triple and close to 1 Mt C year−1, which would be a substantial contribution in the wider context. However, a further factor to consider is that while conditions in the Fram Strait have become increasingly favourable for the boreal C. finmarchicus (Freer et al., 2021), they have become less so for C. glacialis and C. hyperboreus with core distribution regions shifting ever northwards (Ershova et al., 2021). Therefore, the true value of C flux generated by C. finmarchicus in the Fram Strait may be in maintaining the lipid pump as the contribution from true Arctic conspecifics diminishes.
Concluding Remarks
This study represents the first attempt to estimate the size of the lipid pump in the Fram Strait region. Estimates will be improved by obtaining and analysing samples during the period between early autumn and winter when the entire population has entered diapause and, in early spring, to determine what proportion of the population has survived overwintering and what lipid reserve levels they have remaining. Field validation of the rate of respiration during diapause would also be valuable. Caution must also be applied with regard to the value of 19.3 Mt C year−1 for the total lipid pump of C. finmarchicus given that this does not also include further notable populations such as in the Gulf of Maine and the temperate open Atlantic Ocean. It also represents the contribution of just one species to the total lipid pump, which emphasises the need for further studies on other deep diapausing calanoids to evaluate its full magnitude.
This study contributes to a growing awareness of the dynamic responses of critical basal marine species to changing environmental conditions likely resulting from climate change. The rapidity with which planktonic species such as Calanus can respond to change may have important impacts on broader ecosystem function. While our understanding of the life-cycle strategies of this species group is maturing, our ability to predict environmental responses remains in its infancy. What we are now appreciating is that how these species respond will have a major influence on lipid pump magnitude and their role within the marine carbon cycle.
Data Availability Statement
The raw data supporting the conclusions of this article will be made available by the authors, without undue reservation.
Author Contributions
Samples were collected by GT, CC, JF, AB, DM, VDF and GS. KC and MW carried out zooplankton identification and abundance analyses. Molecular analyses were performed by HP and PL. MB and MJ carried out image analyses to determine prosome and lipid sizes. GT was responsible for total carbon analysis. Maps and GIS analyses were performed by LG and physical oceanographic analyses by FC. The manuscript was written by GT with further input from all authors. All authors listed have made a substantial, direct, and intellectual contribution to the work and approved it for publication.
Funding
Financial support for authors (GT, JF, AB, KC, FC, KL, PL, DM, HP, and GS) was provided by Changing Arctic Ocean (CAO) Programmes DIAPOD and Arctic PRIZE, funded by UKRI Natural Environment Research Council (NERC; NE/P006213/1, NE/P006353/1, NE/P006302/1, NE/P006183/1, and NE/P005985/1, amongst others), and by CAO Project CHASE, jointly funded by NERC (NE/R012733/1) and the German Federal Ministry of Education and Research (BMBF; 03F0803A).
Conflict of Interest
The authors declare that the research was conducted in the absence of any commercial or financial relationships that could be construed as a potential conflict of interest.
Publisher’s Note
All claims expressed in this article are solely those of the authors and do not necessarily represent those of their affiliated organizations, or those of the publisher, the editors and the reviewers. Any product that may be evaluated in this article, or claim that may be made by its manufacturer, is not guaranteed or endorsed by the publisher.
Acknowledgments
We are grateful to the officers and crew of the RRS James Clark Ross for supporting field sampling in the Fram Strait. Thanks to David Pond as DIAPOD principal investigator; Usha Jha for plankton analysis; Paul Geissler for elemental analysis; Bjørg Apeland, Carwyn Davies, and Gareth Flint for technical support; Amber Chadwick, Jordan Grigor, Holly Jenkins, and Flo Atherden for assistance in on-board net sample processing; Aiden Hunter for monitoring net operations; and Aisling Smith for field laboratory support and operational oversight. Sigrun Jonasdottir provided analytical advice and supporting data. This manuscript was improved following comments from two anonymous reviewers.
References
Amélineau F., Gremillet D., Bonnet D., Le Bot T., Fort J. (2016). Where to Forage in the Absence of Sea Ice? Bathymetry as a Key Factor for an Arctic Seabird. PLoS One 11, e0157764. doi: 10.1371/journal.pone.0157764
Angilletta J., Michael J., Dunham A. E. (2003). The Temperature-Size Rule in Ectotherms: Simple Evolutionary Explanations may Not be General. Am. Nat. 162, 332–342. doi: 10.1086/377187
Arnkværn G., Daase M., Eiane K. (2005). Dynamics of Coexisting Calanus finmarchicus, Calanus Glacialis and Calanus Hyperboreus Populations in a High-Arctic Fjord. Polar. Biol. 28, 528–538. doi: 10.1007/s00300-005-0715-8
Ashjian C. J., Campbell R. G., Welch H. E., Butler M., Van Keuren D. (2003). Annual Cycle in Abundance, Distribution, and Size in Relation to Hydrography of Important Copepod Species in the Western Arctic Ocean. Deep. Sea. Res. Part I. Oceanogr. Res. Pap. 50, 1235–1261. doi: 10.1016/S0967-0637(03)00129-8
Atkinson D. (1995). Effects of Temperature on the Size of Aquatic Ectotherms: Exceptions to the General Rule. J. Therm. Biol. 20, 61–74. doi: 10.1016/0306-4565(94)00028-H
Bagoien E., Kaartvedt S., Aksnes D. L., Eiane K. (2001). Vertical Distribution and Mortality of Overwintering Calanus. Limnol. Oceanogr. 46, 1494–1510. doi: 10.4319/lo.2001.46.6.1494
Bandara K., Varpe Ø., Maps F., Ji R., Eiane K., Tverberg V. (2021). Timing of Calanus finmarchicus Diapause in Stochastic Environments. Ecol. Modell. 460, 109739. doi: 10.1016/j.ecolmodel.2021.109739
Beszczynska-Moeller A., Woodgate R. A., Lee C., Melling H., Karcher M. (2011). A Synthesis of Exchanges Through the Main Oceanic Gateways to the Arctic Ocean. Oceanography 24, 82–99. doi: 10.5670/oceanog.2011.59
Bjørke H. (1976). "Some Preliminary Results on Food and Feeding of Young Capelin Larvae", ICES 1976/H:37. Pelagic Fish (Northern) Committee.
Bouchard C., Fortier L. (2020). The Importance of Calanus Glacialis for the Feeding Success of Young Polar Cod: A Circumpolar Synthesis. Polar. Biol. 43, 1095–1107. doi: 10.1007/s00300-020-02643-0
Bradford-Grieve J., Nodder S., Jillett J., Currie K., Lassey K. (2001). Potential Contribution That the Copepod Neocalanus Tonsus Makes to Downward Carbon Flux in the Southern Ocean. J. Plankt. Res. 23, 963–975. doi: 10.1093/plankt/23.9.963
Carmack E., Polyakov I., Padman L., Fer I., Hunke E., Hutchings J., et al. (2015). Toward Quantifying the Increasing Role of Oceanic Heat in Sea Ice Loss in the New Arctic. Bull. Amer. Meteor. 96, 2079–2105. doi: 10.1175/BAMS-D-13-00177.1
Conover R. J., Huntley M. (1991). Copepods in Ice-Covered Seas - Distribution, Adaptations to Seasonally Limited Food, Metabolism, Growth Patterns and Life Cycle Strategies in Polar Seas. J. Mar. Sys. 2, 1–41. doi: 10.1016/0924-7963(91)90011-I
Daase M., Berge J., Søreide J. E., Falk-Petersen S. (2021). “Ecology of Arctic Pelagic Communities,” in Arctic Ecology, (Ed) Thomas DN, John Wiley & Sons , New Jersey, US 219–259.
Dahms H. U. (1995). Dormancy in the Copepoda - An Overview. Hydrobiol 306, 199–211. doi: 10.1007/BF00017691
Dale T., Bagoien E., Melle W., Kaartvedt S. (1999). Can Predator Avoidance Explain Varying Overwintering Depth of Calanus in Different Oceanic Water Masses? Mar. Ecol. Prog. Ser. 179, 113–121. doi: 10.3354/meps179113
Ershova E. A., Kosobokova K. N., Banas N. S., Ellingsen I., Niehoff B., Hildebrandt N., et al. (2021). Sea Ice Decline Drives Biogeographical Shifts of Key Calanus Species in the Central Arctic Ocean. Glob. Change Biol. 27, 2128–2143. doi: 10.1111/gcb.15562
Falk-Petersen S., Mayzaud P., Kattner G., Sargent J. (2009). Lipids and Life Strategy of Arctic Calanus. Mar. Biol. Res. 5, 18–39. doi: 10.1080/17451000802512267
Fauchald P., Skov H., Skern-Mauritzen M., Johns D., Tveraa T. (2011). Wasp-Waist Interactions in the North Sea Ecosystem. PLoS One 6, e22729. doi: 10.1371/journal.pone.0022729
Feng Z., Ji R., Ashjian C., Campbell R., Zhang J. (2018). Biogeographic Responses of the Copepod Calanus Glacialis to a Changing Arctic Marine Environment. Glob. Change Biol. 24, e159–e170. doi: 10.1111/gcb.13890
Fossheim M., Primicerio R., Johannesen E., Ingvaldsen R. B., Aschan M. M., Dolgov A. V. (2015). Recent Warming Leads to a Rapid Borealization of Fish Communities in the Arctic. Nat. Clim. 5, 673–677. doi: 10.1038/NCLIMATE2647
Freer J., Daase M., Tarling G. A. (2021). Modelling the Biogeographic Boundary Shift of Calanus finmarchicus Reveals Drivers of Arctic Atlantification by Subarctic Zooplankton. Glob. Change Biol. 28, 429–440. doi: 10.1111/gcb.15937
Gabrielsen T. M., Merkel B., Søreide J., Johansson-Karlsson E., Bailey A., Vogedes D., et al. (2012). Potential Misidentifications of Two Climate Indicator Species of the Marine Arctic Ecosystem: Calanus Glacialis and C. Finmarchicus. Polar. Biol. 35, 1621–1628. doi: 10.1007/s00300-012-1202-7
Giering S. L., Sanders R., Lampitt R. S., Anderson T. R., Tamburini C., Boutrif M., et al. (2014). Reconciliation of the Carbon Budget in the Ocean’s Twilight Zone. Nature 507, 480–483. doi: 10.1038/nature13123
Gislason A., Eiane K., Reynisson P. (2007). Vertical Distribution and Mortality of Calanus finmarchicus During Overwintering in Oceanic Waters Southwest of Iceland. Mar. Biol. 150, 1253–1263. doi: 10.1007/s00227-006-0400-7
Gislason A., Silva T. (2012). Abundance, Composition, and Development of Zooplankton in the Subarctic Iceland Sea in 2006, 2007, and 2008. ICES J. Mar. Sci. 69, 1263–1276. doi: 10.1093/icesjms/fss070
Gluchowska M., Dalpadado P., Beszczynska-Möller A., Olszewska A., Ingvaldsen R. B., Kwasniewski S. (2017). Interannual Zooplankton Variability in the Main Pathways of the Atlantic Water Flow Into the Arctic Ocean (Fram Strait and Barents Sea Branches). ICES J. Mar. Sci. 74, 1921–1936. doi: 10.1093/icesjms/fsx033
Hattermann T., Isachsen P. E., Von Appen W. J., Albretsen J., Sundfjord A. (2016). Eddy-Driven Recirculation of Atlantic Water in Fram Strait. Geophys. Res. Lett. 43, 3406–3414. doi: 10.1002/2016GL068323
Head E. J., Melle W., Pepin P., Bagøien E., Broms C. (2013). On the Ecology of Calanus finmarchicus in the Subarctic North Atlantic: A Comparison of Population Dynamics and Environmental Conditions in Areas of the Labrador Sea-Labrador/Newfoundland Shelf and Norwegian Sea Atlantic and Coastal Waters. Prog. Oceanogr. 114, 46–63. doi: 10.1016/j.pocean.2013.05.004
Head E., Pepin P. (2008). Variations in Overwintering Depth Distributions of Calanus finmarchicus in the Slope Waters of the NW Atlantic Continental Shelf and the Labrador Sea. J. Northw. Atl. Fish. Sci. 39, 49–69. doi: 10.2960/J.v39.m600
Heath M., Astthorsson O., Dunn J., Ellertsen B., Gaard E., Gislason A., et al. (2000a). Comparative Analysis of Calanus finmarchicus Demography at Locations Around the Northeast Atlantic. ICES J. Mar. Sci. 57, 1562–1580. doi: 10.1006/jmsc.2000.0950
Heath M. R., Boyle P. R., Gislason A., Gurney W. S. C., Hay S. J., Head E. J. H., et al. (2004). Comparative Ecology of Over-Wintering Calanus finmarchicus in the Northern North Atlantic, and Implications for Life-Cycle Patterns. ICES J. Mar. Sci. 61, 698–708. doi: 10.1016/j.icesjms.2004.03.013
Heath M., Fraser J., Gislason A., Hay S., Jónasdóttir S., Richardson K. (2000b). Winter Distribution of Calanus finmarchicus in the Northeast Atlantic. ICES J. Mar. Sci. 57, 1628–1635. doi: 10.1006/jmsc.2000.0978
Heath M., Lough R. (2007). A Synthesis of Large-Scale Patterns in the Planktonic Prey of Larval and Juvenile Cod (Gadus Morhua). Fish. Oceanogr. 16, 169–185. doi: 10.1111/j.1365-2419.2006.00423.x
Heath M., Rasmussen J., Ahmed Y., Allen J., Anderson C., Brierley A., et al. (2008). Spatial Demography of Calanus finmarchicus in the Irminger Sea. Prog. Oceanogr. 76, 39–88. doi: 10.1016/j.pocean.2007.10.001
Hirche H. J. (1996). Diapause in the Marine Copepod, Calanus finmarchicus - A Review. Ophelia 44, 129–143. doi: 10.1080/00785326.1995.10429843
Hirche H.-J. (1997). Life Cycle of the Copepod Calanus Hyperboreus in the Greenland Sea. Mar. Biol. 128, 607–618. doi: 10.1007/s002270050127
Hirche H.-J., Kosobokova K. (2007). Distribution of Calanus finmarchicus in the Northern North Atlantic and Arctic Ocean—expatriation and Potential Colonization. Deep-Sea. Res. II.: Top. Stud. Oceanogr. 54, 2729–2747. doi: 10.1016/j.dsr2.2007.08.006
Hoefnagel K. N., Verberk W. C. (2015). Is the Temperature-Size Rule Mediated by Oxygen in Aquatic Ectotherms? J. Therm. Biol. 54, 56–65. doi: 10.1016/j.jtherbio.2014.12.003
Hygum B., Rey C., Hansen B. W., Tande K. (2000). Importance of Food Quantity to Structural Growth Rate and Neutral Lipid Reserves Accumulated in Calanus finmarchicus. Mar. Biol. 136, 1057–1073. doi: 10.1007/s002270000292
Ingvarsdóttir A., Houlihan D. F., Heath M. R., Hay S. J. (1999). Seasonal Changes in Respiration Rates of Copepodite Stage V Calanus finmarchicus (Gunnerus). Fish. Oceanogr. 8, 73–83. doi: 10.1046/j.1365-2419.1999.00002.x
Irigoien X. (2004). Some Ideas About the Role of Lipids in the Life Cycle of Calanus finmarchicus. J. Plankt. Res. 26, 259–263. doi: 10.1093/plankt/fbh030
Ji R., Ashjian C. J., Campbell R. G., Chen C., Gao G., Davis C. S., et al. (2012). Life History and Biogeography of Calanus Copepods in the Arctic Ocean: An Individual-Based Modeling Study. Prog. Oceanogr. 96, 40–56. doi: 10.1016/j.pocean.2011.10.001
Johnson C. L., Leising A. W., Runge J. A., Head E. J., Pepin P., Plourde S., et al. (2008). Characteristics of Calanus finmarchicus Dormancy Patterns in the Northwest Atlantic. ICES J. Mar. Sci. 65, 339–350. doi: 10.1093/icesjms/fsm171
Jónasdóttir S. H. (1999). Lipid Content of Calanus finmarchicus During Overwintering in the Faroe–Shetland Channel. Fish. Oceanogr. 8, 61–72. doi: 10.1046/j.1365-2419.1999.00003.x
Jónasdóttir S. H., Visser A. W., Richardson K., Heath M. R. (2015). Seasonal Copepod Lipid Pump Promotes Carbon Sequestration in the Deep North Atlantic. Proc. Natl. Acad. Sci. U.S.A. 112, 12122–12126. doi: 10.1073/pnas.1512110112
Jónasdóttir S. H., Wilson R. J., Gislason A., Heath M. R. (2019). Lipid Content in Overwintering Calanus finmarchicus Across the Subpolar Eastern North Atlantic Ocean. Limnol. Oceanogr. 64, 2029–2043. doi: 10.1002/lno.11167
Kahru M., Brotas V., Manzano-Sarabia M., Mitchell B. (2011). Are Phytoplankton Blooms Occurring Earlier in the Arctic? Glob. Change Biol. 17, 1733–1739. doi: 10.1111/j.1365-2486.2010.02312.x
Karnovsky N. J., Kwaśniewski S., Węsławski J. M., Walkusz W., Beszczyńska-Möller A. (2003). Foraging Behavior of Little Auks in a Heterogeneous Environment. Mar. Ecol. Prog. Ser. 253, 289–303. doi: 10.3354/meps253289
Kattner G., Hagen W. (2009). “Lipids in Marine Copepods: Latitudinal Characteristics and Perspective to Global Warming,” in Lipids in Aquatic Ecosystems (Berlin: Springer), 257–280.
Kattner G., Krause M. (1987). Changes in Lipids During the Development of Calanus finmarchicus Sl From Copepodid I to Adult. Mar. Biol. 96, 511–518. doi: 10.1007/BF00397968
Kobari T., Shinada A., Tsuda A. (2003). Functional Roles of Interzonal Migrating Mesozooplankton in the Western Subarctic Pacific. Prog. Oceanogr. 57, 279–298. doi: 10.1016/s0079-6611(03)00102-2
Kobari T., Steinberg D. K., Ueda A., Tsuda A., Silver M. W., Kitamura M. (2008). Impacts of Ontogenetically Migrating Copepods on Downward Carbon Flux in the Western Subarctic Pacific Ocean. Deep-Sea. Res. II.: Top. Stud. Oceanogr. 55, 1648–1660. doi: 10.1016/j.dsr2.2008.04.016
Kortsch S., Primicerio R., Fossheim M., Dolgov A. V., Aschan M. (2015). “Climate Change Alters the Structure of Arctic Marine Food Webs Due to Poleward Shifts of Boreal Generalists,” in Proc. Royal Soc. B (London: The Royal Society), 1546.
Krumhansl K. A., Head E. J., Pepin P., Plourde S., Record N. R., Runge J. A., et al. (2018). Environmental Drivers of Vertical Distribution in Diapausing Calanus Copepods in the Northwest Atlantic. Prog. Oceanogr. 162, 202–222. doi: 10.1016/j.pocean.2018.02.018
Kwasniewski S., Gluchowska M., Walkusz W., Karnovsky N. J., Jakubas D., Wojczulanis-Jakubas K., et al. (2012). Interannual Changes in Zooplankton on the West Spitsbergen Shelf in Relation to Hydrography and Their Consequences for the Diet of Planktivorous Seabirds. ICES J. Mar. Sci. 69, 890–901. doi: 10.1093/icesjms/fss076
Kwasniewski S., Hop H., Falk-Petersen S., Pedersen G. (2003). Distribution of Calanus Species in Kongsfjorden, a Glacial Fjord in Svalbard. J. Plankt. Res. 25, 1–20. doi: 10.1093/plankt/25.1.1
Lee R. F., Hagen W., Kattner G. (2006). Lipid Storage in Marine Zooplankton. Mar. Ecol. Prog. Ser. 307, 273–306. doi: 10.3354/meps307273
Lindeque P., Hann I., Parry H., Cook K., Lindley A., Mayor D. (2022). Red Pigmentation can be Used to Reliably Distinguish Between Live Calanus Finmarchicus and Calanus glacialis Females in the Fram Strait. Front. Mar. Sci. 9, 906465. doi: 10.3389/fmars.2022.906465
Lindeque P. K., Harris R. P., Jones M. B., Smerdon G. R. (1999). Simple Molecular Method to Distinguish the Identity of Calanus Species (Copepoda : Calanoida) at Any Developmental Stage. Mar. Biol. 133, 91–96. doi: 10.1007/s002270050446
Lindeque P. K., Parry H. E., Harmer R. A., Somerfield P. J., Atkinson A. (2013). Next Generation Sequencing Reveals the Hidden Diversity of Zooplankton Assemblages. PLoS One 8, e81327. doi: 10.1371/journal.pone.0081327
Longhurst A., Williams R. (1992). Carbon Flux by Seasonal Vertical Migrant Copepods is a Small Number. J. Plankt. Res. 14, 1495–1509. doi: 10.1093/plankt/14.11.1495
Marsay C. M., Sanders R. J., Henson S. A., Pabortsava K., Achterberg E. P., Lampitt R. S. (2015). Attenuation of Sinking Particulate Organic Carbon Flux Through the Mesopelagic Ocean. Proc. Natl. Acad. Sci. U.S.A. 112, 1089–1094. doi: 10.1073/pnas.1415311112
Melle W., Runge J., Head E., Plourde S., Castellani C., Licandro P., et al. (2014). The North Atlantic Ocean as Habitat for Calanus Finmarchicus: Environmental Factors and Life History Traits. Prog. Oceanogr. 129, 244–284. doi: 10.1016/j.pocean.2014.04.026
Miller C. B., Crain J. A., Morgan C. A. (2000). Oil Storage Variability in Calanus finmarchicus. ICES J. Mar. Sci. 57, 1786–1799. doi: 10.1006/jmsc.2000.0975
Miller C. B., Morgan C. A., Prahl F. G., Sparrow M. A. (1998). Storage Lipids of the Copepod Calanus Finmarchicus From Georges Bank and the Gulf of Maine. Limnol. Oceanogr. 43, 488–497. doi: 10.4319/lo.1998.43.3.0488
Onarheim I. H., Eldevik T., Smedsrud L. H., Stroeve J. C. (2018). Seasonal and Regional Manifestation of Arctic Sea Ice Loss. J. Clim. 31, 4917–4932. doi: 10.1175/JCLI-D-17-0427.1
Orkney A., Platt T., Narayanaswamy B. E., Kostakis I., Bouman H. A. (2020). Bio-Optical Evidence for Increasing Phaeocystis Dominance in the Barents Sea. Philos. Trans. R. Soc A. 378, 20190357. doi: 10.1098/rsta.2019.0357
Pasternak A., Riser C. W., Arashkevich E., Rat'kova T., Wassmann P. (2002). Calanus Spp. Grazing Affects Egg Production and Vertical Carbon Flux (the Marginal Ice Zone and Open Barents Sea). J. Mar. Sys. 38, 147–164. doi: 10.1016/S0924-7963(02)00174-4
Pepin P., Head E. J. (2009). Seasonal and Depth-Dependent Variations in the Size and Lipid Contents of Stage 5 Copepodites of Calanus Finmarchicus in the Waters of the Newfoundland Shelf and the Labrador Sea. Deep. Sea. Res. Part I. Oceanogr. Res. Pap. 56, 989–1002. doi: 10.1016/j.dsr.2009.01.005
Pierson J. J., Batchelder H., Saumweber W., Leising A., Runge J. (2013). The Impact of Increasing Temperatures on Dormancy Duration in Calanus finmarchicus. J. Plankt. Res. 35, 504–512. doi: 10.1093/plankt/fbu100
Pinsky M. L., Worm B., Fogarty M. J., Sarmiento J. L., Levin S. A. (2013). Marine Taxa Track Local Climate Velocities. Science 341, 1239–1242. doi: 10.1126/science.1239352
Polyakov I. V., Alkire M., Bluhm B., Brown K., Carmack E. C., Chierici M., et al. (2020). Borealization of the Arctic Ocean in Response to Anomalous Advection From Sub-Arctic Seas. Front. Mar. Sci. 7. doi: 10.3389/fmars.2020.00491
Pond D. W., Tarling G. A. (2011). Phase Transitions of Wax Esters Adjust Buoyancy in Diapausing Calanoides Acutus. Limnol. Oceanogr. 56, 1310–1318. doi: 10.4319/lo.2011.56.4.1310
Renaud P. E., Daase M., Banas N. S., Gabrielsen T. M., Søreide J. E., Varpe Ø., et al. (2018). Pelagic Food-Webs in a Changing Arctic: A Trait-Based Perspective Suggests a Mode of Resilience. ICES J. Mar. Sci. 75, 1871–1881. doi: 10.1093/icesjms/fsy063
Rey-Rassat C., Irigoien X., Harris R., Carlotti F. (2002). Energetic Cost of Gonad Development in Calanus finmarchicus and C. Helgolandicus. Mar. Ecol. Prog. Ser. 238, 301–306. doi: 10.3354/meps238301
Ringuette M., Fortier L., Fortier M., Runge J. A., Bélanger S., Larouche P., et al. (2002). Advanced Recruitment and Accelerated Population Development in Arctic Calanoid Copepods of the North Water. Deep. Sea. Res. Part II. Top. Stud. Oceanogr. 49, 5081–5099. doi: 10.1016/S0967-0645(02)00179-0
Rudels B. (2015). Arctic Ocean Circulation, Processes and Water Masses: A Description of Observations and Ideas With Focus on the Period Prior to the International Polar Year 2007–2009. Prog. Oceanogr. 132, 22–67. doi: 10.1016/j.pocean.2013.11.006
Rudels B., Björk G., Nilsson J., Winsor P., Lake I., Nohr C. (2005). The Interaction Between Waters From the Arctic Ocean and the Nordic Seas North of Fram Strait and Along the East Greenland Current: Results From the Arctic Ocean-02 Oden Expedition. J. Mar. Sys. 55, 1–30. doi: 10.1016/j.jmarsys.2004.06.008
Runge J. A., Ji R., Thompson C. R., Record N. R., Chen C., Vandemark D. C., et al. (2015). Persistence of Calanus finmarchicus in the Western Gulf of Maine During Recent Extreme Warming. J. Plankt. Res. 37, 221–232. doi: 10.1093/plankt/fbu098
Søreide J. E., Falk-Petersen S., Hegseth E. N., Hop H., Carroll M. L., Hobson K. A., et al. (2008). Seasonal Feeding Strategies of Calanus in the High-Arctic Svalbard Region. Deep. Sea. Res. Part II. Top. Stud. Oceanogr. 55, 2225–2244. doi: 10.1016/j.dsr2.2008.05.024
Sainmont J., Andersen K. H., Varpe Ø., Visser A. W. (2014). Capital Versus Income Breeding in a Seasonal Environment. Am. Nat. 184, 466–476. doi: 10.1086/677926
Sargent J., Falk-Petersen S. (1988). “The Lipid Biochemistry of Calanoid Copepods,” in Biology of Copepods (Berlin: Springer), 101–114.
Saumweber W. J., Durbin E. G. (2006). Estimating Potential Diapause Duration in Calanus Finmarchicus. Deep. Sea. Res. Part II. Top. Stud. Oceanogr. 53, 2597–2617. doi: 10.1016/j.dsr2.2006.08.003
Schauer U., Fahrbach E., Osterhus S., Rohardt G. (2004). Arctic Warming Through the Fram Strait: Oceanic Heat Transport From 3 Years of Measurements. J. Geophys. Res. Oc. 109, C06026. doi: 10.1029/2003JC001823
Scott C. L., Kwasniewski S., Falk-Petersen S., Sargent J. R. (2000). Lipids and Life Strategies of Calanus Finmarchicus, Calanus Glacialis and Calanus Hyperboreus in Late Autumn, Kongsfjorden, Svalbard. Polar. Biol. 23, 510–516. doi: 10.1007/s003000000114
Smith S. L., Schnack-Schiel S. B. (1990). “Polar Zooplankton,” in Polar Oceanography, Part B: Chemistry, Biology, and Geology. Ed. Smith W. (San Diego, CA: Academic Press), 527–598.
Speirs D. C., Gurney W. S. C., Holmes S. J., Heath M. R., Wood S. N., Clarke E. D., et al. (2004). Understanding Demography in an Advective Environment: Modelling Calanus finmarchicus in the Norwegian Sea. J. Anim. Ecol. 73, 897–910. doi: 10.1111/j.0021-8790.2004.00857.x
Stroeve J., Notz D. (2018). Changing State of Arctic Sea Ice Across All Seasons. Environ. Res. Lett. 13, 103001. doi: 10.1088/1748-9326/aade56/meta
Sunday J. M., Bates A. E., Dulvy N. K. (2011). Global Analysis of Thermal Tolerance and Latitude in Ectotherms. Proc. R. Soc B. 278, 1823–1830. doi: 10.1098/rspb.2010.1295
Tande K., Henderson R. (1988). Lipid Composition of Copepodite Stages and Adult Females of Calanus Glacialis in Arctic Waters of the Barents Sea. Polar. Biol. 8, 333–339. doi: 10.1007/BF00442024
Tarling G. A., Freer J. J., Banas N. S., Belcher A., Blackwell M., Castellani C., et al. (2022). Can a Key Boreal Calanus Copepod Species Now Complete its Life-Cycle in the Arctic? Evidence and Implications for Arctic Food-Webs. Ambio 51, 333–344. doi: 10.1007/s13280-021-01667-y
Thomas D. N., Arévalo-Martínez D. L., Crocket K. C., Große F., Grosse J., Schulz K., et al. (2022). A Changing Arctic Ocean. Ambio 51, 293–297. doi: 10.1007/s13280-021-01677-w
Torgersen T., Huse G. (2005). Variability in Retention of Calanus Finmarchicus in the Nordic Seas. ICES J. Mar. Sci. 62, 1301–1309. doi: 10.1016/j.icesjms.2005.05.016
Varpe Ø., Jørgensen C., Tarling G. A., Fiksen Ø. (2009). The Adaptive Value of Energy Storage and Capital Breeding in Seasonal Environments. Oikos 118, 363–370. doi: 10.1111/j.1600-0706.2008.17036.x
Verberk W. C., Atkinson D., Hoefnagel K. N., Hirst A. G., Horne C. R., Siepel H. (2021). Shrinking Body Sizes in Response to Warming: Explanations for the Temperature–Size Rule With Special Emphasis on the Role of Oxygen. Biol. Rev. 96, 247–268. doi: 10.1111/brv.12653
Visser A. W., Grønning J., Jónasdóttir S. H. (2017). Calanus Hyperboreus and the Lipid Pump. Limnol. Oceanogr. 62, 1155–1165. doi: 10.1002/lno.10492
Visser A. W., Jonasdottir S. H. (1999). Lipids, Buoyancy and the Seasonal Vertical Migration of Calanus Finmarchicus. Fish. Oceanogr. 8 (Suppl 1), 100–106. doi: 10.1046/j.1365-2419.1999.00001.x
Vogedes D., Eiane K., Båtnes A. S., Berge J. (2014). Variability in Calanus Spp. Abundance on Fine-to Mesoscales in an Arctic Fjord: Implications for Little Auk Feeding. Mar. Biol. Res. 10, 437–448. doi: 10.1080/17451000.2013.815781
Vogedes D., Varpe Ø., Søreide J. E., Graeve M., Berge J., Falk-Petersen S. (2010). Lipid Sac Area as a Proxy for Individual Lipid Content of Arctic Calanoid Copepods. J. Plankt. Res. 32, 1471–1477. doi: 10.1093/plankt/fbq068
Wassmann P. (2011). Arctic Marine Ecosystems in an Era of Rapid Climate Change. Prog. Oceanogr. 90, 1–17. doi: 10.1016/j.pocean.2011.02.002
Wassmann P., Duarte C. M., Agusti S., Sejr M. K. (2011). Footprints of Climate Change in the Arctic Marine Ecosystem. Glob. Change Biol. 17, 1235–1249. doi: 10.1111/j.1365-2486.2010.02311.x
Wassmann P., Kosobokova K., Slagstad D., Drinkwater K., Hopcroft R., Moore S., et al. (2015). The Contiguous Domains of Arctic Ocean Advection: Trails of Life and Death. Prog. Oceanogr. 139, 42–65. doi: 10.1016/j.pocean.2015.06.011
Wassmann P., Reigstad M., Haug T., Rudels B., Carroll M. L., Hop H., et al. (2006). Food Webs and Carbon Flux in the Barents Sea. Prog. Oceanogr. 71, 232–287. doi: 10.1016/j.pocean.2006.10.003
Weydmann A., Coelho N. C., Serrao E. A., Burzyński A., Pearson G. A. (2016). Pan-Arctic Population of the Keystone Copepod Calanus Glacialis. Polar. Biol. 39, 2311–2318. doi: 10.1007/s00300-016-1898-x
Wiedmann M. A., Primicerio R., Dolgov A., Ottesen C. A., Aschan M. (2014). Life History Variation in B Arents S Ea Fish: Implications for Sensitivity to Fishing in a Changing Environment. Ecol. Evol. 4, 3596–3611. doi: 10.1002/ece3.1203
Wilson R. J., Banas N. S., Heath M. R., Speirs D. C. (2016). Projected Impacts of 21st Century Climate Change on Diapause in Calanus Finmarchicus. Glob. Change Biol. 22, 3332–3340. doi: 10.1111/gcb.13282
Keywords: calanoid, overwinter, life cycle, carbon flux, Arctic Ocean
Citation: Tarling GA, Belcher A, Blackwell M, Castellani C, Cook KB, Cottier FR, Dewar-Fowler V, Freer JJ, Gerrish L, Johnson ML, Last KS, Lindeque PK, Mayor DJ, Parry HE, Stowasser G and Wootton M (2022) Carbon and Lipid Contents of the Copepod Calanus finmarchicus Entering Diapause in the Fram Strait and Their Contribution to the Boreal and Arctic Lipid Pump. Front. Mar. Sci. 9:926462. doi: 10.3389/fmars.2022.926462
Received: 22 April 2022; Accepted: 23 May 2022;
Published: 28 June 2022.
Edited by:
Jesper H. Andersen, NIVA Denmark Water Research, DenmarkReviewed by:
Daria Martynova, Zoological Institute (RAS), RussiaTerry Eugene Whitledge, Retired, Fairbanks, United States
Copyright © 2022 Tarling, Belcher, Blackwell, Castellani, Cook, Cottier, Dewar-Fowler, Freer, Gerrish, Johnson, Last, Lindeque, Mayor, Parry, Stowasser and Wootton. This is an open-access article distributed under the terms of the Creative Commons Attribution License (CC BY). The use, distribution or reproduction in other forums is permitted, provided the original author(s) and the copyright owner(s) are credited and that the original publication in this journal is cited, in accordance with accepted academic practice. No use, distribution or reproduction is permitted which does not comply with these terms.
*Correspondence: Geraint A. Tarling, Z2FudEBiYXMuYWMudWs=