 Emmanuel Boss1*
 Anya M. Waite2
 Johannes Karstensen3
 Tom Trull4
 Frank Muller-Karger5
 Heidi M. Sosik6
 Julia Uitz7
 Silvia G. Acinas8
 Katja Fennel9
 Ilana Berman-Frank10Sandy Thomalla11,12
 Hidekatsu Yamazaki13
 Sonia Batten14
 Gerald Gregori15
 Anthony J. Richardson16,17
 Rik Wanninkhof18
- 1School of Marine Sciences, University of Maine, Orono, ME, United States
- 2Department of Oceanography, Ocean Frontier Institute, Dalhousie University, Halifax, NS, Canada
- 3GEOMAR Helmholtz Centre for Ocean Research Kiel, Kiel, Germany
- 4Oceans and Atmosphere, Commonwealth Scientific and Industrial Research Organisation (CSIRO), Hobart, TAS, Australia
- 5College of Marine Science, University of South Florida, Saint Petersberg, FL, United States
- 6 Biology Department, Woods Hole Oceanographic Institution, Woods Hole, MA, United States
- 7Sorbonne Université, CNRS, Laboratoire d’Océanographie de Villefranche, Villefranchie-sur-Mer, France
- 8Department of Marine Biology and Oceanography, Institut de Ciències del Mar, CSIC, Barcelona, Spain
- 9Department of Oceanography, Dalhousie University, Halifax, NS, Canada
- 10Department of Marine Biology, Leon H. Charney School of Marine Sciences, University of Haifa, Haifa, Israel
- 11Southern Ocean Carbon-Climate Observatory, Council for Scientific and Industrial Research, Cape Town, South Africa
- 12Marine and Antarctic Research for Innovation and Sustainability, University of Cape Town, Cape Town, South Africa
- 13Department of Ocean Sciences, Tokyo University of Marine Science and Technology, Tokyo, Japan
- 14North Pacific Marine Science Organization (PICES), Sidney, BC, Canada
- 15Aix-Marseille University, Université de Toulon, CNRS, IRD, Mediterranean Institute of Oceanography, Marseille, France
- 16CSIRO Oceans and Atmosphere –, St Lucia, QLD, Australia
- 17School of Mathematicsl and Physics, University of Queensland, St Lucia, QLD, Australia
- 18Atlantic Oceanographic and Meteorological Laboratory (AOML) of the National Oceanic and Atmospheric Administration (NOAA), Miami FL, United States
Measuring plankton and associated variables as part of ocean time-series stations has the potential to revolutionize our understanding of ocean biology and ecology and their ties to ocean biogeochemistry. It will open temporal scales (e.g., resolving diel cycles) not typically sampled as a function of depth. In this review we motivate the addition of biological measurements to time-series sites by detailing science questions they could help address, reviewing existing technology that could be deployed, and providing examples of time-series sites already deploying some of those technologies. We consider here the opportunities that exist through global coordination within the OceanSITES network for long-term (climate) time series station in the open ocean. Especially with respect to data management, global solutions are needed as these are critical to maximize the utility of such data. We conclude by providing recommendations for an implementation plan.
1 Introduction
Tracking how marine life responds to increased human use and climate change will empower the global community to predict, mitigate, and manage the ocean. Here we demonstrate the existence of mature technologies to measure a combination of biomass and diversity indicators across most of the plankton size spectrum (from sub-micron bacteria to mm-size zooplankton). These technologies are now ready to deploy on coastal to high seas moorings, the focus of this review A natural partner for a global implementation of such technology is OceanSITES1, the global network for coordinating long-term open-ocean Eulerian (e.g. fixed-point) time series stations. Other partner include national, rgional and international ship-based stations and devices like autonomous profiling and drifting floats.
1.1 Why Measure Plankton and Associated Variables?
Oceanographic programs can transform our understanding of the oceans when they are integrated as systematic multidisciplinary observing initiatives, and enacted at global scales (Karsenti et al., 2011). OceanSITES is an entry point for the implementation of this vision through its coordination of sustained time series observations at key locations across the globe to characterize the temporal evolution of ocean physics, chemistry and biology in a fixed-point framework (Figure 1).
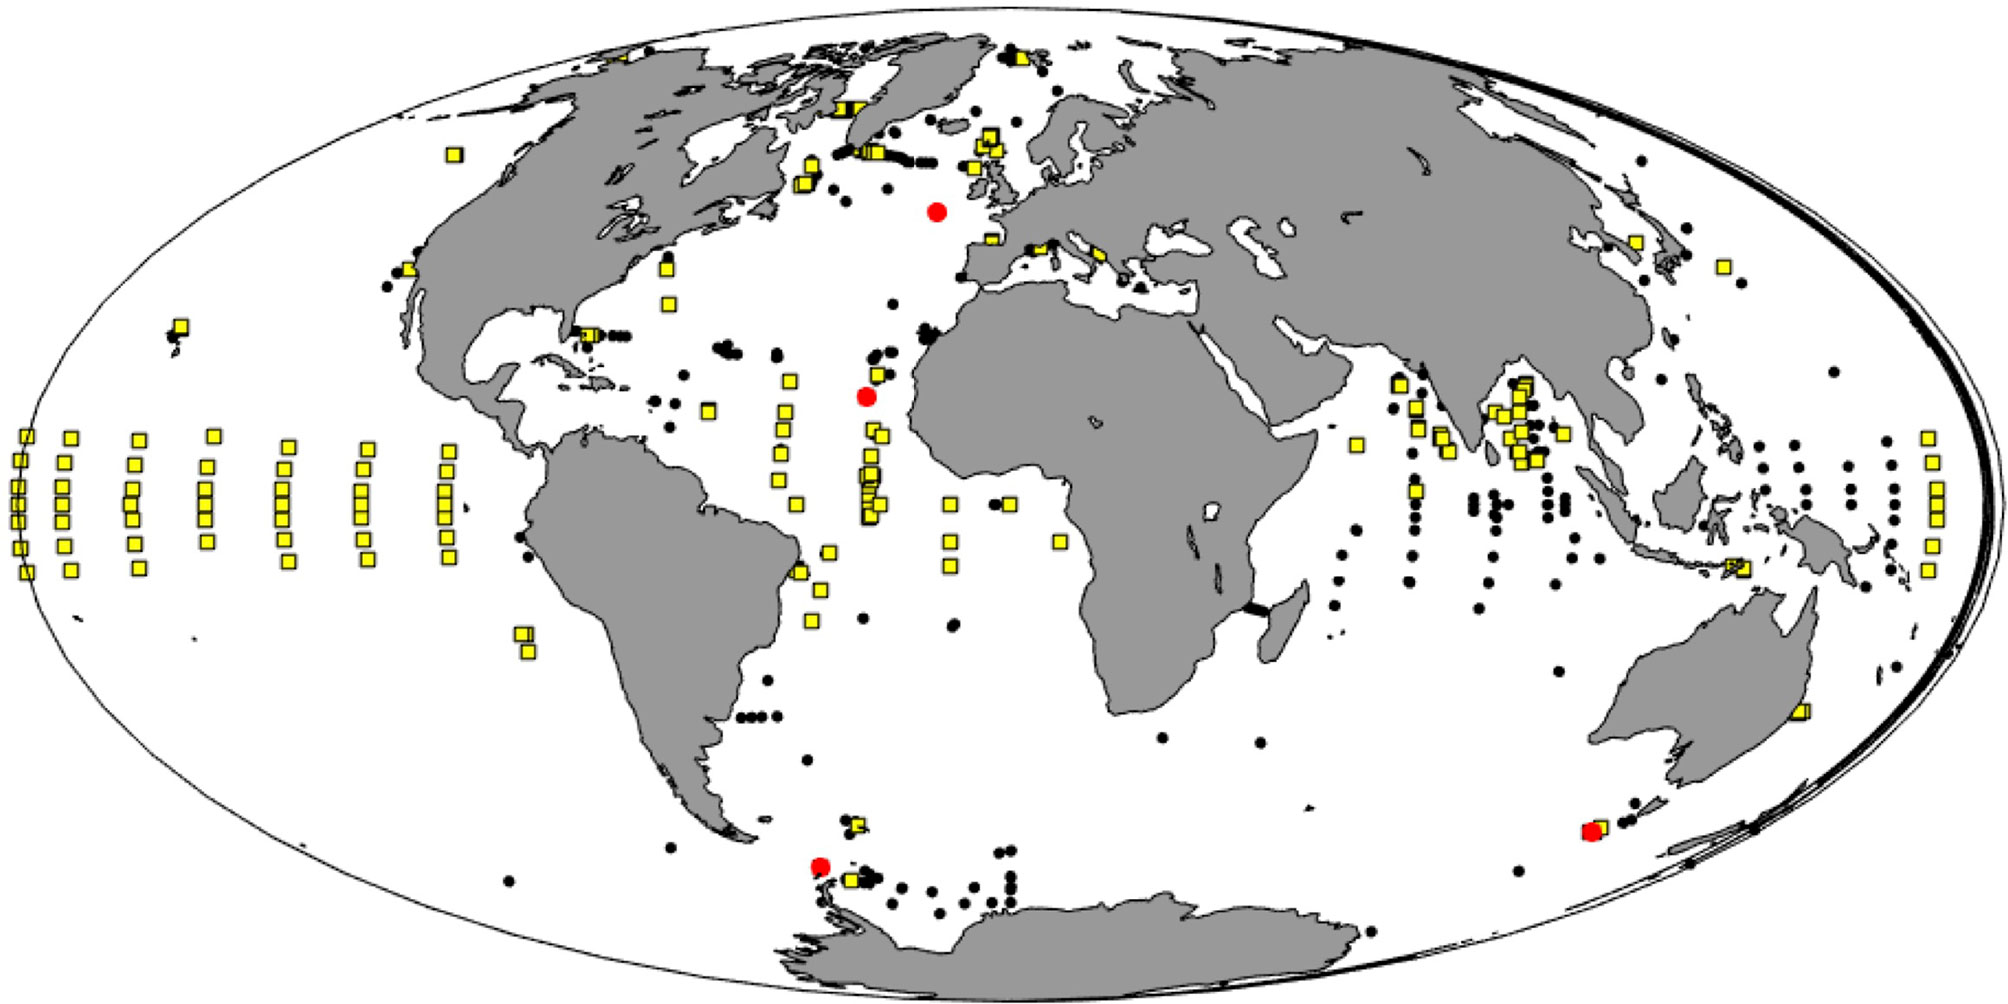
Figure 1 Global map of OceanSITES sites (black dots) as registered in the OCG metadatabase OceanOPS (www.ocean-ops.org). Sites that are registered with the variable “Plankton” (red circles) and sites that have acoustic Doppler current profiler installations (yellow squares) are GEOMAR Helmholtz Centre for Ocean Research Kiel, Kiel, Germany.
Measurements of biological Essential Ocean Variables [EOVs2, Lindstrom et al. (2012); Miloslavich et al. (2018)] that characterize life in the ocean—including diversity, abundance, and changes in distribution of organisms — are fundamental to our understanding of marine ecosystems. For example, the abundance of many species of fishes, seabirds, and marine mammals is regulated by fluctuations in the abundance and diversity of smaller planktonic organisms [e.g. Richardson et al. (2000); Scott et al. (2010)]. Similarly, phytoplankton, the foundation of most aquatic food webs, play a fundamental role mediating the cycles of chemical elements in the ocean that are critical for life, including iron, oxygen, nitrogen, phosphorus, and carbon. At present, however, geographic coverage of biological EOVs is poor [Satterthwaite et al. (2021)]. Many pressing societal challenges related to sustainable fisheries and ocean health (e.g. contaminants, harmful algal and jellyfish blooms) and scientific questions at scales from local to global, and from coastal to the open ocean, remain unaddressed and have been held back by lack of observations of trophic levels beyond those that can be assessed with satellite remote sensing. As such, biomass and diversity of viruses, bacteria, archaea, phytoplankton and zooplankton are all EOVs and all considered Essential Biodiversity Variables [EBVs3, Muller-Karger et al. (2018)]. Phyto- and zooplankton are, in addition, represented as a single Essential Climate Variable (ECV4), but remain largely unobserved over most of the global ocean. Today, most assessments of living resources and management decisions are based on estimates of the possible distribution of organisms based on observations of variables such as temperature, salinity, chlorophyll and oxygen as proxies for the missing direct observations of the biology and ecology EOVs.
Because ocean ecosystems (including the physical and chemical environment) vary across multiple spatial and temporal scales, the diversity, biomass and productivity of oceanic plankton should be measured at the same scales. This requires high resolution long-term observations of plankton EOVs, which are critical for developing scientific understanding and for ecosystem and biogeochemical model initialization and validation [e.g., Everett et al. (2017) , Folllett et al. (2022)]. Improved ecosystem understanding and model ability for predictive and monitoring capacity will have considerable downstream practical applications for the benefit of society.
A baseline of plankton distributions and phenology (seasonal timing) will also help fill critical gaps in our understanding of mechanisms controlling phytoplankton and zooplankton in different regions of the ocean. For example, there are incompatible arguments to explain the same phenomena (e.g., the North Atlantic spring bloom) which could be resolved if appropriate biological data were collected [e.g. Fischer et al. (2014); Behrenfeld and Boss (2018)]. Some of the greatest uncertainties in prediction of future climate are associated with the response of the biosphere to present and future environmental changes, and the subsequent biotic interactions, responses and feedback. For a large number of questions (including the impact of climate change on primary productivity and the biological pump and thus on atmospheric CO2 drawdown), we do not even know the sign of the feedback [Behrenfeld et al. (2016)].
A major uncertainty in predicting future fish production under climate change is the response of phytoplankton and zooplankton composition and productivity to a changing climate [Hoegh-Guldberg et al. (2014)]. A variety of models are used to forecast the biomass and recruitment of organisms such as fish, the efficiency of food webs in cycling elements, the transfer of energy across trophic levels, and for understanding and predicting rates and composition of biological stocks. These models provide critical tools to evaluate multi-scale processes such as the availability and quality of food for fish and other organisms, potential expansion of hypoxic areas in the ocean, the rate of ocean acidification, the modulation of air-sea exchange of gases (e.g., oxygen, carbon dioxide), and the amount of organic matter sinking to the deep ocean. However, the performance of these models relies on substantial volumes of in-situ plankton data to build, constrain, evaluate and ultimately improve their predictive capacity.
1.2 OceanSITES and the Global Ocean Observing System Framework
OceanSITES is a global coordination network for moored and ship-based time series observations at fixed-locations in the open ocean. While the network is global, the individual sites are maintained out of the observational requirements prioritized by nations, institutions and PIs. In other words, observations in OceanSITES are per-se not based on a global design (such as e.g., the Argo profiling floats array) but the coordination of national activities through OceanSITES creates a global framework to ensure national observing address global needs. OceanSITES identified from analysis of its underlying observational design approaches five types of station characteristics: (1) global transport arrays, (2) air/sea exchange, (3) global ocean watch, (4) deep ocean and (5) coastal/open ocean exchange. For the global ocean many regions can be identified for which models would benefit from better coverage of moored time series site (see e.g. Cronin et al., 2019 for an example for air/sea flux sites).
Information on whether pooling national observational activities into a global network is sufficient for delivering data to address global requirements can be assessed by Observing System Design (OSD) studies or even Ocean Observing Simulations Experiments (OSSE). Ocean physics examples exist for successful OSSE [e.g., Fujii et al. (2019)]. The use of models to assess optimal sampling for biogeochemical or even ecosystems may still be premature as in some regions basic process understanding is still missing (Gehlen et al., 2015).
Besides these scientifically motivated characteristics, the coordination comprises the data and metadata standardization towards Findability, Accessibility, Interoperability, and Reuse principles (FAIR; Wilkinson et al., 2016), training and capacity development efforts and globally accepted Best Practices documentation for all aspects related to site operations.
OceanSITES is a partner in the Observation Coordination Group (OCG) of the Global Ocean Observing System (GOOS) which in turn also links to the Global Climate Observing System (GCOS) of the World Meteorological Organization (WMO) and International Oceanographic Commission (IOC). OCG aims at advancing the dialogue and enabling joint activities of the various observation coordination groups, including Argo, GO-SHIP, Ship Observation Team (SOT), Data Buoy Cooperation Panel (DBCP), and OceanGliders. Global integration, best practices, and reproducible data quality are a pre-requisite for interlinking multiplatform observations and work across disciplines (physics, chemistry, biology) to address scientific or practical problems relevant to life in the ocean including societal needs (e.g., productivity, fisheries, recreation, water quality and other environmental impacts or planning). Only a global and cross-network dialogue will produce the environment that is needed to advance the observations part of the GOOS and GCOS.
GOOS has identified global observing requirements from national and local activities that fall under the three themes of climate, operational services and ocean health and that can also be described as globally “sustainable”. To be able to reliably provide the information to address the requirements, sustainable observations are needed and which in turn create the link to the EOVs/EBVs. However, in a distributed network such as OceanSITES, the GOOS sustainable requirements and the linked globally prioritized that EOVs do not necessarily match the regional and local requirements that are the base for national funding of sites. From the perspective of the national funding organisations, EOVs may not be the primary observation focus and observations that are guided by what is defined at a local, regional or multinational as being “essential” (e.g. European Marine Strategy Framework Directive).
Developments in technologies to measure physical and chemical parameters (e.g., salinity, temperature, oxygen, pH, nutrients, currents) to estimate EOVs have resulted in these parameters constituting the vast majority of the observations collected from current sampling platforms; biological observations are, in contrast, typically missing despite being critically needed. To better understand biology in the ocean, we need to move toward a more holistic description of planktonic communities. This includes resolving their biomass and diversity across their eight orders of magnitude in size, from viruses to zooplankton. With new instruments and sensors we now have the capacity to include measurements of many biological EOVs, to enable assessment of EBVs and ECVs. Broadening global programs to include biological information will fill critical gaps in our knowledge of ecosystem function and dynamics, and improve our ability to forecast the system response for evidence-based policy making and management of coastal and marine systems. Increasing biological observations is a key recommendation for many scientific and applied programs that wish to produce a comprehensive in-situ multidisciplinary suit of measurements [e.g., biogeochemical (BGC)-Argo: Roemmich et al. (2019), Continuous Plankton Recorder surveys: Batten et al. (2019), and satellite remote sensing: Groom et al. (2019)]. Such observations, the value of which were recently summarized and reviewed in Chavez et al. (2021a) and Estes et al. (2021), will assist in better characterizing and explaining synoptic changes of life in the ocean as well as contribute to the design and implementation of an ocean health index [Duarte et al. (2018)].
In this review we outline a selection of measurements of biological variables necessary to study the links with ocean physics and chemistry, and allow the assessment of ecosystem function and health. This review proposes the implementation of technologies and methods that can be deployed today at a modest cost and significant benefit, to complement programs and projects operated on national and institutional fixed location time series stations. The recommendations given here relate to the world’s largest time series coordination network, the OceanSITES program, yet many aspects are transferable to other observing programs. This is especially true for data management aspects.
Extracting the OceanSITES station locations that record “plankton” by making use of the GOOS metadata base OceanOPS (www.ocean-ops.org) reveals that from the more than 300 sites (Figure 1) only 4 sites claim in the metadata that they recorded plankton: the Southern ocean Time Series (SOTS), the Porcupine Abyssal Plain (PAP), the Cape Verde Ocean Observatory mooring (CVOO), and a site in the Weddell Sea (WEDDELAWI). However, making use of the same metadata base the great potential for making use of existing data for plankton observations can also be investigated, for example, at almost all sites an Acoustic Doppler Current Profiler (ADCP) is/has been operated and these data can be used for estimates of zooplankton biomass relevant for studying diurnal migration and carbon pathways [e.g., Behrenfeld et al. (2019); Dwinovantyo et al. (2019)].
The review here focuses on moorings and leaves out the ship-based component of OceanSITES for which recommendations for data collections have been outlined by the SCOR working group 154 in a recent report on GO-SHIP research vessel operations [SCOR-WG-154 (2020)]. Moorings are unattended tethered autonomous structures used as platforms for data collection in a fixed-location reference system. While our recommendations are useful for other time-series efforts, a wider set of measurements may be possible for other platforms [e.g., Lombard et al. (2019)]. OceanSITES have autonomous operation of instrumentation that is uninterrupted over long time periods, often more than a year. Stitching together of these deployment periods generates data series that span several decades at some locations.
Salient differences relative to the ship data coordination network GO-SHIP include the frequency of measurements at a given location (e.g. hourly to decades for OceanSITES, vs years to decades for GO-SHIP), availability of technical expertise on site to troubleshoot problems during measurement (not available on OceanSITES), power and data transmission (limited at OceanSITES), and quality assurance methodology (calibration procedures available on OceanSITES are typically limited to pre- and post-deployment only).
1.2.1 Key Science Questions That Augmented Plankton Data Will Answer
To motivate this review we provide some key questions upcoming measurements of plankton on fixed platforms would help answer:
• How do biological diversity, composition and biomass vary among environments and in relation to environmental parameters?
• In turn, how do changes in biological communities modify environmental biogeochemical parameters?
• How much biological variability as a function of time and space is there in the meso- and bathy-pelagic regions and how coupled is it to the surface ecology?
• To what degree can community composition be predicted from environmental variables?
• To what degree do predator-prey interactions, parasitism, mutualism and other ecological processes determine community composition?
• How do ocean deoxygenation, acidification and warming affect the abundance, composition, diversity, succession and function of organisms in the ocean and what are the biological feedbacks that affect these biogeochemical processes?
These questions will not be answered based on measurements at a single site or over a single deployment. The accumulation of biological data over years and at many (contrasting) sites will provide the data and insights needed to address them.
1.3 Objectives
The purpose of this review is to provide the information necessary to incorporate routine biological and biologically-relevant measurements on OceanSITES and similar moorings programs. We provide an inventory of validated plankton-related measurements and commercial sensors that are ready to be implemented/installed on moorings, describe the associated effort involved (costs of sensor, bandwidth of data, power requirements), and present the existing data-dissemination infrastructure for such data. Specifically, we provide:
• Justification for the need for biologically relevant EOV measurements.
• A description of existing technology and associated protocols.
• A detailed cost analysis.
• An implementation strategy.
• An example of two mooring-based programs, one in the Southern Ocean and the other in the Arctic Ocean.
We deliberately limit consideration to technologies that are commercially available and which are documented in publications and protocols from groups other than their inventors or manufacturers. This is an important indicator for technology readiness level (TRL5). There are many technologies not documented here that are working toward a higher TRL, but have not yet achieved it. We recommend that there is a process in place to update the recommended measurements as novel sensing techniques and specific sensors mature. We also recommended that before adopting any technology, including the ones described here, users comb the literature of papers by groups not associated with the developer of technology, as success by them is a testimony of a high TRL. Of particular utility would be the documentation and use of standard operating practices and best practices as part of the Ocean Best Practices System of the IOC6.
1.4 Organization of this Review
We recognize and assess six categories of measurements: bio-acoustics, bio-optics, imaging systems, flow cytometry, genetics, and elemental analysis.
We consider the pros and cons of two modes of sample and information collection:
• 1. collection of data with automated sensors and,
• 2. collection and analysis of water samples.
We have built on and extended a recent review by Lombard et al. (2019), which advocated a holistic approach to plankton sampling and detailed a comprehensive strategy to achieve it. Another review of note is that of Wang et al. (2019), which focused on cost-effective in-situ sensing technologies.
Many of the sensors we present measure proxies of biological properties (e.g., using acoustic backscattering to estimate zooplankton biomass, fluorescence for chlorophyll a) as opposed to a biological property (e.g., a gene or a photo of an organism allowing its identification). It is critical that these proxies be ‘calibrated’ with in-situ collected samples to establish that the proxy relationships applied are reasonable and with known uncertainties. These observations (e.g., net tows to calibrate bio-acoustics, High Performance Liquid Chromatography (HPLC) samples to calibrate chlorophyll fluorometers) can be taken when moorings are deployed, serviced and/or retrieved.
There are a variety of relatively mature biogeochemical sensors (e.g., for nitrate, oxygen and pH) that are useful to constrain rates of biological productivity (whether by phytoplankton or at the community level). While we do not review them here, we strongly recommend their deployment along with biological sensors, as their synergy provides more than the contribution from each individual technology [e.g. Briggs et al. (2018)].
At the end of the review we present two mooring-based programs that have had success measuring a variety of physical, biogeochemical and biological parameters. We encourage readers to consider their successes and the groundbreaking nature of the range of questions they answer.
2 Sampling Modes and Configurations: An Overview
2.1 Sensor Systems
2.1.1 Sensor Depth Consideration
Sensors are typically integrated into a suite of instruments mounted either on the mooring wire or in a cage mounted on the mooring wire. Devices also exist to mount sensors onto moored profiling platforms [e.g. McLane profiler, Seacycler, Send et al. (2013)]. The advantage of a profiling instrumented platform is that the same suite of sensors makes measurements at all depths, such that observed vertical gradients in a property are independent of sensor drift. However, increased spatial resolution comes at the cost of temporal resolution. Furthermore, it is important to consider that the long response time of some sensors (several minutes) requires a sufficiently slow profiling time over the water column. Sensors at a fixed nominal depth, on the other hand, can sample at sufficient frequency to capture temporal gradients created by the advection of anomalies. However, to ensure that signals from different depth horizons are comparable, intercalibration between fixed-depth sensors is required. An additional advantage of multiple sensors at fixed depths is greater redundancy than is achievable with profiling systems (e.g., in case of sensor failure).
Notably, even fixed-depth sensors can undergo changes in depth as all moorings are affected by mooring knock-down due to the impact of ocean currents on the infrastructure. Mooring knock-down can be small (a couple of meters) in cases where large surface buoys are used to tether the mooring at the surface; for example, the tropical moored arrays and air/sea reference sites are equipped with such buoys. However, for subsurface moorings, the knock-down can be substantial and several hundreds of meters; for example, when energetic mesoscale eddies cross the mooring. Instruments mounted closer to the surface will thus experience higher depth amplitude fluctuations, which need to be considered not only when interpreting the data but also for design and in the context of the depth rating of the instrument being deployed. A mooring simulation (e.g. Gobat and Grosenbaugh 2000) that is as realistic as possible is recommended for the design of the mooring itself and for all individual instruments. That being said, moderate mooring knock-down (e.g. from tidal currents) can eventually even provide additional spatial context, introducing “profiler” capabilities.
Specific depth choice for sensors should be based on variability expected and hence the information gained. A sensor at a depth with larger variance in time provides more information than one at a depth with little variance. Similarly, the depth horizon represented by a sensor located at a fixed depth varies based on its position in the water column; e.g. vertical variance in phytoplankton properties is weak within the surface mixed-layer increases below the base of the mixed layer and decreases again below the euphotic depth. Given that these depth horizons are not fixed in time, simulating seasonal variability is likely to help optimally position sensors.
2.1.2 Biofouling Considerations
The ocean is a challenging chemical and biological environment for sensor deployment. A variety of strategies have been devised to cope with this environment [see Manov et al. (2004); Delauney et al. (2010)], which we do not review here. It is critical, particularly for measurements in the sunlit and warmer ocean, that significant efforts are made to minimize biofouling, as the effect on measurements and measurement systems can be significant and rapid and can ultimately render the data unusable. Understanding bio-fouling is critical to schedule appropriately for mooring servicing, as well as to diagnose when it affects measurements.
2.1.3 Artificial Reef Effect
Structures moored in the ocean attract fish (and fishers) and hence affect, to some degree, the environment they sample. In addition, some optical sensors attract organisms to them via the light they emit [e.g. Tanaka et al. (2019); Haëntjens et al. (2020)]. It is therefore important to sample such sensors in bursts rather than continuously so as to reduce the potential to induce behaviors in surrounding organisms that will introduce spurious signals to the data.
2.2 Discrete Water Sampling
Specialized systems for collecting physical samples (filters or water) on moorings exist (e.g., McLane and technicap samplers7). These systems can collect sinking particles (e.g., sediment traps) or filter particles from a known amount of pumped water. For applications such as sediment traps, fixatives are necessary to avoid sample degradation. But note that care must be taken in choice of fixative [e.g. Knauer et al. (1984); Lee et al. (1992); Pohl et al. (2004); Antia (2005)]. The major limitation of these systems is the small number of physical samples one can obtain (typically up to 36 per deployment) thus limiting temporal resolution. They can be very useful, for example, when evaluating or creating a local proxy relationship between what is being sensed (e.g., optical backscattering) and the parameter of interest (e.g., particulate organic matter). Positioning of such collectors depends on specific questions of interest.
3 Autonomous Sensors for Moored Applications
3.1 Bio-Acoustics
Acoustic methods can reveal information about the spatial distribution and temporal dynamics of zooplankton and even larger organisms (micronecton). For example, echo sounders led to the discoveries of the diel vertical migration of plankton and micronekton [Johnson (1948)] and their ubiquitous and dense but previously hidden aggregations [Cheriton et al. (2007)]. The ability of acoustic tools to simultaneously assess animals ranging from sub-millimeter to a meter in size allows ecological processes in the plankton to be examined when appropriate acoustic frequencies are chosen. However, this ability also highlights a key challenge — separating animal types and accurately assessing their biomass. While these approaches have long been used for fish stock assessment and management of a number of species [Maclennan and Simmonds (1992)], they are typically more challenging for zooplankton assessment. This is because of the dramatic differences in body size, species composition, elastic properties and orientation, which markedly influence the acoustic reflectivity or target strength of zooplankton [Holliday et al. (1989)]. Coupled with the diversity of typical zooplankton communities, separation of taxa and assessment of biomass have significant uncertainties.
Nonetheless, many important insights into zooplankton behavior and distribution have come from creative integration of acoustics with multiple, complementary sampling devices including nets, optics, imaging and animal tagging that take advantage of the different strengths of each approach and fill in the gaps where necessary [see reviews by Benoit-Bird and Lawson (2016), and Wiebe and Benfield (2003)]. Multi-sensor fusion efforts such as these have the potential for wider application through the use of autonomous or profiling platforms, which can resolve the issue of limited range for high frequency acoustics, as sound propagation in the ocean decreases with frequency. For detection of organisms emitting sound such as whales and dolphins, passive acoustic devices can and are deployed on moorings [e.g. Baumgartner et al. (2019)] but are not further discussed here.
Mooring-mounted bio-acoustic sensors typically come in two flavors, quantitative echo sounders and Acoustic Doppler Current Profilers, as summarized below.
3.1.1 Quantitative Echo Sounders
Multi-frequency quantitative echo sounders are calibrated sensors designed to insonify a volume of the water column to obtain quantitative information about organisms through acoustic backscatter. The use of different frequencies makes it possible to obtain more information on the underlying plankton beyond concentration [e.g. Lavery et al. (2007)]. Additionally, the more independent information is measured about the organisms in the water (e.g., from moored imaging systems and nets when servicing), the better the inversion can be carried out to estimate biomass [Berger et al. (2018)].
3.1.2 Acoustic Doppler Current Profilers – ADCPs
Single frequency ADCPs are primarily designed to obtain water velocity by combining Doppler shifts along 3 or more discrete beams. Considering the theoretical energy loss along the acoustic beam, and characteristics of the individual ADCP devices, the volume backscatter (Sv) in dB can be estimated from the backscatter intensity records. Although Sv signals are not exclusively linked to zooplankton biomass, further analysis (e.g., the diurnal variations in vertical maxima in Sv) has been useful in investigating zooplankton migration [Maclennan et al. (2002); Gostiaux and van Haren (2010); Mullison (2019); Behrenfeld et al. (2019); Dwinovantyo et al. (2019); Tanaka et al. (2021)]. Through calibration of Sv with in-situ plankton observations (e.g., imaging), ADCPs produce quantitative estimates of biomass that can be related across vessels and over time. Data can be recorded with temporal resolution of seconds and can cover a depth range from a few meters with high vertical resolution (centimeters) with the highest frequency ADCPs, to more than 1500 m depth with low-frequency systems and coarser resolution (>25m). ADCPs are typically deployed either down- or upward looking to maximize their depth coverage. The specific orientation depends on the depth horizon of interest, avoiding measuring the ocean surface or bottom and mooring-specific structure (e.g. proximity to external batteries).
3.2 Bio-Optics
Optical devices can provide high-resolution descriptions of particle abundance, size, and type and have become increasingly attractive as they become more affordable and technically more feasible [Giering et al. (2020)]. Similar to acoustic sensors, optical measurements are best used with complementary sampling approaches for biological EOVs. Measurements of the optical characteristics of water in-situ have been used for decades [e.g., Gardner et al. (2018)] to characterize bulk properties associated with micrometer-size particles in general and phytoplankton in particular (near-forward scattering and analysis of signal fluctuations extends this range to a few 100s μm). Optical sensors are sensitive to bio-fouling and special care needs to be applied to keep them clean [Manov et al. (2004)]. Typically, copper shutters, copper tape and copper tubing are used. Fouling is often worst in sunlit and/or warm waters. All sensor types introduced in this section have versions that can be deployed to 6000 m depth. Manuals for quality control of near-real time optical data have been published [e.g. Bushnell et al. (2017)].
3.2.1 Fluorometers
In vivo fluorescence as a proxy for chlorophyll concentration has been widely used since its introduction [Lorenzen (1966)]as a rapid, cost effective, and reliable technique for studying phytoplankton distribution. However, fluorescence is sensitive to quenching (a physiological down regulation under high incident irradiance), which can result in underestimation of daytime derived chlorophyll if uncorrected. Multiple excitation-emission fluorometers, can provide information on pigments beyond chlorophyll a and to provide estimates of phytoplankton functional groups [Beutler et al. (2002); Proctor and Roesler (2010)]. These measurements are, however, best combined with biological EOVs that provide biomass and diversity observations, as fluorescence observations are difficult to interpret quantitatively due to a number of factors, including the physiology and diversity of the phytoplankton community [Roesler et al. (2017)]. Fluorometers having a variable excitation protocol (named fast repetition rate fluorometers, or FRRF), have been deployed on moorings [e.g. Fujiki et al. (2008)] to provide, in addition to pigment concentration, an assessment of phytoplantkon photo-physiology and productivity parameters. Their ability to constrain primary production is, however, still limited [e.g. Robinson et al. (2014)].
3.2.2 Optical Scattering Sensors
Backscattering sensors have been used since the 1990s as proxies of particulate material concentrations. These techniques are useful as proxies of POC in general [Cetinić et al. (2012)] and phytoplankton carbon in particular [Graff et al. (2015)]. If measured at multiple wavelengths that are not strongly affected by particulate absorption, they can provide a size proxy for micron-sized particles. Combined with chlorophyll fluorescence, the backscattering signal provides physiological information on phytoplankton chlorophyll-to-carbon ratio, and at relatively constant light regime, information about phytoplankton community composition [Cetinić et al. (2015)]. High frequency fluctuations in the signal (spikes) can be used to estimate the size of rare large particles passing through the instrument’s beam [Briggs et al. (2013)].
The Light In-situ Scattering and Transmission instrument (LISST, Sequoia Scientific), measures near-forward scattering and transmission and has been used since the 1990s to size particles between ~ 1-250 μm particularly in sedimentology applications [Traykovski et al. (1999)]. Such information in the upper ocean is useful for studying species succession and harmful algal blooms [HABs, Ahn and Grant (2007)]. Short path length and sensitivity to ambient light makes this instrument not ideal to near-surface, clear-water (i.e., low particle concentration) deployments [Reynolds et al. (2010)] though consistent measurements have been collected in such conditions [Barone et al. (2015)]. To date, the LISST has not been deployed at fixed-point locations for periods longer than a few months.
3.2.3 Absorption and Attenuation Sensors
Measurements of beam transmission at one wavelength near 660 nm have been conducted with commercial sensors since the 1980s to provide a rapid assessment of water quality and the amount of particles in the water column [Gardner et al. (2018)]. The measurements are simple to perform, but may require significant calibration and quality control effort in oceanic waters where the concentration of particles is very low. Transmissometer measurements provide a proxy for particulate organic matter and phytoplankton [Behrenfeld and Boss (2006)].
Spectral absorption and attenuation sensors (Sea-Bird AC-9 and AC-s) have been deployed successfully on moorings [Roesler and Boss (2008)], although significant efforts need to be applied to remove inherent sensor drift. Data provide information on the dominant phytoplankton groups [Roesler and Boss (2008)] and can be used to derive some pigment groups [Chase et al. (2013)]. Such sensors have been regularly deployed on OOI8 moorings, however, no evaluation of these data has been published.
3.2.4 Spectral Radiometers and PAR Sensors
Sensors, measuring the downwelling photosynthetically active radiation (PAR), have been used regularly as part of a weather station on top of moorings and just below the surface. This measurement is a critical input to phytoplankton productivity and photo-physiological models. Spectral radiometers, if deployed on a profiling system or at several depths, can provide an estimate of the spectral diffuse attenuation in the water, which can be inverted to obtain phytoplankton absorption [Huot et al. (2007)], and in the process delineating the phytoplankton pigment and colored dissolved organic material distribution, as well as obtaining the depth of the productive layer.
3.3 Imaging
Imaging is challenging to do on moorings due to potential for biofouling, power requirements, and data rate typically associated with such sensors. As such, they are optimally deployed on a cabled observatory. However, a recent successful long-term deployment on a mooring has been achieved [Picheral et al. (2022)] opening an avenue for wider utilization. A practical overview of the challenges and potential of using imaging instruments to measure particles in the ocean is provided in Giering et al. (2020).
3.3.1 In Situ Cameras
The Underwater Vision Profiler 6s [UVP, Picheral et al. (2022)]operates a 5 Mpixels CMOS monochrome image sensor (Sony IMX264) imaging a field of view of ~ 0.7 liter of water. The UVP sizes marine snow aggregates > 70 μm and images plankton > 500 μm. To date it has been deployed successfully on a mooring (including under ice) for a period of 10 months [Picheral et al. (2022)].
3.3.2 Holographic Cameras
Several new commercial holographic cameras systems have been developed and deployed successfully [Nayak et al. (2021)]. Two commercial sensors are the HoloSea (4Deep) and LISST-holo2 (Sequoia Scientific Inc.), both of which can be used to reconstruct images of objects sized from a few micrometers to millimeters.
3.3.3 Imaging-in-Flow Cytometry
The Imaging FlowCytobot (IFCB, McLane Labs) is an integrated flow cell and camera system that acquires in-focus images of nano- and microplankton, as well as other similar sized particles, as they are pumped past the sensor [Sosik and Olson (2007); Peakock et al. (2014); Hunter-Cevera et al. (2014)]. IFCB images can be used to derive concentration and biodiversity information, as well as organism-specific size, shape, fluorescence and scattering. This instrument has been routinely deployed for periods of 6 months or longer [Peakock et al. (2014)9]. IFCB is currently rated to 30m depth and takes about 25 min to image one 5-ml sample. While most deployments to date have been at sites with high bandwidth communication, onboard storage of images is possible for a year or more given typical open ocean data rates. IFCB has been successfully and repeatedly deployed for months on a solar-powered mooring off Southern California [Kahru et al. (2021)10].
3.4 In-Situ Flow Cytometry
The Cytosub (CytoBuoy b.v.) is an automated submersible flow cytometer specially designed to analyze aquatic microbes from 0.1 μm to 4 mm in length and up to 1.3 mm in width. It can record forward- and side-scattered light intensities, and several wavelengths of fluorescence, as well as detect curvature and polarized light. Cytosub records the entire optical profiles as the particles flow through the laser beam, generating an optical fingerprint of each particle (from cells to colonies). An in-flow imaging device also captures pictures of some targeted cells. Cytosub is rated to 200m and designed to perform sampling and analysis up to several times per hour (typically every 20 to 30 min). An example application on a coastal mooring can be found in Pereira et al. (2016).
3.5 Automatic Genetic Sampler
The Environmental Sample Processor (ESP, McLane Labs) provides in situ collection and analysis of water samples from the subsurface ocean. The instrument is an electromechanical/fluidic system designed to collect discrete water samples, concentrate microorganisms or particles, and automate application of molecular probes that identify microorganisms and their gene products [Scholin et al. (2009)]. It has been deployed on a mooring with bi-monthly turnarounds of the sampler for over three years, to detect, in near real time, HABs [Moore et al. (2021)].
4 Discrete Sample Analysis
Quantitative estimates of plankton biomass and community composition, including micro- and mesozooplankton, photosynthetic pico-, nano- and micro-phytoplankton, heterotrophic bacteria and eukaryotes, and viruses, as well as their genetic composition and metabolic function, are all fundamental to characterizing life in the ocean and how it is changing. Discrete sampling as described below requires a system that collects the sample and preserves it on a mooring and is limited by the volume sampled to relatively small organisms (e.g., phytoplankton, bacteria). Most studies in this area have focused on HABs (given their large economic impact) and, by using sediment traps, on particle fluxes to study the biological carbon pump. Because samples are kept for a long time, a fixative must be used for preservation to avoid degradation and respiration of the sampled materials, further affecting the types of analyses that are possible (in addition, the fixative may affect differently preserved organisms). Furthermore, such samples can be collected during deployment and recovery of the moored systems to obtain proxy relations to measurements done on the mooring for the purpose of calibration and qualification of these measurements.
4.1 Elemental Analysis
Total suspended matter in the upper open ocean, as well as the flux of material to depth, is dominated by plankton-derived particles, such as marine aggregates. The analysis of particulate inorganic carbon, organic carbon, phosphorus, nitrogen, and silicate (including their isotopic composition) associated with bulk particulate samples retained on a filter provides essential descriptors of the dynamics of such particles. The associated methods have been tested and refined for decades [e.g., Honda et al. (2006)].
4.2 Genetics
Analysing the genetic sequences contained within filtered samples has revolutionized our understanding of planktonic diversity and function [see reviews by Pedrós-Alió et al. (2018) and Chavez et al. (2021b)]. High throughput sequencing provides relatively cost-effective and fast sequencing of DNA and RNA and more genetic information is being extracted as techniques evolve and mature. Sequencing of DNA (the genes of marine organisms) gives information on which organisms are present in a sample [Rusch et al. (2007)]. RNA (the transcripts of genes, produced when a specific gene is active) can give information on the activity of key processes [e.g., nutrient uptake, Carradec et al. (2018)]. Because sequencing techniques are evolving quickly, extra samples are often stored on filters at -80°C for future analysis. Preservation of samples is thus critical to enable application of future techniques on archived samples [Pesant et al. (2015)].
Finally, genetic sequences only yield their valuable information through statistical comparison with known sequences, a process known as bioinformatics. The development of bioinformatics techniques is complex and ongoing, but bioinformatics skills should be integrated with existing knowledge and approaches (e.g., isolation, taxonomy and image identification) in research labs, otherwise analyses may become biased if the natural world is explored only through sequences and in silico approaches [Pedrós-Alió et al. (2018)].
4.3. Imaging and Enumeration of Individual Organisms and Other Particles in Discrete Water Samples
4.3.1 Flow Cytometry
Flow cytometry enumerates particles in suspension and characterizes their fluorescence and light scattering properties. Individual particles are measured “in flow” as they pass through a focused light source (usually one or several laser beams). Combinations of fluorescence and scattering signals can be analyzed to distinguish photosynthetic cells such as Prochlorococcus, Synechococcus, Cryptophytes, or functional groups such as eukaryotic picophytoplankton, and nanophytoplankton. With the addition of a nucleic acid stain to samples at the time of analysis, it is also possible to routinely enumerate heterotrophic prokaryotes. More specialized analyses with stains can also be used for viruses and microzooplankton, or to assess cell viability.
4.3.2 Microscopy
Traditional microscopic analysis of preserved samples (often with low-acidity glutaraldehyde) allows for the enumeration and characterization of moderate to large size phytoplankton in samples preserved from automated samplers [e.g. McGillicuddy et al. (2014); Eriksen et al. (2018); Blain et al. (2021)]. It is still considered a gold standard for information about community structure but manual microscopy is time consuming and hence expensive to obtain statistically meaningful assessments.
5 Costs and Benefits of Proposed Measurements
We summarize the salient logistic considerations and resource requirements associated with the measurements we advocate for OceanSITES moorings in Table 1. All measurements proposed here have a history of being made on moorings, though not all have been deployed for a full year. A holistic sampling effort would ideally include all measurements in the list. However, each mooring will have different logistical details, so we include a consideration of the key constraints below. Note that costs associated with mooring deployment, recovery and maintenance are not included.
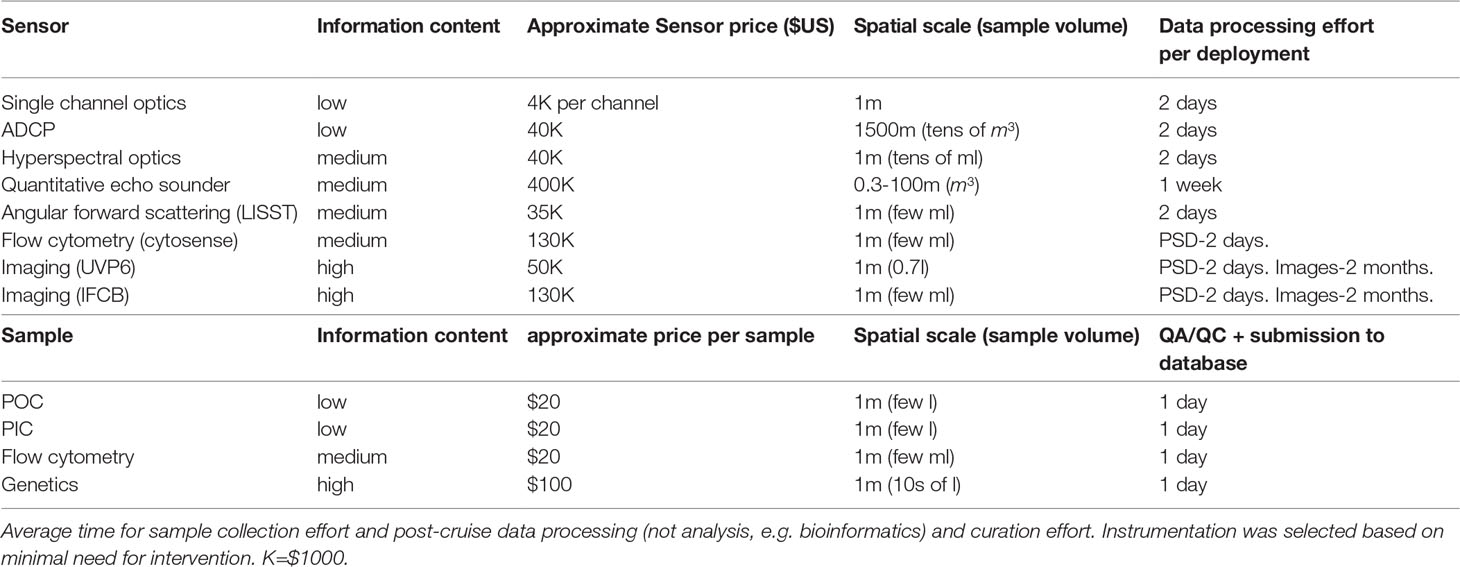
Table 1 Information content generated under OceanSITES sampling, price (approximate, not including accessories), sampling mode (and hence density of sampling), spatial scale (vertical or horizontal depending on sampling mode) and approximate volume inquired per sample.
The assignment of “information content” is intended to reflect the breadth of biological information provided by a single measurement. For example, POC or 1-channel optics gives information on concentration alone, while genetics and images yield information about diversity and community composition.
6 Data Management and Data Access
OceanSITES has a strong data management component as part of its global coordination and that aims to harmonize the underlying national and institutional data archiving techniques - a process that is key to arrive at FAIR data. Closely linked to the data archiving are efforts to harmonize the metadata vocabularies used by the various site operators the respective data managers. To enable the integration of biological data into the OceanSITES network, it is important to first present the elements and conventions of the OceanSITES data system.
OceanSITES focus in on high quality climate data and therefore requires comprehensive data quality control on the recordings after the instruments are recovered from sea. Access to real-time data at many OceanSITES stations (e.g. tropical moored arrays such as PIRATA or RAMA) falls under the category met/ocean data and is coordinated by a sister network, the Data Buoy Cooperation Panel (DBCP). However, DBCP has a clear focus on ocean/lower atmosphere physics and here a gap may exists on real-time access to non-physics data. This is particularly evident considering the new technology outlined in this review. Real-time access to data from moored time series stations may serve different needs such as data safety (e.g. loss of instruments before recovery), data use (e.g. enable analysis or operational system use right away and without the latency of more than a year typical moorings are in the water for), and adaptive sampling (e.g. increase sampling frequency during an event such as a storm). Enabling access to real-time data requires advanced mooring technology. A surface element is required for data transmission (this could also be an autonomous surface vehicle). The transmission of data from different depths to the surface is often done by means of inductive data transmission via the mooring wire or also by underwater acoustics. Proven technologies exist [e.g., Frye et al. (2001); Farr et al. (2010); Alford et al. (2015)], but the costs and risks of implementation must be carefully weighed for individual applications (Bailey et al., 2019).
For data storage OceanSITES recommends the use of the NetCDF (Network Common Data Form) file format and using the Climate and Forecast Metadata Convention (CF) [OceanSITES (2020)]. One driver for this recommendation is that such files are self-describing and can (and should) include all the relevant metadata. The NetCDF files should follow filename conventions [OceanSITES (2020)] to ease access and discovery via the OceanSITES Global Data Assembly Centre (GDAC) that can be entered via Ifremer, France11 or the National Data Bouy Centre (NDBC), US12. The GDAC provides access to raw data, quality controlled time series data (structured by deployment period and site), and gridded time series data products (structured by site, variable, and eventually period). Recently OceanSITES began implementing an Environmental Research Division’s Data Access Program [ERDDAP; Simons and Mendelssohn (2012)] server for distributed data access.
OceanSITES encourages use of standardized instrument names in the netCDF files following the SeaVOX vocabulary13. The vocabulary combines machine readable code with standard human readable instrument names. SeaVOX follows an open architecture. It allows adding of new instruments and sensors14. Mapping examples for instruments discussed in this document are provided below in Table 2.
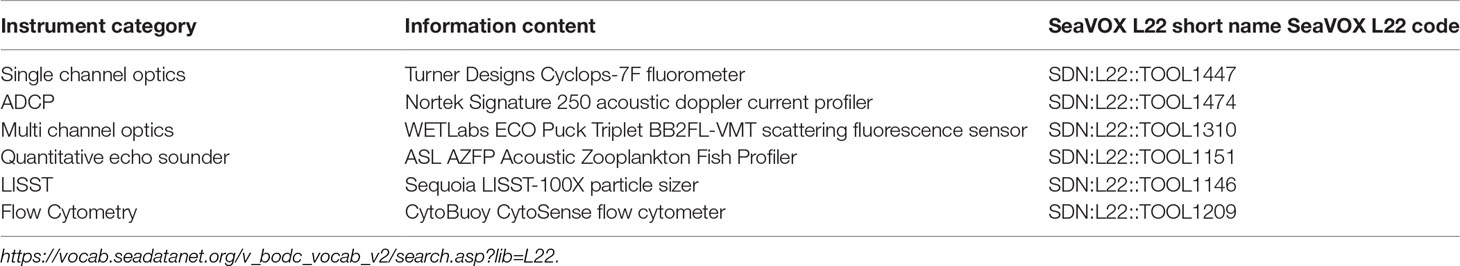
Table 2 Examples of vocabulary standards for OceanSITES instrumentation curated by the SeaVOX Vocab Library.
However, it is evident by visiting the OceanSITES GDAC that only part of the data and data products from the sites are provided to the GDAC. For example no plankton data could be found on the GDAC as for now. One reason could have to do with the requirements OceanSITES places on data providers, in particular the metadata vocabularies to be used and the NetCDF file format. The Marine Biodiversity Observation Network (MBON), the Global Ocean Observing System Bio-Eco Panel, and the Ocean Biodiversity Information System (OBIS) have recommended the use of standardized data processing protocols and data workflows for biological EOVs. Specifically, this SCOR WG recommends that OceanSITES adopt and implement the Darwin Core data standard [Wieczorek et al. (2012); De Pooter et al. (2017)] for recording biological information, and as needed ancillary environmental data.
The challenge of providing FAIR data is especially faced by networks that are not based on a global design but on national/institutional monitoring activities linked only by global coordination (e.g. OceanGldiers, GO-SHIP, DBPC moorings). Here we see a task for the OCG of GOOS that could facilitate the dialogue, for example, with OBIS to implement the Darwin code into the data schemes of the observation networks (including OceanSITES) and make data conform to the FAIR Guiding Principles and accessible to OBIS upon publication.
7 Case Studies in Integration of Plankton Measurements on Mooring Programs
Here we highlight two mooring-based observation systems from high-latitude oceans. The success of these time-series in remote regions that are particularly inhospitable demonstrates that success is achievable in most of the world’s ocean.
7.1 The Southern Ocean Time Series (SOTS)
SOTS15 currently consists of a set of two moorings in the Subantarctic Southern Ocean, 500km southwest of Tasmania near 141° E and 47° S. The moorings are serviced annually. Deployments began in 1997 with the installation of a deep ocean sediment trap mooring. In 2006, the program was expanded to include surface measurements. The Subantarctic Zone (SAZ) mooring collects sinking particles into rotating-carousel conical sediment traps at nominal depths of 1000m, 2000m, and 3800m, and also has sensors for deep ocean currents, temperature and salinity. The Southern Ocean air-sea flux mooring (SOFS) has a large surface float with a meteorological tower, as well as oceanic instruments arrayed along the mooring line in the upper ocean. It supports a wide range of sensors in the atmosphere, including insolation (shortwave, longwave, PAR, and specific frequencies matched to satellite ocean color remote sensing), winds, air temperature and humidity, and rainfall. In the ocean, measurements are made for surface waves, currents, temperature, salinity, oxygen, total gas tension, pCO2 (in air and water), nitrate, chlorophyll fluorescence, optical backscattering, spectral downwellingand PAR attenuation, and multi-frequency time-resolved profiling of acoustic backscatter to several hundred meters depth. In addition, a modified Mclane RAS-500 sampler and a custom-built trace metal clean sampler provide time-series collections of surface seawater for additional measurements of nutrients and microscopic identification of phytoplankton. These observations allow a multi-trophic assessment of the interaction between physical, chemical, and ecological processes. These sensors are used to characterize biological activity in multiple ways. The incoming light available for photosynthesis (PAR) is measured with an upward facing sensor on the meteorological tower. The presence of the shortwave insolation sensor, installed to quantify heat fluxes, provides a useful cross-check on any PAR sensor drift. Another upward-facing PAR sensor at 30m depth determines the PAR attenuation. This attenuation offers one means to estimate the abundance of phytoplankton (via correlations of attenuation with ship-collected phytoplankton samples). Phytoplankton biomass is also estimated more directly from chlorophyll-fluorescence sensors (stimulation/emission: 470/695 nm) at 1 and 30m depth. Both approaches have some complexity: the PAR attenuation is influenced by phytoplankton properties and the presence of any non-algal particles, while chlorophyll fluorescence depends on phytoplankton community structure and physiology. Including both PAR and fluorescence sensors allows some assessment of these effects, and this is further improved by a second optical backscattering channel in the fluorescence sensor from which particulate backscattering can be estimated [bbp(700nm)], which can also be used to estimate particulate organic carbon (POC) through correlations with ship-collected POC samples. A 9-wavelengths visible irradiance upward facing sensor is also in the instrument package at 30m depth. It provides attenuation estimates at multiple wavelengths by comparison with an identical sensor on the meteorological tower, including the attenuation coefficient at 490nm [Kd(490)] which allows for comparison with ocean color satellite products, as well as information on phytoplankton community composition via the absorption spectra of their pigments. Comparison with satellite products is furthered via a downward facing (Lu) sensor with the same wavelengths, to determine the water-leaving radiance just below the ocean surface.
By combining the phytoplankton abundance estimates with PAR availability (using mixed layer depth as estimated by temperature loggers along the mooring line) productivity can be estimated. Nitrate limitation is evaluated using an ultraviolet spectrometer installed on the base of the surface float. More complete assessment of nutrient limitation, including from iron and silicate, is enabled by the autonomous collection of seawater samples. Combining results from oxygen and total gas tension (the sum of the partial pressures of N2 and O2) sensors, the biological and physical contributions to surface mixed layer oxygen budgets can be separated to quantify net community production, which represents the balance between the processes that produce biomass (mainly photosynthesis) and those that remove it (bacterial respiration and zooplankton grazing).
Perhaps the most ambitious and exciting biological sensor is the acoustic profiler, which provides a path to estimate zooplankton and higher trophic level abundances and behaviors (e.g. migration). The time-resolved intensity of acoustic backscatter from pulsed kHz frequency-band emissions allows the presence of organisms to be estimated over the top several hundred meters of the water column. Multiple frequency-bands (e.g., 38, 75, 210, 440 kHz) provide some information on organism sizes. The lower frequencies attenuate more slowly and thus can image more of the water column. The higher frequencies are more useful for small organisms such as zooplankton. Several different models, mounting configurations, and pulse regimes have been tested. Each has its challenges. All are limited by battery power. Placing the device in the surface float allows for larger batteries than mounting it deeper in the water column, but air bubbles below the float limit sound penetration. Frequent pulsing (e.g., 15-second intervals) allows zooplankton and fish behavior to be imaged (e.g., their diel cycles of downward migration and its dependence on size (via frequency) including the tracking of individual organisms), but it is difficult to maintain power over an entire year in comparison to less frequent pulsing sufficient to determine seasonal abundance variations. Conversion of the acoustic signatures to biomass estimates is challenging and, as with all variables, is improved by collecting samples (e.g., nets) during ship service visits.
Examples of scientific results from the SAZ mooring deep sediment traps include quantification of bulk fluxes of organic and inorganic carbon, nitrogen, and silicon and their contribution to the global carbon cycle [Trull et al. (2001); Wynn-Edwards et al. (2020)], and examination of seasonal and interannual variations in the abundance of specific taxa [e.g., Roberts et al. (2014); Kloster et al. (2019); Rigual Hernández et al. (2020)]. The SOFS mooring has supported a broad range of sensor-based studies, including quantification of air-sea fluxes of heat, moisture, and CO2 [Schulz et al. (2012); Shadwick et al. (2015)], estimates of net community production obtained by separating physical and biological contributions to oxygen budgets [Weeding and Trull (2014)], and seasonal variations in bio-optical properties, phytoplankton, and the abundance and diel migration of zooplankton and fish [Schallenberg et al. (2019); Trull et al. (2019)]. The surface seawater sample collections have provided information on the seasonal succession of nutrients and phytoplankton Eriksen et al. (2018)] and the levels of dissolved iron that limits phytoplankton production in this region [van der Merwe et al. (2019)]. All of these sensors and samplers have functioned successfully for entire years at sea.
7.2 FRontiers in Arctic Marine Monitoring (FRAM)
Located between Svalbard and Greenland, the primary aim of the open-ocean infrastructure FRAM16 developed by the Alfred Wegener Institute in Bremerhaven, Germany, is permanent fixed-location observation of key variables at sea, from surface to depth, in near-realtime. The FRAM constellation includes moorings, ice-tethered platforms, autonomous underwater vehicles, stationary and mobile benthic platforms with autonomous sensors, samplers, analytical instruments and cameras. Early results from the FRAM observatory have yielded simultaneous assessment of the physical water column structure (stratification, temperature, light), nutrient concentrations, phytoplankton abundance, particulate organic carbon (POC), and mesozooplankton, and have allowed the inference of a number of key fluxes and rates (net community production (O2), zooplankton migration, and fluxes of particles to depth [sediment traps)]. Perhaps most importantly, the FRAM observatory has allowed the continuous observation of fluxes of the biological/biogeochemical pump, and an assessment of the impact of sea ice melt on the physical structure of the water column, with its associated impact on vertical carbon export [von Appen et al. (2021)] and, more locally, the impact of ice melt on the export of carbon released directly from sea-ice [Fadeev et al. (2021)]. The Observatory is supplemented with annual cruises to calibrate mooring sensors data to ship-board measurements [see comparison of ship-board and mooring data in von Appen et al. (2021)]. Recently, a successful ten months long deployment of an in-situ plankton imaging system has been achieved on FRAM [Picheral et al. (2022)]. Data are available through the Alfred Wegener Institute portal17. Details about the technologies being used are available at their web site18.
8 Development of an Implementation Plan
We provide a list of recommendations for the implementation of plankton measurements in the OceanSITES network at scales varying from local to the whole network:
8.1 At the Network Scale
•Perform a OceanSITES network-wide assessment of existing expertise, applications, and experience in plankton observations and taxonomy.
•Further deploy biological expertise to the OceanSITES science committees, in particular in the “Global Ocean Watch” science theme group to achieve a global harmonization of plankton observations from moorings, including the creation of standardized protocols, operation and calibration procedures.
•Curation and taxonomic expertise should be assembled and consulted to ensure data are fully utilized.
•Data management infrastructure is critically important. Data archives exist for all proposed measurements, but in several different repositories. It is important to make sure all are linked, there is appropriate meta-data including terms and units, and that procedures have been reviewed by data specialists.
•OceanSITES should adopt and implement the Darwin Core data standard for recording biological information and relevant ancillary environmental data. Data should conform to the FAIR Guiding Principles and be accessible to OBIS upon publication.
8.2 At the Local Scale
•Step-wise implementation is pragmatic. Start with a limited number of instruments, and increase as skill improves. This will ensure data collected data are high quality, relevant, and follow best-practice protocols, and that data users are invested.
•Sensors not part of routine sampling could be housed at a local expert’s lab when not on moorings so they are used, serviced, and ready to be deployed as needed.
•Communicate with biological user groups engaged in operations at areas near sites that form the network to obtain knowledge on how to further attract local user’s buy-in, interest, and build capacity.
Author Contributions
EB, AW, JK, TT, and FM-K contributed to conception and design of this review and wrote sections of the manuscript. All authors contributed to manuscript revision, read, and approved the submitted version.
Funding
This work was partially supported from funding to SCOR WG 154 (P-OBS) provided by national committees of the Scientific Committee on Oceanic Research (SCOR) and from a grant to SCOR from the U.S. National Science Foundation (OCE-1840868). FM-K acknowledges the support provided for participation by the Marine Biodiversity Observation Network (MBON) sponsored by NASA, NOAA, ONR, BOEM. HS acknowledges support from the Simons Foundation.
Conflict of Interest
The authors declare that the research was conducted in the absence of any commercial or financial relationships that could be construed as a potential conflict of interest.
Publisher’s Note
All claims expressed in this article are solely those of the authors and do not necessarily represent those of their affiliated organizations, or those of the publisher, the editors and the reviewers. Any product that may be evaluated in this article, or claim that may be made by its manufacturer, is not guaranteed or endorsed by the publisher.
Acknowledgments
We would like to thank the Scientific Committee on Oceanic Research for funding WG154 Integration of Plankton-Observing Sensor Systems to Existing Global Sampling Programs (P-OBS). Particularly we would like to thank Patricia Miloslavich who has shepherded our SCOR working group from its inception and contributed significantly to all of our activities. We would like to thanks subject expert that have contributed to this report; they include Raquel Somavilla, Ryan Downie, Peter Gaube, Rudy Kloser, Wu-Jung Lee, Mei Sato, Chris Bassett, Collin Roesler, Josep M. Gasol, Ramon Massana, Isabel Ferrera, and Marta Sebastian, as well as additional members of our SCOR WG: Herve Claustre, Marcela Cornejo, Jorgen Berg and Bernadette Sloyan. Comments by two reviewers significantly improved this manuscript.
Footnotes
- ^ http://www.oceansites.org.
- ^ https://www.goosocean.org/index.php?option=com_content&view=article&id=14&Itemid=114.
- ^ https://geobon.org/ebvs/what-are-ebvs.
- ^ https://public.wmo.int/en/programmes/global-climate-observing-system/essential-climate-variables.
- ^ https://www.nasa.gov/pdf/458490main_TRL_Definitions.pdf.
- ^ https://www.oceanbestpractices.org.
- ^ https://mclanelabs.com/, http://www.technicap.com.
- ^ https://oceanobservatories.org/.
- ^ https://ifcb-data.whoi.edu/timeline?dataset=mvco&bin=D20170428T160804_IFCB010.
- ^ https://ifcb-data.whoi.edu/SIO_Delmar_mooring.
- ^ http://tds0.ifremer.fr/thredds/CORIOLIS-OCEANSITES-GDAC-OBS/CORIOLIS-OCEANSITES-GDAC-OBS.html.
- ^ https://dods.ndbc.noaa.gov/oceansites/.
- ^ https://www.bodc.ac.uk/resources/vocabularies/seavox/.
- ^ https://github.com/nvs-vocabs/L22.
- ^ https://imos.org.au/facilities/deepwatermoorings/sots.
- ^ https://www.awi.de/en/expedition/observatories/ocean-fram.html.
- ^ https://www.awi.de/en/expedition/observatories/ocean-fram/fram-data-integration.html.
- ^ https://www.awi.de/en/expedition/observatories/ocean-fram/fram-geraete-en.html.
References
Ahn J. H., Grant S. B. (2007). Size Distribution, Sources, and Seasonality of Suspended Particles in Southern California Marine Bathing Waters. Environ. Sci. Technol. 41, 355–367. doi: 10.1021/es061960+
Alford M. H., McGinnis T., Howe B. M. (2015). An inductive charging and real-time communications system for profiling moorings. J. Atmospher. Ocean. Technol. 32, 2243–2252. doi: 10.1175/JTECH-D-15-0103.1
Antia A. N. (2005). Solubilization of Particles in Sediment Traps: Revising the Stoichiometry of Mixed Layer Export. Biogeosciences 2, 189–204. doi: 10.5194/bg-2-189-2005
Bailey K., Steinberg C., Davies C., Galibert G., Hidas M., McManus M. A., et al. (2019). Coastal Mooring Observing Networks and Their Data Products: Recommendations for the Next Decade. Front. Mar. Sci. 6. doi: 10.3389/fmars.2019.00180
Barone B., Bidigare R. R., Church M. J., Karl D. M., Letelier R. M., White A. E. (2015). Particle Distributions and Dynamics in the Euphotic Zone of the North Pacific Subtropical Gyre. J. Geophys. Res.: Ocean. 120, 3229–3247. doi: 10.1002/2015JC010774
Batten S. D., Abu-Alhaija R., Chiba S., Edwards M., Graham G., Jyothibabu R., et al. (2019). A Global Plankton Diversity Monitoring Program. Front. Mar. Sci. 6. doi: 10.3389/fmars.2019.00321
Baumgartner M. F., Bonnell J., Van Parijs S. M., Corkeron P. J., Hotchkin C., Ball K., et al. (2019). Persistent Near Real-Time Passive Acoustic Monitoring for Baleen Whales From a Moored Buoy: System Description and Evaluation. Methods Ecol. Evol. 10, 1476–1489. doi: 10.1111/2041-210X.13244
Behrenfeld M. J., Boss E. (2006). Beam Attenuation and Chlorophyll Concentration as Alternative Optical Indices of Phytoplankton Biomass. J. Mar. Res. 64, 431–451. doi: 10.1357/002224006778189563
Behrenfeld M. J., Boss E. S. (2018). Student’s Tutorial on Bloom Hypotheses in the Context of Phytoplankton Annual Cycles. Global Change Biol. 24, 55–77. doi: 10.1111/gcb.13858
Behrenfeld M. J., Gaube P., Penna A., O’Malley R. T., Burt W. J., Hu Y., et al. (2019). Global Satellite-Observed Daily Vertical Migrations of Ocean Animals. Nature 576, 257–261. doi: 10.1038/s41586-019-1796-9
Behrenfeld M. J., O’Malley R. T., Boss E. S., Westberry T. K., Graff J. R., Halsey K. H., et al. (2016). Revaluating Ocean Warming Impacts on Global Phytoplankton. Nat. Climate Change 6, 207–226. doi: 10.1038/nclimate2838
Benoit-Bird K. J., Lawson G. L. (2016). Ecological Insights From Pelagic Habitats Acquired Using Active Acoustic Techniques. Annu. Rev. Mar. Sci. 8, 463–490. doi: 10.1146/annurev-marine-122414-034001
Berger L., Campanlla F., Chu D., Demer D., De Robertis A., Domokos R., et al. (2018). Acoustic Target Classification (Copenhagen: Tech. rep.). doi: 10.17895/ices.pub.4567
Beutler M., Wiltshire K. H., Meyer B., Moldaenke C., Luring C., Meyerhofer M., et al (2002). A Fluorometric Method for the Differentiation of Algal Populations In Vivo and In Situ. Photosynth. Res. 72, 39–53. doi: 10.1023/A:1016026607048
Blain S., Rembauville M., Crispi O., Obernosterer I. (2021). Synchronized Autonomous Sampling Reveals Coupled Pulses of Biomass and Export of Morphologically Different Diatoms in the Southern Ocean. Limnol. Oceanogr. 66, 753–764. doi: 10.1002/lno.11638
Briggs N., Guomundsson K., Cetinić I., D’Asaro E., Rehm E., Lee C., et al. (2018). A Multi-Method Autonomous Assessment of Primary Productivity and Export Efficiency in the Springtime North Atlantic. Biogeosciences 15, 4515–4532. doi: 10.5194/bg-15-4515-2018
Briggs N. T., Slade W. H., Boss E., Perry M. J. (2013). Method for Estimating Mean Particle Size From High-Frequency Fluctuations in Beam Attenuation or Scattering Measurements. Appl. Opt. 52, 6710–6725. doi: 10.1364/AO.52.006710
Bushnell M., Kinkade C., Worthington H. (2017). Manual for Real-Time Quality Control of Ocean Optics Data: A Guide to Quality Control and Quality Assurance of Coastal and Oceanic Optics Observations. Tech. Rep. doi: 10.25923/v9p8-ft24
Carradec Q., Pelletier E., Da Silva C., Alberti A., Seeleuthner Y., Blanc-Mathieu R., et al. (2018). A Global Ocean Atlas of Eukaryotic Genes. Nat. Commun. 9, 1–13. doi: 10.1038/s41467-017-02342-1
Cetinić I., Perry M. J., Briggs N. T., Kallin E., D’Asaro E. A., Lee C. M. (2012). Particulate Organic Carbon and Inherent Optical Properties During 2008 North Atlantic Bloom Experiment. J. Geophys. Res.: Ocean. 117. doi: 10.1029/2011JC007771
Cetinić I., Perry M. J., D'Asaro E., Briggs N., Poulton N., Sieracki M. E. (2015), A simple optical index shows spatial and temporal heterogeneity in phytoplankton community composition during the2008 north atlantic bloom experiment, Biogeosciences 117, C06028, doi: 10.1029/2011JC007771
Chase A., Boss E., Zaneveld R., Bricaud A., Claustre H., Ras J., et al. (2013). Decomposition of In Situ Particulate Absorption Spectra. Methods Oceanogr. 7, 110–124. doi: 10.1016/j.mio.2014.02.002
Chavez F. P., Miller R. J., Muller-Karger F. E., Iken K., Canonico G., Egan K., et al. (2021a). Mbon—Marine Biodiversity Observation Network: An Observing System for Life in the Sea. Oceanography.24(2), 12–15. doi: 10.5670/oceanog.2021.211
Chavez F. P., Min M., Pitz K., Truelove N., Baker J., LaScala-Grunewald D., et al. (2021b). Observing Life in the Sea Using DNA. Oceanography24(2),102–119. doi: 10.5670/oceanog.2021.218
Cheriton O. M., McManus M. A., Holliday D. V., Greenlaw C. F., Donaghay P. L., Cowles T. J. (2007). Effects of Mesoscale Physical Processes on Thin Zooplankton Layers at Four Sites Along the West Coast of the U.s. Estuaries. Coasts. 30, 575–590. doi: 10.1007/BF02841955
Cronin M. F., Gentemann C. L., Edson J., Ueki I., Bourassa M., Brown S., et al. (2019). Air-Sea Fluxes With a Focus on Heat and Momentum. Front. Mar. Sci. 6. doi: 10.3389/fmars.2019.00430
Delauney L., Compère C., Lehaitre M. (2010). Biofouling Protection for Marine Environmental Sensors. Ocean. Sci. 6, 503–511. doi: 10.5194/os-6-503-2010
De Pooter D, Appeltans W, Bailly N, Bristol S, Deneudt K, Eliezer M, et al. (2017) Toward a New Data Standard for Combined Marine Biological and Environmental Datasets - Expanding OBIS Beyond Species Occurrences. Biodivers Data J. (5), e10989. doi: 10.3897/BDJ.5.e10989. PMID: 28325978; PMCID: PMC5345125.
Duarte C. M., Poiner I., Gunn J. (2018). Perspectives on a Global Observing System to Assess Ocean Health. Front. Mar. Sci. 5. doi: 10.3389/fmars.2018.00265
Dwinovantyo A., Manik H. M., Prartono T., Susilohadi S., Mukai T. (2019). Variation of Zooplankton Mean Volume Backscattering Strength From Moored and Mobile Adcp Instruments for Diel Vertical Migration Observation. Appl. 9(9), 1851, doi: 10.3390/app9091851
Eriksen R., Trull T. W., Davies D., Jansen P., Davidson A. T., Westwood K., et al. (2018). Seasonal Succession of Phytoplankton Community Structure From Autonomous Sampling at the Australian Southern Ocean Time Series (Sots) Observatory. Mar. Ecol. Prog. Ser. 589, 13–31. doi: 10.3354/meps12420
Estes M., Anderson C., Appeltans W., Bax N., Bednaršek N., Canonico G., et al. (2021). Enhanced Monitoring of Life in the Sea is a Critical Component of Conservation Management and Sustainable Economic Growth. Mar. Policy 132, 104699. doi: 10.1016/j.marpol.2021.104699
Everett J. D., Baird M. E., Buchanan P., Bulman C., Davies C., Downie R., et al. (2017). Modeling What We Sample and Sampling What We Model: Challenges for Zooplankton Model Assessment. Front. Mar. Sci. 4. doi: 10.3389/fmars.2017.00077
Fadeev E., Rogge A., Ramondenc S., Nöthig E.-M., Wekerle C., Bienhold C., et al. (2021). Sea Ice Presence is Linked to Higher Carbon Export and Vertical Microbial Connectivity in the Eurasian Arctic Ocean. Commun. Biol. 4, 1–13. doi: 10.1038/s42003-021-02776-w
Farr N., Bowen A., Ware J., Pontbriand C., Tivey M. (2010). An Integrated, Underwater Optical/Acoustic Communications System. OCEANS’10. IEEE SYDNEY. pp. 1–6,. doi: 10.1109/OCEANSSYD.2010.5603510
Fischer A. D., Moberg E. A., Alexander H., Brownlee E. F., Hunter-Cevera K. R., Pitz K. J., et al. (2014). Sixty Years of Sverdrup: A Retrospective of Progress in the Study of Phytoplankton Blooms. Oceanography 27(1), 222–235, doi: 10.5670/oceanog.2014.26
Follett C. L., Dutkiewicz S., Ribalet F., Zakem E., Caron D., Armbrust E. V., et al. (2022). Trophic Interactions With Heterotrophic Bacteria Limit the Range of Prochlorococcus. Proc. Natl. Acad. Sci. 119, e2110993118. doi: 10.1073/pnas.2110993118
Frye D., Kemp J., Paul W., Peters D. (2001). Mooring Developments for Autonomous Ocean-Sampling Networks. IEEE J. Ocean. Eng. 26, 477–486. doi: 10.1109/48.972081
Fujii Y., Rémy E., Zuo H., Oke P., Halliwell G., Gasparin F., et al. (2019). Observing System Evaluation Based on Ocean Data Assimilation and Prediction Systems: On-Going Challenges and a Future Vision for Designing and Supporting Ocean Observational Networks. Front. Mar. Sci. 6. doi: 10.3389/fmars.2019.00417
Fujiki T., Hosaka T., Kimoto H., Ishimaru T., Saino T. (2008). In Situ Observation of Phytoplankton Productivity by an Underwater Profiling Buoy System: Use of Fast Repetition Rate Fluorometry. Mar. Ecol. Prog. Ser. 353, 81–88. doi: 10.3354/meps07151
Gardner W. D., Jo Richardson M., Mishonov A. V., Biscaye P. E. (2018). Global Comparison of Benthic Nepheloid Layers Based on 52 Years of Nephelometer and Transmissometer Measurements. Prog. Oceanogr. 168, 100–111. doi: 10.1016/j.pocean.2018.09.008
Gehlen M., Barciela R., Bertino L., Brasseur P., Butenschön M., Chai F., et al. (2015). Building the Capacity for Forecasting Marine Biogeochemistry and Ecosystems: Recent Advances and Future Developments. J. Operational. Oceanogr. 8, s168–s187. doi: 10.1080/1755876X.2015.1022350
Giering S. L. C., Cavan E. L., Basedow S. L., Briggs N., Burd A. B., Darroch L. J., et al. (2020). Sinking Organic Particles in the Ocean—Flux Estimates From in Situ Optical Devices. Front. Mar. Sci. 6. doi: 10.3389/fmars.2019.00834
Gobat J. I., Grosenbaugh M. A. (2000). WHOI Cable V2.0: Time Domain Numerical Simulation of Moored and Towed Oceanographic Systems. Technical Report WHOI-2000-08 (Woods Hole, MA, USA: Tech. rep.).
Gostiaux L., van Haren H. (2010). Extracting Meaningful Information From Uncalibrated Backscattered Echo Intensity Data. J. Atmospher. Ocean. Technol. 27, 943–949. doi: 10.1175/2009JTECHO704.1
Graff J. R., Westberry T. K., Milligan A. J., Brown M. B., Dall’Olmo G., van Dongen-Vogels V., et al. (2015). Analytical Phytoplankton Carbon Measurements Spanning Diverse Ecosystems. Deep. Sea. Res. Part I.: Oceanographic. Res. Papers. 102, 16–25. doi: 10.1016/j.dsr.2015.04.006
Groom S., Sathyendranath S., Ban Y., Bernard S., Brewin R., Brotas V., et al. (2019). Satellite Ocean Colour: Current Status and Future Perspective. Front. Mar. Sci. 6. doi: 10.3389/fmars.2019.00485
Haëntjens N., Della Penna A., Briggs N., Karp-Boss L., Gaube P., Claustre H., et al. (2020). Detecting Mesopelagic Organisms Using Biogeochemical-Argo Floats. Geophys. Res. Lett. 47, e2019GL086088. doi: 10.1029/2019GL086088
Hoegh-Guldberg O., Cai R., Poloczanska E. S., Brewer P. G., Sundby S., Hilmi K., et al. (2014). “The Ocean,” in Climate Change 2014: Impacts, Adaptation, and Vulnerability. Part B: Regional Aspects. Contribution of Working Group II to the Fifth Assessment Report of the Intergovernmental Panel on Climate Change (Cambridge: Cambridge University Press), 1655–1731. S., P. E.
Holliday D. V., Pieper R. E., Kleppel G. S. (1989). Determination of Zooplankton Size and Distribution With Multifrequency Acoustic Technology. ICES. J. Mar. Sci. 46, 52–61. doi: 10.1093/icesjms/46.1.52
Honda M. C., Kawakami H., Sasaoka K., Watanabe S., Dickey T. (2006). Quick Transport of Primary Produced Organic Carbon to the Ocean Interior. Geophys. Res. Lett., 33, L16603, doi: 10.1029/2006GL026466
Hunter-Cevera K. R., Neubert M. G., Solow A. R., Olson R. J., Shalapyonok A., Sosik H. M. (2014). Diel Size Distributions Reveal Seasonal Growth Dynamics of a Coastal Phytoplankter. Proc. Natl. Acad. Sci. 111, 9852–9857. doi: 10.1073/pnas.1321421111
Huot Y., Brown C. A., Cullen J. J. (2007). Retrieval of Phytoplankton Biomass From Simultaneous Inversion of Reflectance, the Diffuse Attenuation Coefficient, and Sun-Induced Fluorescence in Coastal Waters. J. Geophys. Res., 112, C06013. doi: 10.1029/2006JC003794
Johnson M. H. (1948). Sound as a Tool in Marine Ecology, From Data on Biological Noises and the Deep Scattering Layer. J. Mar. Res. 7, 443–458.
Kahru M., Anderson C., Barton A. D., Carter M. L., Catlett D., Send U., et al. (2021). Satellite Detection of Dinoflagellate Blooms Off California by UV Reflectance Ratios. Elementa: Sci. Anthropocene, 9(1): 00157. doi: 10.1525/elementa.2020.00157
Karsenti E., Acinas S. G., Bork P., Bowler C., De Vargas C., Raes J., et al. (2011). A Holistic Approach to Marine Eco-Systems Biology. PloS Biol. 9, e1001177. doi: 10.1371/journal.pbio.1001177
Kloster M., Rigual-Hernández A. S., Armand L. K., Kauer G., Trull T. W., Beszteri B. (2019). Temporal Changes in Size Distributions of the Southern Ocean Diatom Fragilariopsis Kerguelensis Through High-Throughput Microscopy of Sediment Trap Samples. Diatom. Res. 34, 133–147. doi: 10.1080/0269249X.2019.1626770
Knauer G. A., Karl D. M., Martin J. H., Hunter C. N. (1984). In Situ Effects of Selected Preservatives on Total Carbon, Nitrogen and Metals Collected in Sediment Traps. J. Mar. Res. 42, 445–462. doi: 10.1357/002224084788502710
Lavery A. C., Wiebe P. H., Stanton T. K., Lawson G. L., Benfield M. C., Copley N. (2007). Determining Dominant Scatterers of Sound in Mixed Zooplankton Populations. J. Acoustical. Soc. America 122, 3304–3326. doi: 10.1121/1.2793613
Lee C., Hedges J. I., Wakeham S. G., Zhu N. (1992). Effectiveness of Various Treatments in Retarding Microbial Activity in Sediment Trap Material and Their Effects on the Collection of Swimmers. Limnol. Oceanogr. 37, 117–130. doi: 10.4319/lo.1992.37.1.0117
Lindstrom E., Gunn J., Fischer A., McCurdy A., Glover L. K. (2012). A Framework for Ocean Observing. Tech. Rep. Paris. 27p. doi: 10.5270/OceanObs09-FOO
Lombard F., Boss E., Waite A. M., Vogt M., Uitz J., Stemmann L., et al. (2019). Globally Consistent Quantitative Observations of Planktonic Ecosystems. Front. Mar. Sci. 6. doi: 10.3389/fmars.2019.00196
Lorenzen C. J. (1966). A Method for the Continuous Measurement of In Vivo Chlorophyll Concentration. Deep. Sea. Res. Oceanographic. Abstracts. 13, 223–227. doi: 10.1016/0011-7471(66)91102-8
Maclennan D. N., Fernandes P. G., Dalen J. (2002). A Consistent Approach to Definitions and Symbols in Fisheries Acoustics. ICES. J. Mar. Sci. 59, 365–369. doi: 10.1006/jmsc.2001.1158
Manov D. V., Chang G. C., Dickey T. D. (2004). Methods for Reducing Biofouling of Moored Optical Sensors. J. Atmospher. Ocean. Technol. 21, 958–968. doi: 10.1175/1520-0426(2004)021<0958:MFRBOM>2.0.CO;2
McGillicuddy D. Jr., Brosnahan M., Couture D., He R., Keafer B., Manning J., et al. (2014). A Red Tide of Alexandrium Fundyense in the Gulf of Maine. Deep. Sea. Res. Part II.: Topical. Stud. Oceanogr. 103, 174–184. doi: 10.1016/j.dsr2.2013.05.011
Miloslavich P., Bax N. J., Simmons S. E., Klein E., Appeltans W., Aburto-Oropeza O., et al. (2018). Essential Ocean Variables for Global Sustained Observations of Biodiversity and Ecosystem Changes. Global Change Biol. 24, 2416–2433. doi: 10.1111/gcb.14108
Moore S. K., Mickett J. B., Doucette G. J., Adams N. G., Mikulski C. M., Birch J. M., et al. (2021). An Autonomous Platform for Near Real-Time Surveillance of Harmful Algae and Their Toxins in Dynamic Coastal Shelf Environments. J. Mar. Sci. Eng. 9,336. doi: 10.3390/jmse9030336
Muller-Karger F. E., Miloslavich P., Bax N. J., Simmons S., Costello M. J., Sousa Pinto I., et al. (2018). Advancing Marine Biological Observations and Data Requirements of the Complementary Essential Ocean Variables (Eovs) and Essential Biodiversity Variables (Ebvs) Frameworks. Front. Mar. Sci. 5. doi: 10.3389/fmars.2018.00211
Mullison J. W. (2019), "Backscatter Estimation Using ADCPs - Twenty Years Later," 2019 IEEE/OES Twelfth Current, Waves and Turbulence Measurement (CWTM), pp. 1–5, doi: 10.1109/CWTM43797.2019.8955274
Nayak A. R., Malkiel E., McFarland M. N., Twardowski M. S., Sullivan J. M. (2021). A Review of Holography in the Aquatic Sciences: In Situ Characterization of Particles, Plankton, and Small Scale Biophysical Interactions. Front. Mar. Sci. 7. doi: 10.3389/fmars.2020.572147
OceanSITES (2020). OceanSITES Data Format Reference Manual NetCDF Conventions and Reference Tables Vol. Version 1.4 (Switzerland: Tech. rep., Geneva). d. m. t. doi: 10.25607/OBP-421.2
Peakock E. E., Olson R. J., Sosik H. M. (2014). Parasitic Infection of the Diatom Guinardia Delicatula, a Recurrent and Ecologically Important Phenomenon on the New England Shelf. Mar. Ecol. Prog. Ser. 503:1–10. doi: 10.3354/meps10784
Pedrós-Alió C., Acinas S. G., Logares R., Massana R. (2018). Marine Microbial Diversity as Seen By High Through-Put Sequencing. In Microbial Ecology of the OceansGasol J.M., Kirchman D. L. (eds). New York, NY: John Wiley and Sons pp 47–98.
Pereira G. C., Oliveira M. M. F., Andrade L. P., Espindola R., van Hecke K. G., Ebecken N. F. F. (2016). Simoco: The Viability of a Prototype Platform for a Coastal Monitoring System: A Case Study. J. Mar. Sci. Technol. 21, 651–662. doi: 10.1007/s00773-016-0380-3
Pesant S., Not F., Picheral M., Kandels-Lewis S., Le Bescot N., Gorsky G., et al. (2015). Open Science Resources for the Discovery and Analysis of Tara Oceans Data. Sci. Data 2, 1–16. doi: 10.1038/sdata.2015.23
Picheral M., Catalano C., Brousseau D., Claustre H., Coppola L., Leymarie E., et al. (2022). The Underwater Vision Profiler 6: An Imaging Sensor of Particle Size Spectra and Plankton, for Autonomous and Cabled Platforms. Limnol. Oceanogr.: Methods 20, 115–129. doi: 10.1002/lom3.10475
Pohl C., Löffler A., Hennings U. (2004). A Sediment Trap Flux Study for Trace Metals Under Seasonal Aspects in the Stratified Baltic Sea (Gotland Basin; 57°19.20′N; 20°03.00′E). Mar. Chem. 84, 143–160. doi: 10.1016/j.marchem.2003.07.002
Proctor C. W., Roesler C. S. (2010). New Insights on Obtaining Phytoplankton Concentration and Composition From In Situ Multispectral Chlorophyll Fluorescence. Limnol. Oceanogr.: Methods 8, 695–708. doi: 10.4319/lom.2010.8.0695
Reynolds R. A., Stramski D., Wright V. M., Woźniak S. B. (2010). Measurements and Characterization of Particle Size Distributions in Coastal Waters. J. Geophys. Res.: Ocean. 115,C08024. doi: 10.1029/2009JC005930
Richardson K., Visser A. W., Pedersen F. (2000). Subsurface Phytoplankton Blooms Fuel Pelagic Production in the North Sea. J. Plankton. Res. 22, 1663–1671. doi: 10.1093/plankt/22.9.1663
Rigual Hernández A. S., Trull T. W., Nodder S. D., Flores J. A., Bostock H., Abrantes F., et al. (2020). Coccolithophore Biodiversity Controls Carbonate Export in the Southern Ocean. Biogeosciences 17, 245–263. doi: 10.5194/bg-17-245-2020
Roberts D., Howard W. R., Roberts J. L., Bray S. G., Moy A. D., Trull T. W., et al. (2014). Diverse Trends in Shell Weight of Three Southern Ocean Pteropod Taxa Collected With Polar Frontal Zone Sediment Traps From 1997 to 2007. Polar. Biol. 37, 1445–1458. doi: 10.1007/s00300-014-1534-6
Robinson C., Suggett D., Cherukuru N., Ralph P., Doblin M. (2014). Performance of Fast Repetition Rate Fluorometry Based Estimates of Primary Productivity in Coastal Waters. J. Mar. Syst. 139, 299–310. doi: 10.1016/j.jmarsys.2014.07.016
Roemmich D., Alford M. H., Claustre H., Johnson K., King B., Moum J., et al. (2019). On the Future of Argo: A Global, Full-Depth, Multi-Disciplinary Array. Front. Mar. Sci. 6. doi: 10.3389/fmars.2019.00439
Roesler C. S., Boss E. (2008). “In Situ Measurement of the Inherent Optical Properties (Iops) and Potential for Harmful Algal Bloom Detection and Coastal Ecosystem Observations,” in Real-Time Coastal Observing Systems for Ecosystem Dynamics and Harmful Algal Bloom. Eds. Babin M., Roesler C. S. (Paris: UNESCO), 153–205. C. J. Jchap. 5.
Roesler C., Uitz J., Claustre H., Boss E., Xing X., Organelli E., et al. (2017). Recommendations for Obtaining Unbiased Chlorophyll Estimates From In Situ Chlorophyll Fluorometers: A Global Analysis of Wet Labs Eco Sensors. Limnol. Oceanogr.: Methods 15, 572–585. doi: 10.1002/lom3.10185
Rusch D. B., Halpern A. L., Sutton G., Heidelberg K. B., Williamson S., Yooseph S., et al. (2007). The Sorcerer Ii Global Ocean Sampling Expedition: Northwest Atlantic Through Eastern Tropical Pacific. PloS Biol. 5, e77. doi: 10.1371/journal.pbio.0050077
Satterthwaite E. V., Bax N. J., Miloslavich P., Ratnarajah L., Canonico G., Dunn D., et al. (2021). Establishing the Foundation for the Global Observing System for Marine Life. Front. Mar. Sci. 8. doi: 10.3389/fmars.2021.737416
Schallenberg C., Harley J. W., Jansen P., Davies D. M., Trull T. W. (2019). Multi-Year Observations of Fluorescence and Backscatter at the Southern Ocean Time Series (Sots) Shed Light on Two Distinct Seasonal Bio-Optical Regimes. Front. Mar. Sci. 595. doi: 10.3389/fmars.2019.00595
Scholin C., Doucette G., Jensen S., Roman B., Pargett D., MARIN R. III, et al. (2009). Remote Detection of Marine Microbes, Small Invertebrates, Harmful Algae, and Biotoxins Using the Environmental Sample Processor (Esp). Oceanography 22, 158–167. doi: 10.5670/oceanog.2009.46
Schulz E., Josey S., Verein R. (2012). First Air-Sea Flux Mooring Measurements in the Southern Ocean. Geophys. Res. Lett. 39,L16606. doi: 10.1029/2012GL052290
SCOR-WG-154 (2020). Recommendations for Plankton Measurements on the GO-SHIP Program With Relevance To Other Sea-Going Expeditions. Tech. Rep., 70pp., doi: 10.25607/OBP-718
Scott B. E., Sharples J., Ross O. N., Wang J., Pierce G. J., Camphuysen C. J. (2010). Sub-Surface Hotspots in Shallow Seas: Fine-Scale Limited Locations of Top Predator Foraging Habitat Indicated by Tidal Mixing and Sub-Surface Chlorophyll. Mar. Ecol. Prog. Ser. 408, 207–226. doi: 10.3354/meps08552
Send U., Fowler G., Siddall G., Beanlands B., Pittman M., Waldmann C., et al. (2013). Seacycler: A Moored Open-Ocean Profiling System for the Upper Ocean in Extended Self-Contained Deployments. J. Atmospher. Ocean. Technol. 30, 1555–1565. doi: 10.1175/JTECH-D-11-00168.1
Shadwick E., Trull T., Tilbrook B., Sutton A., Schulz E., Sabine C. (2015). Seasonality of Biological and Physical Controls on Surface Ocean Co2 From Hourly Observations at the Southern Ocean Time Series Site South of Australia. Global Biogeochem. Cycles. 29, 223–238. doi: 10.1002/2014GB004906
Simons R., Mendelssohn R. (2012). “Erddap-A Brokering Data Server for Gridded and Tabular Datasets,” in American Geophysical Union, Fall Meeting December 3-7, 2012 San Francisco, California, USA, abstract id. IN21B–1473
Sosik H. M., Olson R. J. (2007). Automated Taxonomic Classification of Phytoplankton Sampled With Imaging-in-Flow Cytometry. Limnol. Oceanogr.: Methods 5, 204–216. doi: 10.4319/lom.2007.5.204
Tanaka M., Genin A., Endo Y., Ivey G. N., Yamazaki H. (2021). The Potential Role of Turbulence in Modulating the Migration of Demersal Zooplankton. Limnol. Oceanogr. 66, 855–864. doi: 10.1002/lno.11646
Tanaka M., Genin A., Lopes R. M., Strickler J. R., Yamazaki H. (2019). Biased Measurements by Stationary Turbidity-Fluorescence Instruments Due to Phototactic Zooplankton Behavior. Limnol. Oceanogr.: Methods 17, 505–513. doi: 10.1002/lom3.10328
Traykovski P., Latter R. J., Irish J. D. (1999). A Laboratory Evaluation of the Laser In Situ Scattering and Transmissometery Instrument Using Natural Sediments. Mar. Geol. 159, 355–367. doi: 10.1016/S0025-3227(98)00196-0
Trull T. W., Bray S. G., Manganini S. J., Honjo S., François R. (2001). Moored Sediment Trap Measurements of Carbon Export in the Subantarctic and Polar Frontal Zones of the Southern Ocean, South of Australia. J. Geophys. Res.: Ocean. 106, 31489–31509. doi: 10.1029/2000JC000308
Trull T. W., Jansen P., Schulz E., Weeding B., Davies D. M., Bray S. G. (2019). Autonomous Multi-Trophic Observations of Productivity and Export at the Australian Southern Ocean Time Series (Sots) Reveal Sequential Mechanisms of Physical-Biological Coupling. Front. Mar. Sci. 525. doi: 10.3389/fmars.2019.00525
van der Merwe P., Trull T. W., Goodwin T., Jansen P., Bowie A. (2019). The Autonomous Clean Environmental (Ace) Sampler: A Trace-Metal Clean Seawater Sampler Suitable for Open-Ocean Time-Series Applications. Limnol. Oceanogr.: Methods 17, 490–504. doi: 10.1002/lom3.10327
von Appen W.-J., Waite A. M., Bergmann M., Bienhold C., Boebel O., Bracher A., et al. (2021). Sea-Ice Derived Meltwater Stratification Slows the Biological Carbon Pump: Results From Continuous Observations. Nat. Commun. 12, 1–16. doi: 10.1038/s41467-021-26943-z
Wang Z. A., Moustahfid H., Mueller A. V., Michel A. P. M., Mowlem M., Glazer B. T., et al. (2019). Advancing Observation of Ocean Biogeochemistry, Biology, and Ecosystems With Cost-Effective In Situ Sensing Technologies. Front. Mar. Sci. 6. doi: 10.3389/fmars.2019.00519
Weeding B., Trull T. W. (2014). Hourly Oxygen and Total Gas Tension Measurements at the Southern Ocean Time Series Site Reveal Winter Ventilation and Spring Net Community Production. J. Geophys. Res.: Ocean. 119, 348–358. doi: 10.1002/2013JC009302
Wiebe P. H., Benfield M. C. (2003). From the Hensen Net Toward Four-Dimensional Biological Oceanography. Prog. Oceanogr. 56, 7–136. doi: 10.1016/S0079-6611(02)00140-4
Wieczorek J., Bloom D., Guralnick R., Blum S., Döring M., Giovanni R., et al. (2012). Darwin Core: An Evolving Community-Developed Biodiversity Data Standard. PloS One 7, 1–8. doi: 10.1371/journal.pone.0029715
Wilkinson M. D., Dumontier M., Aalbersberg I. J., Appleton G., Axton M., Baak A., et al. (2016). The Fair Guiding Principles for Scientific Data Management and Stewardship. Sci. Data 3, 1–9. doi: 10.1038/sdata.2016.18
Wynn-Edwards C. A., Shadwick E. H., Davies D. M., Bray S. G., Jansen P., Trinh R., et al. (2020). Particle Fluxes at the Australian Southern Ocean Time Series (Sots) Achieve Organic Carbon Sequestration at Rates Close to the Global Median, are Dominated by Biogenic Carbonates, and Show no Temporal Trends Over 20-Years. Front. Earth Sci. 8. doi: 10.3389/feart.2020.00329
Keywords: plankton, ocean, measurements, sensors, OceanSITES, ocean biology
Citation: Boss E, Waite AM, Karstensen J, Trull T, Muller-Karger F, Sosik HM, Uitz J, Acinas SG, Fennel K, Berman-Frank I, Thomalla S, Yamazaki H, Batten S, Gregori G, Richardson AJ and Wanninkhof R (2022) Recommendations for Plankton Measurements on OceanSITES Moorings With Relevance to Other Observing Sites. Front. Mar. Sci. 9:929436. doi: 10.3389/fmars.2022.929436
Received: 26 April 2022; Accepted: 01 June 2022;
Published: 22 July 2022.
Edited by:
Astrid Bracher, Alfred Wegener Institute Helmholtz Centre for Polar and Marine Research (AWI), GermanyReviewed by:
Colleen Mouw, University of Rhode Island, United StatesPeter Leslie Croot, National University of Ireland Galway, Ireland
Copyright © 2022 Boss, Waite, Karstensen, Trull, Muller-Karger, Sosik, Uitz, Acinas, Fennel, Berman-Frank, Thomalla, Yamazaki, Batten, Gregori, Richardson and Wanninkhof. This is an open-access article distributed under the terms of the Creative Commons Attribution License (CC BY). The use, distribution or reproduction in other forums is permitted, provided the original author(s) and the copyright owner(s) are credited and that the original publication in this journal is cited, in accordance with accepted academic practice. No use, distribution or reproduction is permitted which does not comply with these terms.
*Correspondence: Emmanuel Boss, RW1tYW51ZWwuYm9zc0BtYWluZS5lZHU=