 Jianguo Du1,2,3
 Like Ding1,4
 Shangke Su1
 Wenjia Hu1,2,3*
 Yuyu Wang5
 Kar-Hoe Loh6
 Shengyun Yang7
 Mingru Chen7
 Kakaskasen Andreas Roeroe8Se Songploy9
 Zhenghua Liu1,2,3
 Bin Chen1,2,3*
- 1Third Institute of Oceanography, Ministry of Natural Resources, Xiamen, China
- 2Key Laboratory of Marine Ecological Conservation and Restoration, Ministry of Natural Resources, Xiamen, China
- 3Fujian Provincial Key Laboratory of Marine Ecological Conservation and Restoration, Xiamen, China
- 4College of Marine Science, Shanghai Ocean University, Shanghai, China
- 5School of Ecology and Nature Conservation, Beijing Forestry University, Beijing, China
- 6Institute of Ocean and Earth Sciences, Universiti Malaya, Kuala Lumpur, Malaysia
- 7College of Ocean and Earth Sciences, Xiamen University, Xiame, China
- 8Faculty of Fisheries and Marine Science, Sam Ratulangi University, Manado, Indonesia
- 9Aquatic Resources Research Institute, Chulalongkorn University, Bangkok, Thailand
Sharks play an important role in marine ecosystems as top predators and have been increasingly accepted in recent years as a group for priority conservation worldwide. However, as one of the regions with the highest marine shark species richness, there is still a limited understanding of shark diversity patterns and conservation needs in China and the Association of Southeast Asian Nations (ASEAN) seas. In this study, we applied an ensemble species distribution model of five algorithms to investigate the diversity distribution patterns of 149 shark species in China and the ASEAN seas for the first time. A systematic conservation planning approach involving diversity, scarcity, and biogeographical distinctiveness was used to identify and compare conservation priority settings. Our results showed that bathymetry and dissolved oxygen were the most important variables contributing to shark distribution. The distribution pattern of shark species richness peaked on the continental shelves at 22–26°N, and a hotspot of shark diversity was identified around the Taiwan Strait. The spatial distribution of shark species in the nine orders and the 72 threatened shark species varied considerably. The existing marine protected area network only protects 2.1% of the ocean, 32.9% of the shark species, and 43.1% of the threatened species, highlighting a substantial conservation gap. Among the conservation priorities identified, the high conservation target scenario (30%) protects only 10%–15% more species than the low conservation target scenario (10%). However, under the high conservation target scenario, the conservation range of species tripled. Our results show that low conservation targets were only suitable for addressing the number of protected species, and that high targets would bring about improved outcomes for the number of protected species and the protected range of threatened species. Furthermore, planned priorities with a large clump pattern had slightly higher conservation achievements than those with small clumps. The results of this study will contribute to the development of a priority area network for sharks and provide a scientific basis for shark conservation and management in the China and ASEAN seas.
Introduction
Sharks are important top predators in marine ecosystems and have played an essential role at the highest trophic levels and in the food web for 400 million years (Compagno et al., 2005; Arai and Azri, 2019). However, sharks are more susceptible to potential extinction risks due to high exploitation rates and fishing pressure coupled with low resilience, such as slow growth, low fecundity, and later maturity ages (Ferretti et al., 2008; Lucifora et al., 2011; Jorgensen et al., 2022). The abundance of oceanic sharks has declined globally by 71.1% over the last half-century, with an average rate of 18.2% per decade (Pacoureau et al., 2021). Overfishing has resulted in almost 20% of the surveyed reefs being without sharks (MacNeil et al., 2020). A total of 37% of sharks and rays were classified as threatened species according to the latest International Union for the Conservation of Nature (IUCN) Red List (IUCN, 2022), with 45 elasmobranchs being listed in the Convention on International Trade in Endangered Species of Wild Fauna and Flora (CITES) Appendix II. The decline of shark resources will have a negative impact on the integrity and service functions of marine ecosystems (Yagnesh et al., 2020; Pimiento et al., 2020). Shark conservation has attracted worldwide attention, and there is an urgent need to develop conservation and management plans to protect them.
The peak diversity area of global shark species is located on continental shelves and at mid-latitudes. Hotspots of species richness have been found in Japan, Taiwan, eastern Australia, southeast Africa, and South America (Lucifora et al., 2011; Dulvy et al., 2014). The China and Association of Southeast Asian Nations (ASEAN) seas are among the regions with the highest marine shark species richness, with 146 species from 21 families, and 196 species from 30 families recorded in Chinese waters and Southeast Asia, respectively (Zhang and Yang, 2005; Ali et al., 2018; Wu and Zhong, 2021). Southeast Asia is one of the areas with the highest number of endangered and data deficient shark species (Dulvy et al., 2017). However, research on sharks in this area has predominantly focused on taxonomy (Zhu, 1960; Ali et al., 2018), fisheries (Lam and Sadovy de Mitcheson, 2011; Friedman et al., 2018) and trade (Van Houtan et al., 2020; Prasetyo et al., 2021). The distribution pattern of shark biodiversity is still poorly understood. Despite the importance of sharks and rays as being recognized as umbrella species, only a few marine protected areas (MPAs) have been designed to protect them (Giménez et al., 2020). Furthermore, many MPAs are ineffective in protecting vulnerable elasmobranchs (Dureuil et al., 2018). The majority of shark sanctuaries are in Oceania, the Caribbean, and the Indian Ocean (Ward-Paige and Worm, 2017). How many shark species have been protected in Chinese and ASEAN seas and which areas should be protected remain unknown. Owing to the unknown, unmonitored, and unmanaged shark populations in Southeast Asia, only 18 of the 109 shark species that have historically been present in the area were found during a market survey, and 65% of these were below their maturity length (Lam and Sadovy de Mitcheson, 2011). Current fishery practices will likely lead to the extinction of some shark species in the future (Arai and Azri, 2019). With these extensive research gaps, our current knowledge is inadequate to meet the challenges of shark protection and management (Prasetyo et al., 2021). There is an urgent need to study the diversity distribution patterns and the current conservation status of the sharks in China and the ASEAN seas.
According to Aichi Target 11 of the Convention on Biological Diversity (CBD), 10% of marine areas were to be conserved by 2020 (https://www.cbd.int/aichi-targets). Based on the World Parks Congress and the Kunming declaration of the CBD, many countries have called to protect 30% of terrestrial and marine areas by 2030 (World Parks Congress, 2014; CBD/COP/15/5/Add.1, 2021). However, at present only 7.93% of the ocean is protected worldwide (UNEP-WCMC and IUCN, 2022). It remains a challenge to assess and identify conservation priority areas for global marine conservation and management, encompassing those that best represent the world’s marine biodiversity (Venter et al., 2014; Zhao et al., 2020). Over the last decade, one-third of the increase in the MPA range has been undertaken with the aim of shark conservation. However, 97.4% of the marine species have less than 10% of their geographic range within MPAs (Davidson & Dulvy, 2017). Fifteen countries in the Atlantic, Indian, and Pacific Oceans have declared their entire economic exclusive zones as “shark sanctuaries,” which were delimited by administrative boundaries rather than ecological characteristics (Ward-Paige and Worm, 2017). Systematic conservation planning (SCP) can be used to identify conservation priority areas and design protected area networks, providing a new decision-making method for managers (Margules and Pressey, 2000). In recent years, SCP has been widely used in terrestrial (Cuesta et al., 2017; Jellinek, 2017) and oceanic conservation priority area planning (Zhao et al., 2020; Jefferson et al., 2021). Marine spatially explicit annealing (Marxan) is the most widely used software worldwide for SCP analysis (Christodoulou et al., 2021). The marine conservation areas for five demersal sharks and rays were identified using Marxan decision support tools in the western Mediterranean Sea (Giménez et al., 2020). Marine protected area design was also informed by Marxan combined with movement models for eight elasmobranchs in the Bahamas (Van Zinnicq Bergmann et al., 2022). However, there has been a tendency for shark conservation to address only some species (Dulvy et al., 2017). The representativeness of diversity and specific ecoregions needs to be improved. There is also a lack of research on sharks using the SCP approach in China and the ASEAN seas, where information regarding the spatial distribution of most sharks is still scarce.
Although methods such as long-line, electronic tags, eDNA, and baited remote underwater video stations can provide occurrence records for sharks, distribution data are still scarce for these widely distributed marine megafauna (White et al., 2019; Espinoza et al., 2020; Jorgensen et al., 2022). In recent years, species distribution models (SDMs) have often been used to explore the distribution and assess the habitat suitability for marine species for which records are difficult to obtain (Melo-Merino et al., 2020). A single SDM has been used to explore the distribution of sharks, such as the generalized linear model (GLM) (Kai et al., 2017; Giménez et al., 2020), and maximum entropy (Maxent) (Chan et al., 2021; Noviello et al., 2021; Pottie et al., 2021). However, using a single model is likely to cause high uncertainty, but ensemble SDM, used in many studies, increases the confidence level (Segurado and Araujo, 2004; Thuiller et al., 2019). The distribution of elasmobranchs has been projected using ensemble SDMs, while far fewer studies have been undertaken in the China and ASEAN seas than in the UK, North America, and the Western Central Atlantic (Austin et al., 2019; Garzon et al., 2021).
In the present study, we applied the ensemble SDM and SCP approach to investigate diversity distribution patterns and conservation priority areas for 149 shark species in the China and ASEAN seas. The main objectives were to (i) identify the spatial distribution pattern of shark diversity and its main environmental drivers, (ii) reveal current conservation gaps, and (iii) identify and compare conservation priorities for different conservation targets and explore the best solutions. This study is the first attempt to reveal the diversity distribution characteristics of sharks in the China and ASEAN seas. Through this research, we aimed to identify the conservation effectiveness of different target scenarios, which will contribute to the development of a priority area network for sharks in this region, providing a scientific basis for shark conservation and management.
Materials and Methods
Study Area
The seas surrounding China and ASEAN form part of the western Pacific, covering a wide range across 52 latitudes in warm-temperate, subtropical, and tropical climate zones. The longitude and latitude of the study region were approximately 41° N–10.5° S and 99° E–135° E, respectively, with an area of approximately 837×104 km2 (Figure 1). Fifteen marine ecoregions were included in the study according to the Marine Ecoregions of the World (MEOW) proposed by Spalding et al. (2007). The study region is affected by the Pacific-to-Indian Ocean throughflow, the Indonesian throughflow, the Kuroshio warm current, and the equatorial current (Liu, 2011). Most parts of the coral triangle are included in this region, which represents a global epicenter of marine life abundance and diversity. The study area included the center of marine shore fish biodiversity (Carpenter and Springer, 2005). It is also among the regions with the highest marine shark diversity, with more than 150 species of sharks and rays in a half-degree cell (Lucifora et al., 2011; Kaschner et al., 2019).
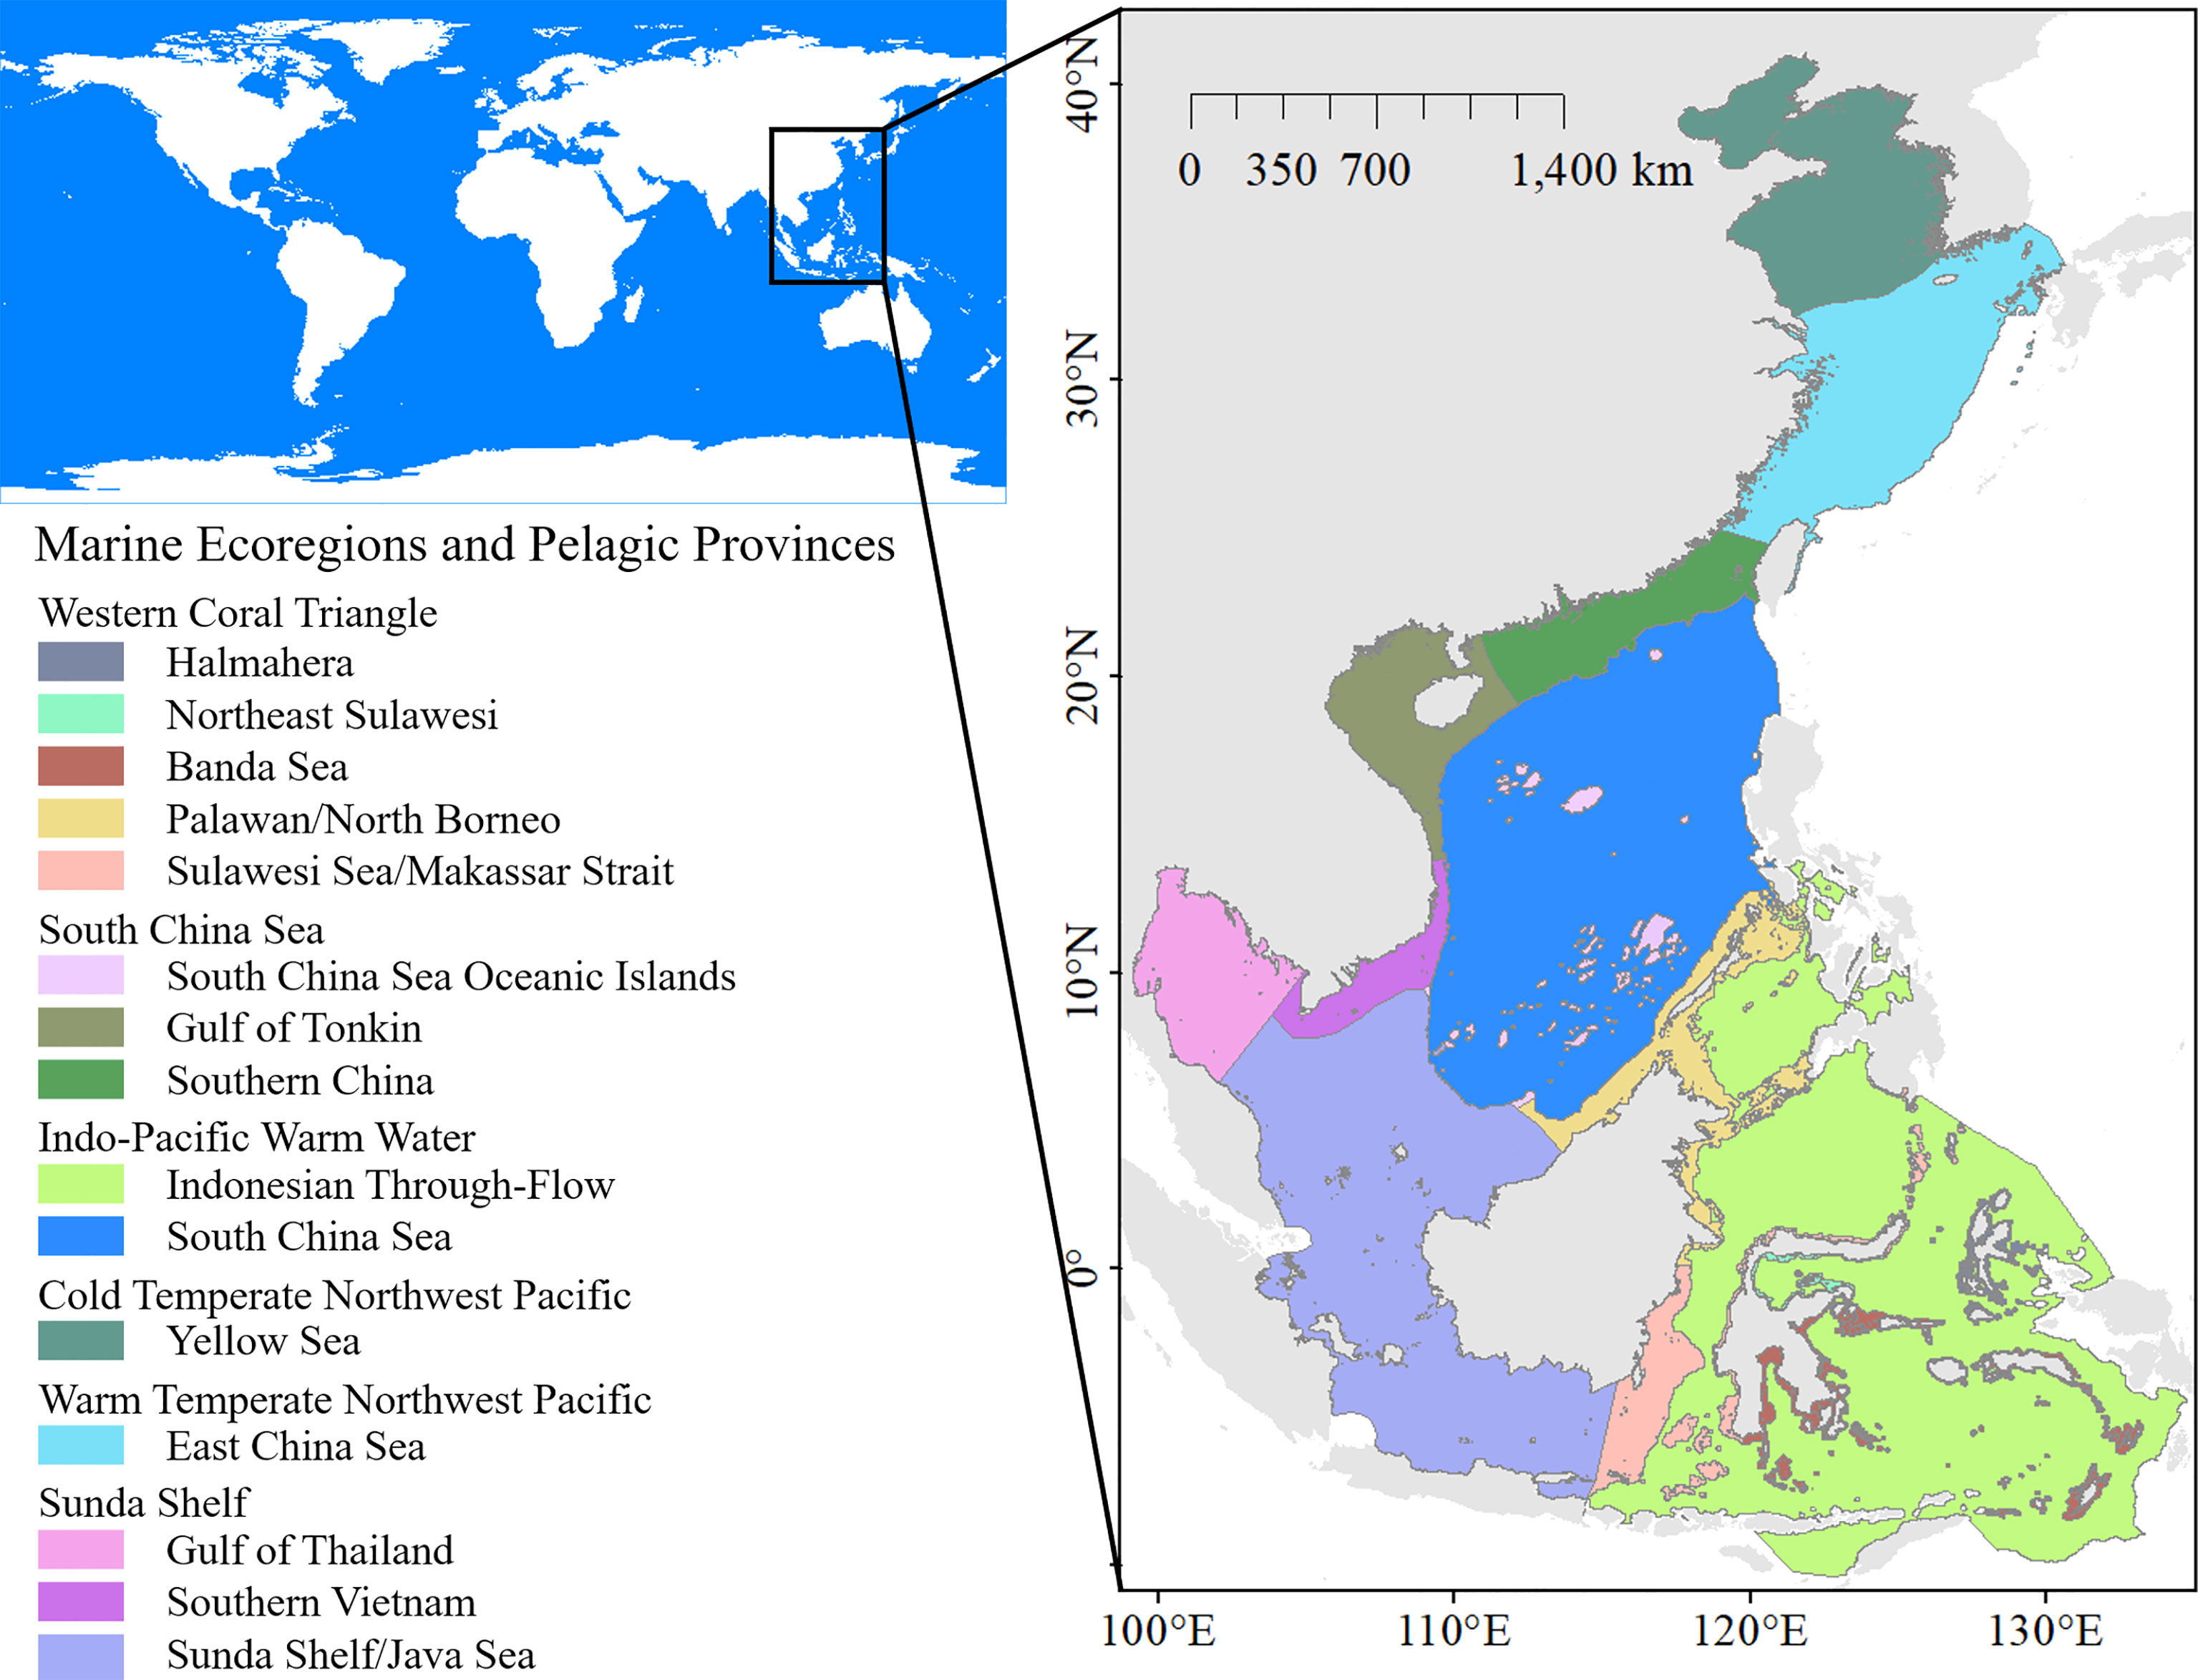
Figure 1 The study region, marine ecoregions, and the pelagic provinces.
In the present study, 149 shark species from nine orders and 32 families were selected (Supplementary Material) according to data availability. These species account for more than 76% of all the sharks in this region (Zhang and Yang, 2005; Ali et al., 2018; Wu and Zhong, 2021). This encompasses almost all the shark orders and families in China and the ASEAN seas, from the Carcharhiniformes which is the largest group with 78 species, to the Pristiophoriformes which has one species. According to the IUCN Red List, there are 10 critically endangered (CR) species, 28 endangered (EN) species, and 34 vulnerable (VU) species (IUCN, 2022), totaling 72 ETP (endangered, threatened, and protected) species. The selected species come from a range of trophic levels (TLs) and habitats. Most sharks are carnivorous, such as the great white shark (Carcharodon carcharias) which has a TL value of 4.5, while some are filter-feeding species such as the basking shark (Cetorhinus maximus) which has a TL value of 3.2 (Froese and Pauly, 2022). They also include the largest whale shark (Rhincodon typus) and the small Japanese angelshark (Squatina japonica). Endemic species were also included in the selected species; for example, the clouded angelshark (Squatina nebulosa), which occurs from Japan to Taiwan (Rigby et al., 2021).
Data Sources and Preparation
Occurrence data for the 149 shark species were collected from the global biogeographic database, field investigation, and the related literature. The occurrence records from the Global Biodiversity Information Faculty (GBIF, www.gbif.org) and the Ocean Biodiversity Information System (OBIS, www.iobis.org) were extracted using the spocc R package (Chamberlain et al., 2014), and the data from FishBase (www.fishbase.org) were collected manually. Data from the Chinese Offshore Investigation and Assessment project conducted in 2004–2009 were also collected, which is the most recent and largest marine survey in China (State Oceanic Administration, 2016). Data were also collected from relevant papers and reports in China (Li et al., 2007; Zhang et al., 2018), and Malaysia (Yano et al., 2005; Last et al., 2010). The data were merged to retain the longitude and latitude information. Duplicated, impossible, and incomplete coordinates were removed during the data-cleaning process, retaining 60,426 occurrence records for the 149 shark species. The data-cleaning process was conducted in an R environment using the scrubr package (Thuiller et al., 2021; Chamberlain, 2022). Spatial rarefying was then conducted to resample the shark occurrence records to the same density as the environmental dataset for SDM modeling.
Sharks are heterothermic animals and temperature has a considerable impact on their distribution (Birkmanis et al., 2020; Diaz-Carballido et al., 2022). Primary productivity is also an important factor that affects shark distribution and abundance (MacKenzie et al., 2019). Many studies have widely demonstrated the relationship between the primary productivity and fisheries catch (Pauly and Christensen, 1995; Watson et al., 2014), and primary productivity variability is significantly and positively correlated to the mean trophic level of catches (Conti and Scardi, 2010); therefore, the primary productivity is used in most SDMs (Gonzalez-Pestana et al., 2020; Chan et al., 2021). Other environmental variables like depth, dissolved oxygen, salinity, and offshore distance are often used in the study of marine shark distribution (Sequeira et al., 2014; Meyers et al., 2017; Chan et al., 2021; Pottie et al., 2021; González-Andrés et al., 2021). In the present study, eight environmental variables including SST, salinity, depth, distance from land, current velocity, primary productivity, dissolved oxygen concentration, and pH were selected as the model predictors. These factors were extracted from public datasets and products of Bio-Oracle and NOAA (Table 1). All the environmental variables were processed using ArcGIS 10.5 software, extracted from the boundary of the study area, and resampled to a grid cell size of 5 arcmin. To analyze the conservation gaps, a dataset of MPAs in the study region was extracted from the latest World Database on Protected Areas (UNEP-WCMC and IUCN, 2022).
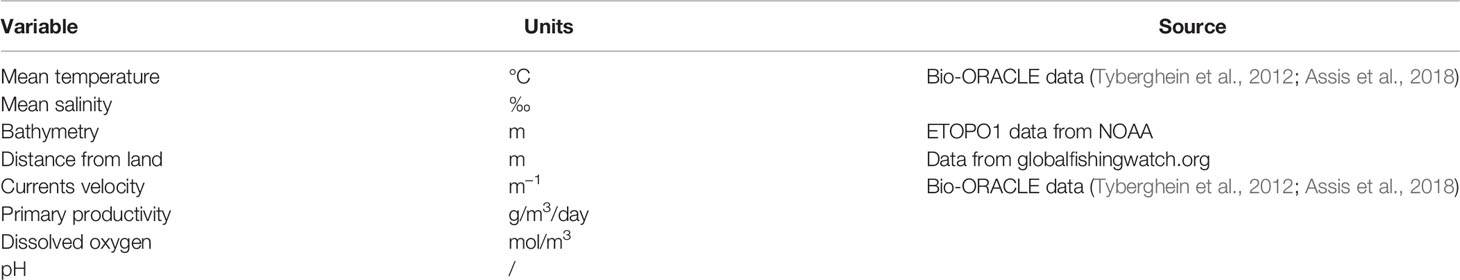
Table 1 Environmental predictors used in the ensemble SDM.
SDM Modeling
An ensemble model combining several SDM algorithms was used in this study to produce a distribution map for each shark species. The relationships between shark occurrence data and the eight environmental variables were estimated using five algorithms, namely GLM, generalized boosting model (GBM), random forest (RF), artificial neural network (ANN), and Maxent. These five models were fitted by their default parameters in the R environment using the biomod2 package (Version 3.5.1, Thuiller et al., 2021). Each algorithm was run with 10 replicates, i.e., the predictions for each species were derived from 50 simulations. The predictive abilities of the models were evaluated using true skill statistics (TSS, Allouche et al., 2006), KAPPA, and the area under the receiver operating curve (AUC, Fourcade et al., 2018). Model outputs with a TSS value of ≥ 0.7 were used to ensure a good performance for the predicted results. An ensemble result was then generated for each species using the mean consensus method (Marmion et al., 2009; Crimmins et al., 2013).
SCP Model Settings
As the most extensively used SCP software (Watts et al., 2009; Giménez et al., 2020), Marxan was used to set the priority areas for the study. A simulating annealing algorithm was used as an optimization method in Marxan to find a reserve network to reach the conservation target. One of the outputs of the Marxan analysis was identified as the best solution file, which was then run with the best objective value from all the good solutions produced by the model (Christodoulou et al., 2021). The study region was divided into planning units (PUs), which were used as candidate conservation units. We divided our study area into 0.25° fishnet units according to the scale of the study region, obtaining a total of 11,652 PUs.
Four conservation targets were set for the SCP model in this study (Table 2). The two scenarios were based on the CBD’s Aichi Target 11, which states that at least 10% of coastal and marine areas were to be conserved through MPAs by 2020 (https://www. cbd. int/aichi-targets). Two additional scenarios were based on the 30% conservation target proposed by the World Parks Congress and the Kunming declaration (World Parks Congress, 2014; CBD/COP/15/5/Add.1, 2021). Diversity, scarcity (ETP species), and biogeographical distinctiveness (considering the representative across ecoregions) were also selected as targets to stratify the results by study region, so that they can act as coarse filters (Ardron et al., 2008; Levy and Ban, 2013). The boundary length modifier (BLM) was tested through a sensitivity analysis to control the compactness of the reserve solutions, using values of 0.002 and 0.1, representing dispersion and aggregation, respectively. The dispersion option allowed Marxan to select small clumps of PU across the study area; meanwhile, the aggregation option forced Marxan to select large clumps of PU. Each Marxan analysis was performed for 100 replicates, with a penalty factor of 100. All the operating procedures were performed in accordance with the Marxan user manual (Serra et al., 2020). The achievement of each conservation target was spatially calculated using the zonal statistics tool in ArcGIS 10.5.
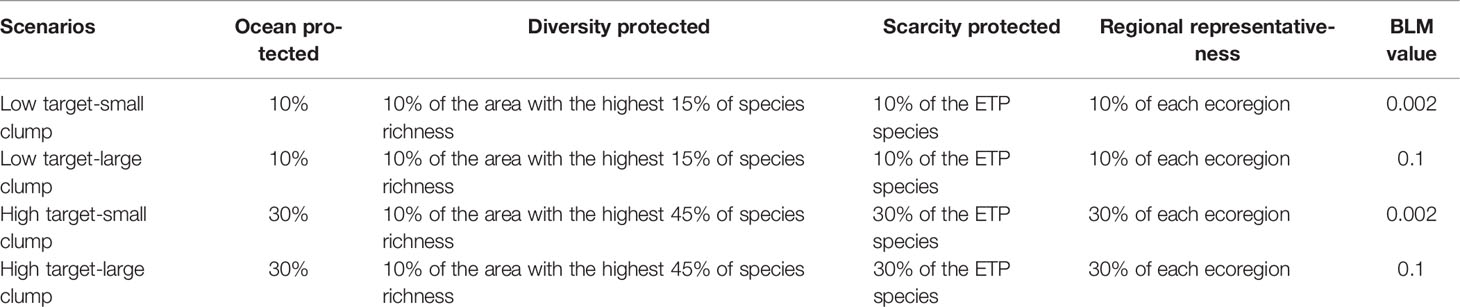
Table 2 Four scenario settings used in the Marxan analysis.
Results
Shark Diversity Distribution and Environmental Drivers
The accuracy test showed that all the models had excellent performance, with TSS, ROC, and KAPPA values between 0.79 and 0.99 (Table 3). The environmental variable importance showed that the distribution of 83.2% of species was predominantly influenced by bathymetry and 74.5% was influenced by dissolved oxygen (Supplementary Material). This suggests that bathymetry and dissolved oxygen are crucial variables contributing to the distribution of most sharks. A clear distribution pattern was observed by plotting the relationship between shark species richness and these two variables. The areas with a shark species richness greater than 50 were within the bathymetry at 0–200 m (Figure 2A), concentrated between the shoreline and continental shelf. A distinct unimodal pattern was observed in the relationship between the species richness and the dissolved oxygen. Dissolved oxygen concentration with a species richness greater than 25 was recorded between 200–250 mol/m3, and the peak occurred at approximately 215 mol/m3, with species richness exceeding 125 (Figure 2B).
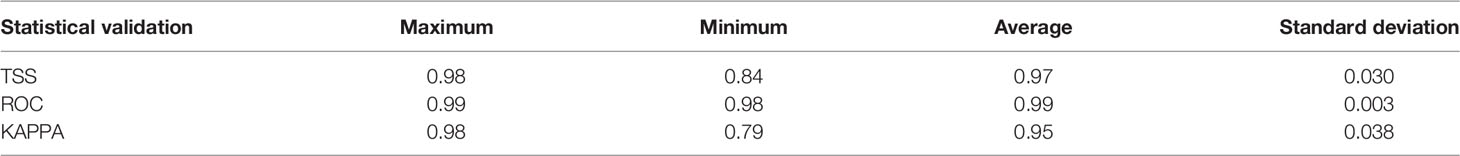
Table 3 TSS, ROC, and KAPPA values for the ensemble model.
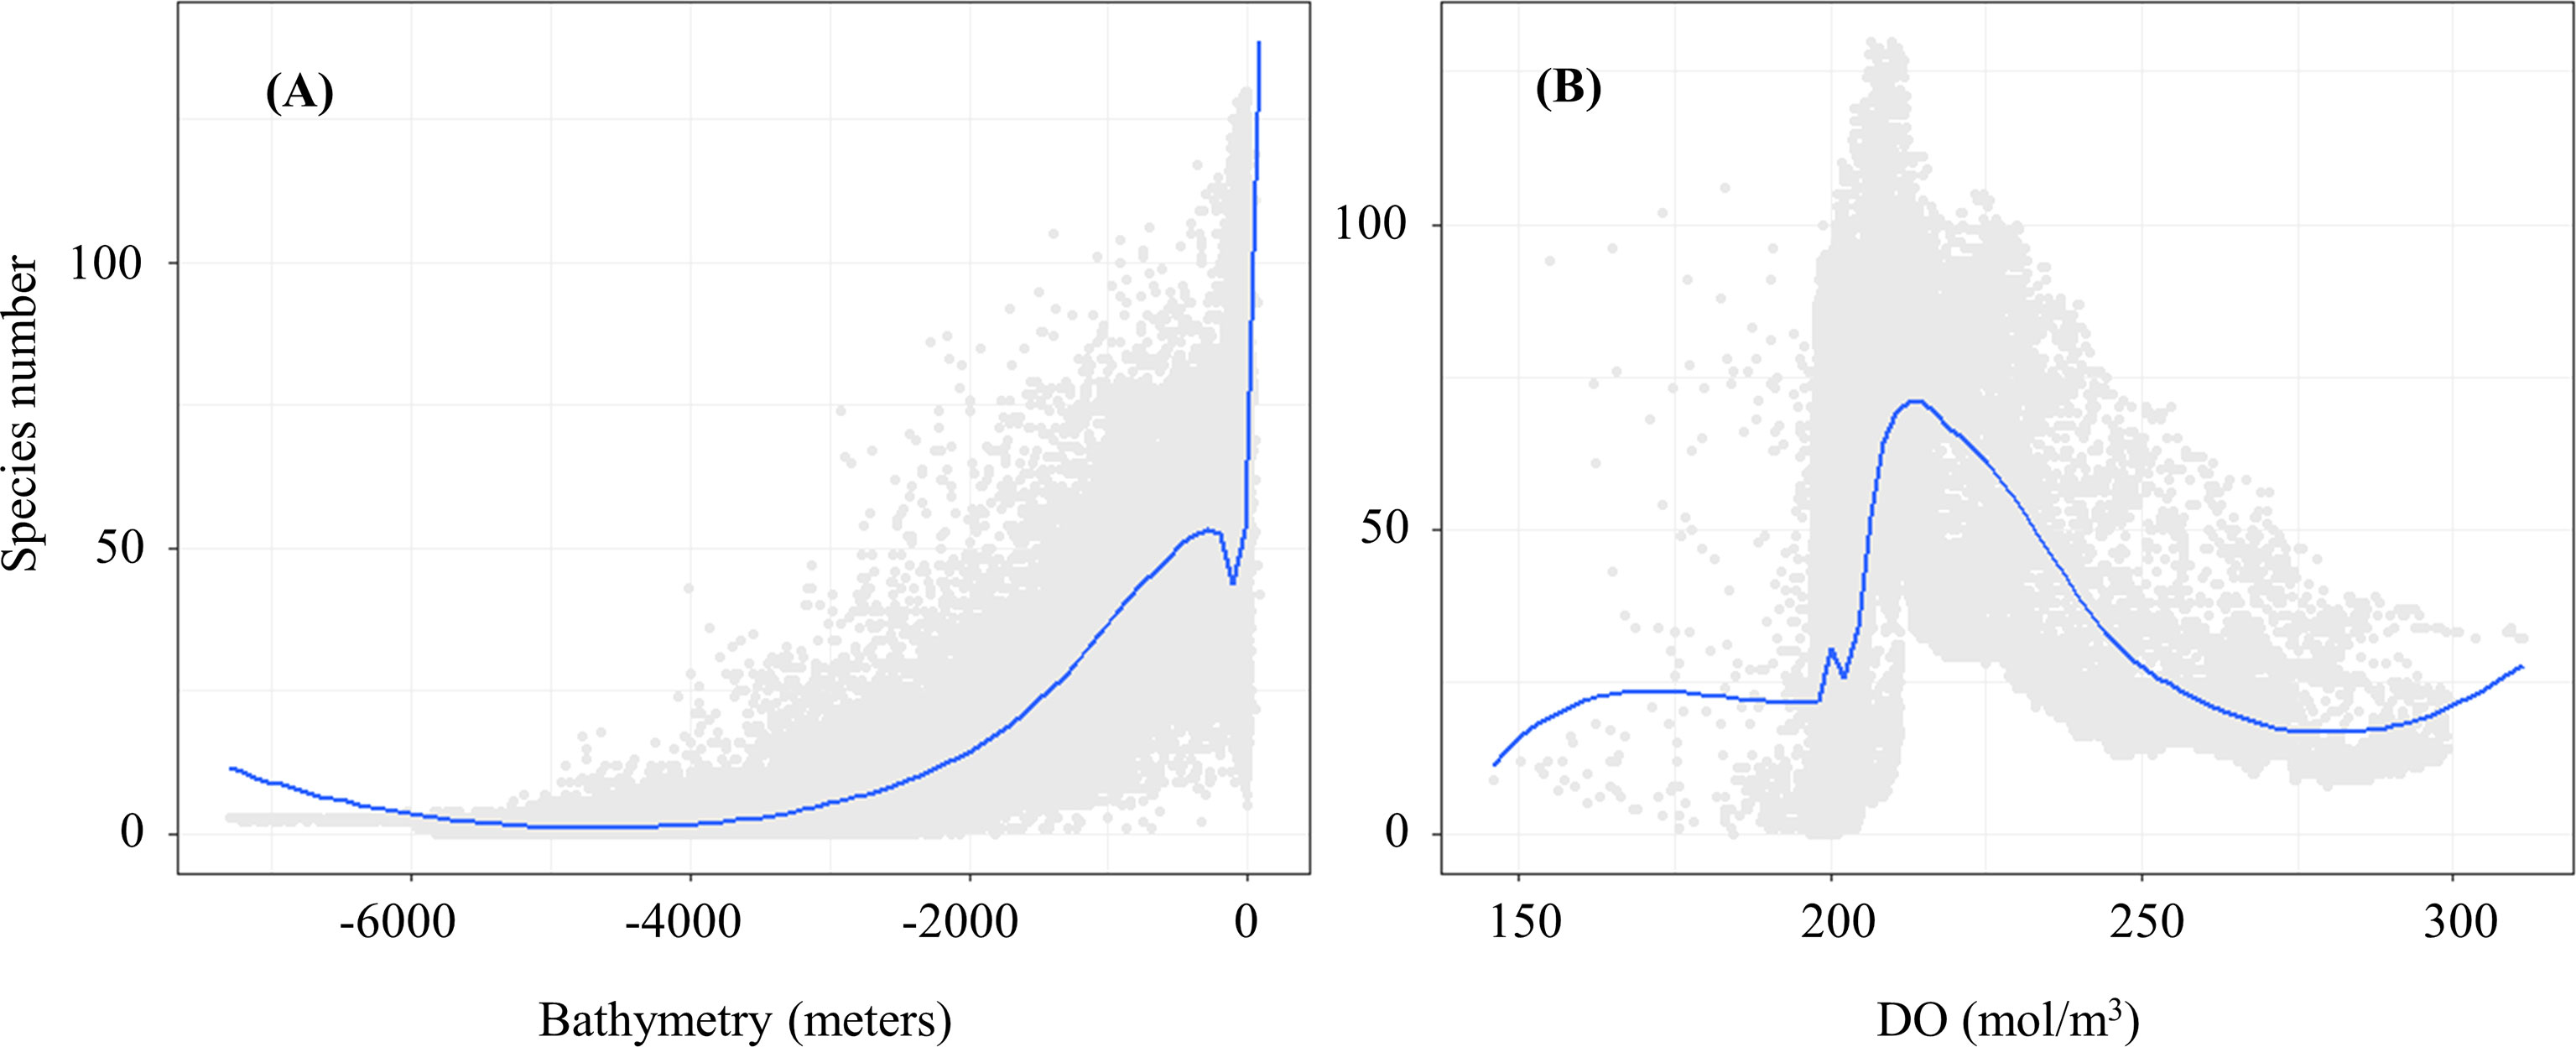
Figure 2 Response curves among species number and the key environmental drivers (A. Bathymetry; B. DO).
The latitudinal distribution pattern of shark species richness showed a peak at 22–26°N (Figure 3A). This matched the hotspot of shark diversity in the Taiwan Strait, where shark species richness was as high as 90 to 130. In contrast, shark species richness decreased sharply from 35°N northward. Species richness varied considerably among the different marine ecoregions and the pelagic provinces (Figure 3B). The highest and lowest species richness was found in the Province of Temperate Northwest Pacific, where there were 144 species in the East China Sea and 68 species in the Yellow Sea. Shark species richness in tropical and subtropical ecoregions was similar, exceeding 110, except for the Northeast Sulawesi ecoregion.
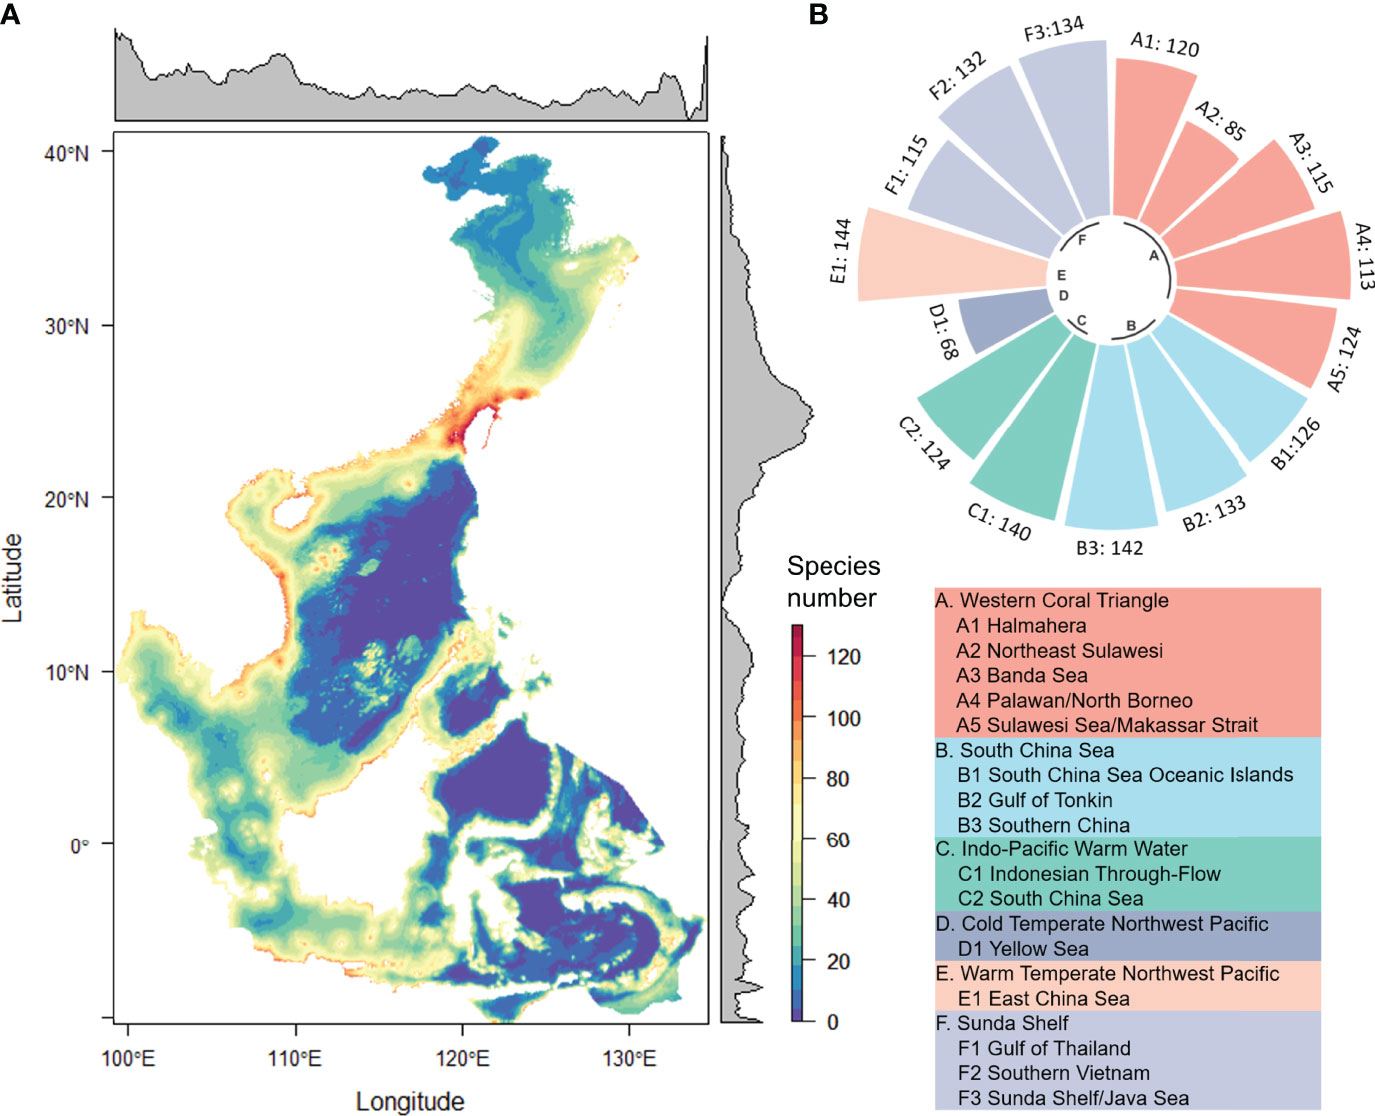
Figure 3 Species abundance distribution (A) and species number in each marine ecoregion and pelagic province (B).
Distribution Patterns of Different Orders and ETP Groups
The distribution of the different taxa varied substantially (Figure 4). The Carcharhiniformes had the highest species richness (79 species) and were the most widespread taxon with a distribution encompassing almost the entire coastline of the study area. The species richness of the Squaliformes was also high with 38 species, but the distribution range was concentrated in the East China Sea. The Pristiophoriformes had the lowest species richness and narrowest distribution range. The Orectolobiformes preferred lower latitudes than the other orders and were distributed within the latitudinal range of 0 ± 10°.
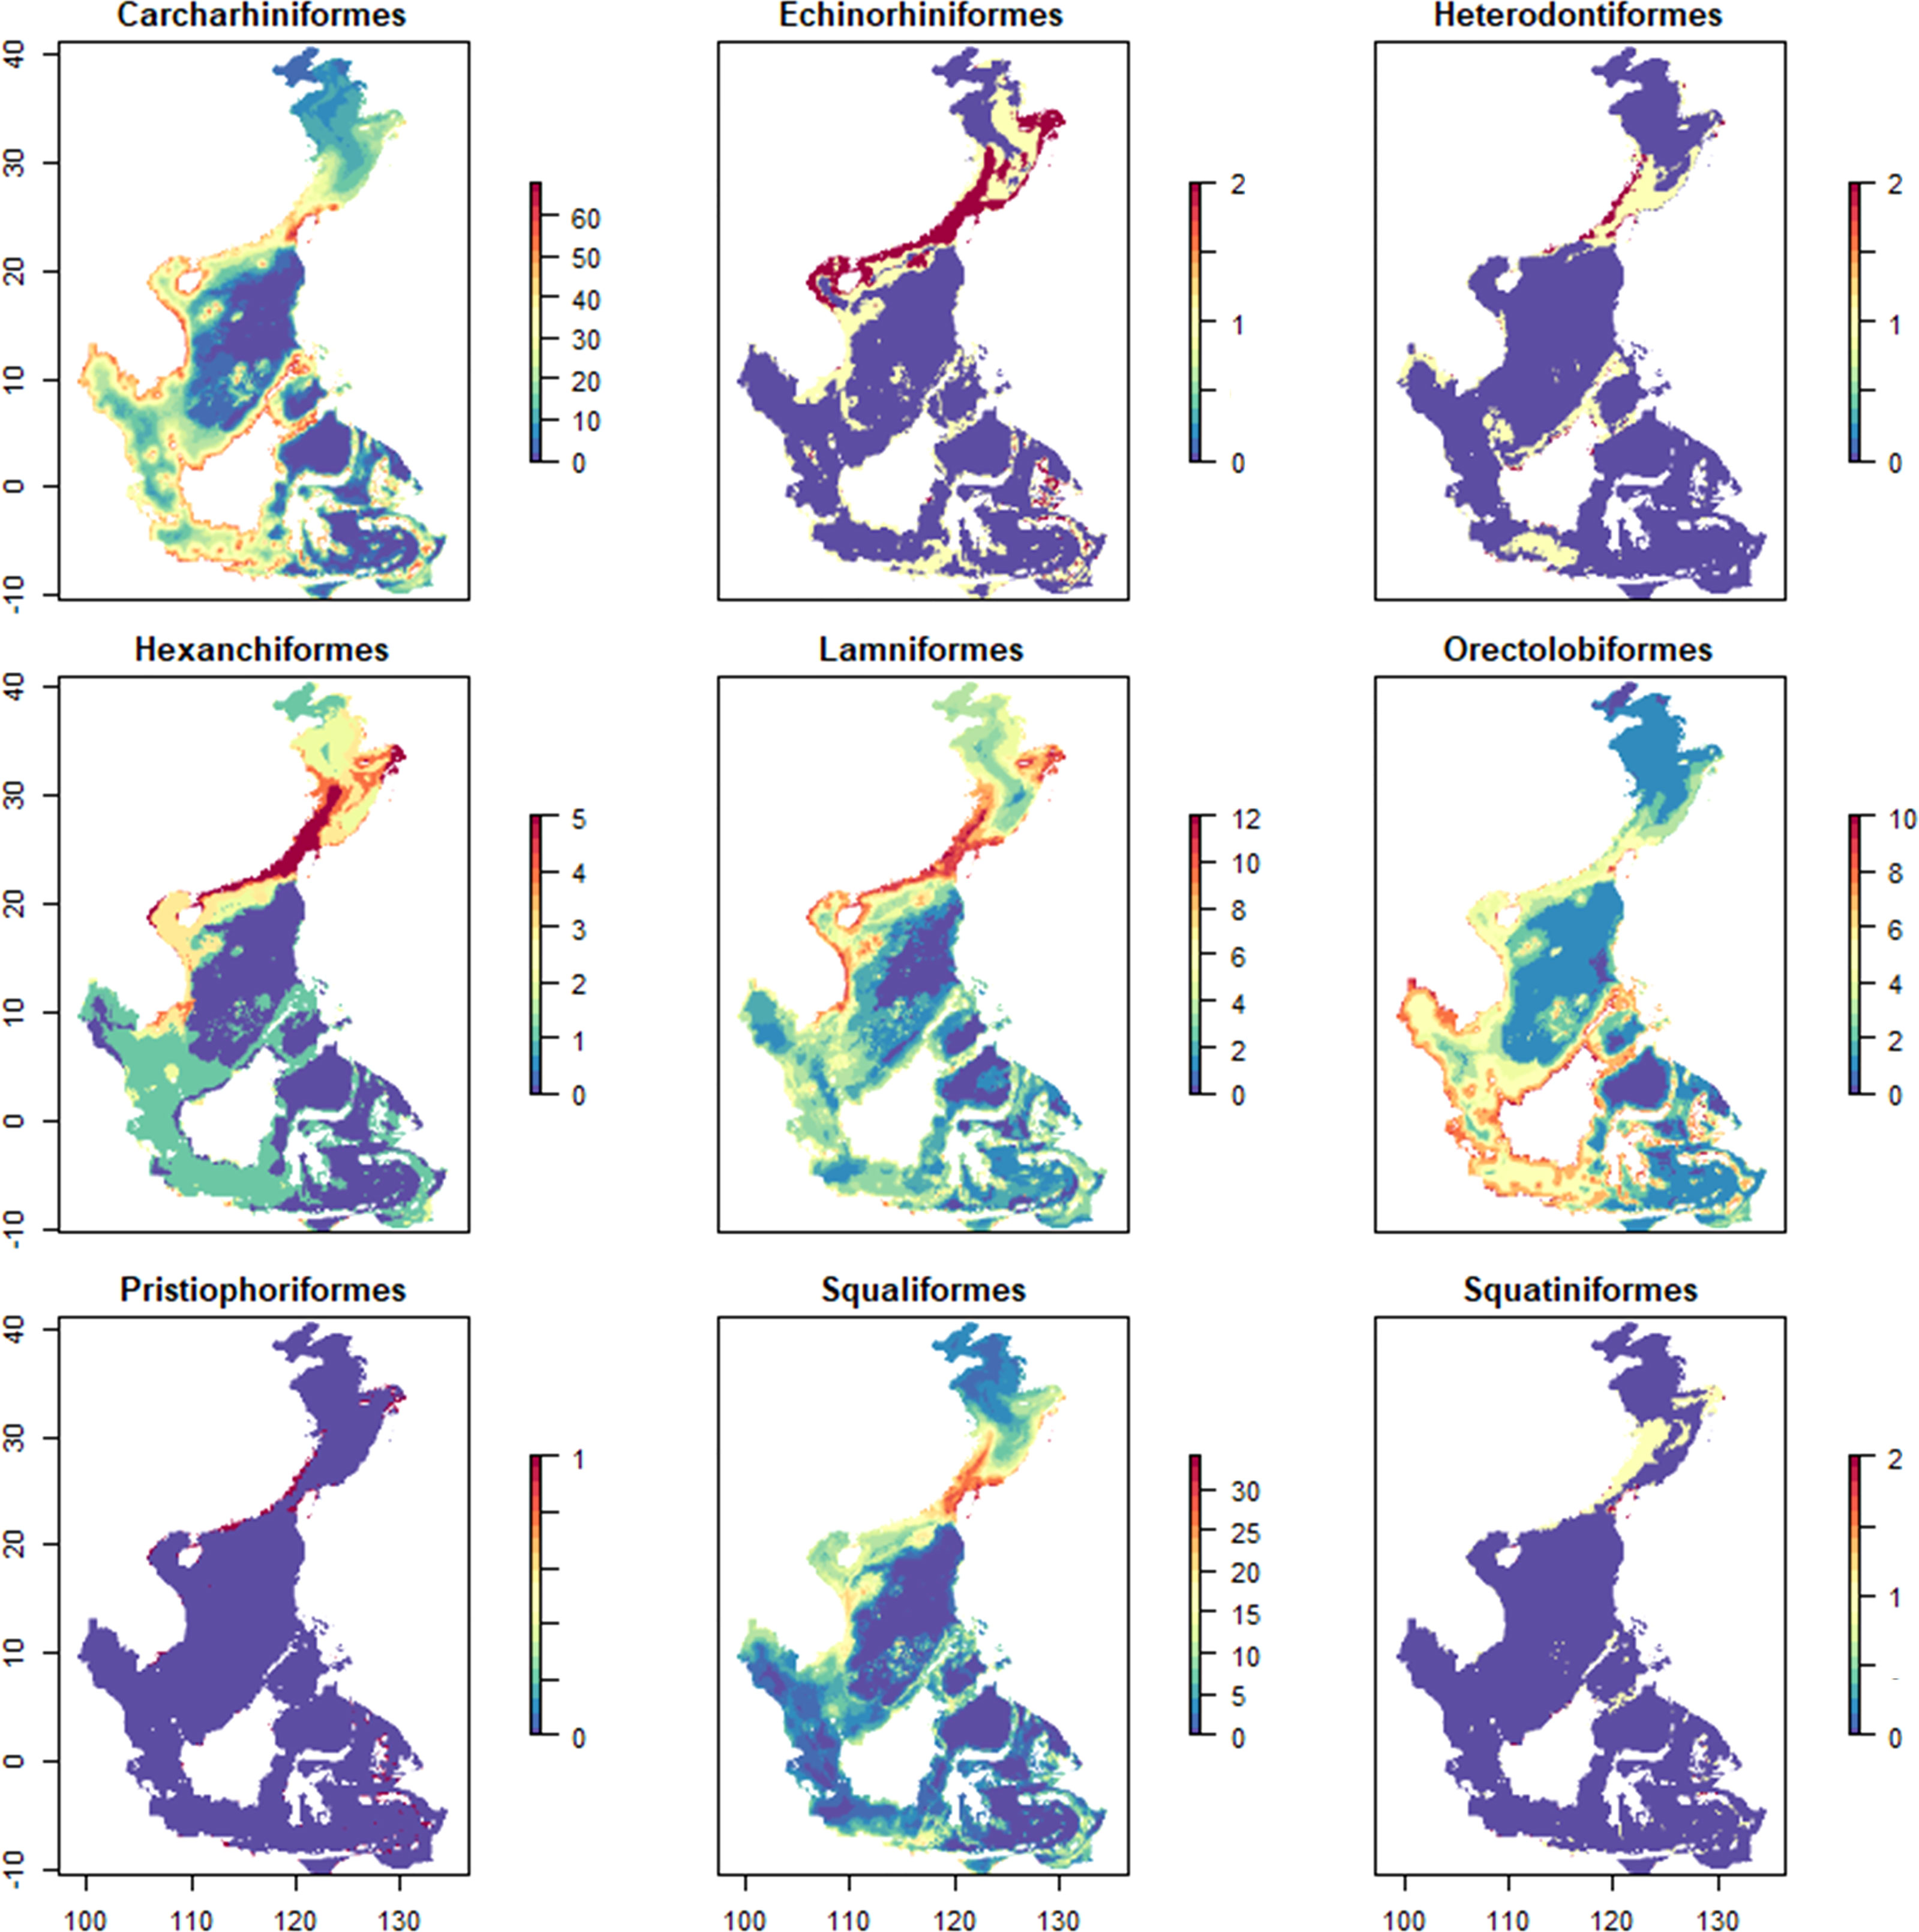
Figure 4 Species distribution of different orders.
The distribution of ETP species was mapped according to their endangered status, and the results showed that the CR species were predominantly distributed to the south of 30°N, while EN and VU species have pronounced diversity hotspots in the Taiwan Strait (Figure 5). The distribution ranges of the different ETP species substantially varied (Figure 6). Among the 72 ETP species, the whale shark (R. typus) was the most widely distributed, with a predicted distribution range of 87,465 grid cells, followed by the bigeye thresher (Alopias superciliosus) with 68,315 grid cells, and the scalloped hammerhead (Sphyrna lewini) with 57,884 grid cells. The distribution of the blackspotted smooth-hound (Mustelus punctulatus) was the narrowest, with a predicted distribution range of 32 grid cells.
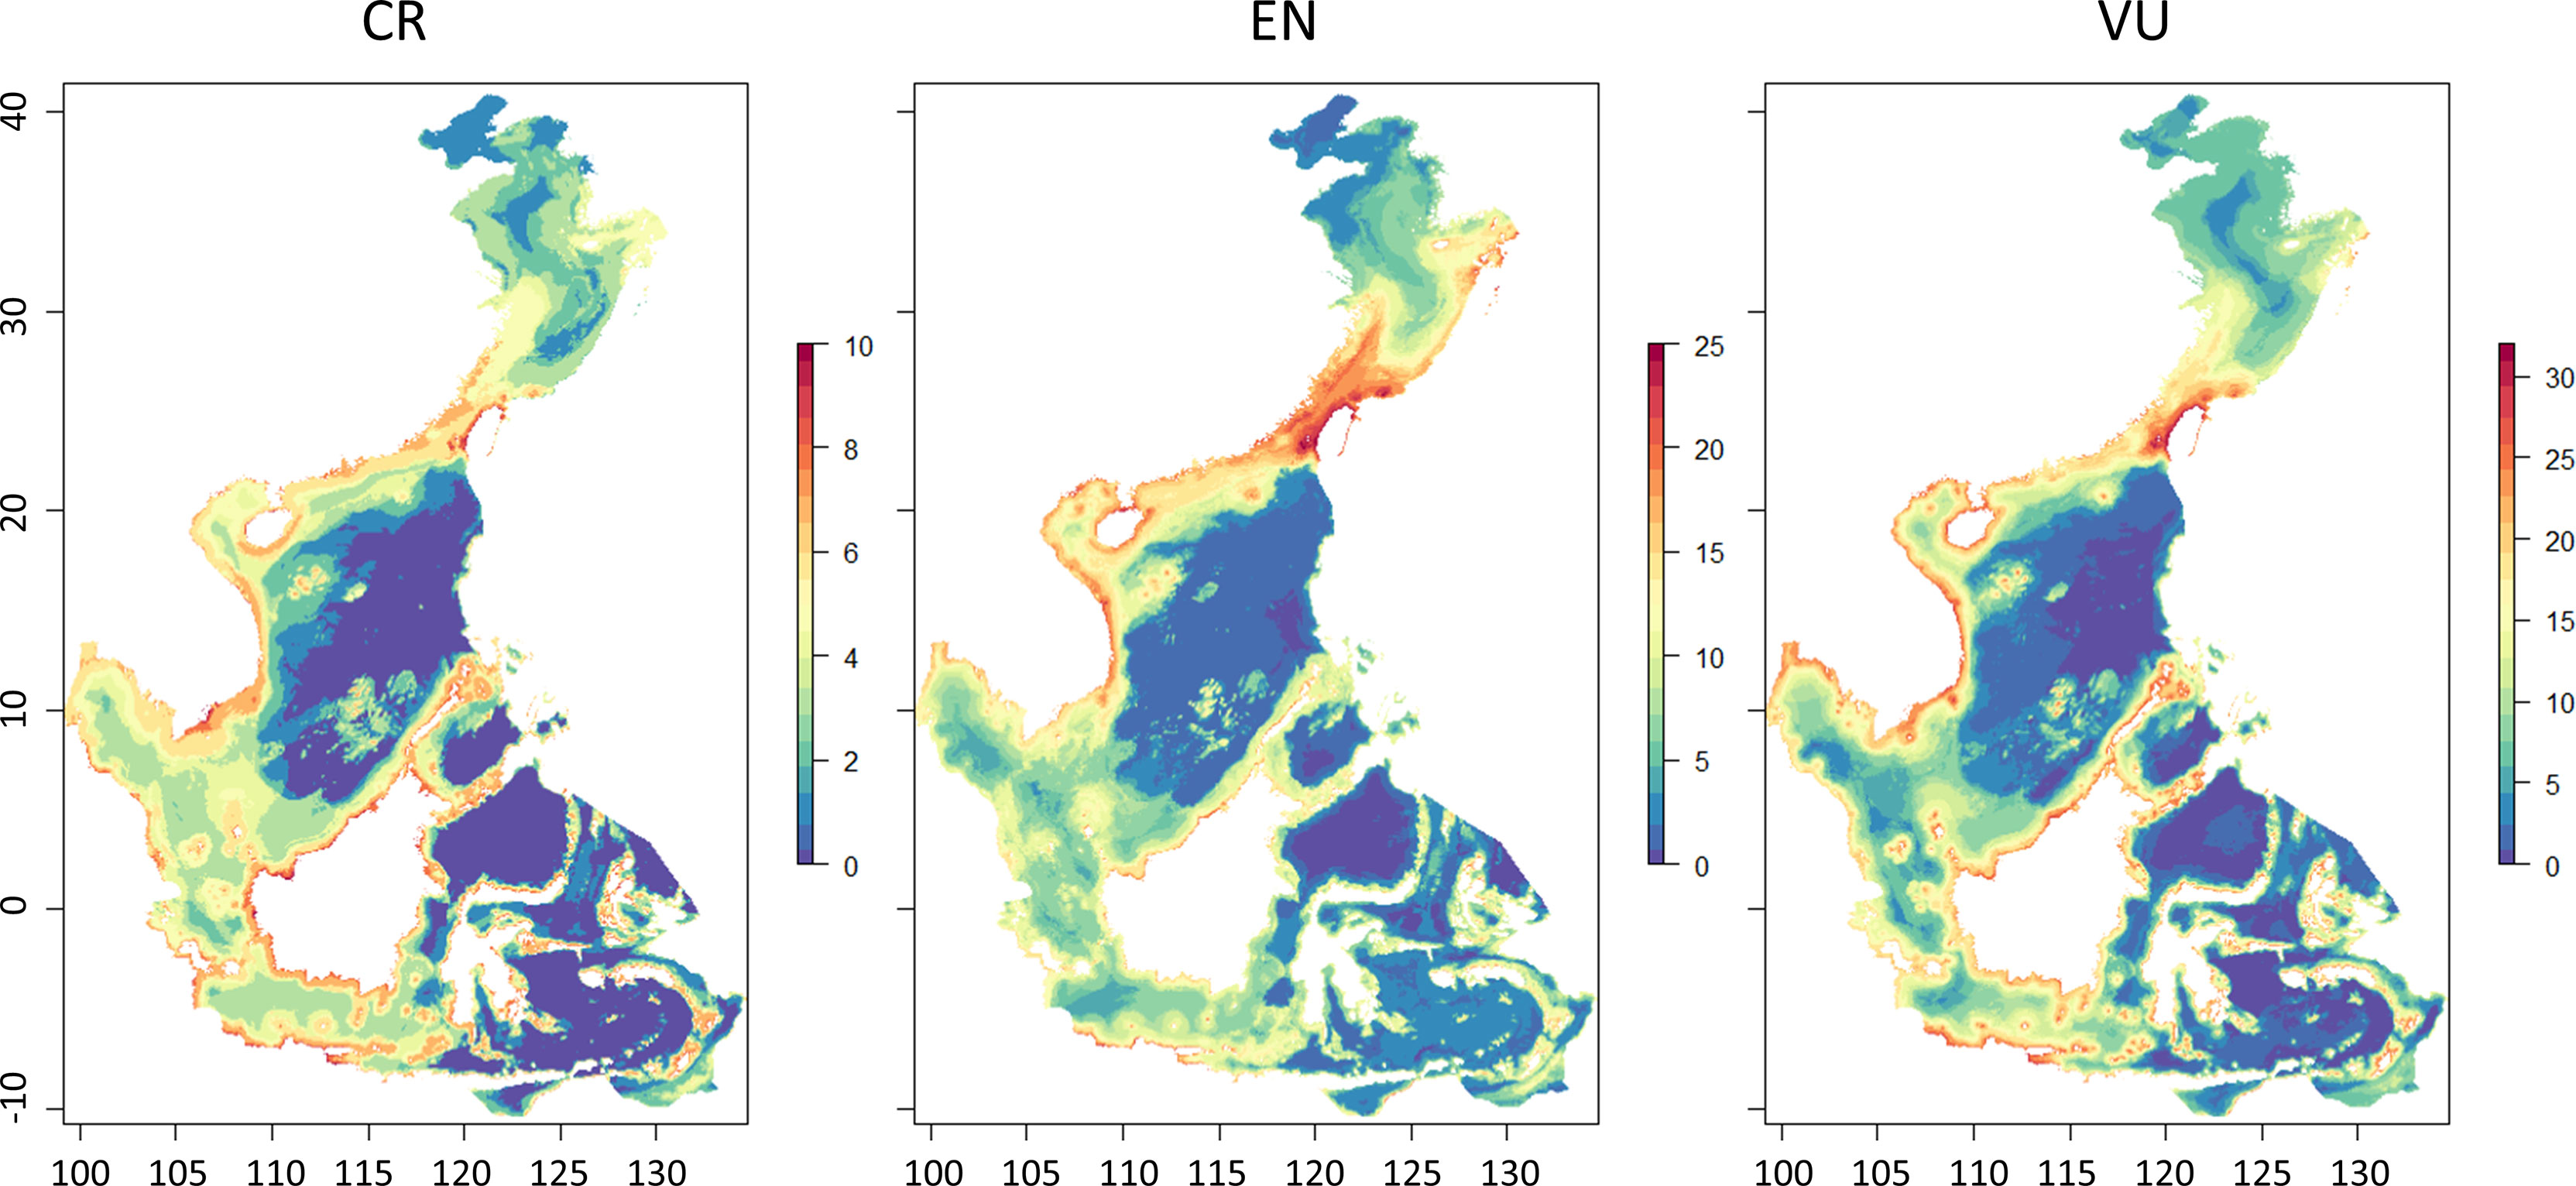
Figure 5 Species distribution of the different ETP groups.
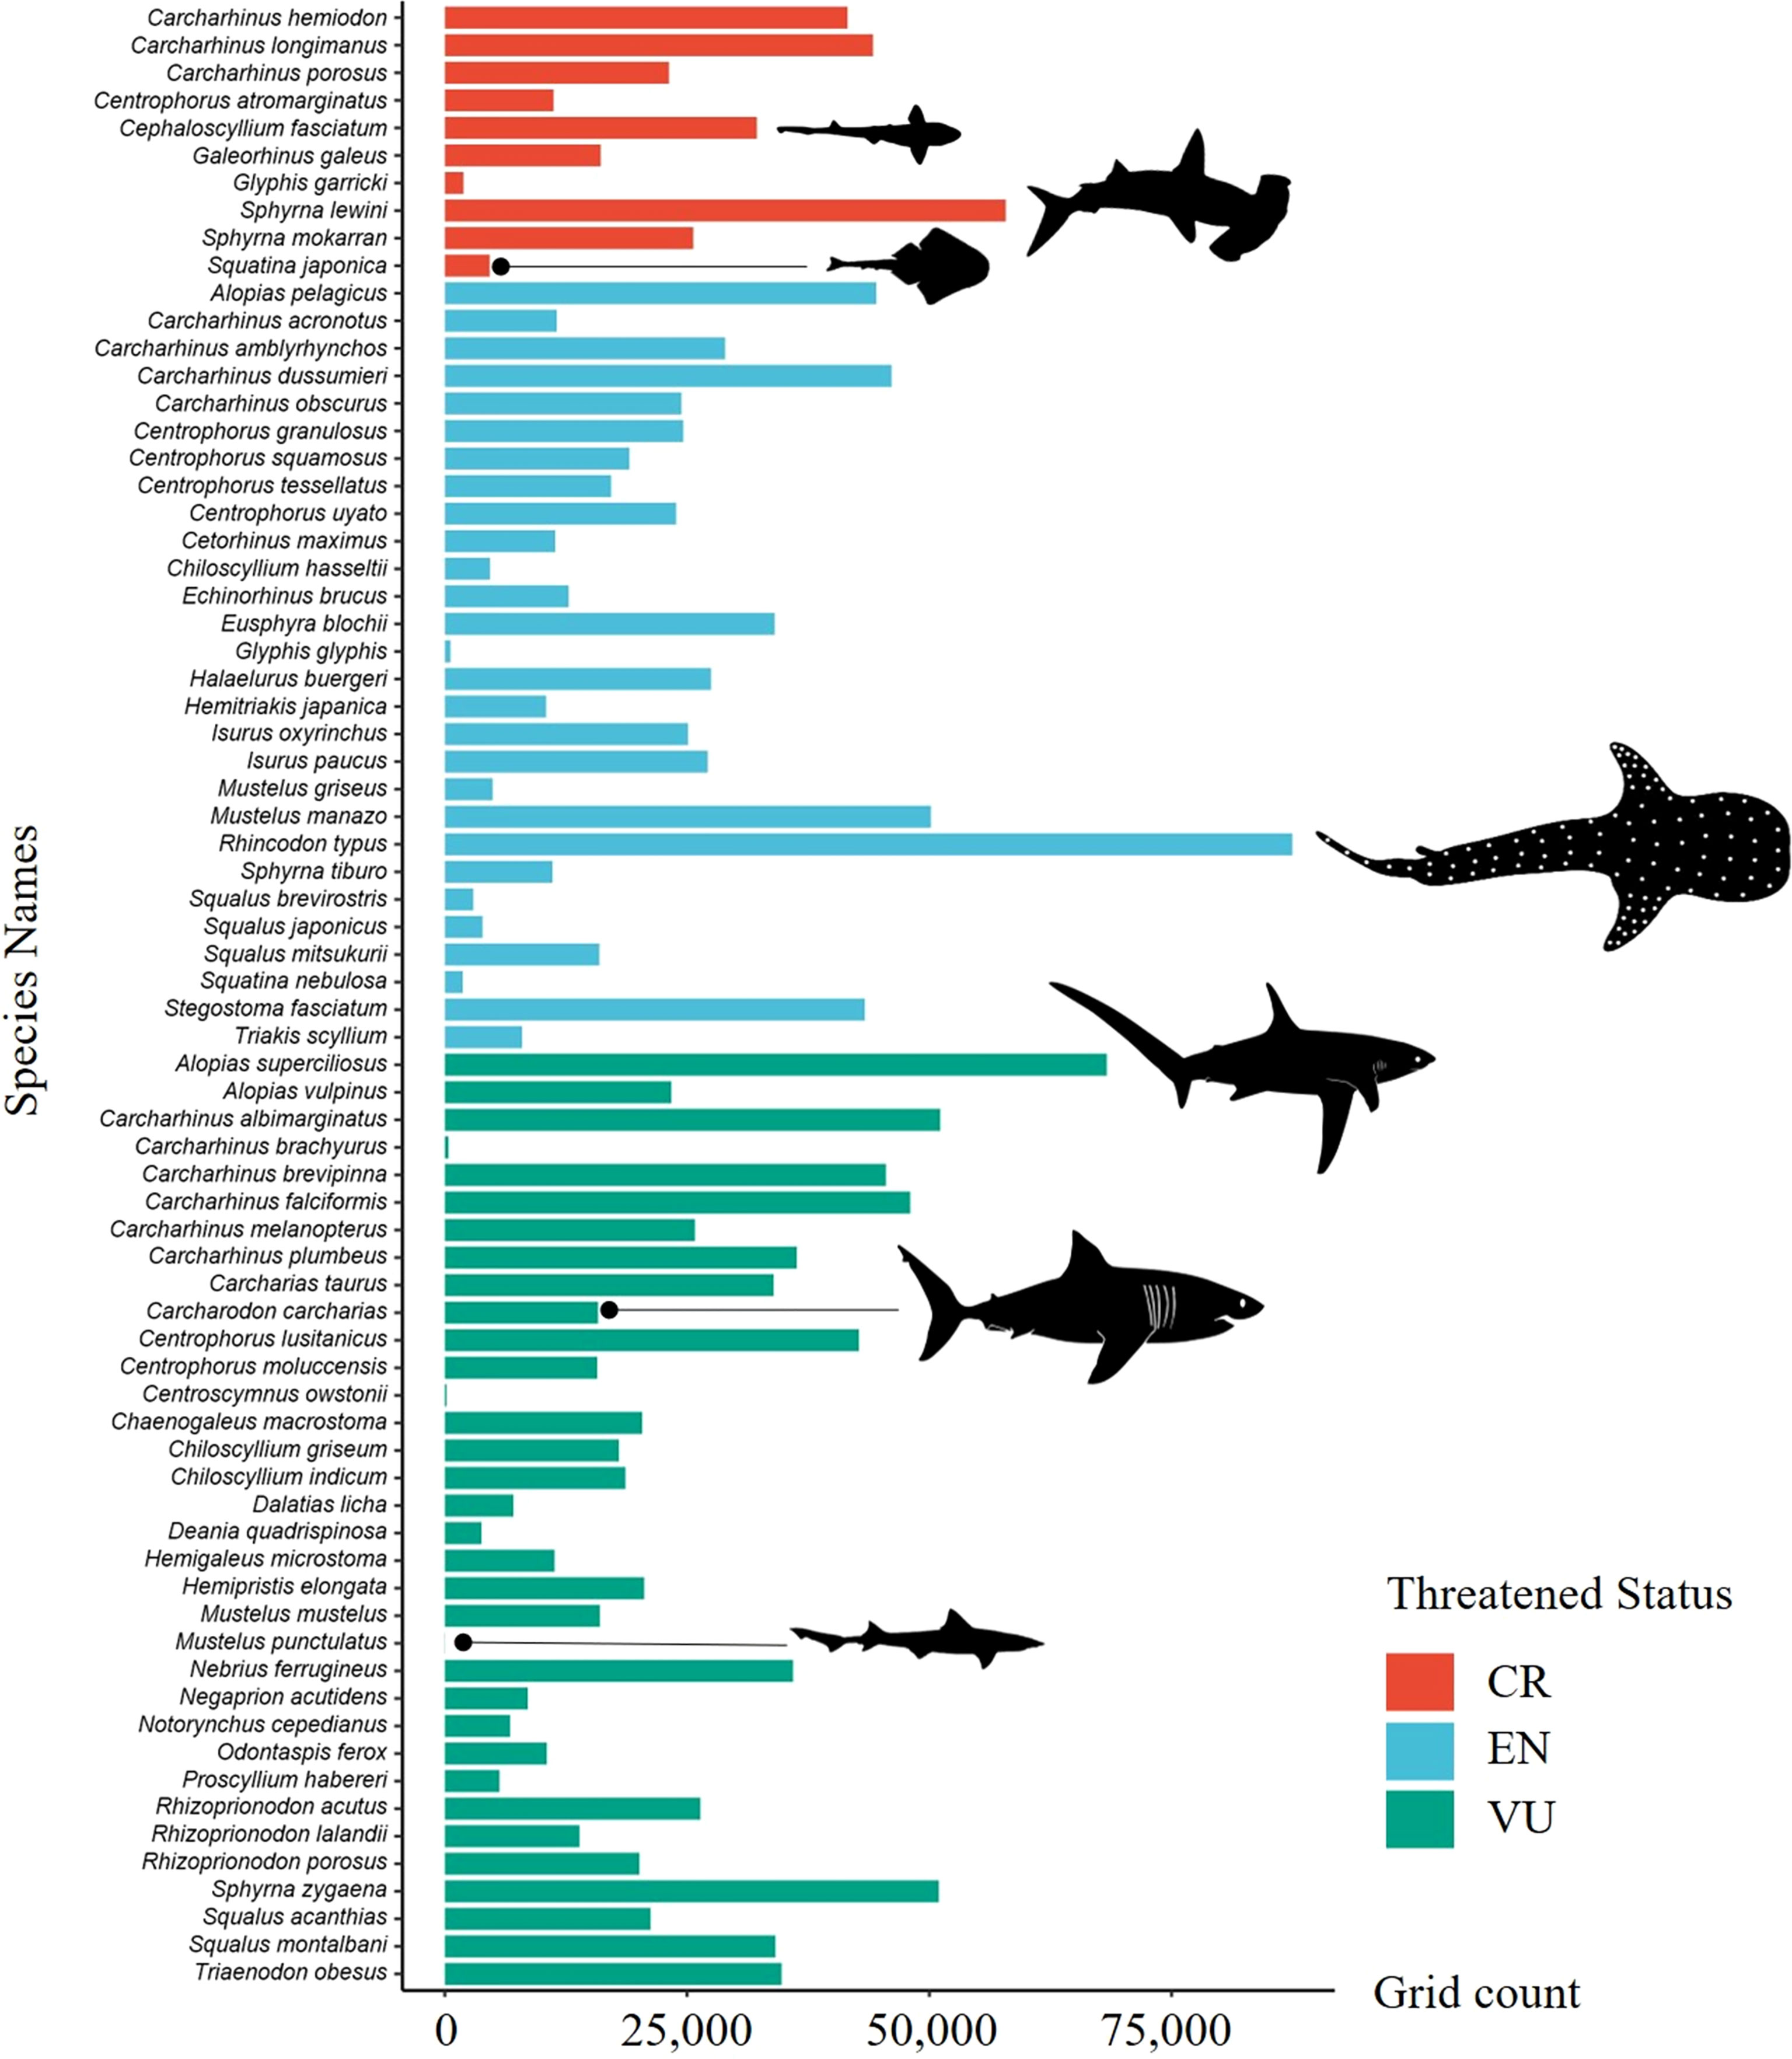
Figure 6 Potential distribution range of ETP species.
Setting Conservation Priorities
The existing MPA network currently covers 2.1% of the ocean, with MPAs scattered along the coast and on islands. The patch size and dispersion of conservation priorities substantially differed among scenarios (Figure 7). Regarding the achievement of conservation goals, it was found that the existing MPAs (baseline scenario) protected only 32.9% of all species and 43.1% of the ETP species. The average protection range of ETP species was less than 5%, suggesting that there were large conservation gaps within the region (Table 4). The number of protected species and the distribution range substantially improved under the four scenarios. The number of protected species increased by 55 to 61, and the number of protected ETP species increased by 25 under low target scenarios. Under the high target scenarios, the number of protected species increased by 79, and the number of protected ETP species increased by 34 to 35. The conservation range of the ETP species was two to three times higher for the low target scenarios than for the baseline scenario. In contrast, it was five to eight times higher with the high target scenarios.
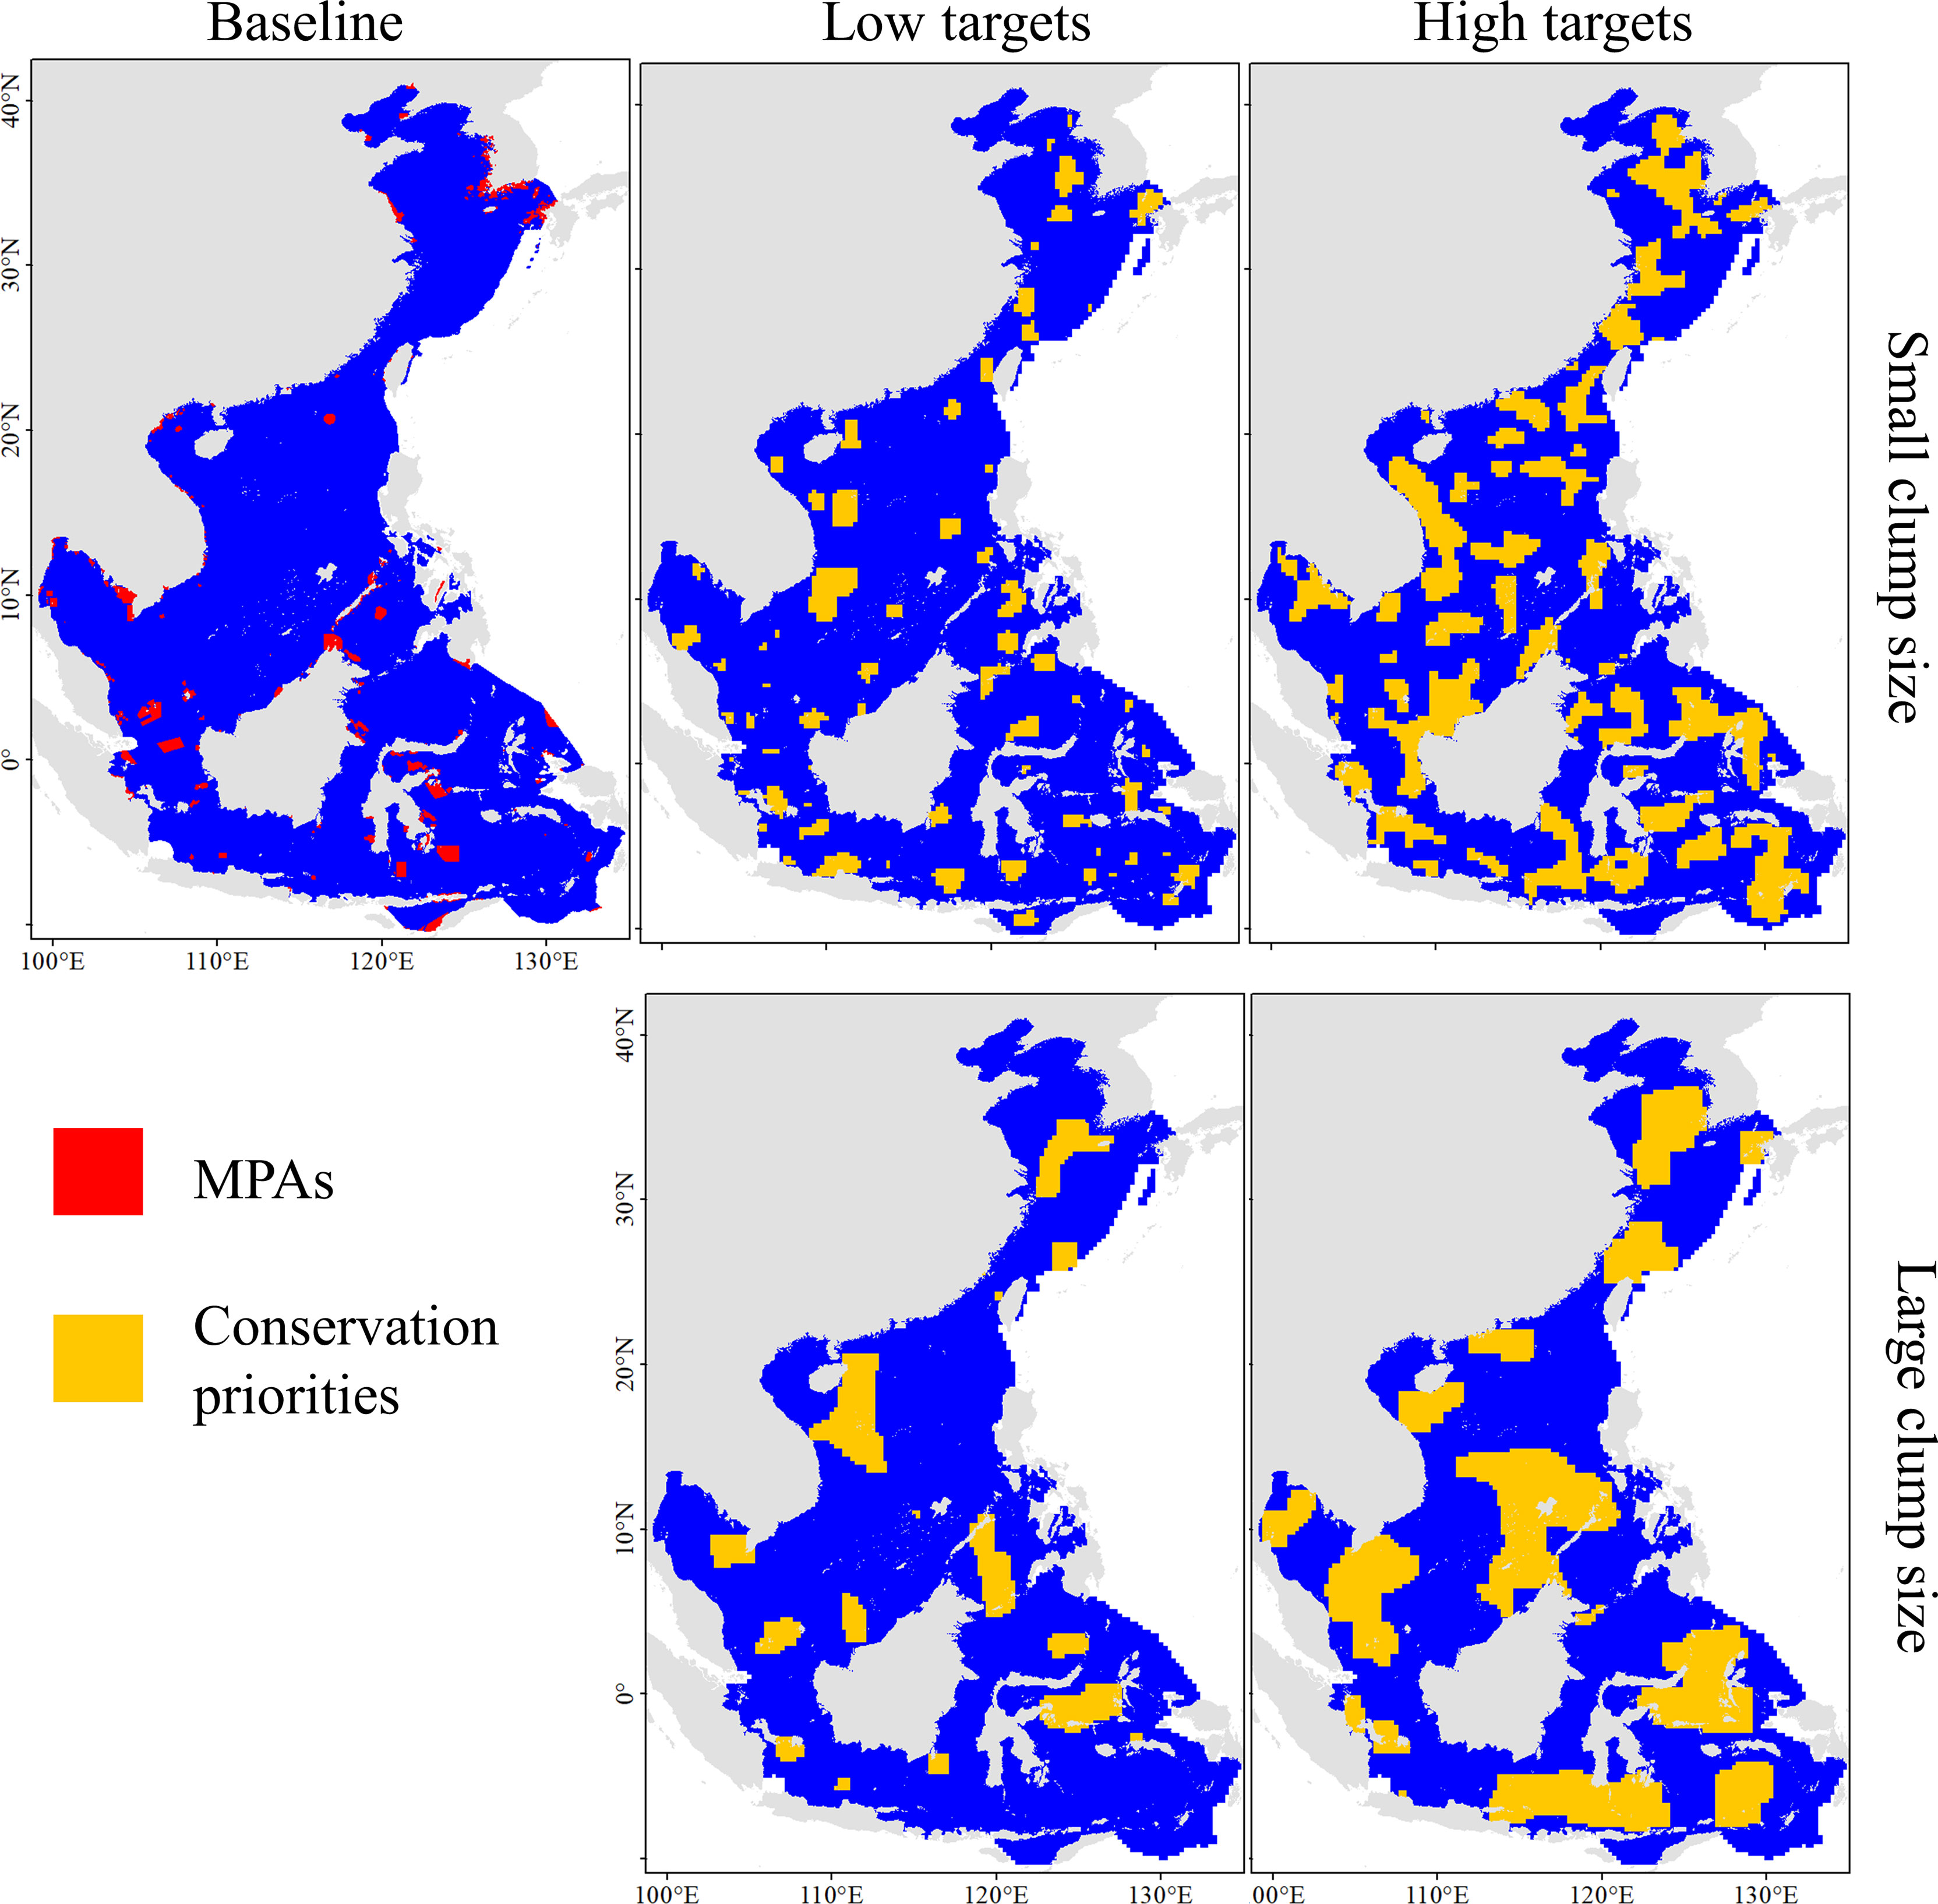
Figure 7 Best solutions for conservation priorities under different scenarios.
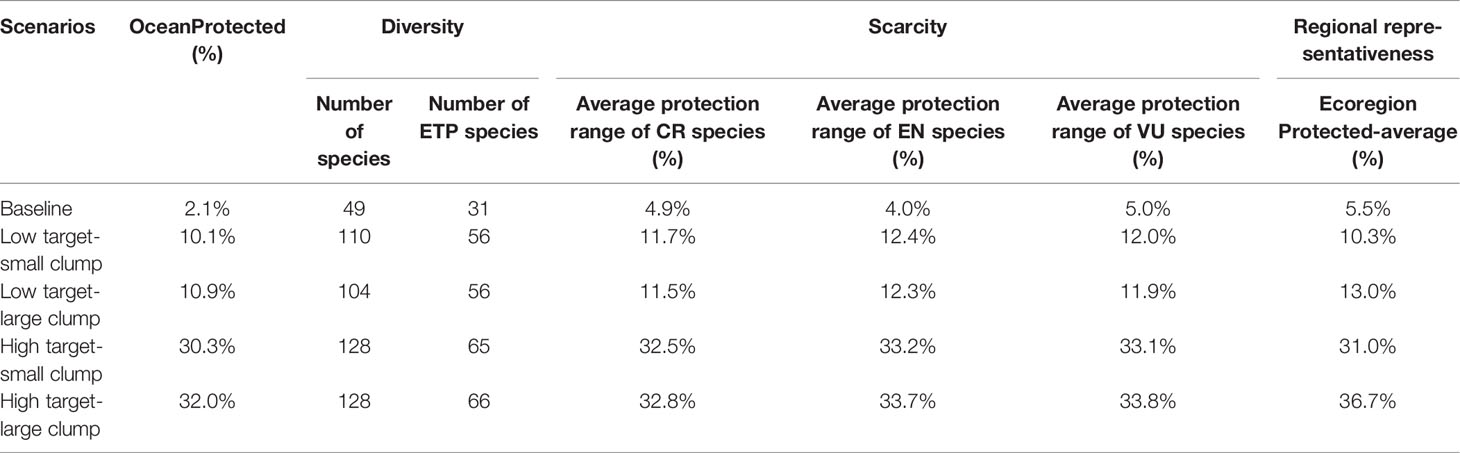
Table 4 Conservation target achievements for different scenarios.
It is likely that low target scenarios are highly beneficial if only the number of protected species is considered. Approximately 10% of the prioritized areas could protect 69.8%–73.8% of all species and 77.8% of the ETP species. However, in the low target scenarios, 11–12% of the habitat range was protected, which is insufficient. In the high target scenarios, 30% of the prioritized areas could protect 85% of all species and more than 90% of the ETP species, and the average protected range of ETP species exceeded 30%. Therefore, 30% of the priority areas would considerably enhance conservation effectiveness. The large clump pattern had a slightly higher conservation achievement than the small clump pattern for similarly high conservation targets. However, we also observed that the priorities under large clump scenarios have various transboundary situations. This may not be conducive to the planning and coordination of conservation actions, resulting in further resistance and challenges in achieving conservation targets.
Discussion
Environment Factors Affecting Shark Distribution
Shark distribution is affected by several key environmental variables. In the present study, bathymetry and dissolved oxygen were the most important factors contributing to the distribution of most sharks, which is consistent with the conclusions of other studies. Bathymetry is well known to strongly influence the distribution of sharks. Depth limits have been identified for many shark species. Shark species that are widely distributed also show regional variation in their depth limits (Lucifora et al., 2011). Depth was identified as the most important environmental variable for the distribution of whale sharks (R. typus), and shallower coastal waters with higher chlorophyll-a values off the coast of northern Peru were predicted to be suitable habitats (Gonzalez-Pestana et al., 2020). Bathymetry was also considered the main environmental variable for the distribution of the angelshark (Squatina squatina), which may be because of the importance of depth for diel vertical migration and reproductive activity (Noviello et al., 2021). We found that higher shark species richness was within 200 m (Figure 2), which has also been confirmed by other studies. Most of the 33 sharks and rays were caught at a depth of 40–120 m in the waters adjacent to the main islands and reefs of the South China Sea (Chen et al., 2006). There was an occurrence rate of 73.91% at a depth of 120–200 m in the southwestern sea of the Nansha Islands (Zhang et al., 2018), and there was a high probability of occurrence for hammerhead sharks at depths less than 50 m in the southern Gulf of Mexico (Chan et al., 2021).
Dissolved oxygen is a limiting factor for water-breathing animals (Pauly, 2021), and also has an impact on the distribution of sharks and their survival and growth during the early stages of ontogeny (Sims, 2019; Crear et al., 2020; Musa et al., 2020). Maximum dissolved oxygen is the second most important environmental factor for hammerhead sharks (Chan et al., 2021). Dissolved oxygen concentrations can limit the distribution of sharks, such as the shortfin mako (Isurus oxyrinchus) (Abascal et al., 2011), the great white shark (C. carcharias) (Nasby-Lucas et al., 2009), and bull sharks (C. leucas) (Heithaus et al., 2009). Other factors can also contribute to the distribution of sharks, such as the distance from land, current velocity, and primary productivity. Along the edge of the continental shelf, ocean currents can bring nutrient-rich seawater to the surface, and sharks, as the top predators, are attracted to these highly productive areas (Zhu, 1960; Baumgartner, 1998).
Distribution Patterns and Diversity Hotspots for Sharks
Latitudinal patterns showed a distribution of high species richness between 30°N and 10°S in China and the ASEAN seas (Figure 3). This is in line with results from the previous global study undertaken between 30 and 40 degrees in both hemispheres (Lucifora et al., 2011; Kaschner et al., 2019). Shark species richness was found to be higher in continental ecoregions such as the East China Sea (144), Southern Vietnam (132), and the Sunda Shelf (134), and lower in deeper waters such as Northeast Sulawesi (85). This is consistent with prior results showing higher species richness on the continental shelves and slopes, and lower species richness in the open sea (Carpenter and Springer, 2005; Lucifora et al., 2011). In this study, the potential number of shark species in the Yellow Sea, East China Sea, and South China Sea were 68, 144, and 124, respectively (Figure 3), in line with historical records for these areas. In China, most shark species are found in tropical and subtropical areas (Zhu, 1958). There were 103 shark species recorded in the East China Sea, accounting for 77.4% of the shark species in China. The shark caught in the southern East China Sea was also the highest, accounting for approximately 44% of China’s total shark catch (Zhang, 2005). There were 25 and 98 species recorded in the Bohai-Yellow Sea and the South China Sea, respectively (Zhang, 2003; Zhang and Yang, 2005).
The diversity hotspot was identified at 22–26°N around the Taiwan Strait. The shark species richness in this region was approximately 90–130. Globally, several studies have also highlighted that the hotspots for shark species richness were off the coastlines of Taiwan and Japan with up to 85 species. This was attributed to the mixing of temperate and tropical fauna (Carpenter and Springer, 2005; Lucifora et al., 2011). The spatial congruency of shark and ray species richness hotspots was low for all species, endemic species and evolutionarily distinct species. However, the congruency region includes Taiwan and parts of southern China (Derrick et al., 2020). The Taiwan Strait is at the transitional area between the East China Sea and the South China Sea, close to the Tropic of Cancer. It is strongly affected by currents including the Kuroshio tributaries, the Taiwan Warm Current, the Zhejiang-Fujian Coastal Current, and the South China Sea Warm Current (Liu, 2008). Fish diversity in this area is high, with a total of 1,697 fish and 98 sharks recorded in and around the Taiwan Strait (Zhang and Yang, 2005; Chen et al., 2014). Fujian province is in the western Taiwan Strait and has a long history of using shark resources. Fishermen in coastal counties often catch sharks, and 21 shark species were recorded there approximately 100 years ago (Wu, 1929; Tang, 1936; Qiu, 1954). As early as the 1950s, Fujian had more than 100 longline shark fishing boats (Lin, 1995; Zhang, 2005). Therefore, historical records are in line with the results of the present study in identifying the hotspots of the Taiwan Strait. Shark species richness is lower in the Northeast Sulawesi ecoregion than in tropical areas such as the Banda Sea. These differences may be because of the different habitat requirements of sharks and the unique ecological environmental conditions of each ecoregion (Lucifora et al., 2011).
Most of the shark orders and ETP species were distributed along the coast of the study area. The hotspot was located off the Taiwan Strait, similar to the distribution pattern of all the shark species. The Carcharhiniformes were the largest shark group in this study and were predominantly distributed on the tropical continental shelf (Figure 4). The Carcharhinidae have been identified as the most diverse group in the southern South China Sea based on landing data (Arai and Azri, 2019). The Carcharhinidae and Sphyrnidae represented 77.1% and 21.7% of the fins identified in the Hong Kong markets, respectively (Cardeñosa et al., 2020). Carcharhinidae also has been shown to have the highest shark diversity in Thailand (30 species; 34.9%), followed by Scyliorhinidae (8 species; 9.3%) (Krajangdara, 2019). Globally, the main hotspots for threatened and endemic sharks and rays are in the South and East China Sea, coastal southeast South America, and off the coast of eastern Australia (Davidson and Dulvy, 2017; Stein et al., 2018). Sharks in developing countries are at a high risk of overfishing, and there is a disproportionate level of threat for more than three-fourths of coastal species in the tropics and subtropics (Dulvy et al., 2021). There is a large overlap between the shark hotspots and global fishing efforts (Queiroz et al., 2019). The spawning, nursery, and feeding grounds of most sharks often overlap with the fishing grounds in the southern South China Sea (Arai and Azri, 2019). Shark fishing efforts have also been concentrated within exclusive economic zones, mostly in coastal areas in Indonesia and Japan (Van Houtan et al., 2020). The shark fin trade is a considerable source of mortality for many threatened species. Therefore, enhanced international trade regulations for these threatened species are still a conservation priority (Cardeñosa et al., 2020).
The distribution range of each species was found to vary substantially (Figure 6). The potential distribution of the whale shark (R. typus) was the most extensive in the present study area. The whale shark is a filter-feeding shark with global distribution in tropical and warm temperate regions that fed on zooplankton (Pierce and Norman, 2016; Gonzalez-Pestana et al., 2020). The scalloped hammerhead (S. lewini) is also distributed in warm temperate and tropical seas and frequently occurs in the southern South China Sea and the southern Gulf of Mexico. It is the most dominant species in the Sarawak state in East Malaysia (Arai and Azri, 2019; Chan et al., 2021). In contrast, the distribution of the Japanese angelshark (S. japonica) was found to be narrow in the present study. This is consistent with the description that it is endemic to the Northwest Pacific Ocean, occurring from southern Russia to southern Taiwan (Walls et al., 2021).
Conservation Priorities and Uncertainty
Determining where conservation efforts should focus on providing adequate protection is highly important to reduce the risk of extinction for threatened species. At present, 7.93% of the ocean is protected globally (UNEP-WCMC and IUCN, 2022), whereas the existing MPA network in China and the ASEAN protects 2.1% of the ocean (Table 4), with less than half of the species being protected in the MPAs. Although awareness of the ecological role and vulnerability of sharks has led to increased conservation attention, only a small number of MPAs have been designated to protect them (Giménez et al., 2020). The majority of these shark sanctuaries are in Palau, the Maldives, the Caribbean, and the Netherlands (Ward-Paige and Worm, 2017), while there are almost no shark MPAs around diversity hotspots in the China and ASEAN seas. Therefore, there is a substantial conservation gap for sharks in the study area.
To sustainably manage and protect coastal and marine biodiversity, international organizations have proposed global marine conservation targets ranging from 10% to 50% (CBD/COP/DEC/X/2, 2010; CBD/COP/15/5/Add.1; World Parks Congress, 2014; Sala et al., 2021). One study suggested that the top 30% of MPAs should be prioritized for marine biodiversity conservation (Zhao et al., 2020), while another found that at least 40% of the seas are required to protect threatened marine species and biodiversity (Jefferson et al., 2021). However, there are complex conservation efficiency and trade-offs in the siting of conservation priority areas. There is a nonlinear relationship between the conservation target distribution and conservation costs. In the present study, the number of protected species increased by only approximately 15% (from 73.8 to 85%) when the global protected area coverage increased by 200% (from 10% to 30%), whereas the protected range of ETP species increased by 170% (from 11% to 30%). This indicates that low conservation targets only improved the number of protected species, and high targets were both better for the number of protected species and the protected range of the ETP species (Table 4). Some studies also highlighted a marginal decrease in conservation efficiency. Under the cheapest cost scenario, the number of protected species increased by 6% when global terrestrial protected area coverage increased by 30%. The number of protected species can be substantially increased if costs are appropriately increased (Venter et al., 2014). Furthermore, tight clumping results in fewer but larger selected areas, resulting in a reduced boundary effect, leading to a slightly higher conservation achievement than a small clump (Serra et al., 2020; Christodoulou et al., 2021). Therefore, the high target scenario with large clumps was the most desirable among several protection scenarios. However, conservation within EEZs and transboundaries should be considered when identifying conservation priority areas. Zoning strategies are the most cost-effective conservation approaches that can enhance the protection of marine biodiversity and are more likely to gain stakeholder support (Giménez et al., 2020). Conservation priority areas located within EEZs can be protected by the countries involved, whereas transboundary conservation requires more effort for communication and collaboration among stakeholders (Friedman et al., 2018; Mason et al., 2020). Many shark species are migratory and each shark species is found in the waters of eight countries on average. The blue shark was found to span the waters of 145 countries (Dulvy et al., 2017). From a global perspective, the management of shark conservation priority areas requires joint participation from relevant countries (Jorgensen et al., 2022).
The present study investigated diversity distribution patterns and conservation priorities for sharks in the China and the ASEAN seas based on 149 species owing to data availability. However, according to historical records, there are approximately 196 shark species in this area. Habitat descriptions of the missing 47 species can only be found in the literature and through expert knowledge without enough occurrence records (Lucifora et al., 2011). The lack of reliable distribution information hinders the comprehensive mapping work. Furthermore, anthropogenic activities and climate change factors, which have been added to the SCP as cost layers in recent studies, were not included in this study (Stein et al., 2018; Arafeh-Dalmau et al., 2021). This study was a preliminary attempt to understand the diversity hotspots and conservation priority areas for sharks in the China and ASEAN seas. Future studies should further evaluate spatial and temporal distribution patterns under anthropogenic drivers and climate change.
Conclusions
This study revealed spatial diversity patterns and conservation priority areas for 149 shark species in the China and ASEAN seas. While the results showed that the distribution pattern of shark species richness peaked on the continental shelves and a hotspot for shark diversity was found around the Taiwan Strait, there was a substantial conservation gap identified in the study region. Identifying conservation priority areas under different target scenarios would provide a scientific basis for shark conservation and management.
Data Availability Statement
The original contributions presented in the study are included in the article/Supplementary Material. Further inquiries can be directed to the corresponding authors.
Author Contributions
JD: Conceptualization, Funding acquisition, methodology, software, writing. WH: Conceptualization, funding acquisition, methodology, writing, supervision. LD: Formal analysis, data curation, writing. ShS: Formal analysis, data curation, software. YW: Data curation, software. K-HL: Data curation, software. SY: Data curation. MC: Data curation. KR: Data curation. SeS: Data curation. ZL: Data curation, Funding acquisition. BC: Resources, funding acquisition, supervision. All authors contributed to the article and approved the submitted version.
Funding
This work was financially supported by the National Natural Science Foundation of China (grant numbers 42176153, 41906127), the China-ASEAN Maritime Cooperation Fund “Marine Protected Areas Network in China-ASEAN Countries”, the China-Indonesia Maritime Cooperation Fund “Development of Indonesia-China Center for Ocean & Climate”, the National Program on Global Change and Air-Sea Interaction (grant number HR01-200701), and partly provided by TIO-UM Cooperation Fund "Diversity and Community Structure of Fishes in Malaysian Water" (grant number IF004‐2022).
Conflict of Interest
The authors declare that the research was conducted in the absence of any commercial or financial relationships that could be construed as a potential conflict of interest.
Publisher’s Note
All claims expressed in this article are solely those of the authors and do not necessarily represent those of their affiliated organizations, or those of the publisher, the editors and the reviewers. Any product that may be evaluated in this article, or claim that may be made by its manufacturer, is not guaranteed or endorsed by the publisher.
Supplementary Material
The Supplementary Material for this article can be found online at: https://www.frontiersin.org/articles/10.3389/fmars.2022.933291/full#supplementary-material
References
Abascal F. J., Quintans M., Ramos-Cartelle A., Mejuto J. (2011). Movements and Environmental Preferences of the Shortfin Mako, Isurus Oxyrinchus, in the Southeastern Pacific Ocean. Mar. Biol. 158, 1175–1184. doi: 10.1007/s00227-011-1639-1
Ali A. B., Fahmi F., Dharmadi D., Krajangdara T., Khiok A. L. P. (2018). Biodiversity and Habitat Preferences of Living Sharks in the Southeast Asian Region. Indones. Fish. Res. J. 24, 133–140. doi: 10.15578/ifrj.24.2.2018.133-140
Allouche O., Tsoar A., Kadmon R. (2006). Assessing the Accuracy of Species Distribution Models: Prevalence, Kappa and the True Skill Statistic (TSS). J. Appl. Ecol. 43, 1223–1232. doi: 10.2307/4123815
Arafeh-Dalmau N., Brito-Morales I., Schoeman D. S., Possingham H. P., Klein C. J., Richardson A. J. (2021). Incorporating Climate Velocity Into the Design of Climate-Smart Networks of Marine Protected Areas. Methods Ecol. Evol. 12, 1969–1983. doi: 10.1111/2041-210X.13675
Arai T., Azri A. (2019). Diversity, Occurrence and Conservation of Sharks in the Southern South China Sea. PloS One 14, e0213864. doi: 10.1371/journal.pone.0213864
Ardron J. A., Possingham H. P., Klein C. J. (2008). Marxan Good Practices Handbook. Pacific Marine Analysis and Research Association (Vancouver:Pacific Marine Analysis and Research Association), 149.
Assis J., Tyberghein L., Bosh S., Verbruggen H., Serrao E. A., De Clerck O. (2018). Bio-ORACLE V2.0: Extending Marine Data Layers for Bioclimatic Modelling. Glob. Ecol. Biogeogr. 27, 277–284. doi: 10.1111/geb.12693
Austin R. A., Hawkes L. A., Doherty P. D., Henderson S. M., Inger R., Johnson L., et al (2019). Predicting Habitat Suitability for Basking Sharks (Cetorhinus Maximus) in UK Waters Using Ensemble Ecological Niche Modelling. J. Sea Res. 153, 101767. doi: 10.1016/j.seares.2019.101767
Baumgartner M. F. (1998). The Distribution of Risso's Dolphin (Grampus Griseus) With Respect to the Physiography of the Northern Gulf of Mexico. Oceanogr. Lit. Rev. 1, 124. doi: 10.1111/j.1748-7692.1997.tb00087.x
Birkmanis C. A., Freer J. J., Simmons L. W., Partridge J. C., Sequeira A. M. (2020). Future Distribution of Suitable Habitat for Pelagic Sharks in Australia Under Climate Change Models. Front. Mar. Sci. 570. doi: 10.3389/fmars.2020.00570
Cardeñosa D., Shea K. H., Zhang H., Feldheim K., Fischer G. A., Chapman D. D. (2020). Small Fins, Large Trade: A Snapshot of the Species Composition of Low-Value Shark Fins in the Hong Kong Markets. Anim. Conserv. 23, 203–211. doi: 10.1111/acv.12529
Carpenter K. E., Springer V. G. (2005). The Center of the Center of Marine Shore Fish Biodiversity: The Philippine Islands. Environ. Biol. Fishes 72, 467–480. doi: 10.1007/s10641-004-3154-4
CBD/COP/15/5/Add.1 (2021). Available at: https://www.cbd.int/doc/c/c2db/972a/fb32e0a277bf1ccfff742be5/cop-15-05-add1-en.pdf.
Chamberlain S. (2022) Scrubr: Clean Biological Occurrence Records. Available at: https://github.com/ropensci/scrubrhttps://docs.ropensci.org/scrubr/(docs).
Chamberlain S., Ram K., Hart T. (2014) Spocc: R Interface to Many Species Occurrence Data Sources. R Package Version 0.1.0. Available at: https://github.com/ropensci/spocc.
Chan M. Y. C., Sosa-Nishizaki O., Pérez-Jiménez J. C. (2021). Potential Distribution of Critically Endangered Hammerhead Sharks and Overlap With the Small-Scale Fishing Fleet in the Southern Gulf of Mexico. Reg. Stud. Mar. Sci. 46, 101900. doi: 10.1016/j.rsma.2021.101900
Chen G., Li Y., Chen X., Shu L. (2006). Composition and Distribution of Cartilaginous Fishes in the Adjacent Waters Area of Main Islands and Reefs of South China Sea. J. Shanghai Ocean Univ. 15, 461–467. doi: 10.3969/j.issn.1004-7271.2006.04.014
Chen Y., Zhang J., Song P., Zhang R., Li Y., Zhong Z., et al (2014). Composition of the Taiwan Strait Fish Fauna. Biodivers. Sci. 22, 525. doi: 10.3724/SP.J.1003.2014.14001
Christodoulou C. S., Griffiths G. H., Vogiatzakis I. N. (2021). Systematic Conservation Planning in a Mediterranean Island Context: The Example of Cyprus. Glob. Ecol. Conserv. 32, e01907. doi: 10.1016/j.gecco.2021.e01907
Compagno L. J., Dando M., Fowler S. (2005). Sharks of the World (New Jersy: Princeton University Press), 496 pp.
Conti L., Scardi M. (2010). Fisheries Yield and Primary Productivity in Large Marine Ecosystems. Mar. Ecol. Prog. Ser. 410, 233–244. doi: 10.3354/meps08630
Crear D. P., Latour R. J., Friedrichs M. A., St-Laurent P., Weng K. C. (2020). Sensitivity of a Shark Nursery Habitat to a Changing Climate. Mar. Ecol. Prog. Ser. 652, 123–136. doi: 10.3354/meps13483
Crimmins S. M., Dobrowski S. Z., Mynsberge A. R. (2013). Evaluating Ensemble Forecasts of Plant Species Distributions Under Climate Change. Ecol. Modell. 266, 126–130. doi: 10.1016/j.ecolmodel.2013.07.006
Cuesta F., Peralvo M., Merino-Viteri A., Bustamante M., Baquero F., Freile J. F., et al (2017). Priority Areas for Biodiversity Conservation in Mainland Ecuador. Neotrop. Biodivers. 3, 93–106. doi: 10.1080/23766808.2017.1295705
Davidson L. N., Dulvy N. K. (2017). Global Marine Protected Areas to Prevent Extinctions. Nat. Ecol. Evol. 1, 1–6. doi: 10.1038/s41559-016-0040
Derrick D. H., Cheok J., Dulvy N. K. (2020). Spatially Congruent Sites of Importance for Global Shark and Ray Biodiversity. PloS One 15, e0235559. doi: 10.1371/journal.pone.0235559
Diaz-Carballido P. L., Mendoza-González G., Alberto Yáñez-Arenas C., Chiappa-Carrara X. (2022). Evaluation of Shifts in the Potential Future Distributions of Carcharhinid Sharks Under Different Climate Change Scenarios. Front. Mar. Sci. 2039. doi: 10.3389/fmars.2021.745501
Dulvy N. K., Fowler S. L., Musick J. A., Cavanagh R. D., Kyne P. M., Harrison L. R, et al (2014). Extinction Risk and Conservation of the World's Sharks and Rays. eLife 3, e00590. doi: 10.7554/eLife.00590
Dulvy N. K., Pacoureau N., Rigby C. L., Pollom R. A., Jabado R. W., Ebert D. A., et al (2021). Overfishing Drives Over One-Third of All Sharks and Rays Toward a Global Extinction Crisis. Curr. Biol. 31, 4773–4787.e8. doi: 10.1016/j.cub.2021.08.062
Dulvy N. K., Simpfendorfer C. A., Davidson L. N. K., Fordham S. V., Bräutigam A., Sant G, et al (2017). Challenges and Priorities in Shark and Ray Conservation. Curr. Biol. 27, 565–572. doi: 10.1016/j.cub.2017.04.038
Dureuil M., Boerder K., Burnett K. A., Froese R., Worm B. (2018). Elevated Trawling Inside Protected Areas Undermines Conservation Outcomes in a Global Fishing Hot Spot. Science 362, 1403–1407. doi: 10.1126/science.aau0561
Espinoza M., Araya-Arce T., Chaves-Zamora I., Chinchilla I., Cambra M. (2020). Monitoring Elasmobranch Assemblages in a Data-Poor Country From the Eastern Tropical Pacific Using Baited Remote Underwater Video Stations. Sci. Rep. 10, 1–18. doi: 10.1038/s41598-020-74282-8
Ferretti F., Myers R. A., Serena F., Lotze H. K. (2008). Loss of Large Predatory Sharks From the Mediterranean Sea. Conserv. Biol. 22, 952–964. doi: 10.1111/j.1523-1739.2008.00938.x
Fourcade Y., Besnard A. G., Secondi J. (2018). Paintings Predict the Distribution of Species, or the Challenge of Selecting Environmental Predictors and Evaluation Statistics. Glob. Ecol. Biogeogr. 27, 245–256. doi: 10.1111/geb.12684
Friedman K., Gabriel S., Abe O., Adnan Nuruddin A., Ali A., Bidin Raja Hassan R., et al (2018). Examining the Impact of CITES Listing of Sharks and Rays in Southeast Asian Fisheries. Fish Fish. 19, 662–676. doi: 10.1111/faf.12281
Froese R., Pauly D. (2022). FishBase (World Wide Web electronic publication). Available at: www.fishbase.org.
Garzon F., Graham R. T., Witt M. J., Hawkes L. A. (2021). Ecological Niche Modeling Reveals Manta Ray Distribution and Conservation Priority Areas in the Western Central Atlantic. Anim. Conserv. 24, 322–334. doi: 10.1111/acv.12663
Giménez J., Cardador L., Mazor T., Kark S., Bellido J. M., Coll M., et al (2020). Marine Protected Areas for Demersal Elasmobranchs in Highly Exploited Mediterranean Ecosystems. Mar. Environ. Res. 160, 105033. doi: 10.1016/j.marenvres.2020.105033
González-Andrés C., Sánchez-Lizaso J. L., Cortés J., Pennino M. G. (2021). Predictive Habitat Suitability Models to Aid the Conservation of Elasmobranchs in Isla Del Coco National Park (Costa Rica). J. Mar. Syst. 224, 103643. doi: 10.1016/j.jmarsys.2021.103643
Gonzalez-Pestana A., Maguiño R., Mendoza A., Kelez S., Ramírez-Macías D. (2020). Distribution of Whale Shark (Rhincodon Typus) Off Northern Peru Based on Habitat Suitability. Aquat. Conserv.: Mar. Freshw. Ecosyst. 30, 1325–1336. doi: 10.1002/aqc.3330
Heithaus M. R., Delius B. K., Wirsing A. J., Dunphy-Daly M. M. (2009). Physical Factors Influencing the Distribution of a Top Predator in a Subtropical Oligotrophic Estuary. Limnol. Oceanogr. 54, 472–482. doi: 10.4319/lo.2009.54.2.0472
IUCN (2022) The IUCN Red List of Threatened Species. Available at: https://www.iucnredlist.org.
Jefferson T., Costello M. J., Zhao Q., Lundquist C. J. (2021). Conserving Threatened Marine Species and Biodiversity Requires 40% Ocean Protection. Biol. Conserv. 264, 109368. doi: 10.1016/j.biocon.2021.109368
Jellinek S. (2017). Using Prioritisation Tools to Strategically Restore Vegetation Communities in Fragmented Agricultural Landscapes. Ecol. Manage. Restor. 18, 45–53. doi: 10.1111/emr.12224
Jorgensen S. J., Micheli F., White T. D., Van Houtan K. S., Alfaro-Shigueto J., Andrzejaczek S., et al (2022). Emergent Research and Priorities for Shark and Ray Conservation. Endanger. Species Res. 47, 171–203. doi: 10.3354/esr01169
Kai M., Thorson J. T., Piner K. R., Maunder M. N. (2017). Predicting the Spatio-Temporal Distributions of Pelagic Sharks in the Western and Central North Pacific. Fish. Oceanogr. 26, 569–582. doi: 10.1111/fog.12217
Kaschner K., Kesner-Reyes K., Garilao C., Segschneider J., Rius-Barile J., Rees T., et al (2019) AquaMaps: Predicted Range Maps for Aquatic Species. Available at: https://www.aquamaps.org.
Lam V. Y., Sadovy de Mitcheson Y. (2011). The Sharks of South East Asia–unknown, Unmonitored and Unmanaged. Fish Fish. 12, 51–74. doi: 10.1111/j.1467-2979.2010.00383.x
Last P. R., White W. T., Caira J. N., Jensen K., Lim A. P., Manjaji-Matsumoto B. M., et al (2010). Sharks and Rays of Borneo. (Collingwood, Australia: Csiro publishing)
Levy J. S., Ban N. C. (2013). A Method for Incorporating Climate Change Modelling Into Marine Conservation Planning: An Indo-West Pacific Example. Mar. Policy 38, 16–24. doi: 10.1016/j.marpol.2012.05.015
Li Y., Jia X., Chen G. (2007). Coral Reef Fish Resources in the South China Sea (Beijing: Ocean Press).
Lin C. (1995). Shark Resources and Their Exploitation in Fujian. Fujian Fish. 2, 38–41. doi: 10.14012/j.cnki.fjsc.1995.02.022
Liu R. (2011). Progress of Marine Biodiversity Studies in China Seas. Biodivers. Sci. 19, 614. doi: 10.3724/SP.J.1003.2011.13185
Lucifora L. O., García V. B., Worm B. (2011). Global Diversity Hotspots and Conservation Priorities for Sharks. PloS One 6, e19356. doi: 10.1371/journal.pone.0019356
MacKenzie K. M., Robertson D. R., Adams J. N., Altieri A. H., Turner B. L. (2019). Structure and Nutrient Transfer in a Tropical Pelagic Upwelling Food Web: From Isoscapes to the Whole Ecosystem. Prog. Oceanogr. 178, 102145. doi: 10.1016/j.pocean.2019.102145
MacNeil M. A., Chapman D. D., Heupel M., Simpfendorfer C. A., Heithaus M., Meekan M., et al (2020). Global Status and Conservation Potential of Reef Sharks. Nature 583, 801–806. doi: 10.1038/s41586-020-2519-y
Margules C. R., Pressey R. L. (2000). Systematic Conservation Planning. Nature 405, 243–253. doi: 10.1038/35012251
Marmion M., Parviainen M., Luoto M., Heikkinen R. K., Thuiller W. (2009). Evaluation of Consensus Methods in Predictive Species Distribution Modelling. Diversity Distrib. 15, 59–69. doi: 10.1111/j.1472-4642.2008.00491.x
Mason N., Ward M., Watson J. E., Venter O., Runting R. K. (2020). Global Opportunities and Challenges for Transboundary Conservation. Nat. Ecol. Evol. 4, 694–701. doi: 10.1038/s41559-020-1160-3
Melo-Merino S. M., Reyes-Bonilla H., Lira-Noriega A. (2020). Ecological Niche Models and Species Distribution Models in Marine Environments: A Literature Review and Spatial Analysis of Evidence. Ecol. Modell. 415, 108837. doi: 10.1016/j.ecolmodel.2019.108837
Meyers E. K., Tuya F., Barker J., Jiménez Alvarado D., Castro-Hernández J. J., Haroun R., et al (2017). Population Structure, Distribution and Habitat Use of the Critically Endangered Angelshark, Squatina Squatina, in the Canary Islands. Aquat. Conserv.: Mar. Freshw. Ecosyst. 27, 1133–1144. doi: 10.1002/aqc.2769
Musa S. M., Ripley D. M., Moritz T., Shiels H. A. (2020). Ocean Warming and Hypoxia Affect Embryonic Growth, Fitness and Survival of Small-Spotted Catsharks, Scyliorhinus Canicula. J. Fish Biol. 97, 257–264. doi: 10.1111/jfb.14370
Nasby-Lucas N., Dewar H., Lam C. H., Goldman K. J., Domeier M. L. (2009). White Shark Offshore Habitat: A Behavioral and Environmental Characterization of the Eastern Pacific Shared Offshore Foraging Area. PloS One 4, e8163. doi: 10.1371/journal.pone.0008163
Noviello N., McGonigle C., Jacoby D. M., Meyers E. K., Jiménez-Alvarado D., Barker J. (2021). Modelling Critically Endangered Marine Species: Bias-Corrected Citizen Science Data Inform Habitat Suitability for the Angelshark (Squatina Squatina). Aquat. Conserv.: Mar. Freshw. Ecosyst. 31, 3451–3465. doi: 10.1002/aqc.3711
Pacoureau N., Rigby C. L., Kyne P. M., Sherley R. B., Winker H., Carlson J. K., et al (2021). Half a Century of Global Decline in Oceanic Sharks and Rays. Nature 589, 567–571. doi: 10.1038/s41586-020-03173-9
Pauly D. (2021). The Gill-Oxygen Limitation Theory (GOLT) and its Critics. Sci. Adv. 7, eabc6050. doi: 10.1126/sciadv.abc6050
Pauly D., Christensen V. (1995). Primary Production Required to Sustain Global Fisheries. Nature 376, 279. doi: 10.1038/376279b0
Pierce S. J., Norman B. (2016). Rhincodon Typus Vol. 2016 (The IUCN Red List of Threatened Species), e.T19488A2365291.
Pimiento C., Leprieur F., Silvestro D., Lefcheck J. S., Albouy C., Rasher D. B., et al (2020). Functional Diversity of Marine Megafauna in the Anthropocene. Sci. Adv. 6, eaay7650. doi: 10.1126/sciadv.aay7650
Pottie S., Flam A. L., Keeping J. A., Chivindze C., Bull J. C. (2021). Quantifying the Distribution and Site Fidelity of a Rare, non-Commercial Elasmobranch Using Local Ecological Knowledge. Ocean Coast. Manag. 212, 105796. doi: 10.1016/j.ocecoaman.2021.105796
Prasetyo A. P., McDevitt A. D., Murray J. M., Barry J., Agung F., Muttaqin E., et al (2021). Shark and Ray Trade in and Out of Indonesia: Addressing Knowledge Gaps on the Path to Sustainability. Mar. Policy 133, 104714. doi: 10.1016/j.marpol.2021.104714
Qiu S. (1954). Studies on the Sharks of Xiamen (II) Classification. J. Xiamen Univ. (Nat. Sci. Edition) 3, 30–49.
Queiroz N., Humphries N. E., Couto A., Vedor M., da Costa I., Sequeira A. M.M., et al. (2019). Global spatial Risk Assessment of Sharks Under the Footprint of Fisheries. Nature 572 (7770), 461–466. doi: 10.1038/s41586-019-1444-4
Rigby C. L., Walls R., Derrick D., Dyldin Y. V., Yamaguchi A. (2021). Squatina Nebulosa (The IUCN Red List of Threatened Species).
Sala E., Mayorga J., Bradley D., Cabral R. B., Atwood T. B., Auber A., et al (2021). Protecting the Global Ocean for Biodiversity, Food and Climate. Nature 592, 397–402. doi: 10.1038/s41586-021-03371-z
Segurado P., Araujo M. B. (2004). An Evaluation of Methods for Modelling Species Distributions. J. Biogeogr. 31, 1555–1568. doi: 10.1111/j.1365-2699.2004.01076.x
Sequeira A. M., Mellin C., Fordham D. A., Meekan M. G., Bradshaw C. J. (2014). Predicting Current and Future Global Distributions of Whale Sharks. Glob. Change Biol. 20, 778–789. doi: 10.1111/gcb.12343
Serra N., Kockel A., Game E. T., Grantham H., Possingham H. P., McGowan J. (2020). Marxan User Manual: For Marxan Version 2.43 and Above (Victoria, British Columbia, Canada: The Nature Conservancy (TNC), Arlington, Virginia, United States and Pacific Marine Analysis and Research Association (PacMARA).
Sims D. W. (2019). “The Significance of Ocean Deoxygenation for Elasmobranchs,” in Ocean Deoxygenation: Everyone's Problem-Causes, Impacts, Consequences and Solutions. Eds. Laffoley D., Baxter J. M. (Gland: IUCN), p 431–p 448.
Spalding M. D., Fox H. E., Allen G. R., Davidson N., Ferdaña Z. A., Finlayson M. A. X., et al (2007). Marine Ecoregions of the World: A Bioregionalization of Coastal and Shelf Areas. BioScience 57, 573–583. doi: 10.1641/B570707
State Oceanic Administration (2016). Ocean Atlas of China's coastal waters - Marine Biology and Ecology (Beijing (in Chinese):China Ocean Press).
Stein R. W., Mull C. G., Kuhn T. S., Aschliman N. C., Davidson L. N., Joy J. B., et al (2018). Global Priorities for Conserving the Evolutionary History of Sharks, Rays and Chimaeras. Nat. Ecol. Evol. 2, 288–298. doi: 10.1038/s41559-017-0448-4
Tang D. (1936). The Elasmobranchiate Fishes of Amoy. Coll. Pap. Dept. Biol. Mar. Biol. Lab. Univ. Amoy 3, 1–25.
Thuiller W., Georges D., Gueguen M., Engler R., Breiner F. (2021) Biomod2: Ensemble Platform for Species Distribution Modeling. R Package Version 3.5.1. Available at: https://CRAN.R-project.org/package=biomod2.
Thuiller W., Guéguen M., Renaud J., Karger D. N., Zimmermann N. E. (2019). Uncertainty in Ensembles of Global Biodiversity Scenarios. Nat. Commun. 10, 1–9. doi: 10.1038/s41467-019-09519-w
Tyberghein L., Verbruggen H., Pauly K., Troupin C., Mineur F., De Clerck O. (2012). Bio-ORACLE: A Global Environmental Dataset for Marine Species Distribution Modelling. Glob. Ecol. Biogeogr. 21, 272–281. doi: 10.1111/j.1466-8238.2011.00656.x
CBD/COP/DEC/X/2 (2010). Available at: https://www.cbd.int/doc/decisions/cop-10/cop-10-dec-02-en.pdf.
UNEP-WCMC, IUCN (2022) Marine Protected Planet. Available at: www.protectedplanet.net.
Van Houtan K. S., Gagné T. O., Reygondeau G., Tanaka K. R., Palumbi S. R., Jorgensen S. J. (2020). Coastal Sharks Supply the Global Shark Fin Trade. Biol. Lett. 16, 20200609. doi: 10.1098/rsbl.2020.0609
Van Zinnicq Bergmann M. P., Guttridge T. L., Smukall M. J., Adams V. M., Bond M. E., Burke P. J., et al (2022). Using Movement Models and Systematic Conservation Planning to Inform Marine Protected Area Design for a Multi-Species Predator Community. Biol. Conserv. 266, 109469. doi: 10.1016/j.biocon.2022.109469
Venter O., Fuller R. A., Segan D. B., Carwardine J., Brooks T., Butchart S. H., et al (2014). Targeting Global Protected Area Expansion for Imperiled Biodiversity. PloS Biol. 12, e1001891. doi: 10.1371/journal.pbio.1001891
Walls R., Rigby C. L., Derrick D., Dyldin Y. V., Yamaguchi A. (2021). Squatina Japonica (The IUCN Red List of Threatened Species).
Ward-Paige C. A., Worm B. (2017). Global Evaluation of Shark Sanctuaries. Global Environ. Change 47, 174–189. doi: 10.1016/j.gloenvcha.2017.09.005
Watson R., Zeller D., Pauly D. (2014). Primary Productivity Demands of Global Fishing Fleets. Fish Fish. 15 (2), 231–241. doi: 10.1111/faf.12013
Watts M. E., Ball I. R., Stewart R. S., Klein C. J., Wilson K., Steinback C., et al (2009). Marxan With Zones: Software for Optimal Conservation Based Land-and Sea-Use Zoning. Environ. Model. Softw. 24, 1513–1521. doi: 10.1016/j.envsoft.2009.06.005
White T. D., Ferretti F., Kroodsma D. A., Hazen E. L., Carlisle A. B., Scales K. L., et al (2019). Predicted Hotspots of Overlap Between Highly Migratory Fishes and Industrial Fishing Fleets in the Northeast Pacific. Sci. Adv. 5, eaau3761. doi: 10.1126/sciadv.aau3761
World Parks Congress (2014). A Strategy of Innovative Approaches and Recommendations to Enhance Implementation of Marine Conservation in the Next Decade (Sydney, Australia: IUCN World Parks Congress).
Wu H., Zhong J. (2021). Key to Marine and Estuarial Fishes of China (Beijing: China Agricultural Press).
Yagnesh M., Durga F., Rehanavaz M., Poojaben T., Raj D. (2020). Importance of Sharks in Ocean Ecosystem. J. Entomol. Zool. Stud. 8, 611–613.
Yano K., Ahmad A., Gambang A. C., Idris A. H., Solahuddin A. R., Aznan Z. (2005). Sharks and Rays of Malaysia and Brunei Darussalam. (Kuala Terengganu, Malaysia:Seafdec-Mfrdmd/sp/I2)
Zhang F. (2003). The Varieties and Use Value of the Chondrichthves in the Huang Sea and the Bo Sea. Spec. Wild Econ. Anim. Plant Res. 3, 53–56. doi: 10.3969/j.issn.1001-4721.2003.03.018
Zhang Z. (2005). The Fishery Resources Statuts of Sharks in Eastern China Sea. J. Fujian Fish. 3, 10–13. doi: 10.14012/j.cnki.fjsc.2005.03.02
Zhang R., Lin L., Li Y., Song P., Chen Y., Zhang J. (2018). Species Composition and Quantity Distribution of Sharks in the Southwestern Sea of the Nansha Islands and Mouth of the Beibu Bay. Mar. Fish. 1, 27–37. doi: 10.13233/j.cnki.mar.fish.2018.01.004
Zhang Q., Yang S. (2005). Species, Geography Distribution and Resource of Chondrichthian Fishes of China. J. Xiamen Univ. (Nat. Sci.) 44, 207–211. doi: 10.3321/j.issn:0438-0479.2005.z1.048
Zhao Q., Stephenson F., Lundquist C., Kaschner K., Jayathilake D., Costello M. J. (2020). Where Marine Protected Areas Would Best Represent 30% of Ocean Biodiversity. Biol. Conserv. 244, 108536. doi: 10.1016/j.biocon.2020.108536
Zhu Y. (1958). A Review of the Elasmobranchiate Fishes of China, With Discussion on the Problems of Their Utilization. Oceanol. Limnol. Sin. 1, 325–333.
Keywords: conservation gap, elasmobranch, marine sharks, species distribution model, systematic conservation planning, MPA network
Citation: Du J, Ding L, Su S, Hu W, Wang Y, Loh K-H, Yang S, Chen M, Roeroe KA, Songploy S, Liu Z and Chen B (2022) Setting Conservation Priorities for Marine Sharks in China and the Association of Southeast Asian Nations (ASEAN) Seas: What Are the Benefits of a 30% Conservation Target? Front. Mar. Sci. 9:933291. doi: 10.3389/fmars.2022.933291
Received: 30 April 2022; Accepted: 30 May 2022;
Published: 24 June 2022.
Edited by:
Jun Xu, Institute of Hydrobiology, Chinese Academy of Sciences (CAS), ChinaReviewed by:
Xuehui Wang, South China Sea Fisheries Research Institute, Chinese Academy of Fishery Sciences (CAFS), ChinaCui Liang, Institute of Oceanology, Chinese Academy of Sciences (CAS), China
Copyright © 2022 Du, Ding, Su, Hu, Wang, Loh, Yang, Chen, Roeroe, Songploy, Liu and Chen. This is an open-access article distributed under the terms of the Creative Commons Attribution License (CC BY). The use, distribution or reproduction in other forums is permitted, provided the original author(s) and the copyright owner(s) are credited and that the original publication in this journal is cited, in accordance with accepted academic practice. No use, distribution or reproduction is permitted which does not comply with these terms.
*Correspondence: Wenjia Hu, aHV3ZW5qaWFAdGlvLm9yZy5jbg==; Bin Chen, Y2hlbmJpbkB0aW8ub3JnLmNu