 David W. Crawford1*†
 Duncan A. Purdie1
 Maeve C. Lohan1
 Peter J. Statham1
 Tawnya D. Peterson2
 Hilary A. Kennedy3
 Michael S. Lipsen4Jennifer N. Putland5Frank A. Whitney6
- 1School of Ocean and Earth Science, National Oceanography Centre, University of Southampton, Southampton, United Kingdom
- 2Oregon Health & Science University, School of Public Health, Portland State University, Portland, OR, United States
- 3School of Ocean Sciences, Bangor University, Anglesey, United Kingdom
- 4Department of Earth, Ocean and Atmospheric Sciences, University of British Columbia, Vancouver, BC, Canada
- 5Independent Researcher, Victoria, BC, Canada
- 6Centre for Ocean Climate Chemistry, Institute of Ocean Sciences, Sidney, BC, Canada
The offshore Gulf of Alaska—in the northeastern subarctic Pacific—is a high-nitrate, low-chlorophyll (HNLC) oceanic region where concentrations of dissolved iron (DFe) and zinc (DZn) are of the order ~0.1 nmol kg−1 in surface waters. At the average winter mixed layer depth of ~120 m, DFe and DZn are of the orders ~0.1–0.2 nmol kg−1 and ~1–2 nmol kg−1, respectively. Vertical supply of Fe to surface waters is therefore limited, with phytoplankton blooms driven by episodic atmospheric and lateral inputs of Fe. In contrast, DZn is presumably replenished through seasonal vertical mixing, though maintained at low levels in surface waters, even in winter, implying that removal processes are in operation. Previous supplementation experiments have demonstrated that phytoplankton biomass (chl-a), growth, and drawdown of nitrate (NO3-) are stimulated strongly by Fe but only minimally, if at all, by Zn alone. Using on-deck bioassay incubations of surface waters, we confirm that the addition of Fe stimulates significant increases in chl-a and large diatoms, and drawdown of NO3- and silicic acid [Si(OH)4]. Associated drawdown of DZn and dissolved cadmium (DCd) indicated Zn stress in the control and +Fe treatment. Supplementation with Zn alone had no significant impact on NO3- and commonly monitored pigments such as chl-a and fucoxanthin. However, in the +Zn treatment, DFe and coccolithophore abundance were significantly lower, and the concentration of particulate organic carbon (POC) and that of the pigments alloxanthin and chlorophyll c1+2 were significantly higher than those in control incubations. Our experiment corroborates previously observed relationships between DZn and alloxanthin and chlorophyll c across the subarctic north Pacific and Bering Sea and could help to explain the low or undetectable concentrations of alloxanthin frequently observed in this region. Alloxanthin is a pigment specific to the cryptophytes, either within free-living cells or within functional plastids retained by mixotrophic protists. Both cryptophytes and mixotrophic ciliates, such as Laboea sp. and Strombidium spp., make a variable but significant contribution to phytoplankton biomass in this area. In the absence of Fe supply to surface waters, Zn could play a hitherto unsuspected role in shaping plankton communities in the HNLC Gulf of Alaska.
Introduction
When Karl Banse posed the question “Does iron really limit phytoplankton production in the offshore subarctic Pacific?” (Banse, 1990), John Martin’s reply was unequivocal “Yes it does…” (Martin et al., 1990) and proved to be correct. Since the late 1980s, both on-deck (Martin et al., 1989; Coale, 1991; Boyd et al., 1996; Takeda, 1998; Crawford et al., 2003) and in situ (Boyd et al., 2004) fertilization experiments have consistently shown that dissolved iron (DFe) strongly stimulates biomass and productivity of phytoplankton populations around Ocean Station Papa (OSP) in the offshore northeastern subarctic Pacific. Despite this conclusive evidence, the low and relatively constant concentrations of chl-a (~0.3 µg L−1) observed year-round (Frost, 1991) suggest that natural supply of Fe is generally too low for phytoplankton biomass to reach levels observed under artificially fertilized conditions. To date, evidence for significant natural fertilization by Fe has been restricted to episodic events, presumably caused by atmospheric input of Fe from volcanic eruptions (Hamme et al., 2010; Mélançon et al., 2014) and from lateral supply—within the upper 200 m—of particulate Fe from the continental margin (Lam et al., 2006). Sporadic events involving silicic acid [Si(OH)4] limitation (Wong and Matear, 1999) and increased vertical flux of biogenic particles to the deep ocean around OSP (Wong et al., 1999) could also implicate episodic Fe fertilization.
In the 1980s, the “grazing hypothesis” grew out of the SUPER program (e.g., Frost, 1991; Miller et al., 1991) to explain the low and relatively constant phytoplankton biomass in this region. Using trace metal clean incubations supplemented with Fe, the VERTEX program then provided the basis for the “iron hypothesis” as an alternative explanation for this phenomenon (Martin et al., 1989). These two hypotheses were reconciled within a so-called “ecumenical Fe hypothesis”, proposing that large diatoms are limited by availability of Fe, but that smaller, more abundant phytoplankton are efficiently grazed by microzooplankton (Morel et al., 1991a; Cullen, 1995). Although Fe fertilization can explain some episodic events in this area, the role of routinely measured low levels of DFe (~0.1 nmol kg−1) in surface waters in driving the variability of biomass, productivity, and export production on seasonal and annual time scales has been harder to evaluate. In order to improve our understanding of micronutrients in this system, the dynamics of other trace metals present in low concentrations clearly require closer scrutiny.
Despite his strong convictions regarding Fe limitation, John Martin also noted that concentrations of dissolved zinc (DZn) in surface waters of the offshore northeastern subarctic Pacific were of a similar order (~0.1 nmol kg−1) to those of DFe (Martin et al., 1989). However, the concept of Zn limitation of phytoplankton growth in the area was dismissed by Martin, who argued that the sharp increase in DZn with depth meant that, in contrast to Fe, Zn would be re-supplied seasonally from beneath the mixed layer (Martin et al., 1989). More recent studies have generally confirmed low concentrations of DZn of ~0.1 nmol kg−1 in summer, both in near-surface waters around OSP (Lohan et al., 2002) and in the coastal-HNLC transitional waters further east (Chappell et al., 2019; Vance et al., 2019), although higher levels of DZn have also been measured (Chappell et al., 2019; Vance et al., 2019). Concentrations of DZn of ~0.1 nmol kg−1 have also been reported in winter at OSP (Lohan et al., 2002), when the mixed layer is much deeper, implying strong uptake processes throughout the year, a concept supported by the presence of strong complexing ligands (Lohan et al., 2005) that appear to maintain free Zn ion concentrations [Zn2+] at around the same order as those shown to limit growth of phytoplankton in controlled cultures (Brand et al., 1983; Sunda and Huntsman, 1992; Varela et al., 2011). Despite low DZn and [Zn2+], on-deck incubations of surface waters from OSP supplemented with trace metals have suggested only a subtle role for Zn stimulation of chl-a and drawdown of (Coale, 1991; Crawford et al., 2003). However, Zn is an essential element for marine phytoplankton (Morel et al., 1991b) that is required in a variety of enzymes (Sinoir et al., 2012; Morel et al., 2020). When DZn is limiting, cadmium (Cd) and cobalt (Co) can substitute for Zn in some enzymes (e.g., Morel et al., 2020), and the consequences of low DZn concentrations in near-surface waters clearly require further attention.
Recent modelling of the northeastern subarctic Pacific suggests a strong seasonality of phytoplankton carbon (phyto C) that is not reflected in total chl-a because of light- and nutrient-driven variations in cellular pigment levels (Westberry et al., 2016). The relatively constant total chl-a concentrations characterizing OSP waters could therefore be associated with seasonal variation in phyto C, a concept consistent with the strong seasonal signal in vertical biogenic particle flux to the deep ocean observed in sediments traps (Wong et al., 1999). The vertical relationship between DZn and Si(OH)4 observed at OSP (Lohan et al., 2002; Janssen and Cullen, 2015; Vance et al., 2019)—and elsewhere (Middag et al., 2019; Morel et al., 2020)—suggests the involvement of sinking of diatoms and subsequent remineralization of biogenic silica (bSi) and particulate Zn. This DZn-Si(OH)4 relationship extends into deeper waters, but high-resolution data from the mixed layer are sparse and the role of near-surface processes in the relationship is unclear. Deficiency in DZn has been shown to increase bSi quotas in some diatoms (De La Rocha et al., 2000), but not others (Varela et al., 2011). Although studies have focused on the role of diatoms in cycling of Zn, diatoms are present at lower abundances under regular Fe-limited conditions in near-surface waters (Martin et al., 1989; Coale, 1991; Boyd et al., 1996; Crawford et al., 2003); thus, the contribution of non-siliceous phytoplankton and protists to cycling of Zn requires examination.
Here, we report on the results from an on-deck trace metal clean incubation experiment at OSP that repeated an earlier experiment (Crawford et al., 2003), but examined in more detail the impacts of Zn additions. We adopted a more intensive daily sampling program and added a suite of biogeochemical variables not measured in the original study of Crawford et al. (2003). Measurements of pigment concentrations were made to examine subtle potential changes in the composition of microplankton assemblages, and measurements of the dissolved CO2 system—and associated isotopes—were made to explore the potential role of dissolved Zn in facilitating acquisition of CO2 by phytoplankton under low CO2 conditions (Morel et al., 1994; Morel et al., 2020).
Methods
Incubation setup
On-deck incubations were conducted at OSP (or station P26; 50°N, 145°W) in June 2001 on cruise 2001-08 of the research vessel CCGS John P. Tully during its regular program along line P, co-ordinated by the Institute of Ocean Sciences (IOS) Sidney, BC, Canada.
The experiment repeated that of Crawford et al. (2003), but with an increased sampling frequency, and a greater number of variables measured. Prior to the cruise, incubation vessels and sampling equipment were subjected to the rigorous acid cleaning procedure adopted previously (Crawford et al., 2003). Two days prior to arriving at OSP, acid-cleaned 4-L low-density polyethylene (LDPE) flexible cubic containers (“cubitainers”; VWR Canlab) were rinsed in trace metal clean open ocean water, then left to soak in this water to permit equilibration and minimize adsorption of trace metals onto the container walls. After arriving at OSP, cubitainers were rinsed three times with seawater from ~15 m depth prior to filling. Seawater for the incubation experiment was collected from ~15 m depth at OSP during the hours of darkness (17–18 June), using a Teflon pump (PFD-1 Asti) and Teflon tubing, and cleanly pumped into the 32 pre-cleaned cubitainers in an on-deck PVC ultralow-penetration air clean hood (Lohan et al., 2005). The water samples were not prefiltered to exclude grazing organisms prior to incubation. Filling of cubitainers took most of the night, and therefore, the composition of microplankton communities could have changed slightly during that time. To minimize any consequent bias, the filled cubitainers were randomly assigned to the four treatments.
At the time of collection (time zero or T0), triplicate samples were also taken from the pumped supply at T0 for the measurements listed in Table 1A. We also briefly report concentrations of certain pigments from the same cruise from 0-, 10-, 20-, and 30-m depths at stations OSP and P20 (49°34’ N; 138°40’ W), and at station Z03 (53°N; 145°W) north of OSP.
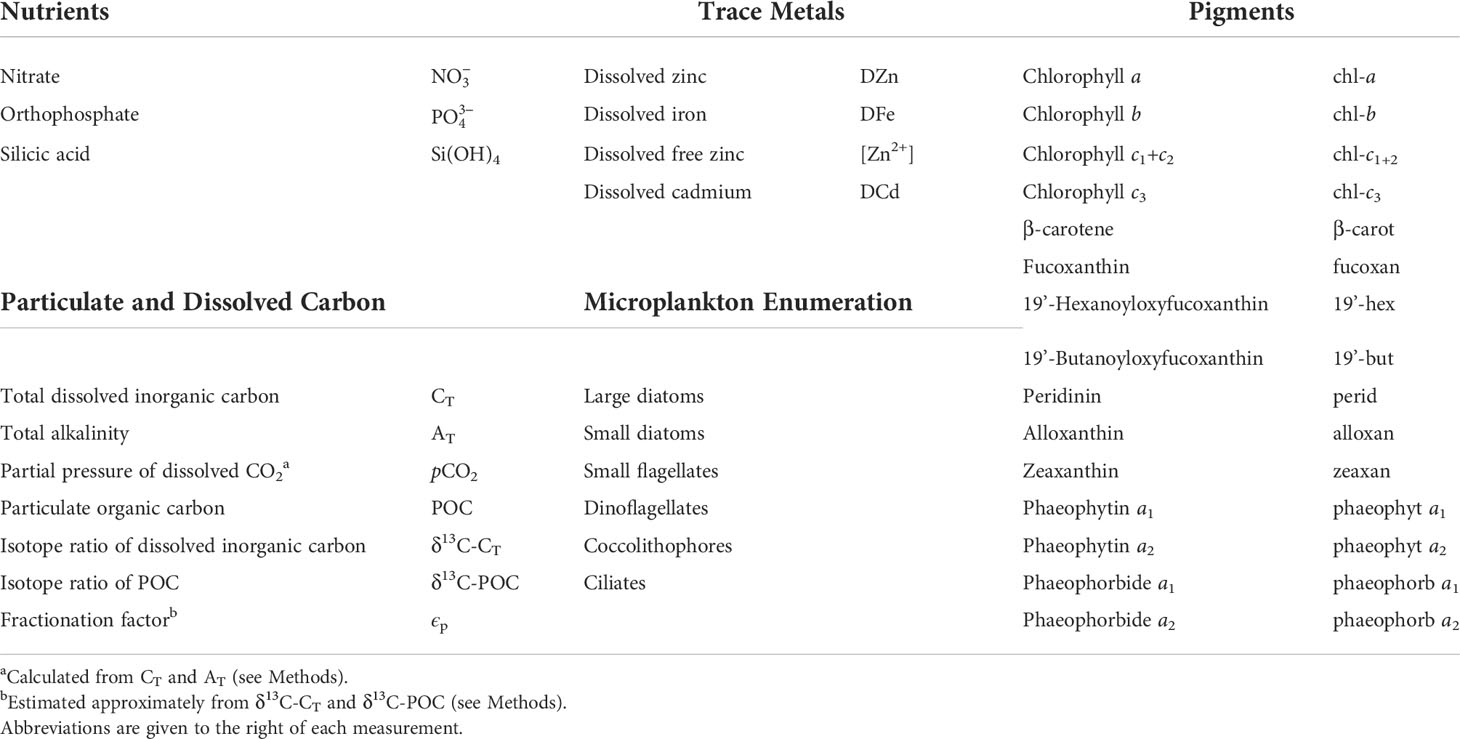
Table 1A Summary of biological and chemical measurements taken daily from T0 samples and on-deck incubations at Ocean Station Papa (OSP) in June 2001.
The 32 filled cubitainers were randomly allocated into four groups of eight, with each group supplemented with one of the following trace metal treatments in the clean hood:
1. Control—no additions
2. +Zn—10 nmol L−1 ZnCl2
3. +Fe—10 nmol L−1 FeCl3
4. +Fe & +Zn—10 nmol L−1 ZnCl2 + 10 nmol L−1 FeCl3
Stock solutions were 1,000 ppm ZnCl2 and 1,000 ppm FeCl3 (Fisher Scientific). As the natural speciation of zinc and binding ligands was to be measured, EDTA was not added with the trace metal supplements; ligand concentrations were reported in Lohan et al. (2005).
Cubitainers were then processed and placed before dawn in on-deck incubators supplied with surface seawater to maintain mixed-layer T0 temperatures (Crawford et al., 2003). Seawater at T0 had a temperature (T) of ~7.3°C and salinity (S) of ~32.55, taken from the CTD. The flow-through seawater supply to incubations varied in T between 7 and 12°C as the ship moved over the course of the experiment, a range similar to that observed in near-surface water between June and August at OSP (Whitney and Freeland, 1999). Cubitainers were randomly placed in the incubators to minimize any shading bias caused by position on-deck, and then incubated for up to 8 days. Neutral density screening provided spectrally unmodified shading to approximately 30% of the surface ambient light level, approximating the irradiance level at the depth of collection. The cubitainers were not repetitively sampled, thereby avoiding contamination during the subsampling procedure. One cubitainer from each of the four treatments was randomly removed each evening at 18:00 h toward the end of the light period, and the contents utilized almost entirely for subsamples for the measurements as given in Table 1A.
Chl-a and dissolved nutrients
Subsamples of 300 ml were removed from the cubitainers, stored in the cold and dark, and then filtered onto 47-mm-diameter GFF filters that were then frozen. Chl-a was extracted and measured using standard methods (Parsons et al., 1984) as previously described (Crawford et al., 2003). Precision of the method (1 SD) was ±0.03 µg chl-a L−1 for triplicate T0 samples (Crawford et al., 2003). Subsamples for , , and Si(OH)4 were placed in polycarbonate tubes, stored in the refrigerator, and analyzed using standard methods (Barwell-Clarke and Whitney, 1996; Crawford et al., 2003). Typical precisions (1 SD) for duplicate nutrient measurements from fresh samples were ±0.01, 0.02, and 0.4 µmol L−1 for , , and Si(OH)4, respectively (Barwell-Clarke and Whitney, 1996), and for triplicate T0 samples, they were ±0.23, 0.02, and 0.33 µmol L−1, respectively (Crawford et al., 2003).
Dissolved trace metals
Seawater at T0 or from each cubitainer was immediately vacuum filtered through acid-cleaned 0.22-µm polycarbonate membrane filters (Nuclepore) into two replicate 500-ml LDPE bottles. One 500-ml aliquot was acidified for dissolved trace metal analysis, and the other aliquot was used for Zn speciation studies, which were analyzed within 3 h of collection (Lohan et al., 2005). Samples for DZn were analyzed by adsorptive cathodic stripping voltammetry (AdCSV) (Lohan et al., 2002; Lohan et al., 2005), and samples for DFe and DCd were analyzed using the chelation solvent extraction method (Statham, 1985; Lohan et al., 2005) and atomic adsorption spectroscopy (AAS). Precision (1 SD) of replicate trace metal measurements was 3% for DZn, 4% for DFe, and 5% for DCd.
Recoveries of reference materials NASS-5 were as follows:
DFe: determined 0.206 ± 0.02 µg L−1; certified value: 0.207 ± 0.035 µg L−1.
DCd: determined 0.025 ± 0.12 µg L−1; certified value: 0.023 ± 0.003 µg L−1.
DZn: determined 0.106 ± 0.03 µg L−1; certified value: 0.102 ± 0.039 µg L−1.
The concentration of free zinc [Zn2+] was analyzed using competitive ligand equilibrium (CLE)-AdCSV (Lohan et al., 2005).
POC and δ13C-POC
Water samples for particulate organic carbon (POC) and δ13C-POC were collected by filtering 700–750 ml onto pre-combusted (500°C for 3 h) 47-mm GF/F filters (0.7 µm nominal pore size) and frozen prior to analysis. The filters were subsequently acid fumed (concentrated HCl) overnight to remove any carbonate, dried at 40°C, and stored in a desiccator prior to analysis. POC was determined by combustion using a commercial CN analyzer (Europa Scientific, Crewe, U.K.). The precision of replicate POC measurements (l SD) is typically ±2 µmol L−1 and was ±2.5 µmol L−1 for triplicate T0 samples.
Samples for δ13C-POC analysis were loaded into small pre-combusted quartz tubes along with copper, pre-combusted copper oxide, and silver foil. The tubes were placed in larger pre-combusted quartz tubes, sealed under vacuum and combusted at 910°C for 3 h. Resulting gases were distilled cryogenically in a vacuum line and the CO2 was measured on a PDZEUROPA GEO 20/20 mass spectrometer. The δ13C is reported relative to Vienna Pee Dee Bellemnite (VPDB, i.e., dsample = 1,000 [(Rsample/Rstandard) – 1], where R = 13C/12C. Precision (l SD) of replicate δ13C-POC measurements is typically ±0.1‰ and was ±0.24‰ for triplicate T0 samples.
AT, CT, pCO2, and δ13C-CT
Subsamples were siphoned carefully from cubitainers into 250-ml glass stoppered bottles excluding air bubbles and preserved with 100 µl of mercuric chloride (HgCl2) for analysis of AT, CT, and δ13C-CT. CT was analyzed using the coulometric technique of Johnson and Sieburth (1996) adapted by the DOE handbook (DOE, 1994). The precision (1 SD) of replicate CT measurements is typically ±1.2 µmol kg−1 (Miller et al., 2013) and was ±1.6 µmol kg−1 from triplicate T0 samples. AT was analyzed using the open-cell potentiometric method (Dickson et al., 2003); the precision of replicate AT measurements is typically ±2 µmol kg−1 (Miller et al., 2013) and was ±13.7 µmol kg−1 from triplicate T0 samples.
pCO2 was calculated from AT and CT using the “co2sys_xls” spreadsheet (Pierrot et al., 2006) using T ~7.3°C and S ~32.55 from the CTD profile at T0. To ensure that changes in pCO2 reflected a biological signal, both T and S were assumed to remain constant during on-deck incubations, despite the variation in T within incubators noted earlier. Contributions of and Si(OH)4 to AT were included in the calculation of pCO2 (Pierrot et al., 2006). Precision of pCO2 measurements is approximately 5% where precision of both CT and AT is ~1% (Dickson and Riley, 1978). Average calculated pCO2 in T0 samples from the mixed layer was 374.2 ppmv, which is in good agreement with the average of ~373.2 ppmv for atmospheric pCO2 in June 2001 (Keeling and Keeling, 2017).
δ13C-CT was measured using standard mass spectrometric techniques (Quay et al., 1992) with a typical precision of ±0.02‰ (Quay et al., 1992). Precision of measurements (1 SD) for δ13C-CT from triplicate T0 samples was ±0.02‰. A crude fractionation factor ϵp was estimated as the difference between δ13C-CT and δ13C-POC on any given day.
HPLC analysis of pigments
For high-performance liquid chromatography (HPLC) analyses of pigments, 500–750 ml of subsamples were filtered onto 47-mm GFF filters, then frozen and stored in liquid N2, and transported on dry ice (Wong and Crawford, 2006). Frozen filters were processed as described in Wong and Crawford (2006) with pigments analyzed using reverse-phase HPLC (Barlow et al., 1993a; Barlow et al., 1993b). Pigments reported are listed in Table 1A. This method did not separate chlorophylls c1 and c2, which are reported together as chl-c1+2. Diadinoxanthin and violaxanthin were detected in small amounts but are not reported here. Precision of triplicate T0 samples (1 SD) for zeaxan, 19’-hex, 19’-but, and fucoxan was in the range ±3.5–11.2 ng L−1, but was poorer for chl-c3 at ±27 ng L−1. Precision for pigments in lower concentrations (perid, chl-c1+2, alloxan, chl-b, and β-carot) was in the range ±0.2–2.9 ng L−1. Precision for phaeopigments was typically ±0.1–0.2 ng L−1.
Enumeration of phytoplankton
Samples for phytoplankton counts (250 ml) were preserved with hexamethylenetetramine-buffered formalin (final concentration 0.4%–0.5%) or 1% Lugol’s iodine and 50-ml (for control and +Zn) or 10-ml (for +Fe and +Fe & +Zn) subsamples then settled in sedimentation chambers (Crawford et al., 2003; Peterson et al., 2011). Broad taxonomic groupings of microplankton were enumerated using a Zeiss Axiovert inverted microscope at ×400 magnification.
Statistical tests
The significance of differences in measurements between treatments was assessed using several approaches. For dissolved measurements, t-tests were performed on the slopes and standard errors calculated from exponential regressions of daily drawdown in concentration in each treatment. For changes in Si(OH)4 and dissolved trace metals, the t-test was performed on the slopes and standard errors of linear regressions of daily drawdown in concentrations in each treatment. Exceptions to this approach were AT and DCd where changes in concentrations did not approximate to exponential or linear patterns; here, the Wilcoxon signed-rank test statistic “W” was used to evaluate the significance of differences between treatments. For particulate measurements, pigments, and taxonomic enumerations, t-tests were performed on the slopes and standard errors of exponential regressions of daily increase. The exceptions to this were ciliates and zeaxan, where patterns deviated from exponential or linear patterns, and the Wilcoxon test was applied to evaluate the significance of differences between treatments. Inputs for the Wilcoxon tests were simply the raw daily data for each of the two treatments being compared.
Although not all treatments approximated to exponential or linear patterns, for a particular measurement, all four treatments were compared using the same approach, and decisions on application of test and model were therefore unavoidably subjective at times.
Multiple testing to assess the potential significance of various trace metal treatments on a large number of measurements increases the chance of type I errors—or false positives—where the null hypothesis (i.e., that there is no difference between two treatments) is falsely rejected. The chances of false positives can be reduced using multiple testing corrections (e.g., Bonferroni correction) but comes at the expense of potentially creating type II errors (or false negatives) where the null hypothesis is falsely accepted. In the present exploratory study, the consequences of false negatives could be as consequential as false positives, in the sense that important new observations might potentially be deemed non-significant. Therefore, a multiple testing correction was not applied, but rather we have described the tests applied, highlighted relevant significance levels, and discussed the tentative nature of some of our conclusions.
The above null hypothesis significance testing approach encourages dismissal or acceptance of hypotheses, rather than an assessment of degrees of likelihood, and an alternative approach has been the consideration of effect sizes and their confidence intervals (Nakagawa and Cuthill, 2007). Again, the design of our study does not provide the replication required to formally consider confidence intervals of effect sizes, but where appropriate, we have given an indication of effect sizes and their potential context and limitations in this region.
OSP cruise, June 1998
Because mixotrophic ciliates (mixo ciliates) were not enumerated in the incubations, data were re-examined from cruise 9815 of the CCGS John P. Tully for evidence of their potential significance at OSP. Measurements taken from vertical profiles on 13 June 1998 are shown in Table 1B. T and S profiles were recorded using a Seabird 911+ CTD. Incident irradiance I (photosynthetically active radiation, PAR) was logged and averaged at 10-min intervals using a Li-COR 4π quantum irradiance sensor and then integrated over the whole day. Water samples for size-fractionated chl-a and PP, nutrients, POC, and microplankton enumeration were taken from GO-FLO bottles from the depths of 100%, 55%, 30%, 10%, 3.5%, and 1% surface irradiance. Samples for size-fractionated chl-a and PP were processed as described in Lipsen et al. (2007), with filters subjected to the microdiffusion technique (Crawford et al., 2003; Lipsen et al., 2007) and PP was then reported as 14C uptake into the organic fraction (Lipsen et al. (2007). Subsamples for , , and Si(OH)4 were analyzed onboard ship as outlined above (Barwell-Clarke and Whitney, 1996). For POC, seawater samples of typically 5 L were filtered onto silver filters (0.8 µm, 47 mm Poretics), which were combusted at 980°C using a Perkin-Elmer 240 or a CEC 440 Elemental Analyzer.
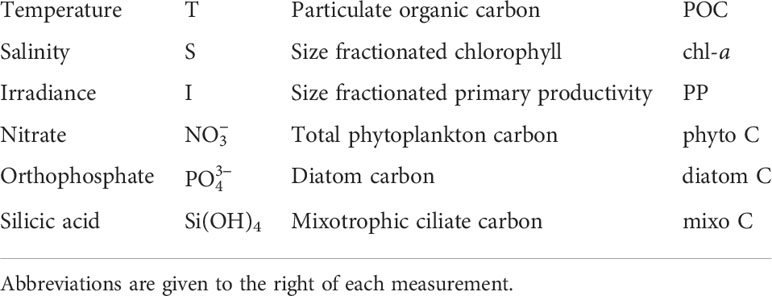
Table 1B Summary of measurements taken in vertical profiles at OSP in June 1998.
Samples for microplankton enumeration (250 ml) were preserved either with 1.5% (final concentration) glutaraldehyde or with buffered formalin (0.4% final concentration) and stored in the dark at 4°C. Within 24 h, 50 ml of the glutaraldehyde samples was processed and then enumerated using an epifluorescence microscope (Booth et al., 1993). Formalin-fixed samples were stored at 4°C prior to examination, and 50 ml was settled in a counting chamber for examination using an inverted microscope. Total autotrophic biomass (µg C L−1) was estimated by summing together the biomass of Synechococcus, autotrophic flagellates, dinoflagellates, diatoms, mixo ciliates, and miscellaneous autotrophs. Synechococcus C was estimated by assuming 210 fg C per cell (Booth et al., 1993). Mixotrophic ciliate carbon (mixo C) was estimated assuming a C:volume ratio of 0.19 pg C µm−3. Mixo ciliates fluoresced because of their retained plastids (Booth et al., 1993), and many showed the orange fluorescence characteristic of phycoerythrin presence. For cells >4 µm in diameter, total phyto C was estimated using appropriate geometric shapes (Wetzel and Likens, 1991) and equations either for diatoms or for non-diatoms (Strathmann, 1967; Booth et al., 1993). For flagellates and coccoid cells <10 µm in diameter, cell volume was multiplied by 1.52 to correct for cell shrinkage during fixation (Booth et al., 1993).
Photosynthetic rates were estimated from the P vs. I equation given for mixo ciliates (Putt, 1990), and the I profile taken on the same day as microplankton samples in June 1998. Mean values of photosynthetic parameters for mixo ciliates were assumed to be Pmax = 2.1 pg C pg chl-a−1 h−1 and α = 0.03 pg C pg chl-a−1 h−1 [µmol photons m−2 s−1]−1 (Putt, 1990).
Methodological limitations
In an oligotrophic environment such as the HNLC Gulf of Alaska, some measurements require relatively large sample volumes, thus potentially constraining the residual volume available for other measurements. Careful pre-planning was therefore required, and the minimum acceptable volumes chosen may have been sub-optimal for particulate measurements such as pigments and POC, and for enumeration of larger phytoplankton and protists present in lower abundances.
Management of such incubations is also dictated by the number of treatments, the desired temporal resolution of sampling, and the degree of replication. An acceptable level of replication has previously been observed (Crawford et al., 2003), but the sampling interval of 4 days was too wide, and the present study adopted a daily sampling program, with replication restricted to T0 samples. This provided valuable temporal information on many variables but resulted in challenges regarding statistical comparisons. Choice of statistical tests was somewhat subjective because daily changes did not necessarily follow consistent patterns that could be fitted neatly to mathematical functions.
Microplankton assemblages were examined through pigment concentrations and enumeration of taxonomic categories, which, in retrospect, were rather broad in terms of the presence of certain taxa of unexpected significance. The CHEMTAX program (e.g., Mackey et al., 1996) is a powerful chemotaxonomic tool that iteratively calculates the contribution of various phytoplankton taxa relative to total chl-a, but was not employed here. Several studies have recommended that the initial pigment:chl-a ratios chosen should, if at all possible, reflect the dominant phytoplankton species present in a given area (Schlüter et al., 2000). In our experiments, large shifts in taxonomic composition and biomass (chl-a) occurred between treatments and over time, and the choice of appropriate or inappropriate initial pigment:chl-a ratios for all 32 incubations could have imposed unknown bias on calculations.
Interpreting a large number of measurements conducted on mixed natural incubations subjected to several treatments can be challenging, with taxa showing a variety of complex sensitivities to trace metal limitation. Our exploratory study provides a window into the temporal resolution and replication required for future studies, and our tentative conclusions could have implications that can be further explored in more intensive field and culture studies.
Results
Concentrations of chl-a increased exponentially to >9.5 µg L−1 in the two +Fe treatments but increased only to ~1.5 µg L−1 in the control and +Zn treatment (Figure 1A). This was accompanied by drawdowns in , (Figures 1B, C), and CT (Figure 1E), which were significantly greater in the two +Fe treatments than in the +Zn and control treatments (Table 2). The increases in chl-a in the two +Fe treatments appeared to be limited by the depletion of by day 8 (Figures 1A, B). The drawdown in Si(OH)4 was weaker and occurred later (Figure 1D), potentially lowering the significance of differences between treatments (Table 2). No significant differences in chl-a, , , Si(OH)4, or CT were noted between the two +Fe treatments, or between control and +Zn (Table 2). Changes in AT and pCO2 were more complicated (Figures 1F, G), with sharp drawdowns in pCO2 later in the two +Fe treatments, but slight increases around days 3–5 in the control and +Zn treatment coinciding with decreases in AT. Differences in AT were not significant between any of the treatments (Table 2), whereas pCO2 differences showed a similar pattern to those of CT (Table 2).
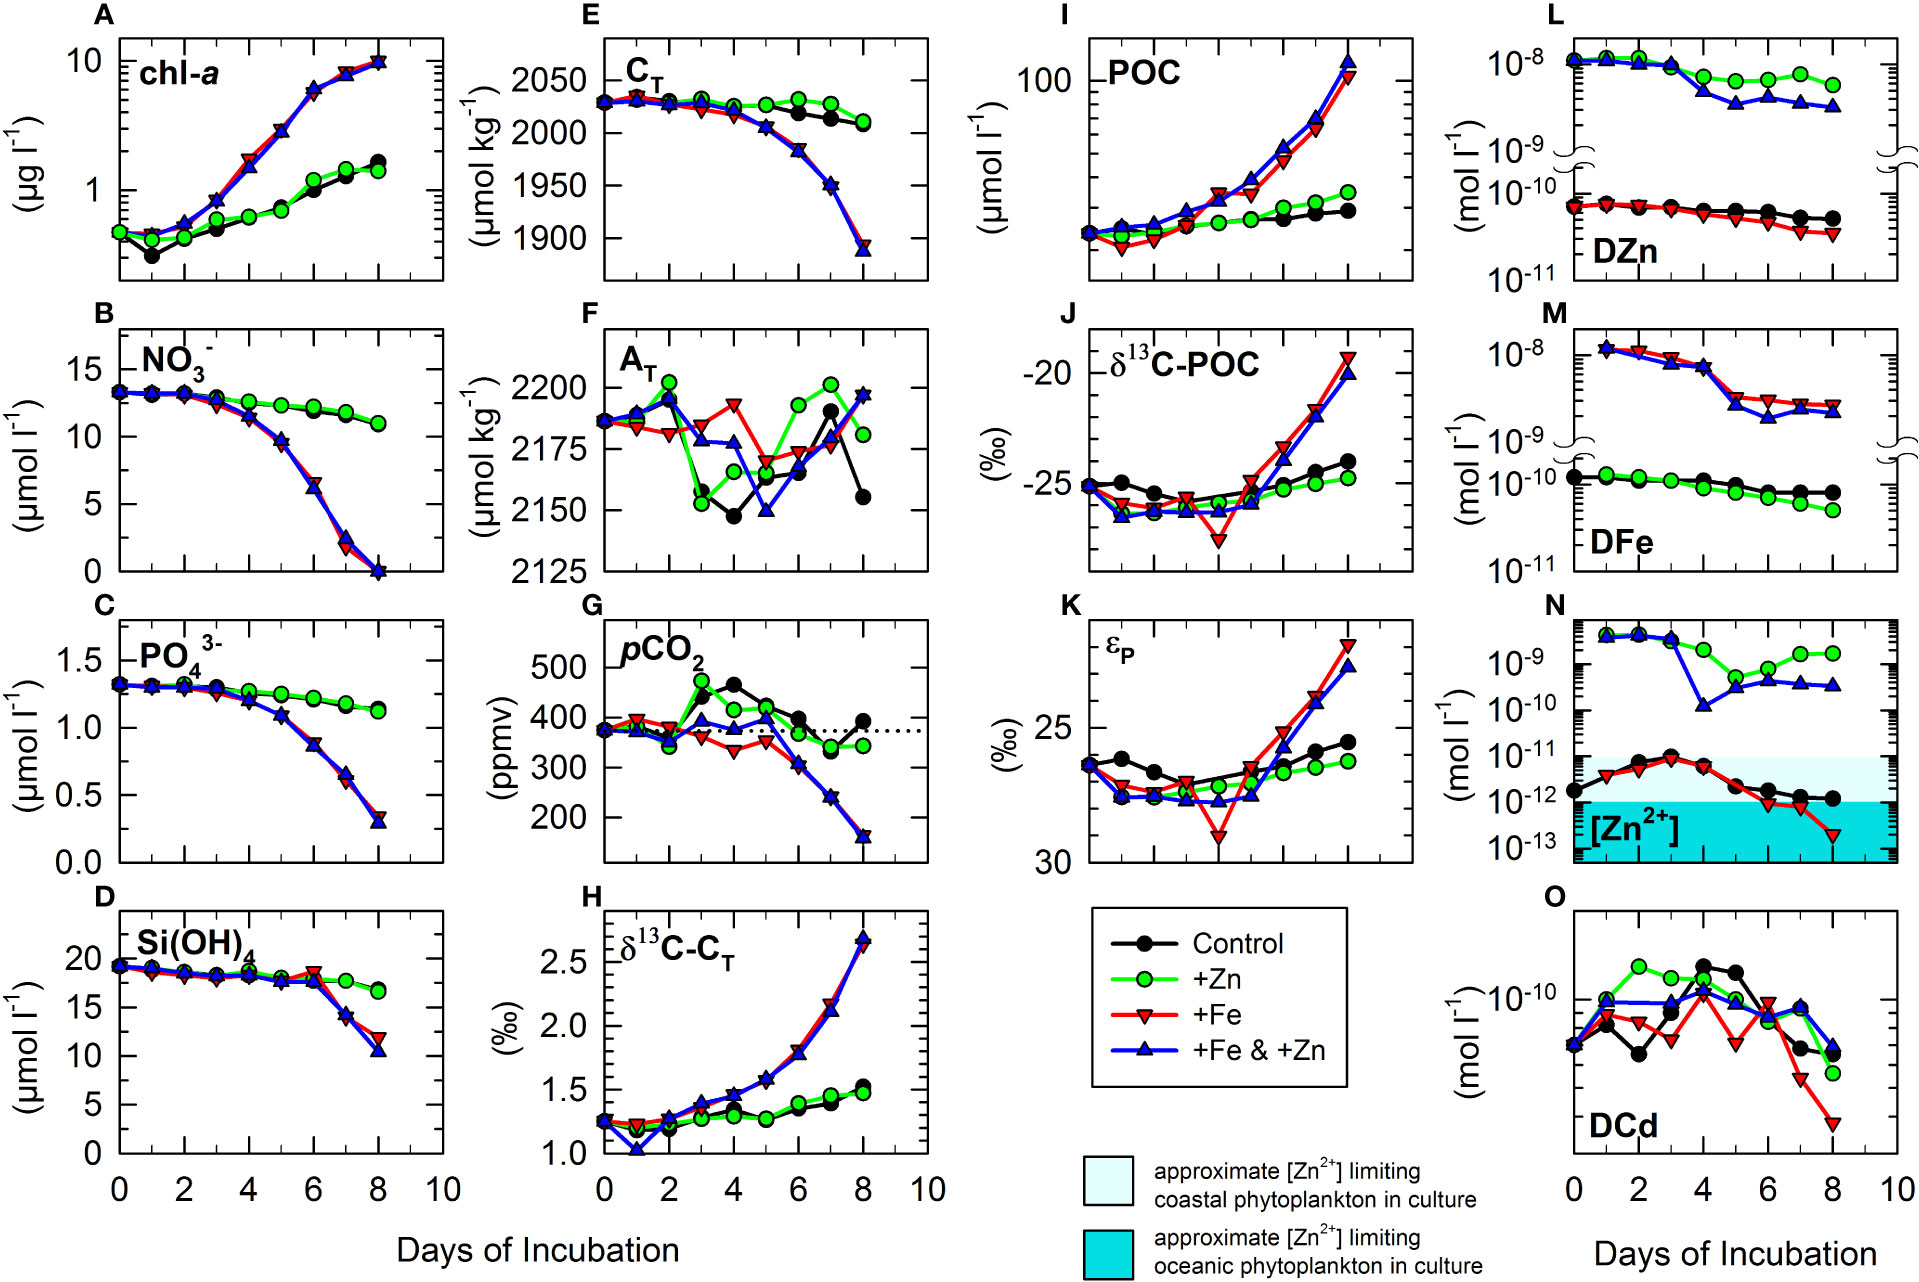
Figure 1 Time series of measurements during the 8-day on-deck incubations of cubitainers of seawater from Ocean Station Papa (OSP; 50°N 145°W). One set of incubations were un-supplemented (control), while the others were supplemented either with DZn (+Zn), DFe (+Fe), or both (+Fe & +Zn). The complete experiment represented (T0) measurements, followed by daily sampling from the four treatments, with each data point representing one ~4-L incubation. Subsamples for the following measurements were taken, with abbreviations given in Table 1A: Standard measurements of biomass of phytoplankton and concentrations of macronutrients: (A) chl-a, (B) NO3-, (C) PO43-, and (D) Si(OH)4. Standard measurements of the dissolved CO2 system: (E) CT, (F) AT, (G) pCO2, and (H) δ13C-CT. pCO2 was calculated from CT and AT assuming constant T = 7.3°C and S = 32.55 of the mixed layer at T0 (see Methods). The dotted line in (G) shows approximate atmospheric pCO2 for June 2001 (~373 ppmv). Particulate matter and isotopic analysis: (I) POC (J) δ13C-POC and (K) approximate fractionation factor (ϵp) between δ13C-CT and δ13C-POC. Dissolved trace metals: (L) DZn, (M) DFe, (N) [Zn2+], (O) DCd. Note that some concentrations are plotted on a log scale because of the large ranges resulting from trace metal supplementation. Areas shaded in two shades of cyan in (N) represent the approximate [Zn2+] levels below which Zn limits growth of some coastal (~10 pmol L−1) and oceanic (~1 pmol L−1) phytoplankton in cultures (Brand et al., 1983; Sunda and Huntsman, 1992; Varela et al., 2011).
Table 2 Summary of statistical significance of comparisons between measurements in incubations treated with various combinations of Zn and Fe.
The isotope ratio of total dissolved CO2 (δ13C-CT) increased from ~1.25‰ at T0, to ~2.65‰ in the two +Fe treatments, with resulting values significantly heavier than observed in the control and +Zn treatment (Figure 1H and Table 2), and clearly showing discrimination against heavier 13CO2 that reflected the strong drawdown in CT driven by Fe (Figure 1E). However, there was no significant difference in δ13C-CT between the two +Fe treatments, or between the +Zn treatment and the control (Table 2). The increases in chl-a and drawdown in nutrients in the two +Fe treatments were accompanied by sharp increases in POC that were significantly higher (>100 µmol L−1) than in treatments without Fe (Figure 1I and Table 2). By day 8, POC was significantly higher in the +Zn treatment (34.6 µmol L−1) than in the control (29 µmol L−1), but not significantly different between +Fe and +Fe & +Zn treatments (Figure 1I and Table 2). Later in the experiment, the 13C isotope ratio of POC (δ13C-POC) was significantly heavier in the two +Fe treatment (ca. −20‰ by day 8) than in the control and +Zn treatment (Figure 1J and Table 2). δ13C-POC was also slightly lighter in the +Zn treatment than in the control, and in the +Fe & +Zn treatment versus the +Fe treatment, although these differences were not significant (Table 2). From these data, fractionation factor (εP) values of ~21.9%–29.0‰ were crudely estimated in the four treatments (Figure 1K), simply derived as the difference between δ13C-POC and δ13C-CT on any given day. The bulk of CT is made up of ions, and should free CO2 be assumed instead to be the source of dissolved CO2 for photosynthesis, then a fractionation of −11‰ could be calculated at 7.3°C for CO2(aq) with respect to δ13C- (Mook et al., 1974). This would imply an εP range of 10.9‰ to 18‰ for fractionation between dissolved free CO2 and δ13C-POC during the incubations. The measured δ13C-POC represented the isotope ratio of the sum of accumulated POC, and εP did not therefore represent the true fractionation between source δ13C-CT—which was increasing through the experiment—and instantaneous δ13C-POC of the product. Although these incubations of natural populations were essentially closed systems, the use of the Raleigh fractionation model and equations (e.g., Mariotti et al., 1981) was inappropriate to estimate true εP between source and instantaneously produced product because both photosynthesis and calcification were simultaneously impacting upon CT and δ13C-CT. For this reason, the approximate values for εP are given for illustrative and comparative purposes only in Figure 1K, and statistical differences are not given in Table 2.
Concentrations of DZn and DFe at T0 (Figures 1L, M) clearly reflected additions to each treatment, and were obviously significantly higher in treatments supplemented with a particular metal (Table 2). Initial concentrations were not precisely as estimated from the stock solutions added, because of the flexible nature of the cubitainers—i.e., final incubation volumes were only nominally 4 L. Initial concentrations of DZn were ~11 nmol L−1 in the +Zn and the +Fe & +Zn treatments, with a slightly higher drawdown (though not significant) of DZn later in the +Fe & +Zn treatment (Figure 1L) that reflected the higher chl-a in that treatment (Figure 1A). In the two treatments without added Zn, initial concentrations of DZn were only ~71 pmol L−1, reflecting the ambient levels in the water column at the time of sampling. By the end of the experiment, DZn decreased in the control to ~51 pmol L−1 and was reduced significantly more (Table 2) in the +Fe treatment to ~35 pmol L−1 by the high levels of biomass present (Figures 1A, I). In the two +Fe treatments, concentrations of DFe were ~11–12 nmol−1 at T0 (Figure 1M), and by day 8, this was reduced more in the +Fe & +Zn treatment (2.17 nmol L−1) than in the +Fe treatment (2.68 nmol L−1), though this was not statistically different (Table 2). Between days 0 and 2, concentrations of DFe were 116.7 pmol L−1 ( ± 5.8 pmol L−1 SD) in the control and 123.3 pmol L−1 ( ± 5.8 pmol L−1) in the +Zn treatment, a difference that was not significant (t-test, p > 0.6). These data suggest that contamination by Fe was unlikely to be involved in observed differences between control and +Zn treatment. By day 8, DFe was significantly lower (~50 pmol L−1) in the +Zn treatment than in the control (~80 pmol L−1) (Figure 1M and Table 2), despite similarly low concentrations of chl-a in the two treatments (Figure 1A and Table 2).
Changes in the activity of free Zn [Zn2+] in the four treatments (Figure 1N) showed rather similar patterns to those observed for DZn (Figure 1L) though differences were less clear. Between days 1-2, [Zn2+] concentration was ~4 nmol L−1 in the two +Zn treatments (Figure 1N). By day 8, [Zn2+] was depleted to 0.33 nmol L−1 in the +Fe & +Zn treatment, and to 1.68 nmol L−1 in the +Zn treatment, although the difference was not significant (Table 2). In the two treatments without added Zn, [Zn2+] at T0 was only ~2 pmol L−1 and remained between 1.2 and 9.7 pmol L−1 throughout the experiment in the control (Figure 1N). In contrast, the elevated chl-a in the +Fe treatment resulted in a sharp drawdown in [Zn2+] to <0.2 pmol L−1 by day 8. Differences in [Zn2+] between control and +Fe were not however statistically significant (Figure 1N and Table 2), possibly due to uncertainties in accurate estimation of [Zn2+] at very low concentrations, or because the relative difference was only strongly apparent by days 7–8. At T0, concentrations of DCd were ~70 pmol L−1, increasing slightly in all treatments over the first 2–3 days (Figure 1O). In the control and in both +Zn treatments, DCd varied between 56 and 129 pmol L−1 throughout the experiment with no significant differences between treatments (Figure 1O and Table 2). In the +Fe treatment, however, the low levels of DZn and [Zn2+] measured later in the experiment were also associated with DCd concentrations as low as ~38 pmol L−1, which was significantly lower than in the control (Figure 1O and Table 2).
The data for microplankton enumeration exhibited less striking differences between treatments (Figures 2A–F) than did those for dissolved and particulate measurements (Figure 1). High growth rates in the two +Fe treatments were particularly notable for large diatoms (Figure 2A), which increased from 10.6 × 10³ cells L−1 at T0 to >5 × 10⁶ cells L−1 by day 8, and were significantly higher than in control and +Zn treatment (Figure 2A and Table 2). No significant difference was observed between large diatoms in +Fe versus +Fe & +Zn treatments, or between control and + Zn treatment (Table 2). In contrast, abundance of small diatoms varied less between treatments (Figure 2B) but were significantly higher in the +Fe alone treatment than in the other three treatments (Table 2). Despite increasing in abundance throughout the experiment, small flagellates (Figure 2C) and dinoflagellates (Figure 2D) showed no significant differences between any of the treatments (Table 2). Abundances of coccolithophores showed little difference between treatments (Figure 2E and Table 2), but were significantly lower in the +Zn treatment than in both the control and the +Fe treatment (Figure 2E and Table 2). Compared to other taxonomic groups, absolute abundances of ciliates were low and rather “noisy”, generally being of the order 0.3–20 × 103 cells L−1 (Figure 2F), but with relatively little temporal variation (Figure 2F). Clear differences between treatments were not apparent, although abundance was slightly higher (though not significant) in the +Zn treatment compared to the control (Figure 2F and Table 2).
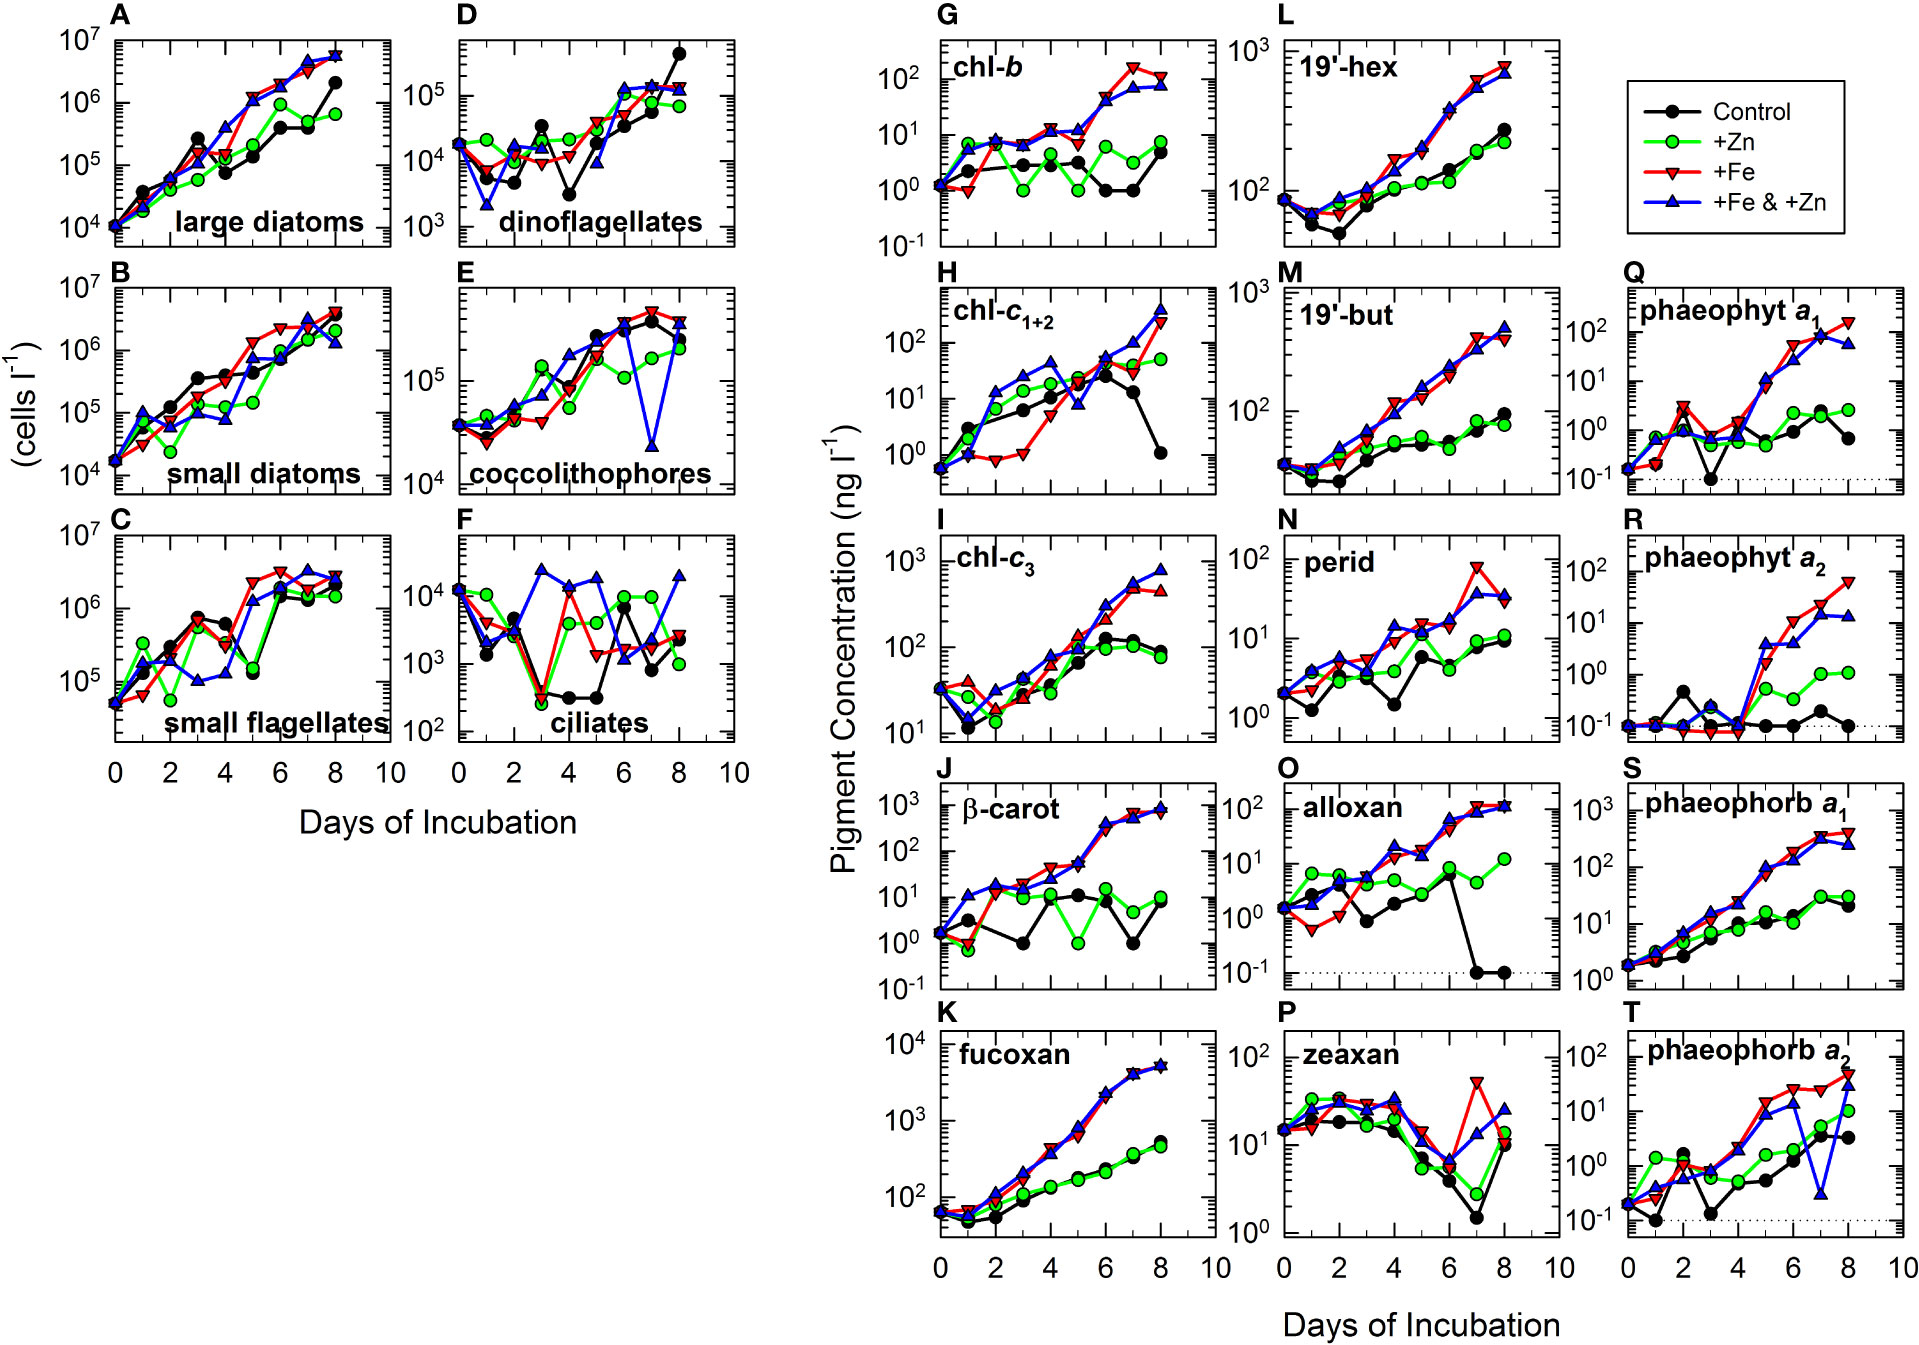
Figure 2 Time series of measurements of microplankton community composition from each of the cubitainers described in Figure 1. Abbreviations given in Table 1A. Abundance (cells L−1) of several broad taxonomic groups of phytoplankton: (A) large diatoms, (B) small diatoms, (C) small flagellates, (D) dinoflagellates, (E) coccolithophores, and (F) ciliates. Concentrations of pigments (ng L−1) measured using high-pressure liquid chromatography (HPLC) analysis of particulate samples. See Methods for details. Pigments shown are (G–I) chlorophylls chl-b, chl-c1+2, and chl-c3; (J) the carotenoid β-carot and several xanthophyll carotenoids; (K) fucoxan; (L) 19’-hex; (M) 19’-but; (N) perid; (O) alloxan; and (P) zeaxan. Also shown are chlorophyll degradation derivatives (Q, R) phaeophyt a1 and a2, and (S, T) phaeophorb a1 and a2. Because of the log-scale plots, where pigments were undetectable, the lower detection limit of ~0.1 ng L−1 (see dotted line where appropriate) of the pigment was also plotted.
As observed for chl-a (Figure 1A), other chlorophylls (Figures 2G–I) and most carotenoids (Figures 2J–O) showed significantly greater (Table 2) exponential increases in the two +Fe treatments than in control and +Zn treatment. Zeaxan showed a different pattern (Figure 2P), with no significant differences between the +Zn treatment and either the +Fe or the +Fe & +Zn treatments (Table 2). Most chlorophylls and carotenoids showed no significant differences between +Zn and control treatments (Table 2) with the exceptions of chl-c1+2 and alloxan (Table 2). By the end of the experiment in the controls, alloxan concentration was below the detection limit (<DL) and chl-c1+2 had decreased to ~1 ng L−1 (Figures 2H, O). Although these differences became more marked later in the experiment, the levels of alloxan and chl-c1+2 were consistently lower almost every day in the control versus the +Zn treatment, and a further non-parametric Wilcoxon test also verified (p< 0.001) a highly significant difference. Most chlorophylls and carotenoids showed no significant difference between the +Zn treatment and the +Fe & +Zn treatment (Table 2), with the exceptions of chl-b, β-carot, and alloxan (Table 2).
Phaeophyt a1 and a2 and phaeophorb a1 (Figures 2Q–S) showed patterns similar to those observed for chl-a and fucoxan (Figures 1A, 2K), with concentrations in the two +Fe treatments significantly higher than in the control and +Zn treatment (Table 2). Phaeophorb a2 showed a similar pattern (Figure 2T) although differences were not significant between the control and +Fe & +Zn treatment, or between the +Zn treatment and the +Fe & +Zn treatment (Table 2). In contrast to the other phaeopigments, phaeophyt a2 was significantly higher in the +Zn treatment than in the control (Table 2). Phaeophorb a1 and a2 were significantly higher in the +Fe & +Zn treatment than in the +Fe treatment (Table 2), in contrast to the phaeophytins.
In terms of initial concentrations at T0, the dominant pigments were fucoxan, 19’-hex, 19’-but, and chl-c3, all with concentrations of >30 ng L−1. Zeaxan was also present at a relatively high initial concentration of ~15 ng L−1. Initial concentrations of chl-b, β-carot, and perid were 1–2 ng L−1, with concentrations of chl-c1+2 and alloxan of <1.5 ng L−1. Phaeophorb a1 was present at an initial concentration of ~1.9 ng L−1, whereas those of phaeophyt a1 and a2, and phaeophorb a2 were 0.1–0.2 ng L−1
Concentrations of fucoxan, alloxan, and chl-c1+2 in control and +Zn treatment are compared in Figure 3 (using data from Figures 2H, K, O, shown on a linear scale) with concentrations reported in open water at OSP in July 2002 (Wong and Crawford, 2006). Fucoxan concentrations increased in both treatments through the experiment (as did chl-a) but within a similar range to that observed in open water (Figure 3A). Concentrations of alloxan in the control incubations of <DL–6.3 ng L−1 were similar to the range (<DL–5.4 ng L−1) measured by Wong and Crawford (2006), whereas concentrations in the +Zn treatment reached 12.1 ng L−1 (Figure 3B). Similarly, the range of chl-c1+2 concentrations in the controls (0.6–25.3 ng L−1) was consistent with the open water range of 2–13.4 ng L−1 (Wong and Crawford, 2006), whereas much higher concentrations of up to ~50 ng L−1 were measured in the +Zn incubation (Figure 3C). Normalized to chl-a in the incubations, fucoxan and chl-c1+2 showed steady increases through the experiment, whereas alloxan did not increase markedly but was rather variable (Figures 3D–F).
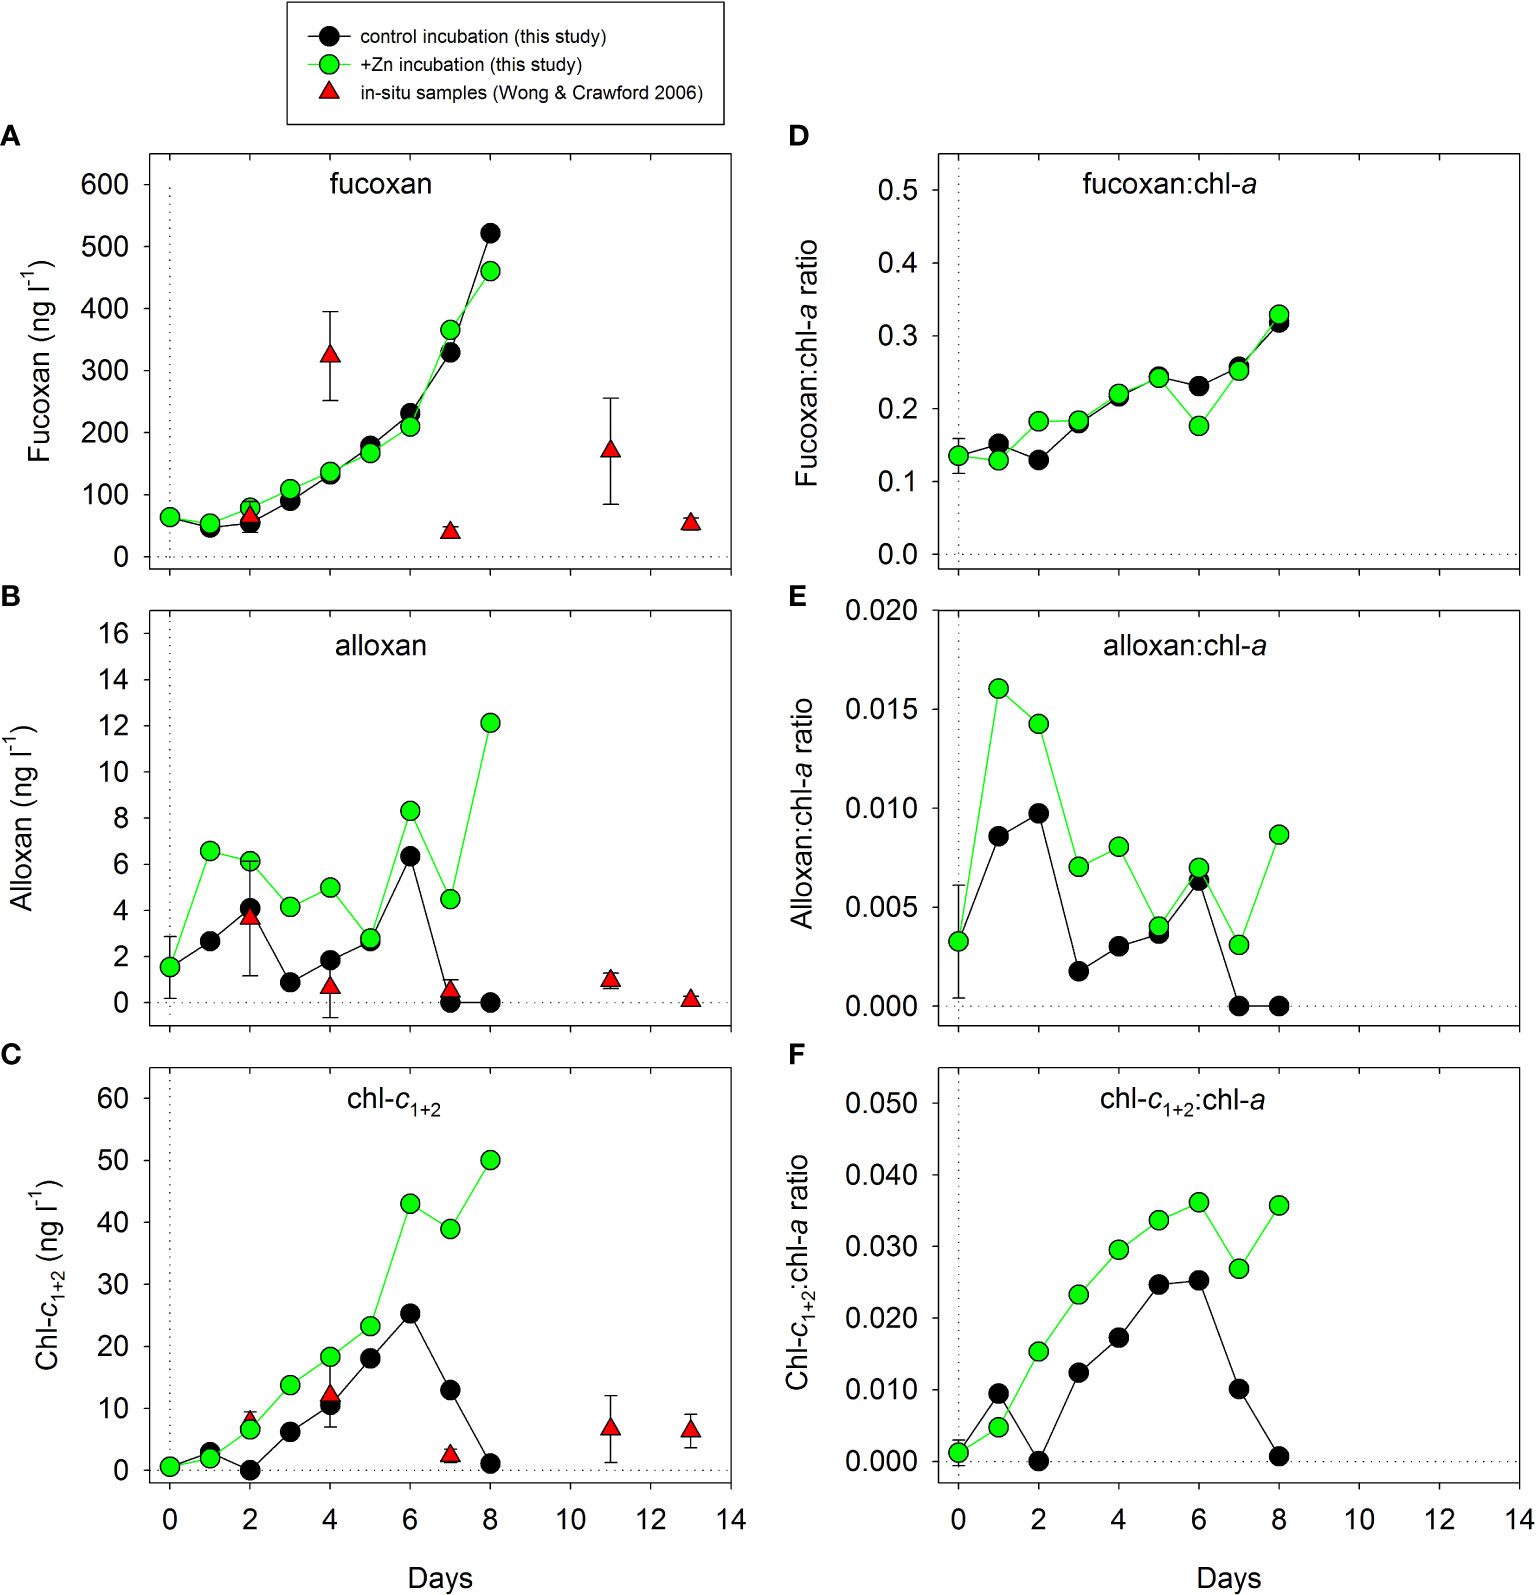
Figure 3 Comparison of concentrations of (A) fucoxan, (B) alloxan, and (C) chl-c1+2 (from Figure 2, now on a linear scale) over time between the present incubation study and the open water study of Wong and Crawford (2006). Panels (D-F) show the same three pigments normalized to changes in total chl-a in the incubations. Alloxan and chl-c1+2 showed significant differences between control and +Zn treatment (see Figure 2 and Table 2). Data from Wong and Crawford (2006) represent in situ concentrations averaged over the upper 35 m of the water column from samples taken outside a Fe-enriched patch of surface water at OSP in July 2002 (see Boyd et al., 2004).
Mixo ciliates were not enumerated in the incubations described above, but an earlier cruise in June 1998 at OSP provided data on their biomass and vertical distribution in relation to oceanographic properties (Figure 4). In the upper 50 m, T and S of surface water was around 9°C and 32.7, respectively, with a shallow seasonal thermocline at around 20 m depth (Figure 4A). The near-surface daily irradiance (I) of ~18 mol photons m−2 day−1 (Figure 4A) averaged ~312 µmol photons m−2 s−1 over a 16-h day. Near-surface concentrations of , , and Si(OH)4 were 10, 1, and 18 µmol L−1 respectively, and showed slight increases below ~30 m depth (Figure 4B). Concentrations of POC in near-surface water were ~80–85 µg C L−1, of which phyto C represented ~40–46 µg C L−1 (Figure 4C). A peak in POC of >100 µg C L−1 was present at ~30 m where the relative contribution of phyto C was lower (Figure 4C). Over the upper 50 m, mixo C of 0.8–8.2 µg C L−1 was of a similar order (2.4–5.1 µg C L−1) to diatom C (Figure 4D), with mixo C peaking at around 10 m depth. This C biomass was used to estimate the chl-a contribution of mixo ciliates (Figure 4E) of 0.01–0.08 µg chl-a L−1, assuming the mid-range C:chl-a ratio of 100 given by Putt (1990) for mixo ciliates. This chl-a contribution of mixo ciliates was similar to the range of 0.03–0.11 µg chl-a L−1 for the 5–20 µm size fraction measured on the same day (Figure 4E). Using the profiles of chl-a (Figure 4E) and mixo C (Figure 4D), their productivity was then estimated (Figure 4F) using the productivity versus irradiance (P vs. I) equations and parameters given by Putt (1990) for mixo ciliates. Maximum productivity of mixo ciliates at 5 m depth was estimated to be ~2.5 µg C L−1 day−1, and similar to the PP of ~3.2 µg C L−1 day−1 for the 5–20 µm size fraction measured at 5 m depth on the same day (Figure 4F). Finally, the overall contribution of mixo ciliates was estimated (Figure 4G) as up to ~10% total POC, ~18% total phyto C, ~24% total chl-a, and ~33% total PP.
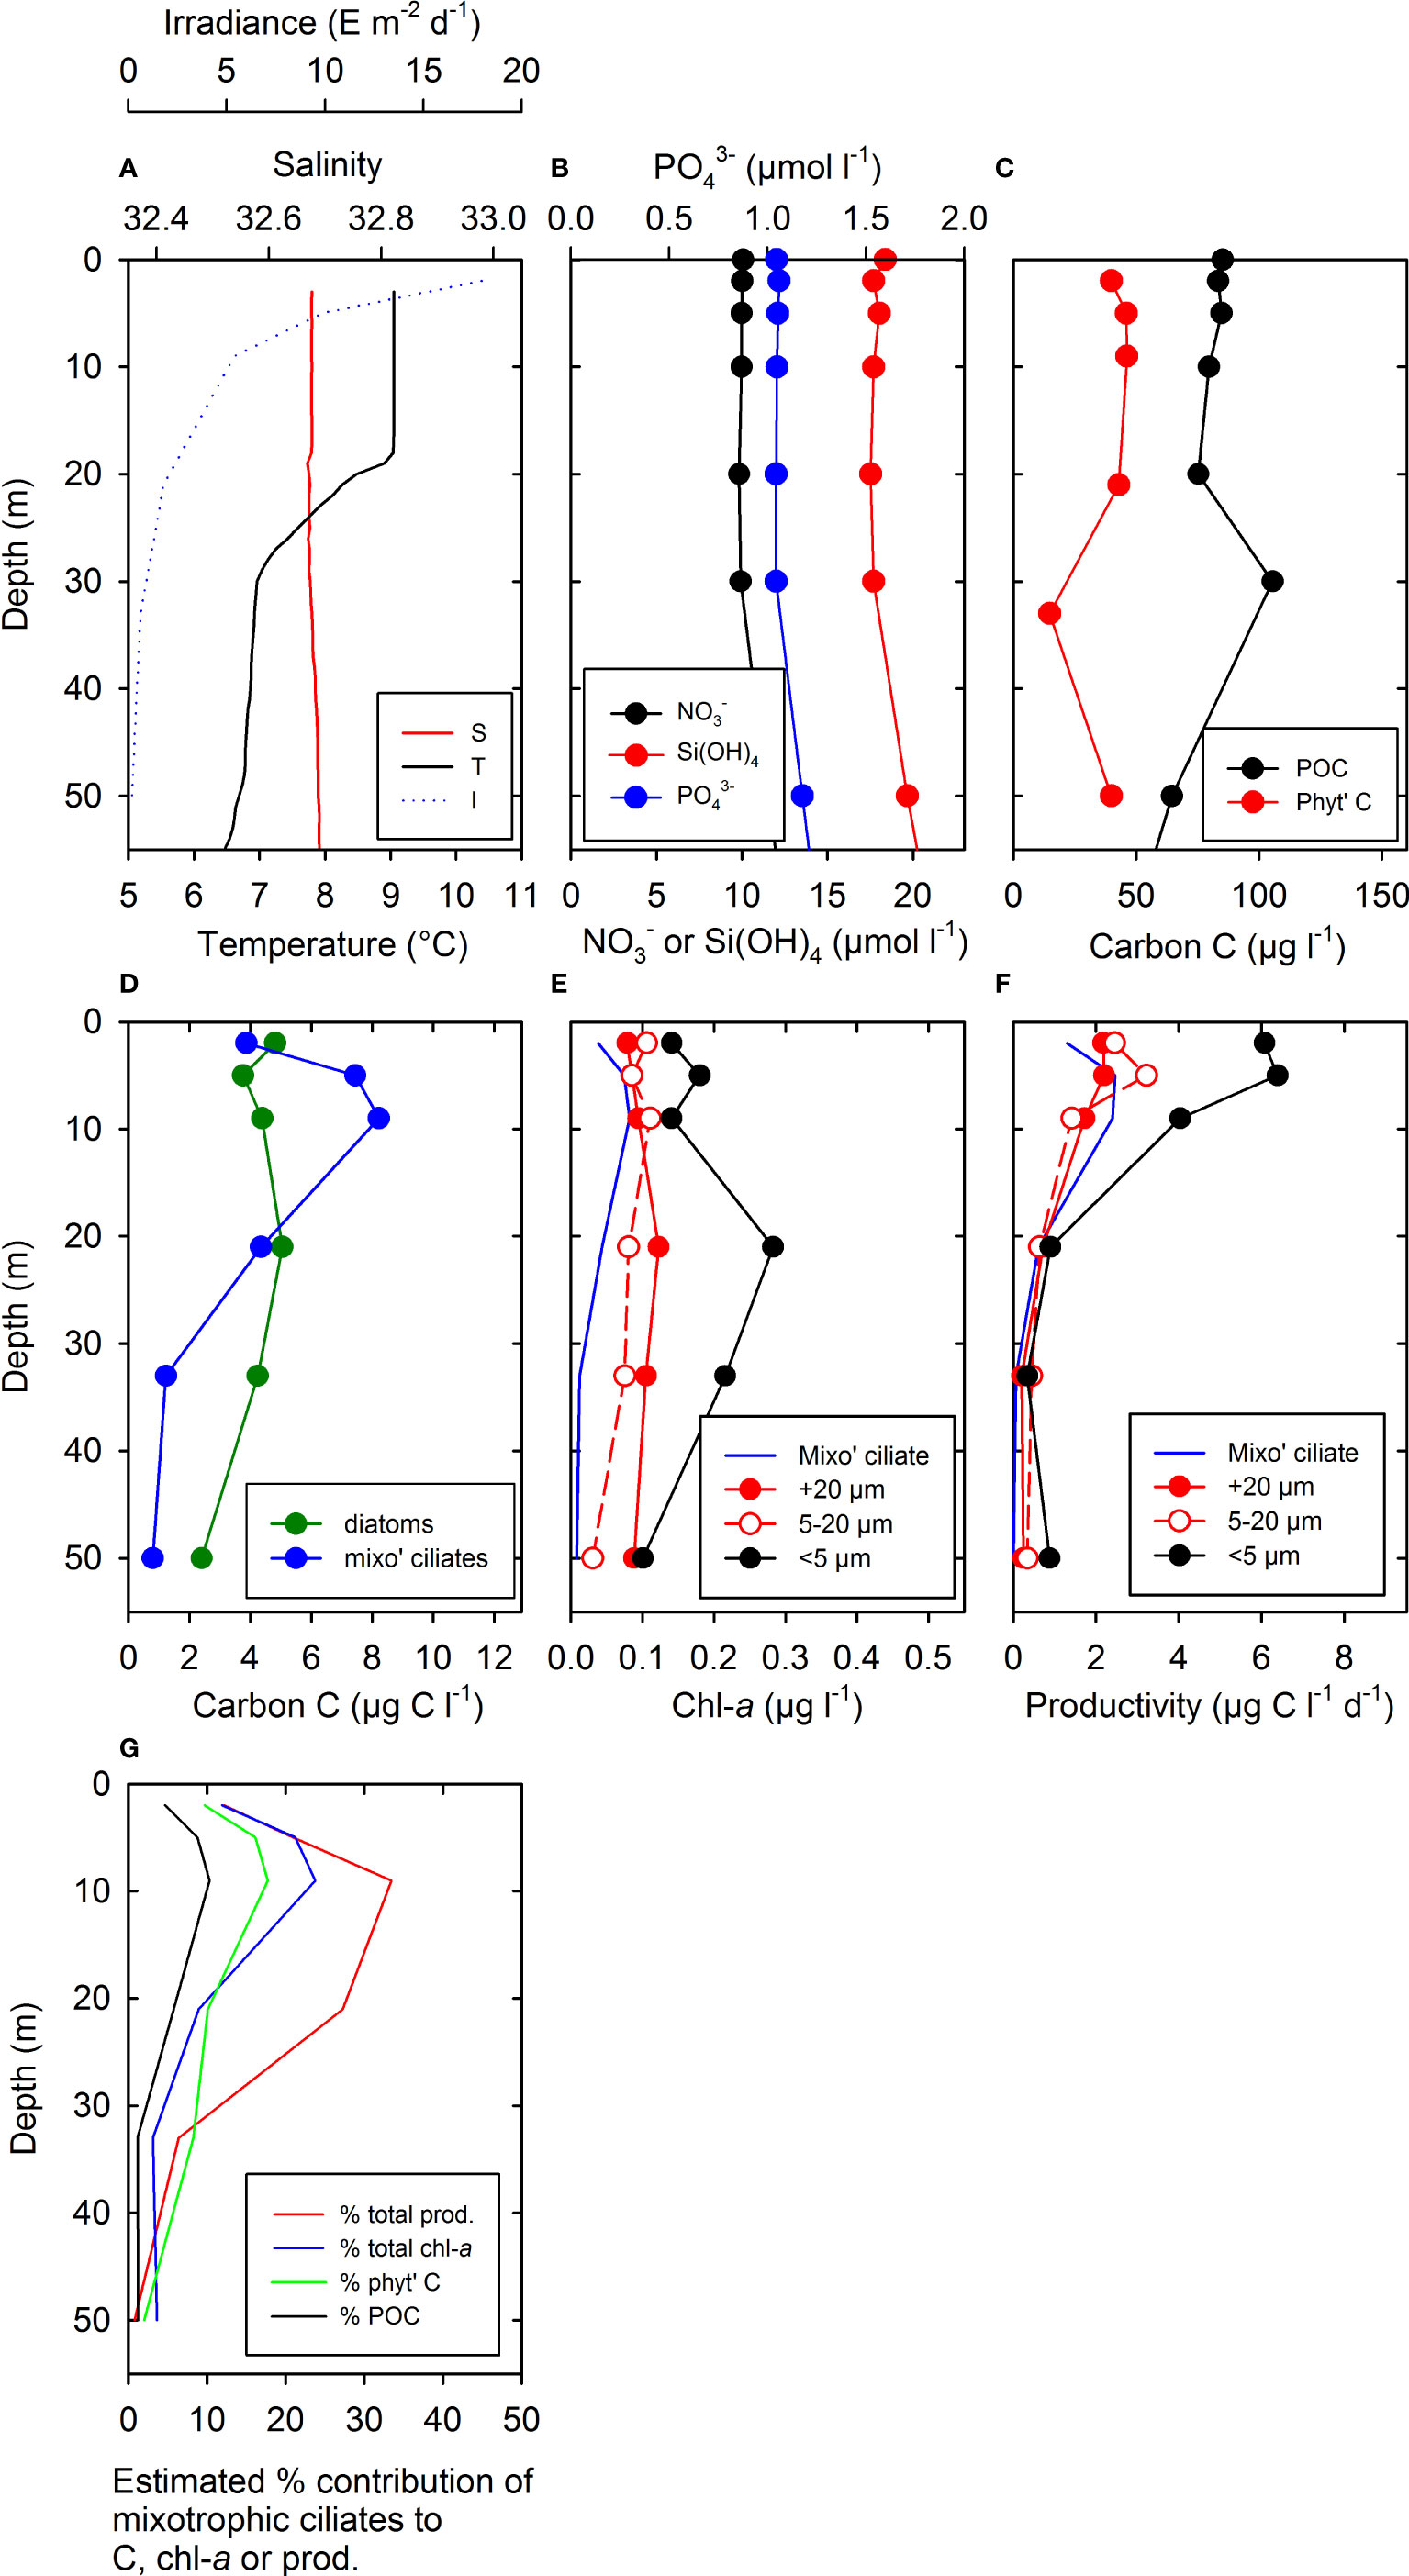
Figure 4 Depth profiles of oceanographic properties and biological measurements in the upper water column at OSP in June 1998. Abbreviations are given in Table 1B. (A) T, S, and total daily irradiance, I. (B) Concentrations of NO3-, Si(OH)4, and PO43-. (C) POC and phyto C (D) total cellular carbon from diatoms (diatom C) and mixotrophic ciliates (mixo ciliates, mixo C) estimated from microscopy, (E) estimated range of total chl-a content of mixo ciliates (calculated using C profiles shown in (D), and the mid-range of C:chl-a ratios of 100 for mixo ciliates given by Putt, 1990). Also shown in (E) are size-fractionated chl-a measurements (<5 µm, 5–20 µm, and >20 µm) taken on the same day. (F) Range of PP rates estimated for mixo ciliates using the chl-a profile estimated in (E), combined with the P vs. I relationship given for mixo ciliates (Putt, 1990) and our I profile (shown in A) collected on the same day. Values assumed were Pmax = 2.1 pg C pg chl-a−1 h−1 and α = 0.03 pg C pg chl-a−1 h−1 [µmol photons m−2 s−1]−1 representing mean values for mixo ciliates (Putt, 1990, see Methods for details). Also shown in (F) are size-fractionated 14C PP measurements (<5 µm, 5–20 µm, and >20 µm) taken on the same day. (G) Estimated % contribution of mixo ciliates to total PP >0.2 µm (sum of fractions shown in F), total chl-a content (sum of fractions shown in E), phyto C (shown in C), and total POC (shown in C). Estimated % contributions of mixo ciliates to total chl-a and total PP assumed a C:chl-a ratio of 100 as in (E).
Discussion
General observations
Our observations are consistent with previous incubation experiments in the HNLC Gulf of Alaska showing that Fe stimulates significant increases in chl-a and large diatoms, in turn drawing down and Si(OH)4 (Martin et al., 1989; Coale, 1991; Boyd et al., 1996; Crawford et al., 2003). In the present study, the addition of Fe with or without Zn also resulted in sharp significant increases in several pigments, POC, δ13C-CT, and δ13C-POC, and a significant drawdown in CT (Figures 1 and 2, Table 2). The addition of Zn alone did not significantly increase chl-a or drawdown of or Si(OH)4, thus largely supporting previous experiments (e.g., Coale, 1991; Crawford et al., 2003), but also further revealed no significant effects on CT, δ13C-CT, δ13C-POC (Figure 1), and several pigments—including fucoxanthin (Figure 2). Within this scenario of no apparent stimulation, our data do, however, suggest that Zn significantly increased the concentrations (relative to controls) of other minor pigments and POC, accompanied by a significant drawdown in DFe, but not CT (Table 2).
In control treatments, increases in chl-a, POC, and other measurements were notable, as previously reported in some studies in this area (e.g., Martin et al., 1989; Boyd et al., 1996), but not in others (e.g., Crawford et al., 2003). Moreover, increases in POC and pigments in the +Fe treatment were greater than observed in an in situ experiment at OSP (Boyd et al., 2004; Wong and Crawford, 2006). These deviations between on-deck incubations and open water studies could result from reduced grazing pressure, temperature changes, or alleviation of light limitation. Phytoplankton at OSP appear to be co-limited by Fe and light, at least in winter (Maldonado et al., 1999), and incubation of seawater from 15 m depth at 30% surface irradiance could represent an increase in irradiance compared to the average experienced within the mixed layer.
Multiple testing increases the possibility of false positives and negatives (see Methods), and the addition of Zn resulted in effect sizes that were relatively low compared to those for the two +Fe treatments (Figures 1, 2). The significance of our conclusions should therefore be judged cautiously, although our data show patterns that are plausible and consistent with observations in the literature. On the other hand, the relatively strong effect sizes observed in +Fe treatments—and the relatively subtle differences between +Fe and +Fe & Zn treatments—do replicate previous studies but represent scenarios rarely encountered in open water. Our discussion therefore focuses more on the comparisons between +Zn and control treatments, which, in the absence of Fe input, are more representative of regular seasonal variations of trace metals at OSP.
Trace metals, enzymes, and dissolved CO2
Variation in [Zn2+] in the control and +Fe treatment (0.2–9.7 pmol L−1; Figure 1N) was within the growth-limiting range (0.1–10 pmol L−1) established in cultures of marine phytoplankton (Brand et al., 1983; Sunda and Huntsman, 1992; Varela et al., 2011). However, these cultures are typically grown at saturating levels of cobalt (Co), and oceanic phytoplankton may be more limited by Zn when Co is also depleted. Indeed, diatoms in the northeastern Pacific have a high Zn demand that can be partially compensated for by Co (Kellogg et al., 2020), and complex relationships between Fe, Zn, and Co are also apparent in the Southern Ocean (Hassler et al., 2012).
Carbonic anhydrase (CA) is an enzyme with a Zn requirement that catalyzes the supply of CO2 from bicarbonate () under limiting CO2 conditions (Morel et al., 2020), with potential consequences for δ13C-POC (Morel et al., 1994). Substitution of Cd for Zn in CA when Zn is limiting is thought to be largely responsible for the nutritional role of Cd (e.g., Lee and Morel, 1995). Within the control and +Zn treatment, CT remained between 2,008 and 2,034 µmol kg−1 and pCO2 remained between 332 and 473 ppmv (Figures 1E, G), with no significant difference between the two. No difference was observed in Cd concentrations between +Zn and controls, and differences in CA activity were therefore unlikely to be associated with measured differences in pigments, POC, and DFe.
However, by day 8 in the +Fe treatment, CT was drawn down to 1,894 µmol kg−1, pCO2 to 164 ppmv, and DZn to ~35 pmol L−1 (Figures 1E, G, L), with DCd decreasing to ~38 pmol L−1, a significantly lower concentration (Figure 1O, Table 2) than in the control (~56 pmol L−1). In contrast, no significant difference was observed in DCd between the +Fe & +Zn treatment and control (Figure 1O, Table 2). These observations are consistent with the reduction of both CO2 and Zn by Fe-stimulated phytoplankton growth, with a concomitant increase in Cd uptake (Lane et al., 2009), although no significant difference in δ13C-POC or δ13C-CT was noted between the +Fe and +Fe & +Zn treatments (Figure 1H, J, Table 2). A consequence of limitation by one trace metal may be a secondary perhaps stronger limitation by another trace metal (Saito et al., 2008; Koch and Trimborn, 2019), and it could be speculated that dual Zn–Fe limitation in our controls was partially relieved by Cd uptake in the +Fe treatment. However, interpretations could be complicated by the identification of a Cd-containing enzyme in the marine diatom Thalassiosira weissflogii that does not require Zn (Lane et al., 2005), and further investigation is required.
Another putative physiological role for Zn in marine phytoplankton is its requirement in the enzyme alkaline phosphatase (AP), which can scavenge inorganic phosphorus (P) from dissolved organic P (Shaked et al., 2006). Indeed, increased AP activity upon addition of Zn has been reported in the sub-tropical Atlantic (Mahaffey et al., 2014), with enhanced Zn quotas also observed in P limited cultures of Trichodesmium (Wang et al., 2022). Throughout the present experiment, concentrations of remained >1 µmol L−1 in the control and +Zn treatment, with no significant difference between the two (Table 2); the role of AP is therefore unlikely to explain the observed differences in some measurements between treatments. Studies on Zn physiology of marine phytoplankton have tended to focus upon enzymes in cultured diatoms, but no significant differences were observed in diatom abundance, chl-a, or fucoxanthin between control and +Zn, or between +Fe and +Fe & +Zn treatments (Figure 2, Table 2).
Other roles for Zn are not well understood, but Zn is present in enzymes such as superoxide dismutases (SODs) and methionine synthase (Morel et al., 2020), and the potential for limitation and trace metal substitutions in other enzymes within phytoplankton and protists is unknown. Further research is clearly required on biogeochemical cycling of Zn, Fe, Cd, and Co in the HNLC Gulf of Alaska, both under Fe-limited conditions, and under episodic Fe-fertilized blooms.
Coccolithophores
As would be expected for organic growth, the strong drawdown in CT in the two Fe treatments was not associated with significant changes in AT (Figure 1, Table 2). However, small variations in AT were notable around day 4 in all treatments, possibly consistent with low levels of calcification, and with uptake of inorganic nutrients. The precision of replicate AT samples at T0 was poorer than generally accepted (see Methods), and non-significant differences in AT between treatments (Table 2) should be interpreted cautiously in the context of measurement error, a low calcification signal, and the consequential potential for false negatives.
In the two +Fe treatments and the controls, abundance of coccolithophores increased from ~0.4 × 10⁵ cells L−1 at T0 to only ~2.5–4.8 × 10⁵ cells L−1 by days 6–8, with little difference between treatments (Table 2). This observation contrasts with a previous experiment (Crawford et al., 2003) conducted in late summer at OSP where abundance in the +Fe treatment (~55 × 105 cells L−1) was much higher than at T0 or in the control (~1.9–2.7 × 10⁵ cells L−1). In the present study, abundance of coccolithophores between days 6 and 8 in the +Zn treatment (1.1–2.0 × 10⁵ cells L−1) was significantly lower than in the control or +Fe treatment (Figure 2E; Table 2). This is unlikely to indicate toxicity of Zn because abundance in the +Fe & +Zn treatment was not significantly different to the control treatment (Figure 2E; Table 2). Interestingly, these data again contrast with the earlier experiment (Crawford et al., 2003) where coccolithophore abundance after 8 days in the +Zn treatment was higher (7.6 × 10⁵ cells L−1) than in the control (2.7 × 10⁵ cells L−1), suggesting that factors other than direct Zn limitation were responsible for the decrease observed in the present study. Some phaeopigments were significantly higher in +Zn treatment than controls (Figure 2R), indicating that grazing or pigment degradation could have been a contributory factor. Alternatively, stimulation of some taxa in the +Zn treatment could have provided competition for coccolithophores, thus potentially explaining the apparent increased drawdown of DFe in the +Zn treatment compared to the control (Figure 1M).
Calcification by coccolithophores is known to be significant in these HNLC waters (Putland et al., 2004; Lipsen et al., 2007; Daniels et al., 2018), impacting both biogeochemical properties of surface waters (Wong et al., 2002; Fassbender et al., 2016) and particle fluxes to deeper waters (Wong et al., 1999; Wong and Crawford, 2002). Our data add further intrigue to conflicting effects of Fe additions on calcification in incubations at OSP (Lam et al., 2001; Crawford et al., 2003) and suggest that a seasonal or episodic component to interaction between coccolithophores and trace metals requires detailed investigation.
Phytoplankton and pigments
Because of the previous interest in Fe-limited diatoms at OSP, most studies have focused on the “major” pigments such as chl-a and fucoxanthin, a dominant pigment in diatoms, but also present in several other algal groups (Mackey et al., 1996). In the present study, observed changes in phytoplankton taxa, and concentrations of chl-a and fucoxanthin, support previous studies showing that large diatoms are strongly stimulated by Fe, with no significant stimulation by Zn. Changes in most other phytoplankton pigments showed similar patterns to those for chl-a and fucoxanthin, clearly suggesting that most taxa also benefited from addition of Fe. Several pigments also increased in control and +Zn incubations in a similar manner to chl-a, but zeaxanthin showed a different pattern, with a slight initial increase, followed by a decrease in all treatments. This could result from reduced grazing by zooplankton on protists in on-deck incubations, with consequential increased grazing by protists on Synechococcus.
Our microplankton analyses enumerated relatively broad taxonomic groups, and these were not always consistent with changes in pigment concentrations, which generally showed lower variability possibly as a consequence of lower measurement error associated with greater sample volumes. For example, there was no significant differences in dinoflagellates between any of the treatments (Figure 2D, Table 2), but peridinin, a pigment specific to most dinoflagellates, showed significant differences between Fe-limited and Fe-replete incubations (Figure 2N, Table 2). However, the interpretation of pigments as a more sensitive indicator of trace metal enrichment is complicated by variations in pigment quotas per cell and the various trophic modes exhibited in dinoflagellates.
The “small flagellate” category (Figure 2C) also showed no significant differences between any of the treatments (Table 2), possibly highlighting the challenge of accurate microscopic enumeration of phytoplankton populations dominated by smaller cells that are difficult to subdivide taxonomically. Given this lack of evidence for effects of trace metals on smaller phytoplankton, measurement of specific marker pigments shows promise as more effective indicators, as evidenced by concentrations of the relatively “minor” pigments alloxanthin and chl-c1+2 that were significantly higher in the +Zn treatment than in controls (Figures 2H, O, Table 2). The relative decrease in alloxanthin and chl-c1+2 in controls compared to the +Zn treatment did not appear to represent a simple Zn limitation of growth of certain taxa. For example, by day 8, alloxanthin was undetectable in the control (Figure 2O) where concentrations of DZn and [Zn2+] had decreased to ~51 pmol L−1 and ~1.2 pmol L−1, respectively, but alloxanthin increased sharply in the +Fe treatment (Figure 2O) despite even lower concentrations of DZn of ~35 pmol L−1 and [Zn2+] ~0.2 pmol L−1.
These observations on pigments corroborate significant correlations between DZn and alloxanthin and chl-c observed in near-surface waters across the subarctic North Pacific (Jakuba et al., 2012). The chl-c mentioned by Jakuba et al. (2012) was stated to be the dominant pigment in diatoms; chl-c2 is in fact the major chl-c component in chromophyte algae (Wright and Jeffrey, 2005), and therefore, the chl-c reported by Jakuba et al. (2012) likely also represented chl-c2 or chl-c1+2. Significant correlations between DZn and fucoxanthin in the western subarctic North Pacific and Bering Sea (Jakuba et al. (2012) were not noted in our study further east. Although we showed a significant difference in phaeophytin a2 between control and +Zn incubations (Table 1A), Jakuba et al. (2012) noted a correlation between Zn and chlorophyllide a.
In our +Zn and control incubations, variations in fucoxanthin (51–522 ng L−1) were similar to those observed (3–400 ng L−1) in open water in this region (Table 3). Alloxanthin and chl-c1+2 are often not reported, or are below the detection limit (<DL) in this region of the North Pacific (Table 3), consistent with the low or undetectable levels in our Zn-limited control incubations (Figure 2; Table 3). The temporal variations of fucoxanthin, alloxanthin, and chl-c1+2 concentrations in our control incubations were also largely consistent with the ranges observed in the upper water column outside a Fe-enriched patch at OSP (Wong and Crawford, 2006) with alloxanthin and chl-c1+2 considerably lower than concentrations observed towards the end of our +Zn incubations (Figures 3A–C). However, caution is required in these comparisons because of the chl-a increase in controls and +Zn treatment (noted earlier), and the apparent increase in fucoxanthin and chl-c1+2 relative to chl-a as the experiment progressed (Figures 3D–F). In control incubations, alloxanthin and chl-c1+2 had concentrations of <DL and 1.1 ng L−1, respectively, by day 8, with notably higher concentrations of 12.1 ng L−1 and ~50 ng L−1, respectively, in the +Zn treatment (Figures 3B, C). This was accompanied by a similar effect on phaeophytin a2, which, by day 8, was <DL in the control and >1 ng L−1 in the +Zn incubation (Figure 1R, Table 2). These pigment differences were supported by a similarly strong effect size on DFe by day 8, with drawdown to ~50 pmol L−1 in the +Zn treatment, compared to ~80 pmol L−1 in the control (p< 0.01, Table 2).
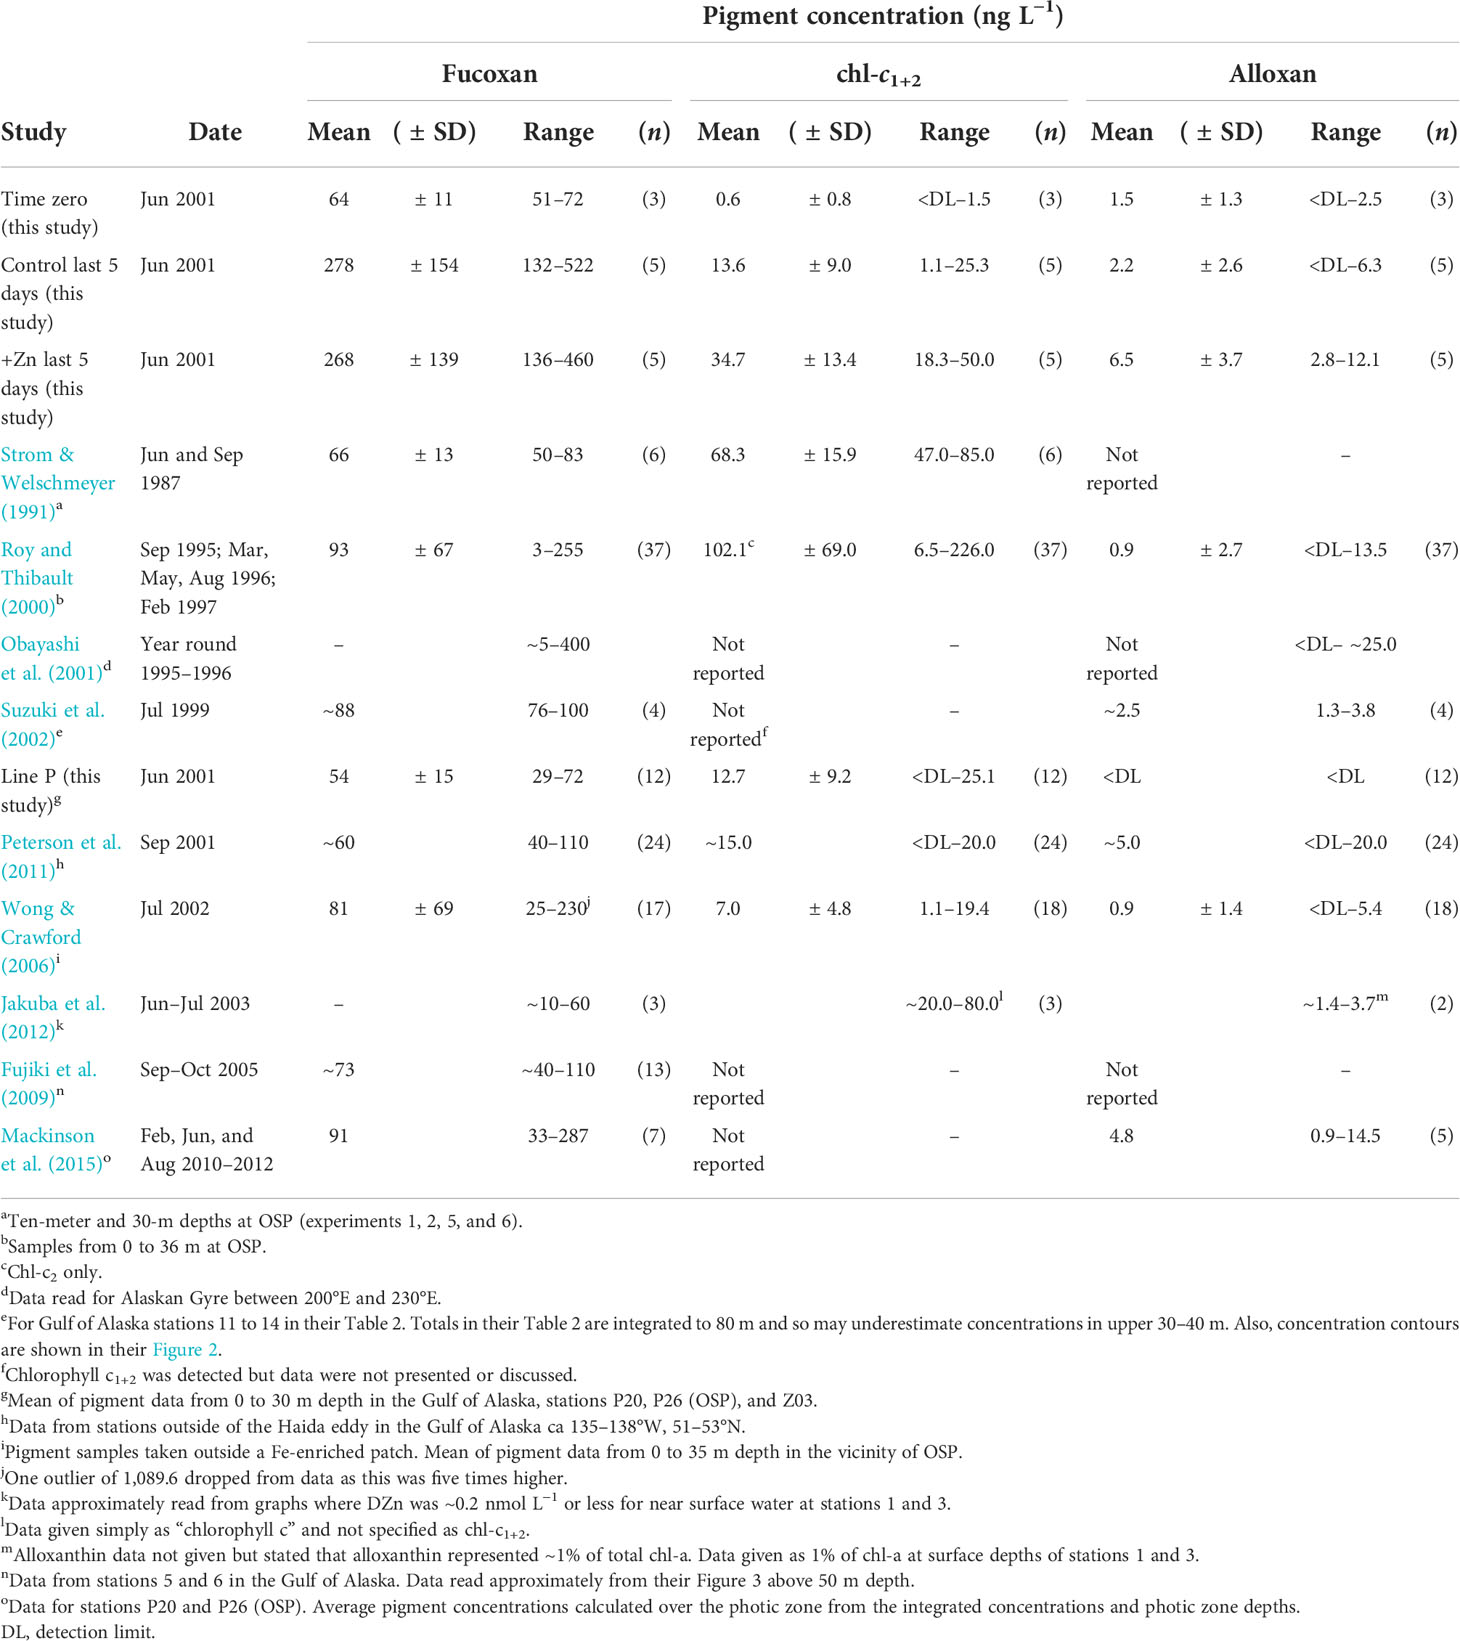
Table 3 Summary of observed published concentrations of fucoxanthin, chlorophyll c1+2, and alloxanthin in the Northeastern Subarctic Pacific.
Though not an initial focus for our study, alloxanthin is a specific marker pigment for cryptophytes (Jeffrey et al., 1997)—also known as cryptomonads—which, in the present study, were not specifically enumerated within the small flagellate category. Cryptophytes also contain chl-c2 (Jeffrey et al., 1997), a pigment present in several other taxonomic groups (Mackey et al., 1996; Wright and Jeffrey, 2005). For cryptophytes, ratios of alloxan:chl-a typically fall within the range of 0.1–0.5, with chl-c2:chl-a ratios in the range 0.07–0.20 (Mackey et al., 1996; Henriksen et al., 2002; Funk et al., 2011; Laviale and Neveux, 2011), although higher ratios of alloxan:chl-a have been observed under certain conditions. These ratios are typically lower than those for fucoxan:chl-a of 0.04–1.21 in haptophytes, chrysophytes, and diatoms (Mackey et al., 1996). The significantly lower concentrations of alloxanthin and chl-c1+2 in control incubations (compared to +Zn) (Figures 2H, O and 3B, C) therefore suggest some form of influence of Zn on growth or biomass of cryptophytes, and/or on their pigment quotas. Ratios of alloxan:chl-a in cryptophytes vary in response to irradiance (Funk et al., 2011; Laviale and Neveux, 2011) and nutrients (Henriksen et al., 2002). Although variation in pigment quotas could be driven by nutrient differences between the treatments with and without Fe, macronutrients and irradiance were identical in our +Zn and control incubations, with only DZn varying between the two treatments. Our study was conducted in an HNLC area where—by definition—macronutrient changes are relatively moderate, and very rarely limiting, but where alloxanthin (and to a lesser extent chl-c1+2) is often undetectable (Table 3). Our data are supported by a recent study on an Antarctic cryptophyte Geminigera cryophile, where Zn limitation resulted in decreases of >99% in cellular Zn quota, >80% in growth rate, and >50% in alloxanthin quota (Koch and Trimborn, 2019). However, alloxanthin decreased sharply to <DL in our control incubations, a concentration unlikely to be driven solely by variation in cellular quota.
Abundances of cryptophytes average 3.6–9.3 × 10³ cells L−1 for spring–summer around OSP (Booth et al., 1993; Marchetti et al., 2006; Crawford et al., 2018). Adopting an approximate alloxanthin quota for cryptophytes (e.g., Teleaulax sp., Rhodomonas sp., and G. cryophile) in cultures of 0.041–0.098 pg cell−1 (Lotocka, 2015; Koch and Trimborn, 2019), the above abundances would represent 0.15–0.91 ng L−1 alloxanthin, a range at the lower end of concentrations observed in our control and +Zn incubations, and in open water around OSP (Figures 3B, C and Table 3). Assuming average alloxanthin concentrations of between ~0.9 and 5 ng L−1 in unenriched conditions around OSP (Table 3), a mean chl-a of ~0.3 µg L−1 (Frost, 1991), and a nominal alloxan:chl-a ratio of 0.3 (mid-point of range 0.1–0.5 given above), alloxanthin-containing cells could contribute 1%–6% of total chl-a.
Mixotrophic protists
Around OSP, alloxanthin concentrations can, however, vary from <DL to >20 ng L−1 (Table 3), and the contribution of alloxanthin-containing cells to total chl-a could clearly exceed the 1%–6% estimated above. In near-surface waters at the beginning of a Fe enrichment experiment at OSP, cryptophyte abundance (~3.6 × 10³ cells L−1, Marchetti et al., 2006) and alloxanthin concentration (~5 ng L−1, Wong and Crawford, 2006) would imply a cellular alloxanthin content of >1 pg cell−1, around an order of magnitude higher than quotas derived in culture (Lotocka, 2015; Koch and Trimborn, 2019), and thus indicative of the potential contribution of other protists to alloxanthin.
Alternative sources for alloxanthin and chl-c2 are cryptophyte endosymbionts, or functional plastids, retained by mixotrophic protists such as Laboea strobila (e.g., Stoecker et al., 1988), Strombidium spp. (e.g., Stoecker et al., 1988/1989; Stoecker and Silver, 1990; Crawford and Stoecker, 1996), Mesodinium rubrum (e.g., Gustafson et al., 2000), and Dinophysis spp. (e.g., Rial et al., 2013). Ratios of alloxan:chl-a and chl-c1+2:chl-a in cryptophyte prey appear to be largely reflected in the ratios reported for M. rubrum and Dinophysis spp. (Rial et al., 2013), and in red tides of M. rubrum (Guzmán et al., 2016). The orange fluorescence characteristic of phycoerythrin—another diagnostic marker for cryptophytes—has been reported in free-living L. strobila (McManus and Fuhrman, 1986) and in other plastidic ciliates (Fragoso et al., 2019), suggesting that their functional cryptophyte plastids contribute to community alloxanthin.
Ciliates were not initially a focus of the present study, and mixotrophic ciliates were not enumerated in our incubations. Between-treatment comparisons of total abundance may lack statistical power because of the potential measurement error associated with the relatively small volumes enumerated (see Methodological limitations section) and significance tests (Table 2) should therefore be interpreted cautiously in the context of potential false negatives. Abundances of ciliates in the control incubations (~0.3–12 × 103 cells L−1) (Figure 2F) were, however, consistent with average abundances (~1–6 × 10³ cells L−1) and biomass (~1–10 µg C L−1) reported in the upper mixed layer at OSP (Gifford, 1993; Strom et al., 1993). Data from an earlier cruise in June 1998 (Figures 4C, D, G) show that mixotrophic ciliates contributed up to ~10% POC and ~18% of total phytoplankton C in the upper 20 m at OSP, with diatoms contributing up to ~12% total phytoplankton C. Assuming a nominal mid-range C:chl-a ratio of 100 (Putt, 1990), mixotrophic ciliates contributed up to ~24% total chl-a, and ~33% total primary productivity (Figures 4E–G). This corroborates earlier observations that the mixotrophic ciliates Laboea spp., Strombidium spp., and Tontonia spp. are common at OSP (Booth et al., 1993) and in the eastern Bering Sea (Stoecker et al., 2014), at times contributing >50% to total chl-a (Stoecker et al., 2014).
Adopting biomass measurements of 3.9–8.2 µg C L−1 in the upper 20 m (Figure 4D), mixotrophic ciliates could potentially contribute 5.8–12.3 ng L−1 alloxanthin in near-surface waters at OSP, assuming a C:chl-a ratio of 100 (Putt, 1990), an alloxan:chl-a ratio of 0.30 (see above), and that 50% plastids were derived from cryptophytes. With additional assumptions for Laboea spp. of ~90 pg chl-a cell−1 (Putt, 1990), ~10 ng C cell−1 (Stoecker and Michaels, 1991), and an average abundance of 89–726 cells L−1 at OSP (Booth et al., 1993), this species alone can be similarly estimated to contribute 0.9–7.3 µg C L−1 and 1.2–9.8 ng L−1 alloxanthin. These ranges of contribution of alloxanthin by mixotrophic ciliates are greater than those estimated above for free-living cryptophytes around OSP (<1 ng L−1), although calculations clearly depend on several variable assumptions (e.g., Putt, 1990). With abundances reaching 2,460 cells L−1 in August 1987 (Booth et al., 1993), Laboea spp. have the potential to contribute ~30 ng L−1 alloxanthin, similar to the maxima observed in open water at OSP (Table 3).
Protozoa, predominantly ciliates, constitute a major component of the diet of Neocalanus plumchrus, one of the dominant copepods in this region of the subarctic Pacific (Gifford, 1993), and 37%–75% of these ciliates are known to be mixotrophic around OSP and in the eastern Bering Sea (Booth et al., 1993; Stoecker et al., 2014). The effect size of adding Zn on total POC in our experiment was relatively small (~5.6 µmol L−1 higher than control by day 8), compared to the two +Fe treatments (~90 µmol L−1 higher than control), and the statistical significance could be questioned (see Methods). However, as noted earlier, Fe fertilization rarely occurs in the region and our data indicate that further research is required to evaluate the influence of Zn on the supply of C to higher trophic levels.
Biogeochemical perspective
There are several broader biogeochemical implications to the present study. Firstly, monitoring only chl-a and as indicators of phytoplankton biomass and activity may obscure subtle dynamics of community structure that could have important geochemical implications. Secondly, strong Fe limitation coupled with infrequent episodic Fe input suggests that certain physiological/behavioural processes may be limited by the supply of other trace elements such as Zn. Our data not only indicate some form of influence of Zn on the microplankton community under regular Fe-limited conditions, but also are suggestive of Zn stress—possibly mitigated by Cd uptake—during Fe-stimulated phytoplankton blooms. Thirdly, the vertical relationship between DZn and Si(OH)4 observed in this region (e.g., Lohan et al., 2002) may point to diatoms as the principal biological driver of variations in DZn in near-surface waters, but our data suggest that other taxa may be involved. A subtle stimulation of small diatoms by Zn was observed in late summer at OSP (Crawford et al., 2003), but not in the present study—in early summer—where Si(OH)4 concentrations were not significantly different between control and +Zn treatment (Table 2). The enhanced sinking of diatoms ballasted by bSi—compared to smaller non-siliceous cells—may contribute to the correlation between DZn and Si(OH)4, but this relationship appears to be decoupled in this region (Janssen and Cullen, 2015; Vance et al., 2019), potentially resulting from different length scales of regeneration of organic matter and bSi (Vance et al., 2019), as also suggested in the Southern Ocean (Vance et al., 2017). Our study suggests that the biomass of alloxanthin-containing cells—such as cryptophytes and/or mixotrophic protists—could be similar to diatoms under Fe-limited conditions at OSP (Figure 4D), and that these non-siliceous cells may be intimately coupled to cycling of Zn in near-surface waters. More efficient regeneration of particulate C and Zn from non-siliceous cells in the upper water column may be a process that has been obscured by the relationship between DZn and Si(OH)4 that extends into much deeper waters, a relationship of considerable debate on the global scale (Vance et al., 2017; Weber et al., 2018).
In HNLC waters around OSP, the concept of Zn limitation was dismissed by John Martin (Martin et al., 1989) on the basis that despite extremely low near-surface concentrations of DZn of ~0.1–0.2 nmol kg−1 (Martin et al., 1989; Lohan et al., 2002), the relatively high concentrations (>1–2 nmol kg−1) below the winter mixed layer depth of ~120 m (Whitney and Freeland, 1999) would re-supply near-surface waters through vertical mixing. However, steep concentration gradients in DZn appear to be maintained through the upper 100 m even in winter (Lohan et al., 2002), implying strong biological uptake in near-surface waters, possibly involving the activity of ligands (Lohan et al., 2005). While not driving the large episodic phytoplankton blooms typically associated with Fe fertilization (Boyd et al., 2004; Hamme et al., 2010), Zn additions could be associated with subtle community shifts. However, because of the exploratory nature of our study, and the associated statistical uncertainty, further research is required to validate these observations.
With much steeper vertical gradients in DZn than DFe in the mixed layer, the coupling of Zn supply with vertical mixing could drive seasonal and interannual variations in community structure that may be sensitive to a changing ocean. Indeed, a large patch of warmer water was observed between 2013 and 2016 in the northeastern subarctic Pacific (Peña et al., 2019) where increased stratification was associated with changes in phytoplankton community composition and very low concentrations of alloxanthin (Peña et al., 2019). Concomitant decreases in net community production were also observed (Yang et al., 2018; Bif et al., 2019), possibly resulting from the decreased vertical supply of macronutrients and trace metals. It could be speculated that our control incubations restrict the supply of DZn—with a consequential decline in alloxanthin—in a manner that mirrors processes occurring under stratified conditions in open water.
Cryptophytes clearly represent a component of the small phytoplankton assemblage in the HNLC Gulf of Alaska that have received little specific attention, and the significance of fluctuations in their marker pigments may have been underestimated. The mechanisms by which Zn deficiency influences free-living cryptophytes and/or mixotrophic protists is not known, but may involve variations in cellular pigment quotas resulting from synthesis and degradation, and from complex patterns of grazing, digestion, and plastid retention that may permit more efficient retention and recycling of trace metals in these HNLC areas. The potential link between DZn and marker pigments for cryptophytes and/or mixotrophic protists has implications for the “ecumenical Fe hypothesis” and for the application of “metallomics” (e.g., Morel et al., 2003) to trace metal cycling in oceanic waters. In short, our data not only validate the iron hypothesis but also lend support to Charles Miller’s contention that “iron limitation cannot be the whole story” (Miller et al., 1991).
Data availability statement
The raw data supporting the conclusions of this article will be made available by the authors, without undue reservation.
Author contributions
DWC conducted the onboard experiments, processed samples and data, prepared figures, reviewed literature and wrote the text. MCL, TDP, MSL, and FAW also took part in onboard experiments and water column sampling, and subsequently processed samples and data. DAP, PJS, and JNP all processed samples and data on shore. All authors contributed to figures, text and interpretation, and approved the final submitted version.
Funding
This study was funded by NERC grant number GR3/11971. Funding for open access was provided by the University of Southampton Hartley Library.
Acknowledgments
We dedicate this work to the late Chi Shing Wong who provided the analytical and logistical framework for this and many other studies in the subarctic Pacific. This work was funded by grant NERC grant GR3/11971 to DAP, PJS, and DWC. We thank the captain and crew of the R/V John P. Tully. At the Institute of Ocean Sciences Sidney, BC, we also thank Val Forsland for 13C-CT analyses, Marty Davelaar for CT and AT analyses, and Wendy Richardson for analyses of dissolved nutrients. Lisa Miller provided valuable advice on dissolved CO2 system sampling and methodology.
Conflict of interest
The authors declare that the research was conducted in the absence of any commercial or financial relationships that could be construed as a potential conflict of interest.
Publisher’s note
All claims expressed in this article are solely those of the authors and do not necessarily represent those of their affiliated organizations, or those of the publisher, the editors and the reviewers. Any product that may be evaluated in this article, or claim that may be made by its manufacturer, is not guaranteed or endorsed by the publisher.
References
Banse K. (1990). Does iron really limit phytoplankton production in the offshore subarctic Pacific? Limnology Oceanography 35 (3), 772–775. doi: 10.4319/lo.1990.35.3.0772
Barlow R. G., Mantoura R. F. C., Gough M. A., Fileman T. A. (1993a). Pigment signatures of the phytoplankton composition in the northeastern Atlantic during the 1990 spring bloom. Deep-Sea Res. II 40, 459–477. doi: 10.1016/0967-0645(93)90027-K
Barlow R. G., Mantoura R. F. C., Gough M. A., Fileman T. A. (1993b). Phaeopigment distribution during the 1990 spring bloom in the northeastern Atlantic. Deep-Sea Res. II 40, 2229–2242. doi: 10.1016/0967-0637(93)90101-8
Barwell-Clarke J., Whitney F. (1996). “Institute of Ocean Sciences nutrient methods and analysis,” in Canadian Technical Report of Hydrography and Ocean Sciences no. 182 (Sidney, BC, Canada: Fisheries & Oceans Canada).
Bif M. B., Siqueira L., Hansell D. A. (2019). Warm events induce loss of resilience in organic carbon production in the northeast Pacific Ocean. Global Biogeochemical Cycles 33, 1174–1186. doi: 10.1029/2019GB006327
Booth B. C., Lewin J., Postel J. R. (1993). Temporal variation in the structure of autotrophic and heterotrophic communities in the subarctic Pacific. Prog. Oceanography 32, 57–99. doi: 10.1016/0079-6611(93)90009-3
Boyd P. W., Law C. S., Wong C. S., Nojiri Y., Tsuda A., Levasseur M., et al. (2004). The decline and fate of an iron-induced subarctic phytoplankton bloom. Nature 428, 549–553. doi: 10.1038/nature02437
Boyd P. W., Muggli D. L., Varela D. E., Goldblatt R. H., Chretien R., Orians K. J., et al. (1996). In vitro iron enrichment experiments in the NE subarctic Pacific. Mar. Ecol. Prog. Ser. 136, 179–193. doi: 10.3354/meps136179
Brand L. E., Sunda W. G., Guillard R. R. L. (1983). Limitation of marine phytoplankton reproductive rates by zinc, manganese, and iron. Limnology Oceanography 28 (6), 1182–1198. doi: 10.4319/lo.1983.28.6.1182
Chappell P. D., Armbrust E. V., Barbeau K. A., Bundy R. M., Moffett J. W., Vedamati J., et al. (2019). Patterns of diatom diversity correlate with dissolved trace metal concentrations and longitudinal position in the northeast Pacific coastal–offshore transition zone. Mar. Ecol. Prog. Ser. 609, 69–86. doi: 10.3354/meps12810
Coale K. H. (1991). Effects of iron, manganese, copper, and zinc enrichments on productivity and biomass in the subarctic Pacific. Limnology Oceanography 36 (8), 1851–1864. doi: 10.4319/lo.1991.36.8.1851
Crawford D. W., Cefarelli A. O., Wrohan I. A., Wyatt S. N., Varela D. E. (2018). Spatial patterns in abundance, taxonomic composition and carbon biomass of nano- and microphytoplankton in subarctic and arctic seas. Prog. Oceanography 162, 132–159. doi: 10.1016/j.pocean.2018.01.006
Crawford D. W., Lipsen M. S., Purdie D. A., Lohan M. C., Statham P. J., Whitney F. A., et al. (2003). Influence of zinc and iron enrichments on phytoplankton growth in the northeastern subarctic Pacific. Limnology Oceanography 48 (4), 1583–1600. doi: 10.4319/lo.2003.48.4.1583
Crawford D. W., Stoecker D. K. (1996). Carbon content, dark respiration and mortality of the mixotrophic planktonic ciliate Strombidium capitatum. Mar. Biol. 126, 415–422. doi: 10.1007/BF00354623
Cullen J. J. (1995). Status of the iron hypothesis after the open-ocean enrichment experiment. Limnology Oceanography 40 (7), 1336–1343. doi: 10.4319/lo.1995.40.7.1336
Daniels C. J., Poulton A. J., Balch W. M., Marañón E., Adey T., Bowler B. C., et al. (2018). A global compilation of coccolithophore calcification rates. Earth System Sci. Data 10, 1859–1876. doi: 10.5194/essd-10-1859-2018
De La Rocha C. L., Hutchins D. A., Brzezinski M. A., Zhang Y. (2000). Effects of iron and zinc deficiency on elemental composition and silica production by diatoms. Mar. Ecol. Prog. Ser. 195, 71–79. doi: 10.3354/meps195071
Dickson A. G., Afghan J. D., Anderson G. C. (2003). Reference materials for oceanic CO2 analysis: a method for the certification of total alkalinity. Mar. Chem. 80 (2–3), 185–197. doi: 10.1016/S0304-4203(02)00133-0
Dickson A. G., Riley J. P. (1978). The effect of analytical error on the evaluation of the components of the aquatic carbon-dioxide system. Mar. Chem. 6, 77–85. doi: 10.1016/0304-4203(78)90008-7
DOE (1994). “Handbook of methods for the analysis of the various parameters of the carbon dioxide system in seawater,” in Version 2, Carbon Dioxide Information Center, Report ORNL/CDIAC–74. Eds. Dickson A. G., Goyet C. (Oak Ridge, TN, USA: Oak Ridge National Laboratory).
Fassbender A. J., Sabine C. L., Cronin M. F. (2016). Net community production and calcification from 7 years of NOAA Station Papa mooring measurements. Global Biogeochem. Cycles 30, 250–267. doi: 10.1002/2015GB005205
Fragoso G. M., Poulton A. J., Pratt N. J., Johnsen G., Purdie D. A. (2019). Trait-based analysis of subpolar North Atlantic phytoplankton and plastidic ciliate communities using automated flow cytometer. Limnology Oceanography 64, 1763–1778. doi: 10.1002/lno.11189
Frost B. W. (1991). The role of grazing in nutrient-rich areas of the open sea. Limnology Oceanography 36 (8), 1616–1630. doi: 10.4319/lo.1991.36.8.1616
Fujiki T., Matsumoto K., Honda M. C., Kawakami H., Watanabe S. (2009). Phytoplankton composition in the subarctic North Pacific during autumn 2005. J. Plankton Res. 31 (2), 179–191. doi: 10.1093/plankt/fbn108.
Funk C., Alami M., Tibiletti T., Green B. R. (2011). High light stress and the one-helix LHC-like proteins of the cryptophyte Guillardia theta. Biochim. Biophys. Acta 1807, 841–846. doi: 10.1016/j.bbabio.2011.03.011
Gifford D. J. (1993). Protozoa In the diets of Neocalanus spp. in the oceanic subarctic Pacific Ocean. Prog. Oceanography 32, 223–237. doi: 10.1016/0079-6611(93)90015-6
Gustafson D. E., Stoecker D. K., Johnson M. D., Van Heukelem W. F., Sneider K. (2000). Cryptophyte algae are robbed of their organelles by the marine ciliate Mesodinium rubrum. Nature 405, 1049–1052. doi: 10.1038/35016570
Guzmán L., Varela R., Muller-Karger F., Lorenzoni L. (2016). Bio-optical characteristics of a red tide induced by Mesodinium rubrum in the Cariaco Basin, Venezuela. J. Mar. Syst. 160, 17–25. doi: 10.1016/j.jmarsys.2016.03.015
Hamme R. C., Webley P. W., Crawford W. R., Whitney F. A., DeGrandpre M. D., Emerson S. R., et al. (2010). Volcanic ash fuels anomalous plankton bloom in subarctic northeast Pacific. Geophysical Res. Lett. 37, L19604. doi: 10.1029/2010GL044629
Hassler C. S., Sinoir M., Clementson L. A., Butler E. C. V. (2012). Exploring the link between micronutrients and phytoplankton in the Southern Ocean during the 2007 austral summer. Front. Microbiol. 3, article 202. doi: 10.3389/fmicb.2012.00202
Henriksen P., Riemann B., Kaas H., Sørensen H. M., Sørensen H. L. (2002). Effects of nutrient-limitation and irradiance on marine phytoplankton pigments. J. Plankton Res. 24 (9), 835–858. doi: 10.1093/plankt/24.9.835
Jakuba R. W., Saito M. A., Moffett J. W., Xu Y. (2012). Dissolved zinc in the subarctic North Pacific and Bering Sea: Its distribution, speciation, and importance to primary producers. Global Biogeochemical Cycles 26, GB2015. doi: 10.1029/2010GB004004
Janssen D. J., Cullen J. T. (2015). Decoupling of zinc and silicic acid in the subarctic northeast Pacific interior. Mar. Chem. 177, 124–133. doi: 10.1016/j.marchem.2015.03.014
Jeffrey S.W., Mantoura R.F.C., Wright S.W. (Eds.) (1997). Phytoplankton pigments in oceanography: guidelines to modern methods (Paris, France: UNESCO Publishing), 661pp.
Johnson K. M., Sieburth J. (1996). Coulometric total carbon dioxide analysis for marine studies: Automation and calibration. Mar. Chem. 21, 117–133. doi: 10.1016/0304-4203(87)90033-8
Keeling R. F., Keeling C. D. (2017). “Atmospheric monthly in situ CO2 data - Mauna Loa Observatory, Hawaii (Archive 2021-09-07),” in Scripps CO2 program data (UC San Diego Library Digital Collections). doi: 10.6075/J08W3BHW
Kellogg M. M., McIlvin M. R., Vedamati J., Twining B. S., Moffett J. W., Marchetti A., et al. (2020). Efficient zinc/cobalt inter-replacement in northeast Pacific diatoms and relationship to high surface dissolved Co : Zn ratios. Limnology Oceanography 65 (11), 2557–2582. doi: 10.1002/lno.11471
Koch F., Trimborn S. (2019). Limitation by Fe, Zn, Co, and B12 results in similar physiological responses in two Antarctic phytoplankton species. Front. Mar. Sci. 6, (514). doi: 10.3389/fmars.2019.00514
Lam P. J., Bishop J. K. B., Henning C. C., Marcus M. A., Waychunas G. A., Fung I. Y. (2006). Wintertime phytoplankton bloom in the subarctic Pacific supported by continental margin iron. Global Biogeochemical Cycles 20, GB1006, 1–12. doi: 10.1029/2005GB002557
Lam P. J., Tortell P. D., Morel F. M. M. (2001). Differential effects of iron additions on organic and inorganic carbon production by phytoplankton. Limnology Oceanography 46 (5), 1199–1202. doi: 10.4319/lo.2001.46.5.1199
Lane T. W., Saito M. A., George G. N., Pickering I. J., Prince R. C., Morel F. M. M. (2005). A cadmium enzyme from a marine diatom. Nature 435, 42. doi: 10.1038/435042a
Lane E. S., Semeniuk D. M., Strzepek R. F., Cullen J. T., Maldonado M. T. (2009). Effects of iron limitation on intracellular cadmium of cultured phytoplankton: Implications for surface dissolved cadmium to phosphate ratios. Mar. Chem. 115, 155–162. doi: 10.1016/j.marchem.2009.07.008
Laviale M., Neveux J. (2011). Relationships between pigment ratios and growth irradiance in 11 marine phytoplankton species. Mar. Ecol. Prog. Ser. 425, 63–77. doi: 10.3354/meps09013
Lee J. G., Morel F. M. M. (1995). Replacement of zinc by cadmium in marine phytoplankton. Mar. Ecol. Prog. Ser. 127, 305–309. doi: 10.3354/meps127305
Lipsen M. S., Crawford D. W., Gower J., Harrison P. J. (2007). Spatial and temporal variability in coccolithophore abundance and production of PIC and POC in the NE subarctic Pacific during El Niño, (1998), La Niña, (1999) and 2000. Prog. Oceanography 75, 304–325. doi: 10.1016/j.pocean.2007.08.004
Lohan M. C., Crawford D. W., Purdie D. A., Statham P. J. (2005). Iron and zinc enrichments in the northeastern subarctic Pacific: Ligand production and zinc availability in response to phytoplankton growth. Limnology Oceanography 50 (5), 1427–1437. doi: 10.4319/lo.2005.50.5.1427
Lohan M. C., Statham P. J., Crawford D. W. (2002). Total dissolved zinc in the upper water column of the subarctic North East Pacific. Deep-Sea Res. II 49, 5793–5808. doi: 10.1016/S0967-0645(02)00215-1
Lotocka M. (2015). The effect of irradiance on the xanthophyll composition of Skeletonema marinoi (Bacillariophyceae), Teleaulax sp., Rhodomonas sp. (Cryptophyceae), and Heterocapsa triquetra (Dinophyceae). Oceanological Hydrobiological Stud. 44 (2), 172–180. doi: 10.1515/ohs-2015-0017
Mackey M. D., Mackey D. J., Higgins H. W., Wright S. W. (1996). CHEMTAX – a program for estimating class abundances from chemical markers: application to HPLC measurements of phytoplankton. Mar. Ecol. Prog. Ser. 144, 265–283. doi: 10.3354/meps144265
Mackinson B. L., Moran S. B., Lomas M. W., Stewart G. M., Kelly R. P. (2015). Estimates of micro-, nano-, and picoplankton contributions to particle export in the northeast Pacific. Biogeosciences 12, 3429–3446. doi: 10.5194/bg-12-3429-2015
Mahaffey C., Reynolds S., Davis C. E., Lohan M. C. (2014). Alkaline phosphatase activity in the subtropical ocean: Insights from nutrient, dust and trace metal addition experiments. Front. Mar. Sci. 1 (article 73). doi: 10.3389/fmars.2014.00073
Maldonado M. T., Boyd P. W., Harrison P. J., Price N. M. (1999). Co-limitation of phytoplankton growth by light and Fe during winter in the NE subarctic Pacific Ocean. Deep-Sea Res. II 46, 2475–2485. doi: 10.1016/S0967-0645(99)00072-7
Marchetti A., Sherry N. D., Kiyosawa H., Tsuda A., Harrison P. J. (2006). Phytoplankton processes during a mesoscale iron enrichment in the NE subarctic Pacific: Part I–biomass and assemblage. Deep-Sea Res. II 53, 2095–2113. doi: 10.1016/j.dsr2.2006.05.038
Mariotti A., Germon J. C., Hubert P., Kaiser P., Letolle R., Tardieux A., et al. (1981). Experimental determination of nitrogen kinetic isotope fractionation: Some principles; illustration for the denitrification and nitrification processes. Plant Soil 62, 413–430. doi: 10.1007/BF02374138
Martin J. H., Broenkow W. W., Fitzwater S. E., Gordon R. M. (1990). Yes, it does: A reply to the comment by Banse. Limnology Oceanography 35 (3), 775–777. doi: 10.4319/lo.1990.35.3.0775
Martin J. H., Gordon R. M., Fitzwater S., Broenkow W. M. (1989). VERTEX: phytoplankton/iron studies in the Gulf of Alaska. Deep-Sea Res. 36 (5), 649–680. doi: 10.1016/0198-0149(89)90144-1
McManus G. B., Fuhrman J. A. (1986). Photosynthetic pigments in the ciliate Laboea strobila from Long Island Sound, USA. J. Plankton Res. 8 (2), 317–327. doi: 10.1093/plankt/8.2.317
Mélançon J., Levasseur M., Lizotte M., Delmelle P., Cullen J., Hamme R. C., et al. (2014). Early response of the northeast subarctic Pacific plankton assemblage to volcanic ash fertilization. Limnology Oceanography 59 (1), 55–67. doi: 10.4319/lo.2014.59.1.0055.
Middag R., de Baar H. J. W., Bruland K. W. (2019). The relationships between dissolved zinc and major nutrients phosphate and silicate along the GEOTRACES GA02 transect in the West Atlantic Ocean. Global Biogeochemical Cycles 33, 63–84. doi: 10.1029/2018GB006034
Miller L. A., Christian J. R., Davelaar M., Johnson W. K., Linguanti J. (2013). Dissolved inorganic carbon (DIC), pH on total scale, total alkalinity, temperature, salinity and other variables collected from discrete sample and profile observations during the R/Vs Endeavour, John P. Tully and Parizeau line P cruises in the coastal waters of SE Alaska, Gulf of Alaska and North Pacific Ocean from 1985-02-12 to 2016-08-26 (NCEI accession 0110260) (NOAA National Centers for Environmental Information). Dataset. doi: 10.3334/cdiac/otg.clivar_line_p_2009
Miller C. B., Frost B. W., Booth B., Wheeler P. A., Landry M. R., Welschmeyer N. (1991). Ecological processes in the subarctic Pacific: Iron limitation cannot be the whole story. Oceanography 4 (2), 71–78. doi: 10.5670/oceanog.1991.05
Mook W. G., Bommerson J. C., Staverman W. H. (1974). Carbon isotope fractionation between dissolved bicarbonate and gaseous carbon dioxide. Earth Planetary Sci. Lett. 22, 169–176. doi: 10.1016/0012-821X(74)90078-8
Morel F. M. M., Hudson R. J. M., Price N. M. (1991b). Limitation of productivity by trace metals in the sea. Limnology Oceanography 36 (8), 1742–1755. doi: 10.4319/lo.1991.36.8.1742
Morel F. M. M., Lam P. J., Saito M. A. (2020). Trace metal substitution in marine phytoplankton. Annu. Rev. Earth Planetary Sci. 48, 19.1–19.27. doi: 10.1146/annurev-earth-053018-060108
Morel F. M. M., Milligan A. J., Saito M. A. (2003). “Marine Bioinorganic Chemistry: The role of trace metals in the oceanic cycles of major nutrients,” in Treatise on Geochemistry, Volume 6. Eds. Elderfield H., Holland H. D., Turekian K. K. (Amsterdam, Netherlands: Elsevier), 625. p.113-143. doi: 10.1016/B0-08-043751-6/06108-9
Morel F. M. M., Reinfelder J. R., Roberts S. B., Chamberlain C. P., Lee J. G., Yee D. (1994). Zinc and carbon co-limitation of marine phytoplankton. Nature 369, 740–742. doi: 10.1038/369740a0
Morel F. M. M., Rueter J. G., Price N. M. (1991a). Iron nutrition of phytoplankton and its possible importance in the ecology of ocean regions with high nutrient and low biomass. Oceanography 4 (2), 56–61. doi: 10.5670/oceanog.1991.03
Nakagawa S., Cuthill I. C. (2007). Effect size, confidence interval and statistical significance: A practical guide for biologists. Biol. Rev. 82, 591–605. doi: 10.1111/j.1469-185X.2007.00027.x
Obayashi Y., Tanoue E., Suzuki K., Handa N., Nojiri Y., Wong C. S. (2001). Spatial and temporal variabilities of phytoplankton community structure in the northern North Pacific as determined by phytoplankton pigments. Deep-Sea Res. I 48, 439–469. doi: 10.1016/S0967-0637(00)00036-4
Parsons T.R., Maita Y., Lalli C. M. (1984). A manual of biological and chemical methods for seawater analysis. Pergamon, Oxford, U. K.
Peña M. A., Nemcek N., Robert M. (2019). Phytoplankton responses to the 2014–2016 warming anomaly in the northeast subarctic Pacific Ocean. Limnology Oceanography 64, 515–525. doi: 10.1002/lno.11056
Peterson T. D., Crawford D. W., Harrison P. J. (2011). Evolution of the phytoplankton assemblage in a long-lived mesoscale eddy in the eastern Gulf of Alaska. Mar. Ecol. Prog. Ser. 424, 53–73. doi: 10.3354/meps08943
Pierrot D., Lewis E., Wallace D. W. R. (2006). “MS excel program developed for CO2 system calculations. ORNL/CDIAC-105a,” in Carbon Dioxide Information Analysis Center (Oak Ridge, Tennessee: Oak Ridge National Laboratory, U.S. Department of Energy). doi: 10.3334/CDIAC/otg.CO2SYS_XLS_CDIAC105a
Putland J. N., Whitney F. A., Crawford D. W. (2004). Survey of bottom-up controls of Emiliania huxleyi in the northeast subarctic Pacific. Deep-Sea Res. I 51, 1793–1802. doi: 10.1016/j.dsr.2004.08.001
Putt M. (1990). Abundance, chlorophyll content and photosynthetic rates of ciliates in the Nordic seas during summer. Deep-Sea Res. 37 (11), 1713–1731. doi: 10.1016/0198-0149(90)90073-5
Quay P. D., Tilbrook P. D., Wong C. S. (1992). Oceanic uptake of fossil fuel CO2: Carbon-13 evidence. Science 256, 74–79. doi: 10.1126/science.256.5053.74
Rial P., Garrido J. L., Jaén D., Rodríguez F. A. (2013). Pigment composition in three Dinophysis species (Dinophyceae) and the associated cultures of Mesodinium rubrum and Teleaulax amphioxeia. J. Plankton Res. 35 (2), 433–437. doi: 10.1093/plankt/fbs099
Roy S., Thibault D. (2000). “IOS pigment data in NE Pacific,” in JGOFS Canada Data Sets 1989-1998, CD-ROM version 1.0 dec. 2000 (Canada: Marine Environmental Data Service, Department of Fisheries and Oceans).
Saito M. A., Goepfert T. J., Ritt J. T. (2008). Some thoughts on the concept of colimitation: Three definitions and the importance of bioavailability. Limnology Oceanography 53 (1), 276–290. doi: 10.4319/lo.2008.53.1.0276
Schlüter L., Møhlenberg F., Havskum H., Larsen S. (2000). The use of phytoplankton pigments for identifying and quantifying phytoplankton groups in coastal areas: testing the influence of light and nutrients on pigment/chlorophyll a ratios. Mar. Ecol. Prog. Ser. 192, 49–63. doi: 10.3354/meps192049
Shaked Y., Xu Y., Leblanc K., Morel F. M. M. (2006). Zinc availability and alkaline phosphatase activity in Emiliania huxleyi: implications for Zn–P co-limitation in the ocean. Limnology Oceanography 51 (1), 299–309. doi: 10.4319/lo.2006.51.1.0299
Sinoir M., Butler E. C. V., Bowie A. R., Mongin M., Nesterenko P. N., Hassler C. S. (2012). Zinc marine biogeochemistry in seawater: A review. Mar. Freshw. Res. 63, 644–657. doi: 10.1071/MF11286
Statham P. J. (1985). The determination of dissolved manganese and cadmium in seawater at low nmol-1 concentrations by chelation and extraction followed by electrothermal atomic absorption spectrometry. Analytica Chimica Acta 169, 149–159. doi: 10.1016/S0003-2670(00)86217-0
Stoecker D. K., Michaels A. E. (1991). Respiration, photosynthesis and carbon metabolism in planktonic ciliates. Mar. Biol. 108, 441–447. doi: 10.1007/BF01313654
Stoecker D. K., Silver M. W. (1990). Replacement and aging of chloroplasts in Strombidium (Ciliophora: Oligotrichida). Mar. Biol. 107, 491–502. doi: 10.1007/BF01313434
Stoecker D. K., Silver M. W., Michaels A. E., Davis. L. H. (1988). Obligate mixotrophy in Laboea strobilia, a ciliate which retains chloroplasts. Mar. Biol. 99, 415–423. doi: 10.1007/BF02112135
Stoecker D. K., Silver M. W., Michaels A. E., Davis L. H. (1988/1989). Enslavement of algal chloroplasts by four Strombidium spp. (Ciliophora, Oligotrichida). Mar. Microbial Food Webs 3, 79–100.
Stoecker D. K., Weigel A. C., Stockwell D. A., Lomas M. W. (2014). Microzooplankton: Abundance, biomass and contribution to chlorophyll in the eastern Bering Sea in summer. Deep-Sea Res. II 109, 134–144. doi: 10.1016/j.dsr2.2013.09.007
Strathmann R. R. (1967). Estimating the organic carbon content of phytoplankton from cell volume or plasma volume. Limnology Oceanography 12 (3), 411–418. doi: 10.4319/lo.1967.12.3.0411
Strom S. L., Postel J. R., Booth B. C. (1993). Abundance, variability, and potential grazing impact of planktonic ciliates in the open subarctic Pacific Ocean. Prog. Oceanography 32, 185–203. doi: 10.1016/0079-6611(93)90013-4
Strom S. L., Welschmeyer N. A. (1991). Pigment-specific rates of phytoplankton growth and microzooplankton grazing in the open subarctic Pacific Ocean. Limnology Oceanography 36 (1), 50–63. doi: 10.4319/lo.1991.36.1.0050
Sunda W. G., Huntsman S. A. (1992). Feedback interactions between zinc and phytoplankton in seawater. Limnology Oceanography 37 (l), 25–40. doi: 10.4319/lo.1992.37.1.0025
Suzuki K., Minami C., Liu H., Saino T. (2002). Temporal and spatial patterns of chemotaxonomic algal pigments in the subarctic Pacific and the Bering Sea during the early summer of 1999. Deep-Sea Res. II 49, 5685–5704. doi: 10.1016/S0967-0645(02)00218-7
Takeda S. (1998). Influence of iron availability on nutrient consumption ratio of diatoms in oceanic waters. Nature 393, 774–777. doi: 10.1038/31674
Vance D., de Souza G. F., Zhao Y., Cullen J. T., Lohan M. C. (2019). The relationship between zinc, its isotopes, and the major nutrients in the North-East Pacific. Earth Planetary Sci. Lett. 525, 115748. doi: 10.1016/j.epsl.2019.115748
Vance D., Little S. H., de Souza G. F., Khatiwala S., Lohan M. C., Middag R. (2017). Silicon and zinc biogeochemical cycles coupled through the Southern Ocean. Nat. Geosci. 10, 202–206. doi: 10.1038/ngeo2890
Varela D. E., Willers V., Crawford D. W. (2011). Effect of zinc availability on growth, morphology, and nutrient incorporation in a coastal and an oceanic diatom. J. Phycology 47 (2), 302–312. doi: 10.1111/j.1529-8817.2010.00948.x
Wang X., Browning T. J., Achterberg E. P., Gledhill M. (2022). Phosphorus limitation enhances diazotroph zinc quotas. Front. Microbiol. 13, (853519). doi: 10.3389/fmicb.2022.853519
Weber T., John S., Tagliabue A., DeVries T. (2018). Biological uptake and reversible scavenging of zinc in the global ocean. Science 361, 72–76. doi: 10.1126/science.aap8532
Westberry T. K., Behrenfeld M. J., Schultz P., Dunne J. P., Hiscock M. R., Maritorena S., et al. (2016). Annual cycles of phytoplankton biomass in the subarctic Atlantic and Pacific Ocean. Global Biogeochemical Cycles 30, 175–190. doi: 10.1002/2015GB005276
Wetzel R. G., Likens G. E. (1991). “Primary productivity of phytoplankton,” in Limnological Analyses. Ed. Wetzel R. G., Likens G. E. (New York, NY: Springer), 207–226.
Whitney F. A., Freeland H. J. (1999). Variability in upper-ocean water properties in the NE Pacific Ocean. Deep-Sea Res. II 46, 2351–2370. doi: 10.1016/S0967-0645(99)00067-3
Wong C. S., Crawford D. W. (2002). Flux of particulate inorganic carbon to the deep subarctic Pacific correlates with El Niño. Deep-Sea Res. II 49, 5705–5715. doi: 10.1016/S0967-0645(02)00210-2
Wong C. S., Crawford D. W. (2006). Evolution of phytoplankton pigments in an in-situ iron enrichment experiment in the subarctic NE Pacific. Deep-Sea Res. II 53, 2152–2167. doi: 10.1016/j.dsr2.2006.05.043
Wong C. S., Matear R. J. (1999). Sporadic silicate limitation of phytoplankton productivity in the subarctic NE Pacific. Deep Sea Res. Part II: Topical Stud. Oceanography 46 (11–12), 2539–2555. doi: 10.1016/S0967-0645(99)00075-2
Wong C. S., Waser N. A. D., Whitney F. A., Johnson W. K., Page J. S. (2002). Time-series study of the biogeochemistry of the north east subarctic Pacific: Reconciliation of the Corg/N remineralization and uptake ratios with the Redfield ratios. Deep Sea Res. Part II: Topical Stud. Oceanography 49 (24–25), 5717–5738. doi: 10.1016/S0967-0645(02)00211-4
Wong C. S., Whitney F. A., Crawford D. W., Iseki K., Matear R. J., Johnson W. K., et al. (1999). Seasonal and interannual variability in particle fluxes of carbon, nitrogen and silicon from time series of sediment traps at Ocean Station P, 1982–1993: relationship to changes in subarctic primary productivity. Deep-Sea Res. II 46, 2735–2760. doi: 10.1016/S0967-0645(99)00082-X
Wright S. W., Jeffrey S. W. (2005). Pigment markers for phytoplankton production. Handb. Environ. Chem. 2, Part N, 71–104. doi: 10.1007/698_2_003
Keywords: Northeastern Subarctic Pacific, phytoplankton, cryptophytes, mixotrophic protists, trace metals, zinc, iron, cadmium
Citation: Crawford DW, Purdie DA, Lohan MC, Statham PJ, Peterson TD, Kennedy HA, Lipsen MS, Putland JN and Whitney FA (2022) Apparent shifts in the microplankton community in response to zinc and iron enrichments in the Northeastern Subarctic Pacific. Front. Mar. Sci. 9:933823. doi: 10.3389/fmars.2022.933823
Received: 01 May 2022; Accepted: 12 August 2022;
Published: 21 September 2022.
Edited by:
Rob Middag, Royal Netherlands Institute for Sea Research (NIOZ), NetherlandsReviewed by:
Willem Hendrik Van De Poll, University of Groningen, NetherlandsJ. Scott P. McCain, Massachusetts Institute of Technology, United States
Copyright © 2022 Crawford, Purdie, Lohan, Statham, Peterson, Kennedy, Lipsen, Putland and Whitney. This is an open-access article distributed under the terms of the Creative Commons Attribution License (CC BY). The use, distribution or reproduction in other forums is permitted, provided the original author(s) and the copyright owner(s) are credited and that the original publication in this journal is cited, in accordance with accepted academic practice. No use, distribution or reproduction is permitted which does not comply with these terms.
*Correspondence: David W. Crawford, ZHdjckBob3RtYWlsLmNvLnVr
†Present address: David W. Crawford, Independent Researcher, Southampton, United Kingdom