 Yuan Li
 Fangrui Lou
 Shigang Liu
 Hai Li
 Jiali Xiang
 Binbin Shan
 Longshan Lin
 Xuan Zhuang
- 1Third Institute of Oceanography, Ministry of Natural Resources, Xiamen, China
- 2School of Ocean, Yantai University, Yantai, China
- 3Scientific Observation and Research Field Station of Pearl River Estuary Ecosystem, Guangzhou, China
- 4Department of Biological Sciences, University of Arkansas, Fayetteville, AR, United States
Climate change and overfishing have led to the degradation of the quality and stock of Pampus echinogaster. Exploring the genetic structure and local adaptive evolutionary mechanisms of P. echinogaster is crucial for the management of this species. This population genomic study of nine geographical populations of P. echinogaster in China was conducted by specific-locus amplified fragment sequencing (SLAF-seq). A total of 935,215 SLAF tags were obtained, and the average sequencing depth of the SLAF tags was 20.80×. After filtering, a total of 46,187 high-consistency genome-wide single nucleotide polymorphisms (SNPs) were detected. Based on all SNPs, the population size of the nine P. echinogaster geographical populations was large. The Shantou population had the lowest genetic diversity, and the Tianjin population had the highest. Moreover, the population genetic structure based on all SNPs revealed significant gene exchange and no significant genetic differentiation among the nine P. echinogaster geographical populations, probably because of the population expansion after the last glacial period, the lack of balance between migration and genetic drift, and the long-distance diffusion of eggs and larvae. We suspect that variation of material metabolism, ion transfer, breeding, stress response, and inflammatory reactions-related genes were critical for adaptation to spatially heterogeneous temperature selection in natural P. echinogaster populations.
Introduction
Widely distributed organisms inevitably encounter diverse habitats, and due to habitat heterogeneity-induced differences, natural selection can improve the habitat adaptation and utilization efficiency of geographically separated populations by changing their phenotypic and genomic characteristics. Ultimately, different geographical groups can undergo adaptive differentiation, even leading to new species (Schluter, 2000; Ferchaud and Hansen, 2016). The effective population size (Ne) of marine organisms is usually large, and seawater can flow with minimal physical barriers, which may result in a high level of gene exchange between marine biogeographical populations and make them less susceptible to genetic drift, generally limiting their genetic differentiation (Shanks et al., 2003; Conover et al., 2006; Cano et al., 2008). The different life history characteristics (such as spawning type, length of the pelagic larval period, and migration mode) of marine biogeographical populations and long-term heterogeneity in environmental factors can promote adaptive differentiation of populations in different habitats (Xue et al., 2019). At the same time, overfishing, habitat loss, and climate change have reduced some population sizes, leading to losses of genetic diversity. The resultant genetic drift and inbreeding may further reduce population sizes, thus affecting the adaptation of populations to their habitats (Frankham et al., 2002; Ouborg et al., 2010). Therefore, understanding the genetic mechanism of adaptive differentiation related to habitat heterogeneity in different populations can not only reveal the evolutionary history of species but also effectively define protection units in the context of climate change to achieve the rational management and protection of resources.
Pampus echinogaster belongs to Stromateidae, Perciformes, and is widely distributed in the northwestern Pacific Ocean, including the waters of Russia, Japan, the Korean Peninsula, the Bohai Sea, the Yellow Sea, the East China Sea, and the northern South China Sea (Dolganov et al., 2007; Oh et al., 2009; Yamada et al., 2009; Nakabo, 2013; Li et al., 2019; ). The complex paleogeographic dynamics of the northwestern Pacific Ocean may affect the formation of different geographical populations of marine organisms, including P. echinogaster, through events such as geographical isolation caused by glaciers and postglacial recolonization, while the hydrological conditions and environmental specificity of different habitats may further cause habitat-based adaptive differentiation of different geographical populations of marine organisms (Cheng and Sha, 2017).
P. echinogaster is a seasonal migratory fish species. Its inner spawning cycle of the gonad development cycle is short (approximately 15 days) during somewhat long reproductive periods (March-July) (Oh et al., 2009), and it can produce buoyant eggs with a pelagic larval period of at least one month (Yamada et al., 2007). Thus, it can spread over long distances. The complex oceanic current system in the northwestern Pacific Ocean results in a mix of recruited populations and overwintering populations of juvenile P. echinogaster, and these factors may eventually shape the genetic homogeneity between different geographical populations of this species (Li et al., 2018). In summary, the complex life history characteristics of this species have made it difficult to distinguish populations. In recent years, factors such as climate change (especially ocean warming) and overfishing have led to a decline in the supply of P. echinogaster and a trend of decreasing age; for example, the existing P. echinogaster resources in the East China Sea and Yellow Sea were 2.0×10⁵ t (Li et al., 2018) and the maximum fork length (266 mm) of P. echinogaster caught off the coastal waters of China was also much smaller than that recorded by FashBase (600 mm) (https://www.fishbase.se/summary/Pampus-argenteus.html). In this context, it is necessary to evaluate the population differentiation of P. echinogaster to achieve rational management of this resource.
Based on mitochondrial control region sequences and six microsatellite loci, we found that the seven P. echinogaster geographical populations in the waters of the Yellow Sea, the Bohai Sea, and the East China Sea may belong to one free-mating group, and there was no significant genetic differentiation between the geographical populations (Li et al., 2018). Genome-wide genotyping will help to elucidate the P. echinogaster population structure in greater detail. In addition, genome-wide genotyping is necessary to analyse the habitat adaptation mechanisms of P. echinogaster geographical populations. However, it is undeniable that environmental factors such as temperature, salinity, and pathogens vary greatly across the widely distributed range of P. echinogaster, which must have led to adaptive habitat differentiation between different geographical populations (Savolainen et al., 2013; Sandoval-Castillo et al., 2018).In this context, genome sequencing by high-throughput sequencing technologies can increase the number of genetic markers, including both neutral and adaptive markers, to achieve the fine assessment of population-genetic parameters in P. echinogasters in different geographical locations and to clarify the genetic mechanisms of habitat adaptation. For specific-locus amplified fragment sequencing (SLAF-seq), the length of an effective read is 2 × 100 bp, and more than 100,000 tags can be developed at one time, so genome-wide scans of genetic markers can be completed for almost any species, contributing to a better understanding of the genetic structure of the species and its population-genomic characteristics under habitat selection (Sun et al., 2013).In this study, SLAF-seq was used for the first time to scan the genome-wide genetic markers of nine P. echinogaster geographical populations off the coast of China. We used a population-genomic method to quantify the genetic variation in P. echinogaster geographical populations and revealed the genetic differentiation among them. Then we predicted the sizes of different geographical P. echinogaster populations under climate change and human activity. Finally, we determined the regulatory mechanism related to the habitat adaptation of geographical P. echinogaster populations. In short, the results of this study could improve our understanding of the population structure and habitat-based adaptive differentiation of P. echinogaster and provide basic information for the accurate determination of its protection units. These contributions will be of great significance for maintaining the sustainability of P. echinogaster resources against the background of climate change and human activity.
Materials and Methods
Sample Collection and SLAF-Seq
A total of 135 P. echinogaster samples (Figure 1) were collected at nine different locations along the coast of China (15 individuals at each location) from October 2017 to December 2017. External morphological identification of the samples was performed mainly by referring to Nakabo (2013) and Li et al. (2019). For each fresh P. echinogaster sample, sterile scissors and tweezers were used to obtain back muscle tissues. All muscle tissues were stored in a cryogenic freezer at -80°C for future experiments. The phenol–chloroform method was used to extract genomic DNA from each sample (Li et al., 2019; Xue et al., 2019). Then, 1% agarose gel electrophoresis and an Invitrogen Qubit fluorometer were used to assess the degradation degree and concentration of the genomic DNA. Qualified genomic DNA (500 ng) was submitted to Biomarker Technologies Corporation (Beijing, China) for library construction and sequencing.
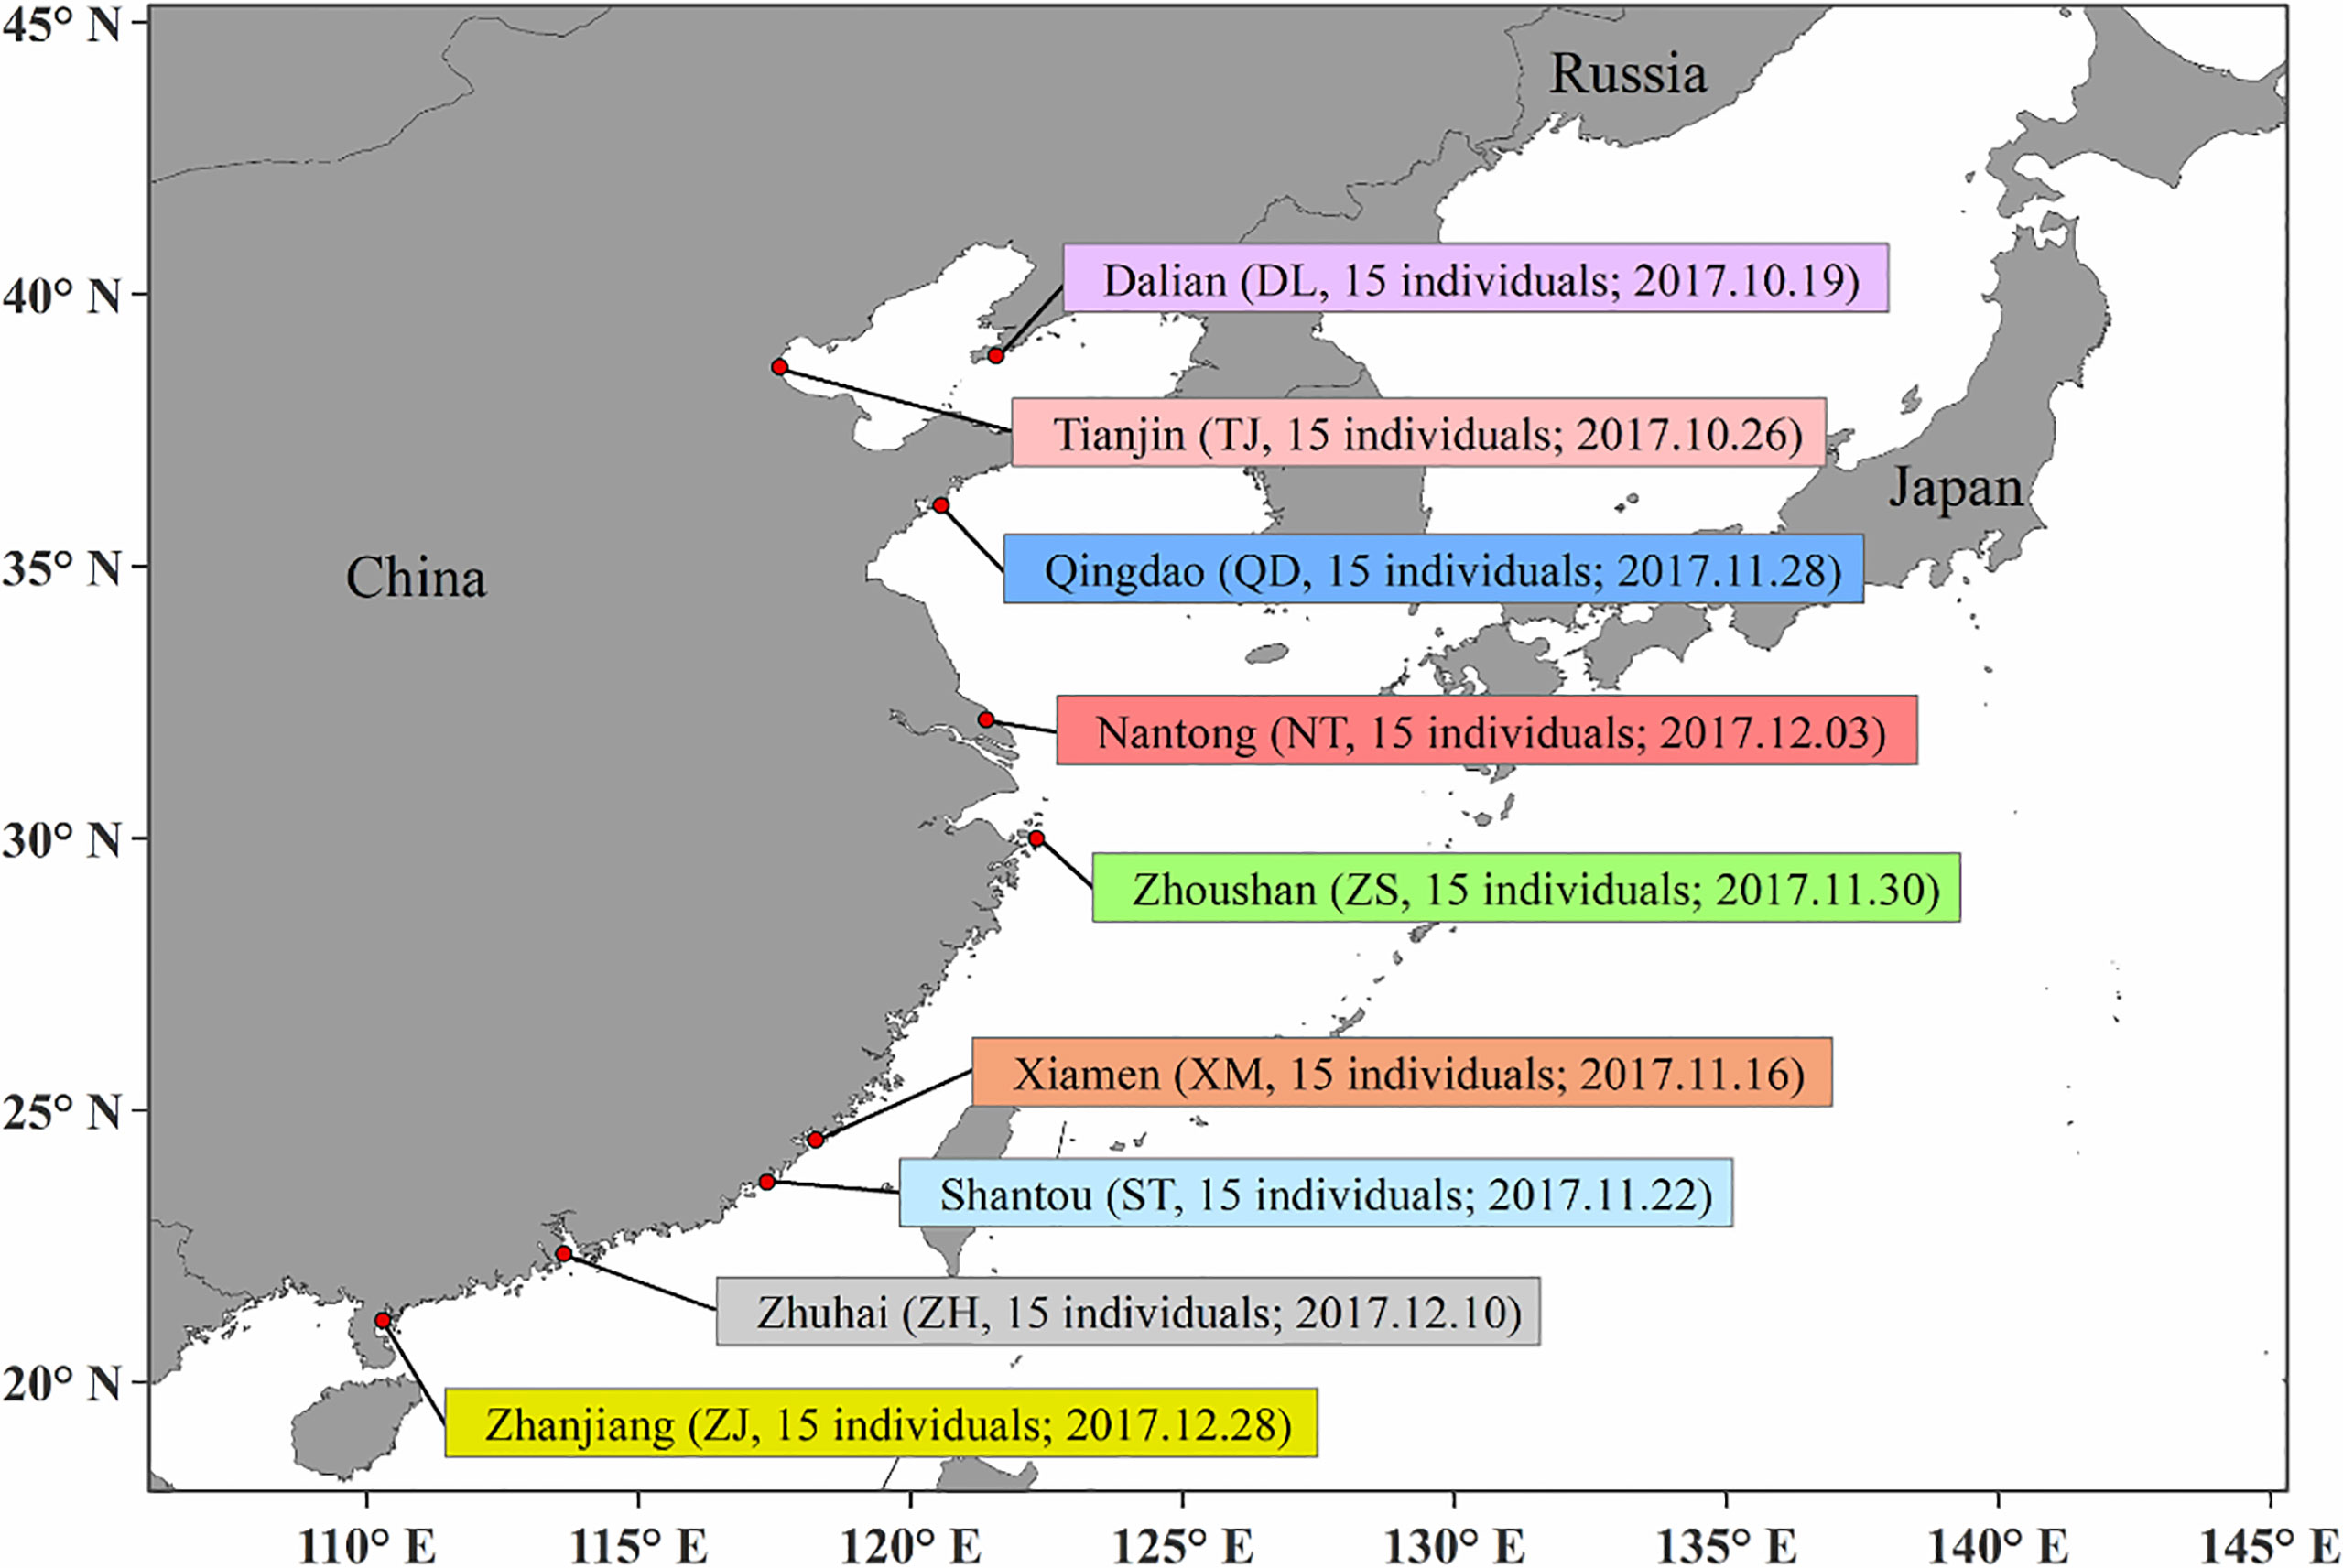
Figure 1 Sample information, including sampling sites, sampling number and Sampling date.
According to the genome size and guanine+cytosine (G+C) content of P. argenteus, enzymatic digestion prediction was performed. The analysis software for SLAF enzymatic digestion prediction independently developed by Biomarker Technologies Corporation (Sun et al., 2013) was used to predict the digestion of the reference genome, and the optimal digestion scheme was selected according to the following principles: (1) the percentage of enzymatic fragments located in the repeat sequences was as low as possible; (2) the enzymatic fragments were distributed as evenly as possible across the genome; (3) the length of each enzymatic fragment was consistent with that of the specific experimental system; and (4) the number of obtained enzymatic fragments (SLAF tags) agreed with the expected number of tags. With the HaeIII restriction enzyme, the genomic DNA of each qualified sample was digested separately. Each obtained digestion fragment (SLAF tag) had a poly (A) tag added to the 3’ end, and dual-index sequencing adaptors were attached (Kozich et al., 2013). Genomic DNA was incubated at 37°C with MseI, T4 DNA ligase, ATP, and MseI adapter. These restriction-ligation reactions for further PCRs were heat-inactivated at 65°C and then digested in an additional reaction with the restriction enzymes HaeIII and BfaI at 37°C. Furthermore, PCR was performed with diluted restriction-ligation PCR products, dNTP, Taq DNA polymerase and MseI primers containing barcode1. The further PCR products were purified using an E.Z.N.A Cycle Pure Kit. The purified PCR products were pooled and incubated at 37°C with MseI, T4 DNA ligase, ATP, and Solexa adapter. The reaction products after incubation were purified using a Quick Spin column and then electrophoresed on a 2% agarose gel. A gel extraction kit was applied to select SLAFs 314-394 bp in size. The gel-purified fragments were further amplified by PCR with Phusion Master Mix and Solexa Amplification primer mix to add barcode2. Finally, paired-end sequencing was performed on the Illumina HiSeq 2500 platform. To evaluate the accuracy of enzyme digestion, Nipponbare was selected as a control for sequencing.
SNP Detection and Screening
The raw data obtained from sequencing were characterized using the dual-index sequencing adaptor. The raw reads of each sample were obtained, and reads with a quality score lower than 30 were excluded. Based on sequence similarity, the remaining high-quality reads of each sample were clustered, and the reads with a similarity greater than 98% were considered to have clustered as a single SLAF tag. A SLAF tag with sequence differences between samples was defined as polymorphic. The sequence with the greatest sequencing depth for each SLAF tag was taken as the reference sequence. The Burrows–Wheeler alignment tool was used (Li and Durbin, 2009) to align the reads to the SLAF tags, both GATK (parameters: –stand_call_conf 30.0 and –stand_emit_conf 0) (McKenna et al., 2010) and SAMTOOLS (parameters: default) (Li et al., 2009) were used to perform single nucleotide polymorphism (SNP) calling, and the overlapping SNPs in the GATK and SAMTOOLS results were used as the final SNP dataset. The generated SNPs were saved in a variant call format (VCF) file. To ensure the accuracy of subsequent analyses, VCFtools (Danecek et al., 2011) was used to screen SNPs with the following parameters: -MAF 0.01 (minimum allele frequency> 0.01); –max-missing 0.1 (filtering out the genotypes with less than 90% data); –min-meanDP 150 (minimum mean depth of coverage > 150); –min-alleles 2 –max-alleles 2 (only two alleles); –minGQ 98 (quality score> 98); –minQ 30 (retaining the loci with a quality score> 30); –remove-indels (excluding the loci containing indels); and -HWE 0.05 (excluding the loci with P < 0.05 in the Hardy-Weinberg equilibrium test).
Genetic Diversity and Population Genetic Structure
To describe the genetic diversity levels of all genome-wide SNPs of the nine P. echinogaster locations, TASSEL software (version 5.2.31) (Bradbury et al., 2007) was used to estimate the nucleotide diversity (Pi) and Tajima’s D value of each SNP in each P. echinogaster population, the step size and window size was 10 and 20, respectively. With Circos software (Krzywinski et al., 2009), the Pi, expected heterozygosity (HE), and Tajima’s D of each SNP were visualized.
Using the “populations” module of Stacks software (version 1.34) (Catchen et al., 2013), the genetic diversity levels of the nine populations, including the polymorphic loci Pi, observed heterozygosity (HO), HE, and inbreeding coefficient (FIS), were statistically analyzed. Arlequin software (version 3.5.2.2) (Excoffier and Lischer, 2010) was used to estimate the pairwise genetic differentiation (FST) of P. echinogaster, and 10,000 permutations were used to test the significance.Based on all SNPs, four methods were used to estimate population structure and individual clustering within a population. (1) PGDSpider software (version 2.0.5.2) (Lischer and Excoffier, 2012) was used to convert the VCF file of all SNPs to STR format, and then ADMIXTURE software, based on the maximum likelihood method (version 1.3.0) (Alexander et al., 2009), was used to evaluate ancestors. This software uses a fast numerical optimization algorithm to achieve a fast analysis rate. During analysis, the range of genetic clusters (K) was set to 1-9, and each analysis was repeated 10 times. Finally, based on the cross-validation (CV) error corresponding to the optimal K value, the clustering results were plotted. (2) Using TASSEL software (version 5.2.31) (Bradbury et al., 2007), neighbour-joining (NJ) trees of different P. echinogaster geographical populations were constructed to clarify the phylogenetic relationships between all individuals in the P. echinogaster geographical populations, and the number of different residues between sequences was used to measure genetic distance. The acquired NJ trees were visualized with iTOL software (https://itol.embl.de/). (3) The adegenet package of R software (Jombart et al., 2010) was used to perform principal component analysis (PCA) of all individuals and visualize the geographical populations and interpopulation relationships. (4) NetView P software, which adopts the k-nearest neighbour (KNN) algorithm, was used to visualize the network topology among all individuals to accurately and thoroughly explore the refined population structure of P. echinogaster. Before running NetView P software, the range of KNN values was first set to 1-60, and the optimal KNN value was determined according to the Fast-Greedy, Infomap, and Walktrap algorithms. In other words, the genetic similarity of individuals was determined based on the optimal resolution of the genetic structure, and then the network topology of all individuals was obtained based on the optimal KNN value. (5) Arlequin (version 3.5.2.2) (Excoffier and Lischer, 2010) was used for analysis of molecular variance (AMOVA) to detect differentiation between groups (FCT) and differentiation between geographical populations within a group (FSC), and the number of iterations was set to 5000. In this study, the P. echinogaster geographical populations were divided into three groups based on geographic location: Dalian, Tianjin, Qingdao, and Nantong; Zhoushan and Xiamen; and Shantou, Zhuhai, and Zhanjiang. Additionally, the effective population size (Ne) of nine P. echinogaster geographical populations was estimated with NeEstimator v2 software (version 2) (Do et al., 2014).
Analysis of Gene Flow Between Geographical Populations
PGDSpider (version 2.0.5.2) (Lischer and Excoffier, 2012) was used to convert the VCF file of all SNPs to the GENEPOP format, and the gene flow between the nine geographical populations was analyzed using divMigrate-Online (https://popgen.shinyapps.io/divMigrate-online/). The parameters were as follows: the number of bootstraps was 1000, alpha was 0.05 and the migration statistic was Nm.
Prediction of the Genomic Regions and Functions of P. Echinogaster Geographical Populations Under Habitat Selection
The genotype-environment association method implemented in Bayenv (version 2.0) (Coop et al., 2010) was applied to detect putative SNPs correlated with temperature variations. First, we obtained the high-resolution mean lowest sea surface temperature (LSST), mean annual sea surface temperature (ASST) and mean highest sea surface temperature (HSST) data of nine sea areas over 68 years (from 1950 to 2017) by combining data from the Japan Meteorological Agency (JMA; http://www.jma.go.jp/jma/index.html), Advanced Very High Resolution Radiometer (AVHRR; http://oceanwatch.pifsc.noaa.gov/thredds/catalog.html) and Geostationary Operational Environmental Satellites (GOES; http://oceanwatch.pifsc.noaa.gov/thredds/catalog.html). We first converted SNP files and average environmental data files (Table 1) into matrix files needed for software operation, and the matrix was evaluated according to the software specification. The parameters were set as follows: -k 100000 -r 63479. Then, Bayenv tests were applied to identify putative SNPs correlated with temperature variations using the “calc_bfs.sh” script in Bayenv2 software, and a Bayes factor (BF) value higher than 20 (Kass and Raftery, 1995) was set as the filtering condition for putative SNPs. Thereafter, we used the overlapping ASST-related, LSST-related, and HSST-related SNPs as candidate temperature-selected SNPs. SLAF sequences containing these SNPs were then annotated using Blast2GO software (Conesa et al., 2005).
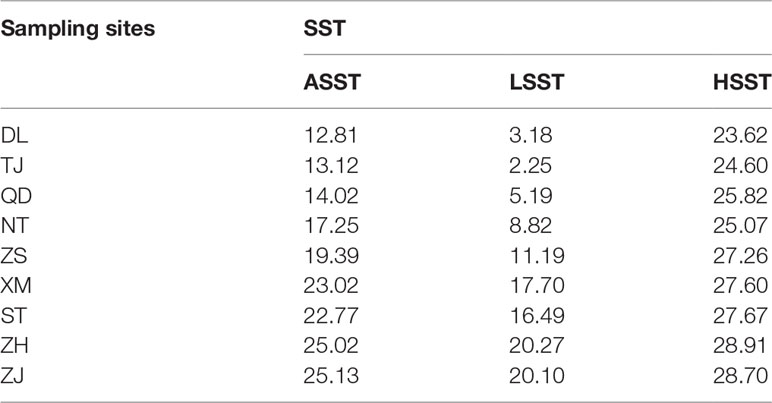
Table 1 Temperature differences at nine sampling sites.
Results
SLAF-Seq Results
After filtering, a total of 448.17 million high-quality paired-end reads were obtained from SLAF-seq of 135 P. echinogaster samples. The average Q30 of the reads was 95.59%, and the average GC content was 43.17%. In addition, for the control sequence of Nipponbare, which was used to evaluate the accuracy of the established library, 1.79 M reads were obtained. After clustering high-quality reads, we obtained a total of 935,215 SLAF tags, and the average sequencing depth of the SLAF tags was 20.80×. Among the SLAF tags, 461,932 were polymorphic. With GATK and SAMTOOLS, 6,152,196 SNPs were further obtained. After the removal of low-quality SNPs, we obtained 62,473 SNPs, and 10,707 passed the Hardy-Weinberg equilibrium test (P < 0.05). After retaining one SNP from each locus with the lowest missing rate, 5,579 SNPs were excluded. Finally, 46,187 highly consistent SNPs were identified for subsequent genetic structure analysis.
Population Genetic Diversity and Population Structure
The Pi and Tajima’s D values of the 46,187 SNPs exhibited similar fluctuating patterns among the nine P. echinogaster geographical populations (Figure 2). The Tajima’s D values of most SNPs in the nine P. echinogaster geographical populations were less than 0, indicating that many rare alleles existed at a high frequency, which may have been due to the large population size.
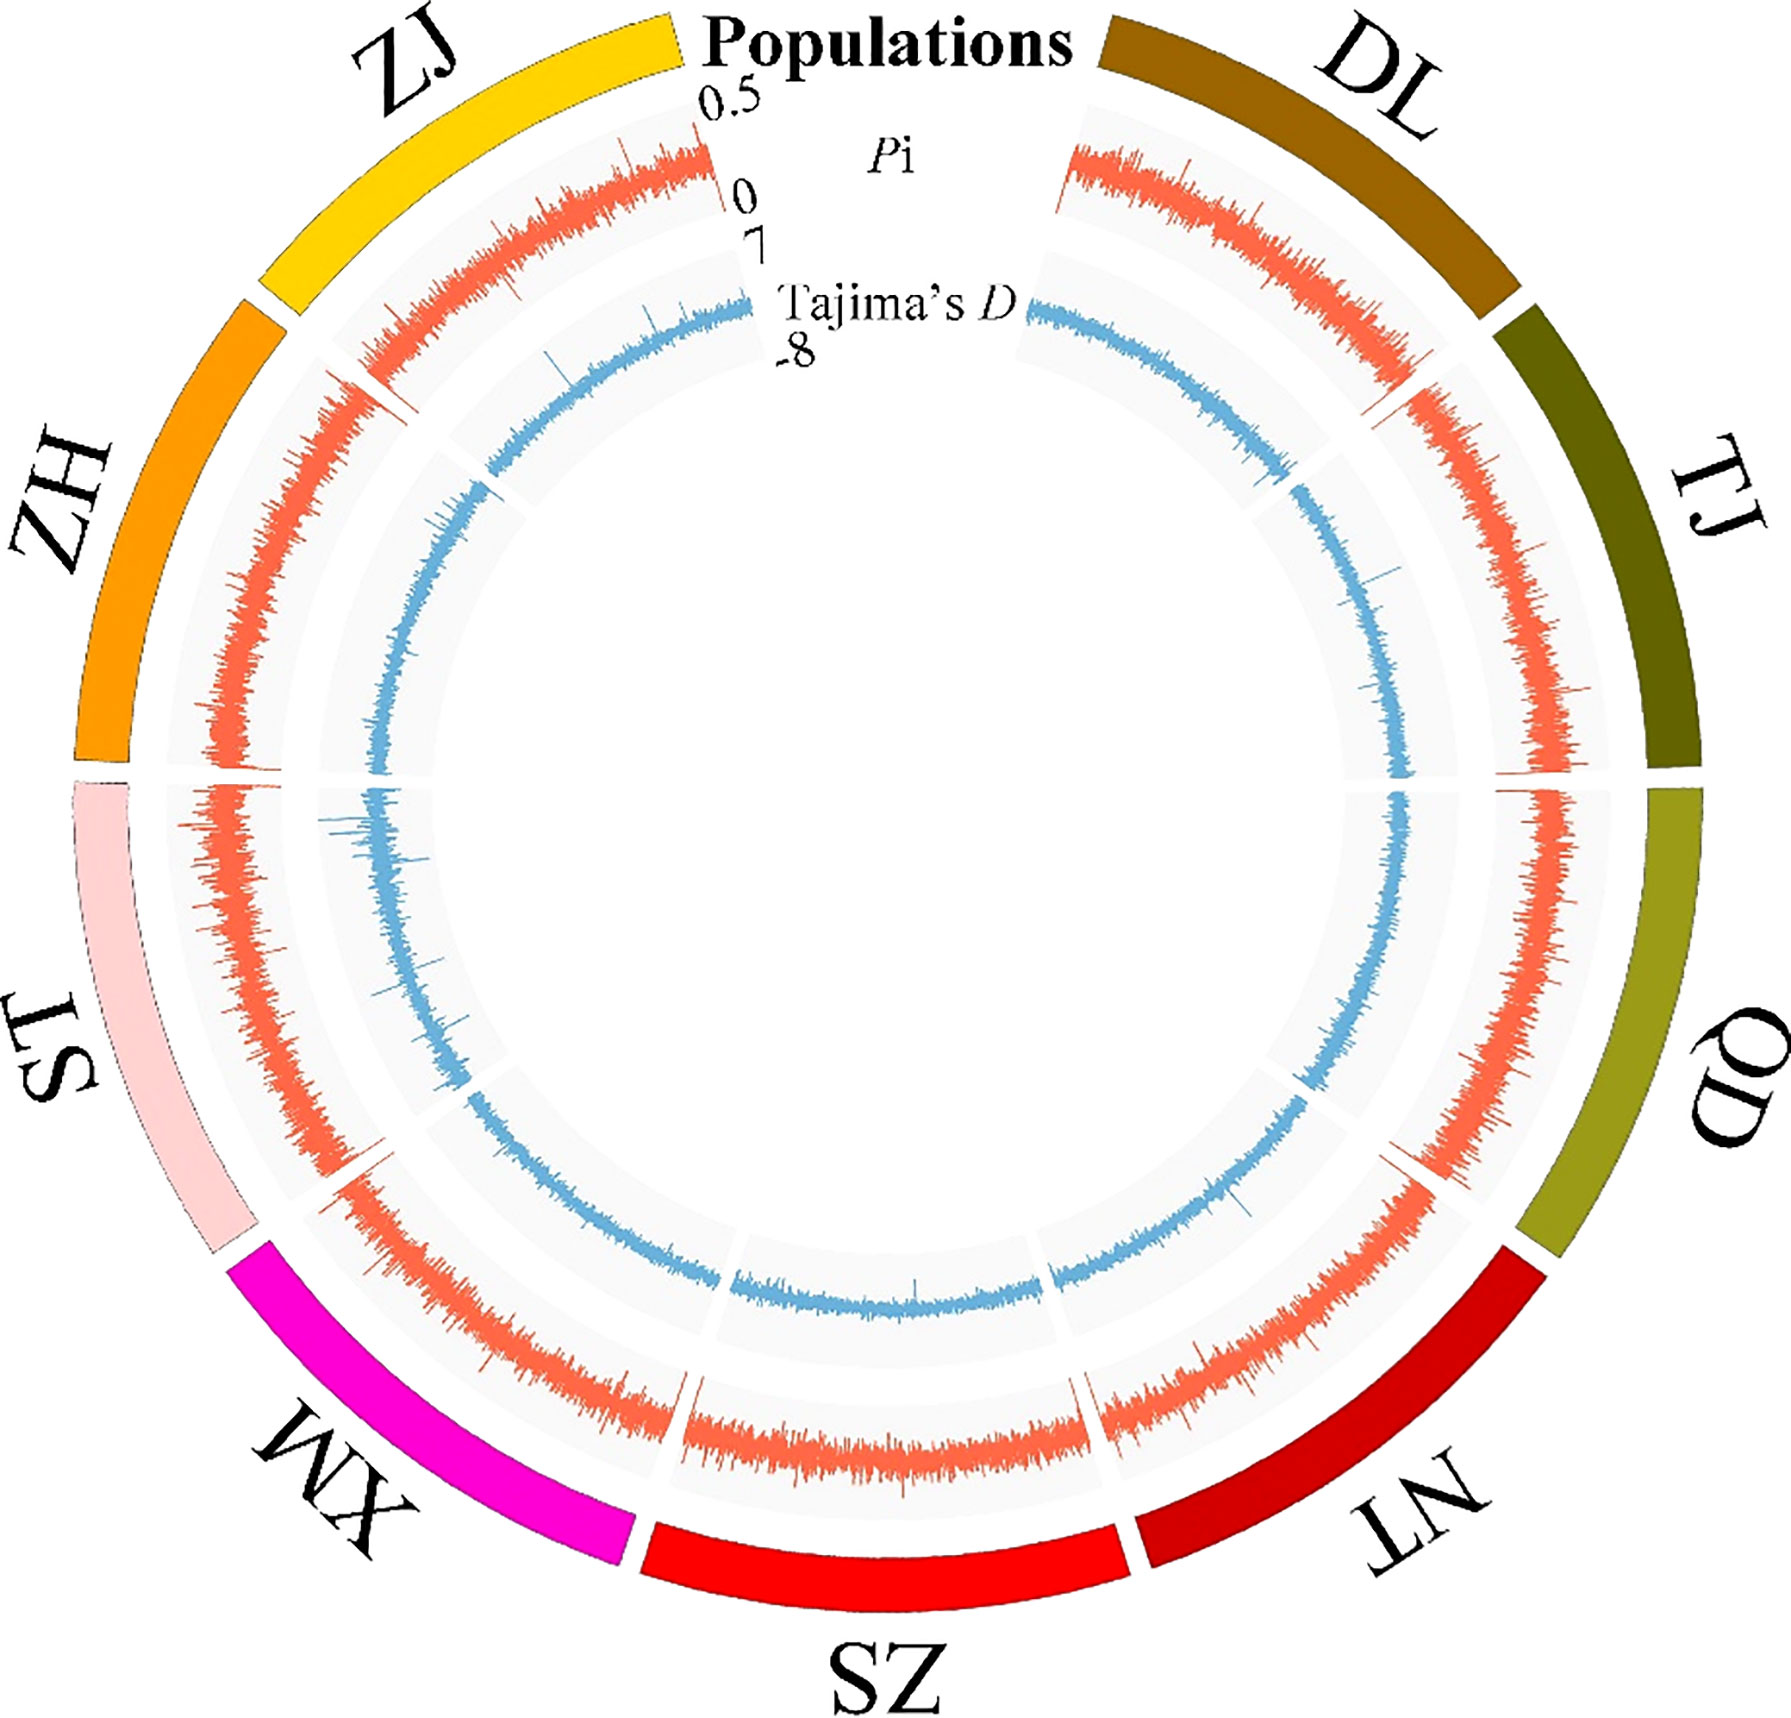
Figure 2 Statistics on the genetic diversity of a genome-wide set of SNP loci in the nine P. echinogaster geographical populations. Populations, Pi and Tajima’s D are represented from the outermost layer in the circos.
After filtering, a total of 46,103 SNPs were considered neutral SNPs, meaning those SNPs that selected balance and genotype were approximately constant. Statistical results of genetic diversity at the 46,103 SNPs showed that the average HO, average HE, and Pi varied among the nine P. echinogaster locations (HO = 0.2046-0.2364, HE = 0.2222-0.2337, and Pi = 0.2336-0.2425), and the FIS values of all nine geographical populations were small (FIS = 0.0222-0.0806) (Table 2). The Shantou population had the lowest average genetic diversity (HO, HE, and Pi) and Tianjin showed the highest genetic diversity (Table 2). The percentage of polymorphic SNPs in each of the nine P. echinogaster geographical populations was relatively high (86.5179-93.2759%).
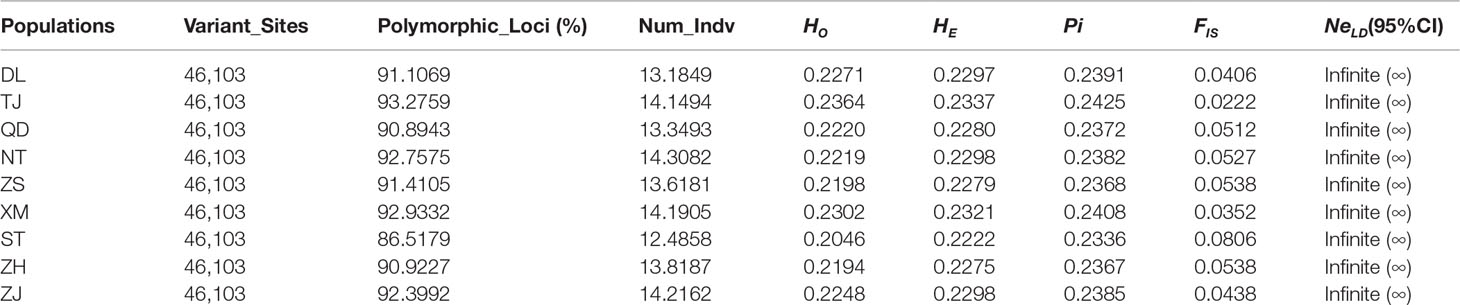
Table 2 Statistical analysis of genetic diversity in nine P. echinogaster populations.
The nine P. echinogaster geographical populations had low values of genetic differentiation, ranging from -0.00109 to 0.00267 (Table 3). ADMIXTURE analysis of 46,103 SNPs revealed an optimum K value of 1 with a minimum CV error. The clustering results from ADMIXTURE based on K=1 showed that all the individuals in the nine geographical locations were clustered into one group, and the clustering results from ADMIXTURE based on K = 2 to 9 showed a similar result (Figure 3A). The clustering pattern from ADMIXTURE was validated by analysis of NJ trees (Figure 3B) and the PCA results (Figure 3C) for all 46,103 SNPs. In addition, NetView P software revealed fine genetic structure among the nine P. echinogaster geographical populations. In this study, the optimal KNN value was determined to be 38 based on various algorithms, and the network topological results showed that all the individuals in all nine locations were clustered together (Figure 3D). The AMOVA results (Table 4) also indicated that most of the variation was within populations (FST = 0.03788; P = 0.00098), while statistically nonsignificant genetic differentiation was observed among the three groups (Va = 0.01; FCT = 0.00014, P = 0.12317; Table 4).
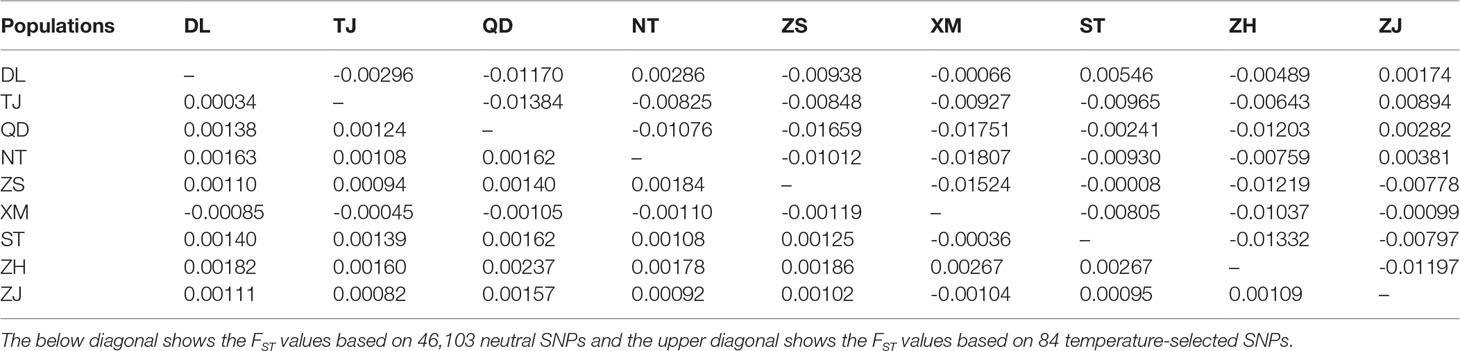
Table 3 Statistical analysis of FST values between the nine P. echinogaster populations.
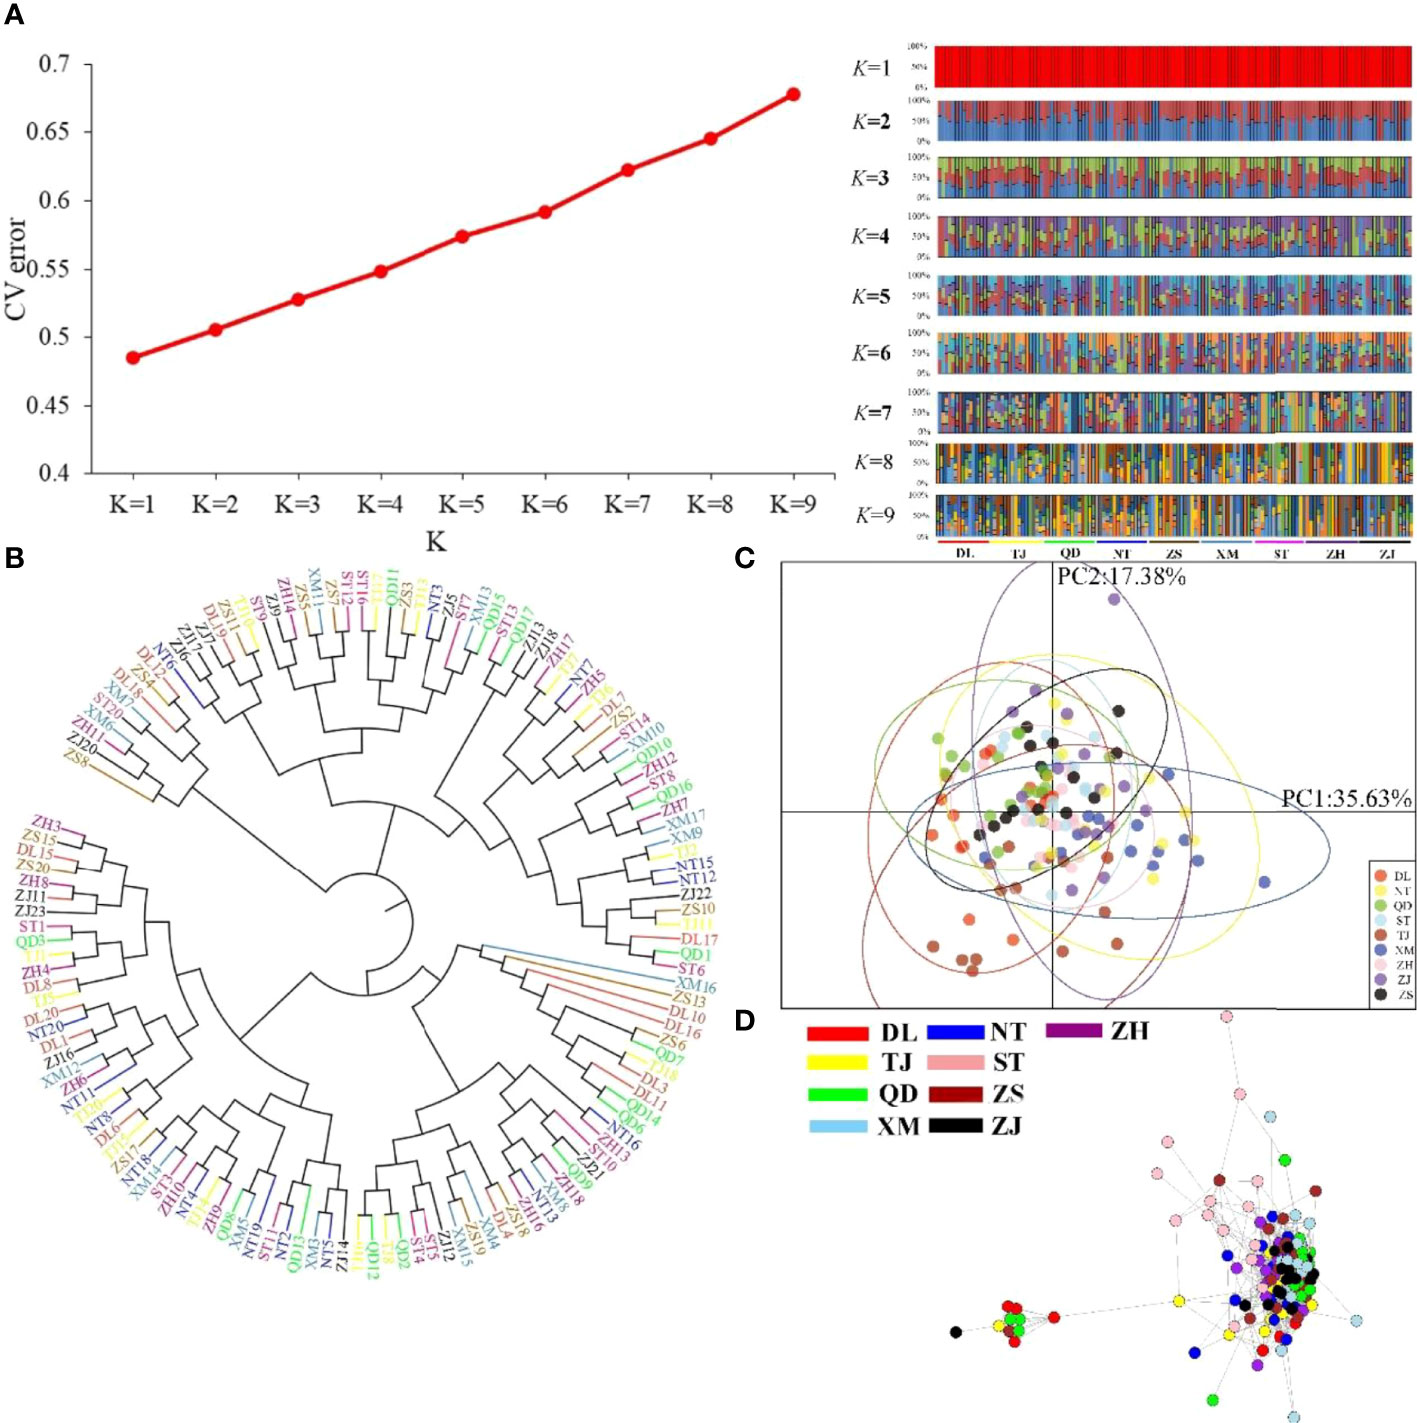
Figure 3 Clustering analysis results for the nine P. echinogaster geographical populations based on 46,103 neutral SNPs. (A) Clustering results from ADMIXTURE, including the relationship between CV error and K value, and structure relationship. (B) NJ tree. (C) PCA chart constructed using the first (35.63%) and second (17.38%) principal components. (D) Individual clustering from NetView P software based on a KNN = 38.
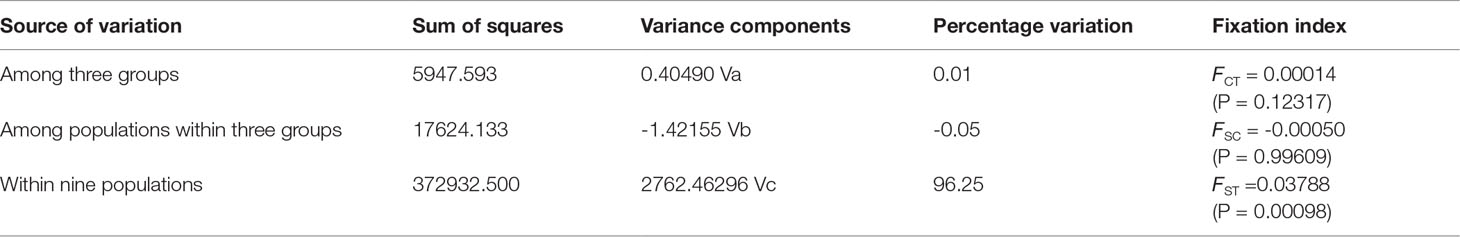
Table 4 AMOVA results for the three P. echinogaster groups.
Gene Exchange Between the Nine P. Echinogaster Geographical Populations
divMigrate-Online software was used to analyse the gene exchange between the nine P. echinogaster geographical populations, and the results showed extensive gene exchange (0.34 - 1) among them (Figure 4), providing good support for the above results on the lack of genetic differentiation.
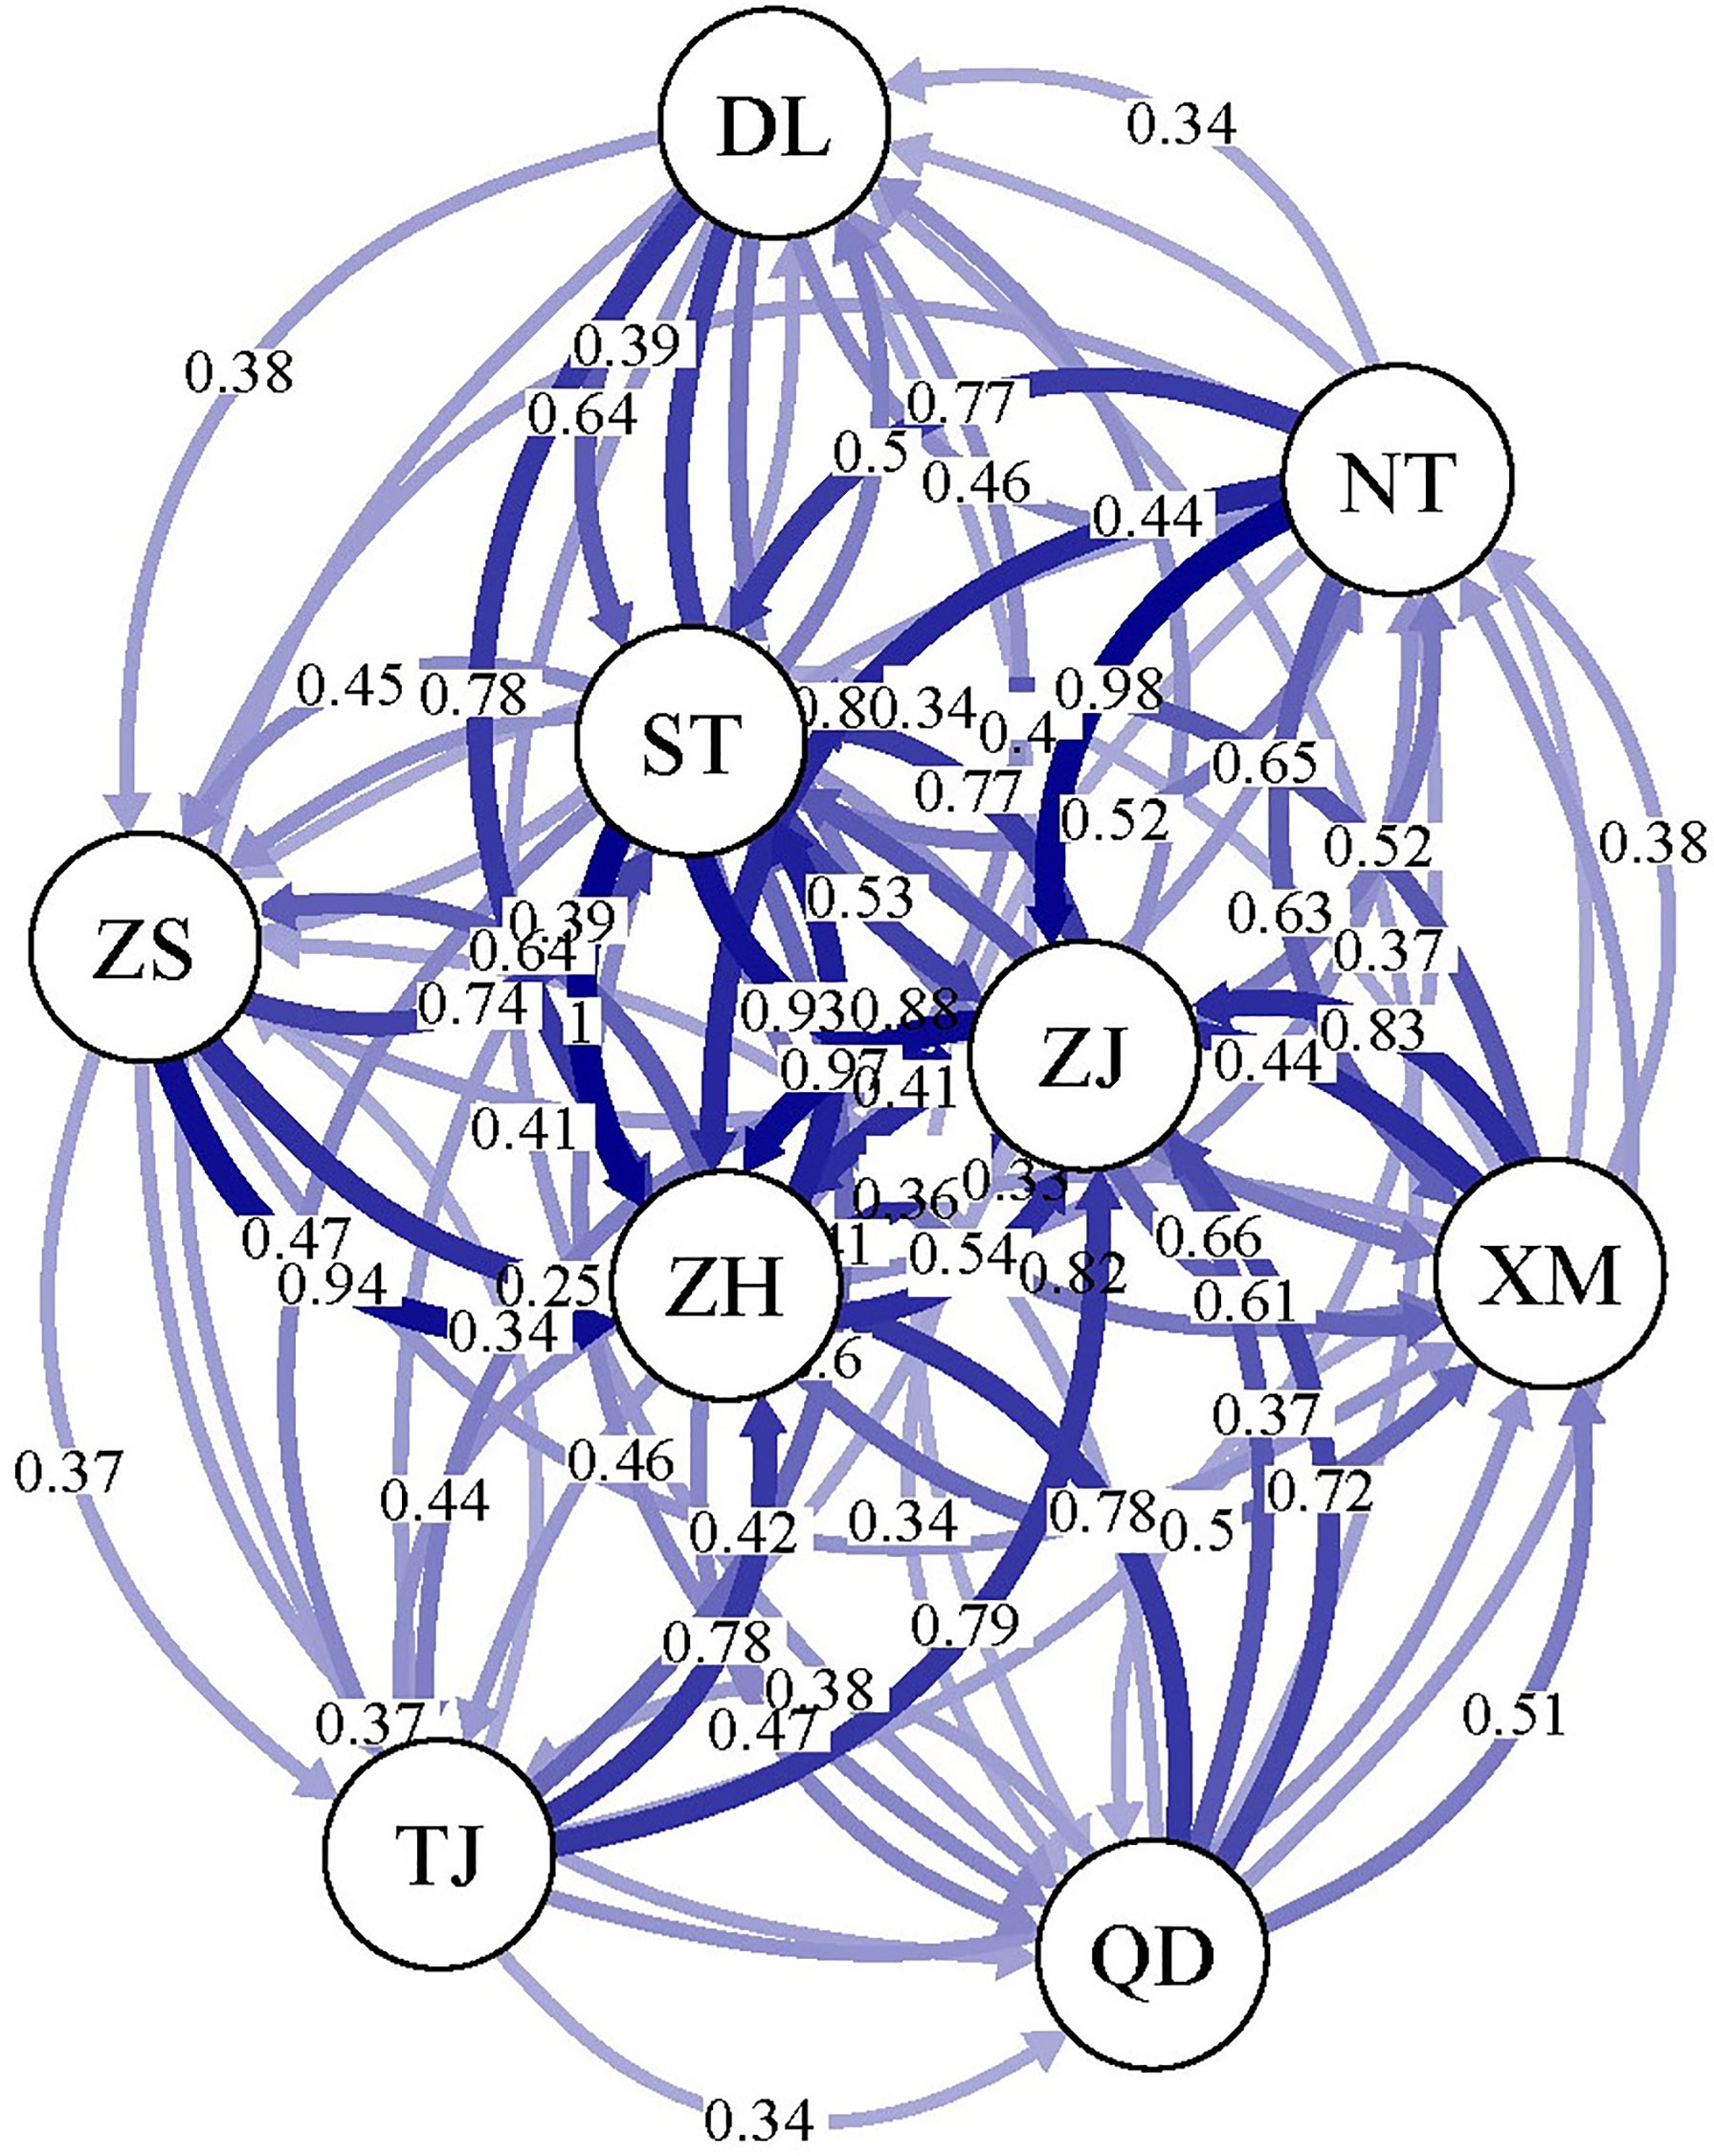
Figure 4 Gene exchange analysis of the nine P. echinogaster geographical populations based on 46,103 neutral SNPs.
Analysis of Local Temperature Adaptation
In the present study, we first calculated the average sea surface temperature (ASST), low sea surface temperature (LSST) and high sea surface temperature (HSST) of nine sea areas over 68 years (Table 1). Then, Bayenv software revealed a total of 329 SNPs associated with temperature variables. Of these SNPs, 203 were associated with ASST, 190 were associated with LSST, and 202 were associated with HSST. There was 84 overlapping SNPs were associated with ASST, LSST, and HSST and we used the 84 overlapping ASST-related, LSST-related, and HSST-related SNPs as candidate temperature-selected SNPs (Figure 5; Table 3). The genetic differentiation of nine P. echinogaster geographical populations based on temperature-selected SNPs was also low (Figure 6). Whole-genome sequences containing 84 SNPs were then used for further annotations, and the results showed that 51 gene sequences containing temperature-selected SNPs matched homologous protein sequences in the nonredundant protein sequences (Nr) database, and these genes were primarily related to material metabolism, ion transport, breeding, stress reactions, and inflammatory reactions. Next, the enrichment of sequences containing temperature-selected SNPs in Gene Ontology (GO) categories was tested, and 30 significantly enriched GO terms were identified (Figure 7).
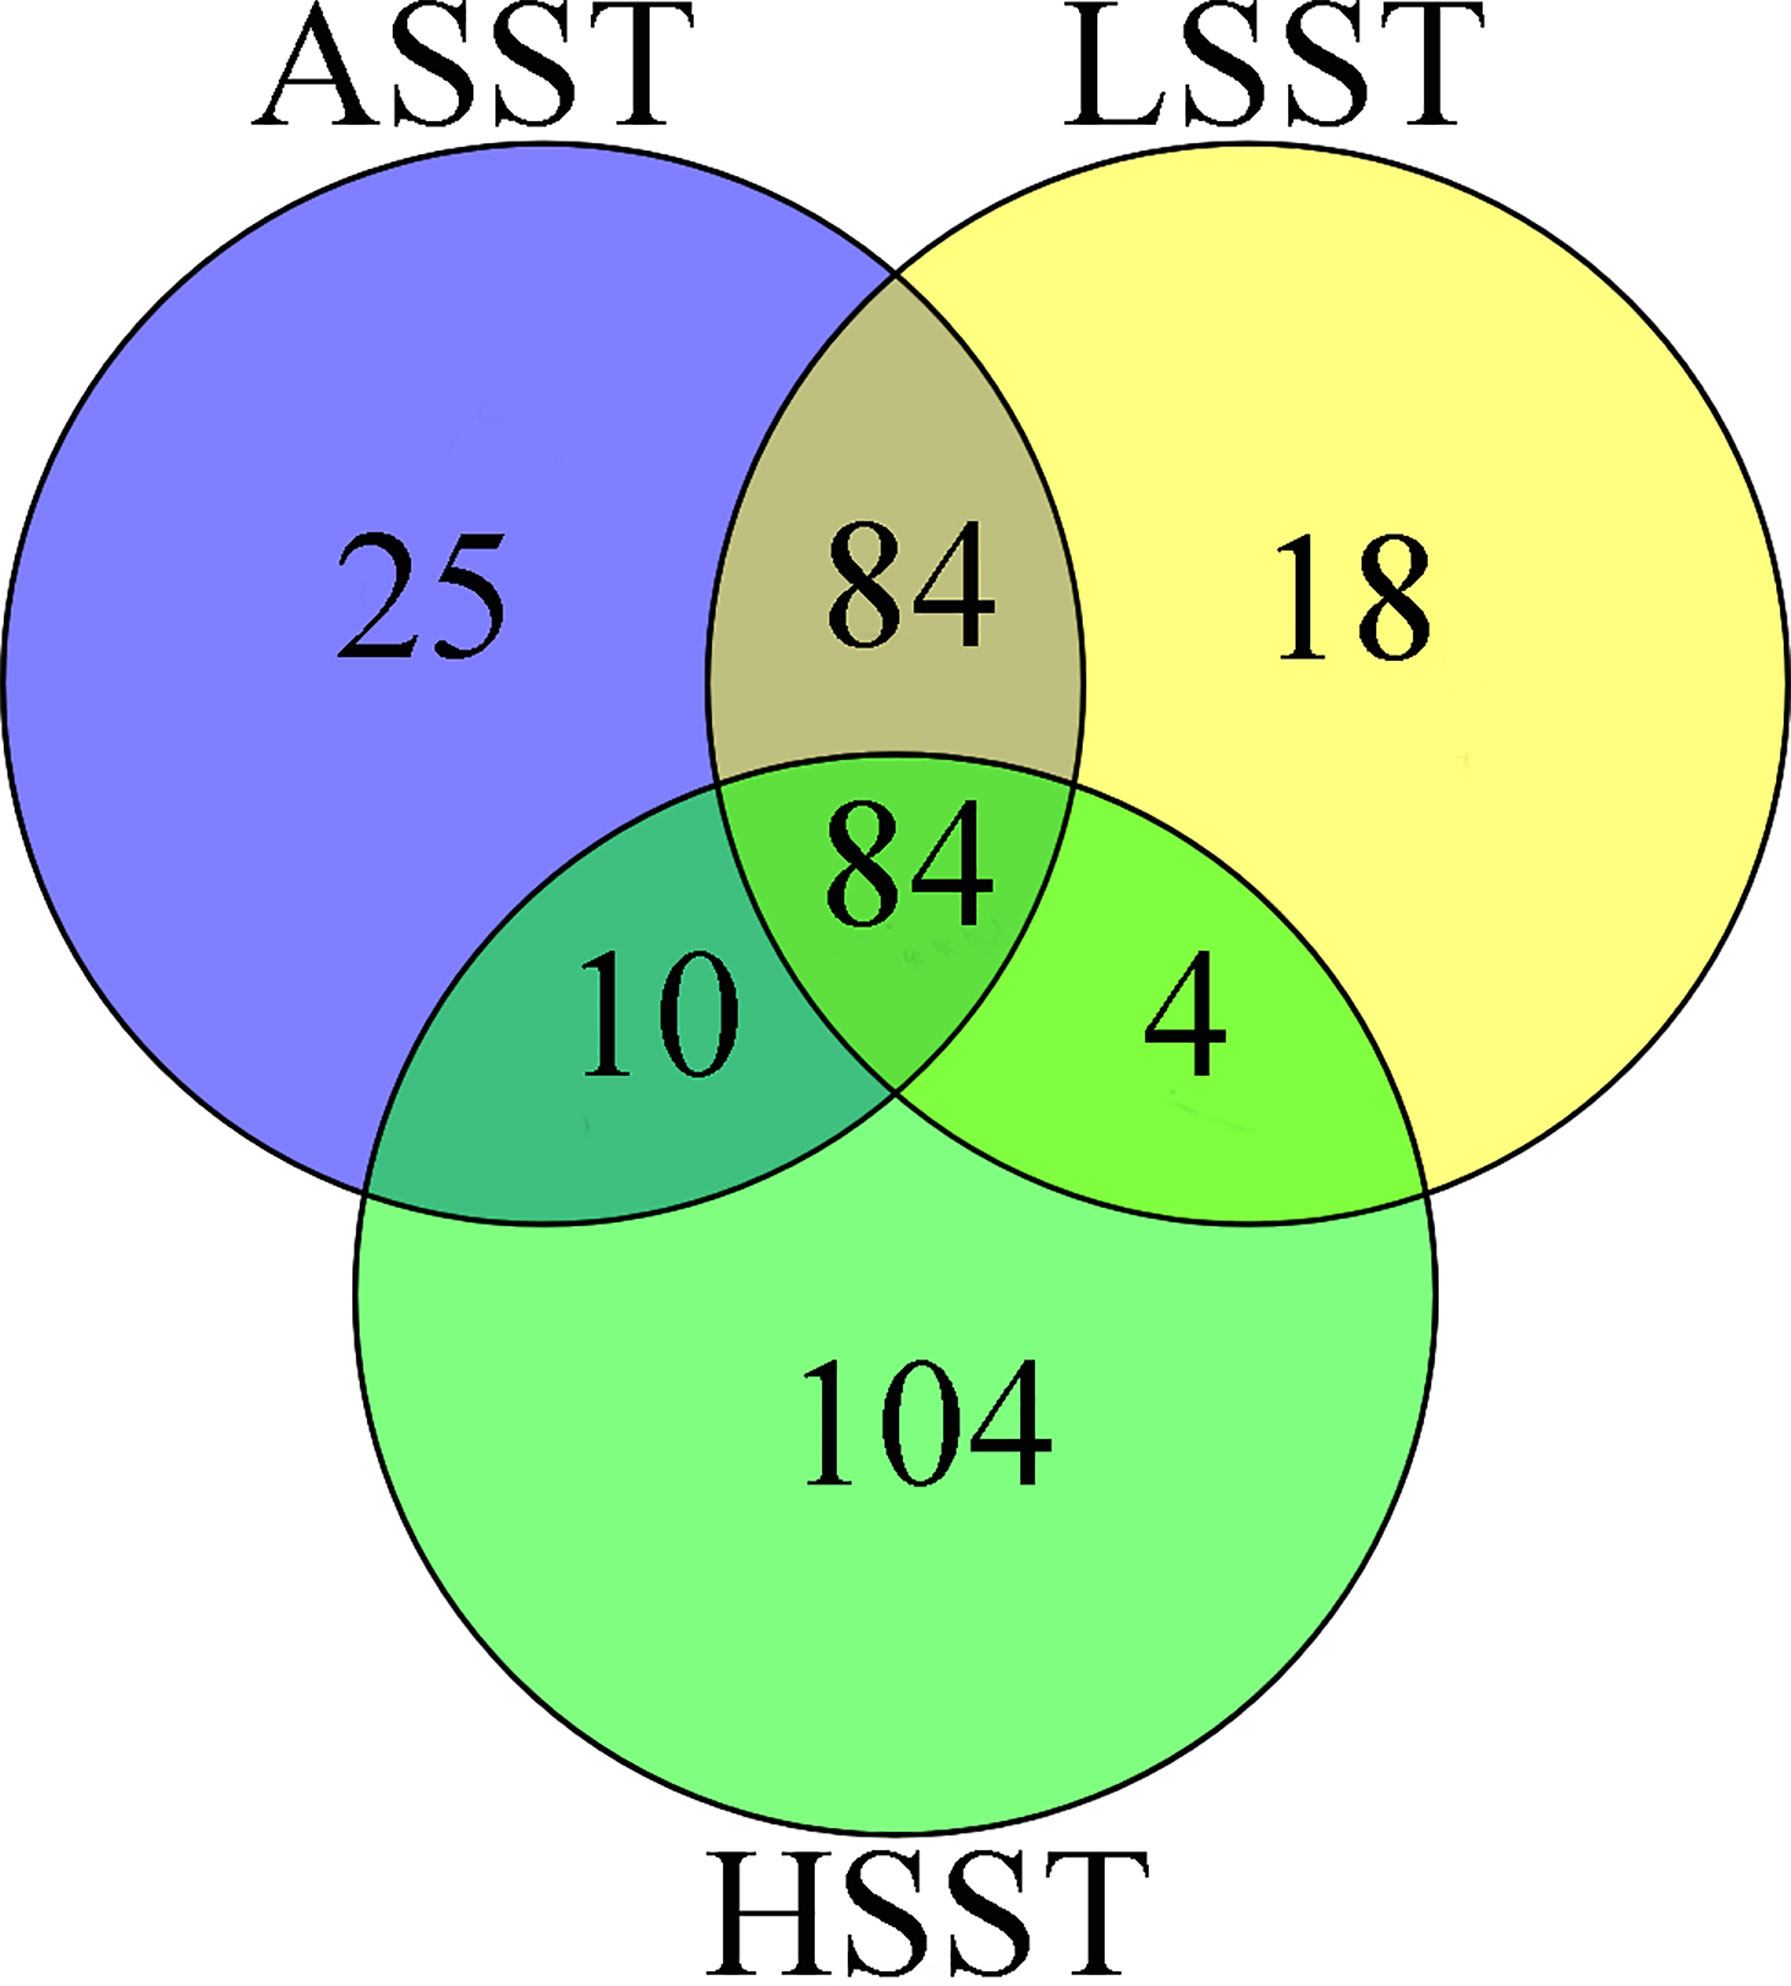
Figure 5 ASST-related, LSST-related, and HSST-related SNPs based on the Bayenv software.
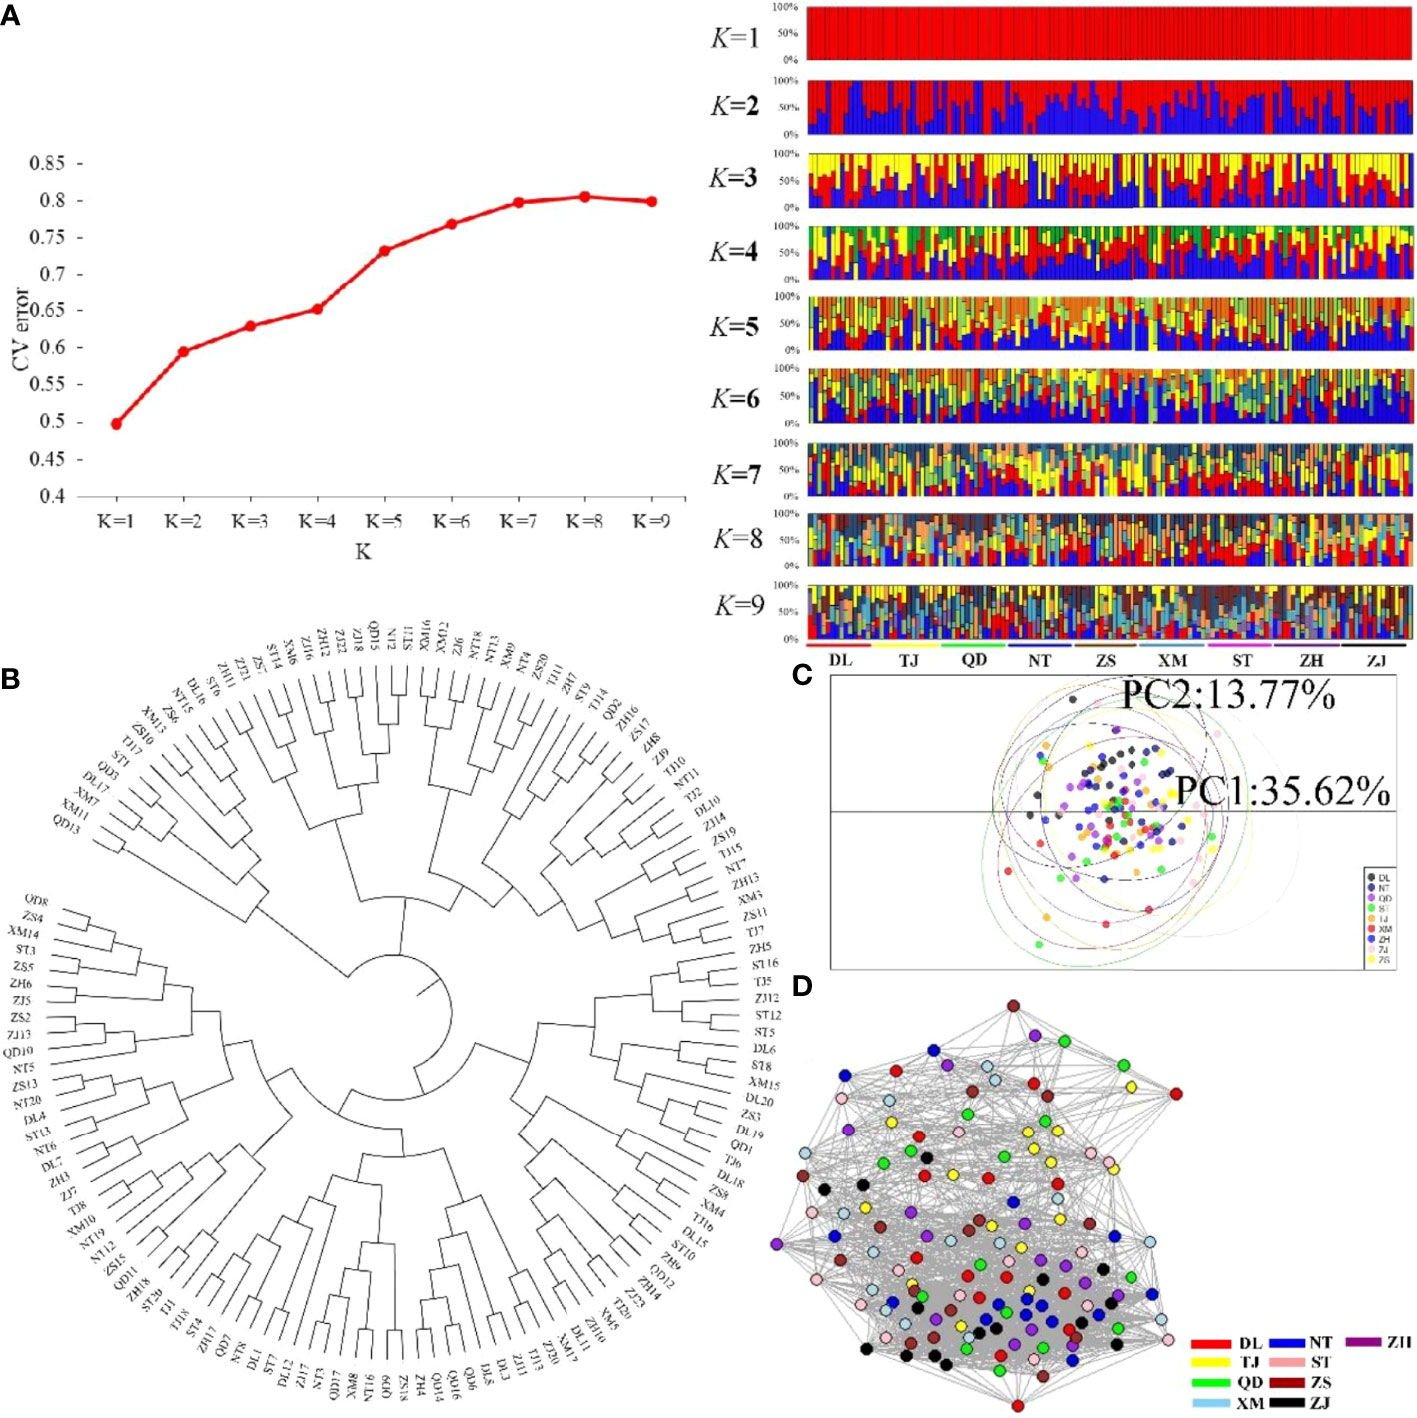
Figure 6 Clustering analysis results for the nine P. echinogaster geographical populations based on 84 temperature-selected SNPs. (A) Clustering results from ADMIXTURE, including the relationship between CV error and K value, and structure relationship. (B) NJ tree. (C) PCA chart constructed using the first (35.62%) and second (13.77%) principal components. (D) Individual clustering from NetView P software based on a KNN = 38.
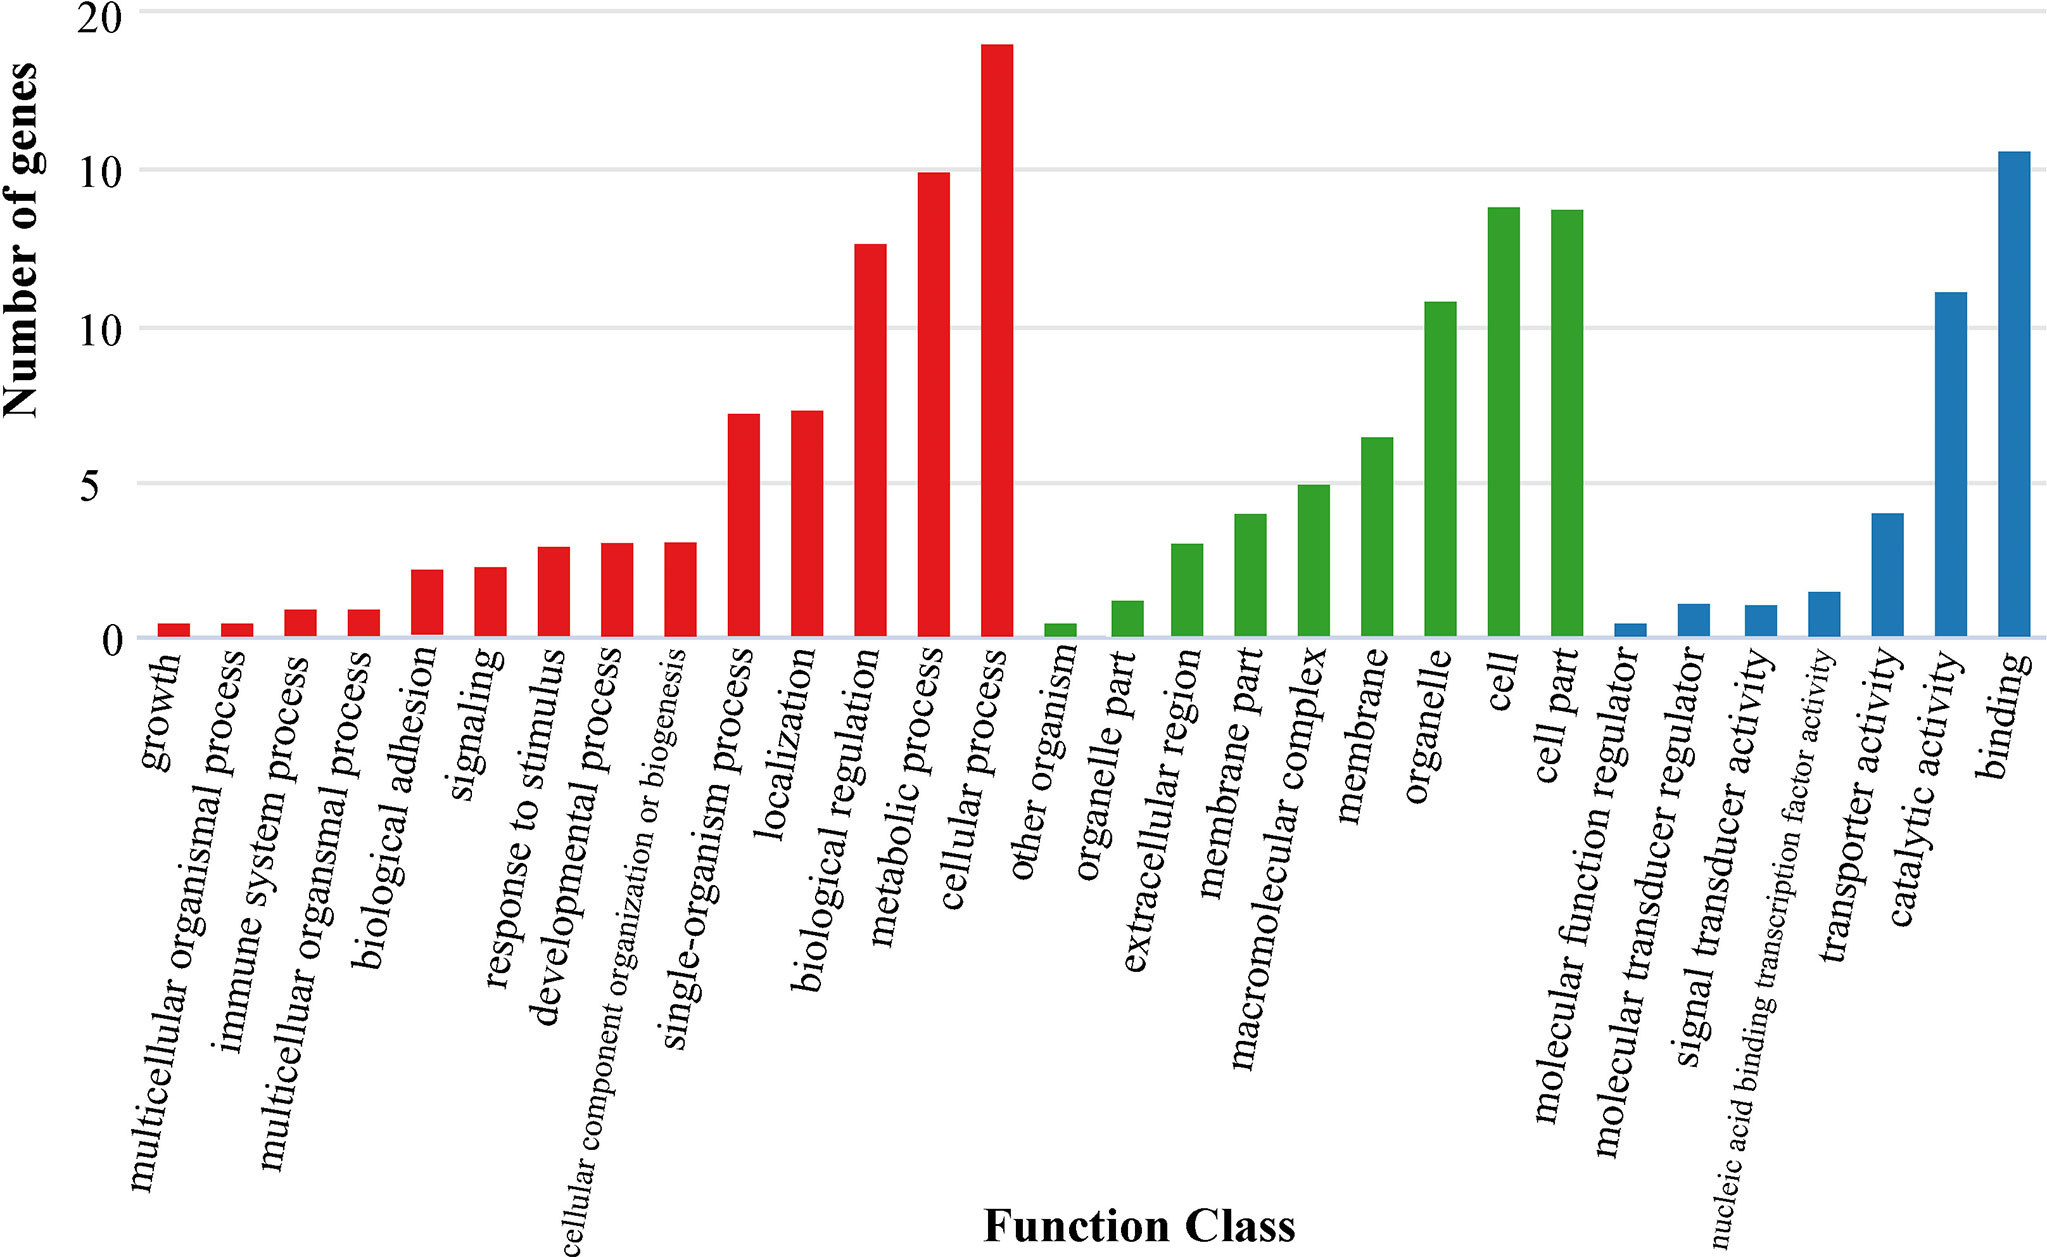
Figure 7 GO annotation information for temperature-selected SNPs. Red, green and blue bars represent biological process, cellular component and molecular function, respectively.
Discussion
Compared with traditional molecular markers, SNPs can be typed across the whole genome with more simplified genome sequencing technology, and they can reveal more sophisticated genetic information in evolutionary biology. Previous studies on the genetic structure of P. echinogaster geographical populations were mainly based on ecological characteristics (Jin et al., 2005; Zhang et al., 2007), mitochondrial DNA sequences (Li et al., 2018), or small numbers of microsatellite loci (Qin, 2013; Li et al., 2018). Population genetics research in P. echinogaster has been restricted by the limited number of genetic markers, and therefore studies on the genetic structure of some geographical populations have yielded different results. It is difficult to detect adaptive characteristics related to the habitats of P. echinogaster geographical populations by traditional molecular markers (Pritchard and Di, 2010). Therefore, in this study, we used genome-wide SNPs obtained from SLAF-seq to analyze and evaluate the genetic structure and habitat adaptation characteristics in regionally represented samples of P. echinogaster we collected from coastal waters of China.
Gene Flow Among the Nine P. Echinogaster Geographical Populations
This is the first study exploring the genetic structure and the genetic diversity of different geographical populations of P. echinogaster at the genomic level. Although the geographic populations of P. echinogaster had higher HO, HE, and Pi values than those of Pampus minor, which we previously studied (Li et al., 2021), they were still lower than 0.50. Except for the ST population, the FIS values of the other 8 geographical populations were all lower than the standard maximum value (0.05) of no genetic differentiation between geographical populations. This means that the genetic differentiation degree between the ST population and the other 8 geographical populations is relatively large.
Although P. echinogaster occupies a wide variety of habitats, this study confirmed that there was no significant genetic differentiation between P. echinogaster geographical populations based on multiple analytical methods. Gene flow analysis also showed frequent gene exchange between P. echinogaster geographical populations, which can be explained by random mating and suggests that high genetic homogeneity exists between P. echinogaster geographical populations. These results are consistent with our previous results based on mitochondrial DNA sequences and microsatellite loci (Li et al., 2018). We speculate that the population expansion of this species after the last glacial period and the lack of a balance between migration and genetic drift may be two main reasons for their unclear genetic structure (Wu et al., 2012; Li et al., 2018). Similar genetic structures are also found in species with closed expansion times, such as Trachurus japonicus (Song et al., 2013), Sebastes schlegelii (Zhang et al., 2013), Synechogobius ommaturus (Song et al., 2010), and Larimichthys polyactis (Xiao et al., 2009; Xiao et al., 2013). At the same time, the open marine environment lacks obvious physical barriers; the strong diffusion ability of eggs, larvae, and adults; and the high randomness of diffusivity provided by ocean currents are key reasons for the genetic homogeneity of marine organisms (Hewitt, 2000). P. echinogaster is a seasonal migratory fish species that lays eggs in batches. The spawning period can last for more than two months, and the number of eggs per mother can be 117,000-218,000 (Jin et al., 2005). In addition, the eggs of P. echinogaster are buoyant, and the larvae have a pelagic period of at least 1 month. These life history characteristics may be conducive to the long-distance diffusion of eggs and larvae and can promote gene exchange between P. echinogaster geographical populations, ultimately resulting in very low population genetic differentiation within a very wide distribution range (Grant and Bowen, 1998). These ocean currents can also affect the dispersal of marine larvae. For instance, the cold and low-salinity China Coastal Current (CCC) flows southwards along the coast of China from the Bohai Sea to the Taiwan Strait (Wu, 1982). The South China Sea Warm Current (SCSWC) connects the East China Sea and the South China Sea (Wu, 1982). Additionally, the Kuroshio Current transports warm and high salinity water northeastward from the Lozon Strait to the steep east-west continental shelf rupture in the East China Sea (Cheng and Sha, 2017). In conclusion, we speculate that the complex ocean current system along the coast of China may further affect the population size and genetic connectivity of this species by increasing the diffusion of eggs and larvae. Currently, P. echinogaster geographical populations form a continuous distribution and present a population-wide genetic pattern (Li et al., 2018). In summary, the life history characteristics of P. echinogaster and the influence of marine environmental factors may cause the mixing of P. echinogaster geographical populations, thus resulting in frequent gene exchange and high genetic homogeneity between them.
Temperature-Selected SNPs of Nine P. Echinogaster Geographical Populations
Temperature-selected SNPs can be applied to explore the prospects of P. echinogaster individual allocation to their region of origin (Nielsen et al., 2009; Jasonowicz et al., 2016). Considering that P. echinogaster is a seasonal migratory fish with long-distance diffusion (Yamada et al., 2007; Li et al., 2018), aquatic temperature conditions vary among geographical populations of this species. In fact, we found that there were differences in the high-resolution mean annual sea surface temperature (ASST), highest sea surface temperature (HSST), and lowest sea surface temperature (LSST) of nine sampling sites in 68 years (1950–2017). The results showed that multiple temperature-selected SNPs were related to material metabolism. In fact, the metabolic capacity of fishes is particularly susceptible to environmental stress; thus, fish use critical energy materials (amino acids, fat, and sugar) stored in their bodies to adapt to changes in habitat factors and for the energy required for life activities, such as migration (Pastoureaud, 1991; Wang, 1999; Liang, 2005). On the other hand, fish also regulate the fatty acid composition of their bodies to increase membrane fluidity, thereby adapting to changes in habitat temperature (Li et al., 2019). Therefore, genes related to material metabolism may play an important role in the adaptation of P. echinogaster to the temperatures of different geographical environments. Ion (such as calcium) transport signalling pathways also play important roles in the process of local adaptive evolution in P. echinogaster. For example, calcium ions are involved in fish reproduction, development, learning and memory, mitochondrial function, muscle contraction, and other functions (Berridge et al., 2000). Calcium signalling is also thought to play an important role in the regulation of ion exchange and osmoregulation, which makes this pathway a reasonable target of spatially differentiated selection under osmotic pressure in P. echinogaster because this species feeds on a wide variety of prey. In fact, a previous study confirmed that temperature changes the osmotic pressure regulation of marine organisms by altering the salinity of seawater (Whiteley et al., 2018). However, these results may have been due to chance because we detected only a small number (n = 84) of temperature-selected SNPs. Therefore, we still need to capture as many highly divergent regions of the genome and temperature-selected SNPs as possible (Woodings et al., 2018). Moreover, we have to acknowledge that explicitly linking genomic features of local adaptation to specific environmental conditions is not an easy task, and further targeted research is needed (Woodings et al., 2018).
Conclusion
In this study, genome-wide information was obtained from nine P. echinogaster geographical populations, and the genetic structure of the populations and the genomic characteristics related to local adaptation were explored. Genetic structure analysis showed that the nine geographical populations had high genetic similarity, which may be due to population expansion after the last glacial period, the lack of balance between migration and genetic drift, and the long-distance diffusion of eggs and larvae. Different habitat conditions might have caused the maintenance of many genetic mutations in the different geographical populations. The annotation of SLAF tags containing temperature-selected SNPs indicated that genes related to material metabolism, ion transfer, breeding, stress reactions, and inflammatory reactions were essential to the habitat temperature adaptation of P. echinogaster geographical populations.
Data Availability Statement
The datasets presented in this study can be found in online repositories. The names of the repository/repositories and accession number(s) can be found in the article/supplementary material.
Ethics Statement
The animal study was reviewed and approved by Third Institute of Oceanography, Ministry of Natural Resources.
Author Contributions
The survey was conducted by HL and SL. JX and BS contributed to species identification. The study conception and design were provided by LL, YL and XZ. Material preparation and data collection were performed by JX, HL and FL. The manuscript was written and edited by YL, FL, LL and XZ. All authors read and approved the final manuscript. All authors contributed to the article and approved the submitted version.
Funding
This research was funded by the National Programme on Global Change and Air-Sea Interaction (GASI-02-SCS-YDsum), the National Key Research and Development Program of China (2018YFC1406302), Scientific Research Foundation of TIO, MNR (2019017, 2019018), and Science and Technology Project of Guangdong Province, China (2019B121201001).
Conflict of Interests
The authors declare that the research was conducted in the absence of any commercial or financial relationships that could be construed as a potential conflict of interest.
Publisher’s Note
All claims expressed in this article are solely those of the authors and do not necessarily represent those of their affiliated organizations, or those of the publisher, the editors and the reviewers. Any product that may be evaluated in this article, or claim that may be made by its manufacturer, is not guaranteed or endorsed by the publisher.
Acknowledgments
The present study could not have been performed without assistance from Mr. Cheng Liu and Miss Zizi Cai during the experimental operation and data processing. We also thank all the editors and reviewers for their constructive comments on our manuscript.
References
Alexander D. H., Novembre J., Lange K. (2009). Fast Model-Based Estimation of Ancestry in Unrelated Individuals. Genome Res. 19, 1655–1664. doi: 10.1161/01.ATV.0000137190.63214.c5
Berridge M. J., Lipp P., Bootman M. D. (2000). The Versatility and Universality of Calcium Signalling. Nat. Rev. Mol. Cell. Biol. 1, 11–21. doi: 10.1038/35036035
Bradbury P. J., Zhang Z., Kroon D. E., Casstevens T. M., Ramdoss Y., Buckler E. S. (2007). TASSEL: Software for Association Mapping of Complex Traits in Diverse Sa-Mples. Bioinformatics 23, 2633–2635. doi: 10.1093/bioinformatics/btm308
Cano J. M., Shikano T., Kuparinen A., Merilä J. (2008). Genetic Differentiation, Effective Population Size and Gene Flow in Marine Fishes: Implications for Stock Management. J. Integr. Field Sci. 5, 1–10.
Catchen J., Hohenlohe P., Bassham S., Amores A., Cresko W. (2013). Stacks: An Analysis Tool Set for Population Genomics. Mol. Ecol. 22, 3124–3140. doi: 10.1111/mec.12354
Cheng J., Sha Z. L. (2017). Cryptic Diversity in the Japanese Mantis Shrimp Oratosquilla Oratoria (Crustacea: Squillidae): Allopatric Diversification, Secondary Contact and Hybridization. Sci. Rep. 7, 1972. doi: 10.1038/s41598-017-02059-7
Conesa A., Götz S., García-Gómez J. M., Terol J., Talón M., Robles M. (2005). Blas-T2go: A Universal Tool for Annotation, Visualization and Analysis in Functional Ge-Nomics Research. Bioinformatics 21, 3674–3676. doi: 10.1093/bioinformatics/bti610
Conover D. O., Clarke L. M., Munich S. B., Wagner G. N. (2006). Spatial and Temporal Scales of Adaptive Divergence in Marine Fishes and the Implications for Conservation. J. Fish. Biol. 69, 21–47. doi: 10.1111/j.1095-8649.2006.01274.x
Coop G., Witonsky D., Di-Rienzo A., Pritchard J. K. (2010). Using Environmental Correlations to Identify Loci Underlying Local Adaptation. Genetics 185, 1411–1423. doi: 10.1534/genetics.110.114819
Danecek P., Auton A., Abecasis G., Albers C. A., Banks E., DePristo M. A., et al. (2011). The Variant Call Format and VCFtools. Bioinformatics 27, 2156–2158. doi: 10.1093/bioinformatics/btr330
Dolganov V. N., Kharin V. E., Zemnukhov V. V. (2007). Species Composition and Distribution of Butterfishes (Stromateidae) in Waters of Russia. J. Ichthyol. 47, 579–584. doi: 10.1134/S0032945207080048nbb
Do C., Waples R. S., Peel D., Macbeth G. M., Tillett B. J., Ovenden J. R. (2014). NeEstimator V2: Re-Implementation of Software for the Estimation of Contemporary Effective Population Size (Ne) From Genetic Data. Mol. Ecol. Resour. 14, 209–214. doi: 10.1111/1755-0998.12157
Excoffier L., Lischer H. E. L. (2010). Arlequin Suite Ver 3.5: A New Series of Programs to Perform Population Genetics Analyses Under Linux and Windows. Mol. Ecol. Resour. 10, 564–567. doi: 10.1111/j.1755-0998.2010.02847.x
Ferchaud A. L., Hansen M. M. (2016). The Impact of Selection, Gene Flow and Demographic History on Heterogeneous Genomic Divergence: Threespine Sticklebacks in Divergent Environments. Mol. Ecol. 25, 238–259. doi: 10.1111/mec.13399
Frankham R., Briscoe D. A., Ballou J. D. (2002). Introduction to Conservation Genetics (Cambridge: Cambridge University Press).
Grant W. S., Bowen B. W. (1998). Shallow Population Histories in Deep Evolutionary Lineages of Marine Fishes: Insights From Sardines and Anchovies and Lessons for Conservation. J. Hered. 89, 415–426. doi: 10.1093/jhered/89.5.415
Hewitt G. (2000). The Genetic Legacy of the Quaternary Ice Ages. Nature 405, 907–913. doi: 10.1038/35016000
Jasonowicz A. J., Goetz F. W., Goetz G. W., Nichols K. M. (2016). Love the One You’re With: Genomic Evidence of Panmixia in the Sablefish (Anoplopoma Fimbria). Can. J. Fish. Aquat. Sci. 74, 377–387. doi: 10.1139/cjfas-2016-0012
Jin X. H., Zhao X. Y., Meng T. X., Cui Y. (2005). Biology Resource and Environment in the Bohai Sea and Yellow Sea (Beijing: Scientific Press).
Jombart T., Devillard S., Balloux F. (2010). Discriminant Analysis of Principal Components: A New Method for the Analysis of Genetically Structured Populations. BMC Genet. 11, 94. doi: 10.1186/1471-2156-11-94
Kass R. E., Raftery A. E. (1995). Bayes Factors. J. Am. Stat. Assoc. 90, 773–795. doi: 10.1080/01621459.1995.10476572
Kozich J. J., Westcott S. L., Baxter N. T., Highlander S. K., Schloss P. D. (2013). Development of a Dual-Index Sequencing Strategy and Curation Pipeline for Analyzing Amplicon Sequence Data on the MiSeq Illumina Sequencing Platform. Appl. Environ. Microbiol. 79, 5112–5120. doi: 10.1128/AEM.01043-13
Krzywinski M., Schein J., Birol I., Connors J., Gascoyne R. D., Horsman D., et al. (2009). CIRCOS: An Information Aesthetic for Comparative Genomics. Genome Res. 19, 1639–1645. doi: 10.1101/gr.092759.109
Liang Y. G. (2005). The Physiological and Biochemical Adaptation of Long-Snout Catfish (Leiocassis Longirostris) to Overwintering (Wuhan: Huazhong Agricultural University).
Li H., Durbin R. (2009). Fast and Accurate Short Read Alignment With Burrows Wheele-R Transform. Bioinformatics 25, 1754–1760. doi: 10.1093/bioinformatics/btp324
Li H., Handsaker B., Wysoker A., Fennell T., Ruan J., Homer N., et al. (2009). 1000 Genome Project Data Processing Subgroup. The Sequence Alignment/Map Format and SAMtools. Bioinformatics 25, 2078–2079. doi: 10.1093/bioinformatics/btp352
Li Y., Lin L. S., Song N., Zhang Y., Gao T. X. (2018). Population Genetics of Pampus Echinogaster Along the Pacific Coastline of China: Insights From CR and Microsatellite Molecular Markers. Mar. Freshwater. Res. 69, 971–981. doi: 10.1071/MF17218
Li Y., Lou F. R., Song P. Q., Liu S. G., Siyal F. K., Lin L. S. (2021). New Perspective on the Genetic Structure and Habitat Adaptation of Pampus Minor Off the Coast of China Based on RAD-Seq. Comp. Biochem. Phys. D. 39, 100865. doi: 10.1016/j.cbd.2021.100865
Lischer H. E., Excoffier L. (2012). PGDSpider: An Automated Data Conversion Tool for Connecting Population Genetics and Genomics Programs. Bioinformatics 28, 298–299. doi: 10.1093/bioinformatics/btr642
Li Y., Zhou Y. D., Li P. F., Gao T. X., Lin L. S. (2019). Species Identification and Cryptic Div\ersity in Pampus Species as Inferred From Morphological and Molecular Characteristics. Mar. Biodivers. 49, 2521–2534. doi: 10.1007/s12526-019-00976-6
McKenna A., Hanna M., Banks E., Sivachenko A., Cibulskis K., Kernytsky A., et al. (2010). The Genome Analysis Toolkit: A MapReduce Framework for Analyzing Next-Generation DNA Sequencing Data. Genome Res. 20, 1297–1303. doi: 10.1101/gr.107524.110
Nakabo T. (2013). Fishes of Japan With Pictorial Keys to the Species (Japan: Tokai University Press).
Nielsen E. E., Hemmer-Hansen J., Poulsen N. A., Loeschcke V., Moen T., Johansen T., et al. (2009). Genomic Signatures of Local Directional Selection in a High Gene Flow Marine Organism; the Atlantic Cod (Gadus Morhua). BMC Evol. Biol. 9, 276. doi: 10.1186/1471-2148-9-276
Oh C. W., Na J. H., Kim J. K. (2009). Population Biology of Korean Pomfret Pampus E-Chinogaster (Basilewsk) (Perciformes: Stromateidae) on the Western Coast of Korea, Yellow Sea. Anim. Cells Syst. 13, 83–89. doi: 10.1080/19768354.2009.9647197
Ouborg N. J., Pertoldi C., Loeschcke V., Bijlsma R., Hedrick P. W. (2010). Conservation Genetics in Transition to Conservation Genomics. Trends Genet. 26, 177–187. doi: 10.1016/j.tig.2010.01.001
Pastoureaud A. (1991). Influence of Starvation at Low Temperatures on Utilization of Energy Reserves, Appetite Recovery and Growth Character in Sea Bass, Dicentrarchus Labrax. Aquaculture 99, 167–178. doi: 10.1016/0044-8486(91)90296-J
Pritchard J. K., Di R. A. (2010). Adaptation - Not by Sweeps Alone. Nat. Rev. Genet. 11, 665–667. doi: 10.1038/nrg2880
Qin Y. (2013). Development of Polymorphic Microsatellites for Pampus Argenteus and its Analysis on Population Genetic Structure (Zhoushan: Zhejiang Ocean University).
Sandoval-Castillo J., Robinson N. A., Hart A. M., Strain L. W. S., Beheregaray L. B. (2018). Seascape Genomics Reveals Adaptive Divergence in a Connected and Commercially Important Mollusc, the Greenlip Abalone (Haliotis Laevigata), Along a Longitudinal Environmental Gradient. Mol. Ecol. 27, 1603–1620. doi: 10.1111/mec.14526
Savolainen O., Lascoux M., Merila J. (2013). Ecological Genomics of Local Adaptation. Nat. Rev. Genet. 14, 807–820. doi: 10.1038/nrg3522
Schluter D. (2000). Ecological Character Displacement in Adaptive Radiation. Am. Nat. 156, 4–16. doi: 10.2307/3079223
Shanks A. L., Grantham B. A., Carr M. H. (2003). Propagule Dispersal Distance and the Size and Spacing of Marine Reserves. Ecol. Appl. 13, 159–169. doi: 10.2307/3100005
Song N., Jia N., Yanagimoto T., Lin L. S., Gao T. X. (2013). Genetic Differentiation of Trachurus Japonicus From the Northwestern Pacific Based on the Mitochondrial DNA Control Region. Mitochondr. DNA 24, 705–712. doi: 10.3109/19401736.2013.773982
Song N., Zhang X. M., Sun X. F., Yanagimoto T., Gao T. X. (2010). Population Genetic Structure and Larval Dispersal Potential of Spottedtail Goby Synechogobius Ommaturus in the North-West Pacific. J. Fish. Biol. 77, 388–402. doi: 10.1111/j.1095-8649.2010.02694.x
Sun X., Liu D., Zhang X., Li W., Liu H., Hong W., et al. (2013). SLAF-Seq: An Efficient Method of Large-Scale De Novo SNP Discovery and Genotyping Using High-Throughput Sequencing. PloS One 8, e58700. doi: 10.1371/journal.pone.0058700
Wang J. Q. (1999). Advances in Studies on the Ecology and Reproductive Biology of Trachidermus Fasciatus Heckle. Acta Hydrobiol. Sin. 23, 729–734.
Whiteley N. M., Suckling C. C., Ciotti B. J., Brown J., Mccarthy I. D., Gimenez L., et al. (2018). Sensitivity to Near-Future CO2 Conditions in Marine Crabs Depends on Their Compensatory Capacities for Salinity Change. Sci. Rep. 8, 15639. doi: 10.1038/s41598-018-34089-0
Woodings L. N., Murphy N. P., Doyle S. R., Hall N. E., Robinson A. J., Liggins G. W., et al. (2018). Outlier SNPs Detect Weak Regional Structure Against a Background of Genetic Homogeneity in the Eastern Rock Lobster, Sagmariasus Verreauxi. Mar. Biol. 165, 185. doi: 10.1007/s00227-018-3443-7
Wu B. (1982). Some Problems on Circulation Study in Taiwan Strait. J. Oceanogr. Taiwan. Strait. 1, 1–7.
Wu R. X., Liang X. H., Zhuang Z. M., Liu S. F. (2012). Mitochondrial COI Sequence Variation of Silver Pomfret (Pampus Argenteus) From Chinese Coastal Waters. Acta Zootaxon. Sin. 37, 480–488.
Xiao Y., Song N., Li J., Xiao Z. Z., Gao T. X. (2013). Significant Population Genetic Structure Detected in the Small Yellow Croaker Larimichthys Polyactis Inferred From Mitochondrial Control Region. Mitochondrial. DNA 26, 409. doi: 10.3109/19401736.2013.843076
Xiao Y., Zhang Y., Gao T., Yanagimoto T., Yabe M., Sakurai Y. (2009). Genetic Diversity in the mtDNA Control Region and Population Structure in the Small Yellow Croaker Larimichthys Polyactis. Environ. Biol. Fishes. 85, 303–314. doi: 10.1007/s10641-009-9497-0
Xue D. X., Li Y. L., Liu J. X. (2019). RAD Genotyping Reveals Fine-Scale Population Structure and Provides Evidence for Adaptive Divergence in a Commercially Important Fish From the Northwestern Pacific Ocean. Peer. J. 7, e7242. doi: 10.7717/peerj.7242
Yamada U., Tokimura M., Horikawa H., Nakabo T. (2007). Fishes and Fisheries of the East China and Yellow Seas (Japan: Tokai University Press).
Yamada U., Tokimura M., Hoshino K., Deng S., Zheng Y., Li S., et al. (2009). Name and Illustrations of Fish From the East China Sea and the Yellow Sea–Japanese-Chinese-Korean–Tokyo (Japan: Overseas Fishery Cooperation Foundation of Japan).
Zhang Q. H., Cheng J. H., Xu H. X., Shen X. Q., Yu G. P., Zheng Y. J. (2007). Fisheries Resources and Their Sustainable Utilization in the East China Sea (Shanghai: Fudan University Press).
Keywords: Pampus echinogaster, specific-length amplified fragment sequencing (SLAF-seq), genomic variation, population-genetic differentiation, adaptive evolution
Citation: Li Y, Lou F, Liu S, Li H, Xiang J, Shan B, Lin L and Zhuang X (2022) Differentiation and Temperature Adaptation of Pampus Echinogaster Based on Genome-Wide SNPs. Front. Mar. Sci. 9:936217. doi: 10.3389/fmars.2022.936217
Received: 05 May 2022; Accepted: 10 June 2022;
Published: 12 July 2022.
Edited by:
Shikai Liu, Ocean University of China, ChinaReviewed by:
Guanpin Yang, Ocean University of China, ChinaAhmed Rady A. E. Elbeltagy, Animal Production Research Institute (APRI), Egypt
Copyright © 2022 Li, Lou, Liu, Li, Xiang, Shan, Lin and Zhuang. This is an open-access article distributed under the terms of the Creative Commons Attribution License (CC BY). The use, distribution or reproduction in other forums is permitted, provided the original author(s) and the copyright owner(s) are credited and that the original publication in this journal is cited, in accordance with accepted academic practice. No use, distribution or reproduction is permitted which does not comply with these terms.
*Correspondence: Longshan Lin, bHNobGluQHRpby5vcmcuY24=; Xuan Zhuang, eHowMzZAdWFyay5lZHU=
†These authors have contributed equally to this work