 Colomban de Vargas1,2,3*
 Noan Le Bescot1,2
 Thibaut Pollina2,4
 Nicolas Henry1,2,3
 Sarah Romac1,2,3
 Sébastien Colin2,5
 Nils Haëntjens2,6Margaux Carmichael2Calixte Berger2David Le Guen2
 Johan Decelle7
 Frédéric Mahé8
 Julie Poulain3,9Emmanuel Malpot10
 Carole Beaumont11Michel Hardy12Damien Guiffant2
 Ian Probert1
 David F. Gruber13
 Andrew E. Allen14,15
 Gabriel Gorsky2,16Michael J. Follows17
 Xavier Pochon18,19Romain Troublé2,20
 B. B. Cael2,21
 Fabien Lombard2,16,22
 Emmanuel Boss2,6*
 Manu Prakash2,4* and the Plankton Planet core team
- 1Sorbonne Université, CNRS, Station Biologique de Roscoff, UMR7144, ECOMAP, Roscoff, France
- 2Plankton Planet Non-Governmental Organization (NGO), Station Biologique de Roscoff, Roscoff, France
- 3Research Federation for the study of Global Ocean Systems Ecology and Evolution, FR2022/Tara GOSEE, Paris, France
- 4Department of Bioengineering, Stanford University, Stanford, CA, United States
- 5BioOptics Facility, Max Planck Institute for Biology Tübingen, Tübingen, Germany
- 6School of Marine Sciences, University of Maine, Orono, ME, United States
- 7Laboratoire de Physiologie Cellulaire et Végétale, Université Grenoble Alpes, CNRS, CEA, INRA, Grenoble, France
- 8CIRAD, UMR BGPI, Biologie et Génétique des Interactions Plante-Parasites, Montpellier, France
- 9Génomique Métabolique, Genoscope, Institut Francois-Jacob, CEA, CNRS, Université d’Evry, Université Paris-Saclay, Evry, France
- 10Moana New Zealand, Cawthron Aquaculture Park, Nelson, New Zealand
- 11On board ‘Folligou’, Lorient, France
- 12On board 'Taravana', Lorient, France
- 13Baruch College and the Graduate Center, Department of Natural Sciences, City University of New York, New York, NY, United States
- 14J. Craig Venter Institute, Microbial and Environmental Genomics, La Jolla, CA, United States
- 15Scripps Institution of Oceanography, University of California, La Jolla, CA, United States
- 16Sorbonne Universite’, CNRS, Laboratoire d’Oce’ anographie de Villefranche, Villefranche-sur-mer, France
- 17Department of Earth, Atmosphere and Planetary Sciences, Massachusetts Institute of Technology(MIT), Cambridge, MA, United States
- 18Biosecurity Group, Cawthron Institute, Nelson, New Zealand
- 19Institute of Marine Science, University of Auckland, Auckland, New Zealand
- 20Tara Ocean Foundation, Paris, France
- 21Ocean Biogeochemistry and Ecosystems, National Oceanography Centre, Southampton, United Kingdom
- 22Institut Universitaire de France (IUF), Paris, France
In every liter of seawater there are between 10 and 100 billion life forms, mostly invisible, called marine plankton or marine microbiome, which form the largest and most dynamic ecosystem on our planet, at the heart of global ecological and economic processes. While physical and chemical parameters of planktonic ecosystems are fairly well measured and modeled at the planetary scale, biological data are still scarce due to the extreme cost and relative inflexibility of the classical vessels and instruments used to explore marine biodiversity. Here we introduce ‘Plankton Planet’, an initiative whose goal is to engage the curiosity and creativity of researchers, makers, and mariners to (i) co-develop a new generation of cost-effective (frugal) universal scientific instrumentation to measure the genetic and morphological diversity of marine microbiomes in context, (ii) organize their systematic deployment through coastal or open ocean communities of sea-users/farers, to generate uniform plankton data across global and long-term spatio-temporal scales, and (iii) setup tools to flow the data without embargo into public and explorable databases. As proof-of-concept, we show how 20 crews of sailors were able to sample plankton biomass from the world surface ocean in a single year, generating the first seatizen-based, planetary dataset of marine plankton biodiversity based on DNA barcodes. The quality of this dataset is comparable to that generated by Tara Oceans and is not biased by the multiplication of samplers. The data unveil significant genetic novelty and can be used to explore the taxonomic and ecological diversity of plankton at both regional and global scales. This pilot project paves the way for construction of a miniaturized, modular, evolvable, affordable and open-source citizen field-platform that will allow systematic assessment of the eco/morpho/genetic variation of aquatic ecosystems and microbiomes across the dimensions of the Earth system.
Introduction
The need for global, long-term surveys of plankton life
The ocean contains 97% of all water on our planet. In every liter of seawater there are between 10 and 100 billion, mostly invisible planktonic life forms. These form a continuous global ecosystem that generates approximately half of planetary oxygen, sustains the large majority of marine life, and regulates atmospheric CO2 and climate. Understanding and modeling the structure, dynamics, and evolution of global plankton populations is critical for predicting the future of our biosphere and learning how to live in symbiosis with our spaceship, the Earth.
Plankton populations comprise, like in terrestrial biomes, organisms from across the tree of life (viruses, bacteria, archaea, protists, and animals) which interact in complex networks (Lima-mendez et al., 2015; Guidi et al., 2016) that are also shaped by ocean currents and associated physico-chemical environmental parameters (Richter et al., 2019; Logares et al., 2020) – i.e. the seascape (Pittman, 2018). But in contrast to terrestrial ecosystems, there are no plants and trees in the plankton - primary production is driven by a large and ancient diversity of photosynthetic bacteria and protists (called phytoplankton) - and the pelagic ecosystem is much more dynamic in terms of both organism life cycle and strategies (e.g. mixotrophy) (Falkowski, 2012) and transport (advection and mixing). The self-organization of local plankton biota into complex ecosystems (Follows et al., 2007) determines their impact on the carbon cycle. For instance, in some regions and seasons, blooms of relatively large cells with mineral components lead to a vigorous sinking flux of organic carbon into the deep sea (Decelle et al., 2013; Durkin et al., 2016). Overall, these fundamental properties of the plankton ecosystem make it arguably the most reactive and proactive compartment of the biosphere to climate change and pollution. Changes in plankton communities can have dramatic effects on global biogeochemical cycles (e.g. Falkowski et al., 2008), climate (e.g. Kwon et al., 2009; Buesseler et al., 2020), and major human societal and economic activities (i.e. fisheries, aquaculture, tourism, etc. Beaugrand and Kirby, 2010; Morgan et al., 2010).
Current models aimed at predicting global ocean ecological changes (e.g. Follows and Dutkiewicz, 2011; Ward et al., 2014) are fairly well constrained in terms of physics and chemistry, but are by comparison heavily oversimplified and unrealistic in terms of biology. In fact, they simply lack good quality, high resolution data on the nature and dynamics of oceanic plankton biodiversity at a planetary scale. While quantitative global data on ocean physics and biogeochemistry are abundantly available by satellites (e.g. Stanley Wilson et al., 2019), in situ floats (e.g. Roemmich et al., 2019; Claustre et al., 2020) sail drones (Vazquez-Cuervo et al., 2019), as well as research (e.g. Sloyan et al., 2019) and citizen (e.g. (Simoniello et al., 2019) vessels, standardized biological data are still scarce due to the challenge of sampling and assessing complex communities of fragile plankton in a harmonized and comparable manner (Lombard et al., 2019). Despite the availability of a century’s worth of recorded data on oceanic plankton (Richardson et al., 2006; Buitenhuis et al., 2013, and see for instance https://www.st.nmfs.noaa.gov/copepod/), some areas of the ocean (including much of the south and tropical Pacific Ocean) are almost devoid of any biological observations and we do not yet have a consistent and informed vision of the global distribution and variation of plankton communities.
The largest and longest homogenous survey of plankton life has been conducted using the Continuous Plankton Recorder (CPR), a visionary plankton-scroll instrument created by Sir Alister Hardy in 1931 (Reid et al., 2003), and towed since then behind ferries and cargo ships, particularly in the North Atlantic, North Pacific, and Southern Ocean south of Australia (Batten et al., 2019). The CPR database is currently the only basin-wide standardized historical record of ocean plankton life, and it has given rise to keystone studies describing and modeling basin-scale dynamics of plankton community over time and global climate change (e.g. Beaugrand et al., 2002; Beaugrand and Kirby, 2010; Chivers et al., 2017). However, CPR data also has drawbacks: (i) the instrument mainly recovers zooplankton >300µm, thus missing most marine microbiome diversity (see below), (ii) it is rather destructive for soft or gelatinous taxa, (iii) data analyses rely on taxonomic experts identifying and counting a restricted number of morpho-taxa, (iv) the formalin preservation of the silk severely limits subsequent light microscopy observations for some groups and analysis of nucleic acids in general, and (v) data come from ships navigating over a restricted number of (mostly northern) commercial routes. CPR data are therefore semi-quantitative and taxonomically and geographically limited.
Over the past 20 years, the revolution in environmental DNA/RNA sequencing has stimulated a new era of global-scale ocean cruises led by molecular and cellular biologists, notably the ‘Global Ocean Sampling’ (GOS - Venter et al., 2004), Tara Oceans (Karsenti et al., 2011), and Malaspina (Duarte, 2015) expeditions. Interestingly, the first two expeditions were private or semi-private enterprises undertaken by sailing boats. The Tara Oceans sailing expedition (2009 – 2013) was the longest and most comprehensive: its team developed an eco-systems biology strategy to explore plankton diversity from genes to communities, from viruses to animals, and across coarse but planetary spatial and seasonal scales (Sunagawa et al., 2020). The combination of standardized DNA metabarcoding (De Vargas et al., 2015; Ibarbalz et al., 2019), metagenomic (Sunagawa et al., 2015; Gregory et al., 2019; Zayed et al., 2022) and metatranscriptomic (Carradec et al., 2018; Salazar et al., 2019) datasets is unveiling the basic structure of plankton taxonomic and metabolic diversity (Bork et al., 2015; Sunagawa et al., 2020), generating hypotheses about its interactions (Chaffron et al., 2021), dynamics in the seascape (Richter et al., 2019), and role in emerging ecosystem functions such as the carbon pump (Guidi et al., 2016; Caputi et al., 2019). Notably, the Tara Oceans team discovered that the great majority of plankton biodiversity is found in organismal size fractions <100µm, and above all in eukaryotes rather than viruses or prokaryotes (De Vargas et al., 2015; Carradec et al., 2018).
Given the massive local (e.g. plastics, pollutants, Tornero and Hanke, 2016; Jacquin et al., 2019) and global (e.g. deoxygenation, warming, acidification, freshening, ocean circulation changes (Hays et al., 2005; Pörtner et al., 2019) anthropogenic pressures on our ocean, we urgently need global plankton surveys that merge the spatio-temporal sampling power of the CPR with the systems-biology approach of Tara Oceans. Only application of a comprehensive and homogenous measure of plankton life from micro- to meso- to global ocean scales (Follows et al., 2007; Lévy et al., 2018; Lombard et al., 2019) will provide the data necessary not only to unveil fundamental principles of ecology and evolution of marine life at the ecosystem level of organization, but also to feed mathematical models of the ocean system that integrate physical, chemical, and biological processes
‘Seatizen’ oceanography to change scale
A long-term measure of the ocean microbiome across planetary scales is hindered by the extreme cost and limited logistical flexibility of classical oceanographic research vessels and instruments, together with the current impossibility to use autonomous samplers (e.g. floats) to sample the biocomplexity of plankton and generate high-quality data from it. In this context, the thousands of citizen sailing boats (Lauro et al., 2014), professional sailing yachts, the >50,000 cargo ships (https://www.ics-shipping.org/shipping-facts/shipping-and-world-trade) and about the same number of global fishing vessels (https://globalfishingwatch.org/datasets-and-code/vessel-identity/) which are navigating the world ocean every day represent an outstanding opportunity.
With the miniaturization of sequencing (e.g. Urban et al., 2020) and imaging (Cybulski et al., 2014) devices, the power of cloud computing and artificial intelligence, and the possibilities offered by a participative science engaging actors and volunteers across disciplines and societal/economic activities (Garcia-Soto et al., 2017; Simoniello et al., 2019), six years ago we - a team of researchers, engineers, makers and sailors from France, the US, and New Zealand - started to develop a frugal approach and effective protocols to sample the world ocean plankton for the production of high quality eco/morpho/genetic data in collaboration with recreational and professional mariners. We created ‘Plankton Planet’ (P2, https://planktonplanet.org), an international initiative that develops a cooperative, frugal, and sustainable global measure of plankton to assess the biodiversity and health of the world’s open and coastal oceans (see P2 vision & mission, Box 1).
Box 1. Plankton Planet Vision & Mission.
Vision: To harness the creativity of mariners, makers, and researchers for a cooperative, long-term and global measure of aquatic invisible life, toward understanding of our blue planet’s biodiversity, evolution, and health for sustainable living in a symbiophere.
Mission: To co-develop a suite of user-friendly and cost-effective tools to collect, measure, and share consistent samples and data from the aquatic microbiome at a planetary scale, providing critical new knowledge on plankton morphology, genetics, and ecology, that will be universally accessible.
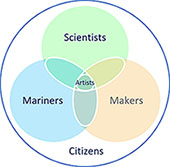
We strongly believe that mariners, makers, and researchers share a passionate curiosity and will to explore and discover their environment, such that assembling these communities will generate the necessary synergies to achieve our objectives. Our practical goal is to co-construct a new generation of frugal and open-source yet robust scientific instruments and protocols, which will allow all interested sea-users and sea-farers to collect comparable eco-morpho-genetic data on plankton diversity and abundance at a planetary scale.
In this paper, we present the first steps of this cost-effective, eco-friendly, agile, and society-engaging approach. We show how 20 pioneer crews of citizen sailors – the ‘planktonauts’-, equipped with a simple kit to sample plankton for DNA-metabarcoding, were able to help generate a scientifically sound, planetary dataset of plankton biodiversity in less than a year. We finally discuss recent developments (see also Pollina et al., 2022), as well as the ‘Plankton Planet’ perspectives toward planetary-scale deployment of integrated, affordable and portable ‘field-AquaScopes’ for long-term assessment of aquatic life and ecosystems at an unprecedented level of sensitivity.
Materials and methods
Between November 2014 and January 2016, with a total budget of $70,000, we provided proof-of-concept for the P2 vision and mission. Our primary goal was to demonstrate that, with the goodwill of mariners, we can sample ocean waters from the entire planet and obtain high quality plankton DNA data for global ecological analyses. We designed a general functional strategy (Supplementary Figure 1) based on robust methods linking affordable and user-friendly instruments for on-board citizen plankton sampling to cutting-edge DNA sequencing and bioinformatic pipelines developed previously in Tara Oceans (De Vargas et al., 2015).
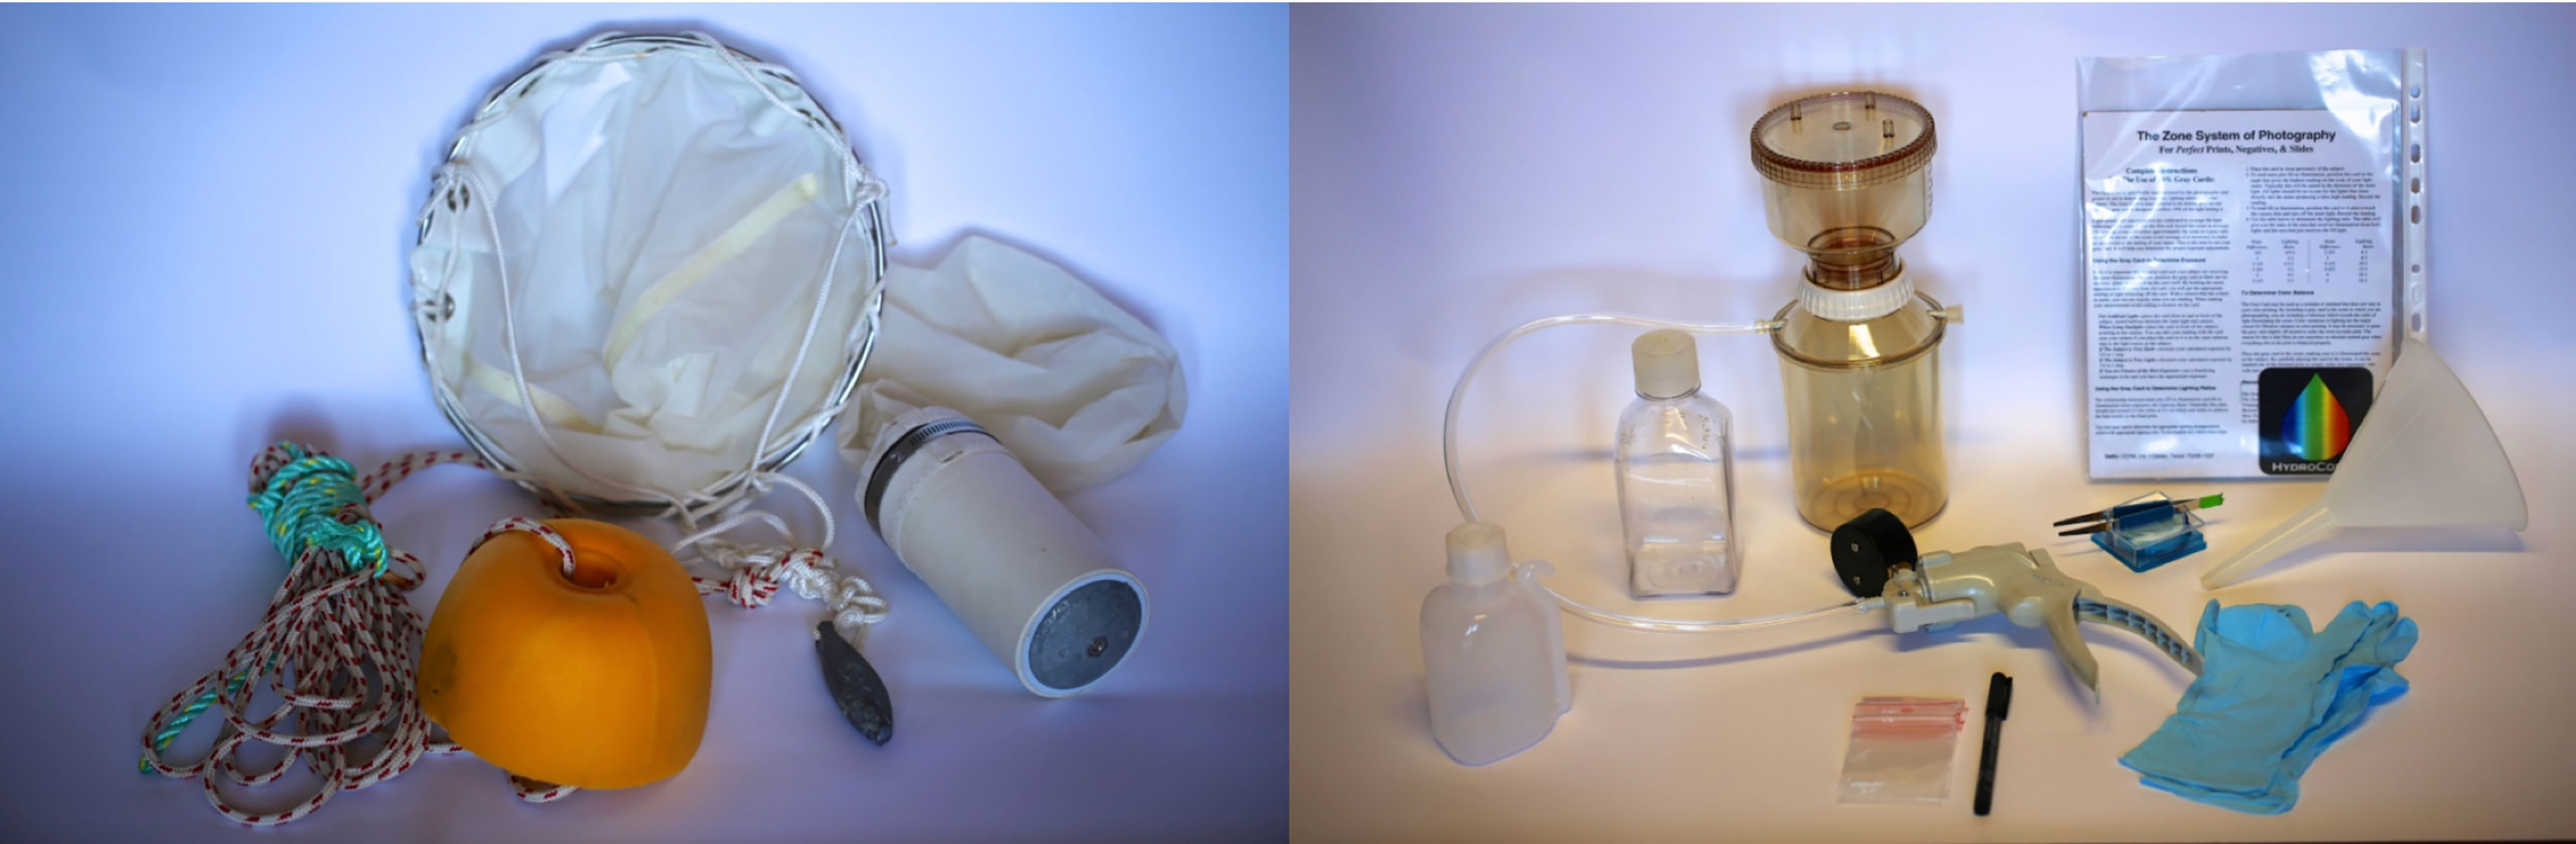
Figure 1 The original Plankton Planet sampling kit. Picture on the left: the P2 plankton net (25cm diameter, 20μm mesh size) with a 2kg weight and a small float to maintain it at a maximum depth of 3m. Picture on the right: the manual vacuum pumping system used to transfer plankton from the cod-end of the net onto a 10μm filter membrane. The total cost for one kit approximates $700 but will be largely reduced through tinkering of home-made parts for mass production.
Frugal and global plankton sampling by citizen-sailors (‘planktonauts’)
The P2 PlanktoKit
We first assembled a simple plankton sampling kit including a small net to collect plankton (>20μm) and a manual pumping system to rapidly transfer the freshly collected plankton onto a filter membrane (Figure 1). Of note, this sampling protocol does not rely on toxic chemicals or electricity, which are typically required in a regular laboratory. In order to avoid the need for high-energy storage of the filter membranes (plankton samples) in freezers on board, as well as complex frozen-shipping to the lab, the planktonauts were asked to place the filter on a clean aluminum cove and carefully heat-dry the filter membranes in a pan on the boat gas-cooker, store the dried plankton samples in labeled zip-lock bags with granular desiccants, and send them to the lab via standard postal services (Figure 2, Supplementary Material).
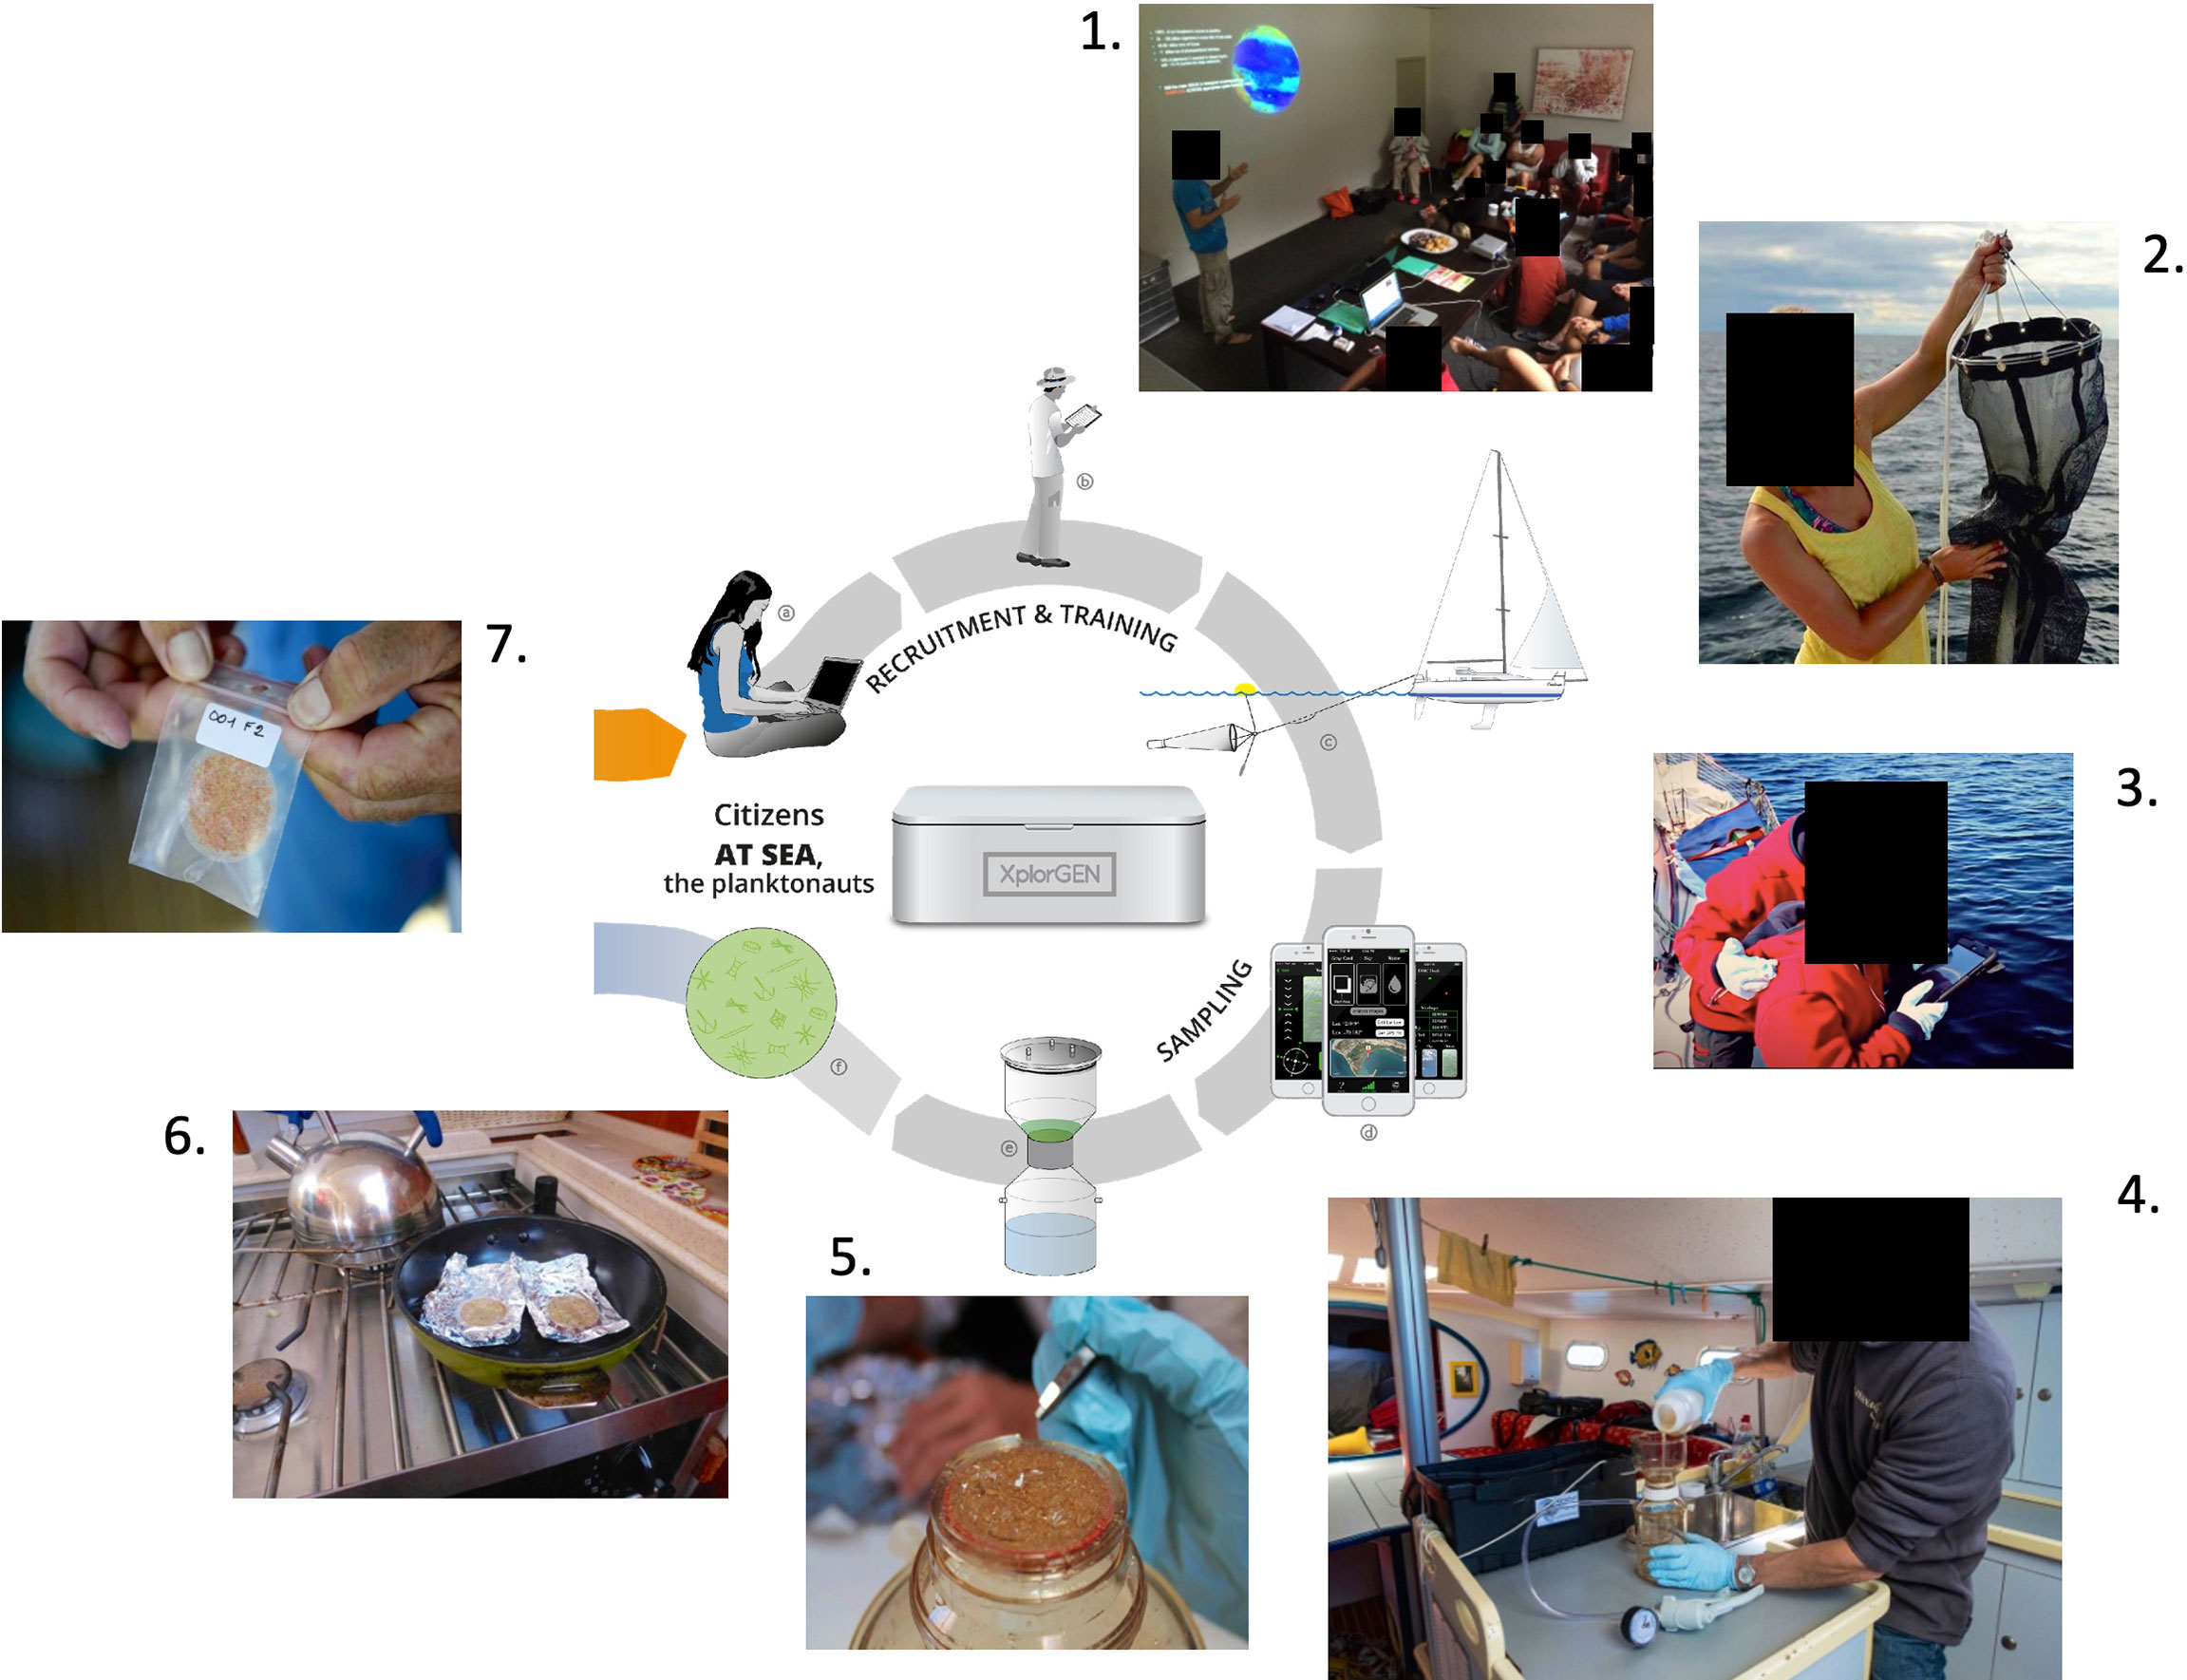
Figure 2 Pictures illustrating various steps of the sampling protocol for planktonauts at sea. 1. Training of a group of planktonauts in Auckland with Dr. Pochon. 2. After 15-20min of towing at a maximum speed of 2 knots, the plankton net is recovered on board, here onboard Tethys. 3. Recording of contextual parameters, here ocean color using the Hydrocolor App on board Zigomar. Note that 3 families participated in the pilot project, showing that even kids can realize parts of the protocol (see for instance: https://vimeo.com/219660346); 4. Pouring of the concentrated plankton from the net cod-end into the manual vacuum-pump, onboard Taravana. 5. Manual recovery of the 10μm filter membrane full of plankton biomass. 6. Gentle drying of the filter membrane in a pan on the boat (Taravana) gas cooker. 7. Storage and labeling of dried plankton samples into zip lock plastic bags before shipping to the laboratory by regular mail.
Heat-dried plankton DNA preservation
The protocol for plankton DNA preservation by heating and desiccation was first tested during two field campaigns along the French Atlantic coast and compared with gold-standard cryo-fixation and preservation. Six citizen crews sampled plankton at different locations (Supplementary Figure 2A) using the P2 protocol (Figures 1, 2). The concentrated plankton samples were equally divided into two subsamples: one was flash-frozen in liquid nitrogen as classically performed on oceanographic vessels for genetics analyses, while the other was heat-dried as implemented in P2 (Figure 2). On land, samples were preserved in a -80°C freezer (flash-frozen samples) and at room temperature (heat-dried samples) for a couple of months before total DNA extraction and sequencing of 1.3 ± 0.07 million V9 SSU rDNA amplicons per sample (see Sup. Mat. for details). Bioinformatic clustering of the plankton communities (defined by types and abundance of rDNA Operational Taxonomic Units (OTUs, see Sup. Mat.) using different dissimilarity indices indicated that the sub-samples preserved by desiccation and flash-freezing systematically clustered together (Supplementary Figures 2B, C). Plankton communities segregated then first by sampling location, then by their distance to fresh-water input within each bay, irrespective of preservation method. These results proved that the heat drying and subsequent desiccation preservation method do not alter the community composition as measured by DNA metabarcoding and can be applied globally.
Empowering pioneer planktonauts to sample the world oceans.
With modest seed-funding, we were able to assemble a first set of 20 PlanktoKits, and our primary strategy was to maximize geographic coverage and sampling conditions. We promoted the idea amongst the French sailing community and encountered great enthusiasm to participate. The antique proverb –’There are three sorts of people: the living, the dead, and those who sail the sea’ is profound: mariners are natural engineers, explorers, and planet-lovers. Word of mouth is powerful in their close-knit community and, limited by the low number of sampling kits available, we soon had to start declining requests. The 27 selected pioneer yacht crews, who we call ‘planktonauts’ (Figure 3A, and https://planktonplanet.org/the-planktonauts/) represented a wide variety of boats and sailing modes, from multi-year expeditions around the world (e.g. Race4Water, Taravana, Folligou), to family cruises (e.g. Manevai, Nika, or Zigomar - see kidsforsea.over-blog.com/), recreation sailing in the same zone over the year (e.g. Suhail), explorers of the poles (e.g. Vagabond or Podorange), or participants in a New Zealand yachting rally across the South Pacific Islands (Figure 3B, bottom-right insert).
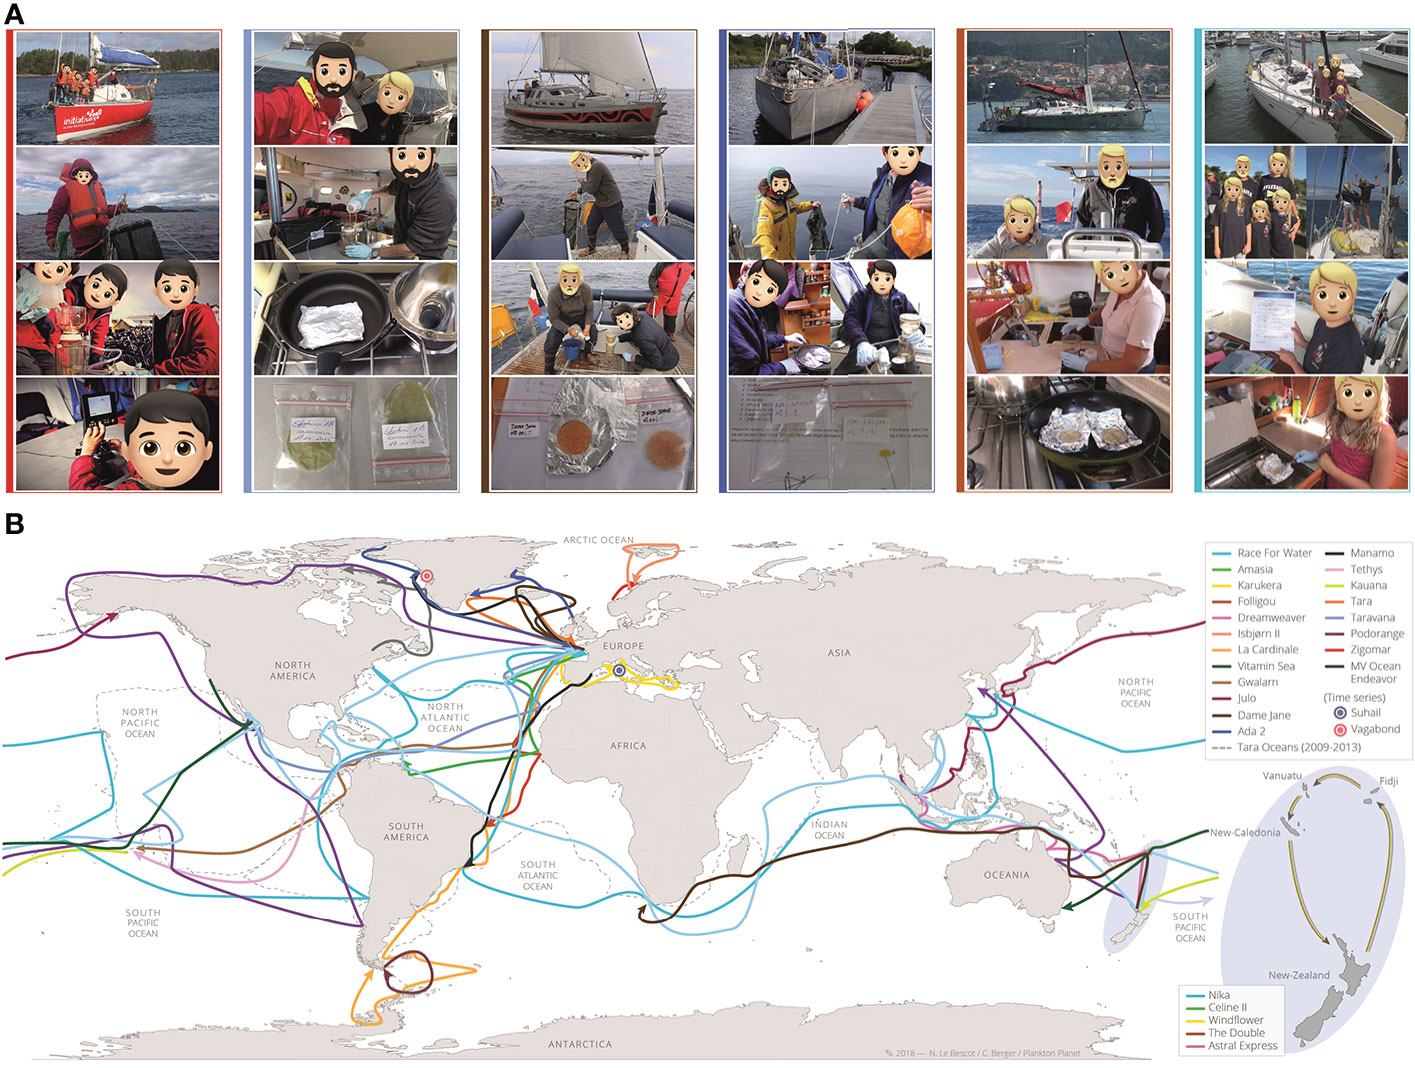
Figure 3 Planktonauts and their routes across the world ocean. (A) Examples of pictures sent by the planktonauts illustrating their actions at sea: towing and recovering the P2 plankton net, filtering, drying, and storing plankton samples, recording contextual data and observing plankton through a microscope. From left to right columns: N. Fabry and family on board Zigomar; M. and A. Hardy on board Taravana; J-M. and B. Viant on board Dame Jane; I. Autissier and crew on board Ada2; C. and D. Beaumont on board Folligou; C. McIntyre and family on board Nika. (B) Routes of the main 20 (of 27) pioneer planktonaut crews recruited during the pilot phase of the project, selected to maximize the geographic coverage and oceanographic and sampling conditions. Note the 5 boats from New Zealand who participated to a rally (May to November 2015) organized in collaboration with the ‘Island Cruising Association (http://www.islandcruising.co.nz).
The planktonauts were trained to perform the P2 protocol (Figure 2), individually or in small groups, and regular internet dialogues were established with them during their voyage to answer their questions and follow their progress. They regularly sent movies (e.g. https://vimeo.com/219660346, https://vimeo.com/164511514) and pictures (Figure 3A) of their actions at sea, allowing us to improve our training protocols and outreach. Their feedback on all steps of the protocol at sea (Figure 2) have been key to identify the bottlenecks and challenges to overcome for the implementation stage of the scientific program (see Discussion section).
After 15-20 min of net towing at a speed of ~2 knots (Supplementary Figure 1C), 500mL of concentrated seawater were split and manually filtered onto two replicate 10µm polycarbonate filter-membranes (diameter 47mm), dried at 70°C for 5 min in a pan (on the boat gas-cooker), and then stored at room temperature in a hermetic Ziploc bag with granular desiccants. Upon arrival in a port, samples were shipped to the Roscoff Marine Laboratory (Brittany, France) in a simple envelope via regular mail. In the laboratory, the samples were stored at -80°C and information related to samples was archived in a database together with contextual data.
Samples processing, DNA data generation and analyses
Total plankton DNA extraction and rDNA metabarcoding
DNA extraction was performed using a protocol modified from the NucleoSpin Plant Midi kit (Macherey-Nagel). One replicate filter of each sample was cut in small pieces and incubated for 2h at 56°C with 3.6mL of the lysis buffer PL1 and 250µL of proteinase K. The lysate was transferred to a large capacity NucleoSpin Filter (DNA Midi kit) and centrifuged for 10 min at 1,500 g. The eluate was transferred to a new tube and 1 volume of PC buffer was added. The mixture was loaded into the appropriate spin column and washed 3 times with the DNA wash solution. Total DNA was finally eluted twice with 150 µl of DNA elution buffer, and stored in sterile microtubes at -20°C. The amount of recovered DNA was quantified by dsDNA-specific fluorimetry using a Qubit 2.0 Fluorometer with Qubit dsDNA Broad Range and High Sensitivity Assays (ThermoFisher Scientific, Waltham, MA). The DNA quality was double-checked in a subset of samples by running 1 µl on 1.2% agarose gel for 45 min at 120V.
To address general questions of eukaryotic biodiversity over extensive taxonomic and ecological scales, the hyper-variable loop V9 of the Small Sub-Unit (SSU) ribosomal (r) RNA gene was targeted for the generation of amplicons by Polymerase Chain Reaction (PCR). This barcode presents a combination of advantages: (i) it is universally conserved in length and simple in secondary structure, thus allowing relatively unbiased PCR amplification across eukaryotic lineages followed by Illuminas sequencing, (ii) it includes both stable and highly-variable nucleotide positions over evolutionary time frames, allowing discrimination of taxa over a significant phylogenetic depth, (iii) it is extensively represented in public reference databases across the eukaryotic tree of life, allowing taxonomic assignment amongst all known lineages.
The first 184 DNA extracts were processed at the Roscoff Marine Laboratory. PCR amplification of the V9 region was performed using 28-bases tagged PCR primers 1389f 5’-CTTTCCCTACACGACGCTCTTCCGATCTTTGTACACACCGCCC -3’ and 1510r 5’-GGAGTTCAGACGTGTGCTCTTCCGATCTCCTTCYGCAGGTTCACCTAC -3’. The PCR mixture (25µL final volume) contained 10ng of template with 0.35µM final concentrations of each primer, 3% of DMSO and 2X of GC buffer Phusion Master Mix (Finnzymes). Amplifications were conducted following the PCR program: initial denaturation step at 98°C for 30 sec, followed by 25 cycles of 10sec at 98°C, 30sec at 57°C, 30sec at 72°C, and a final elongation step at 72°C for 10 min. Each sample was amplified in triplicate to get enough amounts of amplicons. Results from amplification were checked by running 1 µl of PCR product on a 1.2% agarose gel for 45 min at 120V. All replicates from each sample were then pooled and sent to the GeT Genotoul sequencing platform (Toulouse, France) for library preparation, and loading on 1 lane of Illumina sequencing HiSeq3000 per PCR product. 32 additional DNA extracts were PCR amplified and sequenced by the CEA Genoscope (Evry, France). Amplifications of the V9 from SSU rDNA were conducted with Phusion® High-Fidelity DNA Polymerase (Finnzymes) using the PCR primers 1389f 5’- TTGTACACACCGCCC -3’ and 1510r 5’- CCTTCYGCAGGTTCACCTAC -3’. The PCR mixture (25µL final volume) contained 10ng of template with 0.35µM final concentrations of each primer, 3% of DMSO and 2X of GC buffer Phusion Master Mix (Finnzymes). Amplifications were conducted following the PCR program: initial denaturation step at 98°C for 30 sec, followed by 25 cycles of 10sec at 98°C, 30sec at 57°C, 30sec at 72°C, and a final elongation step at 72°C for 10 min. Each sample was amplified in triplicate to get enough amounts of amplicons. PCR products were pooled after amplification and cleaned using AMPure XP beads using a DNA/beads ratio adapted to the length of the amplicon (1,8 Vol). Amplicon lengths were verified using a high-throughput LabChip GX microfluidic capillary electrophoresis system (Perkin Elmer, Waltham, MA, USA), and quantified with a Fluoroskan instrument. A negative control was included in each PCR experiment, as well as a positive control specific to the targeted gene marker. All libraries were prepared using the NEBNext DNA Modules Products and NextFlex DNA barcodes with 100 ng of purified PCR product as input. PCR products were end-repaired, A-tailed at the 3’end, and ligated to Illumina-compatible adaptors using the NEBNext DNA Modules and NextFlex DNA barcodes using a Biomek FX Laboratory Automation Workstation liquid handler (Beckman Coulter Genomics, Danvers, MA, USA), able to perform up to 96 reactions in parallel. After a 1x AMPure XP clean up, the ligated products were amplified using the Kapa Hifi HotStart NGS library Amplification kit, followed by 1x AMPure XP purification. All libraries prepared using the Biomek FX Laboratory Automation Workstation were quantified first by PicoGreen in 96-well plates. Library profiles were assessed using a high throughput microfluidic capillary electrophoresis LabChip GX system (Perkin Elmer, Waltham, MA, USA) and qPCR with the KAPA Library Quantification Kit for Illumina Libraries on an MXPro instrument. Libraries were loaded on 1 lane of Illumina sequencing HiSeq4000 with 20% of PhiX DNA spike-ins (to minimize the impact on the run quality of the low nucleotide diversity at the beginning of the reads, due to the presence of the primer sequences used for amplification), in order to obtain between 3 and 12 millions of paired-end reads 2x150 bp per sample.
Bioinformatic data processing
In order to compare P2 DNA metabarcoding data to the primary Tara Oceans (TO) eukaryotic metabarcoding dataset (De Vargas et al., 2015), we first merged raw reads from both datasets and applied the following bioinformatics steps. Paired Illumina™ MiSeq reads from the 214 P2 samples and the 883 samples from Tara Oceans (2009-2012) were assembled with vsearch v2.7.1 (Rognes et al., 2016) using the command fastq_mergepairs and the option fastq_allowmergestagger. Demultiplexing and primer clipping were performed with cutadapt v1.9 (Martin, 2011) enforcing a full-length match for sample tags and allowing a 2/3-length partial match for forward and reverse primers. Only reads containing both primers were retained. For each trimmed read, the expected error was estimated with vsearch’s command fastq_filter and the option eeout. Each sample was then dereplicated, i.e. strictly identical reads were merged, using vsearch’s command derep_fulllength, and converted to FASTA format. To prepare for clustering, samples were pooled and submitted to another round of dereplication with vsearch. Files containing expected error estimations were also dereplicated to retain only the lowest expected error for each unique sequence. Clustering was performed with Swarm v2.2.2 (Mahé et al., 2015), using a local threshold of one difference and the fastidious option. The representative sequences of each molecular operational taxonomic unit (OTU) were then searched for chimeras with the vsearch’s command uchime_denovo (Edgar et al., 2011). In parallel, the OTU representative sequences were pairwise compared to a custom version (https://doi.org/10.5281/zenodo.3768951) of the Protist Ribosomal Reference database PR2 (Guillou et al., 2013), using a global pairwise alignment approach (usearch_global vsearch’s command), and taxonomically assigned to their best hit (https://github.com/frederic-mahe/stampa/). In case of ties, the sequence is assigned to the last common ancestor of the references. OTUs with a score below 80% similarity were considered as unassigned. This custom reference database is an update of the V9_PR2 reference database used for the taxonomic assignation of the Tara Oceans metabarcodes (De Vargas et al., 2015). A schematic representation of the bioinformatic pipeline used herein together with quantitative details is available in the Figure 6 of the Supplementary Material.
Clustering results, expected error values, taxonomic assignments and chimera detection results were used to build a raw OTU table. Up to that point, reads that could not be merged, reads without tags or primers, reads shorter than 32 nucleotides and reads with uncalled bases (“N”) were eliminated. To create the “cleaned” OTU table, additional filters were applied to retain only: non-chimeric OTUs, OTUs with an expected error per nucleotide below 0.0002, and OTUs containing more than 3 reads or seen in 2 samples. The final OTU table, analyzed in this study, integrated the 214 P2 samples together with the 386 Tara Oceans samples collected in surface waters for 4 organismal size fractions (0.8-5, 5-20, 20-180, 180-2000 µm). This table, with no taxonomic filtration, was subsampled (rarefied) at the minimum number of reads observed for a sample (313,539 reads) for comparison of OTU richness between samples. Based on the rarefied OTU table, an OTU is considered as unique to P2 if it is present in at least one P2 sample and not present in any of the 386 Tara Oceans surface samples. Only OTUs assigned to Eukaryota with more than 80% of similarity were considered for ecological analyses (e.g. alpha and beta diversity, taxonomic composition). The plankton samples from ‘Objectif Plancton’ used to compare the preservation methods were processed independently using the same bioinformatic pipeline. Raw data were deposited at the European Nucleotide Archive (ENA) under the project ids PRJEB53961 and PRJEB53911, and OTU tables along with corresponding contextual data were also made available in Zenodo @: https://doi.org/10.5281/zenodo.6778240.
Results
Geographical coverage and cost of P2-pilot samples
Despite the relatively low number of samples recovered per boat (2 to 18), the widespread routes of many planktonauts (Figure 3B) yielded plankton samples from 258 sites across the world surface ocean in less than 1 year (Figure 4B). This is remarkable compared to the few tens of spatio-temporally relatively restricted stations usually sampled during classical oceanographic cruises, or even to the 147 sites sampled by the schooner Tara in 3 years during her first circumglobal expedition (Bork et al., 2015) (Figure 4B). Furthermore, the total cost of ~200 US$ per sample (including the price of the kit, training, sampling, shipping, and DNA extractions), which could be significantly reduced with increasing sampling frequency and decreasing sampling gears’ costs, is one to several orders of magnitude lower than sample cost on oceanographic vessels. The running budget of an open oceanographic research vessel is on the order of 30,000 US$/day. Therefore, a single research vessel traveling at 10 knots and stopping for one hour at each sampling station would have taken 8.6 months - and thus a minimum cost of 7.9 million US$ - to cover 56% of the total P2 sites sampled in slightly more than a year by the planktonauts (Supplementary Figure 3). Note that the average cost to equip and run a sailing boat for a transoceanic route is ~25,000 US$; all together, volunteer planktonauts thus offered ~90% of the cost of field work in sailing charges. This being said, we acknowledge that planktonauts are logistically constrained and will never be able to gather the sort of comprehensive bathymetric, oceanographic and physico-chemical data that oceanographic vessels routinely collect. P2 is not a substitute, but an invaluable complement to the intensive research cruise manned by experts.
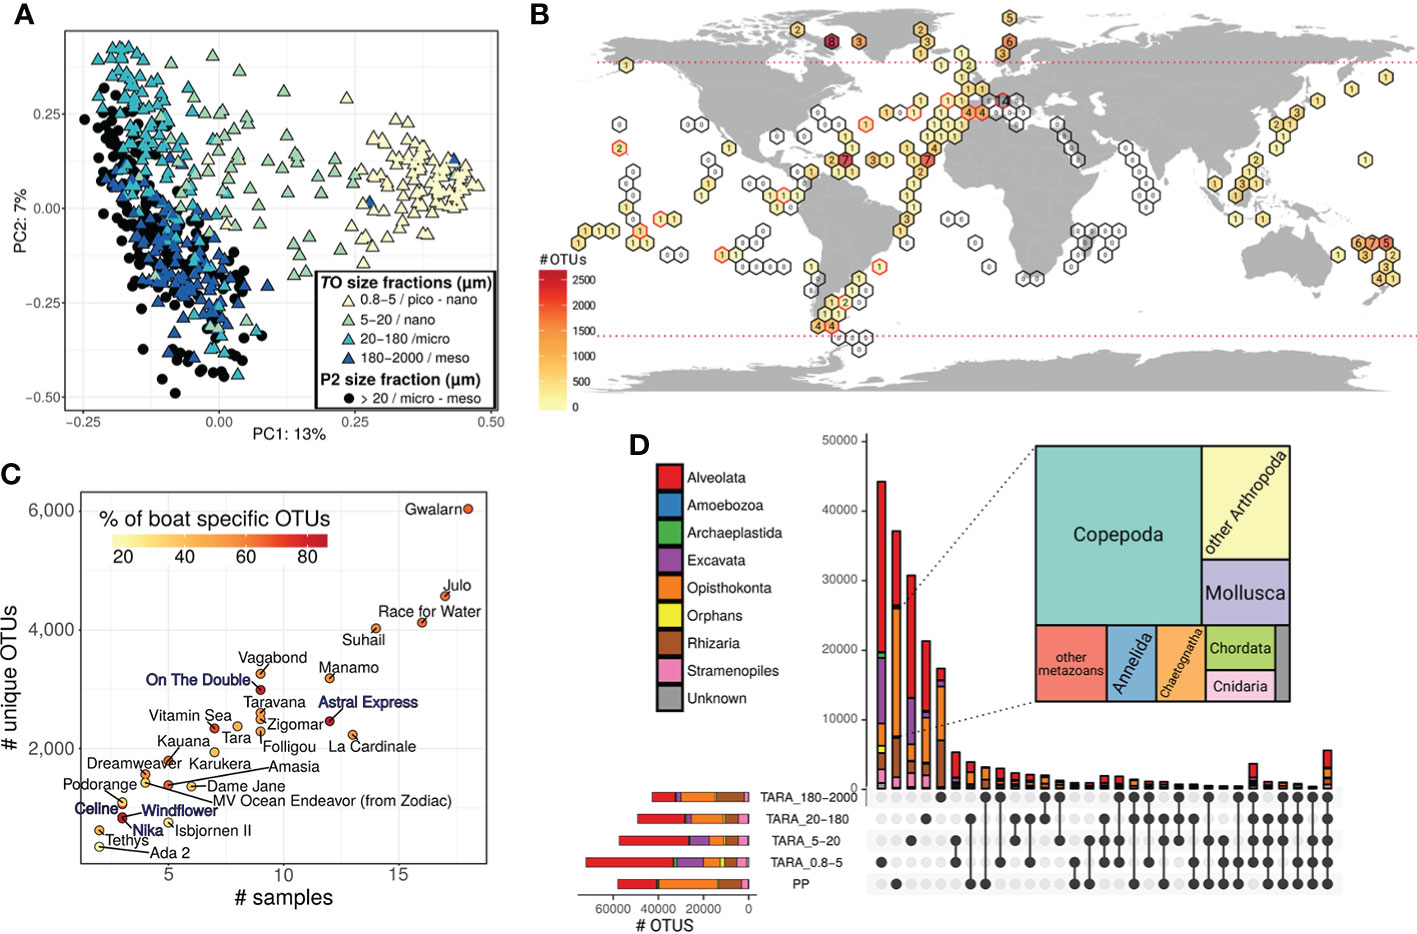
Figure 4 The extent, novelty, and community composition of P2 metabarcoding data. (A) Grouping of P2 (black dots) and TO (colored triangles) plankton communities from surface water according to taxonomic compositional similarity (PCA of Hellinger standardized abundances). Colors correspond to the different plankton size-fractions sampled in TO. (B) Geographic distribution and novelty of P2 sequenced samples as compared to TO samples. Sampled sites are aggregated in pre-defined geographic area (hexagons) for readability. Hexagons containing P2 samples are filled with a color gradient corresponding to the number of rDNA OTUs that were not detected in TO (see colored scale). Number inside the colored hexagons indicate the number of samples collected in the area. Empty hexagons are area with only TO samples. Hexagons with red-line borders are area with both P2 and TO samples. Horizontal dotted red lines indicate the Northern and Southern 60 Degree latitudes; only samples comprised between these lines were kept for ecological comparative analyses between P2 and TO data. (C) Novel plankton diversity (rDNA OTU) uncovered by each boat. Each dot represents a boat, with its position along the X and Y axes corresponding, respectively, to the number of samples collected, and the number of OTUs recovered by the boat that were not detected in TO. The color-gradient indicates the % of novel P2 OTUs that are unique to the particular boat. Note the higher values for the New Zealander crews (blue characters). (D) UpSetR plot displaying the taxonomic richness, divided by eukaryotic super-groups, shared between P2 (>20μm) and TO size-fractionated samples. The horizontal bars show each individual complete dataset, while vertical bars correspond to the number of OTUs shared between particular datasets (intersections given by the dots under the vertical bars). The tree map shows the taxonomic composition of the 18,430 unique Opisthokonta OTU unveiled in P2, with a dominance (46%) of copepods.
High-quality data for global plankton biodiversity and ecology
18 months after the launch of P2, we had extracted total DNA from 214 plankton samples collected by 27 boats, PCR amplified rDNA metabarcodes from each sample, and generated a total of 453 million rDNA reads to assess the diversity of eukaryotic plankton (>20 µm) in the explored surface water masses. The methods used for DNA extraction, sequencing, and analyses were essentially developed in Tara Oceans (De Vargas et al., 2015; Alberti et al., 2017); the metabarcode used (V9 SSU rDNA) has proven successful to measure the ecological diversity of total eukaryotic plankton (De Vargas et al., 2015), focus eco-evolutionary analyses on specific groups (Malviya et al., 2015; Cabello et al., 2016; Flegontova et al., 2016; Mordret et al., 2016), reconstruct plankton ecological networks (Lima-mendez et al., 2015), or revisit plankton macro-ecological patterns (Ser-Giacomi et al., 2018; Ibarbalz et al., 2019), or biogeochemical processes (Guidi et al., 2016).
Integration of P2 data into Tara Oceans data
Tara Oceans (TO) data are today a gold standard for ocean plankton ecology, and we first merged the P2 data into the global TO metabarcoding dataset for quality checks and comparison of content. As P2 samples were collected by different sailors, sometimes in harsh conditions, we first checked for the presence of obvious biases, such as the sequencing of bacterial contaminants. After taxonomic assignment of the rDNA reads, we found that 1.9% of Plankton Planet reads were assigned to prokaryotes whereas prokaryotes represented 0.5% of Tara Oceans reads. This difference is explained by the presence of few outlier samples in P2, typically explained by on-board major processing errors (see Supplementary Figure 4). The median percentages of prokaryotic reads, 0.17% and 0.11% for TO and P2 samples respectively, are, however, comparable (and expected given the very large taxonomic spectrum of the eukaryotic PCR primers used that also amplify prokaryotic genes).
We then compared plankton community composition between P2 and TO samples. Principal component analysis confirmed the primary influence of organism size on community structuring (De Vargas et al., 2015), with the pico-nanoplankton (0.8-5 µm) displaying stronger cohesiveness than micro- (20-180 µm) and meso- (180-2000 µm) planktonic communities (Figure 4A). P2 samples clearly fell within the range of variability of TO micro- and meso-plankton samples, reflecting the P2 protocol that uses a 20µm mesh-size net and does not apply any pre-filtration. P2 and TO micro/meso- plankton size fractions samples spread together along the second axis of the PCA whose variance (7%) is the result of multiple physico-chemical (dispersal and mixing, variations in temperature, light, nutrients, etc) and biological (species interactions, life cycles, behavior, acclimation/adaptation) processes.
Despite the overall similarity between P2 and TO micro/meso-plankton samples (Figure 4A), the P2 sampling effort did unveil significant novelty in global plankton diversity. All P2 samples produced rDNA OTUs that had not been reported in the TO world ocean survey (Figure 4B), and the number of discovered OTUs clearly increased with sampling effort, both per area (Figure 4B) and per boat (Figure 4C). Each planktonaut crew unveiled between 62 and 3,907 unique OTUs, unseen by either Tara or any other P2 boats, with a discovery rate partly explained by the eccentricity of the sampled areas relative to TO sampling sites. Note for instance the high percentage of boat-specific OTUs (>75%) in the New Zealand area (Figure 4C).
We further dug into the composition of plankton diversity unveiled by P2 versus TO samples. P2 samples yielded a total of 57,994 OTUs, as compared to 158,716 for TO surface ocean samples. Phylogenetic breakdown of the rDNA data (Figure 5) shows the overall taxonomic similarity, in both abundance and richness, between data from P2 and the TO micro- and meso-planktonic size fractions. While 8,220 OTUs (mostly metazoans and alveolates) were shared exclusively between P2 and the TO larger (>20 µm) organismal size fractions, only 1,981 were common with the smaller (<20 µm) TO plankton size fractions (Figure 4D). This emphasizes the consistency of the organisms harvested by P2 and TO in comparable plankton size-fractions, and provides organismal data support for our principal component analysis (Figure 4A). Remarkably, however, more than half of all P2 OTUs (37,163) were actually not seen in any plankton size fractions of the TO circumglobal dataset (Figure 4D). These correspond mostly (~78%) to Alveolata and Opisthokonta, with an overwhelming majority (98%) of relatively large metazoans (copepods, other arthropods, mollusks, see insert in Figure 4D). This major difference is most likely explained by the fact that the P2 sampling protocol does not involve an upper-size filtration while the TO larger size-fraction was constrained by a sieving at 2mm (micro-plankton: 180-2000 µm), resulting in a more complete survey of larger plankton in P2.
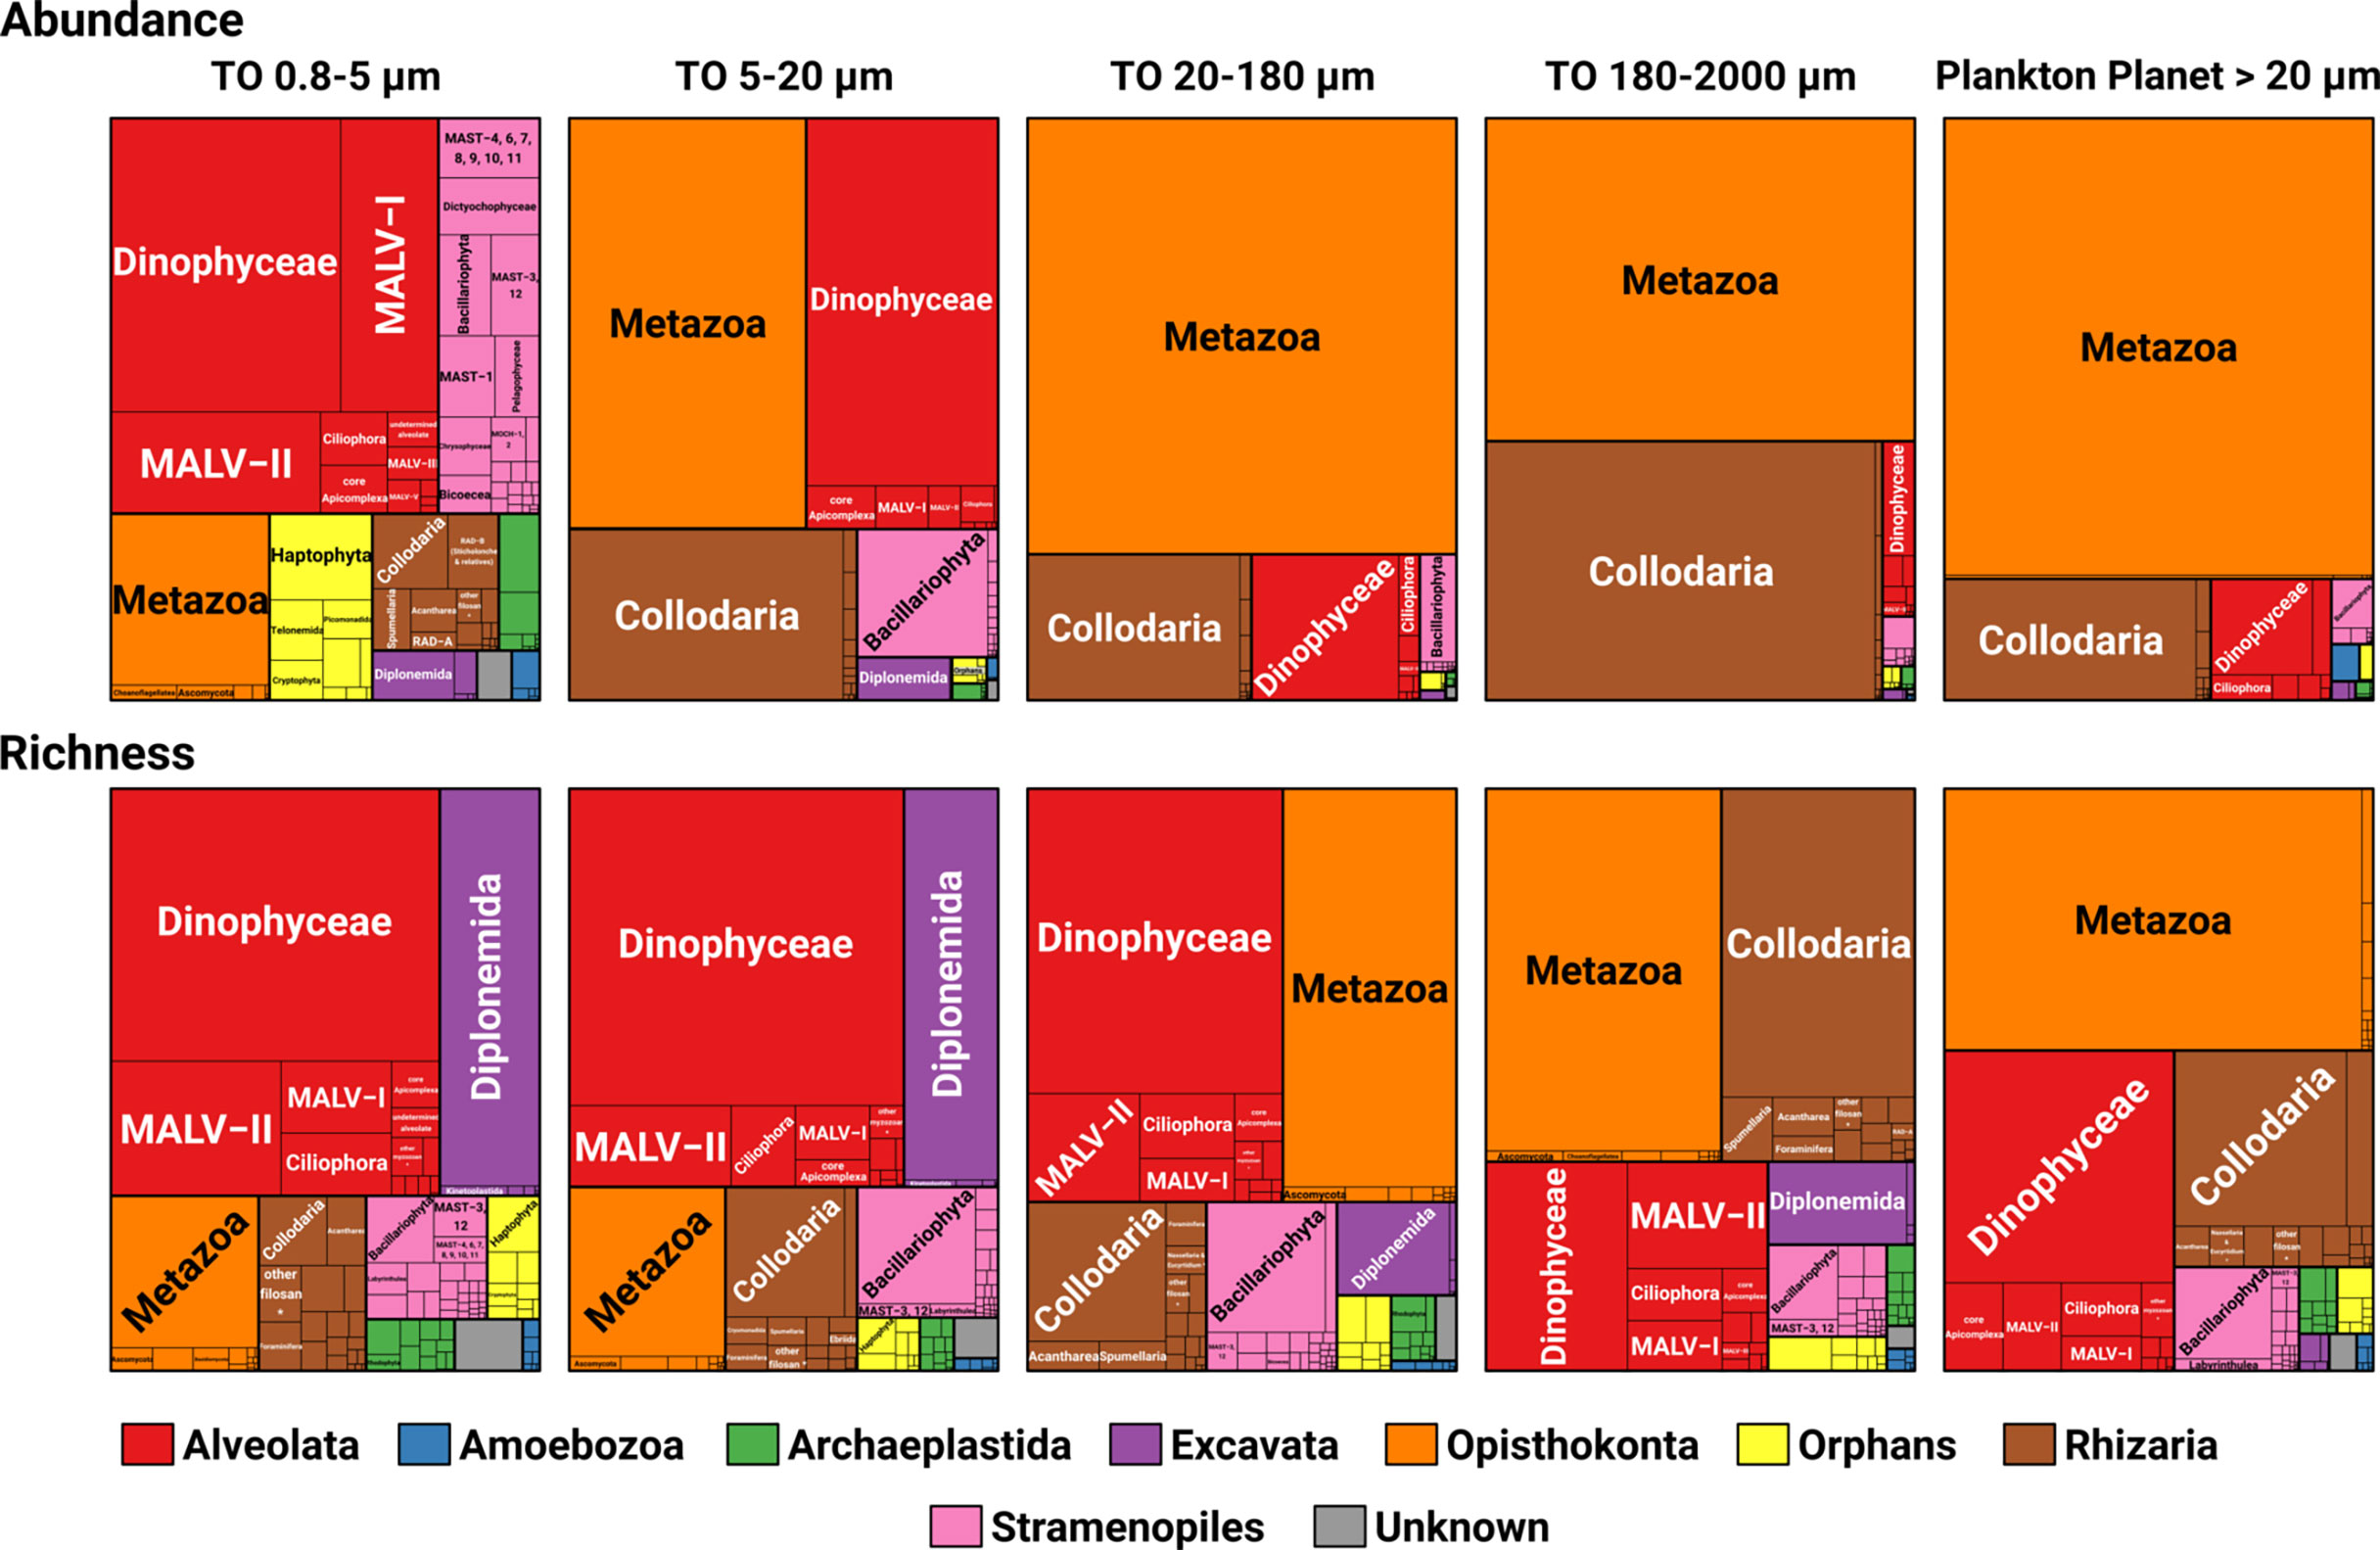
Figure 5 Phylogenetic breakdown of the Tara Oceans and Plankton Planet global ocean metabarcoding datasets at the eukaryotic supergroup and ‘taxogroup’ levels. All V9 rDNA reads and OTUs with genetic similarity to a eukaryotic reference sequence ≥80% were retained and taxonomically assigned. The tree-maps display the relative abundance (upper part) and richness (lower part) of the different taxonomic groups in TO plankton size fractions and P2. The category ‘Orphans’ contains the known but phylogenetically uncertain deep-branching lineages (i.e. Haptophyta, Telonemida, Picomonadida, Katablepharidida, Cryptophyta, Centrohelida and Apusozoan); ‘Unknown’ corresponds to OTUs assigned to two different supergroups.
In order to check the value of P2 data at finer-grained taxonomic resolution, we explored the phylogenetic and organismal size-fraction distribution of P2 and TO OTUs assigned to a well-known phytoplankton group, the dinoflagellate order Peridiniales (Figure 6). Most Peridiniales OTUs observed in TO were also found in P2, except a few taxa particularly abundant in the piconano- and nano- size fractions (<20 µm). The relatively large, microplanktonic taxa from the genus Protoperidinium were particularly well represented in the P2 dataset, with four OTUs unseen in the TO dataset. Note also the presence of many Blastodinium and Brandtodinium OTUs, which are well-known parasites (Skovgaard et al., 2012) and photosymbionts (Probert et al., 2014) of respectively copepods and radiolarians, and are thus part of the meso- and macro-plankton in their symbiotic stage. Overall, these analyses confirm the quality of the P2 data to assess plankton diversity from the OTU to the community level.
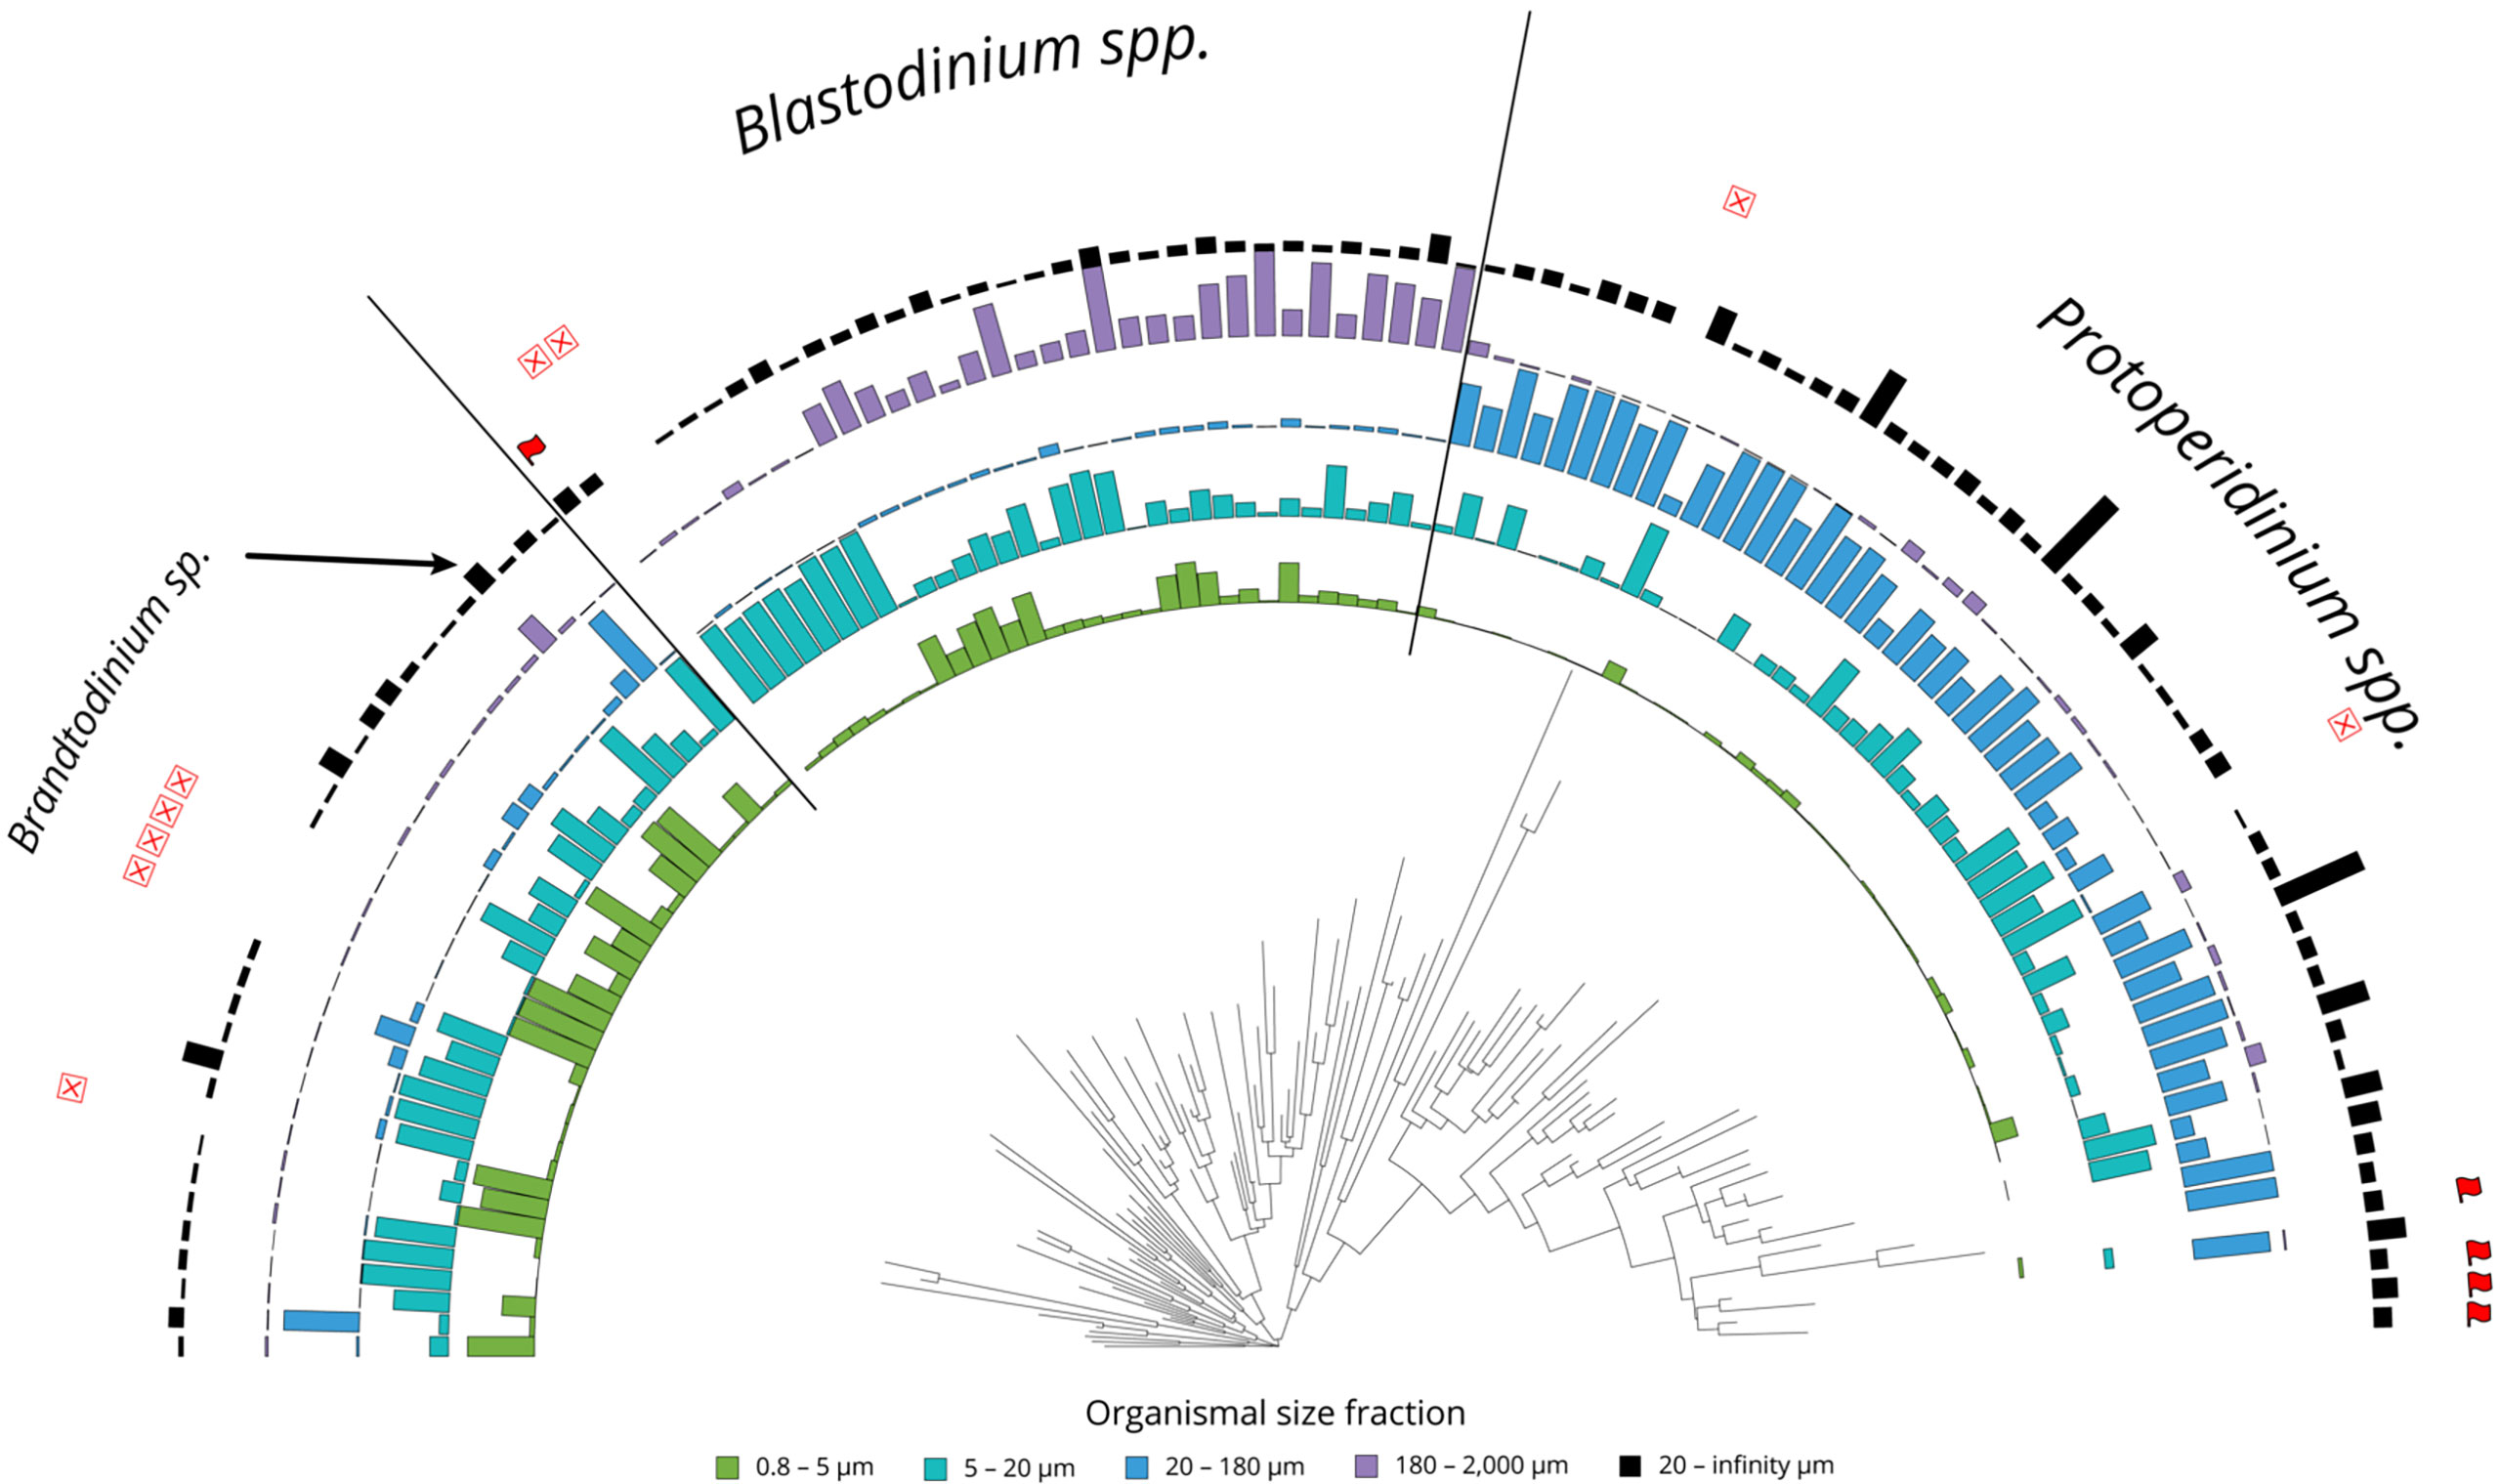
Figure 6 Phylogenetic and plankton size fraction distribution of the most abundant OTUs assigned to Peridiniales dinoflagellates in both the P2 and TO metabarcoding datasets. The 100 most abundant Peridiniales OTUs in TO and the 50 most abundant in P2 were selected, together representing 119 unique OTUs. Colored bars indicate the proportion of mean relative abundance of each OTU amongst the four TO plankton size fractions. Black bars indicate the mean abundance (log transformed and scaled to 1) of each OTU amongst all P2 samples. Flag and red crosses symbols indicate OTUs observed respectively only in P2 and only in TO.
Insights into multiscale plankton ecology using P2 data
We finally used P2 metabarcoding data to explore the consistency of macroecological patterns at both global and local scales, across the data collected by the different boats and planktonauts who sampled plankton independently. At the world ocean scale, the P2 data displayed an increase in alpha diversity (Shannon index) from both poles to the tropics (Figure 7A). On a more regional scale, the five planktonaut crews from New Zealand collected enough samples to highlight a biogeographical pattern in this area, with no apparent bias linked to the multiplication of samplers. Clustering of the plankton communities based on their OTU composition into three groups fitted with the three legs of the navigation loop: New Zealand - Fiji; Fiji - New Caledonia, New Caledonia - New Zealand (Figure 7B).
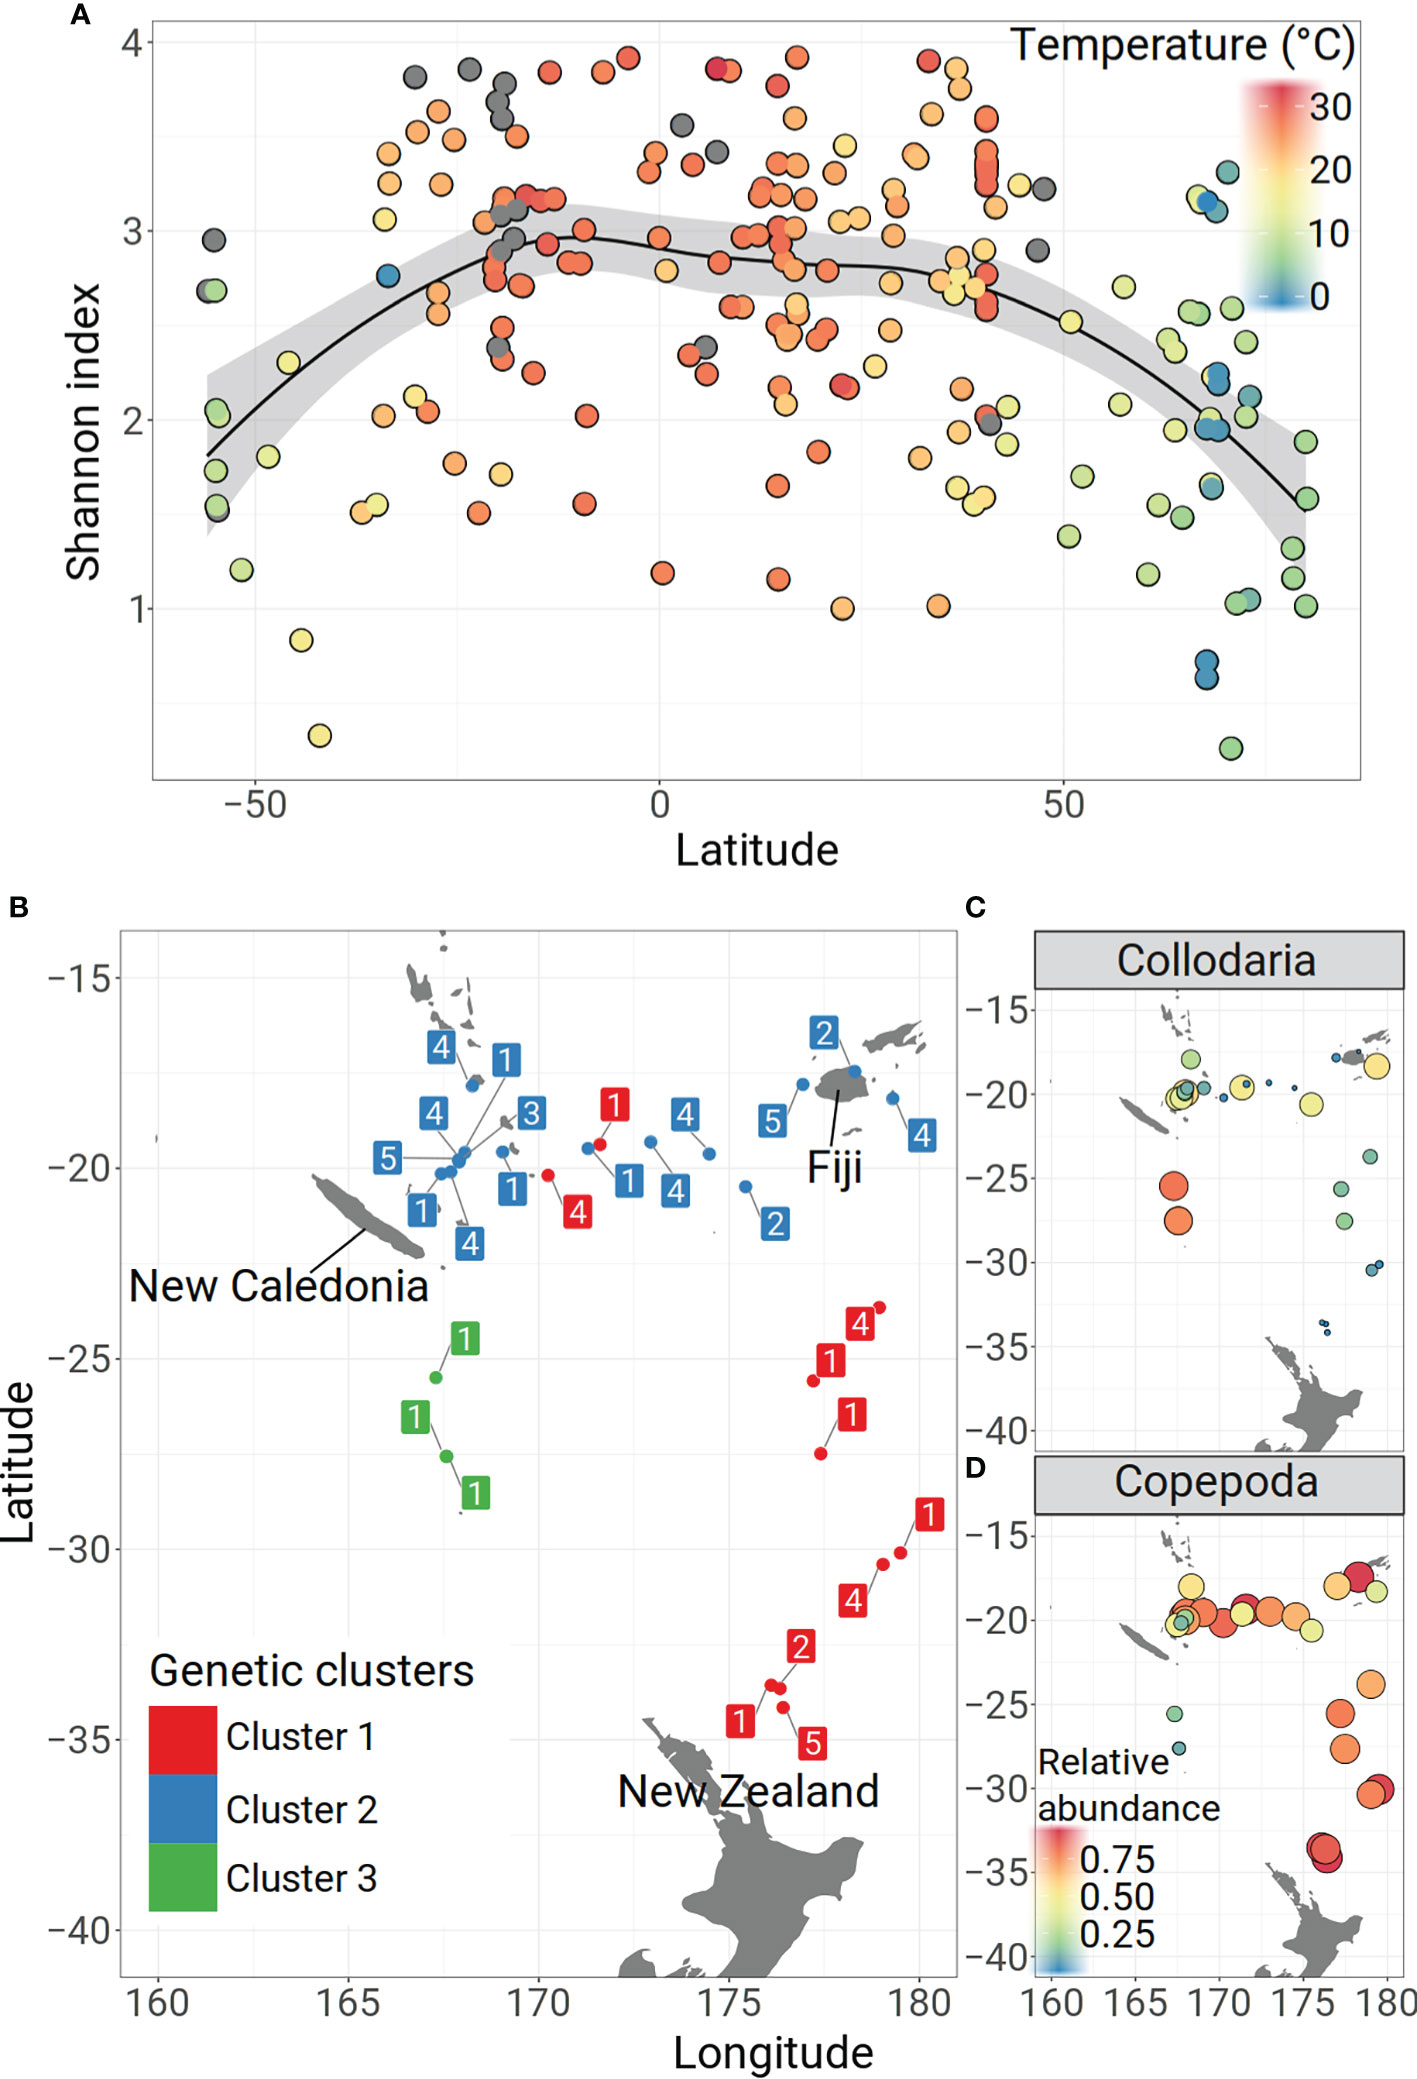
Figure 7 P2 insights into plankton ecology. (A) Global ocean latitudinal diversity gradient. Scatter plot showing the evolution of the Shannon index (alpha diversity) of all P2 samples (colored dots) along latitudes. The color gradient is related to the sea surface temperature measured by the planktonauts during plankton sampling. LOESS regression curve42 fitting the data. (B–D) Plankton biogeography at the scale of a navigation loop (the ‘kiwi loop’, around New Zealand, Fiji and New Caledonia, Figure 2B). (B) The samples from this loop (colored dots) were clustered into three groups based on their OTU composition (Jaccard distance) using the Partitioning Around Medoids (PAM) algorithm 43. See Sup. Figure 5 for details. Two samples from the Nika boat, considered as outliers (and collected very close to the coast), were excluded from the analysis. Squared numbers close to each sample site correspond to the sampling boat (1: Astral Express; 2: Celine; 3: Nika; 4: On the Double; 5: Windflower); the colors represent the genetic clusters. C, D Relative abundances of the two most abundant taxonomic groups, the collodarians (C) and the copepods (D). The color gradient and the size of the circles both correspond to the relative abundance.
Contextual environmental data
Given the importance of the abiotic environment in structuring planktonic ecosystems (Richter et al., 2019; Logares et al., 2020), we also included the measure of basic environmental parameters at each P2 sampling site. Besides UTC date/time for each sampling event, the planktonauts were asked to record surface water temperature using the water temperature sensor of their boat and/or mercury thermometer (Figure 7A), and broad-band spectral water reflectance using the Hydrocolor App (Leeuw and Boss, 2018). In situ temperature data were compared with those from the NASA’s MODIS-Aqua satellite, and a good match – on average better than 1°C – was observed. We also developed automated procedures to extract remote sensing ocean color data at each sampling site (https://github.com/OceanOptics/getOC), providing bulk information on chlorophyll-a concentration, as well as suspended dissolved and particulate materials in the target water. In the future, these can not only assist planning of sampling stations at sea in near-real time, but also allow analyses linking ocean color to phytoplankton functional type measured by DNA metabarcoding and the PlanktoScope (see below and Pollina et al., 2022). On the other hand, the Hydrocolor App has been compared to commercial instrumentation and found to correlate well (Yang et al., 2018); it is hoped it will help relate water reflectance to in-situ plankton communities, increasing further the utility of remote sensed ocean color.
Discussion
Operational PlanktoKit integrating eco/morpho/genetic data
In the pilot stage of ‘Plankton Planet’ described herein, we have witnessed the enormous desire of sailors to sample ocean life during their voyages around the globe. We have also generated what is, to our knowledge, the first citizen-based consistent planetary dataset to explore plankton biodiversity and ecology. The DNA metabarcoding data generated from the samples collected by the 27 crews of planktonauts (i) displayed a quality comparable to that of the Tara Ocean metabarcoding dataset, (ii) unveiled significant genetic novelty in zooplankton, and (iii) uncovered consistent plankton ecological patterns at both global and local scales. At the world ocean scale, the full dataset displayed a Latitudinal Diversity Gradient that is well known from terrestrial and marine ecosystems (Willig et al., 2003), and has been previously recorded in more restricted planktonic groups (e.g. (Fuhrman et al., 2008; Dolan et al., 2016; Boltovskoy and Correa, 2017) and across plankton kingdoms (Ibarbalz et al., 2019). In the New-Zealand area, the metabarcoding data clustered into three ‘eco-genetic’ regions along the navigation loop: (i) a first portion characterized by high abundances of copepods (Figure 7D) and important richness of indicator OTUs (Dufrene and Legendre, 1997) amongst Marine Alveolates (MALV), Acantharia, Dinophyceae and also copepods (Supplementary Figure 5A); (ii) a second portion from Fiji to New Caledonia with lower diversity of indicator OTUs and lower genetic homogeneity (Supplementary Figure 5B), which may be due to the variability of habitats characterizing this region full of islands; (iii) a third portion (genetic cluster 3, Figure 7B) characterized by low abundances of copepods and high abundances of collodarians (Figure 7C), with indicator OTUs belonging to collodarians and spumellarians, diatoms (Bacillariophyta), copepods and choanoflagellates. All boats have sampled plankton in at least two different eco-genetic regions, reinforcing both the robustness of the protocol and the accuracy of the emerging plankton biogeography.
However, along the way, we also identified critical challenges to overcome.
Sampling total plankton at sailing-speed
In the P2 pilot project, the planktonauts were asked to maneuver their boats at a speed of less than 2 knots when towing the 20μm-mesh size plankton net. This requests uncomfortable sailing operations impacting the cruising speed, and it was identified as the primary limiting factor for denser sampling. We have therefore been working on the design of new miniaturized high-speed nets (von Ammon et al., 2020; Mériguet et al., 2022, inspired by our successful experience during the Tara Pacific expedition (Gorsky et al., 2019), as well as simple manual pumping system allowing aspiration of seawater at cruising speed, followed by filtration through a small net system installed on board. The latter device has the advantage of being able to collect pristine water that can also be used to extract DNA/RNA from the smaller plankton size fractions enriched in bacteria, archaea and viruses. Indeed, long-term monitoring of marine plankton systems will ultimately require a sampling protocol covering the 8 orders of plankton organismal size-magnitude, from viruses to animals (Lombard et al., 2019; Sunagawa et al., 2020), in order to assess both top-down and bottom-up ecological mechanisms shaping the ecosystem.
Collecting morphological and behavioral plankton data at sea
The revolution in environmental DNA/RNA sequencing provides the power to comprehensively assess plankton taxonomic and metabolic diversity (Sunagawa et al., 2020). However, meta-omics data convey relatively poor information on the shapes, structures and behaviors of organelles, cells and organisms, which may well be the primary drivers for the self-organization of contemporary ecosystems and their emergent functions (Karsenti, 2012). Fundamental phenotypic mechanisms such as symbioses sensu lato, selective feeding, vertical motions and migrations (Krishnamurthy et al., 2019), and many other unknown complex cellular and organismal behaviors, need to be identified and quantified in the context of the seascape if we ever want to reach a mechanistic pheno-genomic understanding of ecosystem patterning and functioning in the ocean.
Over the last few years, we have thus developed the PlanktoScope (see companion papers by Pollina et al., 2022. and Mériguet et al., 2022), an affordable, miniaturized, modular and evolvable, open source imaging platform for citizen oceanography. For a cost of less than 1000 US$ in parts, the PlanktoScope allows both quantitative imaging of microplankton communities through a fluidic module before their storage for total DNA/RNA extraction and genetic analyses in the lab, and high-quality imaging/filming of individual cells or organisms under different types of illumination. Planktonic organisms are notably fragile, versatile, and ephemeral, and the scarcity of live images and movies of plankton at sea constitutes arguably the major knowledge-gap in oceanography, today’s oceanographers spending most of their time behind their office computer screens or analyzing in the lab fixed and thus highly-altered plankton samples. Beyond generating quantitative phenotypic data complementary to DNA metabarcoding, the PlanktoScope can trigger an emotional shock in each planktonaut discovering the beauty of the marine microbiome, changing their view of the ocean forever and further driving their will to explore and preserve the invisible life thriving under their boat.
Toward seatizen field-Aquascopes for perennial cooperative monitoring of the global aquatic microbiome
Today we have developed all parts to assemble a stable P2 PlanktoKit 1.0 allowing any engaged seatizen to generate consistent plankton eco/morpho/genetic data directly in the field. The PlanktoKit 1.0, which costs less than $3,000 in parts, consists of a cruising-speed plankton collection system (von Ammon et al., 2020), a PlanktoScope (Pollina et al., this volume), a new cost-effective plankton DNA collection-kit we call the ‘Lamprey’, and a tablet computer to drive the PlanktoScope, record all contextual and meta-data, and visualize and record plankton images and movies. We have shown that these frugal tools deployed from sailing boats can generate consistent, planetary scale genetic (this paper) and morphological (Mériguet et al., 2022) data, paving the way for the Plankton Planet vision (Box 1). Deployment of the first kits on key navigation loops and routes will start in 2023 in the Atlantic oceans as part of the European research program AtlantEco. We believe that implementation of a perennial and self-sustainable survey of the world ocean surface plankton could happen by 2030, depending on our capacity to organize the synergies between seatizens (crews of all kinds of boats - pleasure and racing yachts, commercial, fishing, and defense vessels - fishermen and aquaculturists, managers), makers and engineers, and reseachers. This would bring critical new knowledge and outputs for human societies sharing the blue planet (Box 2).
Box 2. Perspective outputs of Plankton Planet.
Oceanography 3.0 ecosystem
● An international fleet of planktonauts to act as sentinels and the collective consciousness of the biological health of our oceans.
● An evolvable toolkit of affordable, scientifically relevant instruments for seatizen-based assessment of aquatic (marine and freshwater) biodiversity and ecosystems.
● An ever-growing cryo-bank of global ocean DNA samples, archiving the memory of our changing oceans for future generations and technologies.
● A continuous flow of standardized ocean microbiome imaging and genetic data at the planetary scale, available for fundamental and applied science, policy-makers, and education.
Blue-sky science
● Unique long-term monitoring of the distribution and evolution of global plankton biodiversity in our fast-changing ocean; including analysis of the impacts of warming, acidification, and de-oxygenation.
● Novel understanding of abundance, structures, functions, and behaviors of plankton life via the billions of images and movies of planktonic organisms generated at sea using PlanktoScopes.
● Incorporation of high-resolution global-scale biological data into efforts to model the dynamics of ocean ecosystems and ocean-climate interactions.
Applied science & policies
● Detection of invasive, toxic, or economically relevant species at the planetary scale.
● Evaluation of the health of oceanic regions based on species content, species richness, and trends in time.
● Assessment of ocean biogeographic zones (“seascapes”) for optimal design of marine protected areas in the high seas (e.g. ecosystems with high capacity for carbon pumping).
● Linking of data on plankton communities (including fish gametes and larvae, and eDNA) to fish-catch data for robust prediction of fish stocks.
Education through ‘Plankton & Arts’
● Collective awareness of the ocean microbiomes and their planetary impact, both directly (through the PlanktoScope) and indirectly via the shared images, movies, and 3D prints of plankton. Educational tools will notably be distributed by planktonauts in remote countries and islands whose communities interact with and depend on the marine ecosystem.
At the core of our long-term vision, the principles applied to development of the PlanktoScope (Pollina et al., 2022) should be extended to co-construct a field-AquaScope for seatizen exploration of aquatic eco-systems, and the concept could be easily applied for the exploration of other planetary biomes. We foresee the field-AquaScope as a miniaturized platform that can host modules and sensors to measure the critical biological, but also (bio)chemical, and physical parameters of any aquatic eco-system. Each module (including the PlanktoScope) is co-developed by small international and interdisciplinary teams of (i) researchers who define the scientific specifications to address fundamental question in global ecology, (ii) mariners and citizen samplers who assess practical user-constraints linked to specific field conditions (e.g. on-board sailing boats or cargo-ships), and (iii) makers and engineers who design and construct the frugal modules to measure given parameters. The Plankton Planet ecosystem will provide overall coordination to ensure that all modules can be fully integrated into the miniaturized field-laboratory and generate good-quality homogenous data that are shared in public databases.
Over the last century, societies have spent phenomenal amounts of money to discover the properties of the infinitely small (atoms and cells) and the infinitely large (weather, planets and stars, and the universe). But it is in between these extremes that we find arguably the most complex object in the known universe: eco-systems, i.e. self-organized and evolving life networks that interact with physico-chemical processes at micro- to planetary scales. Ecosystems have shaped the Earth atmosphere and biogeochemical cycles, they currently buffer climate change while providing sources of food and medicine, they will determine the future habitability of our planet and the fate of humanity. Due to their extreme complexity, integrating biology, chemistry, and physics, ecosystems have long escaped holistic quantitative assessment. Today the tools and methods exist, in particular automated sequencing and imaging, as well as artificial intelligence and massive computing to collect and integrate the layers of big data needed to understand eco-systems. The major challenge is to develop the new generation of affordable tools that can be deployed in a systematic manner across the spatio-temporal dimension of the Earth system. Plankton Planet proposes a coherent and frugal approach to overcome this challenge, at the interface of science and society, using one of the simplest biomes – marine waters- as a case study. Clearly being at the onset of planetary biology, we hope that Plankton Planet will contribute to reaching a profound understanding of our habitat in the decades to come, and to learning how to live in synergy with the biosphere.
The plankton planet core team
The ‘Plankton Planet’ core team includes: Romain Bazile (Seatizen for Plankton Planet, SBR, Roscoff, France), Emmanuel Boss (University of Maine, Orono, USA), Guillaume Bourdin (University of Maine, Orono, USA), BB Cael (NOC, Southampton, UK), Roberto Casati (CNRS IJN, Paris, France), Sébastien Colin (MPI Tübingen, Germany), Colomban de Vargas (CNRS SBR, Roscoff, France), Gabriel Gorsky (Sorbonne Université, LOV, Villefranche/Mer, France), Damien Guiffant (Seatizen for Plankton Planet, SBR, Roscoff, France), Nils Haentjens (University of Maine, Orono, USA), Nicolas Henry (CNRS SBR, Roscoff, France), Adam Larson (Stanford University, Stanford, USA), Noan Le Bescot (Seatizen for Plankton Planet, SBR, Roscoff, France), Fabien Lombard (Sorbonne Université, LOV, Villefranche/Mer, France), Gilles Mirambeau (Sorbonne Université, OOB, Banyuls/Mer, France), Clémentine Moulin (Tara Ocean Foundation, Paris, France), Anna Oddone (Seatizen for Plankton Planet, SBR, Roscoff, France), Manu Prakash (Stanford University, Stanford, USA), Christophe Prazuck (Institut de l’Ocean, Sorbonne Université, Paris, France), Vincent Raimbault (CNRS LAAS, Toulouse, France), Clara Trellu (Seatizen for Plankton Planet, SBR, Roscoff, France), Romain Troublé (Tara Ocean Foundation, Paris, France).
Data availability statement
All raw and secondary data produced and analysed in this study are publicly available. Raw sequencing data were deposited at the European Nucleotide Archive (ENA) under the project ids PRJEB53961 and PRJEB53911, and OTU tables along with corresponding contextual data are available in Zenodo: https://doi.org/10.5281/zenodo.6778240.
Author contributions
CdV: Founded Plankton Planet, conception and design of the work, data analysis and interpretation, wrote the manuscript, supervised the study NLB: study design, manuscript edition, field work TP: study design, logistical support NHe: data analysis SR: study design, data production SC: study design, constructive comments NHa: data analysis MC: field work, logistics CalB: study design, logistics DLG: instrument design JD: constructive comments, logistics FM: data analysis JP: data production EM: logistical support CalB: field sampling MH: field sampling the P2 core team: critical review of the work and manuscript DG: administration, logistics IP: critical revision of the article DFG: study design AA: study design GG: constructive comments MF: study design XP: study design RT: logistical support BC: study design FB: study design EB: design and supervision of the work MP: design and supervision of the work All authors revised and edited the manuscript, and approved the version sent for publication
Funding
The Plankton Planet pilot project was made possible by seed-funding from the Richard Lounsbery Foundation. Additional funding came from the French Government “Investissements d’Avenir” program OCEANOMICS (ANR-11-BTBR- 0008) and National Research Agency grant CORALGENE (ANR-17-CE02-0020), the ‘Plankton Arts’ grant from the Fondation d’Entreprise Total, the New Zealand Royal Society Dumont-D’Urville (DDU-CAW1501) and Strategic Seeding (16-CAW-008-CSG) Funds, the Cawthron Institute, as well as the Okeanos, Tara Ocean, and Schmidt Futures Foundations.
Acknowledgments
We are deeply grateful to the pioneer planktonauts: E. Abadie on board Manevai, I. Autissier on board Ada 2, R. Barnaud on board Kauana, C. Beaumont on board Folligou, E. Brossier on Vagabond, K. & K. Brownie on board Astral Express, V. Chirié on board Dreamweaver, I. Corrias on board Attila 3, Q. d’Avout on board Vitamin Sea, B. de Ravignan on board La Cardinale, M. Denis on board Isbjørn II, E. Di Iorio on board Suhail, B. Dumontet on board Ainez, E. Dupuis on board Vaihere, N. Fabbri on board Zigomar, Y. Gladu on board Tethys, J. Goulias on board Gwalarn, M. Hardy & A. Schnarwiler on board Taravana, P. Laparre on board Amasia, A. Marchandise on board Karukera, L. Marie on board Vagabond, J. & L. Martin on board Windflower, C., L., G., O. & R. McIntyre on board Nika, M. & C. Stephens on board The Double, B. Monégier on board Podorange, D. & S. Patterson on board Celine, Lorena Piana on board Giulia, A. Schmid on board Julo, M. Simeoni on board Race for Water, Students on Ice on board the MV Ocean Endeavor, Tara’s crew on board Tara, S. Valcke on board Manamo, & JM. Viant on board Dame Jane. We thank also Pierre Mollo, Francoise Gaill, Éric Karsenti, Paul Falkowski, Étienne Bourgois, Catherine Chabaud, Roland Jourdain, Isabelle Autissier, Raphaela le Gouvello, Daniel Richter, Chris Cornelisen and Gilles Boeuf, for their continuous advice and support. This article is contribution number 1 of Plankton Planet.
Conflict of interest
The authors declare that the research was conducted in the absence of any commercial or financial relationships that could be construed as a potential conflict of interest.
Publisher’s note
All claims expressed in this article are solely those of the authors and do not necessarily represent those of their affiliated organizations, or those of the publisher, the editors and the reviewers. Any product that may be evaluated in this article, or claim that may be made by its manufacturer, is not guaranteed or endorsed by the publisher.
Supplementary material
The Supplementary Material for this article can be found online at: https://www.frontiersin.org/articles/10.3389/fmars.2022.936972/full#supplementary-material
References
Alberti A., Poulain J., Engelen S., Labadie K., Romac S., Ferrera I., et al. (2017). Viral to metazoan marine plankton nucleotide sequences from the Tara oceans expedition. Sci. Data 4, 1–20. doi: 10.1038/sdata.2017.93
Batten S. D., Abu-Alhaija R., Chiba S., Edwards M., Graham G., Jyothibabu R., et al. (2019). A global plankton diversity monitoring program. Front. Mar. Sci. 6 (APR). doi: 10.3389/fmars.2019.00321
Beaugrand G., Kirby R. R. (2002). Reorganization of north Atlantic marine copepod biodiversity and climate. Science 296 (5573), 1692–1694. doi: 10.1126/science.1071329
Beaugrand G., Kirby R. R. (2010). Climate, plankton and cod. Global Change Biol. 16 (4), 1268–1280. doi: 10.1111/j.1365-2486.2009.02063.x
Boltovskoy D., Correa N. (2017). Planktonic equatorial diversity troughs: Fact or artifact? latitudinal diversity gradients in radiolaria. Ecology 98 (1), 112–124. doi: 10.1002/ecy.1623
Bork P., Bowler C., de Vargas C., Gorsky G., Karsenti E., Wincker P., et al. (2015). Tara Oceans studies plankton at planetary scale. Science 348 (6237), 873. doi: 10.1126/science.aac5605
Buesseler K. O., Boyd P. W., Black E. E., Siegel D. A. (2020). Metrics that matter for assessing the ocean biological carbon pump. Proc. Natl. Acad. Sci. 117 (18), 201918114. doi: 10.1073/pnas.1918114117
Buitenhuis E. T., Vogt M., Moriarty R., Bednaršek N., Doney S. C., Leblanc K., et al. (2013). MAREDAT: Towards a world atlas of MARine ecosystem DATa. Earth System Sci. Data 5 (2), 227–239. doi: 10.5194/essd-5-227-2013
Cabello A. M., Cornejo-Castillo F. M., Raho N., Blasco D., Vidal M., Audic S., et al. (2016). Global distribution and vertical patterns of a prymnesiophyte–cyanobacteria obligate symbiosis. ISME J. 10 (3), 693–706. doi: 10.1038/ismej.2015.147
Caputi L., Carradec Q., Eveillard D., Kirilovsky A., Pelletier E., Pierella Karlusich J. J., et al. (2019). Community-level responses to iron availability in open ocean plankton ecosystems. Global Biogeochemical Cycles 33 (3), 391–419. doi: 10.1029/2018GB006022
Carradec Q., Pelletier E., Da Silva C., Alberti A., Seeleuthner Y., Blanc-Mathieu R., et al. (2018). A global ocean atlas of eukaryotic genes (SupMat). Nat. Commun. 9 (1), 1–13. doi: 10.1038/s41467-017-02342-1
Chaffron S., Delage E., Budinich M., Vintache D., Henry N., Nef C., et al. (2021). Environmental vulnerability of the global ocean epipelagic plankton community interactome. Sci. Adv. 7 (35), 1–16. doi: 10.1126/sciadv.abg1921
Chivers W. J., Walne A. W., Hays G. C. (2017). Mismatch between marine plankton range movements and the velocity of climate change. Nat. Commun. 8, 1–8. doi: 10.1038/ncomms14434
Claustre H., Johnson K. S., Takeshita Y. (2020). Observing the global ocean with biogeochemical-argo. Annu. Rev. Mar. Sci. 12 (1), 23–48. doi: 10.1146/annurev-marine-010419-010956
Cybulski J. S., Clements J., Prakash M. (2014). Foldscope: Origami-based paper microscope. PLoS One 9 (6), e98781. doi: 10.1371/journal.pone.0098781
Decelle J., Martin P., Paborstava K., Pond D. W., Tarling G., Mahé F., et al. (2013). Diversity, ecology and biogeochemistry of cyst-forming acantharia (Radiolaria) in the oceans. PLoS One 8 (1), e53598. doi: 10.1371/journal.pone.0053598
De Vargas C., Audic S., Henry N., Decelle J., Mahé F., Logares R., et al. (2015). Eukaryotic plankton diversity in the sunlit ocean. Science 348 (6237), 1261605–1/11. doi: 10.1007/s13398-014-0173-7.2
Dolan J. R., Yang E. J., Kang S. H., Rhee T. S. (2016). Declines in both redundant and trace species characterize the latitudinal diversity gradient in tintinnid ciliates. ISME J. 10 (9), 2174–2183. doi: 10.1038/ismej.2016.19
Duarte C. M. (2015). Seafaring in the 21st century: The malaspina 2010 circumnavigation expedition. Limnology Oceanography Bull. 24 (1), 11–14. doi: 10.1002/lob.10008
Dufrene M., Legendre P. (1997). Species assemblages and indicator species: The need for a flexible asymmetrical approach. Ecol. Monogr. 67 (3), 345–366. doi: 10.2307/2963459
Durkin C. A., Van Mooy B. A.S., Dyhrman S. T., Buesseler K. O. (2016). Sinking phytoplankton associated with carbon flux in the Atlantic ocean. Limnology Oceanography 61 (4), 1172–1187. doi: 10.1002/lno.10253
Edgar R. C., Haas B. J., Clemente J. C., Quince C., Knight R. (2011). UCHIME improves sensitivity and speed of chimera detection. Bioinformatics 27, 2194–2200. doi: 10.1093/bioinformatics/btr381
Falkowski P. G., Fenchel T., Delong E. F. (2008). The microbial engines that drive earth’s biogeochemical cycles. Science 320 (5879), 1034–1039. doi: 10.1126/science.1153213
Flegontova O., Flegontov P., Malviya S., Audic S., Wincker P., de Vargas C., et al. (2016). Extreme diversity of diplonemid eukaryotes in the ocean. Curr. Biol. 26 (22), 3060–3065. doi: 10.1016/j.cub.2016.09.031
Follows M. J., Dutkiewicz S. (2011). Modeling diverse communities of marine microbes. Annu. Rev. Mar. Sci. 3, 427–451. doi: 10.1146/annurev-marine-120709-142848
Follows M. J., Dutkiewicz S., Grant S., Chisholm S. W. (2007). Emergent biogeography of microbial communities in a model ocean. Science 315 (5820), 1843–1846. doi: 10.1126/science.1138544
Fuhrman J. A., Steele J. A., Hewson I., Schwalbach M. S., Brown M. V., Green J. L., et al. (2008). A latitudinal diversity gradient in planktonic marine bacteria. Proc. Natl. Acad. Sci. 105 (22), 7774–7778. doi: 10.1073/pnas.0803070105
Garcia-Soto C, van der Meeren G. I., Busch J. A., Delany J., Domegan C., Dubsky K., et al. (2017). Advancing citizen science for coastal and ocean research. position p. Eds. Kellett V., Delany J., McDonough N. Position Paper 23 of the European Marine Board, Ostend, Belgium. 112pp.
Gorsky G., Bourdin G., Lombard F., Pedrotti M. L., Audrain S., Bin N., et al. (2019). Expanding Tara oceans protocols for underway, ecosystemic sampling of the ocean-atmosphere interface during Tara pacific expedition 2016–2018). Front. Mar. Sci. 6 (November). doi: 10.3389/fmars.2019.00750
Gregory A. C., Zayed A. A., Conceição-Neto N., Temperton B., Bolduc B., Alberti A., et al. (2019). Marine DNA viral macro- and microdiversity from pole to pole. Cell 177 (5), 1109–1123.e14. doi: 10.1016/j.cell.2019.03.040
Guidi L., Chaffron S., Bittner L., Eveillard D., Larhlimi A., Roux S., et al. (2016). Plankton networks driving carbon export in the oligotrophic ocean. Nature 532, 465–470. doi: 10.1038/nature16942
Guillou L., Bachar D., Audic S., Bass D., Berney C., Bittner L., et al. (2013). The protist ribosomal reference database (PR2): A catalog of unicellular eukaryote small Sub-unit rRNA sequences with curated taxonomy. Nucleic Acids Res. 41 (D1), 597–604. doi: 10.1093/nar/gks1160
Hays G. C., Richardson A. J., Robinson C. (2005). Climate change and marine plankton. Trends Ecol. Evol. 20 (6 SPEC. ISS.), 337–344. doi: 10.1016/j.tree.2005.03.004
Ibarbalz F. M., Henry N., Brandão M. C., Martini S., Busseni G., Byrne H., et al. (2019). Global trends in marine plankton diversity across kingdoms of life. Cell 179 (5), 1084–1097.e21. doi: 10.1016/j.cell.2019.10.008
Jacquin J., Cheng J., Odobel C., Pandin C., Conan P., Pujo-Pay M., et al. (2019). Microbial ecotoxicology of marine plastic debris: A review on colonization and biodegradation by the ‘plastisphere. Front. Microbiol. 10 (APR). doi: 10.3389/fmicb.2019.00865
Karsenti E. (2012). A journey from reductionist to systemic cell biology aboard the schooner Tara. Mol. Biol. Cell 23 (13), 2403–2406. doi: 10.1091/mbc.E11-06-0571
Karsenti E., Acinas S. G., Bork P., Bowler C., de Vargas C., Raes J., et al. (2011). A holistic approach to marine eco-systems biology. PloS Biol. 9 (10), 7–11. doi: 10.1371/journal.pbio.1001177
Krishnamurthy D., Li H., Rey du Cambournac F. B.P., Larson A., Prakash M. (2019). Scale-free vertical tracking microscopy: Towards bridging scales in biological oceanography. bioRxiv, 610246. doi: 10.1101/610246
Kwon E. Y., Primeau F., Sarmiento J. L. (2009). The impact of remineralization depth on the air-sea carbon balance. Nat. Geosci. 2 (9), 630–635. doi: 10.1038/ngeo612
Lauro F. M., Senstius S. J., Cullen J., Neches R., Jensen R. M., Brown M. V., et al. (2014). The common oceanographer: Crowdsourcing the collection of oceanographic data. PloS Biol. 12 (9), e1001947. doi: 10.1371/journal.pbio.1001947
Leeuw T., Boss E. (2018). The HydroColor app: Above water measurements of remote sensing reflectance and turbidity using a smartphone camera. Sensors (Switzerland) 18 (1), 1–15. doi: 10.3390/s18010256
Lévy M., Franks P. J. S., Smith K. S. (2018). The role of submesoscale currents in structuring marine ecosystems. Nat. Commun. 9 (1), 1–16. doi: 10.1038/s41467-018-07059-3
Lima-mendez G., Faust K., Henry N., Colin S., Carcillo F., Chaffron S., et al. (2015). Determinants of community structure in the global plankton interactome. Sci. (New York N.Y.) 348 (6237), 1262073. doi: 10.1126/science.1262073
Logares R., Deutschmann I. M., Junger P. C., Giner C. R., Krabberød A. K., Schmidt T. S.B., et al. (2020). Disentangling the mechanisms shaping the surface ocean microbiota. Microbiome 8 (1), 55. doi: 10.1186/s40168-020-00827-8
Lombard F., Boss E., Waite A. M., Uitz J., Stemmann L., Sosik H. M., et al. (2019). Globally consistent quantitative observations of planktonic ecosystems. Front. Mar. Sci. 6 (MAR). doi: 10.3389/fmars.2019.00196
Mahé F., Rognes T., Quince C., de Vargas C., Dunthorn M., et al. (2015). Swarm v2: highly-scalable and high-resolution amplicon clustering. PeerJ 3, e1420. doi: 10.7717/peerj.1420
Malviya S., Scalco E., Audic S., Vincent F., Veluchamy A., Bittner L., et al. (2015). Insights into global diatom distribution and diversity in the world’s ocean. Proc. Natl. Acad. Sci. 348, E1516–E1525. doi: 10.1073/pnas.1509523113
Martin M. (2011). Cutadapt removes adapter sequences from high-throughput sequencing reads. EMBnet.journal 17 (1), 10. doi: 10.14806/ej.17.1.200
Mordret S., Romac S, Henry N, Colin S, Carmichael M, Berney C, et al. (2016). The symbiotic life of symbiodinium in the open ocean within a new species of calcifying ciliate (Tiarina sp.). ISME J. 10, 1424–1436. doi: 10.1038/ismej.2015.211
Mériguet Z., Oddone A., Le Guen D., Pollina T., Basile R., Moulin C., et al (2010). Basin-scale underway quantitative survey of surface microplankton using affordable collection and imaging tools deployed from Tara. Front. Mar. Sci. 1–12. doi: 10.3389/fmars.2022.916025
Morgan K. L., Larkin S. L., Adams C. M. (2010). Red tides and participation in marine-based activities: Estimating the response of southwest Florida residents. Harmful Algae 9 (3), 333–341. doi: 10.1016/j.hal.2009.12.004
Pollina T., Larson A. G., Lombard F., Hongquan L., Le Guen D., Colin S., et al. (2022). PlanktoScope: Affordable modular imaging platform for citizen oceanography. Front. Mar. Sci 9, 949428. doi: 10.3389/fmars.2022.949428.
Pörtner H.-O., Roberts D. C., Masson-Delmotte V., Zhai P., M T., Poloczanska E., et al. (2019). IPCC special report on the ocean and cryosphere in a changing climate (Cambridge University Press, Cambridge, UK and New York, NY, USA) 755 p. doi: 10.1017/9781009157964
Probert I., Siano R., Poirier C., Decelle J., Biard T., Akihiro T., et al. (2014). Brandtodinium gen. nov. (Dinophyceae), a dinoflagellates commonly found in symbiosis with polycystines radiolarians. J. Phycology 50 (2), 388–399. doi: 10.1111/jpy.12174
Reid P. C., Colebrook J. M., Matthews J. B.L., Aiken J. (2003). The continuous plankton recorder: concepts and history, from plankton indicator to undulating recorders. Prog. Oceanography 58 (2–4), 117–173. doi: 10.1016/j.pocean.2003.08.002
Richardson A. J., Walne A. W., John A. W.G., Jonas T. D., Lindley J. A., Sims D. W., et al. (2006). Using continuous plankton recorder data. Prog. Oceanography 68, 27–74. doi: 10.1016/j.pocean.2005.09.011
Richter D. J., Watteaux R., Vannier T., Leconte J., Frémont P., Reygondeau G., et al. (2019). Genomic evidence for global ocean plankton biogeography shaped by large-scale current systems. bioRxiv, 867739. doi: 10.1101/867739
Roemmich D., Alford M. H., Claustre H., Johnson K. S., King B., Moum J., et al. (2019). On the future of argo: A global, full-depth, multi-disciplinary array. Front. Mar. Sci. 6 (JUL). doi: 10.3389/fmars.2019.00439
Rognes T., Flouri T., Nichols B., Quince C., Mahé F. (2016). VSEARCH: a versatile open source tool for metagenomics. PeerJ 4, e2584. doi: 10.7717/peerj.2584
Salazar G., Paoli L., Alberti A., Huerta-Cepas J., Ruscheweyh H. J., Cuenca M., et al. (2019). Gene expression changes and community turnover differentially shape the global ocean metatranscriptome. Cell 179 (5), 1068–1083.e21. doi: 10.1016/j.cell.2019.10.014
Ser-Giacomi E., Zinger L., Malviya S., de Vargas C., Karsenti E., Bowler C., et al. (2018). “Ubiquitous abundance distribution of non-dominant plankton across the world’s ocean,” Nat. Ecol. Evol. 2, 1243–1249. doi: 10.1038/s41559-018-0587-2.
Simoniello C., Jencks J., Lauro F. M., Loftis J. D., Weslawski J. M., Deja K., et al. (2019). Citizen-science for the future: Advisory case studies from around the globe. Front. Mar. Sci. 6:1–15. doi: 10.3389/fmars.2019.225
Skovgaard A., Karpov S. A., Guillou L. (2012). The parasitic dinoflagellates blastodinium spp. inhabiting the gut of marine, planktonic copepods: Morphology, ecology, and unrecognized species diversity. Front. Microbiol. 3 (AUG). doi: 10.3389/fmicb.2012.00305
Sloyan B. M., Wanninkhof R., Kramp M., Johnson G. C., Talley L., Tanhua T., et al. (2019). The global ocean ship-base hydrographic investigations program (GO-SHIP): A platform for integrated multidisciplinary ocean science. Front. Mar. Sci. 6 (JUL). doi: 10.3389/fmars.2019.00445
Stanley Wilson W., Lindstrom E. J., Willis J. K. (2019). “Satellite oceanography-history and introductory concepts,” in Encyclopedia of ocean sciences, 3rd3rd (Silver Spring, MD, United States: Elsevier Ltd). doi: 10.1016/B978-0-12-409548-9.10816-4
Sunagawa S., Coelho L. P., Chaffron S., Kultima J. R., Labadie K., Salazar G., et al. (2015). Structure and function of the global ocean microbiome. Science 348 (6237), 1–10. doi: 10.1126/science.1261359
Sunagawa S., Acinas S. G., Bork P., Bowler C. (2020). Tara Oceans: towards global ocean eco-systems biology. Nat. Rev. Microbiol. 18 (8), 428–445 doi: 10.1038/s41579-020-0364-5
Tornero V., Hanke G. (2016). Chemical contaminants entering the marine environment from sea-based sources: A review with a focus on European seas. Mar. pollut. Bull. 112 (1–2), 17–38. doi: 10.1016/j.marpolbul.2016.06.091
Urban L., Holzer A., Baronas J. J., Hall M. B., Braeuninger-Weimer P., Scherm M. J., et al. (2020). Freshwater monitoring by nanopore sequencing. bioRxiv. doi: 10.1101/2020.02.06.936302
Vazquez-Cuervo J., Gomez-Valdes J., Bouali M., Miranda L. E., Van der Stocken T., Tang W., et al. (2019). Using saildrones to validate satellite-derived sea surface salinity and sea surface temperature along the California/Baja coast. Remote Sens. 11 (17), 1–18. doi: 10.3390/rs11171964
Venter J. C., Remington K., Heidelberg J. F., Halpern A. L., Rusch D., Eisen J. A., et al. (2004). Environmental genome shotgun sequencing of the Sargasso Sea. Science 304 (5667), 66–74. doi: 10.1126/science.1093857
von Ammon U., Jeffs A., Zaiko A., van der Reis A., Goodwin D., Beckley L. E., et al. (2020). A portable cruising speed net: Expanding global collection of Sea surface plankton data. Front. Mar. Sci. 7 (December). doi: 10.3389/fmars.2020.615458
Ward B. A., Dutkiewicz S., Follows M. J. (2014). Modelling spatial and temporal patterns in size-structured marine plankton communities: Top-down and bottom-up controls. J. Plankton Res. 36 (1), 31–47. doi: 10.1093/plankt/fbt097
Willig M. R., Kaufman D. M., Stevens R. D. (2003). Latitudinal gradients of biodiversity: Pattern, process, scale, and synthesis. Annu. Rev. Ecology Evolution Systematics 34 (1), 273–309. doi: 10.1146/annurev.ecolsys.34.012103.144032
Yang Y., Cowen L. L. E., Costa M. (2018). Is ocean reflectance acquired by citizen scientists robust for science applications? Remote Sens. 10 (6), 835. doi: 10.3390/rs10060835
Keywords: planetary biology, citizen oceanography, DNA metabarcoding, plankton, seatizens, sailors, frugal science
Citation: de Vargas C, Le Bescot N, Pollina T, Henry N, Romac S, Colin S, Haëntjens N, Carmichael M, Berger C, Le Guen D, Decelle J, Mahé F, Poulain J, Malpot E, Beaumont C, Hardy M, Guiffant D, Probert I, Gruber DF, Allen AE, Gorsky G, Follows MJ, Pochon X, Troublé R, Cael BB, Lombard F, Boss E, Prakash M and the Plankton Planet core team (2022) Plankton Planet: A frugal, cooperative measure of aquatic life at the planetary scale. Front. Mar. Sci. 9:936972. doi: 10.3389/fmars.2022.936972
Received: 05 May 2022; Accepted: 11 July 2022;
Published: 17 August 2022.
Edited by:
Anne Chenuil, Centre National de la Recherche Scientifique (CNRS), FranceReviewed by:
Dirk Steinke, University of Guelph, CanadaOwen S. Wangensteen, The Arctic University of Norway, Norway
Copyright © 2022 de Vargas, Le Bescot, Pollina, Henry, Romac, Colin, Haëntjens, Carmichael, Berger, Le Guen, Decelle, Mahé, Poulain, Malpot, Beaumont, Hardy, Guiffant, Probert, Gruber, Allen, Gorsky, Follows, Pochon, Troublé, Cael, Lombard, Boss, Prakash and the Plankton Planet core team. This is an open-access article distributed under the terms of the Creative Commons Attribution License (CC BY). The use, distribution or reproduction in other forums is permitted, provided the original author(s) and the copyright owner(s) are credited and that the original publication in this journal is cited, in accordance with accepted academic practice. No use, distribution or reproduction is permitted which does not comply with these terms.
*Correspondence: Colomban de Vargas, dmFyZ2FzQHNiLXJvc2NvZmYuZnI=; Emmanuel Boss, ZW1tYW51ZWwuYm9zc0BtYWluZS5lZHU=; Manu Prakash, bWFudXBAc3RhbmZvcmQuZWR1