Abstract
In recent years, the Yellow River Delta has been affected by invasive species Spartina alterniflora (S. alterniflora), resulting in a fragile ecological environment. It is of great significance to monitor the ground object types in the Yellow River Delta wetlands. The classification accuracy based on Synthetic Aperture Radar (SAR) backscattering coefficient is limited by the small difference between some ground objects. To solve this problem, a decision tree classification method for extracting the ground object types in wetland combined time series SAR backscattering and coherence characteristics was proposed. The Yellow River Delta was taken as the study area and the 112 Sentinel-1A GRD data with VV/VH dual-polarization and 64 Sentinel-1A SLC data with VH polarization were used. The decision tree method was established, based on the annual mean VH and VV backscattering characteristics, the new constructed radar backscattering indices, and the annual mean VH coherence characteristics were suitable for extracting the wetlands in the Yellow River Delta. Then the classification results in the Yellow River Delta wetlands from 2018 to 2021 were obtained using the new method proposed in this paper. The results show that the overall accuracy and Kappa coefficient of the proposed method w5ere 89.504% and 0.860, which were 9.992% and 0.127 higher than multi-temporal classification by Support Vector Machine classifier. Compared with the decision tree without coherence, the overall accuracy and Kappa coefficient were improved by 8.854% and 0.108. The spatial distributions of wetland types in the Yellow River Delta from 2018 to 2021 were obtained using the constructed decision tree. The spatio-temporal evolution analysis was conducted. The results showed that the area of S. alterniflora decreased significantly in 2020 but it increased to the area of 2018 in 2021. In addition, S. alterniflora seriously affected the living space of Phragmites australis (P. australis) and in 4 years, 10.485 km2 living space of P. australis was occupied by S. alterniflora. The proposed method can provide a theoretical basis for higher accuracy SAR wetland classification and the monitoring results can provide an effective reference for local wetland protection.
Introduction
A wetland, known as “the kidney of the Earth”, is the ecosystem with the highest biodiversity and productivity in nature as well as one of the most important living environments for human beings (Cadier et al., 2020). A wetland plays an important role in biogeochemical cycles, flood mitigation, energy conversion, degradation of pollutants, promoting silting, and providing means of production and living resources for human beings (Delgado and Marín, 2013). At the same time, it can play a positive role in ecosystem protection, including food supply, carbon sequestration, flood control, and water quality improvement (Liu et al., 2021). A wetland breeds a large number of animal and plant resources with its unique eco-hydrological environment, provides good breeding and habitat for many wild animals, and forms a rich species community (Adame et al., 2019). Therefore, it is also of great significance to monitor the wetlands for the protection of biodiversity.
Spartina alterniflora (S. alterniflora) is a perennial halophyte native to the Atlantic coast of the Americas from Canada to Argentina (Meng et al., 2020). Presently, S. alterniflora has been recognized as one of the most serious coastal invasive species in the world, causing serious damage to coastal ecosystems. S. alterniflora was introduced into China for the first time in 1979 (Zuo et al., 2012) and showed a strong aggressiveness, gradually flooding coastal wetlands in China, and was listed as one of the “Top 10 invasive alien species” in China (Wan et al., 2009). Since 1990, S. alterniflora has spread to the Yellow River Delta, causing serious harm to the local ecosystem and leading to the decline of local biodiversity (Yue et al., 2021). At the same time, the S. alterniflora occupied the waterway space, resulting in waterway blockage and hindering the development of a variety of local industries. Due to the lack of natural enemies in China, S. alterniflora has gradually become the dominant species in coastal wetlands (Wan et al., 2014; Zhang et al., 2020), seriously squeezing the living space of other local species. Therefore, the monitoring of the Yellow River Delta wetland types, especially the accurate acquisition of the distribution range of S. alterniflora, can observe the distribution location and the changing trend of S. alterniflora in real time. This can better reflect the management achievements and shortcomings of S. alterniflora.
Wetland classification and the extraction of S. alterniflora can mainly use optical images, unmanned aerial vehicle (UAV) images, and other remote sensing methods (Zhu et al., 2019; Tian et al., 2020; Zhang et al., 2020). However, optical images are easily affected by clouds and fog, resulting in data unavailability. The monitoring range of UAV is limited and the work is easily affected by weather, which makes it impossible to better complete the monitoring task of a long time series. Synthetic Aperture Radar (SAR) images are not affected by clouds, rain, and snow, so it is possible to classify the wetlands for a long time series (Chen et al., 2017). In addition, it is particularly important to effectively distinguish Phragmites australis (P. australis) and S. alterniflora in wetland classification. S. alterniflora and P. australis are easily confused when they are extracted directly based on pixel from optical and UAV images due to their similarity in appearance. However, the unique backscattering coefficient of SAR images can be used to effectively distinguish these two species.
At present, the study on classification based on backscattering coefficients is mainly focused on the extraction of single ground object types, such as rice (Park et al., 2018) and forest (Khati et al., 2018), and has achieved good results. In addition, some scholars have achieved good classification results in distinguishing between ground object types with obvious differences, such as distinguishing between “wet” fields and “dry” fields (Keisuke et al., 2018) and between flood and vegetation (Tsyganskaya et al., 2018). However, the differences between these ground objects are easy to distinguish. When classifying complex areas such as wetlands, it is difficult to achieve high classification accuracy. The main reason is that the backscattering coefficients of some ground objects are too close to be distinguished. In wetlands study, scholars are constantly looking for new methods to achieve higher classification accuracy. Optical remote sensing image has become a popular classification method because it contains multiple spectral information, which can provide more characteristics to classification. Ottinger et al. (2013) and Liu et al. (2016) have achieved a good classification result in the Yellow River Delta by using optical image in the early years. The classification accuracy of their method is 76% and 89% respectively. Due to the advantages of optical image in classification, the combination of optical image and SAR image has also been widely applied to the classification of the Yellow River Delta wetlands in recent years. For example, Zhang et al. (2021) combined Sentinel-1A with Sentinel-2A and obtained an overall accuracy of 92.4%. Tu et al. (2021) combined GF-3 with hyperspectral satellite Zhuhai-1 and obtained an overall accuracy of 97%. Wang et al. (2022) combined GF-3 with Sentinel-2A and obtained an overall accuracy of 86.18%. All of the classification accuracy obtained was higher than 85%. The combination of optical image and SAR image has achieved a classification result with higher accuracy than only using the backscattering coefficient (Zhang et al., 2019), which has become a common classification method in wetlands. However, under the condition optical image data access being limited, knowing how to use SAR data only to achieve higher accuracy of wetlands classification has become important work.
InSAR technology is used to effectively detect ground changes and generate interferograms and coherence coefficient maps. In this process, coherence refers to the scattering information of ground object scatterers obtained by the coherent processing of two SAR images by InSAR technology. The coherence map is not only used to reflect the quality of interferometry in InSAR processing but also used to reflect the changes in ground object types (Canisius et al., 2019). If there are obvious changes in the covered ground object types between two SAR images, the coherence will decline. The coherence of S. alterniflora is quite different from that of other vegetation because it lives at the edge of the ocean where it is often submerged. Now, coherence has been applied to ground object classification. In some cases, better classification results can be obtained by using the time series coherence of different ground objects than by using the time series backscattering coefficient. This is mainly due to the growth environment of different plants, such as annual crops, grasses for pasture, and sugarcane plantations (Nikaein et al., 2021). However, it is still difficult to classify complex areas using coherence only because many ground objects are not sensitive to coherence. But coherence can enhance the distinction between objects that are difficult to distinguish using backscattering coefficients, which provides a theoretical basis for higher precision SAR classification. In the early years, coherence was mainly used for classification as part of image characteristics. Nizalapur et al. (2011) used the pseudocolor composite of coherence, backscatter difference, and mean backscatter to classify land cover in the Bilaspur forest area in Chattisgarh, India, with an overall accuracy of 82.5%. Fariba et al. (2018) used SAR backscattering and coherence maps as input features to conduct object-based Random Forest classification for marsh and shallow water in Avalon Peninsula, Newfoundland and Labrador, Canada, with an overall accuracy of 74.33%. In addition, the coherence of different temporal baselines is also introduced into the classification. Zhang et al. (2021) extracted rice in Guanghan city by using coherence maps of different time baselines and backscattering coefficients, and the extraction accuracy improved by 3% compared with only using the backscattering coefficients. These scholars have proved that coherence can contribute to achieve higher accuracy of classification. However, in some classification or ground object extraction applications (Nizalapur et al., 2011; Fariba et al., 2018; Zhang et al., 2021) that combine backscattering coefficient and coherence the coherence map is taken as part of the pseudocolor image synthesis and then samples are established for supervised classification; the classification is still limited by sample selection, resulting in reduced accuracy. The coherence and backscattering coefficients are used as a threshold index to construct a decision tree, which can effectively solve the problem.
The decision tree classifier (DTC) (Dattatreya and Kanal, 1986; Safavian and Landgrebe, 1991) is one of the methods for multi-stage decision making. The basic principle involved in any multistage approach is to break up a complex decision into a union of several simpler decisions, hoping the final solution obtained this way would resemble the intended desired solution. In the field of remote sensing monitoring, compared with traditional classification methods such as maximum likelihood classification, the decision tree classifies each pixel in the image by dividing the threshold values. This avoids misclassification and omission caused by the contingency of samples and the color of images in supervised or unsupervised classification, which has substantial advantages in land classification (Friedl and Brodley, 1997). Recently, decision tree classification has been successfully applied to land classification in cities, wetlands, forests, and sea ice (Tooke et al., 2009; Heumann, 2011; Timothy and Bartolo, 2015; Wang et al., 2021a).
In order to achieve effective monitoring of the Yellow River Delta wetland types, and especially to effectively distinguish between the S. alterniflora and P. australis, a decision tree classification method combined time series dual-polarization SAR backscattering and coherence characteristics is proposed in this paper. It can realize the Yellow River Delta wetland classification and explore the spatio-temporal evolution of the Yellow River Delta wetland types, especially the evolution of S. alterniflora.
The structure of this paper is as follows: Section 2 introduces the study area and experimental data in detail. Section 3 is the constructed method of this paper and introduces the process of establishing the decision tree by VH and VV backscattering characteristics, radar backscattering indices, and VH coherence characteristics. Section 4 is the result of this paper and the classification results were compared with the multi-temporal supervised classification. Section 5 discusses the classification accuracy of the different polarization coherences. Then the spatio-temporal evolution of wetland types in the Yellow River Delta from 2018 to 2021 is discussed and analyzed. Finally, some valuable conclusions of this study are drawn in Section 6.
Data and Materials
Study Area
The Yellow River Delta is the most widely preserved, the most complete, and the youngest wetland ecosystem in the world. It is located in the warm temperate zone of the Shandong Province, China. It is the second-largest wetland in China, covering an area of more than 10,000 km2, bordering Bohai Bay in the north and Laizhou Bay in the east. The terrain is flat and the altitude is between 0m and 15m and it has a temperate continental monsoon climate. The annual average precipitation is about 530-630 mm and the annual average temperature is about 11.7-12.6C. Due to the suitable climate conditions, the coastal wetland vegetation in this region is rich in types and covers a wide area (Zhang et al., 2019). Due to its unique ecological environment and unique natural conditions, this area is very rich in biological resources.
The study area is located in the Yellow River Estuary eco-tourism area, which is the most severely affected area by S. alterniflora in the Yellow River Delta. A large number of S. alterniflora is distributed on both sides of the estuary all year round. The study area is shown in the blue box in Figure 1A, covering a total area of 505.35 km2. The red box is the coverage area of Sentinel-1A image and the background is the shaded-relief map generated from Shuttle Radar Topography Mission (SRTM) DEM with 90 m resolution, which is used to represent the altitude of the study area. Figures 1B, C show P. australis and S. alterniflora, respectively, which were photographed in situ. It can be seen that they are very similar in appearance and cannot be directly distinguished from optical remote sensing images.
Figure 1
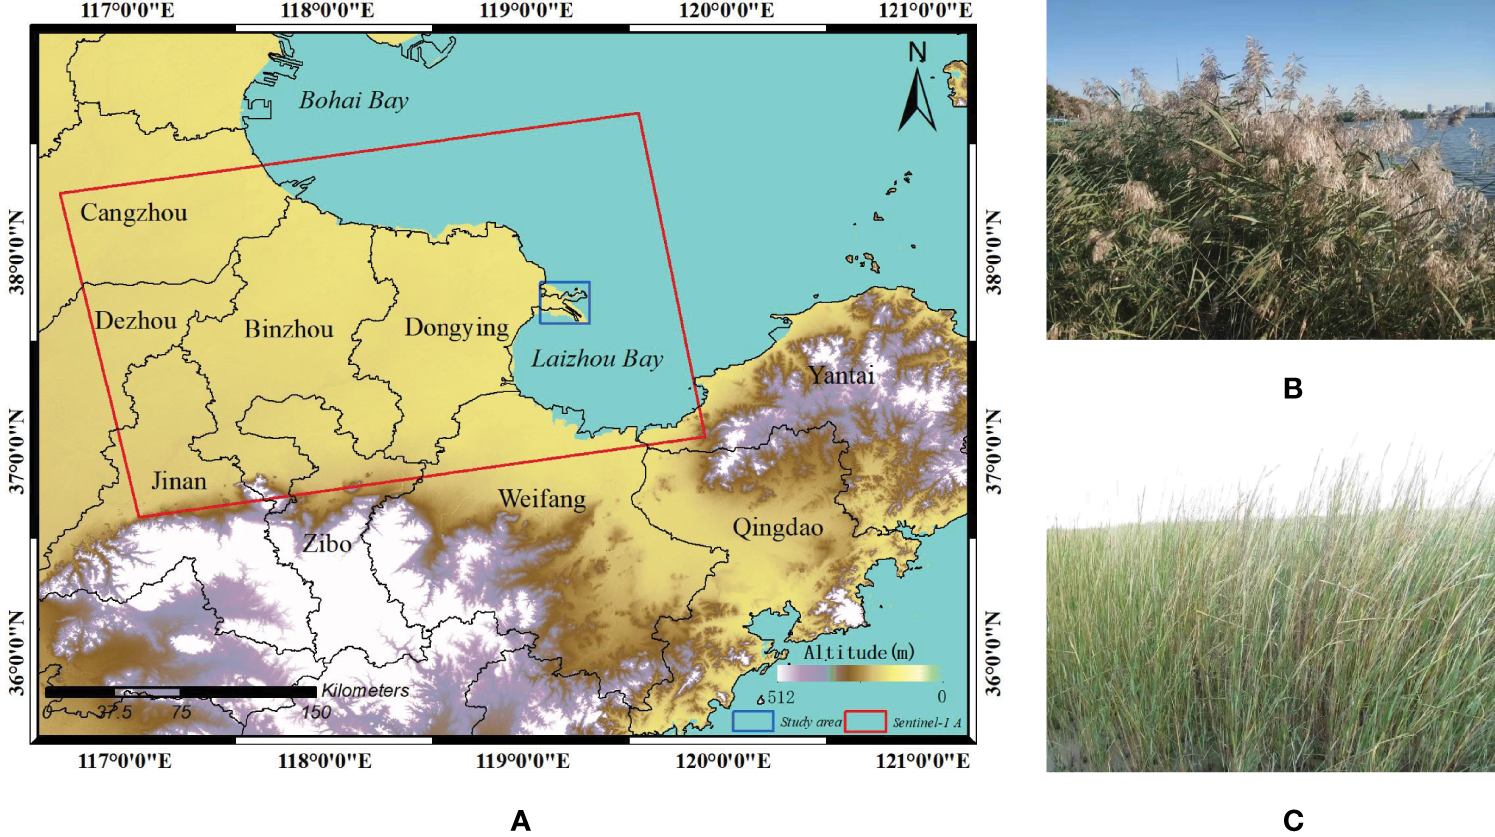
Study area. (A) is the geographical location map of the study area. The red box represents the coverage of Sentinel-1A image, and the blue box represents the study area. The background is the shaded-relief map from SRTM DEM; (B) is P. australis photographed in situ; (C) is S. alterniflora photographed in situ.
Data
To obtain the wetland types and evolution information of the Yellow River Delta, Sentinel-1A radar data from European Space Agency (ESA) were selected. The Sentinel-1A radar satellite was launched from the ESA on April 3, 2014. It works in C-band and orbits at an altitude of about 700 km. The revisit period of the satellite is 12 days, mainly including StripMAP (SM) mode, Interferometric Wide swath (IW) mode, Extra Wide swath (EW) mode, and Wave (WV) mode (Attema et al., 2010). This provides data support for long-term and multi-dimensional earth observation. Sentinel-1 radar satellite data is available for free download at the website: https://scihub.copernicus.eu/.
28 Sentinel-1A dual-polarization Ground Range Detected (GRD) images in IW mode with vertical transmit and vertical receive (VV) and vertical transmit and horizontal receive (VH) in 2018 were selected to obtain backscattering characteristics. The time span was from January 10, 2018 to December 24, 2018, and the imaging dates were evenly distributed to ensure at least two scenes per month, which were used to reflect information about the average backscattering coefficient over a year. In addition, 16 Sentinel-1A dual-polarization Single Look Complex (SLC) images in IW mode with VV and VH were used to obtain coherence characteristics, and the time span was basically the same as GRD data. Because the sensitivity of the change in coherence is lower than the backscattering coefficient (Mohammadimanesh et al., 2018), the time interval between selected images is longer. We guarantee at least one image per month to reflect the coherence change at different times.
In addition, to obtain wetland type information of the study area from 2019 to 2021, 84 Sentinel-1A dual-polarization GRD images (28 images per year) and 48 Sentinel-1A dual-polarization SLC images (16 images per year) were obtained, which were used to analyze the spatio-temporal evolution of wetland types. The imaging time of selected images is similar to 2018. The image parameters of the data used in this study are shown in Table 1. The imaging mode of all data is IW, VH/VV dual-polarization, ascending orbit, and the incidence angle is about 38.9°.
Table 1
| Sensor | Product Level | Orbit direction | Polarization | Incidence angle(°) | Path | Resolution(m) |
|---|---|---|---|---|---|---|
| Sentinel-1A | GRD | Ascending | VH/VV | 38.9 | 69 | 10×10 |
| Sentinel-1A | SLC | Ascending | VH/VV | 38.9 | 69 | 2.3×13.9 |
The parameters of Sentinel-1A data used for monitoring the Yellow River Delta wetlands.
Sentinel-1A product contains GRD data and SLC data. GRD data have the same azimuth resolution and range resolution, which reduces speckle noise and geometric resolution. Therefore, compared with SLC data, GRD data eliminates thermal noise to improve image quality and can achieve better accuracy in ground object classification. However, GRD data does not contain phase information, so it cannot be used to obtain the coherence between two images. To achieve better classification accuracy, GRD data and SLC data are used together for classification in this paper.
Method
In order to obtain the accurate ground object types and spatio-temporal evolution of wetland in the Yellow River Delta, a decision tree classification method combined time series dual-polarization SAR backscattering and coherence characteristics was proposed. Based on the annual mean VH and VV backscattering characteristics, the constructed radar backscattering indices, and the annual mean VH coherence of Sentinel-1A, a decision tree suitable for extracting the ground object types was established to obtain the classification results in the Yellow River Delta wetlands from 2018 to 2021. Finally, we analyzed the wetland types in the Yellow River Delta from 2018 to 2021 and focused on the spatio-temporal evolution of the invasive species S. alterniflora. The flow chart of the method studied in this paper is shown in Figure 2, which mainly includes the acquisition of annual mean backscattering characteristics, acquisition of annual mean coherence characteristics, decision tree construction, wetland classification, accuracy verification, area statistics of wetland ground object types, and analysis of spatio-temporal evolution of S. alterniflora.
Figure 2
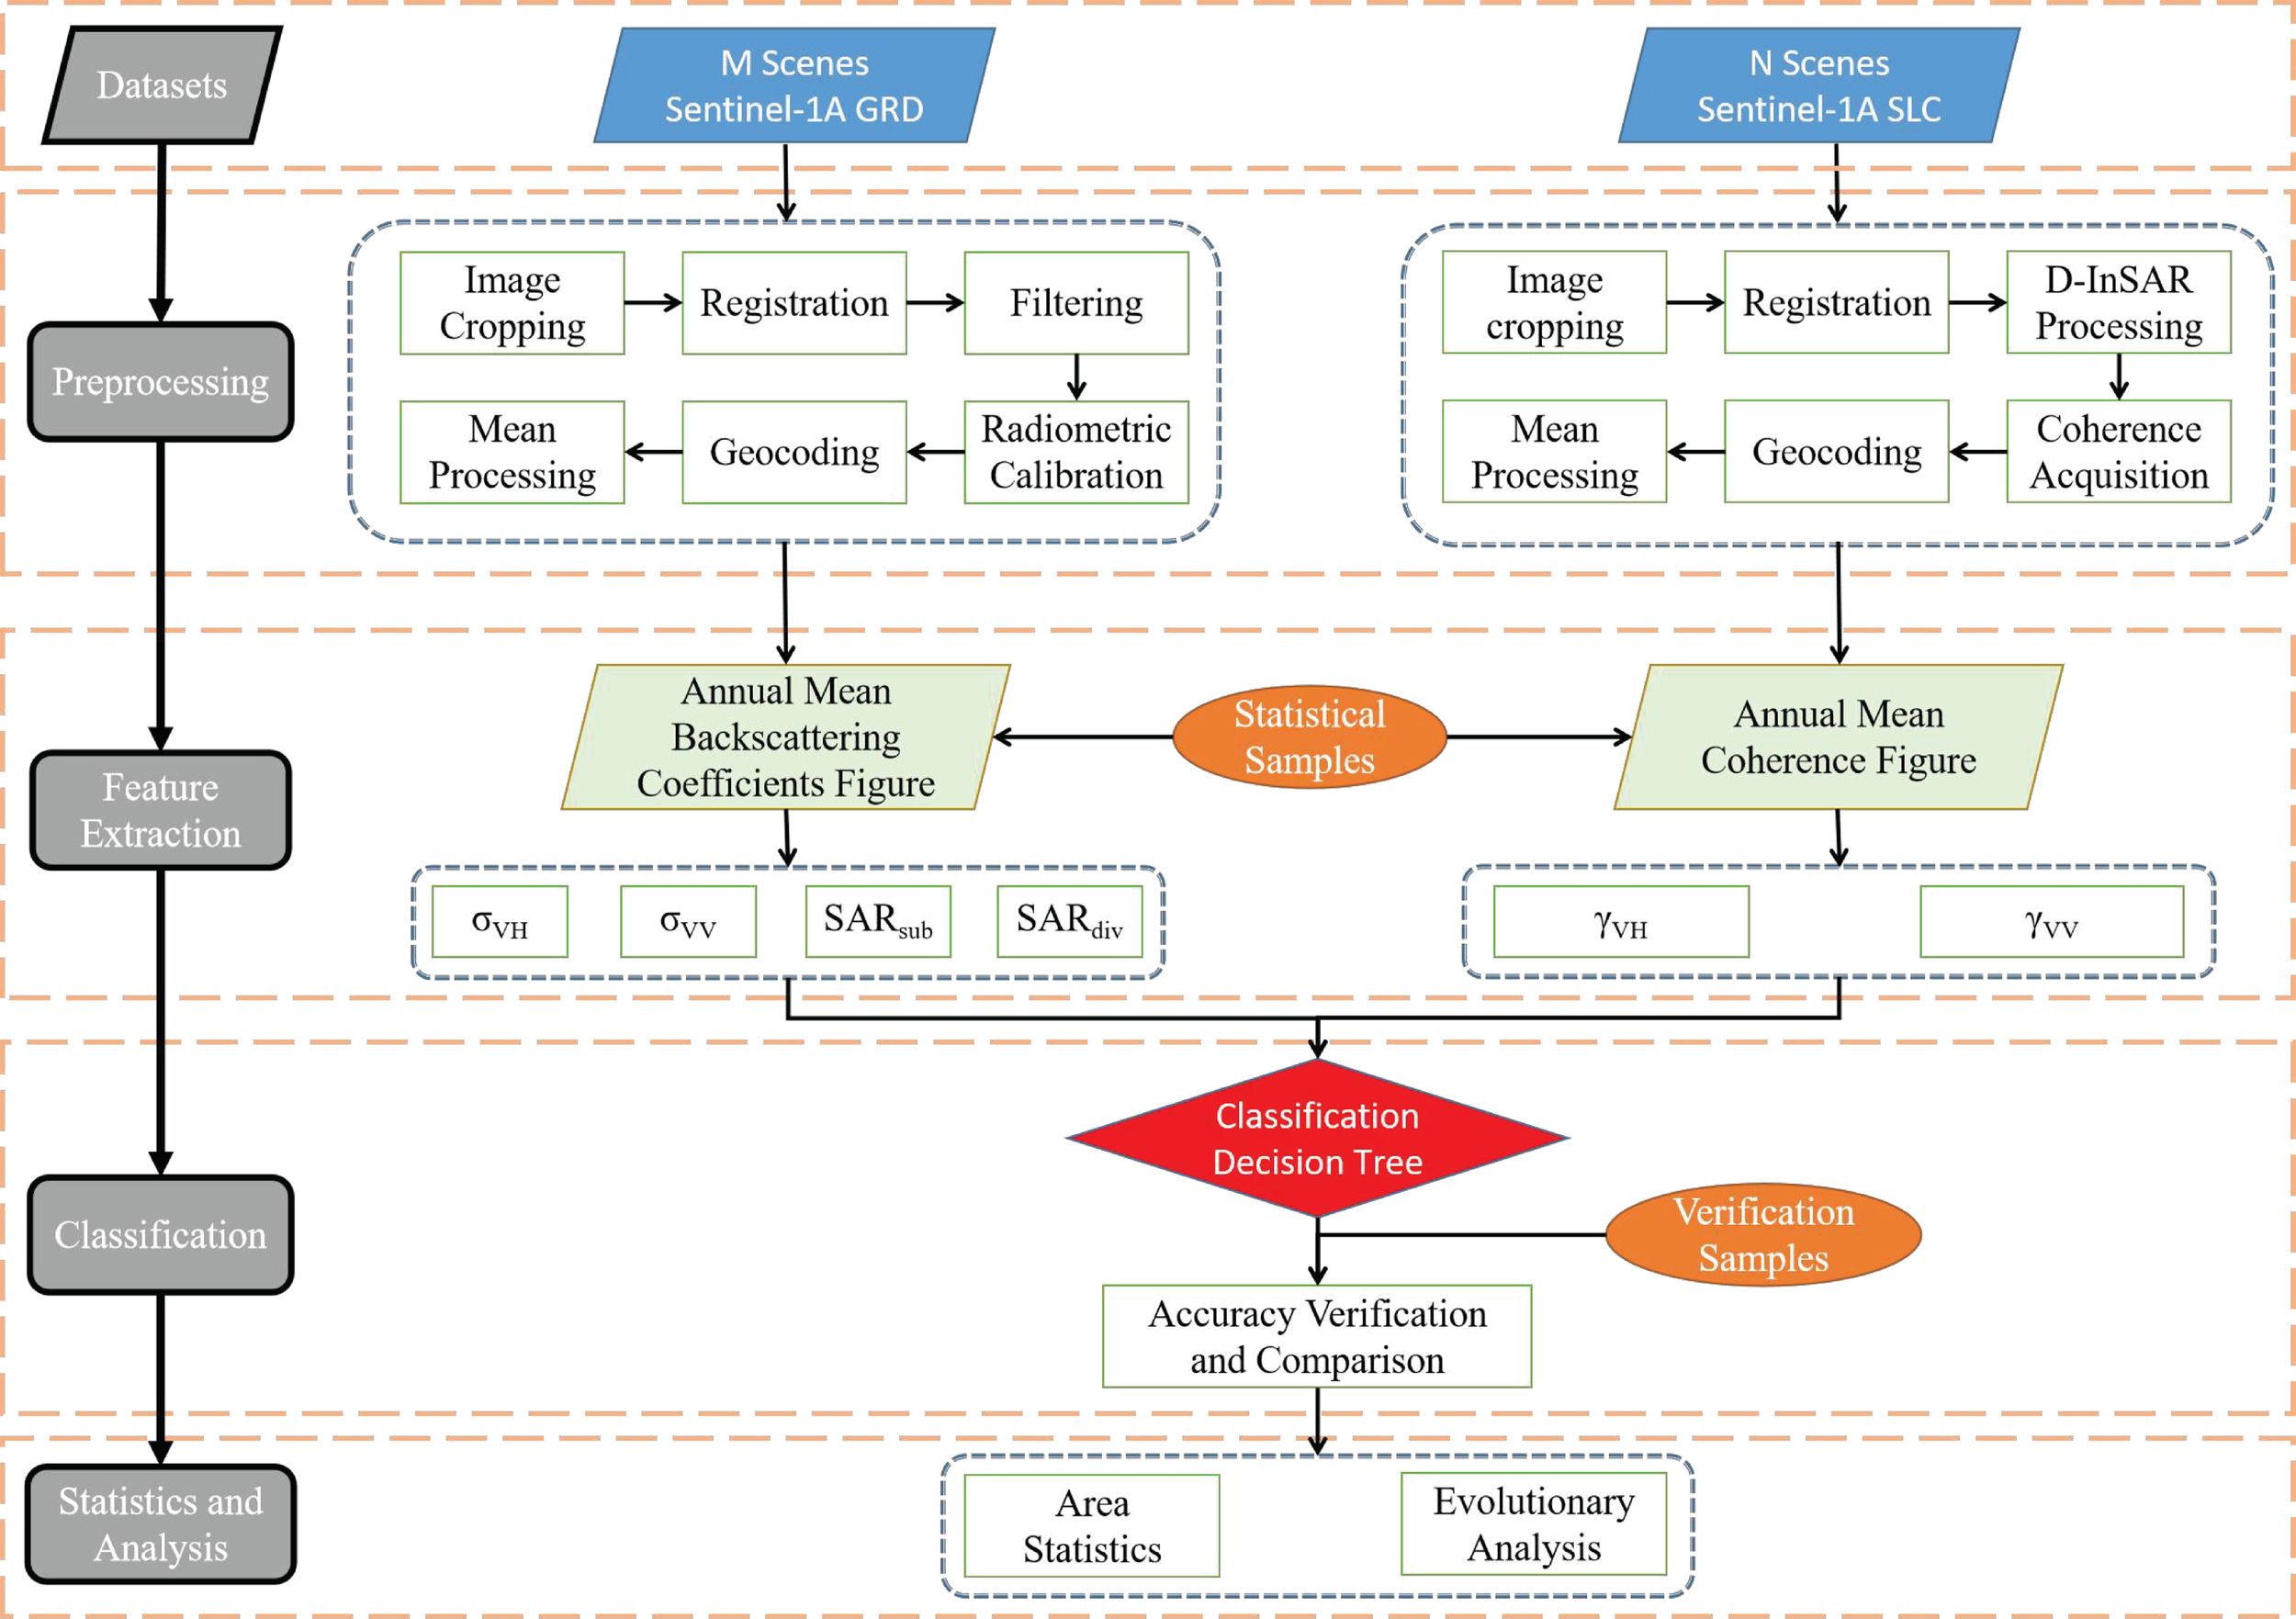
Overall technical flow chart used for monitoring the wetland in the Yellow River Delta.
Annual Mean Backscattering and Coherence Characteristics
(1) Annual Mean Backscattering Characteristics
The SAR backscattering coefficient is mainly related to the ground object surface roughness, ground humidity, and terrain (Schmugge, 1983; Hu et al., 2021). The backscattering coefficient of Sentinel-1 satellite mainly depends on the ground and salt marsh canopy backscatter intensities since the terrain of the coastal zone is mainly flat and terrain correction was performed during data pre-processing (Bouman and Hoekman, 1993). First, 28 dual-polarization Sentinel-1A GRD images were preprocessed as follows Bouman and Hoekman, 1993 to obtain backscattering characteristics:
① SAR image registration. The purpose is to make the image size consistent, and remove geographical deviation. This is to facilitate the subsequent mean processing of images. Cross-correlation method is used for registration (Jiang, 2013).
② SAR image filtering. The purpose is to remove the influence of speckle noise on the backscattering coefficient in SAR images as much as possible and the filtering method uses refined Lee filtering (Lee, 1981).
③ SAR radiometric calibration. The pixel gray value (DN) of the radar image is converted into the backscattering coefficient (σ0) and the conversion formula (1) is as follows:
-
The subscript ij refers to the position of pixel in the image, where i is row and j is column. A is the radiometric calibration parameter of Sentinel-1A.
④ Geocoding. Each pixel is converted from SAR image coordinate system to World Geodetic System 84 (WGS84) geographic coordinate system.
After the above processing was completed, a total of 56 images of backscattering coefficient under VH and VV polarization was obtained. In order to reflect the average distribution of ground objects in the whole year of 2018 and eliminate the influence of noise, the 28 VH backscattering coefficient maps and 28 VV backscattering coefficient maps were averaged respectively, to obtain the annual mean backscattering coefficients maps under VH polarization and VV polarization, as shown in Figures 3A, B. Since it cannot effectively distinguish the ground objects completely, only relying on a single annual mean backscattering coefficient σVH and σVV , the two radar indices SARsub and SARdiv about the backscattering coefficient of dual-polarization are established by referring to the derived parameters SARdiff (Veloso et al., 2017) and SARNDVI (Hu et al., 2021). Compared with the parameter SARdiff, the parameter SARsub can make the value of most ground objects greater than 0, which can be better distinguished from σVH and σVV; Compared with the parameter SARNDVI, the parameter SARdiv makes the calculated value of dual-polarization backscattering coefficient of different ground objects not between 0 and 1, which can expand the range of value. This improves the distinction of different ground object types in wetlands and facilitates the threshold division in classification. The newly constructed formula SARsub and SARdiv are shown in (2) and (3):
Figure 3
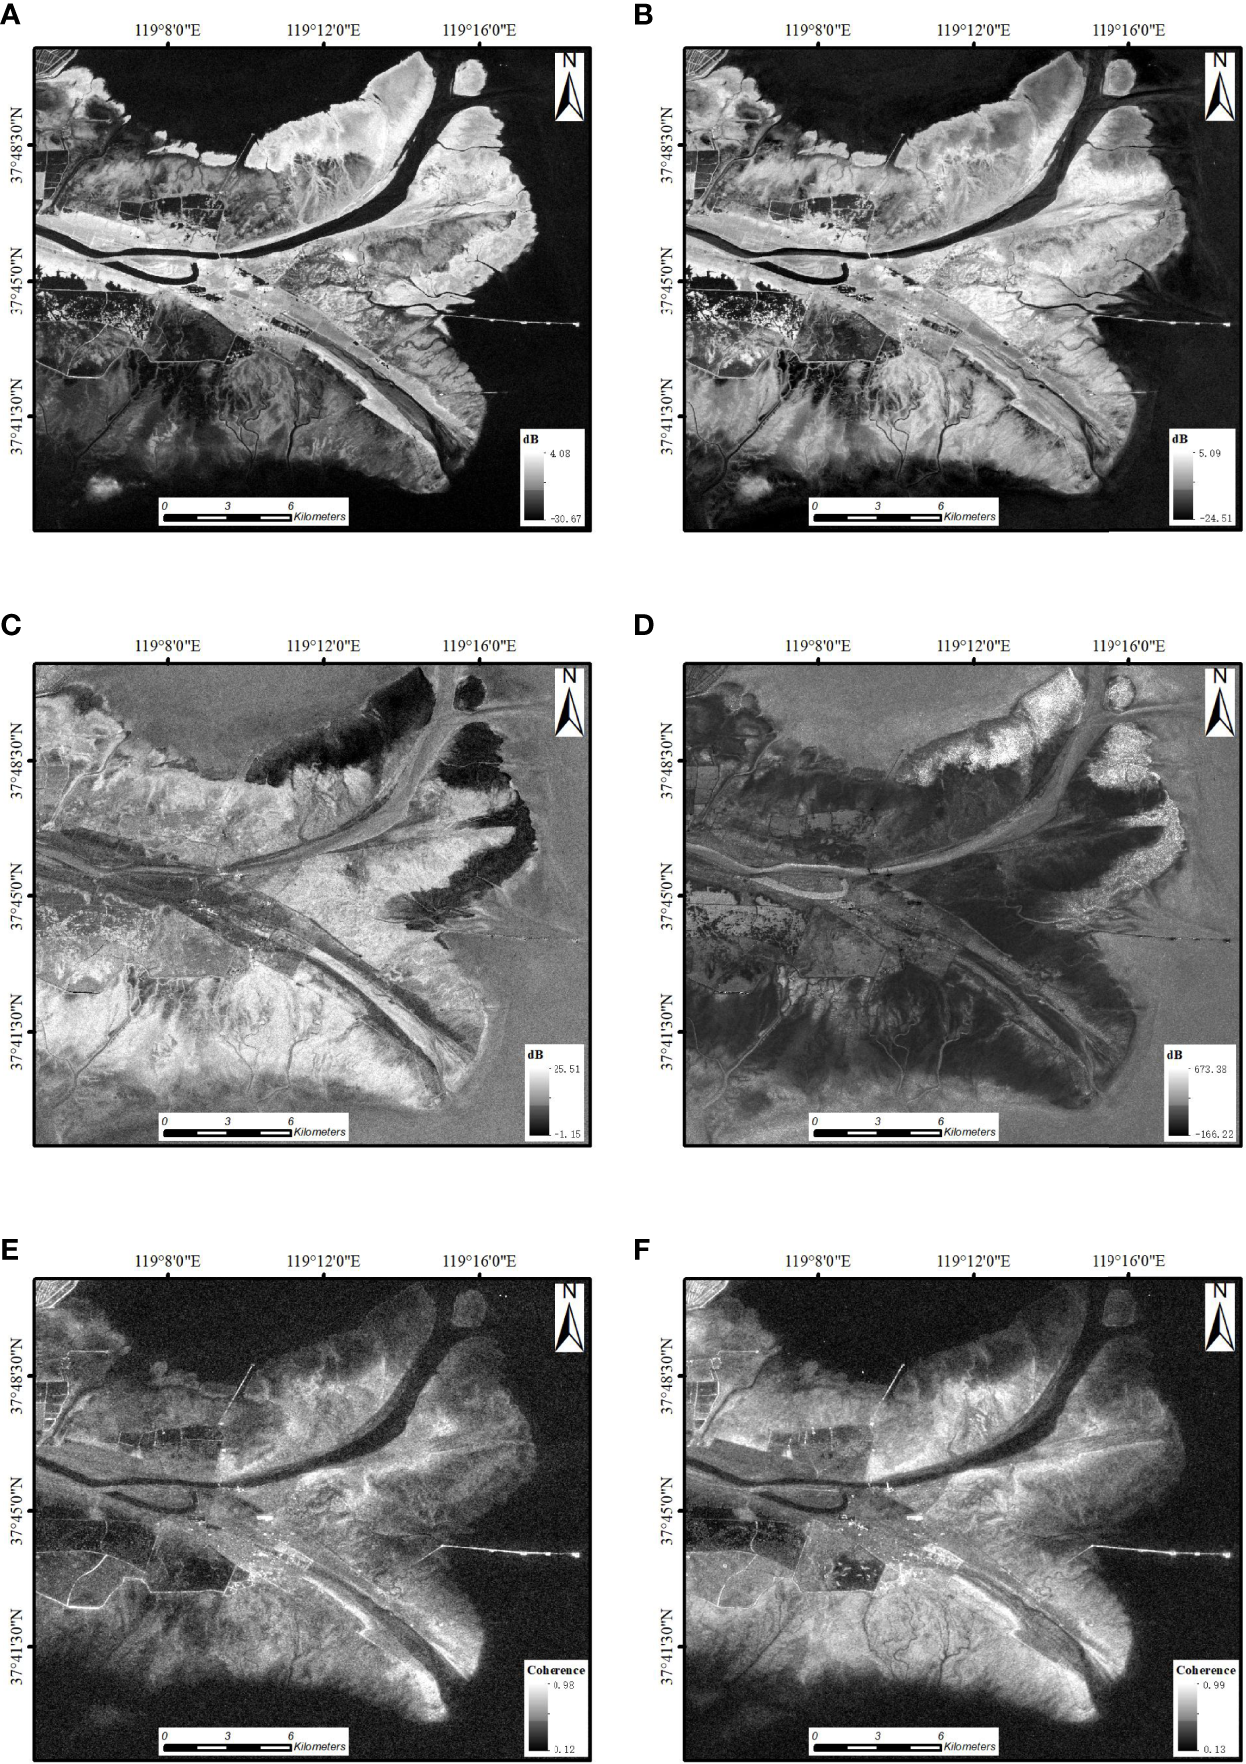
Annual mean backscattering and coherence maps of the study area. (A) is the annual mean backscattering coefficient map under VH polarization; (B) is the annual mean backscattering coefficient map under VV polarization; (C) is the SARsub map according to the formula (2); (D) is the SARdiv map according to the formula (3); (E) is the annual mean coherence coefficient map under VH polarization; and (F) is the annual mean coherence coefficient map under VV polarization. All legends are marked in the lower right corner of the figures.
Where,σVH represents the annual mean backscattering coefficient under VH polarization; σVV represents the annual mean backscattering coefficient under VV polarization. The unit of SARsub SARsub is dB. SARdiv is dimensionless value.
According to the established radar indices, the SARsub map and SARdiv map were calculated based on the annual mean backscattering coefficients maps of VH polarization and VV polarization, as shown in Figures 3C, D.
(2) Annual Mean Coherence Characteristics
Coherence (ranging between 0-1) is used to reflect the quality of interferogram. It is high if scatters remain unchanged and it is low if there is significant change in the scattering medium (Dammann et al., 2018; Wang et al., 2021b). For 16 dual-polarization Sentinel-1A SLC images after registration, Differential Interferometric Synthetic Aperture Radar (DInSAR) (Ou et al., 2018) was performed on every two scenes with adjacent dates and a total of 15 VH coherence maps and 15 VV coherence maps were acquired. The image before the date was the master image and the image after the date was the slave image. The temporal baseline of interferometric pairs was 12-36 days. The coherence coefficient is calculated according to the following formula (4) (Seymour and Cumming, 1994; Liu et al., 2016):
Where S1and S2 represent, respectively, two SLC complex images after registration; E{.} represents mathematical expectation; and * represents complex conjugate operator.
The same average operation is performed for the coherence coefficient maps to obtain the annual mean coherence map. The annual mean coherence maps under VH and VV polarization are shown in Figures 3E, F.
Analysis of Eigenvalues of Different Ground Object Types
Several Region of Interest (ROI) samples were established for statistical analysis of features of different ground object types. The selection of ROI was based on Google Earth images, GF-2 optical images, Sentinel-2 optical images, and study results of other scholars (Feng et al., 2019; Wang et al., 2022). Five types of ground object samples were selected in this study, including S. alterniflora, P. australis, Chinese tamarisk (C. tamarisk), tidal flats (T. flats), and water. A total of 340 ROI samples were selected. 70% of these samples were used for statistics and 30% of these samples were used for validation. The number of statistical samples was as follows: 56 S. alterniflora, 42 P. australis, 35 C. tamarisk, 84 T. flats, and 21 water. The number of validation samples was as follows: 24 S. alterniflora, 18 P. australis, 15 C. tamarisk, 36 T. flats, and 9 water. Figure 4 shows the sample distribution. The distribution of 238 statistical samples is shown in Figure 4A and the distribution of 102 verification samples is shown in Figure 4B. The background is Sentinel-2 true color image and the imaging time is July 16, 2018. Sentinel-2 is the basis for samples selection but it is not the only one.
Figure 4
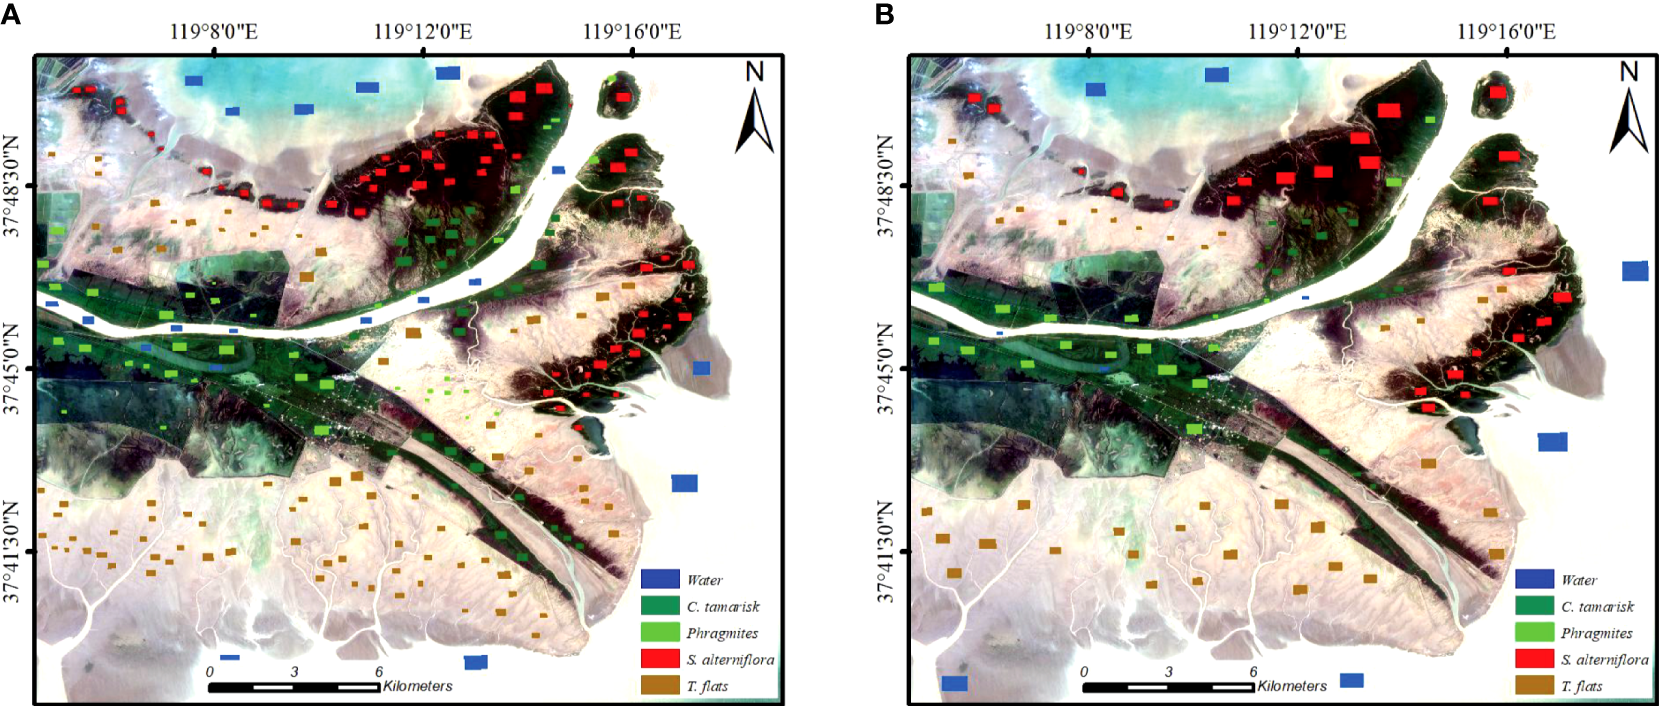
The distribution of samples. The background is the Sentinel-2 true color image, and the imaging time is July 16, 2018. (A) is the distribution of the statistical samples; (B) is the distribution of the verification samples.
The statistical method was the mean value method, that is, we calculated the mean value of backscattering coefficients or coherence of all ROI in the same object samples. The mean value of σVH, σVV, SARsub, SARdiv, γVH, and γVV of five ground objects types in 2018 were obtained, as shown in Figures 5A–D. Figure 5A represents the mean and standard deviation of backscattering coefficients at VH and VV polarization σVH and σVV . Figures 5B, C represent the mean and standard daeviation of the constructed radar indices SARsub and SARdiv , respectively. Figure 5D shows statistical coherence γVH and γVV. The mean and standard deviation of all statistical samples for every object are labeled in the figure.
Figure 5
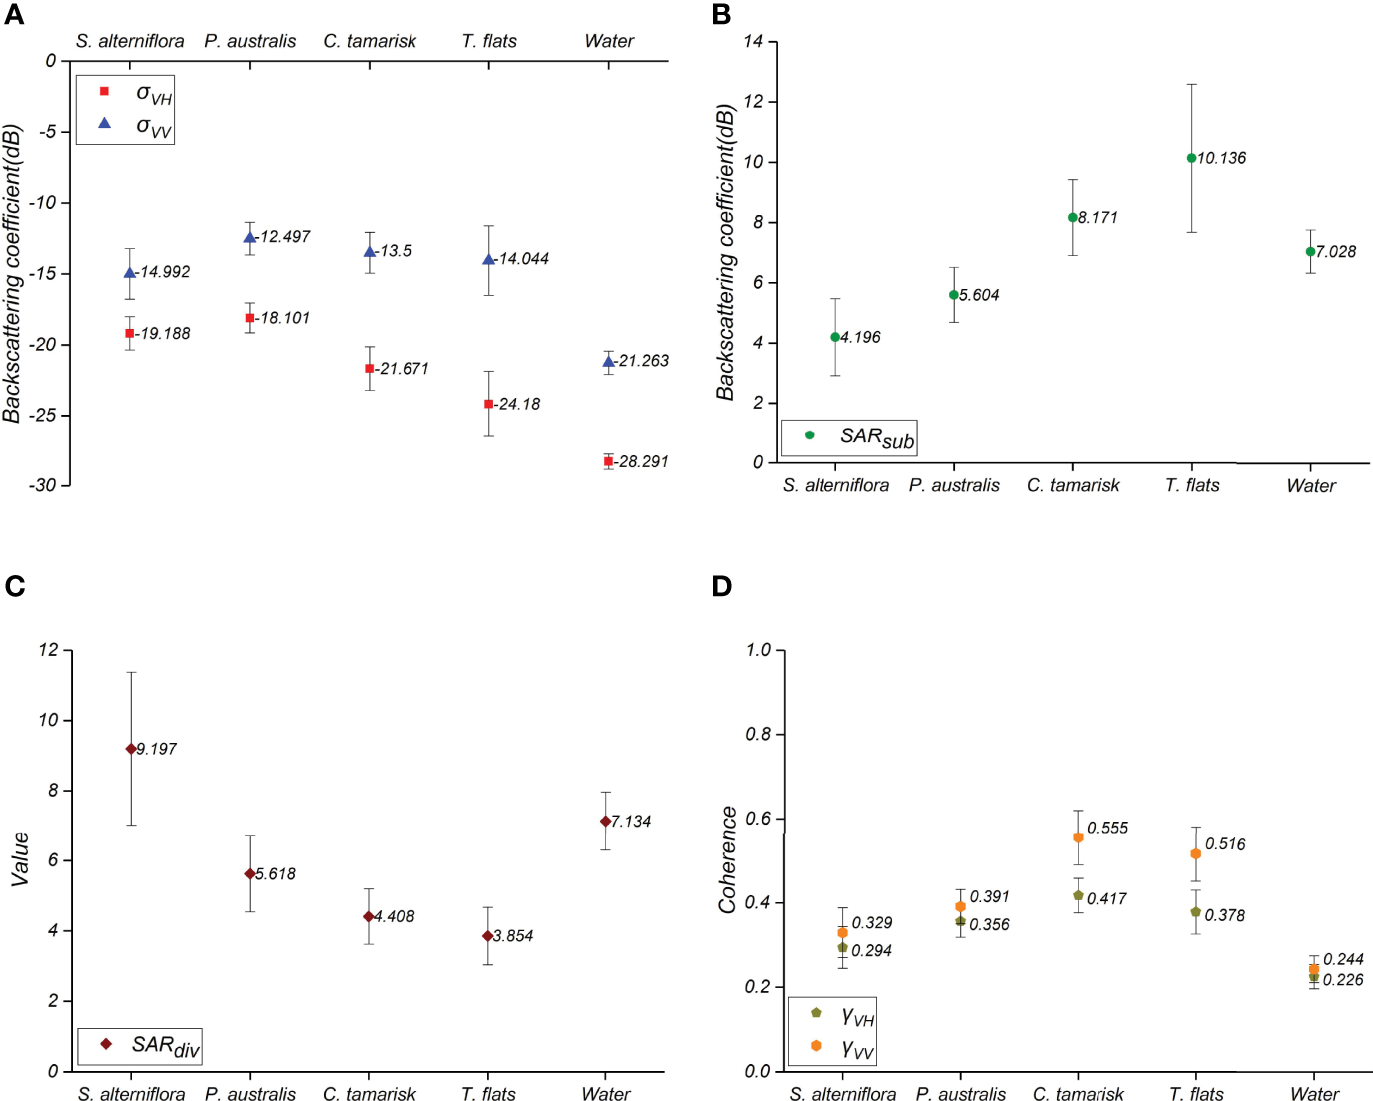
Mean and standard deviation of characteristic parameters of five objects through statistical analysis. (A) is the mean and standard deviation of VH and VV backscattering coefficients; (B) is the mean and standard deviation of radar index SARsub; (C) is the mean and standard deviation of radar index SARdiv; (D) is the mean and standard deviation of VH and VV coherence.
Establishing the Decision Tree
Through the analysis of Figures 5A, B, it can be found that the annual mean backscattering coefficients of water and other ground objects differ greatly. Then they can be easily distinguished from the annual mean backscattering coefficients under VH and VV polarization. Under VH polarization, the annual mean backscattering coefficients of S. alterniflora, P. australis and C. tamarisk are similar. Through the analysis of Figure 5C, the annual mean backscattering coefficients of all objects under VV polarization are relatively similar except water. This indicates that it cannot effectively distinguish ground objects only using VH and VV backscattering coefficients. Through the analysis of Figure 5D, the value of S. alterniflora and P. australis under the radar index SARsub is the smallest, and the relative difference with other ground objects is the greatest, while the value of T. flats is obviously greater than other ground objects. Although the value of C. tamarisk is close to water, the water has already been extracted in the first step, so C. tamarisk and T. flats can be extracted. The difference between S. alterniflora and P. australis under the radar index SARdiv is further magnified, and this can make them easy to distinguish. According to the above principles, the median value of the statistical mean of each two ground objects is taken as the threshold value and the decision tree is established according to the median value.
However, there are some limitations to the ground object types extraction process. For a single index or parameter, there is a certain contingency in the threshold division principle of median value, which may cause the reduction of classification accuracy when only relying on a single index to classify ground objects. Coherence differences can provide help to solve this problem. S. alterniflora grows in the humid coastal salt marsh and its coherence is quite different from that of vegetation in relatively dry areas (such as P. australis and C. tamarisk). Although it is difficult to distinguish all ground objects only based on coherence because some ground objects have similar coherence values, it can be introduced into decision tree as another index to distinguish S. alterniflora to supplement the omission of S. alterniflora extraction. S. alterniflora was easily confused with water when only relying on coherence to distinguish but water could be well extracted by the annual mean backscattering coefficient. Therefore, the distribution range of S. alterniflora can be obtained after water is extracted. We classified water and S. alterniflora into one category in Figure 6. Through analyzing Figure 6, they are distinguished from other ground objects only by the coherence characteristics under VH and VV polarization and the threshold is set as γVH < 0.32 and γVV < 0.36.
Figure 6
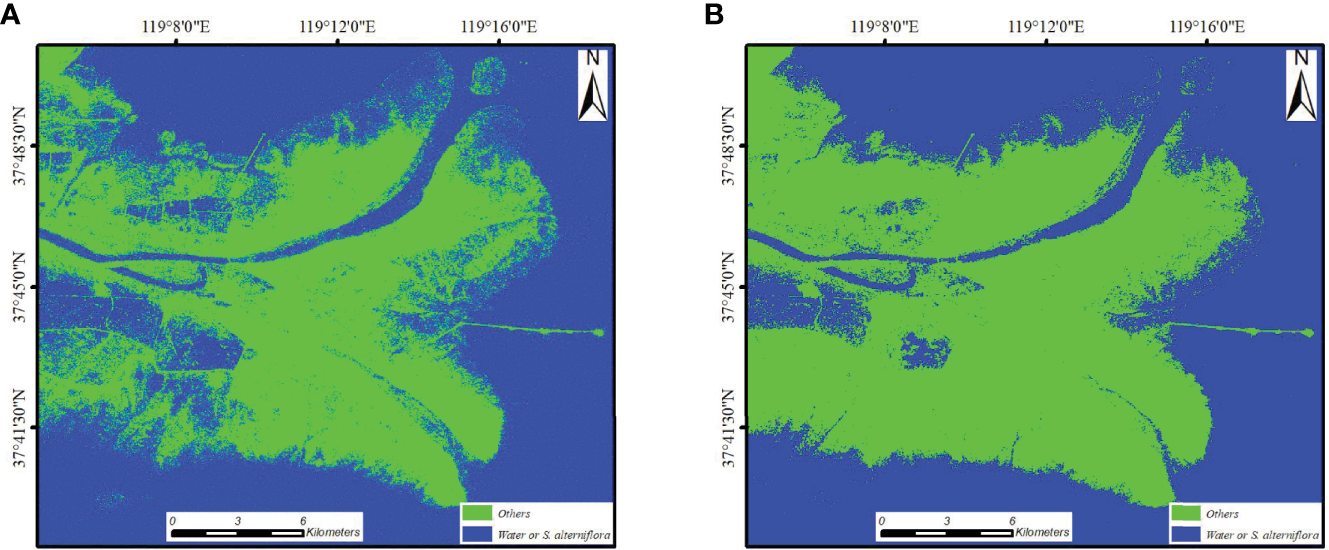
Coherence classification map. Water and S. alterniflora were classified into one category, and they were distinguished from other ground objects by coherence. (A) is the coherence classification map under VH polarization, when the threshold is set as γVH < 0.32, the ground object is classified as water or S. alterniflora; when the threshold is set as γVH > 0.32, the ground object is classified as others; (B) is the coherence classification map under VV polarization, when the threshold is set as γVV < 0.36, the ground object is classified as water or S. alterniflora; when the threshold is set as γVV < 0.36, the ground object is classified as others.
According to the characteristics of selected samples, a decision treefor monitoring the ground object types in the Yellow River Delta wetlands was established. Since water has been extracted in the first step of the decision tree, when the backscattering coefficient and coherence are used to extract S. alterniflora, there is no need to set the lower limiting value of coherence threshold. When γVH < 0.32 or SARdiv >7.4, the ground object is classified as S. alterniflora. Similarly, the difference of coherence can also provide help to solve the problem of misclassification and omission between C. tamarisk and T. flats. The median coherence between C. tamarisk and T. flats is selected as the distinguishing index. When γVH <0.38, the ground object is classified as T. flats. Figure 7 shows the constructed decision tree, where the black box represents the annual mean backscattering coefficient and the constructed radar index threshold setting and the red box represents the annual mean coherence threshold setting.
Figure 7
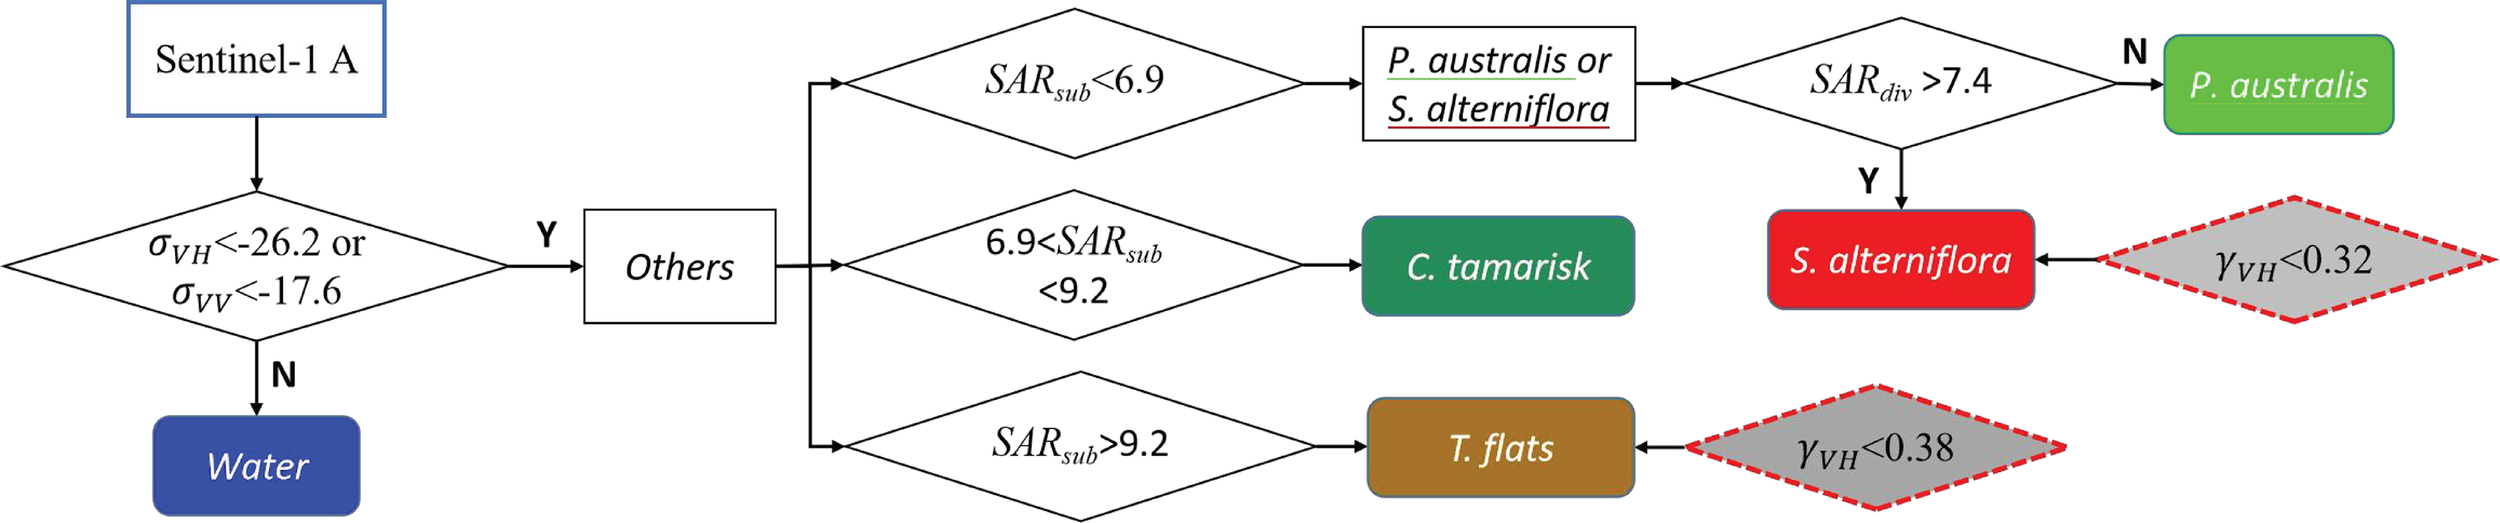
The decision tree constructed for monitoring the wetland ground types in the Yellow River Delta. Note that the black unfilled box represents the threshold setting of the annual mean backscattering coefficient and the constructed radar index, while the gray-filled red box represents the threshold setting of the annual mean coherence.
Multiple Temporal Classification
In order to show the advantages of the proposed method, the accuracy of the classification results of the proposed decision tree is compared with that of multi-temporal classification. It has become one of the important methods of ground object classification in the field of SAR remote sensing to make use of multiple temporal SAR images for pseudocolor synthesis and supervised classification by color difference of pseudocolor images (Lin and Perissin, 2018; Wang et al., 2018; Zhang et al., 2021). 16 Sentinel-1A GRD data and 16 Sentinel-1A SLC data with VH polarization were selected and the imaging time of GRD data and SLC data were consistent. The time series backscattering coefficient and coherence curves of different ground objects were drawn based on statistical samples, as shown in Figures 8A, B. In the time series coherence curve, the horizontal axis represents the date of the slave image of interferometric pairs, that is, January 22 represents the acquisition date of slave image of interferometric pairs between January 10 and January 22.
Figure 8
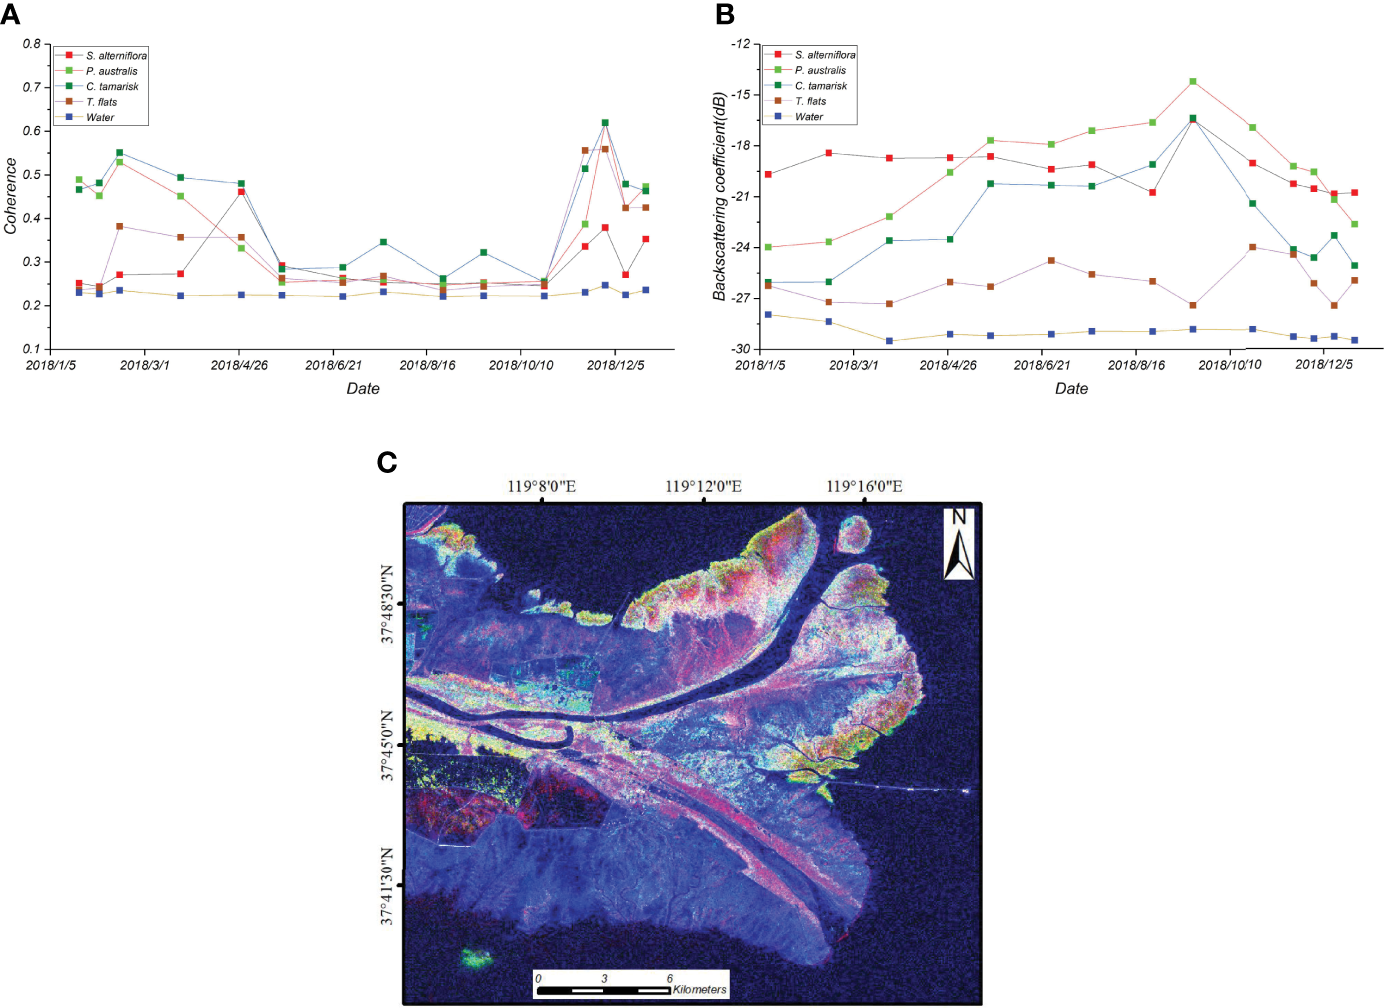
Multi-temporal classification preprocessing. (A) is statistical time series coherence curve in 2018; (B) is statistical time series backscattering coefficient curve in 2018; (C) is multi-temporal composite pseudocolor image. Note that the horizontal axis represents the date of the slave image of interferometric pairs, that is, January 22 represents the acquisition date of slave image of interferometric pairs between January 10 and January 22.
In the statistics of coherence of different ground objects, we found that there were great differences between the coherence of objects from January to April and from November to December. Especially in winter, the coherence of S. alterniflora was obviously different from others. From May to October, the coherence of all ground objects kept about 0.25, except for C. tamarisk. Based on the backscattering coefficient analysis, S. alterniflora was easily distinguished from other ground objects from January to April, while it was easily confused with other ground objects at other times. In June, in addition to S. alterniflora, differences from each other were relatively easy to distinguish. Based on the above analysis, three channels were selected for pseudocolor synthesis to achieve better classification effect. The channels were R (21/06/2018 VH backscattering), G (18/11/2018 VH backscattering) and B (coherence generated by interferometric pairs between 18/11/2018 to 30/11/2018). The synthetic pseudocolor image is shown in Figure 8C.
Support Vector Machine (SVM) (Cortes and Vapnik, 1995) is a kind of machine learning. The SVM firstly normalized the data and then the data to be classified is mapped to the factor space of high dimension to find the optimal decision boundary and divide the data into different categories. SVM is widely used in wetland vegetation monitoring because it can better deal with the imbalance of wetland vegetation samples (Ahmed et al., 2021; Zhang and Lin, 2022). In this paper, SVM method is used to classify the synthetic pseudocolor images.
Results
Classification Results
To achieve an analysis of ground object type changes in the Yellow River Delta wetlands from 2018 to 2021, the wetland classification results of the study area during that time were obtained based on the decision tree constructed in this paper, as shown in Figures 9A–D. Red, light green, dark green, brown, and blue represent S. alterniflora, P. australis, C. tamarisk, T. flats, and water, respectively. According to the classification results, S. alterniflora was distributed in large numbers on both sides of the estuary of the Yellow River and there were many interlacing areas with P. australis. From 2018 to 2021, the distribution range of ground objects in the Yellow River Delta has changed greatly in different years, especially the S. alterniflora and P. australis.
Figure 9
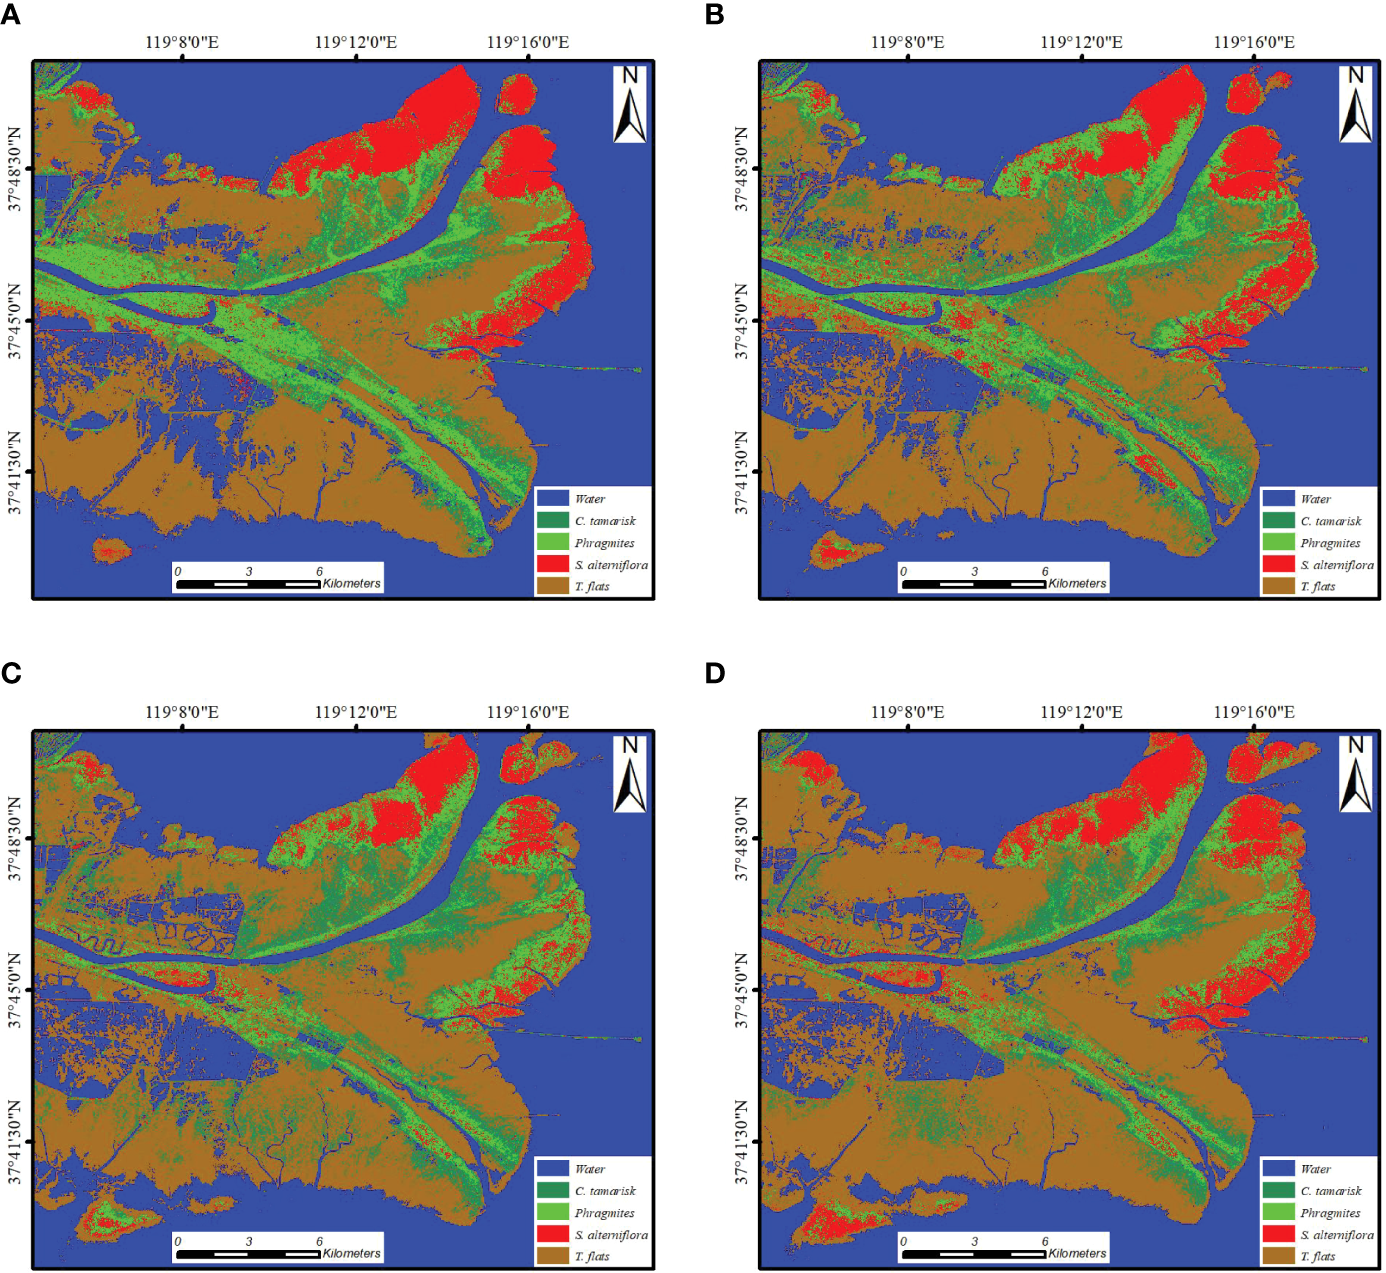
Classification results of the Yellow River Delta wetlands from 2018 to 2021 based on the decision tree constructed in this paper. (A) is classification result in 2018; (B) is classification result in 2019; (C) is classification result in 2020; (D) is classification result in 2021.
Accuracy Verification
The classification result of multiple temporal classification in 2018 is shown in Figure 10A. The classification result of the constructed decision tree in 2018 is shown in Figure 10B. Verification samples were used to establish confusion matrix (Townsend, 1971) and the result of multi-temporal classification was compared with the result from the decision tree constructed in this paper, as shown in Table 2.
Figure 10
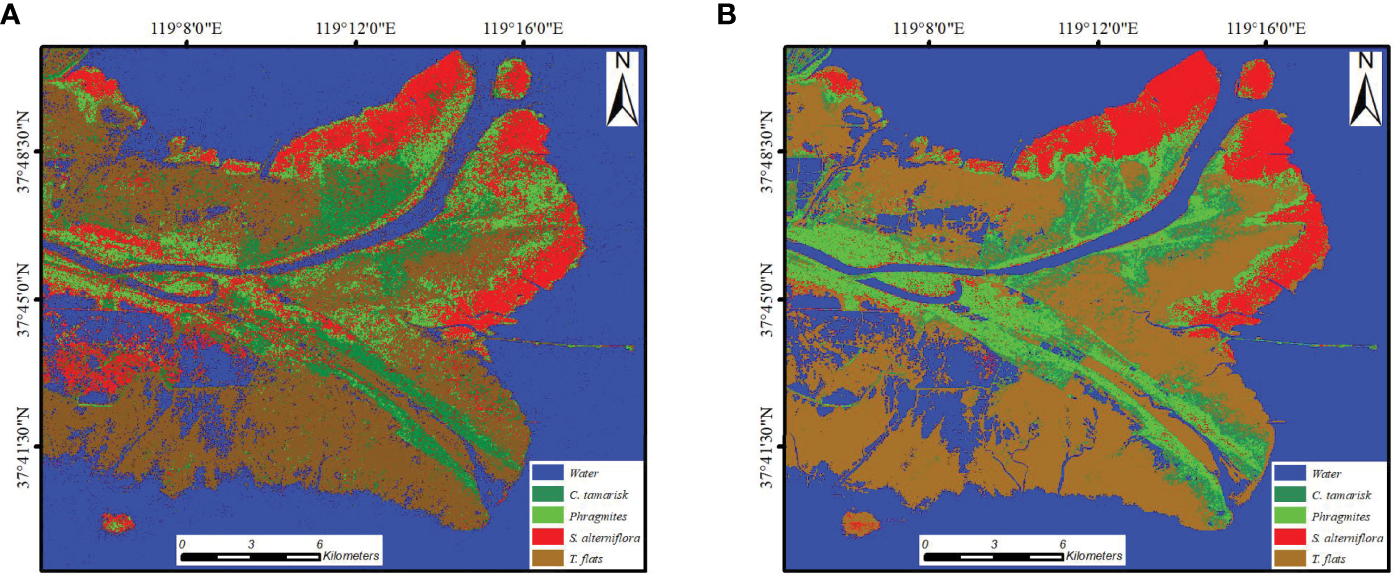
Classification results of different methods in 2018. (A) is the multi-temporal classification results based on SVM method. (B) is the classification results based on constructed decision tree.
Table 2
| Multi-temporal classification(%) | Decision tree classification(%) | |||||||||
|---|---|---|---|---|---|---|---|---|---|---|
| Types | S. alterniflora | P. australis | C. tamarisk | Water | T. flats | S. alterniflora | P. australis | C. tamarisk | Water | T. flats |
| S. alterniflora | 81.47 | 33.37 | 8.39 | 0.01 | 3.88 | 90.42 | 16.75 | 1.58 | 0.01 | 0.02 |
| P. australis | 8.59 | 48.81 | 0.31 | 0.00 | 0.59 | 7.14 | 78.95 | 34.08 | 0.00 | 0.53 |
| C. tamarisk | 7.35 | 14.02 | 74.68 | 0.00 | 5.29 | 0.02 | 1.12 | 47.90 | 0.00 | 4.33 |
| Water | 0.00 | 0.00 | 0.00 | 98.49 | 9.44 | 0.47 | 0.00 | 0.11 | 99.97 | 0.68 |
| T. flats | 2.59 | 3.80 | 16.62 | 1.50 | 80.80 | 1.95 | 3.17 | 16.33 | 0.02 | 94.45 |
| Total | 100.00 | 100.00 | 100.00 | 100.00 | 100.00 | 100.00 | 100.00 | 100.00 | 100.00 | 100.00 |
| Overall Accuracy | 79.512 | 89.504 | ||||||||
| Kappa Coefficient* | 0.734 | 0.861 | ||||||||
The confusion matrix of multi-temporal classification and decision tree classification.
*Kappa coefficients are not percentages. The bold value is the evaluation of the overall classification. The higher the value, the better the effect.
As shown in Table 2, the overall accuracy and Kappa coefficient of multi-temporal classification were 79.512% and 0.734. The overall accuracy and Kappa coefficient of decision tree classification were 89.504% and 0.861. Compared with the multi-temporal classification result, the overall accuracy of the decision tree classification result in this paper was improved by 9.992% and the Kappa coefficient was improved by 0.127. The decision tree constructed in this paper has advantages in all kinds of ground objects except C. tamarisk. In the multi-temporal classification result, the classification accuracy of P. australis was very low and there was a lot of confusion between P. australis and S. alterniflora, which caused a large error in the accurate monitoring of the invasion of S. alterniflora in the Yellow River Delta wetlands. In this paper, the monitoring accuracy of S. alterniflora and P. australis improved by 8.95% and 30.14%, respectively. In addition, there were many speckles in the multi-temporal classification result, which were also classified into different objects, resulting in accuracy loss. This was due to the influence of noise, while the new method in this paper avoided this phenomenon.
To verify the advantages of the proposed method, we compared the classification accuracy with the wetland classification results of other scholars. (Zhang et al., 2019) used L-band ALOS PALSAR satellite, combined with automatically selected samples and manually selected samples, and adopted the method of random forest classification to conduct wetland monitoring, achieving an accuracy of 89.79%. However, L-band SAR data are relatively few and the C-band SAR data in this paper can also achieve the same accuracy level. Wang et al. (2022) used Sentinel-2 optical images and full-polarimetric GF-3 SAR images to monitor wetlands and the overall accuracy was 86.18%. In this paper, higher accuracy was obtained using only Sentinel-1A data. Canisius et al. (2019) used the intensity and coherence of RADARSAT-2 to classify wetlands with an overall accuracy of 86%. In this paper, the combination of the backscattering coefficient and coherence can achieve better classification results. Therefore, the classification method proposed in this paper has some advantages and shows better accuracy compared with some relevant studies.
Discussion
Optimal Coherence Characteristics for Wetland Classification
To explore the difference in the contribution of coherences under different polarization to the classification accuracy, the classification results were obtained in four cases, including no coherence, only introducing VH coherence, only introducing VV coherence, and introducing both VH and VV coherence, as shown in Figures 11A–D. Here, S. alterniflora is taken as an example to illustrate the establishment of decision tree under different polarization coherence is introduced. When γVH <0.32 or SARdiv > 7.4, the ground object is classified as S. alterniflora under the condition when only introducing the VH coherence. When γVV <0.36 or SARdiv >7.4, the ground object is classified as S. alterniflora under the condition when only introducing the VV coherence. When γVH <0.32, or γVV < 0.36, or SARdiv > 7.4, the ground object is classified as S. alterniflora under the condition when introducing the coherence of VH and VV polarization. Figure 11 shows that whether only introducing VH coherence, only introducing VV coherence, or introducing both VH and VV coherence, these classification results all changed greatly and the degree of distinction between different ground objects is greater. The red area on both sides of the Yellow River estuary is denser and more uniform than the classification results based only on the backscattering coefficient, which is more consistent with the real distribution of S. alterniflora. This shows that the introduction of annual mean coherence can significantly improve the extraction accuracy of wetland ground object types. In addition, it is unrealistic for a large number of C. tamarisk to be distributed on the T. flats in Figure 11A. In Figures 11B–D, many T. flats which are misclassified as C. tamarisk have also been corrected.
Figure 11
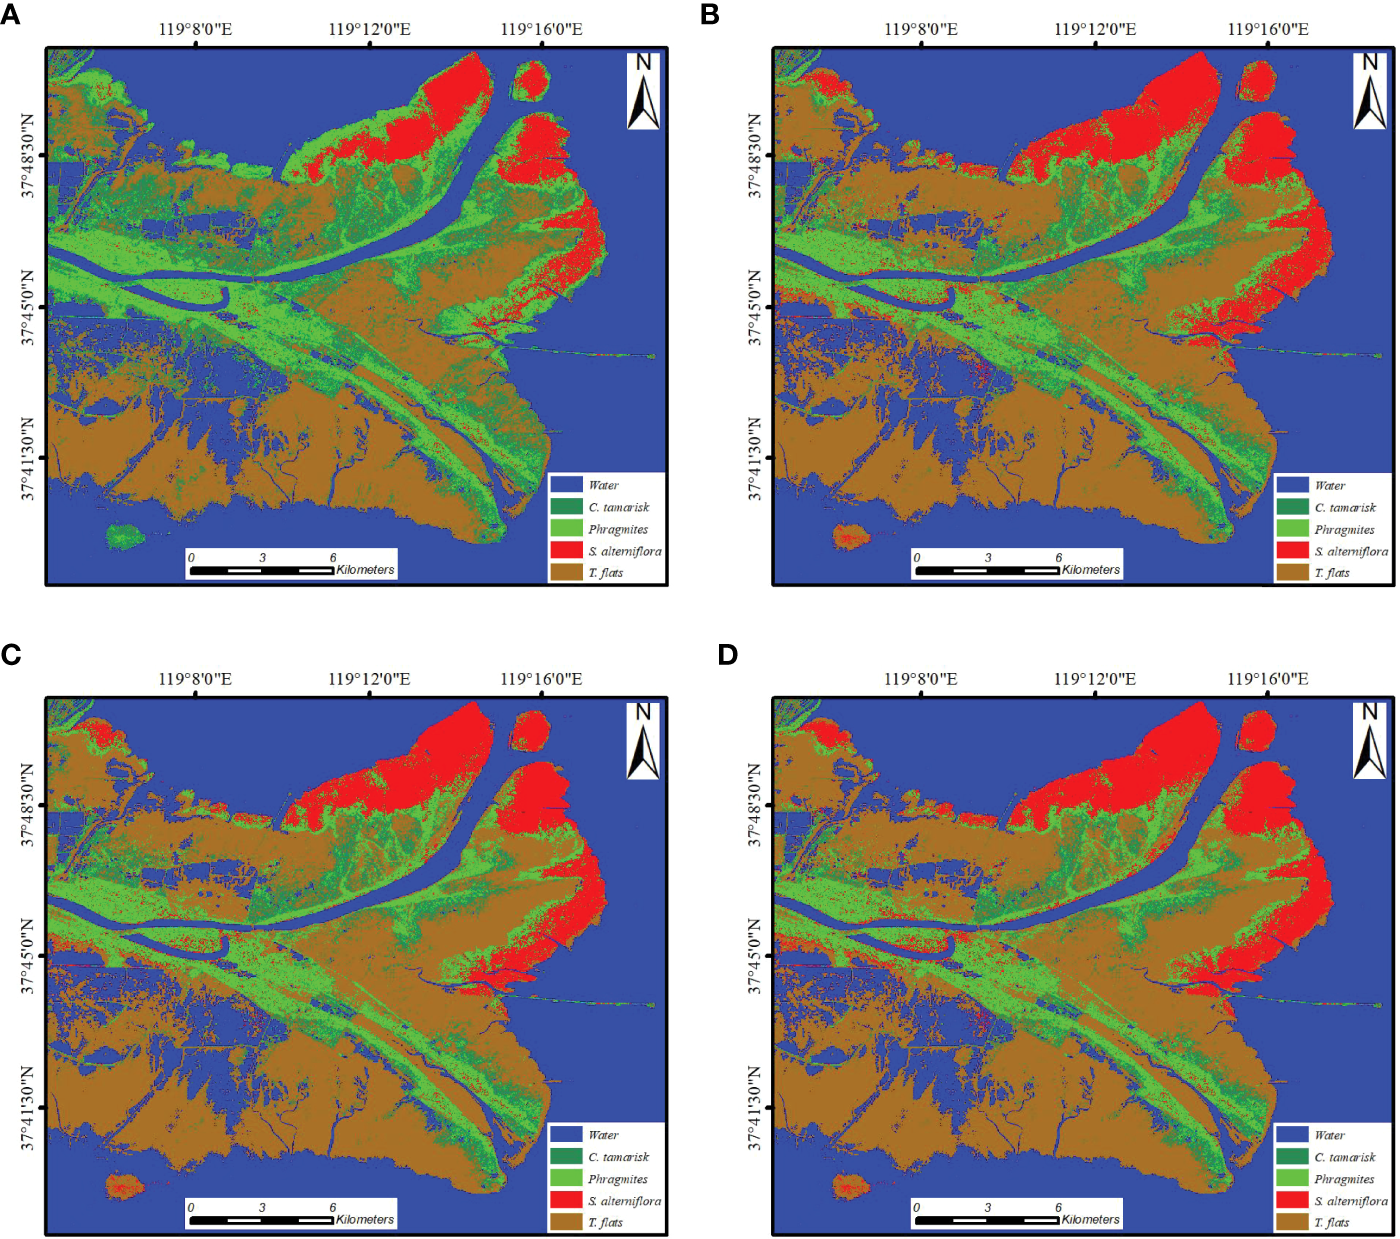
Classification results of the Yellow River Delta wetlands in 2018. (A) is the classification results with no coherence; (B) is the classification results with only introducing VH coherence; (C) is the classification results with only introducing VV coherence; (D) is the classification results with introducing both VH and VV coherence.
Based on the classification results and the verification samples, the confusion matrix was established and the classification accuracy of the decision tree was obtained by only relying on the annual mean backscattering coefficient of dual-polarization and the annual mean coherence coefficient of different polarization, as shown in Table 3. According to Table 3, the overall accuracy and Kappa coefficient of the classification after introducing the coherence under any polarization were higher than those based only on the backscattering coefficient. When coherence was not introduced, the overall accuracy of classification was 80.650%, and the Kappa coefficient was 0.752. When only introducing VH coherence, the overall accuracy of classification was 89.504%, and it improved by 8.854%. The Kappa coefficient was 0.861 and it improved by 0.109. When only introducing the coherence under VV polarization, the overall accuracy of classification was 87.257% and it improved by 6.607%. The Kappa coefficient was 0.831 and it improved by 0.079. When introducing both the coherence of VH and VV polarization, the overall accuracy of classification was 88.944% and it improved by 8.294%. The Kappa coefficient was 0.852 and it improved by 0.100.
Table 3
| Land types | Prod. Acc | User. Acc | Overall Accuracy(%) | Kappa Coefficient | |
| No coherence | S. alterniflora | 64.70 | 96.91 | 80.650 | 0.752 |
| P. australis | 88.72 | 33.06 | |||
| C. tamarisk | 56.46 | 52.24 | |||
| T. flats | 85.78 | 97.16 | |||
| Water | 99.97 | 98.72 | |||
|
Introduce
VH coherence |
S. alterniflora | 90.42 | 95.31 | 89.504 | 0.861 |
| P. australis | 78.95 | 52.49 | |||
| C. tamarisk | 47.90 | 76.57 | |||
| T. flats | 94.45 | 91.90 | |||
| Water | 99.97 | 98.72 | |||
|
Introduce
VV coherence |
S. alterniflora | 88.68 | 95.58 | 87.257 | 0.831 |
| P. australis | 80.19 | 50.37 | |||
| C. tamarisk | 33.07 | 62.37 | |||
| T. flats | 92.50 | 87.42 | |||
| Water | 99.97 | 98.72 | |||
| Introduce VH and VV coherence | S. alterniflora | 93.74 | 94.00 | 88.944 | 0.852 |
| P. australis | 72.51 | 55.75 | |||
| C. tamarisk | 31.06 | 75.95 | |||
| T. flats | 95.68 | 87.25 | |||
| Water | 99.97 | 98.72 |
The classification accuracies with combining different polarization coherence.
The bold value is the evaluation of the overall classification. The higher the value, the better the effect.
Since P. australis and S. alterniflora are prone to misclassification in optical images or UAV images, we focused on their accuracy changes. The results showed that the classification accuracy of S. alterniflora was the highest when introducing VH and VV coherence and the producer accuracy improved by 29.04% while the user accuracy decreased by 2.91%. The producer accuracy of P. australis decreased by 16.21% while the user accuracy improved by 22.69%. In general, the use of coherence played a positive role in the classification of P. australis and S. alterniflora. Although the classification accuracy of S. alterniflora was the highest when introducing both VH and VV coherence, the overall classification accuracy was the best when only introducing VH coherence. Therefore, in the decision tree classification of the study area in this paper when only introducing VH coherence. In the case of only introducing VH coherence, the producer accuracy of S. alterniflora improved by 25.72% and the user accuracy decreased by 1.60%. The producer accuracy of P. australis decreased by 9.77% and the user accuracy improved by 19.43%.
Although the coherence significantly improved the overall accuracy and the classification accuracy of S. alterniflora, the classification accuracy of C. tamarisk was still relatively low. This is mainly because the coefficient of suaeda and C. tamarisk in the statistical process of radar index is very close, and the distribution of the suaeda area is small and scattered. Suaeda was neglected in classification in this paper, which also resulted in low classification accuracy of C. tamarisk.
Competitive Analysis of P. australis and S. alterniflora
The area for this study was about 505.35 km2 and the water area is approximately about 220 km2 to 230 km2. During 2018-2021, there were no large-scale artificial activities like reclaiming the lake and mining ponds therefore, the area of water remained stable. The invasion of S. alterniflora caused damage to native species and P. australis was the specie that was most seriously affected by the invasion. Therefore, the distribution areas and their respective proportions of S. alterniflora and P. australis during 2018-2021 were statistically analyzed in this paper. The statistical graph of area changes and proportion changes are shown in Figures 12A, B.
Figure 12
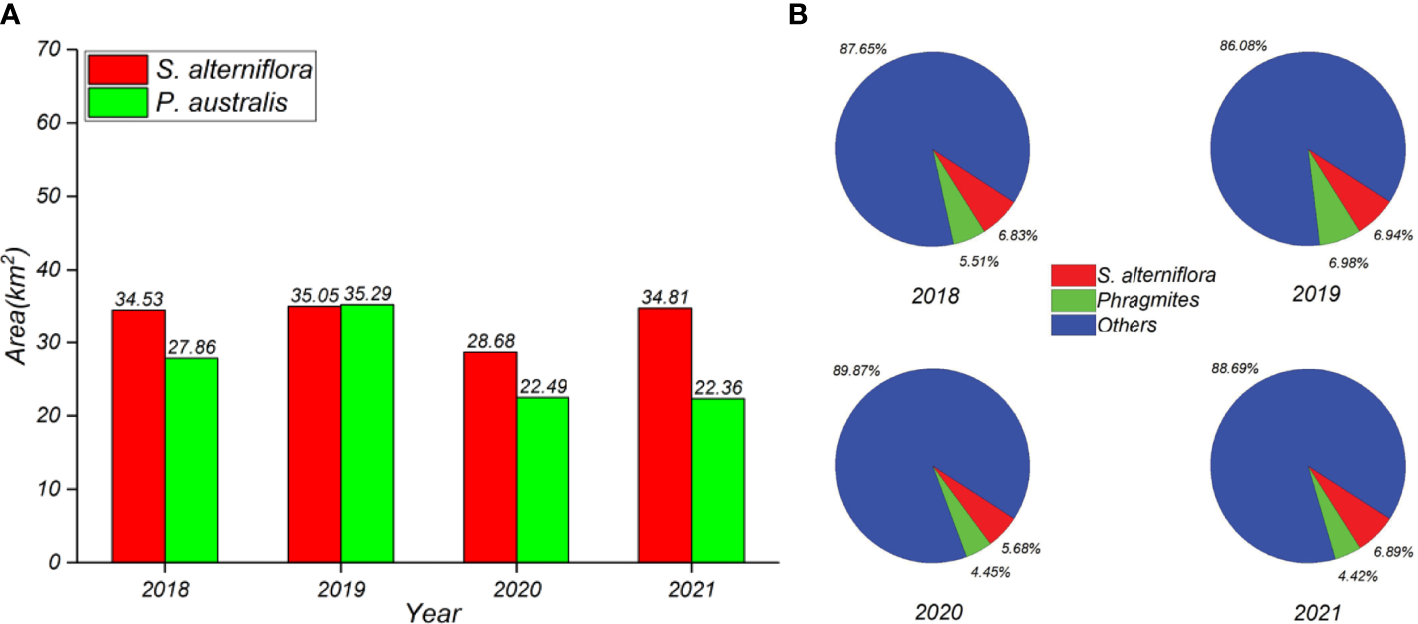
Statistical graph of S. alterniflora and P. australis from 2018 to 2021. (A) is the area statistical graph; (B) is the proportion change graph.
According to Figure 12, the area of S. alterniflora in the study area in 2018 was 34.53 km2, much larger than 27.86 km2 of P. australis. In 2019, the area of S. alterniflora was 35.05 km2, which basically remained stable. During this period, the P. australis achieved its expansion to 35.29 km2 by mainly extending to T. flats, and the proportion of S. alterniflora and P. australis had also become almost the same. In 2020, as the invasion of S. alterniflora received more attention, artificial removal methods such as mowing and plowing had begun to appear in the Yellow River Delta and the area of S. alterniflora had decreased significantly. However, because S. alterniflora intersects with P. australis in many places, many P. australis were also removed during the large-scale removal process, which caused a simultaneous reduction in the area of P. australis and S. alterniflora. In 2021, the area of S. alterniflora returned to the level in 2018, reaching 34.81 km2. However, the area of P. australis did not rise again and was still at 22.36 km2. The area proportion of S. alterniflora had increased significantly, even exceeding that in 2018. S. alterniflora gradually occupied the absolute advantage in the competition for coastal wetlands.
In order to verify the reliability of the classification results in this paper, the results were compared to that of other scholars. In this study, S. alterniflora almost occupied the entire coastline on both sides of the Yellow River estuary in 2018, covering a large area. This is consistent with the classification results of Fu et al. (2021) and Wang et al. (2022). According to the classification results in 2019, the distribution of S. alterniflora changed and the area of S. alterniflora decreased. It was replaced by P. australis along both coasts of the Yellow River estuary, which was consistent with the classification results of Hu et al. (2021) and Li et al. (2022). In 2020, the number of S. alterniflora obviously decreased, especially on the west side of the Yellow River estuary. P. australis expanded to the central area of S. alterniflora, which was similar to the classification results of Tu et al. (2021).
The growth cycle of S. alterniflora is different from that of other native vegetation. It starts to germinate in March and mature from August to December. P. australis begin to germinate from March to April, bloom from July to August, and mature from September to October. The different growth cycles make it difficult to control local S. alterniflora. When the P. australis has withered, S. alterniflora is still in the mature stage, occupying the area of P. australis and continuing to expand. However, the germination period of P. australis was similar to S. alterniflora, and slightly later than S. alterniflora. As time goes on, more P. australis invade the S. alterniflora (Lin et al., 2015; Zeng et al., 2020). Therefore, artificial management methods are urgently needed to prevent the occurrence of this phenomenon.
At present, the removal of S. alterniflora—an invasive species in the Yellow River Delta—is mainly carried out by mowing and plowing. Although this can quickly reduce the S. alterniflora on the surface in a short period of time (such as in 2020) to make it disappear from the image, due to the long rhizomes, strong survival, and reproduction ability, it is difficult to completely eliminate it. In addition, there are always numerous previously propagated S. alterniflora seeds in the T. flats and the process of mowing and plowing has little effect on the destruction of the seeds, which also led to the regrowth of S. alterniflora in the second year. Due to the lack of a natural enemy, its area is back to higher levels. According to the statistical graph, the area of S. alterniflora in 2021 is even higher than that in 2018, indicating that the effect of removal work is not sustainable. Due to its strong invasive ability, S. alterniflora occupied the original living space of P. australis on the T. flats after the P. australis were removed. Therefore, it is still necessary to adopt more effective methods to manage S. alterniflora in the study area to maintain the healthy development of the Yellow River Delta wetlands system.
Spatio-Temporal Evolution of S. alterniflora
Although the area difference between 2018 and 2021 was not significant, the annual distribution of S. alterniflora remained significantly different over the four years of evolution. To better study the growth trend of S. alterniflora and its influence on other ground objects in the Yellow River Delta, we obtained the land use type conversion map between S. alterniflora and other ground objects in the three periods of 2018-2019, 2019-2020, and 2020-2021, as shown in Figure 13.
Figure 13
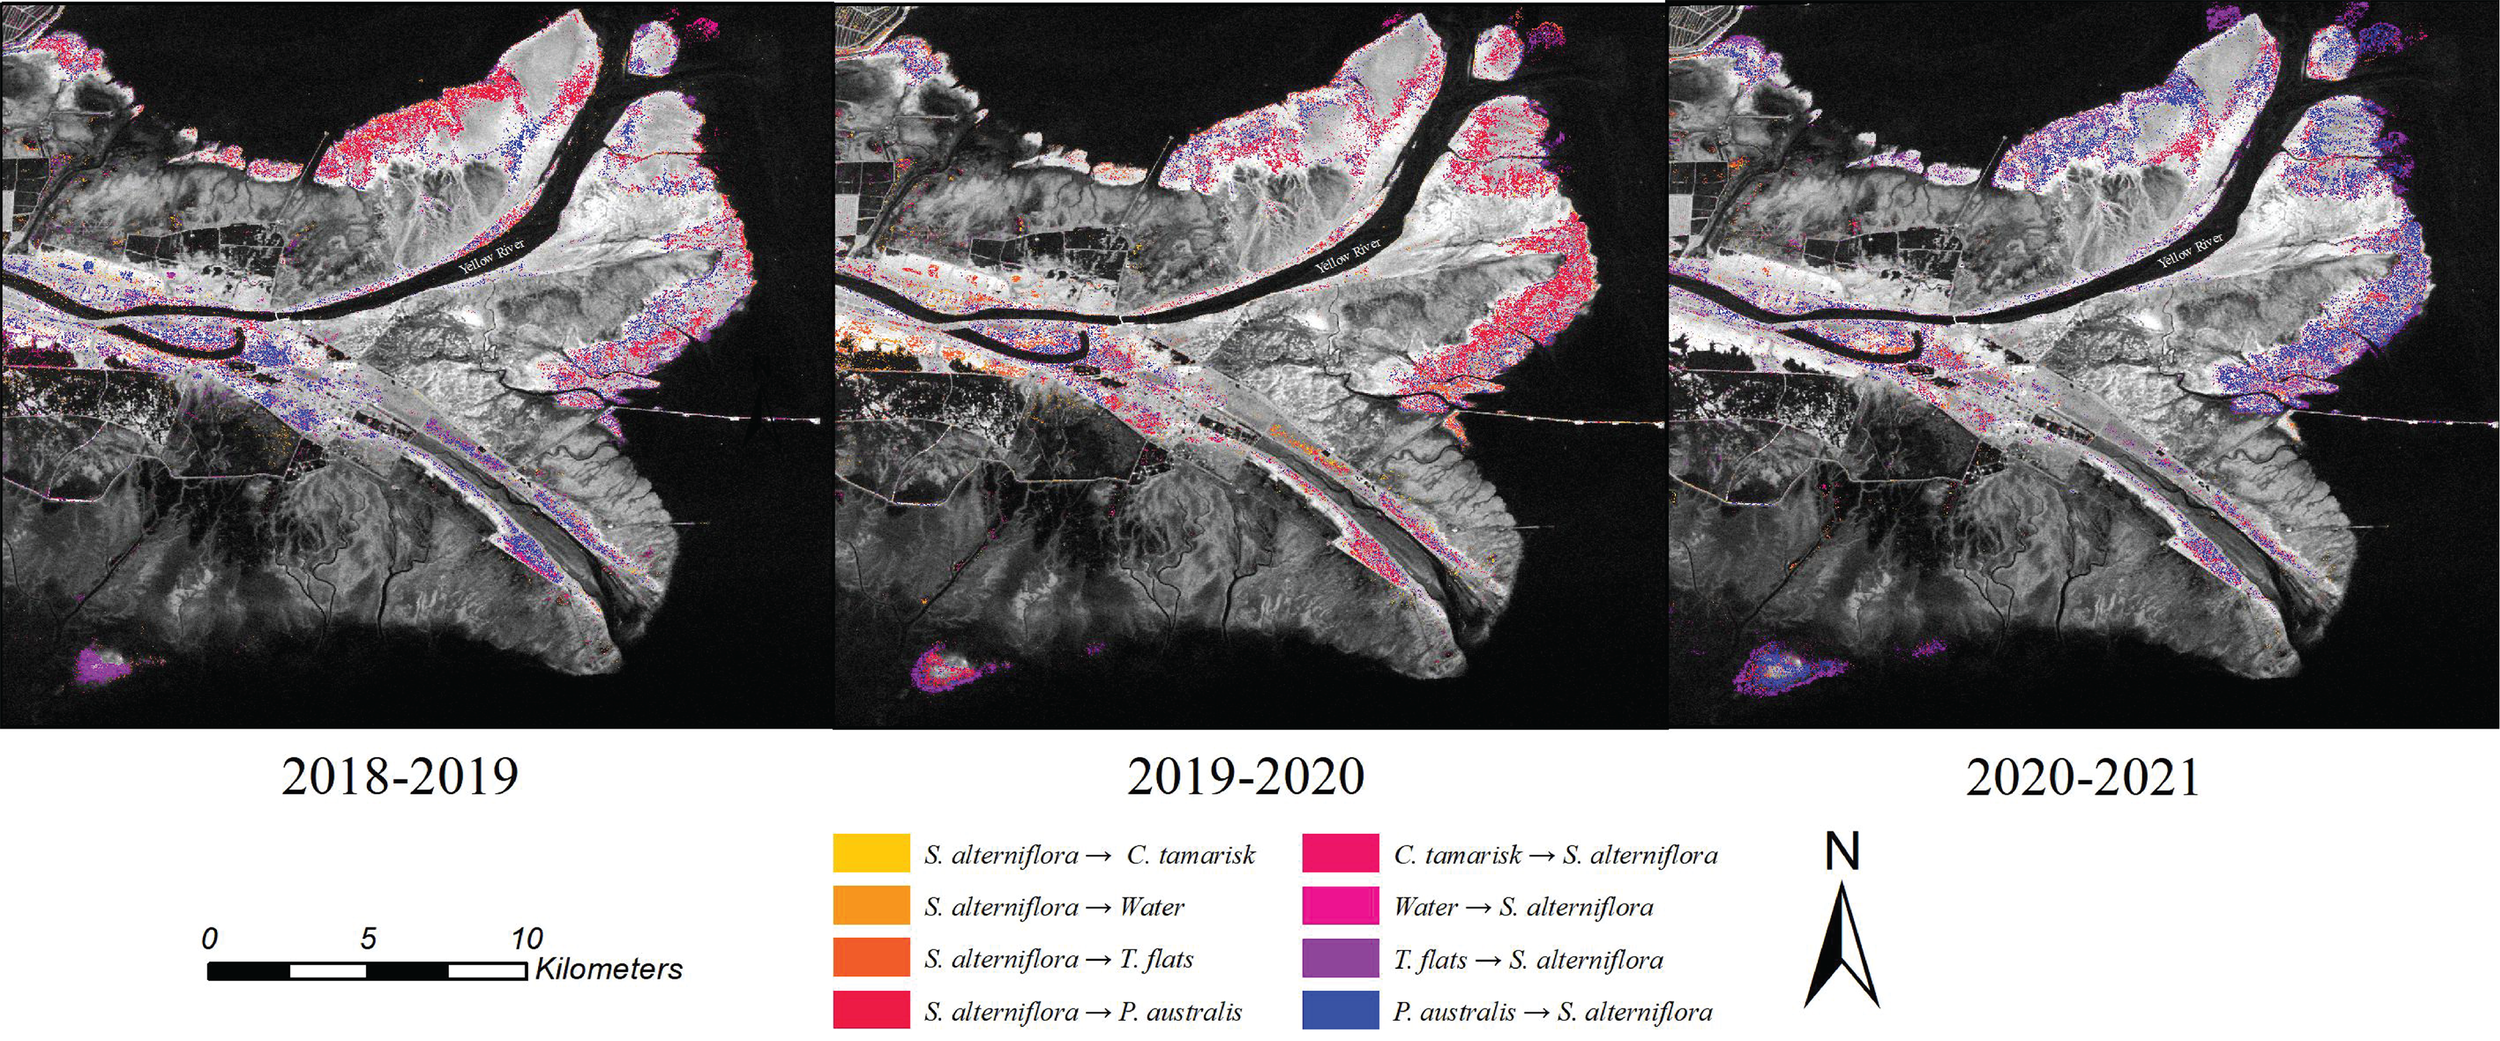
Land use type conversion map. The time corresponding to each map is marked at the bottom of the figure and the legend of ground object conversion type is marked at the bottom center of the figure.
According to Figure 13, between 2018-2019, much of the area formerly occupied by S. alterniflora on the north shore of the estuary coast of the Yellow River became occupied by P. australis (marked in red). But in the middle of the Yellow River on both sides, S. alterniflora began to appear and the distribution area is large, indicating that S. alterniflora began to occupy other areas; From 2019 to 2020, due to the gradual artificial removal of S. alterniflora, the area occupied by S. alterniflora began to reduce, especially east of the Yellow River estuary, where a large number of S. alterniflora were converted to P. australis, indicating that the governance effect was relatively successful in a short period. Between 2020-2021, S. alterniflora reappeared in several areas, and Figure 13 shows the blue area as very densely distributed on the east and west sides of the Yellow River estuary and the northwest side of the study area. More seriously, S. alterniflora also began to appear on isolated islands along the southern coast of the study area. As time goes by, S. alterniflora can easily spread to the southern coast, causing a greater risk of invasion.
The reliability of the evolutionary analysis in this paper is verified by combining the results of other scholars. According to the monitoring results in this paper, the area of S. alterniflora increased in 2018-2019, which was basically consistent with the monitoring results of Wang et al. (2021). In addition, the evolution process of S. alterniflora in this paper is basically consistent with the extraction results of S. alterniflora in different years by other scholars (Wang et al., 2022; Fu et al., 2021; Tu et al., 2021; Li et al. 2022), so the reliability of monitoring results in this paper can be confirmed.
The total area of S. alterniflora remained stable but the distribution changed significantly. The distribution of S. alterniflora from concentrated distribution along both sides of the Yellow River estuary in 2018 to multiple distributions in 2021 posed a challenge to the local ecological protection. To explore the invasion status of S. alterniflora to other ground objects, the transfer matrix between S. alterniflora and other ground objects from 2018 to 2021 was calculated, as shown in Table 4.
Table 4
| Type | P. australis (km2) | C. tamarisk (km2) | T. Flats (km2) | Water (km2) |
|---|---|---|---|---|
| From S. alterniflora to others | 3.872 | 0.272 | 2.194 | 0.291 |
| From others to S. alterniflora | 10.485 | 0.901 | 5.627 | 0.385 |
The land use type transfer matrix from 2018 to 2021.
According to Table 4, from 2018 to 2021, P. australis was the most seriously invaded of all ground objects, with 10.485 km2 of P. australis being invaded by S. alterniflora. Meanwhile, 5.627 km2 of T. flats was occupied by S. alterniflora. In conclusion, although the total area of S. alterniflora remained stable, it still caused great damage to other native species due to its super reproductive ability and lack of natural enemy in China.
Conclusions
In order to solve the problem of low accuracy of wetland classification by only relying on radar backscattering coefficient, this paper constructed a decision tree classification method combined time series SAR backscattering and coherence characteristics. Based on the annual mean VH and VV backscattering characteristics, the constructed radar backscattering indices SARsub and SARdiv and the annual mean VH coherence characteristics, a decision tree suitable for extracting the wetland types was established to monitor the ground object types in the Yellow River Delta wetlands from 2018 to 2021. In addition, the wetland types were analyzed and the spatio-temporal evolution of S. alterniflora was emphatically discussed. Through this study, the following valuable conclusions can be obtained:
-
(1) The overall accuracy and Kappa coefficient of the proposed method are 89.504% and 0.860. Compared with the multi-temporal classification by SVM classifier, the overall accuracy and Kappa coefficient are improved by 9.992% and 0.127. Except for C. tamarisk, it can obtain a higher precision for other ground object types. The monitoring accuracy of S. alterniflora and P. australis improved by 8.95% and 30.14%, respectively. In addition, the proposed method avoids the influence of noise during multi-temporal classification and the result is closer to reality.
-
(2) The contribution of coherence under different polarization to wetland classification accuracy is discussed. Compared with only using the annual mean backscattering coefficient, the overall accuracy of decision tree classification of the Yellow River Delta wetlands, with introducing the annual mean VH coherence, improved by 8.854% and the Kappa coefficient improved by 0.109. The producer accuracy of S. alterniflora improved by 25.72% and user accuracy decreased by 1.60%. The producer accuracy of P. australis decreased by 9.77% and user accuracy improved by 19.43%. Although it can achieve better classification results of S. alterniflora when introducing the annual mean VH and VV coherence, the overall accuracy is lower than only introducing the VH coherence. Therefore, it is more suitable for wetland classification in the Yellow River Delta when only introducing VH coherence.
-
(3) The wetland classification results of the Yellow River Delta from 2018 to 2021 were obtained by using the constructed decision tree, and the spatio-temporal evolution analysis of wetland types was carried out. It was concluded that the area of S. alterniflora remained stable in 2018-2019, about 35 km2, and decreased significantly to 28.68 km2 in 2020. But in 2021, it increased again to the area of 2018. This suggested that the removal work of S. alterniflora was not sustainable. In addition, according to the land use type conversion map and transfer matrix of S. alterniflora, the invasion of S. alterniflora has seriously affected the living space of P. australis. From 2018 to 2021, 10.485 km2 of P. australis was converted to S. alterniflora, and 5.627 km2 of T.flats was occupied by S. alterniflora. More effective methods are needed to eliminate S. alterniflora.
In this paper, the time series backscattering coefficients and coherence are combined to obtain a classification result in Yellow River Delta wetlands with higher accuracy than using only backscattering coefficients. It provides a theoretical basis for achieving a higher accuracy of wetland classification using SAR data (Sentinel-1A of different product levels). At the same time, through the detailed evolution analysis of the Yellow River Delta wetland, the relevant results can provide a reference for local wetland protection. However, this paper only divided five kinds of ground objects and ignored the ground objects such as suaeda and buildings, so the results are not detailed enough. In addition, the classification accuracy of C. tamarisk in this paper is low and more effective methods should be explored to solve this problem in the future.
Funding
This research is funded by the Major Science and Technology Innovation Projects of Shandong Province (No. 2019JZZY020103). This research is supported by funding from the National Natural Science Foundation of China (No. 41876202).
Publisher’s Note
All claims expressed in this article are solely those of the authors and do not necessarily represent those of their affiliated organizations, or those of the publisher, the editors and the reviewers. Any product that may be evaluated in this article, or claim that may be made by its manufacturer, is not guaranteed or endorsed by the publisher.
Statements
Data availability statement
The original contributions presented in the study are included in the article/supplementary material. Further inquiries can be directed to the corresponding author.
Author contributions
ZL collected and analyzed the data, and wrote the manuscript. ZW proposed the method, designed its structure and revised the manuscript. XL and YZ helped in collecting and analyzing the data. KW and TZ critically revised the manuscript. All authors contributed to the article and approved the submitted version.
Acknowledgments
We thank the European Space Agency (ESA) for providing the Sentinel-1A remote sensing data. We thank the National Aeronautics and Space Administration (NASA) for providing the SRTM DEM data. We want to thank the reviewers for their valuable suggestions and comments which improved the quality of the manuscript.
Conflict of interest
The authors declare that the research was conducted in the absence of any commercial or financial relationships that could be construed as a potential conflict of interest.
References
1
Adame M. F. Roberts M. E. Hamilton D. P. Ndehedehe C. E. Reis V. Lu J. et al . (2019). Tropical Coastal Wetlands Ameliorate Nitrogen Export During Floods. Front. Mar. Sci.6. doi: 10.3389/fmars.2019.00671
2
Ahmed K. R. Akter S. Marandi A. Schüthd C. (2021). A Simple and Robust Wetland Classification Approach by Using Optical Indices, Unsupervised and Supervised Machine Learning Algorithms. Remote Sens. Appl.23, 100569. doi: 10.1016/j.rsase.2021.100569
3
Attema E. Davidson M. Snoeij P. Rommen B. Floury N. (2010). “Sentinel-1 Mission Overview,” in 2009 IEEE International Geoscience and Remote Sensing Symposium (, South Africa: IGARSS), 11220500. doi: 10.1109/IGARSS.2009.5416921
4
Bouman B. A. Hoekman D. H. (1993). Multi-Temporal, Multi-Frequency Radar Measurements of Agricultural Crops During the Agriscatt-88 Campaign in the Netherlands. Int. J. Remote Sens.14, 1595–1614. doi: 10.1080/01431169308953988
5
Cadier C. Bayraktarov E. Piccolo R. Adame M. F. (2020). Indicators of Coastal Wetlands Restoration Success: A Systematic Review. Front. Mar. Sci.7. doi: 10.3389/fmars.2020.600220
6
Canisius F. Brisco B. Murnaghan K. Kooij M. V. D. Keizer E. (2019). SAR Backscatter and InSAR Coherence for Monitoring Wetland Extent, Flood Pulse and Vegetation: A Study of the Amazon Lowland. Remote Sens.11, 720. doi: 10.3390/rs11060720
7
Chen F. L. Lasaponara R. Masini N. (2017). An Overview of Satellite Synthetic Aperture Radar Remote Sensing in Archaeology: From Site Detection to Monitoring. J. Cult. Herit.23, 5–11. doi: 10.1016/j.culher.2015.05.003
8
Cortes C. Vapnik V. (1995). Support-Vector Networks. Mach. Learn.20, 273–297. doi: 10.1023/A:1022627411411
9
Dammann D. O. Eriksson L. E. B. Mahoney A. R. Stevens C. W. van der Sanden J. Eicken H. et al . (2018). Mapping Arctic Bottomfast Sea Ice Using SAR Interferometry. Remote Sens.10, 720. doi: 10.3390/rs10050720
10
Dattatreya G. R. Kanal L. N. (1986). Adaptive Pattern Recognition With Random Costs and its Application to Decision Trees. IEEE Trans. Syst. Man. Cybern.16, 208–218. doi: 10.1109/TSMC.1986.4308941
11
Delgado L. E. Marín V. H. (2013). Interannual Changes in the Habitat Area of the Black-Necked Swan, Cygnus Melancoryphus, in the Carlos Anwandter Sanctuary, Southern Chile: A Remote Sensing Approach. Wetlands33, 91–99. doi: 10.1007/s13157-012-0354-0
12
Fariba M. Bahram S. Masoud M. Brian B. Mahdi M. (2018). Multi-Temporal, Multi-Frequency, and Multi-Polarization Coherence and SAR Backscatter Analysis of Wetlands. ISPRS. J. Photogramm.142, 78–93. doi: 10.1016/j.isprsjprs.2018.05.009
13
Feng Q. L. Yang J. Y. Zhu D. H. Liu J. T. Guo H. Bayartungalag B. et al . (2019). Integrating Multitemporal Sentinel-1/2 Data for Coastal Land Cover Classification Using a Multibranch Convolutional Neural Network: A Case of the Yellow River Delta. Remote Sens.11, 1006. doi: 10.3390/rs11091006
14
Friedl M. A. Brodley C. E. (1997). Decision Tree Classification of Land Cover From Remotely Sensed Data. Remote Sens. Environ.61, 399–409. doi: 10.1016/S0034-4257(97)00049-7
15
Fu S. Zheng S. Y. Gao W. L. Wang A. D. Ma X. Sun L. M. et al . (2021). Effects of the Water-Sediment Regulation Scheme on the Expansion of Spartina Alterniflora at the Yellow River Estuary, China. Front. Environ. Sci.9. doi: 10.3389/fenvs.2021.642442
16
Heumann B. W. (2011). An Object-Based Classification of Mangroves Using a Hybrid Decision Tree—Support Vector Machine Approach. Remote Sens.3, 2440–2460. doi: 10.3390/rs3112440
17
Hu Y. K. Tian B. Yuan L. Li X. Z. Huang Y. Shi R. H. et al . (2021). Mapping Coastal Salt Marshes in China Using Time Series of Sentinel-1 SAR. ISPRS. J. Photogram.173, 122–134. doi: 10.1016/j.isprsjprs.2021.01.003
18
Jiang Y. H. (2013). “Optical/SAR Image Registration Based on Cross-Correlation With Multi-Scale and Multi-Direction Gabor Characteristic Matrixes,” in 2013 IET International Radar Conference (IETIRC),(Xi'an, China), 13706905. doi: 10.1049/cp.2013.0343
19
Keisuke H. Kazuo W. Takanori N. Akihiko K. Yoichi F. (2018). Determination of Patterns of Rainfall History Creating Situations for Accurate Classification of Rain-Fed Paddy Fields With SAR Backscatter Coefficients. Remote Sens. Appl.9, 42–51. doi: 10.1016/j.rsase.2017.11.004
20
Khati U. Kumar V. Bandyopadhyay D. Musthafa M. Singh G. (2018). Identification of Forest Cutting in Managed Forest of Haldwani, India Using ALOS-2/PALSAR-2 SAR Data. J. Environ. Manage.213, 503–512. doi: 10.1016/j.jenvman.2018.02.025
21
Lee J. S. (1981). Refined Filtering of Image Noise Using Local Statistics. Comput. Graphics Imag. Process.15, 380–389. doi: 10.1016/S0146-664X(81)80018-4
22
Lin H. J. Hsu C. B. Liao S. H. Chen C. P. Hsieh H. L. (2015). Effects of Spartina Alterniflora Invasion on the Abundance and Community of Meiofauna in a Subtropical Wetland. Wetlands35, 547–556. doi: 10.1007/s13157-015-0643-5
23
Lin K. F. Perissin D. (2018). Single-Polarized SAR Classification Based on a Multi-Temporal Image Stack. Remote Sens.10:1087 doi: 10.3390/rs10071087
24
Liu J. T. Feng Q. L. Gong J. H. Zhou J. P. Li Y. (2016). Land-Cover Classification of the Yellow River Delta Wetland Based on Multiple End-Member Spectral Mixture Analysis and a Random Forest Classifier. Int. J. Remote Sens.37, 1845–1867. doi: 10.1080/01431161.2016.1165888
25
Liu D. D. Yu H. X. Lu K. L. Guan Q. Wu H. T. (2021). Freshwater Releases Into Estuarine Wetlands Change the Determinants of Benthic Invertebrate Metacommunity Structure. Front. Ecol. Evol.9. doi: 10.3389/fevo.2021.721628
26
Li H. Y. Wan J. H. Liu S. W. Sheng H. Xu M. M. (2022). Wetland Vegetation Classification Through Multi-Dimensional Feature Time Series Remote Sensing Images Using Mahalanobis Distance-Based Dynamic Time Warping. Remote Sens.14, 501. doi: 10.3390/rs14030501
27
Meng W. Feagin R. A. Innocenti R. A. Hu B. He M. Li H. (2020). Invasion and Ecological Effects of Exotic Smooth Cordgrass Spartina Alterniflora in China. Ecol. Eng.143, 105670. doi: 10.1016/j.ecoleng.2019.105670
28
Mohammadimanesh F. Salehi B. Mahdianpari M. Brisco B. Motagh M. (2018). Multi-Temporal, Multi-Frequency, and Multi-Polarization Coherence and SAR Backscatter Analysis of Wetlands. ISPRS. J. Photogram.142, 78–93. doi: 10.1016/j.isprsjprs.2018.05.009
29
Nikaein T. Iannini L. Molijn R. A. Lopez-Dekker P. (2021). On the Value of Sentinel-1 InSAR Coherence Time-Series for Vegetation Classification. Remote Sens.13:3300. doi: 10.3390/rs13163300
30
Nizalapur V. Rangaswamy M. Chandra S. J. (2011). Coherence-Based Land Cover Classification in Forested Areas of Chattisgarh, Central India, Using Environmental Satellite—Advanced Synthetic Aperture Radar Data. J. Appl. Remote Sens.5, 1–7. doi: 10.1117/1.3557816
31
Ottinger M. Kuenzer C. Liu G. H. Wang S. Q. Dech S. (2013). Monitoring Land Cover Dynamics in the Yellow River Delta From 1995 to 2010 Based on Landsat 5 TM. Appl. Geogr.44, 53–68. doi: 10.1016/j.apgeog.2013.07.003
32
Ou D. P. Tan K. Du Q. Chen Y. Ding J. W. (2018). Decision Fusion of D-InSAR and Pixel Offset Tracking for Coal Mining Deformation Monitoring. Remote Sens.10, 1055. doi: 10.3390/rs10071055
33
Park S. Y. Im J. H. Park S. H. Yoo C. H. Han H. S. Rhee J. Y. (2018). Classification and Mapping of Paddy Rice by Combining Landsat and SAR Time Series Data. Remote Sens.10, 447. doi: 10.3390/rs10030447
34
Safavian S. R. Landgrebe D. (1991). A Survey of Decision Tree Classifier Methodology. IEEE T. Syst. Man. Cy-S.21, 660–674. doi: 10.1109/21.97458
35
Schmugge T. J. (1983). Remote Sensing of Soil Moisture: Recent Advances. IEEE Trans. Geosci. Remote Sens.3, 336–344. doi: 10.1109/TGRS.1983.350563
36
Seymour M. Cumming I. (1994). “Maximum Likelihood Estimation for SAR Interferometry,” in Proceedings of the IGARSS’94-1994 IEEE International Geoscience and Remote Sensing Symposium (IGARSS) (Pasadena, CA, USA), 2272–2275. doi: 10.1109/IGARSS.1994.399711
37
Tian Y. L. Jia M. M. Wang Z. M. Mao D. H. Du B. J. Wang C. (2020). Monitoring Invasion Process of Spartina Alterniflora by Seasonal Sentinel-2 Imagery and an Object-Based Random Forest Classification. Remote Sens.12:1383. doi: 10.3390/rs12091383
38
Timothy W. Bartolo R. E. (2015). Mapping Aquatic Vegetation in a Tropical Wetland Using High Spatial Resolution Multispectral Satellite Imagery. Remote Sens.7, 11664–11694. doi: 10.3390/rs70911664
39
Tooke T. R. Coops N. C. Goodwin N. R. Voogt J. A. (2009). Extracting Urban Vegetation Characteristics Using Spectral Mixture Analysis and Decision Tree Classifications. Remote Sens. Environ.113, 398–407. doi: 10.1016/j.rse.2008.10.005
40
Townsend J. T. (1971). Theoretical Analysis of an Alphabetic Confusion Matrix. Atten. Percept. Psycho.9, 40–50. doi: 10.3758/BF03212817
41
Tsyganskaya V. Martinis S. Marzahn P. Ludwig R. (2018). Detection of Temporary Flooded Vegetation Using Sentinel-1 Time Series Data. Remote Sens.10:1286. doi: 10.3390/rs10081286
42
Tu C. R. Li P. Li Z. H. Wang H. J. Yin S. W. Li D. H. et al . (2021). Synergetic Classification of Coastal Wetlands Over the Yellow River Delta With GF-3 Full-Polarization SAR and Zhuhai-1 OHS Hyperspectral Remote Sensing. Remote Sens.13:4444. doi: 10.3390/rs13214444
43
Veloso A. Mermoz S. Bouvet A. Toan T. L. Planells M. Dejoux J. F. et al . (2017). Understanding the Temporal Behavior of Crops Using Sentinel-1 and Sentinel-2-Like Data for Agricultural Applications. Remote Sens. Environ.199, 415–426. doi: 10.1016/j.rse.2017.07.015
44
Wang Z. P. Ke Y. H. Chen M. M. Zhou D. M. Zhu L. Bai J. H. (2021). Mapping Coastal Wetlands in the Yellow River Delta, China During 2008-2019: Impacts of Valid Observations, Harmonic Regression, and Critical Months. Int. J. Remote Sens.42, 7880–7906. doi: 10.1080/01431161.2021.1966852
45
Wang L. X. Marzahn P. Bernier M. Ludwig R. (2018). Mapping Permafrost Landscape Features Using Object-Based Image Classification of Multi-Temporal SAR Images. ISPRS. J. Photogramm.141, 10–29. doi: 10.1016/j.isprsjprs.2018.03.026
46
Wang Z. Y. Sun P. L. Wang L. H. Zhang M. Y. Wang Z. H. (2021). Monitoring Sea Ice in Liaodong Bay of Bohai Sea During the Freezing Period of 2017/2018 Using Sentinel-2 Remote Sensing Data. J. Spectrosc.2021, 9974845. doi: 10.1155/2021/9974845
47
Wang Z. Y. Wang Z. H. Li H. Ni P. Liu J. (2021). A Modified Approach of Extracting Landfast Ice Edge Based on Sentinel-1a InSAR Coherence Image in the Gulf of BothniaJ. Mar. Sci. Eng9, 1076. doi: 10.3390/jmse9101076
48
Wang Z. Y. Ye K. L. Zhang M. Y. Li H. Li Z. J. Zhu Y. D. et al . (2022). Monitoring the Wetland of the Yellow River Delta by Combining GF -3 Polarimetric SAR and Sentinel-2a Multispectral Data. Front. Ecol. Evol.10. doi: 10.3389/fevo.2022.806978
49
Wan S. W. Pei Q. Liu J. N. Zhou H. X. (2009). The Positive and Negative Effects of Exotic Spartina Alterniflora in China. Ecol. Eng.35, 444–452. doi: 10.1016/j.ecoleng.2008.05.020
50
Wan H. Wang Q. Jiang D. Fu J. Yang Y. Liu X. (2014). Monitoring the Invasion of Spartina Alterniflora Using Very High Resolution Unmanned Aerial Vehicle Imagery in Beihai, Guangxi (China). Sci. World J.7, 638296. doi: 10.1155/2014/638296
51
Yue S. D. Zhou Y. Yu C. Xu S. H. Zhang X. M. Liu M. J. et al . (2021). Can the Non-Native Salt Marsh Halophyte Spartina Alterniflora Threaten Native Seagrass (Zostera Japonica) Habitats? A Case Study in the Yellow River Delta, China. Front. Plant Sci.12. doi: 10.3389/fpls.2021.643425
52
Zeng A. Y. Hu W. F. Zeng C. S. Sun Z. G. Gao D. Z. (2020). Litter Decomposition and Nutrient Dynamics of Native Species (Cyperus Malaccensis) and Alien Invasive Species (Spartina Alterniflora) in a Typical Subtropical Estuary (Min River) in China. Estuar. Coast.43, 1873–1883. doi: 10.1007/s12237-020-00744-x
53
Zhang M. M. Chen F. Tian B. S. Liang D. (2019). Multi-Temporal SAR Image Classification of Coastal Plain Wetlands Using a New Feature Selection Method and Random Forests. Remote Sens. Lett.10, 312–321. doi: 10.1080/2150704X.2018.1528397
54
Zhang C. Gong Z. N. Qiu H. C. Zhang Y. Zhou D. M. (2021). Mapping Typical Salt-Marsh Species in the Yellow River Delta Wetland Supported by Temporal-Spatial-Spectral Multidimensional Features. Sci. Tot. Environ.783, 147061. doi: 10.1016/j.scitotenv.2021.147061
55
Zhang M. Lin H. (2022). Wetland Classification Using Parcel-Level Ensemble Algorithm Based on Gaofen-6 Multispectral Imagery and Sentinel-1 Dataset. J. Hydrol.606, 127462. doi: 10.1016/j.jhydrol.2022.127462
56
Zhang R. Tang Z. Z. Luo D. Luo H. X. You S. C. Zhang T. (2021). Combined Multi-Time Series SAR Imagery and InSAR Technology for Rice Identification in Cloudy Regions. Appl. Sci.11:6923. doi: 10.3390/app11156923
57
Zhang B. Wang R. Deng Y. Ma P. Lin H. Wang J. (2019). Mapping the Yellow River Delta Land Subsidence With Multitemporal SAR Interferometry by Exploiting Both Persistent and Distributed Scatterers. ISPRS. J. Photogram.148, 147–153. doi: 10.1016/j.isprsjprs.2018.12.008
58
Zhang X. Xiao X. M. Wang X. X. Xu X. Chen B. Q. Wang J. et al . (2020). Quantifying Expansion and Removal of Spartina Alterniflora on Chongming Island, China, Using Time Series Landsat Images During 1995–2018. Remote Sens. Environ.247, 111916. doi: 10.1016/j.rse.2020.111916
59
Zhu X. D. Meng L. X. Zhang Y. H. Weng Q. H. Morris J. (2019). Tidal and Meteorological Influences on the Growth of Invasive Spartina Alterniflora: Evidence From UAV Remote Sensing. Remote Sens.11:1208. doi: 10.3390/rs11101208
60
Zuo P. Zhao S. H. Liu C. A. Wang C. H. Liang Y. B. (2012). Distribution of Spartina Spp. Along China's Coast. Ecol. Eng.40, 160–166. doi: 10.1016/j.ecoleng.2011.12.014
Summary
Keywords
Yellow River Delta, wetland classification, backscattering characteristics, coherence characteristics, decision tree, Spartina alterniflora
Citation
Li Z, Wang Z, Liu X, Zhu Y, Wang K and Zhang T (2022) Classification and Evolutionary Analysis of Yellow River Delta Wetlands Using Decision Tree Based on Time Series SAR Backscattering Coefficient and Coherence. Front. Mar. Sci. 9:940342. doi: 10.3389/fmars.2022.940342
Received
10 May 2022
Accepted
25 May 2022
Published
27 June 2022
Volume
9 - 2022
Edited by
Chao Chen, Zhejiang Ocean University, China
Reviewed by
Gang Yang, Ningbo University, China; Wei Guo, China University of Mining and Technology, China
Updates
Copyright
© 2022 Li, Wang, Liu, Zhu, Wang and Zhang.
This is an open-access article distributed under the terms of the Creative Commons Attribution License (CC BY). The use, distribution or reproduction in other forums is permitted, provided the original author(s) and the copyright owner(s) are credited and that the original publication in this journal is cited, in accordance with accepted academic practice. No use, distribution or reproduction is permitted which does not comply with these terms.
*Correspondence: Zhiyong Wang, skd994177@sdust.edu.cn
This article was submitted to Marine Conservation and Sustainability, a section of the journal Frontiers in Marine Science
Disclaimer
All claims expressed in this article are solely those of the authors and do not necessarily represent those of their affiliated organizations, or those of the publisher, the editors and the reviewers. Any product that may be evaluated in this article or claim that may be made by its manufacturer is not guaranteed or endorsed by the publisher.