 Daniel Marrable1*
 Kathryn Barker1†
 Sawitchaya Tippaya1†
 Mathew Wyatt2
 Scott Bainbridge3
 Marcus Stowar3Jason Larke1
- 1Curtin Institute for Computation, Curtin University, Perth, WA, Australia
- 2Australian Institute of Marine Science, Indian Ocean Marine Research Centre, The University of Western Australia, Perth, WA, Australia
- 3Australian Institute of Marine Science, Townsville, QLD, Australia
Machine-assisted object detection and classification of fish species from Baited Remote Underwater Video Station (BRUVS) surveys using deep learning algorithms presents an opportunity for optimising analysis time and rapid reporting of marine ecosystem statuses. Training object detection algorithms for BRUVS analysis presents significant challenges: the model requires training datasets with bounding boxes already applied identifying the location of all fish individuals in a scene, and it requires training datasets identifying species with labels. In both cases, substantial volumes of data are required and this is currently a manual, labour-intensive process, resulting in a paucity of the labelled data currently required for training object detection models for species detection. Here, we present a “machine-assisted” approach for i) a generalised model to automate the application of bounding boxes to any underwater environment containing fish and ii) fish detection and classification to species identification level, up to 12 target species. A catch-all “fish” classification is applied to fish individuals that remain unidentified due to a lack of available training and validation data. Machine-assisted bounding box annotation was shown to detect and label fish on out-of-sample datasets with a recall between 0.70 and 0.89 and automated labelling of 12 targeted species with an F1 score of 0.79. On average, 12% of fish were given a bounding box with species labels and 88% of fish were located and given a fish label and identified for manual labelling. Taking a combined, machine-assisted approach presents a significant advancement towards the applied use of deep learning for fish species detection in fish analysis and workflows and has potential for future fish ecologist uptake if integrated into video analysis software. Manual labelling and classification effort is still required, and a community effort to address the limitation presented by a severe paucity of training data would improve automation accuracy and encourage increased uptake.
1 Introduction
1.1 BRUVS for Marine Environment Reporting
Baited Remote Underwater Video Stations (BRUVS; Harvey and Shortis, 1995) have become widely adopted as the standard tool for non-destructive fish sampling in both coastal waters in Australia1 and across the world2, providing a cost-effective and 40% more efficient approach to recording species counts than diver-operated video transects (Langlois et al., 2010; Watson et al., 2010). BRUVS sampling is based on self-contained video cameras, pointing at a fish-attracting bait source and recording visitation by fish to sample their diversity and abundance. The resultant video is traditionally manually analysed by specialists to identify, count, and photogrammetrically measure the fishes that visited the station. BRUVS video analysis shares a common challenge with other marine video data analysis: it is a time-consuming and expensive process, typically taking several hours per hour of video (Francour et al., 1999). The Australian Institute of Marine Science (AIMS), a major user of BRUVS, estimates that 4,000 h of video from BRUVS are collected annually in Australia alone, taking approximately 12,000 h of highly trained analysts to manually extract usable fish diversity and abundance data.The analysis time lag from video recording to the delivery of numerical information creates a significant workflow bottleneck (Ditria et al., 2020; Jäger et al., 2015; Sheaves et al., 2020) and inhibits research data synthesis and the timeliness of appropriate policy or management decisions. Overcoming these challenges requires accurate, reliable, autonomous classification, and measurement systems or tools to increase data throughput and significantly decrease analysis cost and time lag (Boom et al., 2014; Jäger et al., 2015; Kavasidis et al., 2014; Lopez-Marcano et al., 2021a; Tseng and Kuo, 2020; L. Yang et al., 2021).
1.2 Deep Learning for Fish Classification and Object Detection
Deep learning (DL) presents an opportunity to automate, or partially automate, the analysis. DL and object detection in automated fish classification is a rapidly developing field with potential well demonstrated through both computer vision methods (Strachan et al., 1990; Strachan, 1993; Storbeck and Daan, 2001; White et al., 2006; Huang, 2016; Miranda and Romero, 2017; Muñoz-Benavent et al., 2018) and object-based approaches for features and shape-based fish classification (Ravanbakhsh et al., 2015). Extending to video, Salman et al. (2019) used the Lucas-Kanade Optical Flow tracking method (Lucas and Kanade, 1981) to isolate moving objects, crop these fish out of the frame, and classify them individually using CNN. Fully Connected Networks (FCN; Shi et al., 2018) can also classify any shaped image. More recently, object detectors such as YOLOv3 (Knausgård et al., 2021), masked region-based CNN for segmentation (Arvind et al., 2019; Ditria et al., 2020), or hybrid object detection models (Mohamed et al., 2020) have been shown to outperform traditional computer vision techniques (L. Yang et al., 2021; X. Yang et al., 2021). DL models make predictions based on learning from labelled datasets and require substantial volumes of accurately data compared with traditional “rule”-based computer vision models (Rawat and Wang, 2017) but can extract ecologically useful information from video footage only when adequately trained (Cutter et al., 2015; Ditria et al., 2021, Ditria et al., 2020). DL models can take many hours or days to train, although advances in Graphics Processing Unit (GPU) technology have sped up the training process by orders of magnitude (Hey et al., 2020) once automated tools become available.
1.3 Challenges to DL Uptake by the Fish Ecology Community
BRUVS users need to be able to quickly analyse video imagery; for this, a DL model (or DL-based approach) needs to simultaneously identify a fish individual in a video scene and to identify its species, something as yet unavailable. A DL model that can simultaneously perform object detection and classification requires: i) training datasets with bounding boxes already applied, identifying the location of all fish individuals in a scene, to learn to identify fish; and ii) training datasets identifying species with labels, task that must be undertaken by fish specialists following established quality control protocols (Langlois et al., 2020).
1.4 Dataset Availability and Suitability
Despite the potential, the application of DL to automating fish identification and classification still presents limitations and challenges for widespread adoption into BRUVS analysis workflows and meeting specific BRUVS analysis requirements. A paucity of training data is one reason for this and is a major limitation to DL uptake by the fish ecology community. Data paucity for DL model training is a recognised challenge common to many disciplines and one that, for some domains, has been well addressed due to availability of datasets (for example, Common Objects in Context, COCO, Lin et al., 2014).
A range of publicly available fish datasets exists, summarised concisely by Ditria et al. (2021) but, for several reasons, do not meet the requirements for DL and object detection development. Several datasets exist for image classification (Holmberg et al., 2009; Anantharajah et al., 2014; Boom et al., 2014; Kavasidis et al., 2014; Cutter et al., 2015; Jäger et al., 2015; Saleh et al., 2020; Ditria et al., 2021; Lopez, 2021; Lopez-Marcano et al., 2021b), but few resolve the object detection challenge, instead identifying the species once cropped from the image. Although some datasets do address object detection (e.g., Saleh et al., 2020; Ditria et al., 2021; Lopez, 2021; Lopez-Marcano et al., 2021b) they fall short due to lack of bounding boxes (e.g., Saleh et al., 2020), lack of species labels matching the BRUVS species library (e.g. Cutter et al., 2015; Holmberg et al., 2009), or video resolution inadequacy for accurate computer vision application (e.g., Boom et al., 2014; Kavasidis et al., 2014). There are many hours of public and hand-labelled BRUVS data available3,4,5 but, as with the examples by Cutter et al. (2015) and Holmberg et al. (2009), they are very imbalanced in the species labelling, reiterating the challenge of training DL models to a high enough precision to recognise the required object (Xu and Matzner, 2018; Li and Ling, 2022). For the method that we propose and explain in further detail in later sections, we use the datasets of (Ditria et al., 2021; Lopez, 2021; Lopez-Marcano et al., 2021b; Saleh et al., 2020) for out-of-sample testing for generalisability. The OzFish dataset (AIMS, 2019) is closest to meeting the DL requirements, having been designed specifically to do so and analysed and quality-controlled following the marine sampling field manual for benthic stereo BRUVS (Langlois et al., 2020). However, OzFish presents its own challenge for DL: the point-based measurements made by fish ecologists were intended for easier, quicker video analysis, and not with DL models in mind. The pixel location of the label is recorded in the software, and the ecologist assigns a genus or species label to the fish. The location and species of the label then can be exported for training DL models; however, object detection models require the extent of the object to be defined either using a bounding box, polygon, or per-pixel segmentation, each increasing in complexity and time to apply manually by a fish ecologist. OzFish does include some bounding boxes with associated species labels, but only for the MaxN objects (the maximum number of individuals observed in a single video frame within the 1 h observation period) and not every object in the image. Although MaxN has been adopted as a conservative and practical abundance estimate, it obviates the need to record every individual and has the potential to repeatedly count the same fish as it enters and leaves the field of view. MaxN is therefore unsuitable for DL dataset generation which requires every object (species of fish in this case) to be labelled to ensure negative reinforcement of the classifier. As such, OzFish is also deficient in the requisite training data for object detection and classification; however, it has bounding boxes and species in the same dataset, providing a basis for the proposed approach.
1.5 Data Volume to Train for Accurate Performance
Data-driven DL models require very large datasets (conservatively estimated at greater than 2,000 images per class of object by early YOLO researchers6), split into separate training and validation datasets, and expertly hand-labelled and curated by fish experts. For a DL model to identify the location of a fish in a video scene, it has to have been trained to identify the location of a fish; this requires the training data to have had bounding boxes already applied to all fish in every scene to achieve accurate performance. For a DL model to identify species, the training dataset also requires the fish to be identified at the species level identification level with labels applied. The time required to add bounding boxes and the specialism involved in species identification mean that the volume of data just does not exist yet for effective DL model training and accurate performance for generalised application. Even with specially designed software such as EventMeasure7, the amount of data that needs to be processed can overwhelm the human resources available for analysis (Sheaves et al., 2020), curtailing high-quality assessment and label numbers required for model training. Retroactively hand-labelling all of these data is not feasible due to the sheer size and volume of the data. Data augmentation and synthetic data generation methods (Allken et al., 2018) have been developed but are yet to completely solve the problem of insufficient datasets.
1.6 Generalisation to Real-World Application
Reported detection algorithm accuracies are commonly calculated by using test data generated as a subset of a larger corpus of data (Villon et al., 2018). This method of model evaluation is required to ensure DL models are not over-fit and gives some metric of how well the model can generalise to real-world applications. Applying models to different habitats (domain shift) also leads to increased false-positive results. To address this, Ditria et al. (2020) highlight the importance of training DL models in a variety of different habitats as seagrass and reef models did not perform well when trained exclusively on one habitat and testing on the other. Furthermore, in situations such as those occurring with BRUVS videos, when the prediction models are applied to data collected from habitats that include a wider variety of fish species than they have been trained on, the model’s performance metrics quickly degrade due to false-positive detections of species that are not included in the training data. This scenario, known as the “out-of-sample”, describes the number and types of objects that the DL algorithm is required to classify outside the sampled classes (i.e., species) of fish it was trained on. When DL models are trained with constrained datasets and deployed in unconstrained environments, objects observed in a given scene that are not included in the training corpus of data will generate and apply false-positive labels. Connolly et al. (2021) address the challenge of reducing false-positive detections due to fish occlusion but limit their study to targeting a single key species, reducing the number of species able to detect but with improved accuracy for the target species.
Recognising the enormous need to speed up data analysis and processing of an ever-growing corpus of BRUVS data in step with current DL capabilities, we present a machine-assisted approach to labelling of fish in BRUVS video imagery, which aids the current manual process and enables the generation of training data to be used in fine tuning DL models for species classification. The objective is to develop a hybrid DL methodology for simultaneously applying species labels to detected fish objects in moving video, with the potential for integrating into and assisting existing BRUVS analysis workflows.
2 Method
Here, we present the steps taken to develop a machine-assisted approach to automated bounding boxes application and species labelling fish in BRUVS underwater video imagery. The potential for application of DL to underwater video imagery is yet to be realised due to the paucity of labelled BRUVS data. Development of this approach has therefore included consultation with the specialists, in this case fish ecologists and the BRUVS user community, to address sampling and analysis requirements. Involving the user community in developing practical approaches to overcoming specific challenges is well recognised as essential to optimising workflows to mutual benefit (e.g., Holmberg et al., 2009; Boom et al., 2014; Weinstein, 2018; Herrera et al., 2020; Sheaves et al., 2020).
The approach that we take to development i) applies a DL model for testing the generalisation of the bounding box generation and applying a “fish-only” label, ii) applies a second model to test species classification, and iii) applies a third model for which sufficient species label data exists to confidently train the model for a subset of 12 species. Confidence in species label performance for 12 target species derives from the performance of object detection in step i, wherein the fish-only label has identified the fish. A glossary of the terms explaining their application is provided in Table 1.
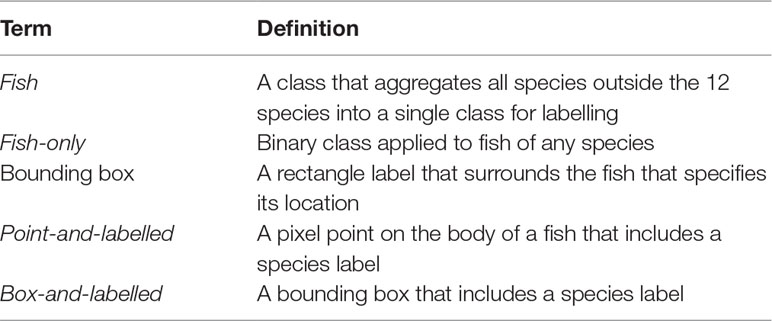
Table 1 Glossary of terms.
2.1 Datasets
The BRUVS video imagery available to this study is the Ozfish8 dataset (AIMS, 2019) made available publicly available by the AIMS, University of Western Australia (UWA) and Curtin University, for the purpose of developing machine learning–based automation methods for annotating BRUVS (Figure 1). The OzFish data were collected, analysed, and quality-controlled following the marine sampling field manual for benthic stereo BRUVS (Langlois et al., 2020). The ideal dataset for DL is to have every image labelled with both the fish species and a bounding box. Of the datasets available and accessible publicly, OzFish contains the species and bounding box combinations needed for model development. The OzFish dataset includes two different annotation sets: i) the extent of all the fish in each image defined with a bounding box but not including the species label of the fish; and ii) a “point-and-labelled” annotation set, hand-labelled with the species as a single point on the body of the fish, but without a bounding box.
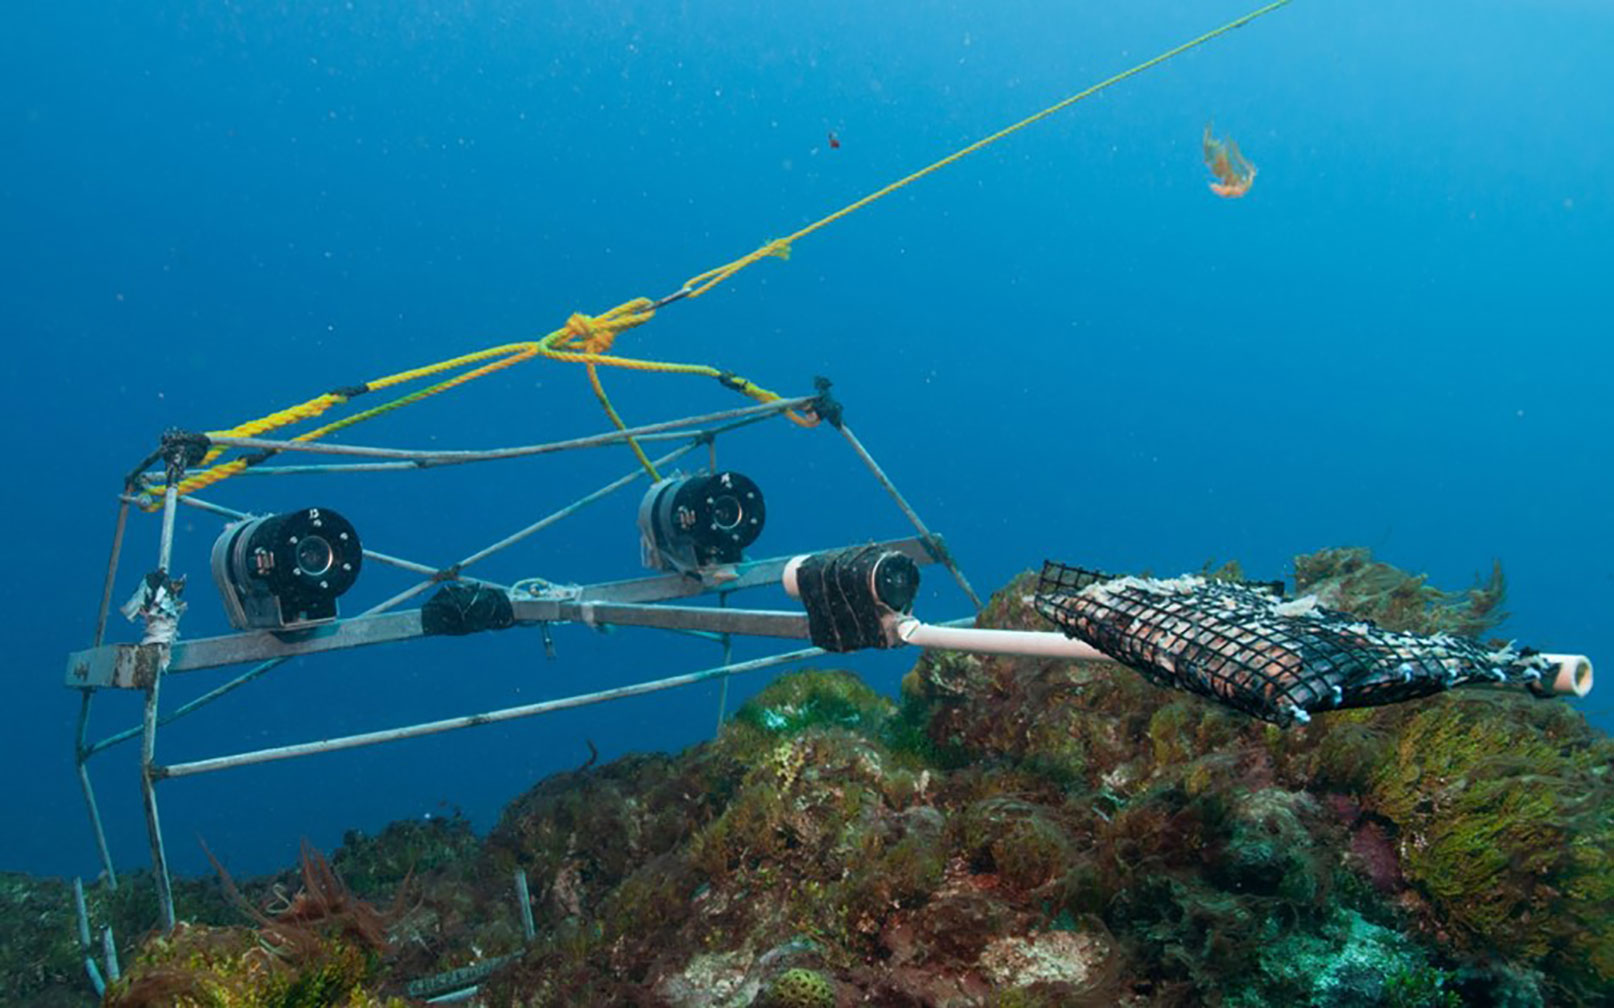
Figure 1 Stereo BRUVS deployed in situ: a steel frame on which is mounted one or two video cameras (typically GoPro or small Sony camcorders) in underwater housings, in either a mono or stereo configuration. A container of bait is projected 1.5 m in front of the camera, attracting fish into the BRUVS video view. From Langlois et al. (2018).
All species of fish are manually identified with specialist video analysis software with built-in species libraries, and the abundance of each species is estimated by recording the MaxN value for each (e.g., Whitmarsh et al., 2017). As previously noted, MaxN is not useful for the DL application, but the species labels associated with MaxN are used.
2.2 Deep Learning for Object Detection and Bounding Box Generation
Although there are a number of possible object detection model families, for this project, we adopted a You Only Look Once model (YOLO; Redmon et al., 2016). YOLO has multiple implementations available depending on the size, number of classes, and computer resources required for a particular use case. The implementation used in this study YOLOv5 is a model that has been trained on the Common Objects in Context (COCO) public dataset. Starting with the available model trained using COCO, the specific implementation for this study was the large YOLOv5 large. The deep transfer learning technique was used to build upon previously learned model knowledge to solve the new fish classification task while reducing the training time and data volume required compared with training from an uninitialised state. Transfer learning was used to retrain the model, using a subset of the OzFish dataset. We followed the standard procedure for selecting the implementation and retraining using transfer learning for custom data outlined on the YOLOv5 website.9
2.3 Preparation for Transfer Learning and Retraining
Figure 2 illustrates the steps taken to identify and filter for images with species labels from the OzFish image collection, subset and prepare the images with bounding boxes and labels for model training. For reference, we define our main dataset terms in Table 1.
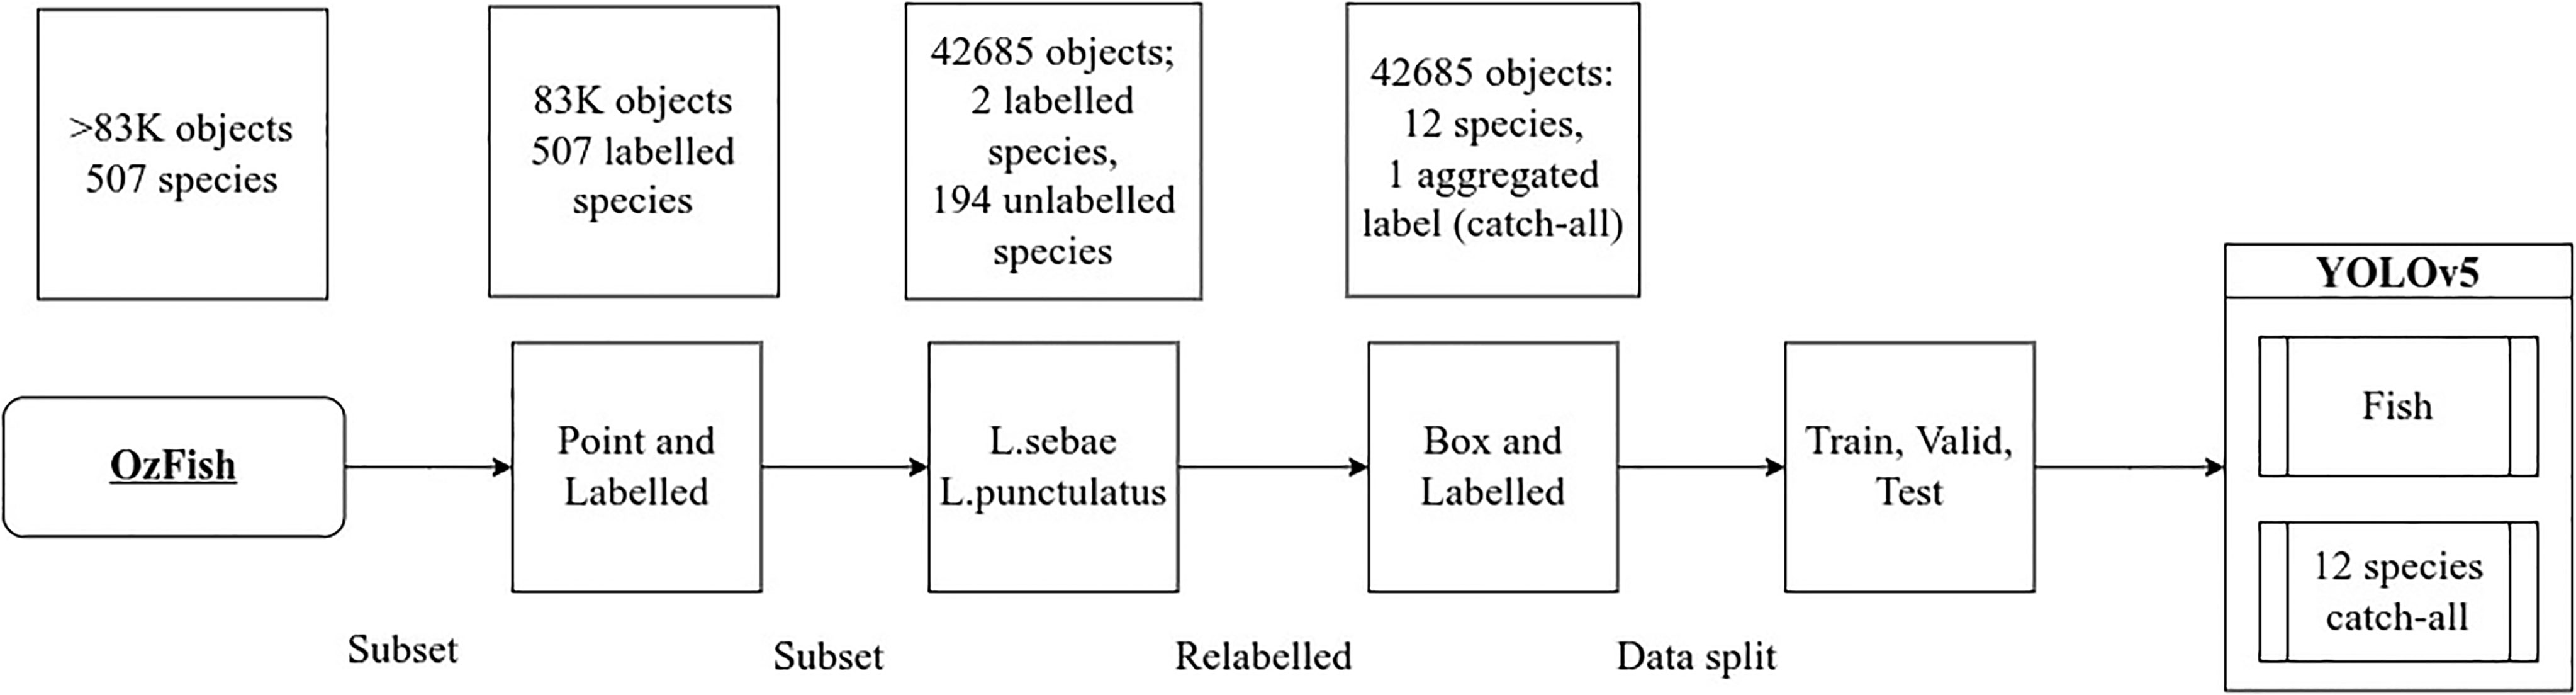
Figure 2 Data preparation steps and subsetting, identifying all images that included species labels followed by filtering two primary key species then manually relabelling all fish with bounding boxes and species generated the data used to train YOLOv5.
To make use of the available data and leverage the expertly annotated point-and-labelled dataset, two primary key species were targeted for relabelling with bounding boxes: Lethrinus punctulatus (Bluespotted Emperor) and Lutjanus sebae (Red Emperor). These two species were selected for their abundance in the videos. They are also of interest because they represent two differing forms of patternations and body shape; one quite distinct in colour pattern and body form (L. sebae) and one more generic in form and colouration (L. punctulatus). Both are a relatively large fish and so avoid the possible added complications brought by particularly small subject sizes and consequent insufficient image resolution. Both species are also sought after target fish for recreational and commercial fishing and are representative of certain species that may be of particular interest in a monitoring campaign.
All of the point-and-labelled images that included either L. punctulatus or L. sebae were subset from the full corpus of images, generating a subset of 1,751 images that had single point labels of the targeted species and many other fish in the images with no labels at all. The target species were relabelled with bounding boxes, and all other fish in the images were given both bounding boxes and species labelled by a fish ecologist resulting in 42,685 fish in total. Finally, the top 12 most abundant species labels of the subset were kept, and any labels outside the top 12 by abundance were relabelled with a 13th catch-all “fish” class, chosen to avoid the long distribution tail of single-digit labelled fish that results in selecting more than 12 species and which are insufficient in number to use for training and impossible to split between the train, validate, and test validation sets. This relabelling process, the “box-and-labelled” data, resulted in 42,685 total number of object labels; 37,573 were given the fish label leaving 5,112 objects with species labels. Fish labelled with both species and bounding boxes are considered the “ground truth” labels for testing the accuracy, precision, and recall during model testing.
A two-step process was applied to fish detection model development:
1. Object detection and bounding box generation: A single fish-only class object detection model was trained using transfer learning. Every bounding box labelled fish was given a single fish-only label regardless of species. The box-and-labelled data were split into train, validation, and test sets with 66%, 17%, and 17% by class, respectively. The train data were used to train the model, the validation data were used for monitoring the training progress, and the test data were reserved for calculating the performance metrics.
This process resulted in a detection model for all classes of fish that applies a bounding box annotation. To test the recall of the fish detection model and to derive an indication of how well the detection model performed when applied to data outside the sampled training set, the model detection was applied to four completely independently collected and published, out-of-sample datasets: DeepFish (Saleh et al., 2020), Dataset A (Lopez-Marcano et al., 2021b), Dataset B (Ditria et al., 2021), and Dataset C (Lopez, 2021). The DeepFish dataset includes three annotation sets: classification, localisation, and segmentation sets. For testing the fish detection model, 1,600 localisation images were combined into a binary fish-only/no-fish test set, from which the recall of the detection model is derived.
2. Species labelling: The second method was to train a species detection model focusing on the 12 species and one fish label in the box-and-labelled data. The same transfer learning, starting with the COCO model, was repeated for the species detection model. The aim of this step was to develop an automation model that could target key species of interest and automatically apply bounding box annotation to all other species. Species aggregated into the fish class will still be required to be hand-labelled, but, where key species are present, the labelling process is automated by the model. In addition, bounding box annotations are applied to all fish across all classes to assist with future DL datasets after manual labelling of species. The distribution of each class and the number of individual fish are shown in Figure 3.
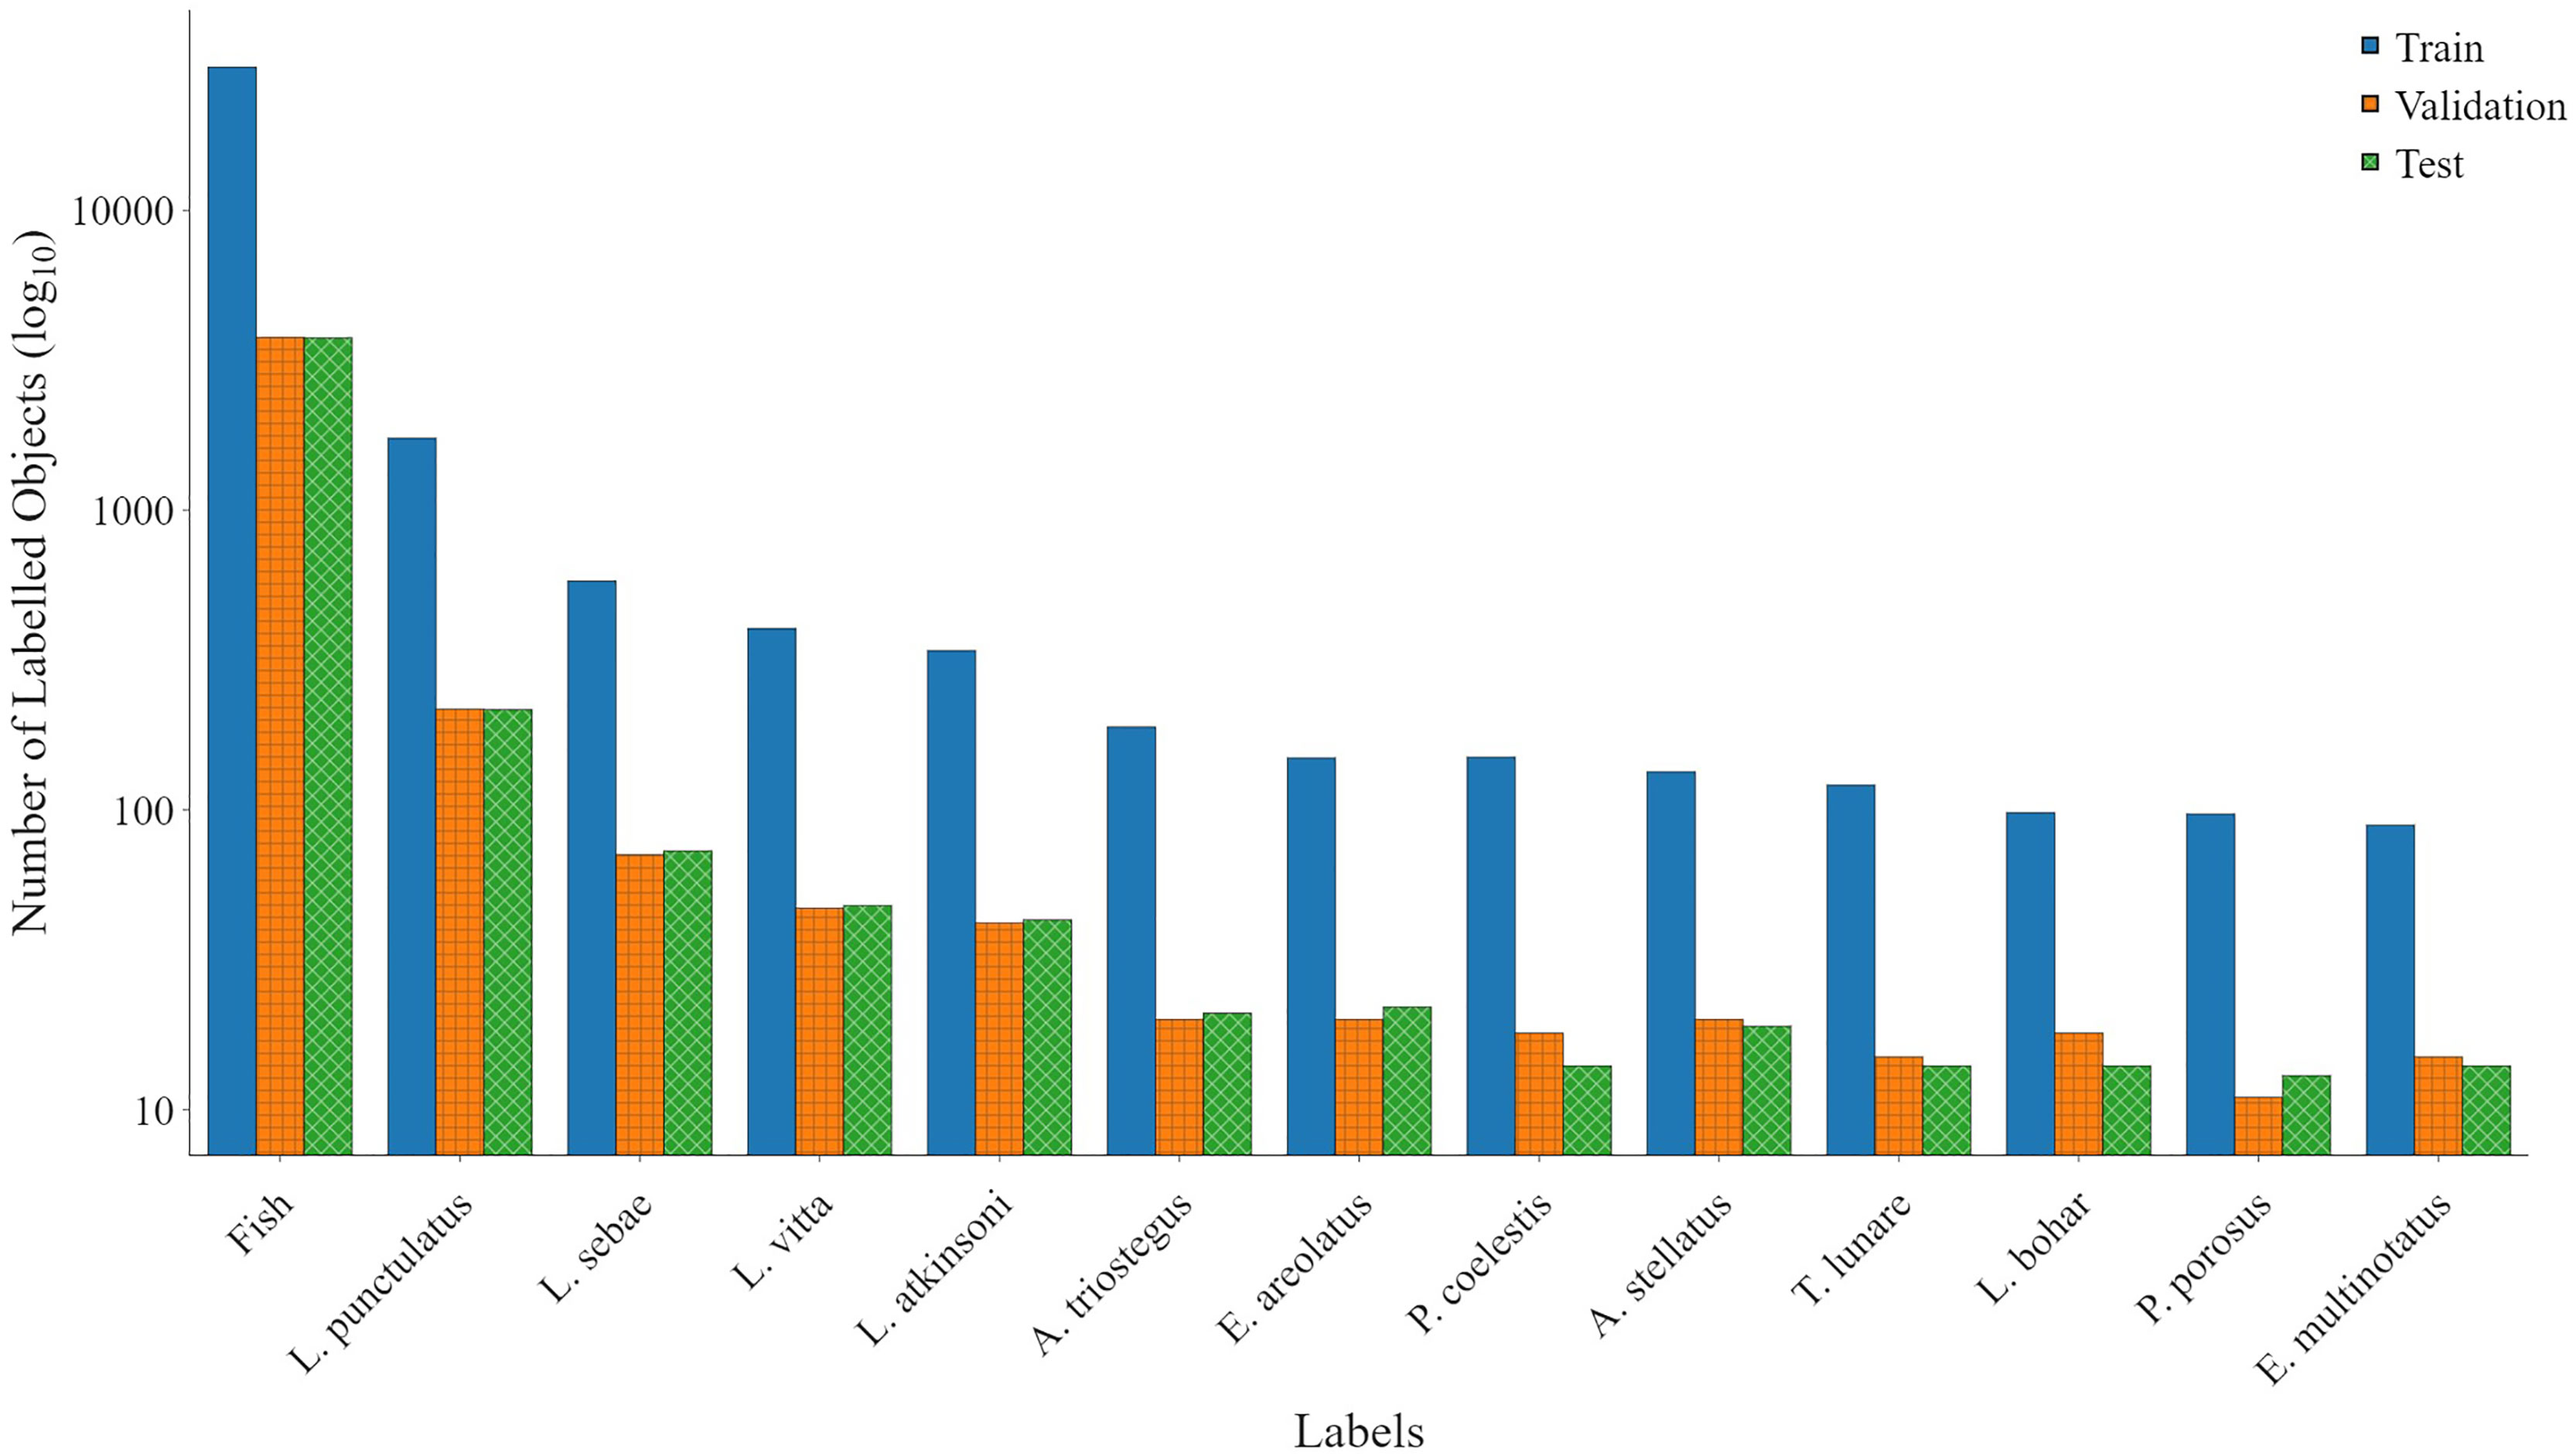
Figure 3 Data used for training YOLOv5. The train, validation, and test data were split at a ratio of 66%, 17%, and 17%, respectively, between classes, chosen to optimise the number of test classes available.
A Jupyter Notebook containing the code used to prepare both the OzFish data and the DeepFish Data are published on Github10.
2.4 Metrics for Model Performance
2.4.1 Recall, Precision, and F1 Score
It can be useful to condense model performance down into a single measurement. An F1 score is an example of such a measurement and is the harmonic mean of both recall and precision.
Recall (Equation 1) is the probability of ground truth objects being detected, whereas labelled recall is the probability of ground truth objects being detected and correctly labelled. Precision (Equation 2) is the probability of predicted objects matching ground truth objects. F1 is derived from the recall and precision by Equation 3.
Recall:
Precision:
F1 score:
where TP is true-positive, the classifier made the same prediction as the ground truth label; FP is false-positive, the classifier predicted a class that was different to the ground truth label; and FN is false-negative, the classifier failed to predict a class where a ground truth label existed.
2.4.2 Out-of-Sample Validation for Automated Bounding Box Generation
Testing and validation of the model performance in real-world applications is difficult due to the lack of bounding box ground truth datasets. The lack of ground truth bounding boxes in the out-of-sample datasets made validation metrics based on localisation impossible. Furthermore, as these datasets did not include species labels for our 12 targeted species, out-of-sample validation for the species detection model was also impossible for these specific species; this is due to the model not having been trained to identify these species.
For an indication of the model’s ability to generalise automation of bounding box annotations in out-of-sample applications, the fish detection model was run over all of the 1,600 DeepFish localisation images. Where the DeepFish pixel point ground truth label was found inside the extent of the bounding box detected by the fish detection model, it was considered a TP result. There is no way to assess FP with any of the out-of-sample validation data, and precision and therefore F1 score cannot be calculated, only recall. All models were given a confidence threshold of 0.5, meaning any predictions with a confidence less than 0.5 were ignored.
3 Results
3.1 Model Performance: Object Detection and Automation of Bounding Box Labels
A recall above 0.700 of the fish-only detection model when applied to all the out-of-sample datasets indicates how well the model generalises when applied to real-word use-cases and its ability to automatically apply bounding box labels to fish (Table 2). Furthermore, this gives a positive indication of how well the fish class will generalise in the 12 species + fish model. The Supplementary Material includes a selection of images extracted from the resulting videos, from both the OzFish dataset and out-of-sample datasets (DeepFish, A, B, and C). The images clearly demonstrate: i) object detection performance across all datasets, with the model identifying fish against backgrounds of a range of habitat types (such as seagrass, sand, and coral) and in a range of water conditions and clarities; and ii) species labelling.
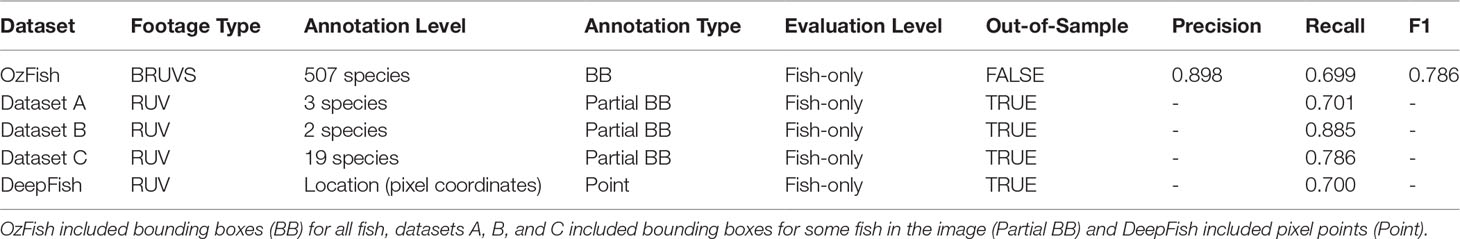
Table 2 Summary of the datasets used for evaluating the object detection performance.
3.2 Model Performance: Species Classification
Table 3 shows that the fish-only model gives more accurate metrics than the out-of-sample test presented in Table 2 indicated by an F1 score of 0.786, compared with that of 0.560 in Table 3. The table also shows that the 12-species model does not perform as well as the model that includes the fish class; this is due to the model finding false-positives. Where fish labels exist outside the 12 target species, this model applies one of the 12 labels resulting in many false positives.
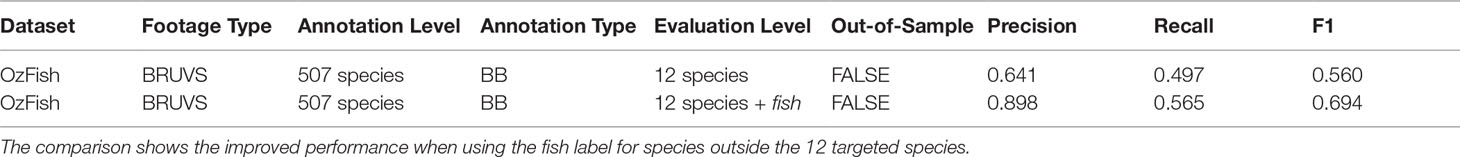
Table 3 Summary of the datasets used for evaluating the species classification performance on the OzFish test data.
The model with the fish class in comparison more often applies the more general fish class as it is more confident with that label, albeit it does so with reduced per class accuracy. These results demonstrate the ability to target species leaving unknown species for manual labelling in a single pass rather than finding all the fish using the fish-only classifier and then relabelling with a second species classifier.
3.3 Model Performance: Automation of Bounding Box Labelling
Table 4 summarises the number of fish that were automatically given the fish label and the fish that were given species labels across the full corpus of data. The fish label reduces false-positive species classifications and incorrectly labels some known species as fish. In the context of generating datasets for DL training, this reduced accuracy in species detection is preferred over false-positive classifications, and this improved model is represented by a higher F1 score in Table 2.
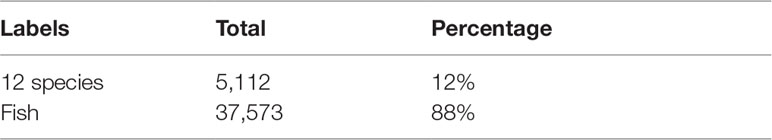
Table 4 The total number of autonomously labelled species and the number of fish autonomously identified for manual labelling using the 12 species + fish model.
4 Discussion
The innovation of this research is to combine machine-assisted learning with a DL model to decrease the manual labour required to annotate and classify images of fish collected by BRUVS. Although the ability to develop accurate DL models for labelling species of fish remains a significant challenge due to the paucity of available training data, applying DL automates bounding box annotation and key fish species labelling and presents an approachable method for accelerating these processes. As more labelled data becomes available, it is anticipated this method will increase the automated labelling accuracy because bounding box and manually labelled data can be added back into training datasets and used to further tune, train, and develop new DL models. Our results supports other recent work in combining methodologies for more effective fish object detection and observational analysis (e.g., Lopez-Marcano et al., 2021b); moreover, it demonstrates that taking an iterative, ideally community-oriented approach will go a long way to progressing the long-recognised requirements of accurately labelled data for DL (Boom et al., 2014; Jäger et al., 2015; Kavasidis et al., 2014), and, in particular, for automated fish observations, monitoring, and tracking, which lags behind other disciplines or above water object classes.
Annotating fish images with bounding boxes generates data suitable for training DL models such as YOLOv5; however, processing of high volumes of fish video with existing bulk labelling, web-based tools (Computer Vision Annotation Tool CVAT, for example11) is not possible as they are not trained to recognise fish to apply the bounding box around it, let alone label to species level, which is challenging even for humans. Manual annotation is now achievable with the video analysis software EventMeasure, which was developed specifically for point annotation and species labelling. The challenge with labelling fish using bounding boxes is that it takes considerably longer for a fish ecologist to draw the box than to make a point measurement annotation. Following the standard operating procedure12 for drawing bounding boxes in EventMeasure, it takes approximately 10 s to draw and adjust the bounding box around a single fish. Compared with less than 1 s for a point measurement, this extra time compounds over the course of annotating an hour-long video with thousands of images of fish. Ditria et al. (2020) take an R-CNN approach to object segmentation; the additional time required to draw the polygon would be even more impractical for BRUVS analysis. A reasonable balance of manual bounding box annotation for DL model training with model performance accuracy needs to be found.
Once trained, DL models can annotate images much faster than humans; a single image in this study takes approximately 500 ms to annotate using YOLOv5-large, and an hour-long video at 30 frames per second can be completely annotated with YOLOv5-large in approximately 15 m. Furthermore, every single frame in the video can now be automatically annotated, an impractical expectation for a human annotator to complete as it would take too long. The ability to detect and count every fish in every frame in 15 m represents a significant advancement in this field, to date unseen in the published literature. Whereas human labellers are limited to analysing a small subset of video key frames of interest such as MaxN frames, this advancement presents opportunities to increase the information gathered from BRUVS, such as average number of fish, statistical distributions of fish abundance, and pre-screening for MaxN frames.
4.1 Limitations
By training a fish detection model, we have demonstrated that drawing the bounding box can be automated using YOLOv5 with a recall of greater than 0.70, using an out-of-sample testing method. Intuitively, this means that a fish can be correctly found and a bounding box applied approximately 70% of the time. Hand labelling is still required for the 30% of fish that the model has missed, but a 70% automatic identification rate represents a considerable reduction in time required to manually identify and label and presents a compelling case for integration of machine-assisted stages into analysis workflows.
The species labels in the out-of-sample datasets used for validation are not labelled with bounding boxes and do not include the same target 12 species; it is therefore impossible to test the species detection accuracy and emphasises the point that detector performance is dependent on training data, and training and detection parameters, among other factors. Addressing this paucity of public datasets for DL must be considered a priority and highlights the complexity of developing a generalisable model and the challenges in quantifying their accuracy. Labelling fish with a single fish label is insufficient for fish ecology research, and monitoring purposes and species identification is still required (Galaiduk et al., 2018). DL models based on YOLO require a very large number of images per class (greater than 2,000) to converge on accurate predictions. For application to the marine environments, often impacted by complex water quality parameters such as turbid and dark water, the number of images per class may be much higher, and quantifying this requirement remains ongoing research. After subsetting the OzFish dataset and adding bounding box labels, the only class label with greater than 2,000 images was the fish class; the second most abundant class, L. punctulatus, was 1,737; and all others were less than 600. There exists many publicly available datasets such as COCO for DL training and advancement for common objects; however, complete and publicly available datasets for fish ecology, expertly labelled with bounding boxes, do not yet exist.
4.2 Real-World Generalisation
Applications of CNNs to underwater fish imagery have, to date, been of species labels applied to cropped images of fish (i.e., image classification, not object detection) with up to 90% reported classification accuracies (e.g., Salman et al., 2016; Villon et al., 2018). Application of CNNs to BRUVS is more challenging, even impossible because BRUVS have many fish in a single image and an object detection model is required before labelling. Furthermore, the reported classification accuracy and comparison to human accuracy is only valid for the in-sample images. When applying DL to habitats with an abundance of species unknown prior to BRUVS deployment, these accuracy metrics are invalid as the model cannot apply a label that it has not been trained to recognise. Our catch-all fish approach was developed to negate this issue by applying a generic label to unrecognised fish.
Generalisation of DL models remains a significant challenge (Ditria et al., 2021; Ditria et al., 2020; Xu and Matzner, 2018) with previous cross habitat analyses demonstrating the requirement for training on accurately labelled datasets and a reduction in performance when a model trained on data captured in one habitat is applied to a novel habitat. In this study, we quantify how well the fish detection model generalises by training using the OzFish data and applying tests to out-of-sample datasets. OzFish, being an amalgam of data from different habitats, addresses this issue and potentially partially explains the high performance of our model. As these data do not include species labels for our targeted species or bounding box labels, a robust test of generalisation remains the focus of future work as more datasets become available. However, our Supplementary Material demonstrates encouraging progress upon application to DeepFish and datasets A, B, and C in which the object detection performs well against a range of benthic habitats and water clarities.
4.3 Datasets for Future Development
OzFish partially addresses the labelling requirement for marine environments by freely and openly publishing annotation sets for advancing DL. As these data are open source, a community of ecologists are needed and encouraged to complete the labelling of this data for future advancement of DL. By subsetting the OzFish data collection to create a dataset that has manually applied bounding box and species labels to train a DL model based on YOLOv5, we have established the possibility of automatically labelling 12 species of fish while also identifying fish and aggregating counts outside the targeted species. Training the fish prediction model using OzFish and testing the classification accuracy on the out-of-sample datasets demonstrate that the model appears to generalise and can automate the application of bounding box labels. Such automation of bounding box annotations would be applicable to other reliable datasets that are published with point annotation labels and would be a viable contribution to growing the corpus of DL datasets.
4.4 Workflow Integration
DL models and algorithms continue to advance, and we have demonstrated that DL has the potential to assist fish ecologists’ research and labelling. The use of a single-label fish detection technique also opens opportunities for counting fish stock in farms (Yang et al., 2021) such as southern bluefin tuna farms where a single species is present (Xu et al., 2020). By targeting key species, many of the manual labels can be automated. Before automated methods using DL can be realised, species-rich datasets, labelled with defined extent (bounding box, polygon, or segmentation), need to significantly increase.
A machine-assisted method employing DL to target key species would be a valuable bridging step in the process of data curation and preparation for video analysis workflows. Where the DL model has low confidence and fish in the image are not within the targeted species, a fish ecologist is left to manually label the remainder. In this study, 88% of fish were identified and given a bounding box, and approximately 12% of images were automatically labelled with species. The time saved from doing these tasks manually is incentivising; not only does it speed up the process of identifying and labelling the datasets for environmental assessment, it presents a convenient and attainable solution for addressing the data paucity challenge because more data can be exported and published in a format suitable for furthering DL applications in this field. Added incentive for uptake and application of DL approaches for underwater video analysis would take the form of integration with software such as EventMeasure, minimising the disruption to current workflows and allowing fish ecologists to easily leverage this technology if required.
5 Conclusion
We demonstrate that applying a DL model is an effective approach to automated bounding box annotation, bridging a large gap in advancing BRUVS analysis for data-driven ecosystem assessment and management. Improvements in retail GPU performance and price and access to powerful, on-demand GPUs in the cloud (such as Google Colab and Amazon Web Services) makes DL a potentially cost-effective approach to autonomous fish classification, increasing reusability, accuracy, and scalability (Lopez-Marcano et al., 2021a; Yang et al., 2021). Coupled with this, it is anticipated that, once a machine-assisted workflow has been integrated into software, the cost and turnaround time of video processing will be substantially reduced, offering: i) the prospect of wider and more frequent application of BRUVS and related video-based sampling methodologies; and ii) a more comprehensive ability to monitor and assess fish populations in coastal and offshore waters. DL also opens up the potential for fish surveys to be undertaken by non-specialists and the results to be analysed and reported to stakeholders and relevant agencies in a timelier manner than currently possible.
Data Availability Statement
Publicly available datasets were analyzed in this study. This data can be found here: https://github.com/open-AIMS/ozfish and https://github.com/alzayats/DeepFish.
Author Contributions
DM, MW, JL, ST and SB contributed to the development of the study design. DM, KB, ST, MW and MS contributed to the writing of the manuscript. All authors contributed to the article and approved the submitted version.
Conflict of Interest
The authors declare that the research was conducted in the absence of any commercial or financial relationships that could be construed as a potential conflict of interest.
Publisher’s Note
All claims expressed in this article are solely those of the authors and do not necessarily represent those of their affiliated organizations, or those of the publisher, the editors and the reviewers. Any product that may be evaluated in this article, or claim that may be made by its manufacturer, is not guaranteed or endorsed by the publisher.
Acknowledgments
The authors would like to acknowledge the dedicated efforts of the Australian BRUVS Working Group, led by Professor Euan Harvey. We would also like to thank the Moreton Bay Environmental Education Centre for freely supplying us with the fish dataset for our research. The fish dataset was supported by an AI for Earth grant from Microsoft.
Supplementary Material
The Supplementary Material for this article can be found online at: https://www.frontiersin.org/articles/10.3389/fmars.2022.944582/full#supplementary-material
Footnotes
- ^ https://globalarchive.org.
- ^ https://globalfinprint.org.
- ^ OzFish https://github.com/open-AIMS/ozfish.
- ^ Fish 4 Knowledge https://homepages.inf.ed.ac.uk/rbf/Fish4Knowledge/.
- ^ LifeCLEF https://www.imageclef.org/.
- ^ https://github.com/AlexeyAB/darknet#custom-object-detection.
- ^ https://www.seagis.com.au.
- ^ OzFish collection: https://github.com/open-AIMS/ozfish.
- ^ https://github.com/ultralytics/yolov5/wiki/Train-Custom-Data.
- ^ https://github.com/AutomatedFishID/afid-publications/blob/main/Data_Audit.ipynb.
- ^ https://github.com/openvinotoolkit/cvat.
- ^ https://youtu.be/u7XLa7EdcPo.
References
AIMS (2019) AIMS Metadata. Available at: https://apps.aims.gov.au/metadata/view/38c829d4-6b6d-44a1-9476-f9b0955ce0b8 (Accessed June 19, 2022).
Allken V., Handegard N. O., Rosen S., Schreyeck T., Mahiout T., Malde K. (2018). Fish Species Identification Using a Convolutional Neural Network Trained on Synthetic Data. ICES J. Mar. Sci.: J. Du Conseil. 76 (1), 342–349. doi: 10.1093/icesjms/fsy147
Anantharajah K., Ge Z., McCool C., Denman S., Fookes C., Corke P., et al. (2014). Local Inter-Session Variability Modelling for Object Classification, in IEEE Winter Conference on Applications of Computer Vision. 309–316.
Arvind C. S., Prajwal R., Prithvi Narayana Bhat A., Sreedevi, Prabhudeva K. N. (2019). Fish Detection and Tracking in Pisciculture Environment Using Deep Instance Segmentation, in TENCON 2019 - 2019 IEEE Region 10 Conference (TENCON). 778–783.
Boom B. J., He J., Simone P., Phoenix X., Huang C., Beyan, et al, (2014). A Research Tool for Long-Term and Continuous Analysis of Fish Assemblage in Coral-Reefs Using Underwater Camera Footage. Ecol. Inf. 23, 83–97. doi: 10.1016/j.ecoinf.2013.10.006
Connolly R. M., Fairclough D. V., Jinks E. L., Ditria E. M., Jackson G., Lopez-Marcano S., et al. (2021). Improved Accuracy for Automated Counting of a Fish in Baited Underwater Videos for Stock Assessment. Front. Mar. Sci. 8. doi: 10.3389/fmars.2021.658135
Cutter G., Stierhoff K., Zeng J. (2015). Automated Detection of Rockfish in Unconstrained Underwater Videos Using Haar Cascades and a New Image Dataset: Labeled Fishes in the Wild, in 2015 IEEE Winter Applications and Computer Vision Workshops. 57–62.
Ditria E. M., Connolly R. M., Jinks E. L., Lopez-Marcano S. (2021). Annotated Video Footage for Automated Identification and Counting of Fish in Unconstrained Seagrass Habitats. Front. Mar. Sci. 8. doi: 10.3389/fmars.2021.629485
Ditria E. M., Sievers M., Lopez-Marcano S., Jinks E. L., Connolly R. M. (2020). Deep Learning for Automated Analysis of Fish Abundance: The Benefits of Training Across Multiple Habitats. Environ. Monit. Assess. 192 (11), 698. doi: 10.1007/s10661-020-08653-z
Francour P., Liret C., Harvey E. (1999). Comparison of Fish Abundance Estimates Made by Remote Underwater Video and Visual Census. Nat. Sicil 23, 155–168.
Galaiduk R., Radford B. T., Euan S.H. (2018). Utilizing Individual Fish Biomass and Relative Abundance Models to Map Environmental Niche Associations of Adult and Juvenile Targeted Fishes. Sci. Rep. 8 (1), 9457.doi: 10.1038/s41598-018-27774-7
Harvey E., Shortis M., (1995). A System for Stereo-Video Measurement of Sub-Tidal Organisms. Mar. Technol. Soc. J. 29, 10–22.
Herrera César, Sheaves J., Baker R., Sheaves M. (2020). A Computer Vision Approach for Studying Fossorial and Cryptic Crabs. bioRxiv. doi: 10.1101/2020.05.11.085803
Hey T., Butler K., Jackson S., Thiyagalingam J. (2020). Machine Learning and Big Scientific Data. Philos. Trans. Ser. A Mathematical. Physical. Eng. Sci. 378 (2166), 20190054. doi: 10.1098/rsta.2019.0054
Holmberg J., Norman B., Arzoumanian Z. (2009). Estimating Population Size, Structure, and Residency Time for Whale Sharks Rhincodon Typus Through Collaborative Photo-Identification. Endangered. Species. Res. 7, 39–53. doi: 10.3354/esr00186
Huang P. X. (2016). “Hierarchical Classification System With Reject Option for Live Fish Recognition”, in Fish4Knowledge: Collecting and Analyzing Massive Coral Reef Fish Video Data. Eds. Fisher R. B., Chen-Burger Y.-H., Giordano D., Hardman L., Lin F.-P. (Cham: Springer International Publishing), 141–159.
Jäger J., Simon M., Denzler J., Wolff V., Fricke-Neuderth K., Kruschel C.Croatian Fish Dataset: Fine-grained classification of fish species in their natural habitat. In , Amaral T., Matthews S., Plötz T., McKenna S., Fisher R. editors, Proceedings of the Machine Vision of Animals and their Behaviour (MVAB), pages 6.1–6.7. BMVA Press, September 2015
Kavasidis I., Simone P., Roberto Di S., Daniela G., Concetto S. (2014). An Innovative Web-Based Collaborative Platform for Video Annotation. Multimedia. Tools Appl. 70 (1), 413–432. doi: 10.1007/s11042-013-1419-7
Knausgård K. M., Wiklund A., Sørdalen T. K., Halvorsen K. T., Kleiven A. R., Lei J., et al. (2021). Temperate Fish Detection and Classification: A Deep Learning Based Approach. Appl. Intell. 52:6988–7001. doi: 10.1007/s10489-020-02154-9
Langlois T. J., Harvey E. S., Fitzpatrick B., Meeuwig J. J., Shedrawi G., Watson D. L. (2010). Cost-Efficient Sampling of Fish Assemblages: Comparison of Baited Video Stations and Diver Video Transects. Aquat. Biol. 9, 155–169 doi: 10.3354/ab00235
Langlois T., Williams J., Monk J., Bouchet P., Currey L., Goetze J., et al. (2018) Marine Sampling Field Manual for Benthic Stereo BRUVS (Baited Remote Underwater Videos). In: Field Manuals for Marine Sampling to Monitor Australian Waters. Available at: http://ecite.utas.edu.au/124946/.
Langlois T., Goetze J., Bond T., Monk J., Abesamis R., Asher J., et al. (2020). A field and video annotation guide for baited remote underwater stereo‐video surveys of demersal fish assemblages. Methods Ecol. Evol., 11(11), 1401–09.
Li D., Ling Du. (2022). Recent Advances of Deep Learning Algorithms for Aquacultural Machine Vision Systems With Emphasis on Fish. Artif. Intell. Rev. 55 (5), 4077–4116. doi: 10.1007/s10462-021-10102-3
Lin T.-Y., Maire M., Belongie S., Hays J., Perona P., Ramanan D., et al. (2014). “Microsoft COCO: Common Objects in Context”, in Computer Vision – ECCV 2014 (Switzerland: Springer International Publishing), 740–755.
Lopez S. (2021). Slopezmarcano/automated-Fish-Detection-In-Low-Visibility: Automated Fish Detection in Low Visibility. doi: 10.5281/zenodo.5238512
Lopez-Marcano S., Brown C. J., Sievers M., Connolly R. M. (2021a). The Slow Rise of Technology: Computer Vision Techniques in Fish Population Connectivity. Aquat. Conservation.: Mar. Freshw. Ecosyst. 31 (1), 210–217. doi: 10.1002/aqc.3432
Lopez-Marcano S., Jinks E. L., Buelow C. A., Brown C. J., Wang D., Kusy B., et al. (2021b). Automatic Detection of Fish and Tracking of Movement for Ecology. Ecol. Evol. 11 (12), 8254–8263. doi: 10.1002/ece3.7656
Lucas B. D., Kanade T. (1981). An Iterative Image Registration Technique With an Application to Stereo Vision. IJCAI. 674–79. Vancouver, British Columbia.
Miranda J. M., Romero M. (2017). A Prototype to Measure Rainbow Trout’s Length Using Image Processing. Aquacultural. Eng. 76, 41–49. doi: 10.1016/j.aquaeng.2017.01.003
Mohamed H. E.-D., Fadl A., Anas O., Wageeh Y., ElMasry N., Nabil A., et al. (2020). MSR-YOLO: Method to Enhance Fish Detection and Tracking in Fish Farms. Proc. Comput. Sci. 170, 539–546. doi: 10.1016/j.procs.2020.03.123
Muñoz-Benavent P., Andreu-García G., José M. Valiente-González V., Atienza-Vanacloig, Puig-Pons V., Espinosa V., , (2018). Enhanced Fish Bending Model for Automatic Tuna Sizing Using Computer Vision. Comput. Electron. Agric. 150, 52–61. doi: 10.1016/j.compag.2018.04.005
Ravanbakhsh M., Shortis M. R., Shafait F., Mian A., Harvey E. S., Seager J. W. (2015). Automated Fish Detection in Underwater Images Using Shape-Based Level Sets. Photogrammetric. Rec. 30 (149), 46–62. doi: 10.1111/phor.12091
Rawat W., Wang Z. (2017). Deep Convolutional Neural Networks for Image Classification: A Comprehensive Review. Neural Comput. 29 (9), 2352–2449. doi: 10.1162/neco_a_00990
Redmon J., Divvala S., Girshick R., Farhadi A. (2016). You Only Look Once: Unified, Real-Time Object Detection, in Proceedings of the IEEE Conference on Computer Vision and Pattern Recognition. 779–788.
Saleh A., Laradji I. H., Konovalov D. A., Bradley M., Vazquez D., Sheaves M. (2020). A Realistic Fish-Habitat Dataset to Evaluate Algorithms for Underwater Visual Analysis. Sci. Rep. 10 (1), 14671. doi: 10.1038/s41598-020-71639-x
Salman A., Jalal A., Shafait F., Mian A., Shortis M., Seager J., et al. (2016). Fish Species Classification in Unconstrained Underwater Environments Based on Deep Learning. Limnology. Oceanography. 14 (9), 570–585. Methods / ASLO. doi: 10.1002/lom3.10113
Salman A., Siddiqui S. A., Shafait F., Mian A., Shortis M. R., Khurshid K., et al. (2019). Automatic Fish Detection in Underwater Videos by a Deep Neural Network-Based Hybrid Motion Learning System. ICES J. Mar. Sci.: J. Du Conseil. 77 (4), 1295–1307. doi: 10.1093/icesjms/fsz025
Sheaves M., Bradley M., Herrera C., Mattone C., Lennard C., Sheaves J., et al. (2020). Optimizing Video Sampling for Juvenile Fish Surveys: Using Deep Learning and Evaluation of Assumptions to Produce Critical FisheriesParameters. Fish. Fisheries. 21 (6), 1259–1276. doi: 10.1111/faf.12501
Shi C., Jia C., Chen Z. (2018). FFDet: A Fully Convolutional Network for Coral Reef Fish Detection by Layer Fusion, in 2018 IEEE Visual Communications and Image Processing (VCIP). 1–4.
Storbeck F., Daan B. (2001). Fish Species Recognition Using Computer Vision and a Neural Network. Fisheries. Res. 51 (1), 11–15. doi: 10.1016/S0165-7836(00)00254-X
Strachan N. J. C. (1993). Recognition of Fish Species by Colour and Shape. Image Vision Computing. 11(1), 2–10. doi: 10.1016/0262-8856(93)90027-e
Strachan N. J. C., Nesvadba P., Allen A. R. (1990). Fish Species Recognition by Shape Analysis of Images. Pattern Recognition. 23 (5), 539–544. doi: 10.1016/0031-3203(90)90074-U
Tseng C.-H., Kuo Y.-F. (2020). Detecting and Counting Harvested Fish and Identifying Fish Types in Electronic Monitoring System Videos Using Deep Convolutional Neural Networks. ICES J. Mar. Sci.: J. Du Conseil. 77 (4), 1367–1378. doi: 10.1093/icesjms/fsaa076
Villon Sébastien, Mouillot D., Chaumont M., Darling E. S., Subsol Gérard, Claverie T., et al. (2018). A Deep Learning Method for Accurate and Fast Identification of Coral Reef Fishes in Underwater Images. Ecol. Inf. 48, 238–244. doi: 10.1016/j.ecoinf.2018.09.007
Watson D. L., Harvey E. S., Fitzpatrick B. M., Langlois T. J., Shedrawi G. (2010). Assessing Reef Fish Assemblage Structure: How Do Different Stereo-Video Techniques Compare? Mar. Biol. 157, 1237–1250. doi: 10.1007/s00227-010-1404-x
Weinstein B. G. (2018). A Computer Vision for Animal Ecology. J. Anim. Ecol. 87 (3), 533–545. doi: 10.1111/1365-2656.12780
White D. J., Svellingen C., Strachan N. J. C. (2006). Automated Measurement of Species and Length of Fish by Computer Vision. Fisheries. Res. 80 (2), 203–210. doi: 10.1016/j.fishres.2006.04.009
Whitmarsh S. K., Fairweather P. G., Huveneers C. (2017). What Is Big BRUVver Up to? Methods and Uses of Baited Underwater Video. Rev. Fish. Biol. Fisheries. 27 (1), 53–73. doi: 10.1007/s11160-016-9450-1
Xu G., Chen Q., Yoshida T., Teravama K., Mizukami Y., Li Q., et al. (2020). Detection of Bluefin Tuna by Cascade Classifier and Deep Learning for Monitoring Fish Resources, in Global Oceans 2020(Singapore – U.S. Gulf Coast,IEEE), 1–4.
Xu W., Matzner S. (2018). Underwater Fish Detection Using Deep Learning for Water Power Applications, in 2018 International Conference on Computational Science and Computational Intelligence (CSCI). 313–318.
Yang L., Liu Y., Yu H., Fang X., Song L., Li D., et al. (2021). Computer Vision Models in Intelligent Aquaculture With Emphasis on Fish Detection and Behavior Analysis: A Review. Arch. Comput. Methods Engineering. State. Art. Rev. 28 (4), 2785–2816. doi: 10.1007/s11831-020-09486-2
Keywords: deep learning, machine-assisted, BRUVS, Baited Remote Underwater Video Station (BRUVS), automation, fish species, bounding box
Citation: Marrable D, Barker K, Tippaya S, Wyatt M, Bainbridge S, Stowar M and Larke J (2022) Accelerating Species Recognition and Labelling of Fish From Underwater Video With Machine-Assisted Deep Learning. Front. Mar. Sci. 9:944582. doi: 10.3389/fmars.2022.944582
Received: 15 May 2022; Accepted: 22 June 2022;
Published: 02 August 2022.
Edited by:
Ahmad Salman, National University of Sciences and Technology (NUST), PakistanReviewed by:
Ellen Maria Ditria, Griffith University, AustraliaDuane Edgington, Monterey Bay Aquarium Research Institute (MBARI), United States
Copyright © 2022 Marrable, Barker, Tippaya, Wyatt, Bainbridge, Stowar and Larke. This is an open-access article distributed under the terms of the Creative Commons Attribution License (CC BY). The use, distribution or reproduction in other forums is permitted, provided the original author(s) and the copyright owner(s) are credited and that the original publication in this journal is cited, in accordance with accepted academic practice. No use, distribution or reproduction is permitted which does not comply with these terms.
*Correspondence: Daniel Marrable, bWFycmFibGRAZ21haWwuY29t
†These authors share senior authorship